domestic water and sanitation in kerala a situation analysis · domestic water and sanitation in...
TRANSCRIPT

Domestic Water and Sanitation in Kerala
A Situation Analysis
Rajeevan Chakrapani
With inputs and guidance from K. Madhavan Namboodiri
WaterAid India
Chalakudy Puzha Samrakshana Samithi (Kerala State Resource Centre of the Forum)
Forum for Policy Dialogue on Water Conflicts in India
March 2014

Drinking Water and Sanitation: A Situation Analysis
Chakrapani R.
With inputs and guidance from K. Madhavan Namboodiri
© Forum for Policy Dialogue on Water Conflicts in India, Pune, Maharashtra, India
Supported by: WaterAid India, Delhi, India
Cover Design and Layout by: Rohan Jhunja
Published by: Forum for Policy Dialogue on Water Conflicts in India, Pune
c/o Society for Promoting Participative Ecosystem Management (SOPPECOM)
16, Kale Park, Someshwarwadi Road,
Pashan, Pune 411 008, Maharashtra, INDIA
Tel: +91-20-2025 1168/ 2588 6542
Fax: +91-020-2588 6542
Email: [email protected]
URL: waterconflictforum.org ; conflicts.indiawaterportal.org
Copies are available at the above address
First published in March 2014
The contents of this compendium may be used with due acknowledgement of the source. Any form of reproduction,
storage in a retrieval system or transmission by any means requires a prior written permission from the publisher.
Citation: Chakrapani, R. (with inputs and guidance from K. Madhavan Namboodiri), 2014, Domestic water and sanitation in Kerala: A situation analysis, Pune: Forum for Policy Dialogue on Water Conflicts in India.


CONTENTS
Foreword
Section 1: Introduction 1-3
Section 2: Limitations of the Existing Frameworks Used to Analyse the WATSAN Sector 4-7
Section 3: Contextual Analysis 8-24
Section 4: Issues Related to Kerala’s Water Supply Sector 25-28
Section 5: Policy Framework 29-32
Section 6: Water Supply Programmes and Coverage in Kerala 33-40
Section 7: Performance of the Water Supply Sector 41-45
Section 8: Right to Water as a Human Right 46-48
Section 9: Domestic Water Sector: Conclusions and Way Forward 49-61
Section 10: Sanitation- An Assessment 62-72
Section 11: Sanitation Sector: Conclusion and Way Forward 73-77
References 78-80

FOREWORd
One of the important themes of work in this phase of the Forum for Policy Dialogue on Water Conflicts in India (Forum) is Right to Water and Sanitation in India (RTWS) which the Forum is doing in partnership with WaterAid India. As one of the many steps in this direction the Forum commissioned studies in two states – Kerala and Odisha – to understand the actual situation with regard to domestic water and sanitation. We chose Kerala and Odisha for this situation analysis primarily because the Forum had set up Resource Centres in both these states in its previous phase of work and the situation analysis would be a further add on to the work undertaken by the Resource Centers. Also, Kerala and Odisha represent the two extremes of the development continuum.
Forum commissioned Shri Rajeevan Chakrapani of INSPIRE to undertake this situation analysis. Shri K. Madhavan Namboodiri, an independent consultant, with vast experience in the water and sanitation sectors, agreed to guide and supervise this exercise. In this report the authors (since Shri Namboodiri’s inputs and insights have been substantial we have used the word “authors”) have tried to cover a large ground with regard to domestic water and sanitation in Kerala and the report does not stop with a critique of the policies and programmes but also offer constructive suggestions to restructure the sectors keeping right to water and sanitation at its core.
Many individuals and originations have provided valuable help in bringing out this report and we would like to express our gratitude to all of them. We are extremely thankful to Shri Rajeevan Chakrapani and Shri K. Madhavan Namboodiri for agreeing to undertake this exercise on behalf of the Forum and also for revising the drafts a few times in the light of the review comments and suggestions at various stages. In the peer review meeting to discuss the first draft of the report, the participants provided very valuable and critical suggestions to improve the report and we are thankful to all the participants of this meeting. Our special thanks to Dr. Ajaykumar Varma for reviewing the first draft and for providing extensive comments and suggestions. We also express our gratitude to Chalakudy Puzha Samrakshana Samiti (CPSS) for coordinating the peer review meeting and especially to S. P Ravi and A. Latha for providing valuable comments and suggestions on the drafts.
Neeta Deshpande copy-edited the report, Rohan Jhunja did the layout and Mudra Printers did the production. We are extremely thankful to all of them.
We acknowledge the financial support and encouragement provided by WaterAid, India. Our special thanks to Mamata Dash of WaterAid for her active participation and support in bringing out this publication. The views expressed in this report are that of the authors. We sincerely hope that all those who are concerned about the water and sanitation issues would find this report useful.
The Secretariat March 2014
Forum for Policy Dialogue on Water Conflicts in India


1
The management of drinking water supply in Kerala obtains importance at the policy
level due to the state’s paradoxical situation where there is scarcity in the midst of
plenty, as well as the growing demand for water due to the high population density1
and changing water use habits. Similarly, the high population density, unchecked
urbanisation, rising rate of per capita waste generation, changing waste streams and
poor waste handling habits have resulted in a complex waste management scenario
in Kerala. In the water supply sector, there were a number of reforms from time to
time on aspects of governance, planning principles, supply norms, implementation
and management of schemes. Until the mid-eighties, the state’s intervention in public
water supply was confined to urban areas under the direct control of the Public
Health Engineering Department (PHED) of the Kerala government. In April 1984, the
PHED was recast into an autonomous body called the Kerala Water Authority (KWA),
and the entire responsibility of planning, implementing and managing the revenue
collection for maintenance of the water supply systems was entrusted to it.
The KWA is the largest institutional entity in the field of water supply, and
implemented thousands of small, medium and large urban and rural piped water
supply schemes. The failure of the KWA to sustainably manage its schemes to the
satisfaction of the user on one hand, and the emergence of a people’s plan campaign
and new democratic initiatives in the state under the 73rd and 74th amendments
on the other, prompted the state to initiate new water supply schemes under the
decentralised governance system. By the early nineties, following the structural
adjustment programme in the national economy and the implementation of neo-
liberal policies, public investment in essential services has declined. India has been
receiving large scale bilateral assistance from the European countries and multilateral
assistance from the World Bank and other international banks, which has also
influenced drastic policy changes at the national and state levels.
The new policy approach promoted pilot initiatives in demand-responsive,
community-managed, decentralised water supply systems run by the joint efforts of
the state, civil society and people. These initiatives were considered to be superior
to KWA schemes not only in terms of sustainability, equity, user satisfaction, good
governance and cost effectiveness, but were also replicable under the decentralised
governance system of the state. As part of these initiatives, the Kerala Rural Water
Supply and Sanitation Agency (KRWSA) was launched as a nodal agency to facilitate
the implementation of rural water supply systems. Thousands of small, medium and
large piped water supply systems completely managed by user communities were
implemented. Besides, thousands of water supply schemes were implemented under
the three-tier Panchayat system as well.
The evolution of programmes in the sanitation sector is equally interesting. What
began as a programme to stop open defecation by providing heavily subsidised
sanitary latrines to each and every household in the early eighties, soon evolved
Section 1: introDuction
1
Kerala’s population density is one
of the highest in the world. It is
one of the smallest states in India
encompassing only 1.3% of the total
area of the country. However, it has
a high population density, at 747
persons per sq. km, which is much
higher than the national average of
267 persons per sq. km. The people
in the state prefer a dispersed
settlement pattern. Hence, the
state requires large areas of land
for housing. Residents of Kerala
prefer houses on independent
plots. This has resulted in large
scale land reclamation. Blessed
with an abundance of rainfall, about
3,000 mm annually, Kerala has 44
monsoon-fed rivers, of the shortest
of which flows for 15 km. However,
due to the undulating topography of
the state, run-off is also quite high.
This has resulted in an increased
demand for water resources and
acute shortages (Nisha, K.R.)

2
into an environmental sanitation programme, addressing solid and liquid waste
management in rural and urban areas. Many centrally-sponsored and state-sponsored
programmes are being implemented through various agencies such as the three-tier
Panchayat system, the state sanitation mission, KRWSA, etc.
In spite of these concerted efforts by the government in the past few decades, the
performance of the Water Supply and Sanitation (hereafter referred to as WATSAN2)
sectors in Kerala is far below expectations in terms of service performance,
sustainability, and equity and user satisfaction. While in the water supply sector,
diminishing water resources, high level of water pollution, and growing water demand
are the major problems, in the sanitation sector, the accumulation of wastes and
the failure of sustaining comprehensive waste management systems significantly
increases health hazards and the disease burden.
The Forum (Forum for Policy Dialogue on Water Conflicts in India) decided to
undertake a situation analysis of the WATSAN sector of Kerala as part of its work on
the Right to Water and Sanitation in India (RtWS).
objectiveS of the SituAtion AnAlySiSThe main objectives of this situation analysis are as follows:
To understand the unique bio-physical and socio-economic-political and cultural z
conditions of Kerala state in order to aid an understanding of the issues related to
WATSAN in the state.
To understand the current status of drinking water supply and sanitation in the z
state of Kerala. This included: a) the quantitative coverage of drinking water and
sanitation in Kerala, b) the type of facilities available for sanitation and water
supply in the state, c) quantitative analysis of spatio-temporal variations in water
availability, d) the quality issues associated with drinking water, e) urban and rural
divides in providing drinking water supply and sanitation facilities.
To review and analyse the institutional and policy frameworks of Kerala’s WATSAN z
sector, including the governance systems at various levels, with a view to assess its
capacity to address issues that might come up if WATSAN is considered a human
right.
To analyse different water and sanitation programmes and schemes in the state - z
their content, mode of implementation, norms and processes.
To review the cost effectiveness, sustainability and governance systems of the z
WATSAN programmes of Kerala, as well as the extent to which they achieve social
justice from a human rights perspective.
To articulate the imperatives of promoting WATSAN as a human rights concept, z
and trigger pertinent discussions on the bio-physical and socio-political-economic
and cultural aspects of Kerala.
The draft report was peer reviewed in a consultation meeting held on 2nd April, 2013
at Thrissur. The document was also peer reviewed by a senior expert on WATSAN
from Kerala. The secretariat of the Forum and the Chalakudy Puzha Samrakshana
Samithi (CPSS) also sent the author detailed comments and suggestions. The author
has tried to engage with most of the comments and suggestions from this extensive
review process.
2
Although the author has
reservations about the water supply
and sanitation sectors being dealt
with together as will be discussed
later, the acronym WATSAN is
used considering the popularity of
the terminology.
3
Structure of the reportFollowing this brief introduction, Section 2 brings out the limitations of the existing
frameworks used to understand and analyse the WATSAN sector. This section
also briefly discusses the methodology used for this review. The third section deals
with the contextual factors that have a bearing on domestic water and sanitation
issues in the state. The important contextual factors dealt with in this section
include geography, demography, physiography and land use, change in land use
pattern, climate and rainfall, surface water sources of Kerala, surface water quality,
groundwater sources of Kerala and the “Kerala model” of development.
Sections 4 to 9 deal with the domestic water part of the report. Section 4 discuses the
important issues of Kerala water supply sector. It discusses the current water crisis,
the poor performance of state owned large piped water supply schemes, choice of
inappropriate technology, limitations of the decentralised water supply schemes and
so on. Section 5 analyses the policy context and discusses the relevant portions
from both the state water policy and the national water policy. The different water
supply programmes and coverage are discussed in Section 6. The water supply
programmes include schemes undertaken by the Kerala Water Authority (KWA),
Jeevadhara (Dutch assisted community managed WATSAN systems), Jalanidhi
project (World Bank aided), Giridhara (community managed water supply in tribal
areas), schemes implemented by the three-tier Panchayati Raj system and the
Sector reforms programme (especially Swajaldhara). Section seven analyses the
performance of all these schemes. The main focus of analysis is the demand driven,
decentralised, community managed systems. Some of the important parameters
used for performance assessment include regularity of water supply, adequacy, water
quality, breakdown maintenance and operation and maintenance costs. Section
8 looks at right to water as a human right. Section 9 is the concluding section for
domestic water and it has two sub-sections, namely, conclusions and way forward.
The major insights form the various sections are brought together under some of the
critical variables like water availability, reasons for supply demand gap, coverage,
social justice (inclusion coverage), water quality and health, performance and
governance systems. The sub-section on way forward deals with critical aspects like
approach towards a sustainable solution, policy, planning/ design criteria of water
supply schemes, the iterative planning process, technology choice, standards, local
resource persons, community organisation, governance model, water quality, source
sustainability, operation and maintenance and service delivery, information, education
and communication, capacity building and cost sharing.
Sections 10 and 11 are about the sanitation part of the report. Section 10, titled as
‘Sanitation - An Assessment’ engages with some of the important concepts and
issues like the concept of sanitation, sanitation as a human right, sanitation problems
of Kerala, different types of waste generation, sanitation programmes of Kerala
including the Kerala sanitation policy and the performance of sanitation systems and
shortcomings of the current planning process. The last section, Section 11, is the
concluding section and has a detailed sub-section on way forward woven around
critical elements like iterative planning process, choice of appropriate technology,
choice of appropriate governance/ delivery systems, attitudinal and behavioural
changes in the public, use of plastic packaging material, school sanitation, community
toilets and data management and monitoring.

4
GenerAl ApproAchAn examination of the past efforts by the government in the WATSAN sector
leads one to conclude that an absence of enabling policies, funds, projects and
programmes have never been the cause for this sad state of affairs. What is it that
ails Kerala’s WATSAN sector then? There have been an umpteen number of sector
studies by national, bilateral and multilateral agencies which throw light on this issue
and recommend well-informed remedies. This review does not discuss them in detail,
though they are referred to at appropriate places.
The author of this review is of the opinion that the framework of approaching the issue
itself has been a limitation in past studies. All the past studies:
Presuppose that water and sanitation together is a complete, if not independent z
development sector. This assumption tends to draw a sectoral system boundary
around the issues of water and sanitation. This not only severely limits the
recognition and identification of cross-cutting inter-sectoral issues, but also creates
new ones. This makes it even more difficult to find sustainable solutions.
Accept the sanctity of international and national protocols, targets and standards. z
Such standardisation often leads to technically, socially and culturally inappropriate
solutions when applied to unique local situations.
Continue to adopt a linear approach to problems and their solutions that attributes z
undue sanctity to project reports and does not recognise development as a
continuous iterative process.
In such circumstances, the real causes of problems in the WATSAN sector can only
be identified by adopting an entirely different approach.
MiSleADinG terMinoloGyMuch of the terminology used in discussions about the water supply sector is highly
misleading. An effective sectoral analysis cannot be achieved without recognising this
fact. Some of the misleading and erroneous terms in use are explained below.
coverageIt is one thing to ‘cover’ an area or region (ward, GP, block, district, state) by a
service facility, but quite another to actually ensure that every deprived household
in the region is now provided the facility as demonstrated by tangible indicators.
Hence, ‘coverage’ is a highly misleading term used to create a false impression of
accomplishments of the government institution.
For instance, consider the statement: Kerala has achieved 100% coverage in water supply. This can mean that:
Section 2: liMitAtionS of the exiStinG frAMeWorKS uSeD to AnAlySe the WAtSAn Sector

5
Everyone in Kerala has access to some quantity of water of some quality, within z
0 to 1000 metres of his/her residence, from a river, pond, well, or public tap.
This statement leaves the impression that the state is responsible for this 100%
coverage, even though this apparent coverage is not achieved through public
schemes, but by the presence of private, community or public sources.
There are water supply pipe lines at a distance of 0 to 1000 metres from every z
household. The claim of 100% coverage in water supply thus does not make any
statement about the water availability for each household.
Despite the reality, we continue to invest massively in water supply schemes every
year because people continue to seek more and more water of better quality at their
homes on the one hand, and the water supply schemes continue to fail on the other.
The term ‘coverage’ is thus highly misleading. Before commenting on the adequacy
of coverage of water supply schemes in Kerala, there is a need to conduct a house-
to-house census that compiles data on the seasonality of the source, the regularity
of supply, its rate, quality, the distance from the source, the type of water source or
scheme, and the name of the supply agency and scheme.
TABlE 1: COvERAGE OF HOUSEHOlD (HH) WATER SUPPly IN KERAlA
total no. of hhs
tap water from treated sources
tap water from untreated sources
covered wells
uncovered wells
hand pumps
tube/ bore wells
Springs rivers tanks/ ponds/ lakes
others
7,716,370 1,802,341
(23.35%)
461,372
(5.98%)
1,129,397
(14.64%)
3,657,463
(47.4%)
38,402
(0.5%)
285,394
(3.7%)
108,527
(1.4%)
15,215
(0.2%)
55,793
(0.7%)
162,466
(2.1%)Source: 2011 census
Demand responsivenessThis phrase is used as an indicator of the actual assessment of need. However,
need is different from demand. While demand varies with the level of motivation to
avail of more or better facilities, a better price, superior quality and after-sale service
for the product, the need defines the requirement for survival which varies based on
the socio-cultural traditions of the user community. While need is felt when scarcity
occurs, which is caused by the over-exploitation or improper use of resources,
demand is virtually generated by marketing techniques.
This is why the World Bank supported Jalanidhi project considers that very poor
people who actually ‘need’ water do not ‘demand’ it, because even 10% or 5% of the
capital cost which is their share according to the project developers, is unaffordable
for them. Similarly, many households which own water sources and do not ‘need’
external supply ‘demand’ a pipe connection because the price is very low. This
situation indicates that more appropriate terms should be used to define need.
Minimum standardsWe assign standards (global, national, or state) for every service offered by the state
and the private sector. While standardisation may be necessary to assess the level of
achievement of projects, it has adverse consequences as well. Each system has its
own unique characteristics and values which evolve naturally and vary with time and
space. None are superior or inferior. It is not wise to evaluate them on an absolute
scale.
There are standards for choice of technology and system design as well.
Standardisation not only leads to a total neglect of situation-specific data for designs
6
and obviously results in inappropriate designs (e.g. standard per capita daily demand,
water quality standards, non-usage of local materials and know-how), but also
leads to expensive designs as well as ones which are more extensive in scope than
required. The scope of creative innovation is also curtailed.
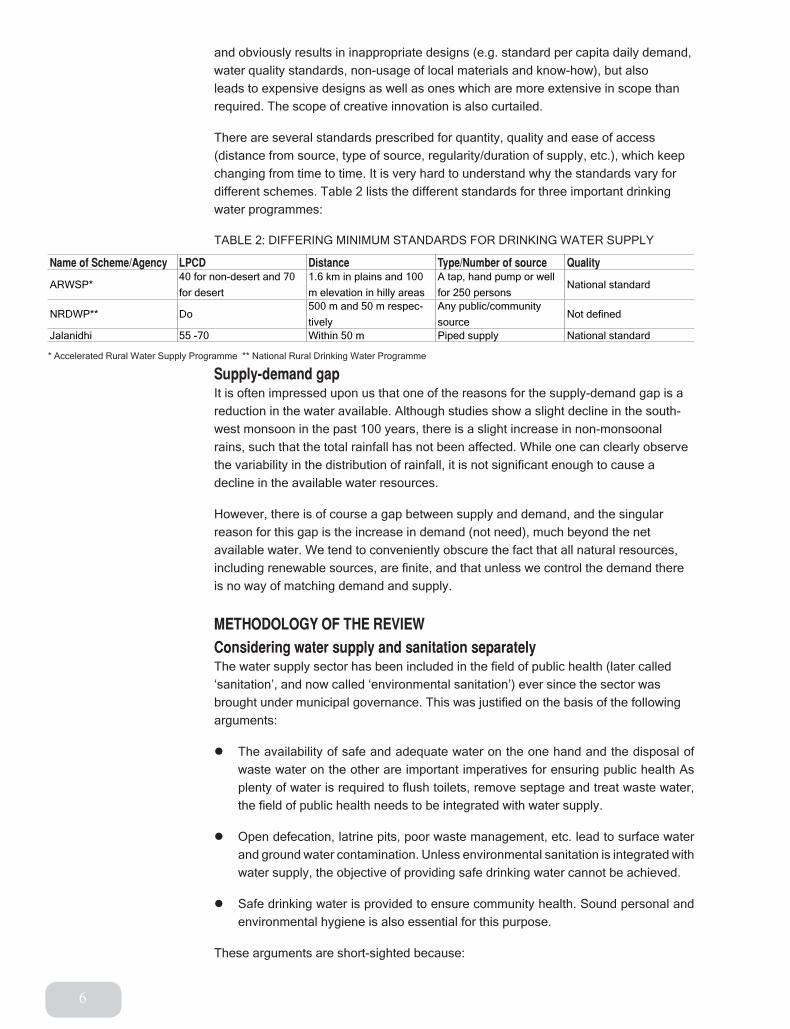
There are several standards prescribed for quantity, quality and ease of access
(distance from source, type of source, regularity/duration of supply, etc.), which keep
changing from time to time. It is very hard to understand why the standards vary for
different schemes. Table 2 lists the different standards for three important drinking
water programmes:
TABlE 2: DIFFERING MINIMUM STANDARDS FOR DRINKING WATER SUPPly
name of Scheme/Agency lpcD Distance type/number of source Quality
ARWSP*40 for non-desert and 70
for desert
1.6 km in plains and 100
m elevation in hilly areas
A tap, hand pump or well
for 250 personsNational standard
NRDWP** Do500 m and 50 m respec-
tively
Any public/community
sourceNot defined
Jalanidhi 55 -70 Within 50 m Piped supply National standard
* Accelerated Rural Water Supply Programme ** National Rural Drinking Water Programme
Supply-demand gapIt is often impressed upon us that one of the reasons for the supply-demand gap is a
reduction in the water available. Although studies show a slight decline in the south-
west monsoon in the past 100 years, there is a slight increase in non-monsoonal
rains, such that the total rainfall has not been affected. While one can clearly observe
the variability in the distribution of rainfall, it is not significant enough to cause a
decline in the available water resources.
However, there is of course a gap between supply and demand, and the singular
reason for this gap is the increase in demand (not need), much beyond the net
available water. We tend to conveniently obscure the fact that all natural resources,
including renewable sources, are finite, and that unless we control the demand there
is no way of matching demand and supply.
MethoDoloGy of the revieWconsidering water supply and sanitation separatelyThe water supply sector has been included in the field of public health (later called
‘sanitation’, and now called ‘environmental sanitation’) ever since the sector was
brought under municipal governance. This was justified on the basis of the following
arguments:
The availability of safe and adequate water on the one hand and the disposal of z
waste water on the other are important imperatives for ensuring public health As
plenty of water is required to flush toilets, remove septage and treat waste water,
the field of public health needs to be integrated with water supply.
Open defecation, latrine pits, poor waste management, etc. lead to surface water z
and ground water contamination. Unless environmental sanitation is integrated with
water supply, the objective of providing safe drinking water cannot be achieved.
Safe drinking water is provided to ensure community health. Sound personal and z
environmental hygiene is also essential for this purpose.
These arguments are short-sighted because:

7
Poor community health is a multi-causative phenomenon of which poor personal/ z
environmental hygiene is only one, although very important, cause. Personal and
environmental hygiene is very critical for community health, and therefore, bringing
it under the water supply sector results in a loss of focus.
Technology, skills and governance systems required for planning, implementing and z
maintaining water supply and environmental sanitation systems are fundamentally
different.
If ensuring an integrated development approach was the objective, then there are z
many more critical sectors that need to be integrated such as land use, water
resource management, preventive health care etc., to name a few.
If we look at the way WATSAN is implemented, there is hardly any integration
other than that the water supply agencies also implement latrine programmes (e.g.
KRWSA). However, a major part of the environmental sanitation programmes are
being implemented by the local self-government department under programmes
sponsored by the state or centre.
This either implies that water supply and sanitation should be dealt with
independently and separately, or that they should be included in a more holistic and
comprehensive sector which includes as many relevant sectors as possible. Since
the scope of this review does not permit such an integrated approach, the authors
decided to discuss water supply and sanitation separately.
Desk studiesIt was decided to study the existing documents that throw light on the performance of
the WATSAN sector in Kerala. These documents can be divided into four categories:
Documents that elaborate on the geographical, demographical, socio-cultural 1.
and socio-economic conditions of Kerala, particularly from the point of view of
WATSAN
Policy and historical documents that elucidate the socio-political evolution of 2.
WATSAN sector policies in Kerala
Documents that highlight the salient features, number, type, coverage, investment 3.
costs, unit costs, cost/benefit analysis, service delivery status, performance, and
governance/management systems of various WATSAN programmes implemented
under various delivery systems
Review/evaluation reports by reputed institutions4.
AnAlySiSSince the available, quantitative information is very meagre and inconsistent, no
scientific analytical tools are applied. Only qualitative discussions are resorted to.

8
Section 3: contextuAl AnAlySiS
FIGURE 1: GEOPOlITICAl MAP OF KERAlA

9
GeoGrAphyKerala, with an area of 38,863 km² (1.18% of India’s landmass) is wedged between
the Arabian Sea to the west and the Western Ghats to the east. Kerala’s coast runs
some 580 km in length, while the width of the state varies from 35 to 120 km. Kerala
lies between north latitudes 8°18’ and 12°48’ and east longitudes 74°52’ and 72°22’,
and is bound by Tamil Nadu in the East and Karnataka in the North.
The state of Kerala is divided into 14 revenue districts. On the basis of geographical,
historical and cultural similarities, the districts are grouped into: 1) Malabar Region
(North Kerala) – Kasargod, Kannur, Wayanad, Kozhikode, and Malappuram districts,
2) Kochi Region (Central Kerala) – Palakkad, Thrissur, and Ernakulam districts,
and 3) Travancore (South Kerala) – Thiruvananthapuram, Kollam, Alappuzha,
Pathanamthitta, Kottayam and Idukki districts.
The 14 districts are further divided into 63 taluks, 1453 revenue villages, 978 GPs, 60
municipalities and 5 municipal corporations. Figure 1 is a geopolitical map of Kerala
with its district boundaries.
DeMoGrAphyAccording to the 2011 census, Kerala’s population is 33.38 million persons which
include 16.02 million males and 17.36 million females. Although Kerala accounts for
only 1% of the total area of India, it contains about 3% of the country’s population.
The population density of the state is about 859 people per sq. km, which is three
times the national average.
TABlE 3: KERAlA STATE DISTRICT WISE POPUlATION
District population Males femalesThiruvananthapuram 3,307,284 1,584,200 1,723,084
Kollam 2,629,703 1,244,815 1,384,888
Alappuzha 2,121,943 1,010,252 1,111,691
Pathanamthitta 1,195,537 561,620 633,917
Kottayam 1,979,384 970,140 1,009,244
Idukki 1,107,453 551,944 555,509
Ernakulam 3,279,860 1,617,602 1,662,258
Thrissur 3,110,327 1,474,665 1,635,662
Palakkad 2,810,892 1,360,067 1,450,825
Kozhikode 3,089,543 1,473,028 1,616,515
Wayanad 816,558 401,314 415,244
Malappuram 4,110,956 1,961,014 2,124,942
Kannur 2,525,637 1,184,012 1,341,625
Kasargod 1,302,600 626,617 675,983
Total 33,387,677 16,021,290 17,366,387
Source: 2011 census

10
Kerala is one of the most densely populated states in the country. It recorded a
decadal population growth of + 9.42% (2,740,101 persons). By the year 2050, the
population of Kerala is likely to grow to almost two times – from about 33 million to 64
million.
Decadal growth rateAs per the 2011 provisional population figures, the rural population of Kerala is
17,455,506. Of this 8,403,706 are males and 9,051,800 are females, whereas
the urban population in the state is 15,932,171. Of this, 7,617,584 are males and
8,314,587 are females. The decadal decline in rural population was -25.96%, whereas
the urban population has grown by 92.72%.
The child population in Kerala has shown a declining trend. The final population totals
for the 2011 census issued by the Directorate of Census Operations reveal a negative
growth rate of the child population in the state (-8.44%). The census figures show that
the child (0-6 years) population is declining in all districts except Malappuram. The
total number of children in Kerala is 3,472,955, with the highest number (574,041)
in Malappuram and the lowest (92,324) in Wayanad. Malappuram also has the
highest growth rate of child population (4.08%), while Pathanamthitta has the lowest
(-23.76%). The census assesses the child sex ratio in Kerala as 964. Pathanamthitta
district with 976 has the highest and Thrissur with 950 has the lowest child sex ratio.
Child sex ratio in respect of the 0-6 age population in Kerala is 959. In rural areas it is
960, whereas, the child sex ratio of the 0-6 age population in urban areas is 958.
The urban population in Kerala has grown to 47.7% of the total, representing a
decadal increase of 21.74% since 2001. As many as 15,934,926 persons in the state
are living in urban areas, while the rural population is 17,471,135, representing 52.3%
of the total. The highest percentage of urban population (68.07) is reported from
Ernakulam district and the lowest (3.86) from Wayanad.
The decadal growth of population in Kerala from 2001 to 2011 is 4.91%, which is
almost half the growth of 9.43% during the previous decade. Malappuram district
has reported the highest growth rate of 13.45%, while the lowest as well as negative
growth rate is reported from Pathanamthitta district (-2.97%). Idukki also has a
negative growth rate (-1.79%). As many as 12 taluks spanning four districts in the
central Travancore area have shown a fall in population.
Scheduled tribesThe scheduled tribe (ST) population of Kerala State is 364,189 as per the 2001
census, constituting only 1.14% of the total population of the state. The decadal
growth of the ST population has been 13.5%, which is 4.1% higher than the growth
of the total population in 1991-2001. The state has a total of thirty-five (35) scheduled
tribes, and all of them have been enumerated during the 2001 census.
The scheduled tribes are overwhelmingly rural as 96.1% of them reside in the villages.
The district-wise distribution of the ST population shows that Wayanad district has
the highest proportion of STs (17.4%), followed by Idduki (14%). Alappuzha district
has the lowest proportion of STs (0.1%), followed by Thrissur, Kollam and Kozhikode
(0.2% each).
The Work Participation Rate (WPR) of the ST population is 46.3%, which is lower than
that of all STs at the national level (49.1%). There is a slight accretion of 0.3% to the
WPR registered in the 1991 census. The WPR of males (57.5%) is higher than that of
females (35.4%).

11
Scheduled castesThe scheduled caste (SC) population of Kerala State is 3,123,941 as per the 2001
census, constituting 9.8% of the total population (31,841,374) of the state. The
growth of the SC population has been 8.2%, which is 1.2% lower than that of the total
population (9.4%) in 1991-2001. The state has a total of sixty-eight (68) SCs, and all
have been enumerated during the 2001 census.
The SCs are overwhelmingly rural, with 81.8% residing in rural areas. Among the
districts, Palakkad district has the highest proportion of SCs (16.5%), followed by
Idukki (14.1%), Pathanamthitta (13.1%) and Kollam districts (12.5%). Kannur district
has the lowest percentage of SC population (4.1%), followed by Wayanad (4.3%) and
Kozhikode (7%).
Migration As of 2011, a total of 2.28 million Keralites resided outside India. The majority of
them are Muslims (44.3%), although Hindus (36.4%) and Christians (20%) are also
significant in population (Zachariah and Rajan, 2012). The largest populations of
Keralites abroad are found in the United Arab Emirates (912,000) and Saudi Arabia
(574,739). Emigrants are largely found from the northern districts of Kerala, namely,
Malappuram, Kanur and Kasaragod.
There are more than 1,000,000 migrants living in Kerala, mostly
from Bangladesh and West Bengal, constituting more than 3% of the population.
Most of these migrants are domestic migrant labourers (DMl). A study shows that
75% of DMl come from other states in India, namely, West Bengal, Assam, Bihar,
Uttar Pradesh and Orissa (Minister of labour, Govt. of Kerala). In some places
like Perumbavoor, the migrants outnumber the locals. They contribute about 4 % to
the state’s GDP. Although this helps to address the significant unavailability of labour
for agriculture and other purposes, an unchecked growth of migrant labourers would
create a massive problem of housing, drinking water supply and sanitation.
phySioGrAphy AnD lAnD uSeBroadly, Kerala is divided into three physiographical regions (Figure 2), namely, 1)
Highlands, 2) Midlands, and 3) lowlands
The highlands slope down from the Western Ghats (also known as the Sahyadris)
which rise to an average height of 900 m, with a number of peaks well over 1800 m in
height. It is 1,860 sq. km in area and accounts for 48% of the total land area of Kerala.
This is the area of major plantations like tea, coffee, rubber and various spices.
The central part of this area is also known as Cardamom Hills. This region is one of
the largest producers of many spices, especially cardamom, from which it earns its
name. Anaimudi (2,694 m) is the highest point in South India, and also the highest
point in India outside the Himalaya-Karakoram mountain range. Most of the rivers in
Kerala originate from the Western Ghats.
The midlands, lying between the mountains and the lowlands, constitute undulating
hills and valleys. It is 16,200 sq. km in area, i.e., about 40% of the total land area.
This is an area of intensive cultivation. Cashew, coconut, areca nut, tapioca, banana
and vegetables of different varieties are grown in this area.
The lowlands are also known as the coastal area, spread across 4000 sq. km. With
numerous shallow lagoons known locally as kayels, river deltas, backwaters and
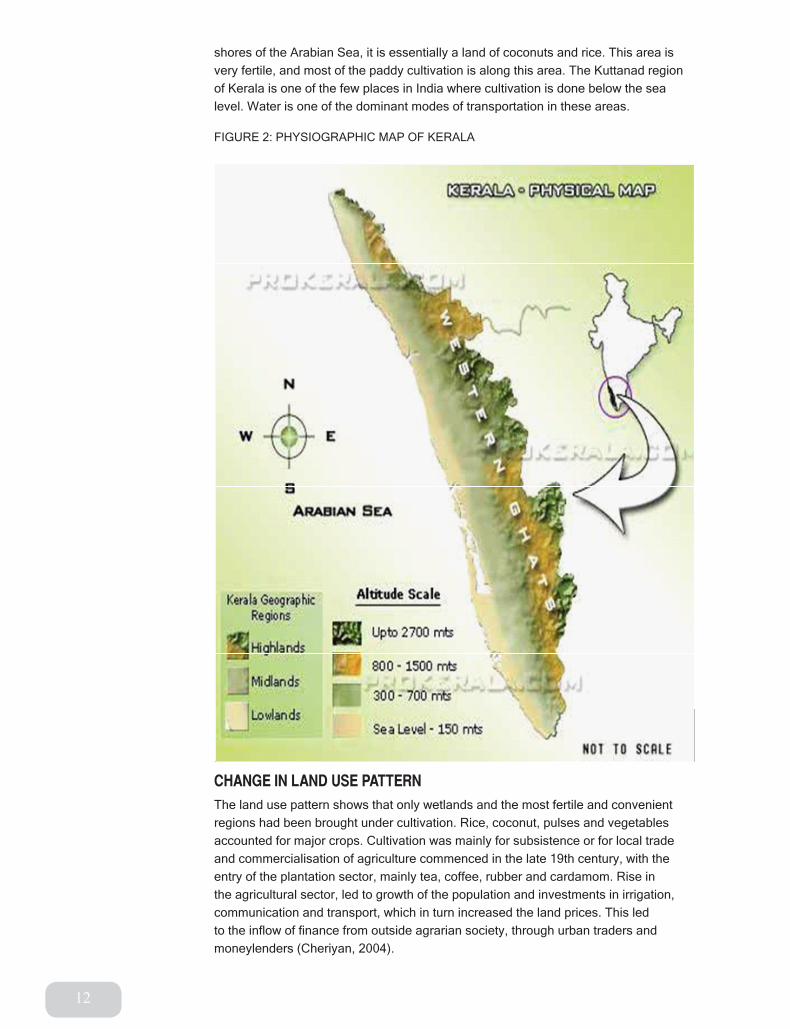
12
shores of the Arabian Sea, it is essentially a land of coconuts and rice. This area is
very fertile, and most of the paddy cultivation is along this area. The Kuttanad region
of Kerala is one of the few places in India where cultivation is done below the sea
level. Water is one of the dominant modes of transportation in these areas.
FIGURE 2: PHySIOGRAPHIC MAP OF KERAlA
chAnGe in lAnD uSe pAttern The land use pattern shows that only wetlands and the most fertile and convenient
regions had been brought under cultivation. Rice, coconut, pulses and vegetables
accounted for major crops. Cultivation was mainly for subsistence or for local trade
and commercialisation of agriculture commenced in the late 19th century, with the
entry of the plantation sector, mainly tea, coffee, rubber and cardamom. Rise in
the agricultural sector, led to growth of the population and investments in irrigation,
communication and transport, which in turn increased the land prices. This led
to the inflow of finance from outside agrarian society, through urban traders and
moneylenders (Cheriyan, 2004).

13
After the formation of Kerala state, there has been diversification in the cropping
pattern. In addition to rice and tapioca, a number of other land crops have contributed
to the state’s food supply. As regards to cash crops, cultivation of pepper, ginger and
other traditional export crops has virtually stagnated. Cardamom and tea have not
shown any substantial increase in their cultivation area whereas areas under coconut
and coffee have increased slightly. The area under rubber crop has increased four-
fold in the past 30 years due to institutional promotion and guidance given to farmers
to adopt rubber cultivation. In consequence, rubber cultivation spread from the high
ranges to the midlands and even to marshy coastal lands (ibid).
Even though rice is the single largest crop grown in Kerala even today, its area under
rice cultivation has gone down by 150% (Cheriyan, 2004) in the past three decades.
Rising cost of cultivation, stagnating rice prices and lucrative alternative uses of
paddy lands are the main reasons for the decline.
Changes in land use patterns during the past 30 years bring out three important
patterns. Firstly, the area put to non- agricultural purposes has increased mainly due
to population pressures and emerging lifestyles. Secondly, the area under forest
cover has diminished due to the expansion of plantations, river valley projects and
encroachment of farmers into forestlands. Thirdly, consequent to the rise in the cost
of cultivation of traditional crops, more land is either left fallow or used to grow less
labour absorbing crops (Ibid).
cliMAte AnD rAinfAllKerala is bestowed with a pleasant and calm climate throughout the year. It enjoys
a moderate weather almost all through the year. It is neither too cold in the winter
months nor too hot in the summers. The warmer (>32°C) months are March-May and
September-October. Mid-May to August is the monsoon period. The humidity is rather
high in Kerala. The average annual rainfall in the state is 3000 mm. However, the
spatial and temporal variation in rainfall influences the hydrological characteristics of
Kerala, especially the frequent floods and droughts in the state (Jalanidhi, 2011).
The average annual rainfall in the lowlands of Kerala ranges from 900 mm in the
south to 3500 mm in the north. In the midlands, annual rainfall ranges from 1400
mm in the south to 4000 mm in the north. In the highlands, annual rainfall varies
from 2500 mm in the south to about 6000 mm in the north. About 60% of the annual
rainfall in the state is received during the south-west monsoon (June-August), 25%
during the north-east monsoon (September - November) and the remaining during the
summer months (ibid).
Generally, the high ranges receive more rainfall than the other zones. However, there
are certain areas in the Attappady valley with only 600 mm annual average rainfall.
Areas on the eastern side of the Western Ghats receive less rainfall and are called
rain-shadow areas; the rainfall in the regions close to the gaps, such as Palghat Gap,
is also comparatively less due to the escape of moisture-laden clouds through the
gaps. While the temporal distribution of rainfall depends on the monsoon winds to a
great extent, the spatial distribution depends on the configuration of land, especially
the undulating topography of the Ghats.
Rainfall is the major source of ground water recharge, and the rainfall pattern
significantly impacts the water levels in the sub-surface aquifers as well as the deeper
aquifers.
Interestingly, it is noticed that there is a slight decrease in the annual total rainfall in
different locations of Kerala in the past century (See Box 1).

14
SurfAce WAter SourceS of KerAlA
riversKerala is a land abundant in water resources, which include rivers, lakes, backwaters,
and big and small ponds. A major share of the state’s water needs is supplied by its
rivers. Kerala has 44 rivers of which 41 are west-flowing and three are east-flowing.
The west-flowing rivers join the Arabian Sea or the backwater lakes which open into
the sea. Many of these rivers serve as inland waterways, especially in the coastal
part of the state. Water from these rivers is used for irrigation, drinking, hydro-electric
power production, etc. They also serve as grounds for inland fishing.
The rivers of Kerala are entirely rain-fed and the flow during the summers is very
meagre affecting dependent water supply schemes. These rivers are comparatively
small and many of them shrink into rivulets or dry up at places during hot seasons.
BOx 1: REDUCTION IN RAINFAll ACROSS KERAlA OvER THE PAST CENTURy
Peerumade, Kottayam, Punalur, Tiruvalla and Alappuzha are those stations in the
State which have witnessed significant reduction in rainfall during the last century.
y.E.A. Raj, Deputy Director-General, Regional Meteorological Centre, Chennai,
revealed this during a special address at the Kerala Environment Congress 2012
here.
The topic of his address was ‘Extent of climate change over India and its projected
impact on Indian agriculture.’ Climate change in respect of individual stations
manifests with mixed trends with positive and negative changes, he said. For
instance, positive trends are available from stations such as Kochi (100.6 mm)
and Kasaragod (153.5 mm) in the State.
“It must be stated here that rainfall series for individual months/seasons in some
of the series may have shown a significant trend. In some other cases, these
trends would have manifested only recently. A more detailed analysis of time
series must be performed to detect and analyse such incidence,” Raj said.
(This article was published in Business line, The Hindu, on 19th August, 2012)

15
FIGURE 3: RIvERS AND lAKES OF KERAlA
As per the national norm, rivers with drainage areas of more than 20,000 sq. km
and 2,000 sq. km are called major and medium rivers respectively. Rivers with less
than 2,000 sq. km of drainage area are termed as minor rivers (Rao, 1979). With this
national norm, Kerala does not have a single major river and has only four medium
rivers (Chaliyar, Bharathapuzha, Periyar, Pamba), with a total drainage area of 8,250
sq. km. The remaining 40 rivers are only minor rivers with a total catchment area of
9,489 sq. km. The total runoff of the rivers of the state amounts to about 77,900 MCM
(million cubic metres), of which 70,200 MCM is from Kerala catchments, and the
remaining 7,700 MCM is from Karnataka and Tamil Nadu catchments (Jalanidhi, 2011).
reduction in river flowsRecent data from the Central Water Commission indicates a trend of reduction in the
flow of Kerala rivers (See Table 4 and Figure 4).

16
Sn Site name riverSeason flow in Million cubic Metres
1998-99
1999-00
2000-01
2001-02
2002-03
2003-04
2004-05
2005-06
2006-07
2007-08
2008-09
1Ambaram
palayamAliyar
Monsoon 115 181 115 131 105 81 151 150. 99 194 123
Non Monsoon 384 182 182 155 159 121 228 247 197 217 142
Annual 499 363 297 286 264 202 379 397 296 411 265
2 Arangaly Chalakudy
Monsoon 2245 1762 1088 1185 1162 1022 1456 1870 1443 3038 1108
Non Monsoon 418 189 27 221 495 401 226 230 225 139 246
Annual 2663 1951 1115 1406 1657 1423 1682 2100 1668 3177 1354
3 Ayilam vamanapuram
Monsoon 616 522 368 405 261 241 563 508 638 699 396
Non Monsoon 304 218 168 130 170 177 229 301 217 151 126
Annual 920 740 536 535 431 418 792 809 855 850 522
4 Erinjipuzha Payaswani
Monsoon 2214 2111 1708 1974 1239 1754 1740 2079 2135 2806 1665
Non Monsoon 267 160 109 159 131 127 100 226 212 224 102
Annual 248 2271 1817 2133 1370 1881 1840 2305 2347 3030 1767
5 Kalampur Kaliyar
Monsoon 1325 1138 910 1113 734 806 891 1309 1118 1337 764
Non Monsoon 252 100 35 138 106 71 40 187 160 82 31
Annual 1577 1238 945 1251 840 877 931 1496 1278 1419 795
6 Kallooppara Manimala
Monsoon 1751 1352 1186 1528 930 1189 1064 1595 1394 1823 1172
Non Monsoon 445 122 130 406 231 360 184 465 386 190 60
Annual 2196 1474 1316 1934 1161 1549 1248 2060 1780 2013 1232
7 Karathou Kadalundi
Monsoon 1099 930 740 870 748 536 919 1152 1808 2461 818
Non Monsoon 96 589 66 131 110 36 44 252 188 177 75
Annual 1195 1519 806 1001 858 572 963 1404 1996 2638 893
8 Kidangur Meenachil
Monsoon 1846 1634 1212 1311 963 1095 1015 1691 1364 1893 1383
Non Monsoon 465 118 122 370 243 342 145. 462 306 281 119
Annual 2311 1752 1334 1681 1206 1437 1160 2153 1670 2174 1502
9 Kumbidi Bharathpuzha
Monsoon 4361 3310 2309 3386 2435 1766 3592 4808 5343 7551 2537
Non Monsoon 1088 304 336 840 329 378 309 767 738 853 297
Annual 5449 3614 2645 4226 2764 2144 3901 5575 6081 8404 2834
10 Kuniyil Chaliyar
Monsoon 4832 4332 2971 2917 1941 1719 3594 5011 4709 6735 3078
Non monsoon 943 531 435 711 163 408 224 1150 402 260 112
Annual 5775 4863 3406 3628 2104 2127 3818 6161 5111 6995 3190
11 Kuttyadi Kuttyadi
Monsoon 810 844 714 645 896 1086 1150 1516 956
Non Monsoon 5 62 89 72 94 114 228 232 171 124
Annual 5 872 933 786 739 1010 1314 1382 1687 1080
12 Malakkara Pamba
Monsoon 3916 3245 2862 2892 1678 1927 2510 3615 3248 3741 2036
Non Monsoon 1379 484 596 703 291 514 920 1489 1004 794 199
Annual 5295 3729 3458 3595 1969 2441 3430 5104 4252 4535 2235
13 Mankara Bharathapuzha
Monsoon 1163 947 382 245 237 147 349 636 647 1451 381
Non Monsoon 495 98 54 81 53 31 58 226 161 200 57
Annual 1658 1045 436 326 290 178 407 862 808 1651 438
14 Neeleeswaram Periyar
Monsoon 6839 4778 5124 5212 4158 3517 5307 6816 4783 7702 4193
Non Monsoon 1923 999 1129 1680 1161 1161 1319. 2505 2240 2365 1409
Annual 8762 5777 6253 6892 5319 4678 6626 9321 7023 10067 5602
15 Pattazhi Kallada
Monsoon 1312 1196 947 810 483 344 593 618 554 689 311
Non Monsoon 742 515 427 494 505 424 384 521 383 306 232
Annual 2054 1711 1374 1304 988 768 977 1139 937 995 543
TABlE 4: FlOW IN KERAlA RIvERS

17
Sn Site name riverSeason flow in Million cubic Metres
1998-99
1999-00
2000-01
2001-02
2002-03
2003-04
2004-05
2005-06
2006-07
2007-08
2008-09
16 Perumunnu valapattanam
Monsoon 3986 3800 2711 2858 2828 2396 3528 4389 4477 5373 2954
Non Monsoon 324 176 195 170 149 212 129 461 266 166 140
Annual 4310 3976 2906 3028 2977 2608 3657 4850 4743 5539 3094
17 Pudur Kannadipuzha
Monsoon 189 180 99. 117 90 71 144 236. 203 484 144
Non Monsoon 238 34 41 37 27 17 57 139 72 116 25
Annual 427 214 140 154 117 88 201 375 275 600 169
18 Pulamanthole Thootha
Monsoon 1876 1730 1155 1281 871 603 1297 1757 1887 2587 1146
Non Monsoon 321 161 156 342 171 175 148 369 289 207 106
Annual 2197 1891 1311 1623 1042 778 1445 2126 2176 2794 1252
19Ramaman-
galamMuvattupuzha
Monsoon 4404 3722 2594 3447 2632 2639 2967 4091 3256 4278 2644
Non Monsoon 2300 1492 1301 1973 942 1218 1372 2028 1668 1934 947
Annual 6704 5214 3895 5420 3574 3857 4339 6119 4924 6212 3591
20 Thumpamon Achankoil
Monsoon 1201 1047 920 929 441 519 814 899 1026 1076 651
Non Monsoon 412 148 171 330 197 291 104 347 302 201 69
Annual 1613 1195 1091 1259 638 810 918 1246 1328 1277 720
21 vandiperiyar Periyar
Monsoon 175 139 84 95. 167 297 161 218 98
Non Monsoon 5 18 16 27 18 38 108 47 9
Annual 180 157 100 122 185 335 269 265 107
Source: Central Water Commission (CWC), 2012, Integrated Hydrological Data Book (Non-Classified
River Basins)
According to Table 4 and Figure 4, which compiles river flows observed in 21
rivers of Kerala for a period of 10 years (1999-2009), one can make the following
observations:
There is a prominent reduction in non-monsoon flows of all riversz
The monsoon flows have increased in most of the rivers, more or less compensating z
for the reduction of non-monsoon flow
The reduction in the non-monsoon flows and corresponding increase in the monsoon
flows probably indicate a steady decline in the storage capacity of catchments
primarily caused due to massive deforestation in the upper catchments. The reason
for the reduction in both the monsoon as well as total flow could probably be
attributed to either inter-basin/state diversion of large quantities of water, or large
scale extraction in the upstream.
backwaters or lagoons These are shallow bodies of water separated from the open sea by land. Backwaters
are one of the most alluring and economically valuable features of Kerala. These
include lakes and ocean inlets, which stretch irregularly along the coast. The
biggest backwater is the vembanad lake with an area of 260 sq. km, followed by the
Ashtamudi lake with an area of 55 sq. km. The Sastamkota lake is the largest natural
fresh water lake in the state. It extends over an area of four sq. km. Other important
backwaters are veli, Kadhinamkulam, Anjuthengu (Anjengo), Edava, Nadayara,
Paravoor, Kayamkulam, Kodungallur (Cranganore) and Chetuva. The deltas of the
rivers interlink the backwaters, providing excellent inland waterways along the lower
and coastal areas of the state (Jalanidhi, 2011).

18
FIGURE 4: FlOW IN RIvER CHERIyAR
ponds and fresh water lakesWhile a majority of the people of Kerala traditionally depended on well water
for drinking and cooking purposes, the innumerable tanks and ponds - both in
homesteads and public places – are used for bathing, washing clothes and meeting
the requirements of domestic animals. In fact, dug wells and ponds cater the domestic
water requirement of the people of Kerala for the past 2-3 decades.
Many of the homesteads had their own ponds and tanks. If a family did not have
them, they depended on their neighbour’s ponds or tanks. Those who did not have
this water source nearby depended on the public ponds or tanks or those attached to
places of worship.
TABlE 4: FRESHWATER BODIES AND RIvERS OF KERAlA
Sr.no. type of water body nos. Area (ha)
1. Private ponds 35,763 21,986
2. Panchayat ponds 6,848 1,487
3. Quarry ponds 879 34
4. Temple ponds 2,689 480
5. village ponds and other water holds 185 496
6. Irrigation tanks 852 2,835
7. Public sector freshwater fish farms 13 85
8. Freshwater lakes 13 85
9. Rivers 44 85,000
10. Check dams 80 259
11.Bunds/Barriers/Anicuts/Shutter
water holds70 879
12. Reservoirs 53 42,890
Total 158,358
Source: Department of Fisheries, Govt. of Kerala

19
Thus, the traditional ‘well-pond’ system worked well in this humid tropical region with
seasonal rainfall. In places where these sources were not available, the inhabitants
depended on the flowing streams for meeting their demands.
The ponds and tanks of Kerala not only catered to the domestic water requirements
of the people and their needs at places of worship, but also served as sources for
irrigation. Some of them also acted as percolation tanks helping in the recharge of
the groundwater table. The elas or small watersheds of Kerala had a pond or kulam
at the upstream or higher elevation known as thalakulam, which not only facilitated
gravity flow to the lower elevations and valleys but also helped in recharging the
groundwater and maintaining the soil moisture. These thalakulams are seen even
today in certain parts of Palakkad district. In the erstwhile Cochin state, attempts were
made to interconnect several tanks so that a cascading system was developed. This
helped in storing water, regulating the levels and achieving optimal use of water for
irrigation purposes. The remains of these ‘tank systems’ are still found in this area.
On larger plots of land, especially in the lower part of the midlands and lowlands,
there were several ponds in the compound which were interconnected. The network
of canals and ponds helped in draining away the flood waters as well as in recharging
the groundwater table. In that sense, the traditional ‘well-tank’ system can be
considered as an integrated system. Such a system was sustainable, and even today
there are several lessons that can be learnt from these traditional practices by water
management experts.
The ponds of Kerala, according to some of the studies being conducted, are unique
ecosystems with a high degree of biodiversity. The fluctuating hydro period, unique
water balance components and the hydric soil at the bed have been responsible for
the unique flora and fauna in these water bodies.
SurfAce WAter QuAlityBy a rough estimate, the source-wise dependence of rural households for domestic
water supply on traditional ground water systems is 80%, 10-15% use piped water
supply systems and 5% use traditional-surface and other systems.
chemical contaminationThe environmental monitoring report on the water quality status in Kerala (2005)
prepared by the Kerala State Council for Science Technology and Environment
(KSCSTE) points out that the rivers in the state are being increasingly polluted by
industrial and domestic waste, pesticides and fertilisers used in agriculture. The
State Environment Report, Kerala, 2005, published by the Council also pointed out
that the condition of the Periyar and Chaliyaar rivers exemplified the pollution of water
bodies due to industrial effluents. According to the report, nearly 260 million litres of
trade effluents are dumped into the Periyar estuary every day from the industrial belt
in Kochi. From mercury to insecticides such as DDT and BHC, copper, sulphides,
ammoniac nitrogen, zinc, lead and phosphates are flowing into the Periyar from major
industries in the industrial zone.
The report also pointed out that incidents of fish kills had also become common
in major rivers such as the Periyar, Chitrapuzha, Chaliyar, and Kallada, and the
vembanad and Ashtamudi lakes. The presence of radioactive waste materials has
also been reported from these areas.
bacterial contaminationAlthough bacterial contamination is very high at a few places along the rivers where

20
large numbers of pilgrims gather, by and large the general bacterial quality of rivers
in Kerala is satisfactory, with a BOD less than 5 mg/l, DO more than 5 mg/l, bacterial
load less than 2000 No/100 ml, and faecal coliforms less than 500 No/100 ml.
However, the water bodies near the coast are heavily polluted. Coconut fibre retting
(which has declined significantly now), effluents from prawn peeling units, direct
discharge of sewage from toilets into water bodies (due to water logging, soil leaching
is not possible) and stagnation of tidal canals and channels due to the dumping of
solid wastes adds to the biological contamination of coastal water bodies. About 1
MCM waste is generated daily in the coastal areas of the state, and 30,000 m3 of it
reaches the surface water bodies in the coastal areas.
industrial pollution of coastal areasIt is estimated that nearly 300 medium and large-scale and about 200 small-scale
industries are discharging effluent directly into saline or freshwater bodies.
According to the report, the northern and southern arms of the Kochi backwaters
receive wastewater from industries. It is estimated that about 53,000 to 80,000 m3
of industrial effluents are discharged each day into the Kochi backwaters. These
discharges contain hazardous concentrations of phosphates, sulphide, ammoniac
nitrogen, fluorides, heavy metals, etc. The report cited that the coastal environment of
wetlands, mangroves, mud-banks, beaches, estuaries and cliffs are in various stages
of degradation.
While wetlands are increasingly being altered for undesirable uses, mangroves
are destroyed for facilitating urbanisation, construction of ports and shrimp farms.
Unabated reclamation, silting and pollution from industries and human wastes are
damaging the estuarine and backwater ecosystem, the report said. After monitoring
the levels of various marine pollutants in the coastal and offshore waters in the state,
the report identified the Kochi backwaters, Alapuzha, Kayamkulam, Kollam, Paravur
and veli as some of the hotspots in the state.
Saline intrusionThe fast-flowing, monsoon-fed rivers of Kerala often encounter salinity intrusion into
their lower stretches during the summer months. When the freshwater flow reduces,
two major problems can occur in these water bodies: (i) salinity spreads to the interior
of the river and (ii) the flushing of the system becomes less effective. The pollution of
the rivers is more severe in the downstream.
GrounDWAter SourceS of KerAlAGeologically, 88% of the state is underlain by crystalline rocks of the Archaean age
comprising Charnockites, Khondalites, gneisses and schistose formations. All these
formations are intruded by dykes of younger age. Along the western part of the state,
the crystalline rocks are overlain by the sedimentary formations of the Tertiary age.
The tertiary formations comprise of four distinct beds, viz., Alleppey, vaikom, Quilon
and Warkali, the age of which ranges from Eocene to lower Miocene. Of these, only
vaikom and Warkali are potential aquifers, whereas, Alleppey beds have brackish
water and Quilon beds are poor aquifers (Kerala ENvIS Centre, 2013a). laterites of
sub-recent age derived from the crystalline as well as sedimentary formations are
seen all along the midlands. The midland areas have medium capacity dug wells,
which can be used for irrigation. Along the coastal plains, sedimentaries and laterites
are overlain by alluvial formations of recent age. In hard rock terrain comprising
weathered crystallines and laterites, groundwater occurs under phreatic conditions

21
in the weathered residuum and the shallow fractures hydraulically connected to it,
whereas it is under semi-confined to confined conditions in the deep fracture zones.
In the alluvial terrain, groundwater in the shallow aquifer systems is in phreatic
condition. Granular zones in the Tertiary sedimentary formations at deeper levels
form potential confined to semi-confined aquifers. (CGWB, 2009; Kerala ENvIS
Centre, 2013a)
Ground water availabilityThe Ground Water Estimation Committee, constituted periodically in the state,
estimated the dynamic groundwater resource situation of Kerala, and their latest
report for 2008-09 was brought out in 2011 (CGWB, 2011). This Committee has the
representation of the Central Ground Water Board, State Ground Water Department,
Centre for Water Resources Development and Management, State Water
Resources Department, Agricultural Department, KWA, etc. They have estimated
the groundwater potential of the state based on an approved procedure considering
the water level fluctuations monitored in 941 wells distributed all over the state and
the hydrogeological characteristics of various aquifers. As per this estimation, the
net groundwater availability of the entire state is 6,029 MCM. Though this estimate
provides an overall picture of the regional groundwater availability, further effort is
required for understanding the groundwater scenario at the micro level. This is a
serious limitation of all the micro-level planning.
Ground water utilisationOut of 152 numbers of assessed blocks, one block is Over-exploited (> 100%),
3 blocks are Critical (90 – 100%), 22 are Semi-critical (70- 90%) and 126 blocks
are Safe (<70%). The long-term water level trends of pre and post-monsoon were
taken to categorise the blocks. Some of the blocks have shown a lesser stage of
development, but the groundwater level is showing a sharp decline, at times more
than 10 cm/year. Although the overall groundwater scenario looks satisfactory, few
hotspots indicate the impending threat of groundwater depletion.
Ground water qualityMore than 60% of households in Kerala use well water for drinking (Kerala ENvIS
Centre, 2013b) and other domestic use. Quality of groundwater in Kerala is by and
large potable. However, many water-borne diseases related to the gastrointestinal
system (Harikumar and Chandran, 2013), diarrhoea, dysentery, typhoid, worm
infestations and infectious hepatitis (Kunhikannan and Aravindan, 2000) and high
rise of faecal contamination are attributed to groundwater contamination (Harikumar
and Chandran, 2013; Kerala ENIvIS Centre, 2013b; KSCSTE, 2009). While chemical
contamination occurs in areas due to heavy industrialisation and heavy application
of chemical fertilisers and pesticides, there are exceptions of in situ chemical
contamination (iron, fluoride) due to the inherent chemical qualities of soil/geological
formations. Bacterial contamination is predominant in thickly populated areas with
poor sanitation, and in the vicinity of bio-polluting industries and water-logged areas
where stagnation of surface and ground water occurs.
Saline intrusion is common in coastal lands and lands surrounding estuaries and
backwater lagoons of Kerala. This is aggravated due to a lower inflow from the
rivers and over pumping of coastal aquifers. But for these isolated patches of lands
with heavy pollution, by and large, the quality of groundwater in Kerala is fairly
satisfactory.

22
the KerAlA MoDelThe ‘Kerala model’ of development is considered to be one of the most successfully
experimented models (which later became part of the global development discourse)
of the mid 1970s. The Kerala state which was once reported to have high infant
mortality, low income, and high population growth rate, underwent a radical
transformation due to social reforms and policies introduced by the state government
and large public movements (CDS, 2006; veron, 2001; Parayil, 1996). The main
elements of the Kerala model include high literacy rate giving opportunity to the lower
classes to attain higher education including women, reduced mortality and lower birth
rate and increase in the life expectancy, despite low per capita income (ibid). These
elements are explained in detail below.
health careImproved health care facilities in Kerala like government facilities and trained doctors
and nurses, along with implementation of health policies have improved the life
expectancy of people and reduced mortality rates in Kerala. The rise in the private
health infrastructure has also aided in the development of health sector in Kerala.
Table 5 shows the different health indicators of Kerala state in comparison with the
rest of the Indian states. The life expectancy of people in Kerala is 74 as against 63
for the rest of India. The table also clearly indicates that Kerala is far better in terms
of reduction in the infant mortality rate and fertility rates. This is attributed to better
maternal health care facilities and child care (CDS, 2006) including state nutrition
programme especially for pregnant women.
TABlE 5: HEAlTH DEvElOPMENT INDICATORS, KERAlA AND INDIA IN 2012
indicator Kerala india
life Expectancy at Birth (years) 74 63
Crude Birth rate per 1,000 people 14.8 22.1
Crude Death rate per 1,000 people 7 7.2
Maternal Mortality Rate per lakh live births 81 212
Infant Mortality Rate per 1,000 live births 13 47
Total Fertility Rates (no. of births per women) 1.7 2.6
Source: Economic Review, 2012, Kerala State Planning Board
educationKerala had been a notable centre of vedic learning, having produced one of the
most influential Hindu philosophers, Adi Shankaracharaya. The vedic learning of
the Nambudiris is an unaltered tradition that still holds today, and is unique for its
orthodoxy, a fact unknown to other Indian communities. However, in feudal Kerala,
though only the Nambudiris received an education in, other vedam castes as well as
women were open to receive education in Sanskrit, Mathematics and Astronomy, in
contrast to other parts of India.
like health care, social reforms were responsible for bringing about a change in
the education system in Kerala (CDS, 2006). In 1957, the first elected communist
government of Kerala brought in radical social reforms, and the highest priority was
placed on education. By 1981, the general literacy rate in Kerala was 70%, almost
twice the all-India rate of 36%. The rural literacy rate was almost the same, and

23
female literacy, at 66%, was not far behind. The government continued to push for
total literacy. In 1990, the total literacy campaign was launched first in the Ernakulum
district, which was a turning point in the education reform in Kerala and inspired other
districts to follow suite (Kumar, 1993).
TABlE 6: lITERACy RATE FROM 1951 - 2011
year persons Males females
195147.18 58.35 36.43
196155.08 64.89 45.56
197169.75 77.13 62.53
198178.85 84.56 73.36
199189.81 93.62 86.17
200190.92 94.20 87.86
201194.59 97.10 92.12
Source: Kerala Govt., India www.kerala.gov.in
radical land reformsIn 1957 Kerala elected a communist government headed by EMS Namboodiripad,
who introduced the revolutionary land Reform Ordinance. The land reform was
implemented by the subsequent government, which had abolished tenancy,
benefiting 1.5 million poor households. This achievement was the result of decades
of struggle by Kerala’s peasant associations. In 1967 in his second term as Chief
Minister, Namboodiripad again pushed for the reform. Apart from the land reform
initiative that abolished tenancy and landlord exploitation, some of the other
important reforms include: 1) effective public food distribution that provides subsidised
rice to low-income households, 2) protective laws for agricultural workers, 3) pensions
for retired agricultural labourers, and 4) high rate of government employment for
members of erstwhile lower caste communities.
limitations of the Kerala modelHowever, despite such positive trends in equitable social development through policy
interventions, the model has certain limitations too. High rate of unemployment,
stagnant agriculture growth, industrial backwardness and poverty especially among
the fishing community and tribal population have been observed (veron, 2001). The
high rate of education in the region has resulted in a brain drain, with many citizens
migrating to other parts of the world for employment as they are unable to find jobs
which suit their capability. The overall job market in Kerala is also very depressed,
forcing many to relocate especially to the “Gulf” countries.
Kerala may continue to receive remittance only till the migrated people have ties
with Kerala. This scenario is also changing as many migrants are now compelled to
return due to competition in the labour market and rapid and radical policy changes in
the host countries to encourage employment opportunities for the domestic people.
Alternatively, once these youngsters start settling down at their place of work outside
Kerala, the state will become a ‘retirement home’ without working youth and inward
remittances.
There is a school of economists who believe that the Kerala model is unsustainable

24
as the ‘state does not have enough fiscal capacity to support the social redistribution
system and it lacks a strong manufacturing sector’ (Bhat and Jain, 2004; Tsai, 2007).
Anyone interested in Kerala’s development today cannot ignore the question of why
its people show such a collective inability to run economic enterprises or to produce
commodities (agricultural or industrial) with the minimum of efficiency required to be
competitive in the Indian, Asian or world market without protection and subsidies. This
is, indeed, a cultural and human problem for people who have achieved relatively high
levels of human development.
There is something precarious and intrinsically unsustainable about the lifestyle of
people of Kerala, which is a banal expression of conspicuous consumerism. In fact
extravagance and indiscriminate consumption is encouraged to “boost demand,
production, and hence employment potential”. In fact this peculiar socio-economic,
socio-cultural and socio-political situation is also responsible for the crisis in Kerala’s
natural resource and environment management.

25
beGinninG of current WAter criSiSUrbanisation and modernisation were introduced subsequent to the invasion of
the British and other colonial rulers. large dams, piped water supply, motorised
pumps, etc., are a few examples of these. The increasing material prosperity and
disintegration of the traditional joint family structures led to divided households, a
consequent division of property, and a need for more water sources. Due to increased
pressures on the land, people not only started reclaiming old ponds and paddy fields
for construction of buildings but also started replacing open dug wells with bore
wells. These phenomena resulted in a gradual overexploitation of ground water on
the one hand and a collapse of the traditions of conservation of water on the other,
contributing to the current water crisis. Adoption of modern consumer culture and
heavy urbanisation resulted in environmental pollution, which included the pollution
of water sources. This also led to an increased demand for construction materials
resulting in massive deforestation, sand mining, and quarries, all of which adversely
affected water sources.
FIGURE 5: PROBlEM TREE OF KERAlA WATER CRISIS
Section 4: iSSueS of KerAlA WAter Supply Sector
Water considered as Commodity
Water Scarcity
Unsustainable and expensive Projects
Depleting/Deteriorating water Sources
Massive Deforestation
Overexploitation of Water
Neglect/ Destruct Traditional Sources
Difficult to Maintain
Inappropriate Technology
Increasing water Demand
Changing Land/ Water use
pattern
Inappropriate Govern. System
Poor Water Wisdom
Indiscriminate Urbanisation/
Industrialisation
Increasing per Capita Demand
Modern/Extravagant Life style
Water Pollution
Inadequate liquid/solid
waste management
Overestimation of water
availability
Primary causes Increased mining of
rock & sand for building construction
Water available only for those who
can pay
Poor left out of Schemes
Failure of Water Supply projects
Unaffordable to Poor

26
According to the dominant development philosophy, all natural resources are
commodities which can be sold and bought, and only those with the ability to pay
will have access to these resources. This is how the concept of ‘demand’ became
a precondition for eligibility for availing drinking water. Demand is measured as a
willingness and ability to pay. Besides, the choice of inappropriate technology has
made schemes expensive and unaffordable to the poor. Thus, poor people who
cannot afford to pay are left behind, unable to access water from supply schemes.
Poor water wisdom led to a poor choice of technology. Poor construction and shoddy
maintenance aggravated the situation resulting in a failure of the public water
supply systems. In the name of rapid growth and modernisation, the adoption of
unsustainable, inappropriate and expensive technologies is spreading. This alarming
development may be the reason for which our rural communities believe that pumps,
pipes and tanks can solve their drinking water problems.
poor perforMAnce of StAte oWneD lArGe pipeD WAter Supply ScheMeSIn 1998, the Operation and Maintenance Improvement Programme (OMIP)3, a Dutch
Danish supported project to assist the KWA to improve the operational efficiency of
its piped water supply schemes concluded that large state owned pipe schemes are
inappropriate for most rural areas of Kerala, because:
The majority of rural Kerala depends on open dug wells. Therefore, problems of z
water availability in the villages of Kerala are due to the seasonal scarcity and
bacterial contamination in these wells. There are a few isolated patches consisting
of 30 to 40 families facing acute water scarcity, for whom small piped water supply
schemes are adequate. A case can, however, be made for improving the yield and
quality of wells.
The KWA schemes are poorly planned particularly in the areas of source z
sustainability, technology choice and design optimisation resulting in source and
system failures.
The Operation and Maintenance (O&M) efficiency of large KWA schemes is very z
poor, and there is very little scope for improving them because of a lack of corporate
will, and poor cost recovery. This leads to a vicious cycle of poor O&M budgets and
a neglect of O&M, leading to a high rate of system failure.
fAilure to QuAntify the probleMEverybody talks about the water crisis in Kerala. There have been an umpteen
number of workshops, seminars, and conferences on the subject. Several articles
have been written and published on Kerala’s water crisis. Unfortunately, most of these
presentations only deal with the qualitative aspects of the problem, leading to highly
generalised conclusions.
An absence of reliable primary data is the main problem. As far as the collection
of primary data is concerned, the picture is utterly dismal. very little effort is made
to collect reliable data such as river flow data, soil erosion data, hydro-chemical/
hydro-biological data, hydrological characteristics of watersheds/river basins, hydro-
geological data such as water table fluctuations, hydraulic parameters of various
aquifers, etc. Thus, even so-called ‘expert reports’ resort to wild assumptions while
conducting water balance studies. Besides, the methodologies used in data collection,
if at all, are mostly outdated. Those who have access to the available data use them
3
Concluding Report, OMIP, 1998

27
selectively to suit their convenience or to prove their prejudiced point of view. One
classic example is the use of ‘monthly averages’ while calculating available water for
a river-pumping scheme. Even if the flow in a river is for a few days (not uncommon
during the summers), the monthly average will ‘redistribute’ the flow over thirty
days and give us an impression that one can pump water from the river even in the
summer.
choice of inAppropriAte technoloGySince choice of technology is dependent on multiple local factors that change in time
and space, a standardised approach will not yield sustainable results. The complexity
of the problems is so vast that ready-to use prescriptions are neither possible nor
desirable. Giving undue importance to large piped water supply is a classic example.
While this may be the only solution for urban areas, for rural areas, this is only one of
multiple options available.
liMitAtionS of DecentrAliSeD WAter Supply ScheMeS By the early nineties, the national policy on the water supply sector changed
radically, and it was widely accepted that decentralised community managed water
management schemes are ideally suited for rural areas. Although the opinion on the
need for decentralisation and community participation was unanimous, it has not
been possible to achieve these results. Encouraged by a few community initiatives
to decentralise the water supply sector in the Malabar region, (e.g. Olavanna4,
Chekode5), by the late nineties, a number of institutional delivery models for up-
scaling community managed water supply systems such as Panchayat, Jalanidhi,
Rajiv Gandhi Sector Reforms, etc., began to emerge in Kerala. While these models
are far superior to the centralised KWA model, as far as community participation
is concerned, they continue to adopt the ‘project’ approach. The following serious
limitations were observed in these models:
In a majority of cases, piped water supply schemes which pump water from wells z
were implemented. An absence of proper yield tests led to over pumping resulting
in the premature drying of the source and neighbouring wells.
Measures to conserve/recharge water sources were limited.z
The chosen technology was expensive and seldom optimal because of the z
dependence on standardised manuals and guidelines.
The scope for the revival of traditional systems did not get adequate attention. On z
the contrary, an overemphasis on piped water supply resulted in a total neglect of
traditional water sources.
Multiple options were seldom considered, and an impression was created that z
piped supply to houses was the best option.
Issues related to equity and social justice were entirely neglected, and community z
participation was restricted to those who can afford to pay.
For this reason, vast sections of the community who could not afford the cost and/z
or preferred different technology options were left behind.
The model failed to empower and improve the capacity of Panchayati Raj institutions z
and the local community.
4
In Olavanna Panchayat near
Kozhikode, in the early nineties, the
community under the leadership
of a local plumber implemented
numerous small water supply
schemes without any assistance
from the government or external
funding. These schemes are
completely owned and managed by
the community.
5
In Chekode Panchayat of
Malappuram district, during
1998-2003, about 42 small
communities managed the
water supply schemes under the
Panchayat Plan with the technical
and notional financial support of the
Dutch government. The community
contributed between 20 to 45% of
the capital cost, and took a lead
role in technology choice, planning
and implementation. The schemes
are owned by the community, and
O&M is completely managed by the
people who share its full cost.

28
The model failed to develop ‘process models’ that perfected the choice, application z
and management of appropriate and environmentally compatible/sustainable
technologies to suit different unique, geographical, cultural, and socio-economic
situations.
contrADictionSKerala, unique in many ways, is a state with highly contrasting if not contradictory
situations. The following paradoxes in the water supply sector demonstrate this
unique nature of Kerala:
Scarcity amongst plenty: Kerala with very high rainfall and natural water resources 1.
has the lowest per capita share of fresh water.6
Highest density of private wells, but high demand for piped supply: Even where 2.
traditional wells supply adequate good water, people tend to demand piped
supply.
very high frequency of breakdown of public water supply systems, but very low 3.
public protest: We can see leaking pipes everywhere but people hardly protest.
This is because almost everyone has an alternate water source. Only when the
problem is acute, there are mass protests.
6
State of Environment Report (2005)
for Kerala, http://www.kscste.kerala.
gov.in/pgm_soe.htm

29
Water is primarily a state subject, i.e., the task of policy formulation in the water
sector is the responsibility of the states. However, the national government also
promulgates water policies from time to time which are the guidelines for planning
and managing the water sector of the country. very often, the states need to adhere
to these policies, particularly when they avail of central assistance.7 Thus, in order
to investigate how far the water policy framework of Kerala is conducive to promote
WATSAN as a human right, one has to review both the national and Kerala state
water policies.
KerAlA WAter policy, 2008In the year 2007, the state government brought out a draft water policy. Due to
popular demand, this policy was subjected to several formal and informal public
debates, in which the press, eminent environmentalists, elected representatives,
representatives of civil society, government experts and academics participated.
Eventually, as per GO (P)No.31/2008/WRD dated 19th July 2008, the Kerala
government promulgated the Kerala Water Policy, 2008.
Interestingly, this document has all the right words - sustainability, equity, social
justice, inclusion, water as a human right, etc., that satisfy almost all stakeholders.
However, the document may disappoint the traditionalists who want to perpetuate the
dominance and interest of government departments in natural resource management
and promote mega schemes at any cost that attract massive investments with
obvious ulterior motives. Even from the human rights perspective, which is seldom
considered in such documents, the Kerala Water Policy 2008 has taken path-
breaking positive positions.
The policy acknowledges water as a public resource and asserts the right of citizens
to access it. Water could indeed become a very scarce commodity in the future due
to global warming and consequent climate change. No longer can the abundant
availability of water be taken for granted. Conserving all water resources in the best
possible way, coordinating the efforts of various government agencies and involving
the people themselves in the task is now a crucial necessity according to the policy
document.
The policy conceives the necessity of conservation, development and management
of water resources based on the concept of watershed as inevitable for maintaining
the ecosystem integrity of rivers and river basins of Kerala. The policy stipulates
treating each river basin as an integral unit of various watersheds for planning water
conservation measures and deciding how the resources on hand shall be apportioned
among various consumer groups. Domestic consumers are the first priority,
followed by farmers, power generation, the agro-processing sector and industrial or
commercial customers, in that order. The commercial use of water is to be subjected
to stringent regulations.8
Section 5: policy frAMeWorK
7
There have been exceptions.
For example, in the Maharashtra
State Water Policy of 2003, the
second priority of use was given
to industries, and the third to
agriculture, whereas in the National
Water Policy, it was the other way
round. In 2012, the Government of
Maharashtra had to change this and
accord second priority to agriculture
through a Government Resolution
(GR) because of civil society action.
8
The policy in its draft form had
an innovative feature of allowing
flexibility to the various river basins
in Kerala to have their own order
of water use prioritisation, after
the first two priorities of domestic
water and agriculture, as per the
specific situation existing in the
basins. However this flexibility was
removed in the final policy.

30
The existing laws and rules on the use of water required a thorough review in the
light of the policy formulated by the government after several rounds of discussions
with experts and stakeholders. The policy proposes new laws for setting up a River
and Wetland Authority and regulating groundwater exploitation. The policy specifies
measures against the delays that have become a norm in the execution of drinking
water and irrigation projects in Kerala. It says that more large irrigation projects are
not advisable for the state. The focus henceforth shall be on small projects, especially
lift irrigation schemes that can reduce water wastage. Rainwater harvesting,
protection of forest cover, preventing water pollution with stringent penal provisions
against the polluters, checking saline water intrusion into inland water sources, and
strengthening research are some of the other focus areas mentioned in the water
policy.
nAtionAl WAter policy, 2012The National Water Policy, 2012 (MoWR, 2012) is one of the most debated
documents in recent times. Hundreds of eminent individuals and institutions have
already expressed their strong points of view about the policy. Some general
observations are:
The document lacks a systematic development based on a logical and objective z
analysis. Instead, this is a compilation of contradictory and vague statements
without any focus.
The document does not discuss the fate of past water policies, and the advantages z
of the current water policy compared to earlier policies.
Some of the basic assumptions and positions in the document are not explained.z
Water scarcity and climate change“There is an increasing scarcity and unequal spatio-temporal distribution (floods, droughts) of water caused due to climate change.” (1.1, 1.2.3, 1.2.4, 1.3.10)
Although there are indications of climate change and a slight decreasing trend
in rainfall, it is not so significant yet, and is a manmade phenomenon caused by
deforestation, construction of large dams, inappropriate land use and overexploitation
of water.
Water scarcity and economic value of water“Lack of public awareness of water scarcity and economic value of water is the reason for wastage, inefficient use and overexploitation of water.” (1.1, 1.2.13, 1.3.4, 3.3)
This is not fully true, because in a water scarce area, a rich man can still pay a
high price for filling his swimming pool, fountain, irrigating his lawn, etc. and a rich
farmer can pay high prices and overexploit water for intensive irrigation of cash
crops. Wastage in the public water supply system occurs because the users did not
participate in the planning, particularly in the choice of technology, and have no sense
of ownership of the system.
technology choice“The lack of .......utilizing modern techniques ............ constrains good water management” (1.2.14).

31
This is not true. Instead, technology that is socially, culturally, environmentally,
technically and economically inappropriate leads to poor water management.
Demand concept“Planning, development and management of water resources need to be governed by …economic needs (1.3.1).
This is not true because it is difficult to meet ‘economic needs’
“Given the limits ……… meeting the future needs will depend more on demand management, (a) evolving an agricultural system which economizes on water-use and maximizes value from water, and (b) bringing in maximum efficiency in useof water and avoiding wastages.” (1.3.8)
This is a very narrow perspective of Demand Management and conveniently
overlooks the need to massively curtail the consumption of industries, urban
complexes, water theme parks, hotels etc. and restrict the per capita domestic
consumption, particularly by the upper class people.
ownership/control of water resources“Water needs to be managed as a community resource held by the state under public trust doctrine to achieve food security, livelihood, and equitable and sustainable development for all.” (1.3.4, 2.2, 3.6, 5.4, 8.4,12.3)
This is a welcome move to curb mismanagement and overexploitation of water
by individual and corporate owners, as long as it does not take away the right of a
community to make the correct decisions and oppose wrong political decision on
water related interventions. The notorious example of the erstwhile Madhya Pradesh
government ‘awarding’ a portion of the Sheonath river (presently in Chhattisgarh)
to a business lobby is a case in point. There are also numerous examples of states
allocating a large share of water to industries and business lobbies “in the best
interest of the people”.
use of water by industry“Industries in water short regions may be allowed to either withdraw only the makeup water or should have an obligation to return treated effluent to a specified standard back to the hydrologic system. Tendencies to unnecessarily use more water within the plant to avoid treatment or to pollute ground water need to be prevented” (11.6)
Industries and commercial systems are the main culprits which cause severe
deterioration of the quality and a reduction in the quantity of water in water sources.
For this reason, no industries or commercial complexes which require large quantities
of water should be allowed in water scarce areas. Besides, strict penal action (like in
the western countries) needs to be initiated against those industries and commercial
complexes which violate the effluent treatment standards.
industrial pollution“Subsidies and incentives should be implemented to encourage recovery of industrial pollutants and recycling / reuse, which are otherwise capital intensive” (11.7)
This is unnecessary. Industries do not need any subsidies or incentives to ensure
water conservation and effluent treatment, because they can afford these systems

32
which are in their own interest.
public private partnership“The water related services should be transferred to community and / or private sector with appropriate Public Private Partnership mode with penalties for failure, under regulatory control on prices charged and service standards with full accountability to democratically elected local bodies” (12.3)
This is a dangerous move by the state to withdraw from service provisioning and
privatise services in the name of expediency. If this is read in the context of the
commodification of water and demand responsiveness in water supply, one can easily
conclude that in the future access to water will be limited only to those who can pay
for it. This will leave millions of poor people without access to water service facilities.
One needs to clearly distinguish between not-for-profit civil society organisations and
private companies. Similarly, urban and rural contexts also need to be distinguished.
Reasons for private companies participating in water governance are not stated.
There are thousands of successful community/user managed systems in India.
Perhaps the PPP model can be tried in the urban water supply sector with certain
non-negotiable conditions like equitable access, affordable pricing, transparent
processes, and grievance redressal systems.
important missing points in the national water policyprioritisation of water useAlthough there is some mention about according top priority to drinking water and
ecosystem needs, what will happen to the remaining water is not explicitly stated.
Thus, proper prioritisation of water is crucially missing from the draft document. If
this aspect is left to the politicians, an ill-informed public may be easily misled to
choose urbanisation/ massive industrialization instead of improving rural livelihood
systems, and commercial/water intensive chemical agriculture instead of sustainable
agriculture and food security (in terms of both quality and quantity). Such choices will
lead to a further deterioration of natural resources.
Water allocation While the policy mentions that minimum supply to all will be ensured, it does not z
discuss an upper limit, nor does it assure minimum supply as a human right.
The policy does not mention the earmarking of an adequate quantity of water z
for future generations, conveniently ignoring the fact that all natural resources,
including renewable ones, are finite.
Therefore, it is clear that while the Kerala State Water Policy, 2008 is well positioned
in terms of the financial and institutional efficiency of the governance system, equity,
right to water, sustainability and environmental stability, the National Water Policy,
2012 needs a lot of work. The possibility of elevating the right to water to the status of
a human right is much greater under the Kerala State Water Policy, 2008 than under
the National Water Policy, 2012.

33
The major implementing agencies of drinking water supply schemes in the state are
the KWA, the KRWSA and local Self Government Institutions (lSGIs). The KRWSA
and lSGIs are ensuring community participation in the implementation of water
supply schemes by sharing the financial costs and undertaking responsibility for
management, operation and maintenance, to some extent. Besides these agencies,
the Department of Urban Development and the Department of Town and Country
Planning also act as nodal agencies for water supply schemes.
Besides, the Socio Economic Unit Foundation (SEUF), an accredited NGO started
with Dutch and Danish support in the mid-eighties also assumed a leading role in
implementing various community managed water supply projects in close association
with the three-tier Panchayat system.
KerAlA WAter Authority The Kerala Water Authority , an autonomous body under the state government,
was launched to plan, implement and manage piped water supply systems in the
mid-eighties. The KWA at present has 86 on-going Accelerated Rural Water Supply
Schemes (ARWSS) which are in various stages of execution, 74 of which are funded
by the central government, and 12 by the state government. 427 schemes under this
category have been completed, while 108 schemes are in the implementation phase.
TABlE 7: WATER SUPPly COvERAGE IN THE STATE
Total Households (HHs) 7,716,370
HHs with tap water from treated sources 1,802,341
HHs with tap water from untreated sources 461,372
HHs with covered well water 1,129,397
HHs with uncovered well water 3,657,463
HHs with hand pumps 38,402
HHs with tube or bore wells 285,394
HHs with spring water 108,527
HHs with river or canal water 15,215
HHs with pond or lake water 55,793
HHs with other sources 162,466
Source: Census 2011
Section 6: WAter Supply proGrAMMeS AnD coverAGe in KerAlA

34
By the late nineties, the KWA attracted severe criticism from international funding
agencies, media and civil society about the deterioration of its water delivery,
governance, service performance and user satisfaction. This is discussed in detail
later. As a last attempt to improve the overall efficiency of the KWA, a joint Dutch-
Danish supported project called the Operation and Maintenance Improvement Project
(OMIP) was implemented between 1995 and 1998. The OMIP carried out a detailed
performance evaluation of one selected KWA scheme, and observed serious defects
in the overall scheme management, particularly in the O&M.
BOx 2: MAJOR PIPE BURST ROCKS KOCHI
Kochi: A vast area of the city will go without drinking water for the next two days after
a major pipeline, where a leak was detected by the Kerala Water Authority (KWA) over
a week ago but took no action, burst at the Kaloor-Kathrikadavu Road on Saturday
morning.
According to KWA officials, around 15% city areas including Kaloor, Kathrikadavu,
Elamakkara, Chitoor, vadutala, Pachalam, North and Mulavukadu will be affected till
Monday. Water resources minister P.J. Joseph said he had directed that the repair
works be completed before Sunday noon but it would take 48 hours to completely
restore water supply. Earlier, the 700 mm pipe supplying water to vaduthala section
burst at 8.30 a.m., with water gushing out with great force, flooding nearby shops and
resulting in a portion of the St Francis xaviers convent, which is nearby, caving in.
“We had detected the leak last week after the locals informed us of water spraying out.
But we decided to start the repair work after ‘vishu’ festival as it would take at least 48
hours to replace the pipe there. However, as a safety measure, we had reduced the
valve turn at Kaloor side from 28 to 10 which saved the day,” said assistant executive
engineer, Kaloor, K.v. Mohan. Meanwhile, Mayor Tony Chammani demanded strict
action against the Kerala Water Authority as KWA officials failed to carry out timely
repair despite the locals informing them about the leak over a week ago.
Source: Deccan Chronicle, 12thAugust, 2013

35
These observations9 had far reaching implications for the future of the water supply
sector of Kerala. In a follow-up effort, advantages of introducing technical and
managerial improvements in the operational management of KWA schemes were
demonstrated through participatory and practical processes. However, the KWA
unfortunately refused to accept any of the recommendations of the OMIP.
jeevADhArA - Dutch ASSiSteD coMMunity MAnAGeD WAtSAn SySteMSTowards the late nineties, the final years of the WATSAN projects implemented by
the KWA and supported by Dutch and Danish governments, it was realised that for
a variety of reasons, the social justice, sustainability, operational efficiency and cost
effectiveness aspects of large state owned piped water supply schemes were poor
and therefore these schemes need not be supported any more. Instead, on a pilot
basis, five decentralised, community-managed, need-based (not demand-responsive
as later qualified) water supply systems were introduced in the Chekode Panchayat
in Malappuram District to be implemented by the SEUF, which would act as the nodal
agency under the decentralised governance system of the Kerala government, known
as the Peoples’ Planning Campaign. This was a great success and received wide
political acceptability. Subsequently, on its own initiative, the Chekode Panchayat
implemented about 43 community managed schemes, each covering 20 to 50
families, under the decentralised governance system of Kerala. These schemes were
financially supported by the community (25%), the Panchayat (40%) and the Dutch
Government (35%). The community chose a variety of technologies (gravity scheme,
pumping scheme, rainwater harvesting, etc.) suitable for local conditions.
Since a lot of focus was laid on capacity building, institutional and operational
sustainability was ensured. These pilot projects were not only highly successful and
attracted wide political patronage, but were also replicable for the same reason. In
fact, this was a pioneering initiative that introduced the concept of decentralised,
community managed water supply systems under decentralised governance. These
experiences led to the formulation of technical, financial and institutional guidelines
for decentralised community managed water supply systems in Kerala.
Encouraged by this high success, by 2000, the project was extended to Idukki and
Alappuzha districts representing highlands and coastal areas. 115 community water
supply schemes and 300 rainwater harvesting units were implemented in Idukki. In
Alappuzha, 157 community schemes, 191 filter point wells, 1,241 household filters
and 1,651 rainwater harvesting structures were implemented. Source recharge was
one of the main features of this programme. 15% of the total capital cost was met
by the community and 10% by the Gram Panchayat (GP). There were instances
where up to 50% of the capital cost was met by communities through labour and local
resource mobilisation.
WorlD bAnK AiDeD jAlAniDhi project
Encouraged by the success of various decentralised community managed WATSAN
projects, particularly the Chekode experience, the World Bank assisted Kerala
Rural Water Supply and Environmental Sanitation Project (later named Jalanidhi),
conceived in mid-1999. The Kerala Government created an autonomous institution -
the KRWSA to implement this project. The project has been designated as a demand
responsive project with a community driven development approach in implementation.
The project integrates water supply with sanitation, health promotion, and ground
water recharge measures.
9
Performance Assessment of
Edappal CWS Scheme, OMIP 1998
and Conclusion Report of OMIP,
1998

36
BOx 3: FROM OlAvANNA TO CHEKODE -THE FORERUNNER OF INTRODUCING
DECENTRAlISED, COMMUNITy OWNED AND MANAGED WATER SUPPly
SySTEMS UNDER THE DECENTRAlISED GOvERNANCE SySTEMS IN KERAlA
By the late eighties, there was an increasing awareness among the rural population
of Kerala about the irrelevance and futility of large state-owned water supply systems,
because they could not sustainably solve the rural drinking water problems. People
also knew that they had very little voice in planning and designing these systems and
for this very reason most such schemes were forced upon them.
On their own initiative, people began looking for an alternative. One of the most
popular initiatives is the ‘Olavanna’ initiative in which people of Olavanna village,
situated about 15 km east of Kozhikode, collected contributions, installed and are
collectively managing many small piped water schemes benefitting 30 to 40 families
each, under the leadership of a local plumber. This experiment received a lot of
publicity, not only because it was a viable alternative to the KWA model but also
because of the bold introduction of a civil society movement. While the people’s
initiative was highly applauded, the Olavanna model still raised questions about equity,
inclusion and replicability under decentralised state governance.
A small pilot initiative to introduce decentralised community managed water supply
systems under the Panchayat governing system was made in Chekode Panchayat
on the banks of Chaliyar river in Malappuram district by SEUF (Socio Economic Unit
Foundation), an NGO with the financial, technical and institutional support from the
Royal Netherlands Embassy in 1998. This initiative had the following unique features:
It adopted an iterative model in spatial and temporal steps which observed and z
incorporated social, cultural, economic, environmental, governance and political
dimensions at every step.
The initiative was implemented with an open mind, and standards were evolved z
rather than imposed. For instance, according to the suggestion of an old woman,
the per capita supply was based on the available water in each subsystem after
earmarking adequate reserve for the next generation. The old woman’s suggestion
was used to design a computer model for planning and designing systems to meet
this requirement.
Many creative technical innovations (e.g. use of ferro-cement Overhead Service z
Reservoir (OHSR), using plastic coins with varying perforations in supply pipes,
computer programme for network analysis and planning water supply systems) and
alternative location specific technology options for source, (e.g. various roof water
harvesting models, spring based gravity schemes) were implemented.
School children were involved in data collection, planning and design.z
The high level of social and political acceptance of this community model in spite of the
fact that the KWA had offered a large piped water supply scheme here, was reason for
the Panchayat to expand the scope of the project to cover the entire Panchayat with
43 piped water schemes benefiting about 1500 families, hundreds of individual and
school roof water systems. By early 2000, the people of Chekode Panchayat offered
this Chekode model to the policy makers of Kerala for replication. All the subsequent
community managed decentralised water supply systems of Kerala, including the
World Bank assisted Jalanidhi project, are based on the Chekode experience.
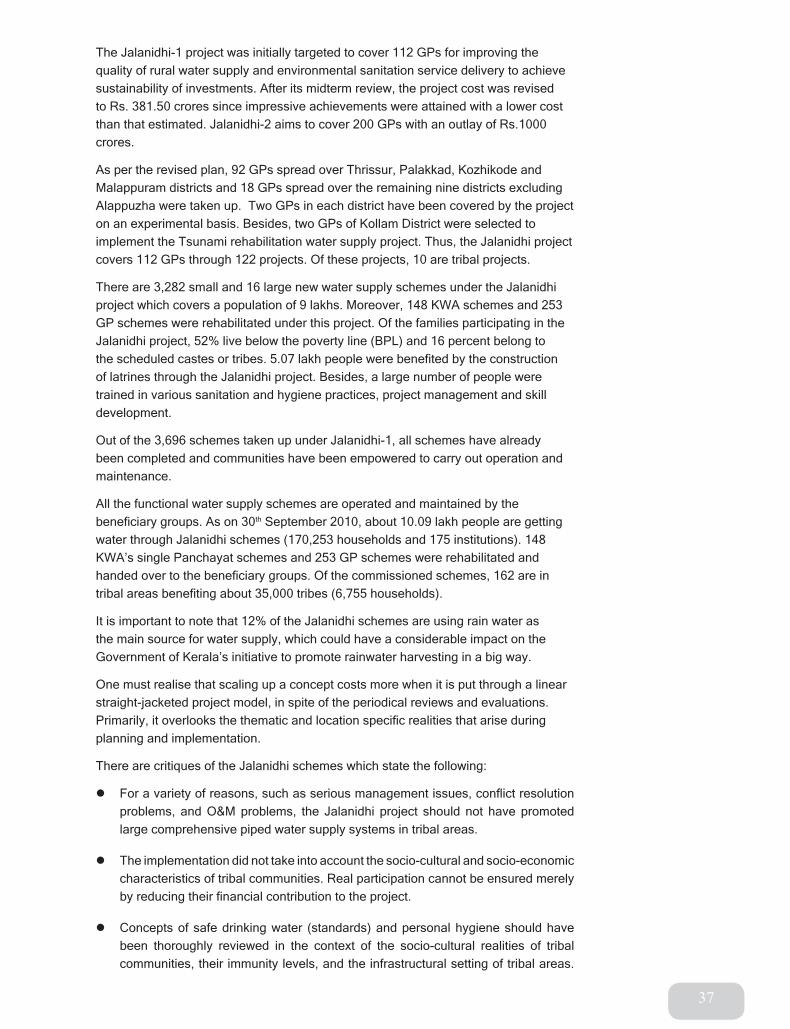
37
The Jalanidhi-1 project was initially targeted to cover 112 GPs for improving the
quality of rural water supply and environmental sanitation service delivery to achieve
sustainability of investments. After its midterm review, the project cost was revised
to Rs. 381.50 crores since impressive achievements were attained with a lower cost
than that estimated. Jalanidhi-2 aims to cover 200 GPs with an outlay of Rs.1000
crores.
As per the revised plan, 92 GPs spread over Thrissur, Palakkad, Kozhikode and
Malappuram districts and 18 GPs spread over the remaining nine districts excluding
Alappuzha were taken up. Two GPs in each district have been covered by the project
on an experimental basis. Besides, two GPs of Kollam District were selected to
implement the Tsunami rehabilitation water supply project. Thus, the Jalanidhi project
covers 112 GPs through 122 projects. Of these projects, 10 are tribal projects.
There are 3,282 small and 16 large new water supply schemes under the Jalanidhi
project which covers a population of 9 lakhs. Moreover, 148 KWA schemes and 253
GP schemes were rehabilitated under this project. Of the families participating in the
Jalanidhi project, 52% live below the poverty line (BPl) and 16 percent belong to
the scheduled castes or tribes. 5.07 lakh people were benefited by the construction
of latrines through the Jalanidhi project. Besides, a large number of people were
trained in various sanitation and hygiene practices, project management and skill
development.
Out of the 3,696 schemes taken up under Jalanidhi-1, all schemes have already
been completed and communities have been empowered to carry out operation and
maintenance.
All the functional water supply schemes are operated and maintained by the
beneficiary groups. As on 30th September 2010, about 10.09 lakh people are getting
water through Jalanidhi schemes (170,253 households and 175 institutions). 148
KWA’s single Panchayat schemes and 253 GP schemes were rehabilitated and
handed over to the beneficiary groups. Of the commissioned schemes, 162 are in
tribal areas benefiting about 35,000 tribes (6,755 households).
It is important to note that 12% of the Jalanidhi schemes are using rain water as
the main source for water supply, which could have a considerable impact on the
Government of Kerala’s initiative to promote rainwater harvesting in a big way.
One must realise that scaling up a concept costs more when it is put through a linear
straight-jacketed project model, in spite of the periodical reviews and evaluations.
Primarily, it overlooks the thematic and location specific realities that arise during
planning and implementation.
There are critiques of the Jalanidhi schemes which state the following:
For a variety of reasons, such as serious management issues, conflict resolution z
problems, and O&M problems, the Jalanidhi project should not have promoted
large comprehensive piped water supply systems in tribal areas.
The implementation did not take into account the socio-cultural and socio-economic z
characteristics of tribal communities. Real participation cannot be ensured merely
by reducing their financial contribution to the project.
Concepts of safe drinking water (standards) and personal hygiene should have z
been thoroughly reviewed in the context of the socio-cultural realities of tribal
communities, their immunity levels, and the infrastructural setting of tribal areas.

38
For instance, even if chlorinated water is provided to the tribal areas, a tribal person
will never drink it.
A study by the KWA10 states that since the water is not ‘treated’ it is unsafe. We are
not surprised by this because the KWA cannot accept any non-chlorinated water as
safe. Instead, one needs to conduct exhaustive studies to understand the quality of
the water sources used by tribal people, and design the most appropriate methods
to maintain their purity keeping the socio-cultural and immunity aspects of tribal
communities in mind.
GiriDhArA (coMMunity MAnAGeD WAter Supply in tribAl AreAS) The project was implemented in the Wayanad district by the SEUF with assistance
from the Government of India (GoI) under the Special Component Plan. The project
aimed to provide adequate safe drinking water in tribal habitats and encourage
initiatives to develop women’s capacities as well as self-help groups. It is a community
driven and demand responsive project, for which the community is expected to
mobilise 10% of resources towards the partial capital cost for implementing water
supply schemes. The project benefited 10 selected GPs in the Wayanad district.
Each GP implemented 15 to 20 water supply schemes per Panchayat, and 600
families benefited from the scheme. Under Giridhara, a total of 3,317 tribal families
were covered through 203 community managed water supply schemes.
ScheMeS iMpleMenteD by the three-tier pAnchAyAti rAj SySteMSince the late eighties, under the people’s planning campaign, Zilla, Block and
GPs, implemented many small piped water supply schemes using the plan funds.
Beneficiaries contribute 10%, and the remaining 90% funds are obtained from the
plan fund. The schemes are designed and implemented according to the guidelines of
the lSGD from time to time. The actual coverage is as follows:
TABlE 7: SCHEMES IMPlEMENTED UNDER THE THREE TIER PANCHAyATI RAJ
SySTEM
lSGD number of Schemes
Rural 509 – Swajaldhara Zilla Parishad
Rural 3500 –GP
Urban 46 – Thrissur Corporation
Due to a variety of reasons, mainly the absence of community participation and poor
operation and maintenance, the performance of these schemes is far from satisfactory
compared to other community managed schemes.
Sector reforM proGrAMMeSIn April 1999, the GoI launched the sector reforms programme by earmarking 20%
of the ARWSP funds. The hardware support is being supplemented by other support
programmes like social mobilisation, capacity building, Information Education and
Communication (IEC), Human Resource Development (HRD) and Management
Information System (MIS). The main objective of the programme is to institutionalise
community participation and demand responsive approaches in order to ensure
sustainability of drinking water systems and sources.
This programme would strive to achieve the objective of institutionalising community
participation and demand responsive approaches with a focus on improving the
institutional and professional capacities at various levels of the decentralised
10
Evaluation study by the
Investigation, Planning and
Design wing of the KWA on
the performance of ‘Jalanidhi’
schemes in Attappady, available
at http://www.stateofkerala.in/
blog/2013/07/30/attappady-water-
schemes-wasted-study/

39
governance systems of the states in planning, implementing and managing
decentralised, community managed WATSAN systems. The sector reform
programme is implemented through the institutional framework comprising of the
District Panchayat, GPs, and the GP volunteer Resources Team (GvRT). The
community contributes 10% of the cost, the rest of which is met by the GoI.
SwajaldharaThe Government of India has been emphasizing the need for taking up community
based rural water supply programmes and with this end in view a beginning was
made in 1999 by sanctioning Sector Reform Pilot Projects on experimental basis.
With the experience gained, the reform initiatives in the rural drinking water supply
sector has now been opened up throughout the country by launching the Swajaldhara
Programme on 25 December, 2002. The Swajaldhara Programme is being
implemented by DRDA with the active participation of the PHED of the district.
In Kerala, out of 509 schemes taken up under Swajaldhara, it was noticed, as will be
discussed later in Section 7, that the performance of the Swajaldhara schemes are
better than that of normal Panchayat schemes, thanks to the institutionalisation of
community management.
WAter Supply coverAGe in KerAlAAccording to a survey conducted by the Rajiv Gandhi National Drinking Water
Mission, there were 9,776 identified habitats in Kerala. Of these habitats, 1,994
habitats were fully covered, 6,964 were partially covered, 805 were not covered and
13 were in forest areas during 2001. The present status of these habitats is provided
in Table 9.
TABlE 9: HABITATION WISE QUANTITy OF WATER SUPPly
Quantity of water supply no. of habitations(as of March2010)
Below 10 lPCD or not covered Nil
Between 10 lPCD and 40 lPCD (partially covered) Nil
Above 40 lPCD (fully covered) 11,883
Forest areas not covered Nil
Total habitations 11,883
Source: Adapted from Jalanidhi report, 2011
This gives the impression that 100% rural habitations are covered by schemes
implemented by the state, which is highly misleading because the ‘coverage’
includes about 80% of habitations where people own wells. All habitations within
the administrative boundary of the location (ward) of a pipeline are considered
to be ‘covered’ irrespective of whether the schemes are functioning or not, and if
functioning, whether all the ‘covered habitations’ use these systems or not. Hence
such information is highly unreliable.
The National Sample Survey Office (NSSO) report on drinking water (1999) shows
that the population covered by piped water supply in Kerala is merely 11.5%, which
is much lower than the estimate of the KWA. However, a majority of households
(85% according to NSS data) in Kerala traditionally depended on open wells for their
household water needs.

40
TABlE 10: DISTRIBUTION OF HOUSEHOlDS (%) HAvING SUFFICIENT DRINKING
WATER THROUGHOUT THE yEAR
principle Source Kerala india
Tap 7.63 14.80
Tube well/hand pump 1.15 46.50
Well 58.80 21.30
Tank/pond restricted for drinking 1.10 0.90
Other tank/pond 0.40 0.50
River/canal/lake 0.07 1.04
Spring 0.20 1.60
Tanker -- 0.20
Others 0.21 0.18
All 69.60 87.00
Source: Adapted from Nisha, K. R. (based on the 54th Round Survey on Drinking Water and Sanitation conducted by
NSSO (1999))
However, among the people depending on wells as the principal source of water,
nearly 59% are getting sufficient water throughout the year (Table 10). It is in Kerala
that the highest percentage (30.4) of households reported that they did not receive
sufficient drinking water in some part of the year. This seasonality in water availability
was an important dimension of the water supply problem in Kerala. Besides, the
dependants of well around 51% households were obtaining water at their household
premises.
FIG. 6: COvERAGE OF STATE PUBlIC WATER SUPPly AS PER DISTRICTS

41
As stated earlier, it is one thing to ‘cover’, but quite another to ensure and sustain
satisfactory performance of schemes. For assessing the performance of public water
supply systems in the context of Kerala, they are divided into the following institutional
categories in which they are implemented and managed.
Supply driven, centralised, state owned/managed systems�
Kerala Water Authority/PHEDz
Old Municipal/Town Administration z
Demand driven, decentralised, community managed systems, under PRI (Reform �
Model)
Swajaldhara (demand responsive, community managed systems implemented by z
the KWA)
Jalanidhiz
local Self Government Department (lSGD)z
Sector Reforms (Rajiv Gandhi Drinking Water Mission)z
Schemes supported by funds from the Dutch Governmentz
Before we analyse the performance of schemes under the above delivery systems,
it is necessary to clearly distinguish between the two kinds of broad institutional
systems.
Supply Driven, centrAliSeD, StAte oWneD/MAnAGeD SySteMSAlthough the reliable data on the financial, institutional and social dimensions of
these systems is not available, it is obvious that they are riddled with the following
problems:
The KWA’s schemes are always piped water systems using age old technical z
norms and designs. There are no attempts to investigate multiple options in the
choice of technology and optimise designs. The schemes are inappropriate and
not cost effective.
The frequency of breakdowns is very high and there are long delays in repairs.z
The loss due to leakage/unaccounted flow is as high as 40% (KWA Reports) to z
78% (OMIP report11 ).
The O&M cost is very high.z
Cost recovery is very poor due to a variety of reasons.z
Section 7: perforMAnce of the WAter Supply Sector
11
Performance Evaluation Report –
Kerala Water Authority, Operation
Maintenance Improvement
Programme, Dutch Danish
Supported Project – 1998
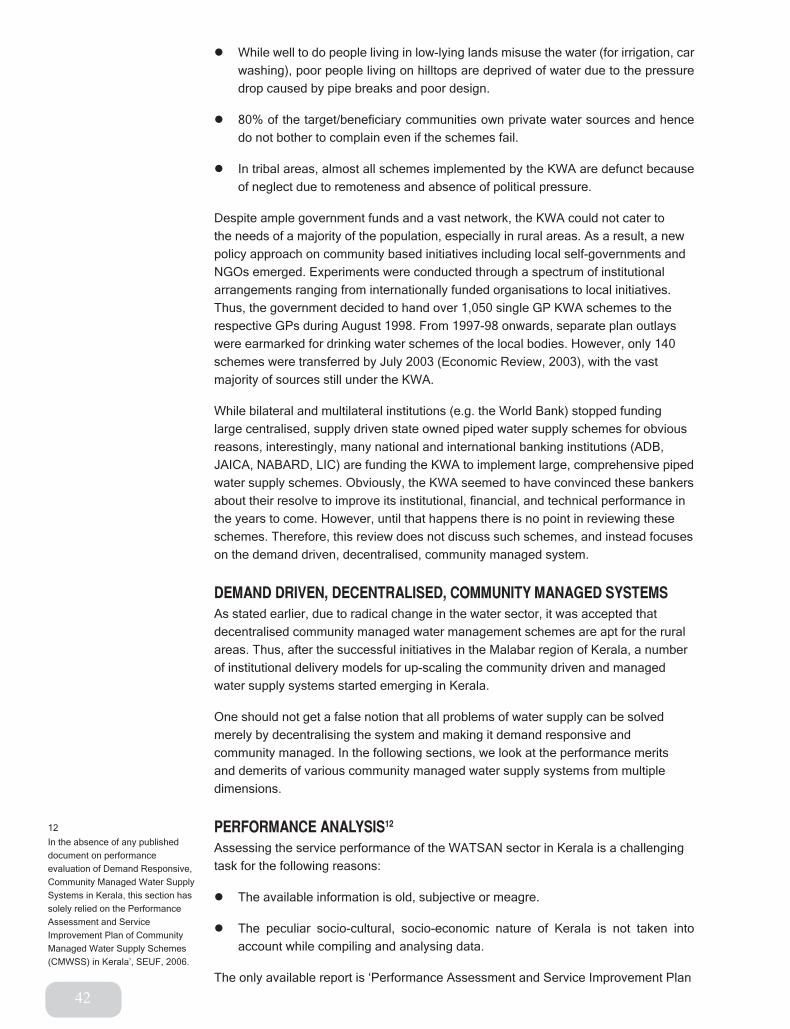
42
While well to do people living in low-lying lands misuse the water (for irrigation, car z
washing), poor people living on hilltops are deprived of water due to the pressure
drop caused by pipe breaks and poor design.
80% of the target/beneficiary communities own private water sources and hence z
do not bother to complain even if the schemes fail.
In tribal areas, almost all schemes implemented by the KWA are defunct because z
of neglect due to remoteness and absence of political pressure.
Despite ample government funds and a vast network, the KWA could not cater to
the needs of a majority of the population, especially in rural areas. As a result, a new
policy approach on community based initiatives including local self-governments and
NGOs emerged. Experiments were conducted through a spectrum of institutional
arrangements ranging from internationally funded organisations to local initiatives.
Thus, the government decided to hand over 1,050 single GP KWA schemes to the
respective GPs during August 1998. From 1997-98 onwards, separate plan outlays
were earmarked for drinking water schemes of the local bodies. However, only 140
schemes were transferred by July 2003 (Economic Review, 2003), with the vast
majority of sources still under the KWA.
While bilateral and multilateral institutions (e.g. the World Bank) stopped funding
large centralised, supply driven state owned piped water supply schemes for obvious
reasons, interestingly, many national and international banking institutions (ADB,
JAICA, NABARD, lIC) are funding the KWA to implement large, comprehensive piped
water supply schemes. Obviously, the KWA seemed to have convinced these bankers
about their resolve to improve its institutional, financial, and technical performance in
the years to come. However, until that happens there is no point in reviewing these
schemes. Therefore, this review does not discuss such schemes, and instead focuses
on the demand driven, decentralised, community managed system.
DeMAnD Driven, DecentrAliSeD, coMMunity MAnAGeD SySteMS As stated earlier, due to radical change in the water sector, it was accepted that
decentralised community managed water management schemes are apt for the rural
areas. Thus, after the successful initiatives in the Malabar region of Kerala, a number
of institutional delivery models for up-scaling the community driven and managed
water supply systems started emerging in Kerala.
One should not get a false notion that all problems of water supply can be solved
merely by decentralising the system and making it demand responsive and
community managed. In the following sections, we look at the performance merits
and demerits of various community managed water supply systems from multiple
dimensions.
perforMAnce AnAlySiS12 Assessing the service performance of the WATSAN sector in Kerala is a challenging
task for the following reasons:
The available information is old, subjective or meagre.z
The peculiar socio-cultural, socio-economic nature of Kerala is not taken into z
account while compiling and analysing data.
The only available report is ‘Performance Assessment and Service Improvement Plan
12
In the absence of any published
document on performance
evaluation of Demand Responsive,
Community Managed Water Supply
Systems in Kerala, this section has
solely relied on the Performance
Assessment and Service
Improvement Plan of Community
Managed Water Supply Schemes
(CMWSS) in Kerala’, SEUF, 2006.

43
of Community Managed Water Supply Schemes (CMWSS) in Kerala’, produced by
the SEUF in 2006. However this study is seriously limited in its scope and content,
because it was purely based on user perceptions and is qualitative in nature. The
study also did not analyse the reasons for the good or bad performance of schemes.
Under these circumstances, the experience and observations of the authors
regarding CMWSS in Kerala will be considered an important input, leading to the
following analysis.
parameters used to assess the performance of cMWSSThe most critical parameters that determine the performance efficiency of water
supply schemes, considered in this review are as follows:
Regularity of supply1.
Adequacy (quantity) of water supply2.
Water quality3.
Breakdown maintenance4.
Operation maintenance cost5.
Since the above indicators are greatly influenced by the governance/institutional
mechanisms under which the scheme operates, the SEUF study considered sample
schemes selected from various governance models as shown in Table 11.
TABlE 11: SAMPlE SElECTION FOR PERFORMANCE STUDy
programme bGs (Schemes) hhs surveyed
Jalanidhi 30 181
Sector reforms 10 60
Swajaldhara 5 30
Jeevadhara 5 30
PRI schemes 11 66
Total 61 367
regularity of water supplyThe important and expected feature of the CMWSS is the regularity in supply. This
signifies management efficiency of the user committee which also contributes to the
sustainability of the scheme. However, this regularity varies drastically under various
institutional mechanisms as can be seen in Table 12, indicating the need for further
study that can help in improving the performance.
TABlE.12: REGUlARITy OF SUPPly DURING SUMMER IN vARIOUS CMWSS IN
KERAlA
Supply in Summer (number of hours)
Schemes (in percentage)
jalanidhi Sector reforms Swajaldhara Support from Dutch Govt. (chekode)
pri schemes
< 1 hour 53% 60% - 40% -
2-6 hours 37% 30% 40% 40% 73%
6-12 hours - - 40% 10% -
12-24 hours 7% - 10% - -
24 hours 3% 10% - - 27%Source: SEUF Study

44
One limitation of this parameter is that if the pressure is high, the same total quantity
of water can be supplied in less time. So this data does not indicate adequacy of
water. However, it is clear that all the CMWSS schemes are functioning regularly.
Adequacy (quantity) of water supplyThe user response to whether the quantity of water supplied daily was adequate
for drinking and cooking is provided in Table13. The higher rates of inadequacy/not
potable reported under Jalanidhi and PRI schemes may be due to the fact that the
size of some schemes is very large leading to source depletion and/ or operational
problems.
TABlE 13: USER PERCEPTION ABOUT THE ADEQUACy OF SUPPly IN CMWSS OF
KERAlA
user perception jalanidhi Sector reforms Swajaldhara jeevadhara pri schemesAdequate 76% 98% 100% 100% 70%
Not adequate 24% 2% 0 0 8%
Available but not used
for drinking
0 0 0 0 22%
Source: SEUF Study
Water quality
FIGURE 7: USER PERCEPTION OF WATER QUAlITy OF CMWSS IN KERAlA
Source: SEUF Study
User perception of water quality purely depends on its colour, smell and taste. While
these are very important parameters, they are not adequate to verify whether they
satisfy drinking water standards. 80% of households surveyed mentioned that the
quality of drinking water supplied was either good or satisfactory. Only very few
households reported that the quality of water supplied was bad (Figure 7). More
studies need to be carried out to test the chemical and bacterial properties of the
water and compare them source wise, as well as to understand the pollution sources.
MaintenanceWhile the frequency of breakdowns indicates the quality of equipment/components
used and the technical capability of the maintenance staff, delays in repairing indicate
the managerial inefficiency. Unfortunately, the data on the frequency of breakdowns
is not available. There is a general understanding that since most of the schemes are
new, the frequency of breakdowns is comparatively less. However, there is some data
available on user perceptions regarding delays in repair, summarised in Table14.

45
TABlE 14: USER PERCEPTIONS ABOUT DElAyS IN REPAIR OF CMWSS IN KERAlA
period taken for rectification
project name
jalanidhiSector reforms Swajaldhara jeevadhara pri schemes
Within a day 7% 5% 0 0 0
Within a week 40% 10% 13% 43% 26%
Within a month 22% 28% 13% 0 21%
very long/Not
known31% 57% 74% 57% 53%
Source: SEUF study
Table 14 indicates a very confusing picture. We cannot believe that the community
will wait indefinitely for repairs. This can mean that either the faults are so minor that
they do not affect the functioning of the scheme, or that the community has alternate
sources.
How users perceive delays in repairs also depends on the month in which these
repairs were delayed, because during the rainy season people do not bother much.
Hence Table 14 does not provide a correct picture about maintenance. However,
it is very clear that there is tremendous scope and need to improve the repairs and
maintenance system of the CMWSS in Kerala.
operation and maintenance costThis is the actual cost of operation and maintenance (O&M) of the schemes which
includes the operator’s salary, electricity charges and small repair costs. The
responses are given in Table 15.
TABlE15: MONTHly O&M COST OF CMWSS OF KERAlA
Sr. no. Schemes Average o&M cost (rupees/family/month)
1 Jalanidhi 26
2 Sector reforms 22
3 Swajaldhara 42
4 Jeevadhara 25
5 PRI schemes 32Source: SEUF study
The community adds a certain percentage of time and money to meet the major
repairs and also generate a corpus fund. Hence the water tariff may be slightly higher
than the actual O&M Cost.

46
GlobAl perSpectiveThe world contains sufficient, clean freshwater for everyone’s basic personal and
domestic needs. Personal and domestic uses of water account for less than 10%
(UNDP, 2006) of the total amount of water used for human activities, although
essential uses require only a significantly lower percentage.
The 2006 UNDP Human Development Report stresses that issues related to poverty,
inequality and unequal power relationships have caused the current water and
sanitation crisis. In 2006, over 1.1 billion individuals lacked access to basic supply of
water from a clean source that is likely to be safe; of these, the majority are living in
rural areas, according to the WHO UNICEF Joint Monitoring Programme. The figure
of 1.1 billion does not include the number of people who cannot afford the water, who
face prohibitive waiting times for collecting water, who receive water at occasional
intervals or have to collect water from dangerous areas.
In rural areas, many people collect water of dubious quality from unprotected wells or
surface water sources, often at a great distance from their homes, which deters them
from collecting sufficient quantities. This problem is significantly worse during the dry
season, when the water table drops, and rivers and shallow wells dry up.
In urban areas low-income groups, in particular those living in informal settlements,
often lack access to adequate water supply. Piped supplies seldom cover informal
settlements, meaning that people living there access water from a variety of
inadequate water supply options, such as wells built close to latrines, water kiosks
with water of dubious origin, or water vendors.
Due to a lack of adequate statistics, the number of people without access to water
is often underestimated. As many of the informal settlements in urban areas are
unrecognized by the local or national governments, the exact number of residents
living in these settlements is often unknown, as is the status of water provision.
Tenants may also be missing from the statistics where landlords do not declare them.
Water can also be prohibitively expensive, so that even where water is available,
people do not have access to a sufficient quantity for health and hygiene practices.
As a result, there is considerable inequality in the distribution of water in urban areas,
with smaller urban centers particularly badly affected. Statistics for access to water in
urban areas therefore tend to be uneven. Further, while people may use safe sources
of water for some purposes, such as for drinking, these sources may be prohibitively
expensive to use for all other domestic uses, forcing people to use unsafe sources for
washing or cooking. This is not reflected in the statistics of access to water supply.
The establishment of an explicit right to water begs questions of definition. The first
question is about standards, i.e. what should the per capita share and quality be, and
how easy should it be to access?
Section 8: riGht to WAter AS A huMAn riGht

47
In 1992, the International Conference on Water and the Environment held in Dublin
set out four guiding principles for action to reverse the trends of over-consumption,
pollution and rising threats from drought and floods. One of the four principles states
that water is an economic commodity with an economic value in all its competing
uses. Within this principle, it acknowledged the basic right to have access to clean
water at an affordable price. What is then an affordable price?
Another important factor that influences the human rights dimension of water supply
is the governance system. There are multiple systems of water supply governance
such as the state, donors, private companies, community/user organisations (in which
the supplier and the consumer are the community) and combinations of the above
with varying levels of success in ensuring right to water. So which governance system
is the best?
last but not the least, there are multiple grey areas while identifying the policy
imperatives for ensuring water supply as a human right. Some of the questions that
need answers are: Do individuals have a right to water supply? What kind of access
is necessary to fulfil this right? What responsibilities do individuals have vis-a-vis this
right? What priority does this right carry in relation to other uses of water (e.g., for
agricultural use, industry, leisure, the environment)? How is this right promoted and
safeguarded?
Answers to the above questions vary widely depending upon the geographical,
political, social, cultural and economic contexts of the target population and location,
and attempts to define global standards for the above is futile. However, broad
guidelines to define and derive contextual standards based on these variables can
be developed to assist refinement of policies and programmes. For this purpose, one
needs to carry out exhaustive studies at various levels.
Though in India there is no explicit recognition of a right to water in any of the policies
or legal instruments, the governments both at the centre and states have been
making efforts to provide safe drinking water and sanitation facilities to people. This
is very often reflected in the various policies like state water polices or policies of
drinking water. There are also various programmes and schemes at national and
state levels to provide safe drinking water and sanitation facilities to people. These
programmes and schemes are implemented through various modes and under
various sets of rules and processes. In short, answers to the above raised questions
indicate the compliance of human rights imperatives in the WATSAN sector of a
country.
KerAlA’S perSpective on riGht to WAter very interestingly, the policy framework of the Kerala Water Sector is highly
supportive and facilitative for ensuring a right to water. The following quotes from the
Kerala Water Policy, 2008 (WRD, 2008) speaks volumes about the intentions of the
Kerala government in this regard:
“Further, it is important to make sure that the right of every citizen to equitable access to water for his or her basic needs is protected and enforced through appropriate policy, legislative and programme initiatives” (1.1, pg.3)
“Access to water is a human right” (1.2, page3)
Besides, in the Kerala Water Policy 2008, there is lot of emphasis on equity and
social justice as can be seen from the following:

48
“…considers water as part of the ecosystem for the benefit of all and not as a commodity for the profit of few” (1.1, page 3)
“A policy framework shall be adopted to create an enabling environment for equitable…….management of water resources…..” (1.3, page 4)
Keeping these policy provisions in mind, one can surely say that there is a policy
environment in Kerala that supports access to water as a human right. However, as
we all know policy pronouncements unless converted to legal instruments are not
legally enforceable.

49
concluSionSWater availabilityStudies indicate that there is no appreciable change in the available rain. However,
there is definitely a drastic change in the distribution of available water, both in time
and space. This is caused due to human interventions such as improper land and
water use, overexploitation of natural resources and poor perspective planning.
The peculiar hydro-geological and geo-morphological setting of Kerala is ideal
for decentralised, low yielding open dug wells. If properly located and sanitarily
protected, these wells meet the domestic water requirements of the people
throughout the year. Besides, if well protected and maintained, sources such as
ponds and rivers can meet the non-drinking domestic requirements.
In exceptional cases (coastal plains with saline intrusion and hilly tracts), where the
population has crossed the carrying capacities, or where the people have started
living in water scarce areas, there are real water problems that cannot be solved
using conventional measures.
reasons for supply demand gapThe tendency to highlight depleting water sources as the reason for water scarcity
and introduce more schemes as the only solution is dangerous. There is also a
tendency to suggest water conservation and artificial recharging as remedies to
compensate for depleting water resources. While to a certain extent, this is true,
considering the peculiar geo-morphological and hydro-geological conditions of
Kerala, there are severe limitations to augmenting water sources through artificial
measures.
Since Kerala is already extracting water at a much faster rate than that at which water
is provided by nature (in an annual cycle), the major reason for the supply demand
gap is the exponential increase in per capita demand (see Figure 5). Can we control
this increase in demand?
coverageThe available statistics on coverage do not yield a clear picture. If the presence of
piped water supply is a criterion, then only about 11.5% of the population is covered.
However, as mentioned earlier, a majority of households in Kerala traditionally
depend on open wells for their household water supply needs. The NSS data shows
that over 85 % of households in Kerala depend on well water for their domestic needs
(a reduction in this figure is noticed in the recent NSS data). However, among the
people who depend on well as their principal source, nearly 59% are getting sufficient
water throughout the year. Besides, among those dependent on wells, around 51% of
households were obtaining water at their household premises.
Section 9: DoMeStic WAter Sector - concluSionS AnD WAy forWArD

50
Social justice (inclusion coverage)There are two interesting observations in the coverage of water supply as far as the
social dimension is concerned:
A great majority of families deprived of safe and adequate drinking water are those 1.
who live in water scarce areas and cannot afford to create their own water source
(e.g. digging a well).
Most families excluded from the so called demand driven water supply schemes 2.
are poor families who cannot afford to pay their share of the cost.
Therefore, the task of identifying families who cannot contribute financially towards
the creation of a water source must be prioritised, and special schemes must be
planned for them. Alternately, their payment towards public schemes should be
reduced or waved.
Water quality and healthAlthough the bacterial contamination is very high at a few spots in rivers where a large
number of pilgrims accumulate or where municipal sewage is discharged in large
quantities, by and large the general bacterial quality of Kerala rivers is satisfactory,
with Biological Oxygen Demand (BOD) less than 5 mg/l, Dissolved Oxygen (DO)
more than 5 mg/l, bacterial load less than 2000 No/100 ml, and faecal coliforms less
than 500 No/100 ml. However, there are enough studies that indicate the deteriorating
chemical quality of our rivers and lakes.
The levels of chemical contamination in some of the large surface water bodies are
extremely high due to industrial effluents and pesticide and chemical residues from
large agricultural lands and plantations. It is reported that the chemical content of
some rivers (e.g. the Periyar) is so high that the conventional treatment plants cannot
purify them.
In addition to the accumulation of chemical pollutants, coastal wetlands also face the
problem of saline intrusion, primarily due to over exploitation of fresh water resulting in
a decreased inflow of fresh water from rivers. This also results in diminishing aquatic
life which further leads to the deterioration of water quality.
As a consequence of the deteriorating water quality there is indirect evidence of
deteriorating health in areas with polluted water. Since morbidity occurs due to
multiple causes, such as poor environmental and personal hygiene, poor water
quality, air pollution and unhealthy food habits and lifestyles, it is difficult to isolate the
cause of diseases. For these reasons, it is almost impossible to assess the impact of
water pollution on health.
There is no regular arrangement for monitoring the quality of water supplied by
schemes. For this reason, it is very difficult to take corrective measures to improve the
quality from time to time.
planning conceptAlmost all water supply systems except the Chekode model adopt the top down,
linear target oriented, project approach for water supply planning. Strictly based on
‘manuals’, external project facilitators make decisions about the required studies,
choice of technology, design norms such as per capita daily supply, etc. and the
governance model. Community participation, if at all, is sought only for decisions
such as the number of beneficiaries, implementation, O&M procedures and the cost

51
sharing pattern. Review meetings only assess the actual progress with respect to the
stipulated targets.
This is the typical ‘waterfall model’13 which is outdated and no longer used in modern
production systems. As opposed to this model, the Chekode model adopts an
iterative process based planning, which relies on building on results. Obviously,
Chekode has enormous advantages in terms of cost effectiveness, operational
efficiency and user satisfaction. The only area where iterations were not carried out in
this model was with regard to the maintenance system.
performance of water supply systemsThe performance of the water supply systems is directly dependant on the
governance and institutional set up. If one considers regularity, adequacy, water
quality, trouble free performance, and cost of operation and maintenance as criteria
for performance, then the KWA schemes are the worst and the Dutch assisted
Jeevadhara schemes are the best. However, it is proven well beyond doubt that
water supply systems can be managed more sustainably and smoothly under
decentralised community managed governance systems. One major drawback in all
the governance system though is the absence of a regular performance monitoring
system.
Governance systemsFollowing three delivery or governance models exist in the Kerala domestic water
sector:
Centralised model of the KWA1.
Community managed systems (Jalanidhi, Sector reforms, Dutch Govt. supported 2.
Jeevadhara, Swajaldhara, etc.)
Decentralised Panchayati Raj systems3.
If one considers the parameters such as investment cost, maintenance cost,
sustainability, quantity and quality, service performance, user satisfaction, WATSAN
security, social justice (inclusion, equity), and conflict-resolution, these governance
systems can be rated as follows:
Jeevadhara1.
Sector Reforms, Swajaldhara2.
Jalanidhi3.
Panchayat4.
KWA5.
Many attempts to improve the performance of the KWA have failed in the past. While
the KWA can still play a vital role in urban water supply and comprehensive piped
water supply systems, this model cannot be recommended for rural water supply at
all. All the decentralised/community managed governance models can be improved
by deriving lessons from the Chekode Model.
13
The waterfall model is a top down
linear (as opposed to cyclic) model
of development with unidirectional
flow of controls, inputs and outputs),
larman 2004, Matt Haikin, Feb
2013

52
WAy forWArD General approach towards a sustainable solutionFollowing the objective tree (Figure 8) thematically explains the general strategy
towards sustainable solutions to water supply problems in Kerala. One can see
how complex the situation is, and how one needs to look at the issue much more
comprehensively than the conventional sectoral approach. The objective tree
illustrates links to many cross cutting issues and sectors, which are missing in all
conventional approaches.
There are six areas of intervention that may increase the net water availability, reduce
the demand, ensure social justice/equity, sustainability and efficiency of systems so
that the water supply problem is addressed in a sustainable and just way.
FIGURE 8: OBJECTIvE TREE
The figure might look dogmatic at the outset. But, if one is looking for a sustainable
and just solution for water supply systems, one has to change the basic approach.
This is possible in iterative participatory processes in which the community makes
informed decisions.
policy aspectsThe provisions of the Kerala Water Policy, 2008 adequately cover all areas to ensure
sustainable and socially just water management in the state. What is urgently required
is the enactment of a series of legislations that facilitate implementation of the policy.
Some suggestions that may help in this regard are as follows:
Revive Traditional Sources
Changing Land/ Water use pattern
Controlled Per Capita Demand
Protected Water Sources
Sustainable & Cost Effective
Water Projects
Quality/Quantity of Water Sources
Maintained/Improved
Reforestation, Water Conservation
Controlled Water Extraction
Easy to Maintain
Appropriate Technology
Judicious water Demand
Appropriate Governance
System
Enhance Water Wisdom Controlled Urbanisation/
Industrialisation
Sustainable Life style
Adequate liquid/solid waste management
Correct Estimation of
Water Availability
Primary Intervention
Controlled mining of rock & sand for building
construction
Making Right to Water a Legal Right
Equity in Water Supply
Every needy person ensured adequate safe
Drinking Water
Affordable Price for the Poor
Water Supply Problem Solved

53
Stringent punishment to polluters of water sourcesz
Recommendations for best practice for mining of river sand, soil and rocksz
Reclaiming encroached lands under water bodiesz
Environmental clearance requirements for all water (hydro-electric, irrigation and z
water supply) projects to be reviewed
Clearance procedures for industrial water use to be made more stringentz
Enforce severe restrictions on the exploitation of water resources (surface and z
ground) in critical areas. In this regard, the draft Model Groundwater Act prepared
as part of the 12th Five year Plan preparatory work could be useful (Planning
Commission, 2011)
Subsidies for poor consumers of water supply schemes to be increasedz
Provision of encouraging incentives to best performing water supply schemesz
Introduce community managed water quality monitoring systems at the block z
level. This will not only ensure maintenance of water quality, but also will provide
employment to many in the rural area. Alternatively, this can be linked with the
science clubs in schools.
Making right to water a legal rightz
introducing the programme to an areaThe success and failure of any programme greatly depends on the way it is
introduced to the public. The conventional approach of ‘launching’ a programme
in which the politicians and officers ‘explain’ the programme, the budget, cost
sharing pattern, and the duration, and solicit their ‘cooperation’ should be avoided.
Instead, the programme should be announced as a community initiative in which the
government would be a facilitator and provider of funds subject to government rules.
Of course, the general imperatives of the project, such as iterative planning process,
cost sharing, maximum government support per capita, minimum and maximum
supply rate, environmental and sustainability conditions, roles of stakeholders in
planning, implementing and managing the schemes etc. should be explained.
planning/ design criteria of water supply schemesSystem sustainability, user satisfaction, equity and performance of water supply
systems greatly depend on the plan and design. For this reason, one cannot assess
the performance of water supply systems without investigating the approaches, tools,
and norms used in planning and designing systems. Here, we are laying certain basic
principles of water supply planning based on the iterative planning model.
the iterative planning processAs mentioned earlier, one of the major causes for the failure of our schemes is the
‘waterfall model’ or linear model of planning. Here the system boundaries, quality
and quantity of inputs and outputs, time frame and the system design are selected
arbitrarily and rigidly, at least during the project tenure. This assumes that the
conditions which influenced the choice of the above parameters do not change in time
and space. However, in practice, in almost all cases they do change and result in a
system failure.

54
Development is an iterative, evolutionary process which is influenced by much more
complex spatio-temporal parameters than is normally recognised by the conventional
planning schools. As early as the mid-nineties, this paradoxical situation was
recognised mainly by experts in software development. They named the current
model ‘Waterfall’, and introduced many new radical models such as Extreme
Programming, Scrum, and Unified Process, which were later followed by IBM’s
Rational Unified Process (Beck and Fowler, 2000; larman, 2004; Matuszek, 2008;
Wells, 2009a, 2009b, Haikin, 2013).
While there are, of course, distinctions between the above new approaches and
methodologies, at their core, they all revolve around the idea of evolving a solution
to a problem in small sub-systems in short iterations. Each step of iteration will have
small increments of time and space and the output of one iteration becomes the input
to the next.
In iterative planning, the system boundary, quality and quantity of inputs and
outputs and time frame are taken up in small incremental steps, and at each step
the output influences the inputs and design parameters of the next step, until a
dynamic equilibrium is obtained. While the basic meteorological, hydrological and
physiographic characteristics of the chosen system offer limiting input conditions,
the land use and socio-cultural values (which determine the demand) are variable
inputs. It is assumed that these can be adjusted through a collective resolve of the
community living in the system. The quantity and quality of outputs (targets) and the
design norms are flexible. Since the community itself is the major decision maker at
every step, there is always user satisfaction and any dissatisfaction at any step is an
indication that there is a need to implement more steps.
The strategy, approach and knowledge base to be used for a choice of solutions
and processes will depend on the geographical, physical, social, cultural, and
environmental characteristics of the area. Hence the first step is to conduct an
in-depth study of these aspects. The study should be conducted in the following steps:
identifying the system boundaryThis is the geographical boundary of the area where intervention is needed. This
may be a region (e.g. Kuttanad), district, Panchayat or habitation. Depending on the
cultural, social, geographical, hydrological and /or hydro-geological homogeneity, the
system can be sub-divided into sub-systems. In water resource management, the
order of considering these various attributes while dividing the system into sub-
systems is as follows:
Hydrologicalz
Hydro-geologicalz
Geographicalz
Social/Culturalz
Manageable sizez
This means that if the system is homogenous in all the above aspects, then the
system need not be subdivided. If hydrologically non-homogenous, the system should
be divided into homogenous hydrological sub systems. These sub-systems are
divided if they are hydro-geologically non-homogenous, and so on. These processes
can be completed using available secondary data.

55
problem analysisIt is said that more than 80% of the solution is achieved if the problem is studied well.
The study should be conducted through a participatory process by resource persons
from the community and a team of facilitators consisting of experienced professionals.
The following studies may be required:
For each sub-system, study the change in quantity and quality of surface and z
ground water resources both in time and space using secondary and if necessary
primary data followed by a systems analysis
Identify various dimensions to the problem (environmental, hydrological, pollution, z
health, social, political, etc.) and define these dimensions in clear terms and draw
up a ‘problem tree’
Quantitatively assess and document the merits and demerits of ongoing government z
programmes, traditional practices and community-managed initiatives in water
management
Fine tune the system and sub-system boundaries (if necessary)z
Ascertaining the safe quantity of available water for extractionThis is the most important and critical step in planning water management schemes.
However, unfortunately, this seldom gets its due importance and is even neglected
in most cases, and availability of water is taken for granted. In almost all cases, the
availability of water is overestimated.
Unless the source is a storage reservoir, the safe available/extractable amount of
water should be expressed as rate of flow rather than total volume (monthly, annual).
The safe available/extractable amount of water for various sources is worked out as
follows:
Stream/Spring = Measured minimum/lean flow – (Demand of planned/ existing
schemes in the upstream and downstream + Flow required for
ecological balance of coastal/wetland regions + Requirement of
future development)
Open Wells = Minimum (peak summer) daily extractable quantity (to be
established through pumping tests) – (certain percentage for drought
years + certain percentage for future development)
Bore/Tube Wells = Identify aquifer system boundary
Then calculate the annual recharge by determining storage coefficients (through
pumping tests), and water table fluctuations, earmark at least 50% for future
development, establish the safe yield of the bore wells (which is 50% of the discharge
rate that stabilizes the water level at 60% of the water column for continuous pumping
of 72 hours and without any deterioration of quality and the water levels of nearby
wells)
choice of technology based on principles of water managementThe community uses the ‘problem tree’, analytical data and comparative studies of
government, traditional and community/private initiatives and takes broad decisions
on the choice of technology using the following water management principles:
Redistribute the available water both in time and space (highly decentralised water z
storage, diversion and extraction systems)

56
Do not extract more fresh water than is supplied by nature every year (rainfall, z
recharge, runoff)
Do not allow stagnation of (both surface and sub-surface) water, as in the case of z
neglecting traditional water sources. Maintain the dynamics of all water sources
(either by extracting for consumption or allowing the water to flow off). This will
allow leaching of salts from the soil every year.
Allow adequate quantity of water to flow in the rivers even during the summer so as z
to prevent sea water intrusion and to maintain the ecological balance of the coastal
and wetland regions.
Earmark sufficient reserve for future demands and meeting riparian rights.z
The principle of subsidiarity, which prompts the pursuer to solve the problem with
minimal institutional involvement, by finding the simplest and smallest possible local
solutions and opting for larger, more complex methods only if absolutely necessary
can be followed while choosing solutions. This exercise will also prevent use of the
proverbial “sledge hammer to kill a fly”.
Developing technology selection matrix The physiographic, hydro-geologic and socio-economic conditions of Kerala differ
vastly from its neighbouring states, hence the water conservation and management
models developed in other states cannot be directly applied to Kerala. The complexity
of these problems is so vast that simple prescriptions are neither possible nor
desirable.
A decision system that incorporates as many variables as is critical in defining the
situation and choosing a logical path in order to select the most appropriate solution.
Perhaps this is a better tool than standard sets of designs and user manuals or
prescriptions. A Technology Selection Matrix (TSM) that offers solutions for different
problems under different conditions could be a sound approach. The user of such a
matrix should, however, be fully aware of the limitations of this tool and should modify
the solutions depending upon changes in the situation both in time and space.
TABlE 16: TyPICAl TECHNOlOGy SElECTION MATRIx FOR WATER SUPPly PROBlEMS
Scope
( in the order of preference)
Solutions for various problem categoriesfor households facing water problem for less than 3 months
for households facing water problem for more than 3 months
Scattered Dense <15 Dense (15-50)
Dense >50 Scattered Dense <15 Dense (15-50)
Dense >50
1.Manual drawing systems (Source<100 m)Scope of improving existing draw wells IWR PWR IWR PWR
New open draw wellyes
Developing springsyes
Rehabilitation of existing hand pumps yes yes
New Hand Pumpsyes
2.Gravity pipe supply (Source>100 m), and com-munity will be able to share capital costSpring yielding>160 lpd/family and a gravity main length<25 m/family
GS GS GS GS GS GS GS

57
Scope
( in the order of preference)
Solutions for various problem categoriesfor households facing water problem for less than 3 months
for households facing water problem for more than 3 months
Scattered Dense <15 Dense (15-50)
Dense >50 Scattered Dense <15 Dense (15-50)
Dense >50
Stream water needing treatment yielding>160 lpd/family and a gravity main length<25m/family
GST GST GST GST GST GST GST
Ponds/quarries needing water treatment with mean annual storage of 30000 l/family and a gravity main length<20 m/family
GST GST GST GST GST GST GST
3.pumping schemes (Source>100 m), and com-munity will be able to share capital costSpring yielding>160 lpd/family and a pumping main length<25 m/family
PS PS PS PS
Existing bore wells yielding>40 lpd/family and pumping main length<25 m/family
PS PS PS PS
Existing open wells yield-ing 15000 – 20000 lpd and a pumping main length<15m/family
PS PS
Existing ponds needing water treatment with mean annual storage of 30000 l/family and a pumping main length<15 m/family
PST PST PST
Stream water needing treatment yielding>160 lpd/family and a pumping main length<25m/family
PST PST PST PST
New bore wells yielding>50 lpd/family and pumping main length<10m/family
PS PS PS PS
New open wells yielding 15000 – 20000 lpd and a pumping main length<15m/family
PS PS
4.none of the above RWH RWH RWH RWH RWH RWH SPS SPS
IWR : Individual Well Rehabilitation to improve the quality and yield of the well
PWR : Public Well Rehabilitation to improve the quality and yield of the well
GS : Gravity Schemes based on springs with individual house connections
GST : Gravity Schemes with slow sand filtration and chlorination with house connections
PS : Pumping Schemes with house connections
PST : Pumping Schemes with slow sand filtration and chlorination with houseconnections
SPS : Special Pumping Schemes from distant sources, sometimes requiring treatment
initiate iterative learning processIt is one thing to suggest solutions but quite another to be sure about their
appropriateness and sustainability, which can be ascertained only by testing them
on the ground. We know that development has always been a conscious, iterative
and evolutionary process. An iterative process that continually refines the designs
based on experience until a near perfect/appropriate solution is found, is a better
approach than a lengthy planning process (using manuals and handbooks) followed
by a lengthy implementation process. Since the community itself spearheads such
processes, they will not only own the responsibility but also sharpen their analytical
skills during the implementation.

58
During the above studies (particularly the analytical part), care should be taken
to ensure active participation of as many stakeholders as possible. An efficient
moderation technique using scientific tools such as Participatory Rural Appraisal
(PRA), Objective Planning Tools, etc. can filter prejudices and vested interests during
such participatory exercises.
StandardsWhile prescribing standards, it is better to prescribe lower and upper limits of per
capita supply, level of service and ease of access (which changes in time and space)
rather than one single national standard. While the lower limit is the minimum
quantity, quality and the service level, the upper limit is the net available/extractable
quantity of water divided by the population within a natural system boundary
(watershed). Of course, while computing net available water, one must not forget to
earmark adequate quantity of water for future generation of all living things and water
necessary to maintain the eco-environmental balance. Another important point to be
considered in locations where the upper limit of extraction has been reached is to
progressively introduce control over per capita use.
identifying local resource personsOne should not take the knowledge of the community for granted. This is particularly
true in the case of rural Kerala. A vocal and somewhat literate person can easily
misguide the community and the facilitators and give an impression that he/she is an
expert. While his/her enthusiasm is a social capital, his/her inexperience might be
detrimental. The decisions of the community should be vetted on sound logical and
technical bases. local resource persons with hands-on experience and deep insights
into the technical, environmental, socio-cultural and socio-economic aspects of the
problem should lead discussions. If such know-how is not readily available amongst
the community, one might need to arrange for external help and impart this knowledge
to them.
The selected persons should be offered thorough training in conflict resolutions,
communication skills and facilitating processes of iterative planning and making
informed choice at every stage of project development. In Chekode, school children
were trained to map the area, collect data and conduct surveys. School children also
assessed the yield of wells and communicated concepts of safe and sustainable yield
to the villagers.
community organisationvarious community organisation models have been tried. The Chekode Model of
evolving community management systems with active participation of the Panchayat
seems to be better than other models. A trained group of motivated local persons will
spearhead this process. local units of Kudumbashree can play a vital role. Several
brainstorming sessions will sharpen the analytical skills of the community so that they
are equipped to make informed choices. Once the technology and designs are ready,
the beneficiaries are formally organised and registered.
Governance modelIn all proven governance models, the role of a professional facilitating agency
(PFA) (like SO, CSO) is very crucial. This review also recognises the need for
such an agency. It is an agent of change that brings in a radical transformation in
the planning tools, community organisation and capacity building. It is expected to
have an organisational vision. However, one must be very careful while selecting
such institutions. They should have facilitated attitudinal changes in the past in the

59
community and politicians about the virtues of environmental concern, equity and
social justice. They should also have independent and practical view points on how
to go about achieving this. yet another positive indication is their ability to motivate
communities to organise into self-help groups to implement projects with minimum
external financial support. Kudumbashree is one such agency. For iterative planning,
the facilitating team should be creative, and experienced in handling situational
changes that occur in time and space without compromising on the objective.
Whether community action should precede institution building or vice-versa to
pursue sustainable solutions to any natural management issue is a “chicken or egg”
question. However, what is most effective is initiating a series of community actions
facilitated by experienced professional groups. Since these initiatives need creativity
and flexibility, it would be better if autonomous citizens/civil society forums implement
them under the public relations dispensation. These forums should network and share
experiences. Their success should lie in initiating concrete action on the ground with
limited external funding for creating physical assets. Most of the inputs (including
intellectual and financial) should be generated locally.
After the success of the first iterative step, the programme can be anchored in a
decentralised governance system. A Neighbourhood Group (NHG) of Kudumbashree
is an ideal planning unit. These planning units are recognised by the Gram Sabha
(ward) and anchored in the Panchayat planning process. Subsidiarity principle has
to be followed and decisions should be made at the lowest level possible especially
concerning issues like technology choice, standards, location, implementation,
sustainability, O&M and management while retaining an umbrella role for the GPs for
effective implementation.
Women should be included in all aspects of decision making with respect to drinking
water security planning, implementation, operation, maintenance and management.
Water qualitybacteriological contaminationExisting drinking water sources and freshwater resources in general should be
protected by the implementation of the Total Sanitation Campaign to make villages
open-defecation free and maintain a clean environment; by safely disposing of solid
and liquid wastes; by ensuring the control and treatment of industrial effluents; and by
raising awareness about the impacts of the use of high concentration of fertilisers and
pesticides on water.
chemical contaminationTo address salinity problem in drinking water, various technological options like
tapping of alternate safe surface water sources, roof-top rainwater harvesting and in
situ dilution through artificial ground-water recharge etc., could be adopted. High-tech
options should only be considered as a last resort. In fact, there is tremendous scope
for action research in deriving low cost solutions to simple chemical contamination.
Sustainability plansSustainability plans should be prepared especially for over-exploited, critical and
semi-critical blocks for taking up scientifically located recharge measures and water
harvesting structures on a watershed or aquifer basis. This may include reforesting
the denuded forests and soil/water conservation in upper catchments to increase the
base flow and prevent erosion, artificial recharging and water conservation measures.

60
Sustainable model of operation and maintenance and service deliverySince this model does not consider large comprehensive piped water supply
projects as a desirable option, only decentralised community managed schemes
are considered. An O&M Plan should be developed right at the planning process.
The community and the village Water and Sanitation Committee (vWSC) should be
engaged in developing the O&M Plan. A simple and practical O&M manual should be
handed over along with the formal transfer of the scheme to the Managing Committee/
vWSC. While working out the operational cost to be shared by the user on a monthly
basis, a provision should be made for an emergency fund to be used to meet price
escalation, unforeseen expenditures such as replacement of equipment, source
revitalisation, artificial recharging, etc.
From the experience of community managed water supply systems, the best models
for O&M management are those implemented under the sector reforms model, which
also pays attention to local employment generation.
Safe water to disadvantaged sectionsExclusion of remote habitations and those with concentrations of Scheduled Caste,
Scheduled Tribe and minorities should be prevented by the appropriate use of MIS and
GIS maps in the planning process. By making water supply a legal right of the citizen, the
government can no more deny such community access to safe and adequate drinking
water by arguing on economic grounds. Besides, the active participation of the user
community in planning, technology choice and scheme design can make the schemes
better suited for the socio-economical and socio-cultural aspects of the community. This
will also prompt the community to own and maintain the schemes.
information, education, communicationParticipation of Women Groups such as Kudumbashree and children’s forums have
tremendously helped in awareness generation and building the capacity of the
community to take informed decisions in Punarjani, an environmental regeneration
project of Alappuzha. This is a good model for the IEC campaign for Kerala.
The following measures should be implemented for schools and Anganwadis
strengthen institutions, teach the use of water testing kits (WTKs), mobilise the
community through rallies and door-to-door IPC by school children, introduce a
chapter on sanitation, water and hygiene in the school syllabus, and introduce a
school cabinet in each school in coordination with the education department.
capacity buildingThe common thread running through all the component activities of the programme
is a strategy of introducing change in how the water supply systems and related
services are planned, implemented and sustainably managed. yet another important
objective of capacity building is to invoke the creative wisdom of the community and
stakeholders. These steps will be implemented by the PFA.
cost sharing strategyThere are advantages and disadvantages to the general policy that the user must
share the cost of service facilities. On one hand, while providing all service facilities
to every citizen free of cost will benefit the socially and economically vulnerable
communities, the opportunity to generate funds required to meet the capital and
maintenance costs of such facilities, the demand for which is steadily growing, will be
lost. On the other hand, if one chooses to levy a price for water, then the poor who
cannot afford that price may be left out, and the rich can buy any amount of water
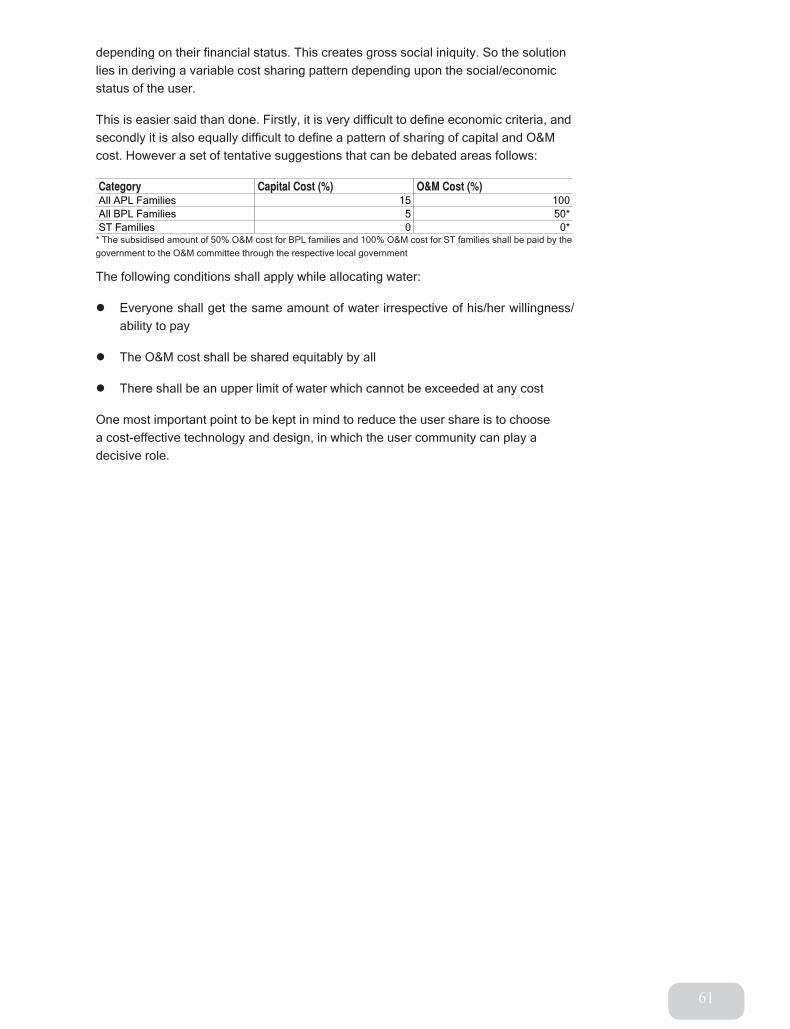
61
depending on their financial status. This creates gross social iniquity. So the solution
lies in deriving a variable cost sharing pattern depending upon the social/economic
status of the user.
This is easier said than done. Firstly, it is very difficult to define economic criteria, and
secondly it is also equally difficult to define a pattern of sharing of capital and O&M
cost. However a set of tentative suggestions that can be debated areas follows:
category capital cost (%) o&M cost (%)All APl Families 15 100All BPl Families 5 50*ST Families 0 0*
* The subsidised amount of 50% O&M cost for BPl families and 100% O&M cost for ST families shall be paid by the
government to the O&M committee through the respective local government
The following conditions shall apply while allocating water:
Everyone shall get the same amount of water irrespective of his/her willingness/z
ability to pay
The O&M cost shall be shared equitably by allz
There shall be an upper limit of water which cannot be exceeded at any costz
One most important point to be kept in mind to reduce the user share is to choose
a cost-effective technology and design, in which the user community can play a
decisive role.

62
unDerStAnDinG the concept of SAnitAtionThe World Health Organisation (WHO) states that:
“Sanitation generally refers to the provision of facilities and services for the safe disposal of human urine and faeces. Inadequate sanitation is a major cause of disease world-wide and improving sanitation is known to have a significant beneficial impact on health both in households and across communities. The word ‘sanitation’ also refers to the maintenance of hygienic conditions, through services such as garbage collection and wastewater disposal”.
COHRE, Water Aid, SDC and UN-HABITAT (2008), define sanitation as,
“Sanitation is access to, and use of, excreta and wastewater facilities and services that ensure privacy and dignity, ensuring a clean and healthy living environment for all”
Arno Rosemarin in the Swedish magazine, Sanitation Now (2008) observed that
“Sanitation is firstly about human behaviour; and to be successful, systems need to prioritise such things as affordability, comfort, dignity, privacy, odour control, ease of cleaning and user acceptance by men, women, elderly and children. To be sustainable, sanitation systems must build in all these aspects.”
environmental sanitationWHO defines ‘Environmental Sanitation’ as,
“the control of all those factors in man’s physical environment which exercise or may exercise a deleterious effect on his physical development, health and survival.” Environmental sanitation/hygiene includes all the activities aimed at improving or maintaining the standard of basic environmental conditions affecting the well-being of people. These conditions include (1) clean and safe water supply, (2) clean and safe ambient air, (3) efficient and safe animal, human, and industrial waste disposal, (4) protection of food from biological and chemical contaminants, and (5) adequate housing in clean and safe surroundings, also called environmental hygiene.”
Sustainable sanitationWhen one talks about sanitation, only provision of toilets, wastewater treatment and
provision of hygiene facilities is not enough. To achieve sanitation in a sustainable
manner, the schemes or approaches should be socially acceptable and economically
viable (Conradin, n.d.). One example of approaching towards sustainable sanitation is
to consider the value of the waste (human excreta and wastewater) as something very
resourceful that can be reused and recycled.
Section 10: SAnitAtion - An ASSeSSMent

63
The concept of sustainable sanitation14 recognises that any improvement in sanitation
has to consider the entire sanitation chain. It then discusses the various dimensions
of sustainability and their implications for the different components of the sanitation
chain15. Finally, it argues that sustainability is more a general direction for improving
sanitation services than a final goal to be achieved, and decisions made in the
relevant sectors will always have to consider the local circumstances and resources
available to move ahead.
ecological sanitationEcological sanitation (ecosan) works on the principle that human excrement is not a
waste product but contains the nutrients required to fertilise land, and that it should
be used for this purpose. The ecological sanitation cycle begins with containment,
the stage at which excreta is held in the sanitation installation. The waste is then
sanitised through one or several processes which cause pathogens to die. The
resultant safe soil conditioner (from faeces) and fertiliser (from urine) is then recycled
and used to assist crop production.
The underlying principle of ecological sanitation is to return the valuable nutrients
from waste back to the environment and avoid the pollution often caused by
conventional sewerage (Esrey et.al, 2001)
SAnitAtion: A huMAn riGhtS iMperAtive“Everyone has the right to an adequate standard of living for themselves and their families, including adequate food, clothing, housing, water and sanitation”,
The Habitat Agenda, adopted by consensus of 171 states at the Second United Nations
Conference on Human Settlements (Habitat II), 1996
“Clean water and sanitation are not only about hygiene and disease, they’re about dignity, too. … Everyone, and that means ALL the people in the world, has the right to a healthy life and a life with dignity. In other words: everyone has the right to sanitation”- Prince Willem Alexander of the Netherlands, Chair of the UN Secretary
General Advisory Board on Water and Sanitation (UNSGAB)
The recognition of sanitation as a human right alongside water is central to this
effort, clarifying the role of member states in ensuring access to adequate sanitation,
establishing standards that can be monitored and to which the states can be held to
account, and lending priority to providing facilities to those without access, particularly
the vulnerable and marginalised, in a non-discriminatory manner.
unDerStAnDinG SAnitAtion probleMS of KerAlAThe people of Kerala always had adequate awareness about personal hygiene and
sanitation. They took a bath twice a day, and kept their homesteads very clean. The
plentiful availability of water was helpful in this regard. Although open defecation was
prevalent amongst economically and socially backward communities, their personal
hygiene habits were of a high standard. Due to lower population density, a lower rate
of waste generation, and the degradable nature of most waste, the management of
solid waste was a simpler task.
However, over the last few decades, the following developments took place (Refer to
Figure 9).
The high density of population and emergence of nuclear families resulted in an z
14
IClEI European Secretariat, 3rdJuly
2012, available at http://www.
accessanitation.org/fileadmin/
accessanitation/Documents/
ACCESSanitation_Concept_of_
sustainable_sanitation.pdf
15
Sanitation is much more than
toilets. It is rather a series of linked
steps ranging from the provision of
resources to operate a sanitation
system, to disposal or reuse of the
end-products. These links form
what is known as the sanitation
chain and each of the elements
within this chain needs to be
considered if the system is to be
sustainable.

64
increasing number of toilets, leading to a very high density of leach pit latrines in
rural areas. This led to the pollution of ground water.
Similar developments and uncontrolled growth in the urban areas resulted in a z
high rate of growth of septic tank toilets. Untreated septage from these toilets is
removed and disposed into water bodies, contaminating surface water sources.
Failure of leach pit type toilets in waterlogged rural areas and the continuation of z
direct defecation in surface water bodies also led to further pollution of surface
water bodies.
These developments resulted in heavy contamination of water resources.z
On the solid waste management front, the adoption of a modern lifestyle resulted z
in the increasing use of plastic packaging materials leading to the accumulation of
non-degradable wastes.
Segregation and management of waste became a herculean task because waste z
was thrown and dumped in public places everywhere due to a lack of awareness.
A defective planning process led to the choice of inappropriate technology and z
governance systems resulting in unsustainable and inefficient waste management
systems.
FIGURE 9: KERAlA SANITATION PROBlEM TREE
Disposing Septage into Surface Water
Bodies
Dense Population of
Septic Tanks in Urban Areas
Failure of Solid Waste Management Programmes
Increased Use of Plastic
Serious Environmental
Pollution
Unsustainable and Expensive Projects
Deteriorating Water Sources
Difficult to Segregate/ Maintain
Inappropriate Governance
System Groundwater Pollution
Dense Population of Leach Pit
Latrines in Rural Areas
Surface Water Pollution
Primary Causes
Poor Public Sanitation Awareness
Throwing Wastes
Everywhere
Failure of Toilet Designs
in Waterlogged
Areas
Increased Production of Non-Degradable
Wastes
Choice of Inappropriate
Technology
Defective Planning Process

65
The above analysis reveals that the sanitation problems of Kerala are much more
complex and multidimensional in nature than is normally recognised.
coverage of sanitary toilets in KeralaThe availability of sanitary toilets has improved in most parts of the state except
backward regions like coastal areas, hilly regions, tribal areas and urban slums.
TABlE 17: HOUSEHOlD SANITARy lATRINES: ACCESS TO SANITATION
FACIlITIES (1991-2005)
timeline 1991 (1) 1995(2) 2001(3) 2005(4)Rural households with toilet (%) 44 73.4 81.3 94.9
Urban households with toilet (%) 73 90.0 92.0 98.3
Source – (1) Census of India, 1991, (2) NSSO, 1995, (3) Census of India, 2001, (4) NFHS 3rd round, 2005
TABlE 18: COvERAGE OF TOIlETS IN KERAlA, 2011 CENSUS
total hhs 7,716,370 HHs in Urban Areas (UA) 3,620,696 No. of HHs having toilets within the premises in UA 3,527,650 No. of HHs not having toilet within the premises in UA 93,046 No. of HHs practising open defecation in UA 60,621 % of open defecation .017% HHs in Rural Areas (RA) 4,095,674 No. of HHs having toilets within the premises in RA 3,818,327 No. of HHs not having toilet within the premises in RA 277,347 No. of HH practising open defecation in RA 229,103 % of open defecation 5.60%
Source: Census 2011
This indicates a very high percentage of coverage. Uncovered households, which
constitute a very small percentage, are in tribal belts, slums where BPl families
reside, or coastal waterlogged areas.
The Suchitwa Mission carried out an assessment of the sanitation coverage among
BPl families in different districts achieved by the Total Sanitation Campaign. The
results are presented in Table 19.
TABlE19: DISTRICT SANITATION COvERAGE OF BPl FAMIlIES
no. District rural population% of total rural population
urban
population% of total urban population
total population% of total population
1 Trivandrum 1,601,803 74.76 958,617 87.81 2,560,420 79.16
2 Kollam 135,397 63.01 453,781 97.38 1,789,178 69.21
3 Pathanamth 813,091 73.24 107,700 87.00 920,791 74.62
4 Alappuzha 1,182,805 79.00 528,255 85.00 1,711,060 81.13
5 Kottayam 964,558 57.09 292,663 97.62 1,257,221 64.35
6 Idukky 632,423 59.12 55,262 95.95 687,685 60.90
7 Ernakulam 1,593,378 97.83 1,393,990 94.38 2,987,368 96.19
8 Thrissur 1,832,646 85.85 828,354 98.68 2,661,000 89.47
9 Palakkad 1,468,977 64.97 340,964 95.62 1,809,941 69.15
10 Malapuram 1,790,729 54.77 353,860 99.35 2,144,589 59.15
11 Kozhikode 693,578 39.01 830,762 75.44 1,524,340 52.94
12 Wyanad 669,798 89.19 14,835 50.01 684,633 87.7
13 Kannur 829,761 69.37 708,332 58.40 1,538,093 63.85
14 Kasargod 751,235 77.42 143,298 61.32 894,533 74.29
Total 16,160,179 68.55 7,010,673 84.08 23,170,852 72.77
Source: Economic Review 2010

66
Generation of solid waste The quantity of garbage generated in the state is about 12,731 tonnes/ day. This
includes waste generated in all municipal corporations, municipalities and GP areas.
As per the Audit Report (lSGIs) for the year ended 31st March 2010, all Urban local
Bodies (UlBs) are required to furnish the details of the quantity and composition of
solid waste generated to the concerned district collectors on an annual basis (CAG,
2010).
TABlE 20: WASTE GENERATED IN UlBS
name of the ulb population 2001Waste generated (Seuf report)
Quantity of waste reported by ulbs (in Mt)
2005-06 2006-07 2007-08 2008-9 2009-10Adoor 28,952 8.68 6.66 6.68 6.70 6.71 6.73Alapuzha 177,029 53.11 45-50 45-55 50.00 55.00 60.00Angamaly 33,409 10.02 8.00 8.00 8.00 8.50 9.00
Attingal 33,831 10.15 16.50 16.50 18.00 18.00 19.00Chavakad 38,138 11.44 8.00 8.25 8.50 8.60 9.00Cherthala 45,102 13.53 9.00 9.50 10.00 10.50 11.00Kanjangad 65,503 19.65 20.00 20.00 20.00 20.00 20.00Kasrgod 52,683 15.80 12.00 13.00 13.00 15.00 15.00Kozhikodu 440,000 176.00 300.00 300.00 300.00 300.00 300.00Malapuram 58,491 17.55 10.00 10.00 15.00 15.00 15.00Payyannur 68,711 20.61 4.50 4.70 5.00 5.50 6.00Perinthalmanna 44,612 13.38 15.00 15.00 17.00 17.00 17.00Perumbavur 26,547 7.96 7.00 8.00 8.50 9.00 9.50Thaliparampu 67,507 20.25 8.00 8.00 8.00 8.00 8.00Thirur 53,654 16.10 10.00 10.00 12.00 15.00 15.00Thrissur 317,526 127.01 45.00 50.00 50-55 50-55 45-50
Source: Adapted from the Audit Report (lSGIs) for the year ended 31st March 2010, CAG, 2010
All the UlBs failed to maintain any records of the quantity and composition of
generated wastes. As there was no reliable data on the quantity of waste generated
in the UlBs, the auditors adopted the study report (2006) of the SEUF on solid waste
management under Water and Sanitation Project (WSP). As per the report, the per
capita waste generation per day was 300 grams in municipalities and 400 grams in
municipal corporations. The mismatch between the figures furnished by the UlBs and
those based on the study report of the SEUF is shown in Table 20 (CAG, 2010).
biomedical waste generationFIGURE 10: BIOMEDICAl WASTE GENERATED IN KERAlA
Source: ENvIS Centre, Kerala State Council for Science, Technology and Environment, MoEF, GoI, http://www.
kerenvis.nic.in/Database/Soil_836.aspx

67
It is roughly estimated that about 1.3 to 2.0 kg/bed/day of solid waste is generated
from health care institutions, of which 15 to 20% is biomedical waste. Thus, about
1.5 lakh tonnes/day of solid waste is generated from hospitals and other health care
centres in the state. (Kerala ENvIS 2013c).
hazardous wasteFIGURE 11: DISTRIBUTION OF HAZARDOUS WASTE HANDlING UNITS IN KERAlA
Source: ENvIS Centre, Kerala State Council for Science, Technology and Environment, MoEF, GoI, http://www.
kerenvis.nic.in/Database/Soil_836.aspx
The quality and quantity of industrial hazardous waste is based on the type of its
source. In Kerala the solid wastes from the industries and the sludge from the
Effluent Treatment Plant (ETP) are not properly disposed. Further waste generated
from conventional industries like coir and cashew cause severe disposal problems.
According to the pollution potential, hazardous waste handling units are classified
into three categories (See Figure 10), namely red category (highly polluting), orange
category (medium polluting) and green category (less polluting). (Kerala ENvIS
2013c).
SAnitAtion proGrAMMeS of KerAlAKerala sanitation policy An integrated action plan, the Malinya Mukta Keralam Action Plan, was drawn up
for a comprehensive intervention in the sanitation situation in Kerala. The Action
Plan, which was released by the President of India on 1st November 2007, put
forward an overall strategy for organisational reform and specific action plans with a
recommended time-frame and expected outputs. The Kerala government announced
a general framework for a very ambitious sanitation policy on 1st November, 2007
which is described below.
visionThe policy aims to make Kerala waste free, with an unpolluted environment, public
hygiene and cleanliness. It is expected that the quality of life in the state will improve
due to better health and overall well-being, economic gains, better aesthetic
surroundings and a healthier environment.

68
Mission Sanitation for allz
Facilitate an attitudinal change among the people of Kerala towards waste z
management and maintaining a healthy environment
Enable achievement of an overall hygienic environmentz
Facilitate implementation of comprehensive scientific waste management z
systems
Promote employment of appropriate technologyz
Facilitate active community participationz
Achieve waste reduction at sourcez
targets Total coverage of household sanitary latrines in nine monthsz
Total coverage of sanitary latrines in public institutions, schools, hospitals etc. in z
one year
Systematising household and institutional waste treatment systems within three z
years
Popularising the segregation of household and institutional waste within one yearz
Developing decentralised common waste treatment facilities within three yearsz
Developing common sanitary land-fill sites for inert waste during the 11z th plan
period
Making colonies clean and neat within two yearsz
Making public places litter-free within three yearsz
Preparing a perspective plan for liquid waste management within two yearsz
Extending sewerage facilities and tripling their coverage within five yearsz
performance of sanitation systemsThere are glaring differences between the factors that support the performance of
water supply and sanitation systems. Some of them are as follows:
While the absence or inadequacy of water supply affects the life of people directly z
and immediately, issues pertaining to sanitation and hygiene take a long time to
be felt by the public and more often than not only when the problem becomes
intolerable.
While the success or failure of environmental sanitation depends upon a behavioural z
change in the public, the performance of water supply systems depends upon
the chosen technology, the operational or managerial efficiency and revenue
generation in addition to people’s participation and their attitude.
Therefore, the parameters for assessing the status of environmental sanitation are
quite different and mostly attitudinal and socio-cultural in nature.

69
Here again, the data available to assess the performance of solid and liquid waste
management systems (both urban and rural) is extremely limited. While there are
statistics on the coverage of environmental sanitation and waste management, there
is not much data available on whether these projects are functioning well, and related
problems. Under these circumstances, similar to the situation regarding water supply,
the authors are constrained to come to certain tentative conclusions.
Solid waste management systems Solid waste management is the most burning issue in terms of its administrative,
ecological and public health implications. It is a major problem in municipal
corporations of Trivandrum, Ernakulam, Kozhikode and Thrissur. It has become a
major threat to public health in urban areas and urban townships in rural areas as
well. The accumulation of plastic waste and the issue of thin plastic carry bags which
are still in use even after repeated legal measures further complicate the scenario.
The pollution of water bodies and the environment due to the misuse of pesticides
poses serious health hazards. Health problems due to occupational pollutants, such
as asthma, allergies, and chronic obstructive pulmonary diseases especially in the
context of rising urbanisation and increasing vehicular traffic are other related issues
that need to be addressed.
Kerala is a developed state. As a result, the huge consumption of resources results
in the generation of large quantity of waste. Several initiatives at the national and
state levels have abated the problems arising due to waste generation, in particular,
pollution. Solid waste generation is mainly due to industrial and domestic activities.
The waste generated due to industrial activities is of hazardous as well as non-
hazardous nature. Biomedical waste is generated from health care institutions. The
responsibility of collecting, treating and safely disposing off all types of solid waste
lies with the institution or industry which generates the waste. Even though there are
58 urban municipalities in Kerala, most of the GPs depict the characters of urban
areas particularly in respect of Municipal Solid Waste (MSW) generation.
collection of solid waste in ulbs16
According to the Municipal Solid Waste (Management and Handling) Rules, 2008 all
municipal solid waste generated should be collected by the local authorities and that
no waste shall remain uncollected posing risks to public health and the environment.
However, none of the UlBs except Kozhikode Municipal Corporation have
maintained records showing the quantum of waste collected. The quantity of waste
reported to have been collected by Attingal and Perinthalmanna Municipalities were
38% and 12% more respectively than the actual quantity of waste generated. In the
remaining UlBs, the reported collection of waste was in the range of 18% to 85%. In
six of these UlBs, the percentage of collection was below 50. The uncollected waste
is hazardous for public health and the environment. (CAG, 2010).
A comparison of the quantum of waste collection (based on approximation) as
reported by the UlBs with the quantum based on average per capita norms is
presented in Table 21.
16
Most of the information in this
section is adapted from the Audit
Report (lSGIs) of Kerala for the
year ended 31st March 2010,
prepared by CAG, India.

70
TABlE 21: WASTE GENERATED IN UlBs
name of the ulb total no. of wards Waste generatedWaste collected and transported per day(in Mt)
percentage of waste collected
Adoor 25 8.68 3.3 38
Alapuzha 50 53.11 45.0 85
Angamaly 27 10.02 8.0 80
Chavakad 29 11.44 6.5 57
Cherthala 32 13.53 8.5 63
Kanjangad 40 19.65 7.0 36
Kasrgod 35 15.65 8.0 51
Kozhikodu 55 176.00 50.0 28
Malapuram 37 17.55 10.0 57
Payyannur 41 20.61 4.5 22
Perinthalmanna 31 13.38 15.5 112
Perumbavur 24 7.96 5.0 63
Thaliparampu 41 20.25 3.6 18
Thirur 35 16.10 13.0 81
Thrissur 52 127.01 42.5 33
Source: Adapted from the CAG Audit Report (lSGIs) of Kerala, 2010
Segregation and storage of wasteAs per the implementation schedule (Schedule II), each UlB should collect municipal
solid waste through any of the methods like community bin collection (central bin),
house-to-house collection, collection at regular pre-informed timings and scheduling
by ringing a bell. Further organic and inorganic waste should be collected separately
for facilitating effective processing and disposal of waste.
The UlBs are also required to provide covered community bins of different colours
-green for biodegradable, white for non-biodegradable and black for other waste. In
Kerala, none of the UlBs provided community bins of different colours. Nine UlBs
have introduced the system of house-to-house collection of waste partially with the
help of Kudumbasree units. The service-level bench-mark prescribed by the Ministry
of Urban Development, GoI was to be 100% coverage of Solid Waste Management
(SWM) services by the UlBs. However, in the selected UlBs, the percentage of
collection of waste from house-holds varied from zero to 34%, except in Kochi where
it was 100%. In five UlBs, the percentage of collection of waste from shops was nil.
The details are given in Table 22.
TABlE 22: NUMBER OF HOUSES AND SHOPS FROM WHICH WASTE WAS
COllECTED By KUDUMBASREE UNITS
name of the ulb total no. of houses
no. of houses from which waste was collected
% of collection total no. of shops
no. of shops from which waste was collected
% of collection Whether seg-regated or not segregated
Alapuzha 52892 12000-150000 25 5909 0 0 No
Attingal 11188 3800 34 1660 1660 100 yes
Chavakad 7233 750 10 1250 0 0 No
Kozhikodu 76030 76030 100 16855 16855 100 yes
Malapuram 16000 2000 13 2106 0 0 No
Payyannur 17393 200 1.14 2507 0 0 yes
Perinthalmanna 16880 0 0 2068 2068 100 yes
Thrissur 93843 15165 16 11055 3373 31 No
Thirur 10171 350 3 2982 0 0 No
Source: Adapted from the CAG Audit Report (lSGIs) of Kerala, 2010

71
transportation of wastesAccording to MSW Rules, municipal solid waste is to be transported using covered
vehicles in order to avoid scattering and exposure to the environment. The vehicle
shall be so designed to avoid multiple handling of waste prior to its final disposal. Out
of 136 vehicles used by the 16 UlBs, only 39 vehicles were covered and 28 were
designed to avoid multiple handling.
processing of wasteThe implementation schedule (Schedule Iv) of the MSW Rules stipulates that the
biodegradable waste shall be processed by composting, vermi-composting, aerobic
digestion or any other appropriate biological processing so as to minimise the burden
on the landfill. The mixed waste containing recoverable resources should follow
the route of recycling and the end products of processing should comply with the
standards specified in the schedule. Among the 16 UlBs the Payyannur Municipality
had established a small vermi-compost plant with a capacity to process a limited
quantity of biodegradable waste.
TABlE 23: QUANTITy OF WASTE PROCESSED
name of the ulb
period of processing Waste brought to site in Mt
Manure pro-duced in Mt
Quantity processed as per norm in Mt
% of pro-cessing
o&M charges paid to service provider ( in lakh rupees)
Thrissur April 2008 to March 2009 15792.00 87.63 350.52 2 39.48
Kozhikode November 2006 to June 2008 39900.00 1736.00 6944.00 17 146.46
January 2009 to December 2009 14647.37 1088.00 4352.00 30 Nil*
Thirur April 2009 to March 2010 3978.00 30.96 123.84 3 2.20
Malapuram August 2005 to March 2010 15960.00 756.00 3024.00 19 68.41
* The Corporation received royalty of Rs.4.80 lakhs per annum
Source: Adapted from the CAG Audit Report (lSGIs) of Kerala, 2010
The Kozhikode and Thrissur Corporations had established processing plants many
years ago. The Kasaragod, Angamali, Perumbavur and Cherthala Municipalities
have not established processing plants. From the table it is seen that 70 to 98% of
the waste collected by the municipalities was dumped in dump yards as crude waste.
This led to an increase in the pressure on scarce land resources available with the
UlBs apart from associated environmental problems.
important observations from the audit report:
Though Taliparamba, Alappuzha, Chavakkad, Kanhangad and Adoor began z
working on this issue between 2005 and 2008, the processing plants had not been
commissioned even as of April 2010. Incomplete projects indicated that Suchitwa
Mission, which provided financial assistance to the UlBs, had not monitored the
projects properly.
Among six UlBs which began waste processing, Attingal and Perinthalmanna did z
not maintain any records of the quantities of waste received in the processing
plant, waste processed, and manure produced and sold. The only data available in
the other four UlBs was the quantity of waste brought to the site and the manure
produced. As per the norm adopted by Suchitwa Mission, the quantity of organic
manure obtainable was 25% by weight of the quantity of waste processed. Based
on this norm, the quantity of waste processed (ranging from 2% to 30%) by the four
UlBs was low. The details are given in Table 23.

72
liquid waste managementThe coverage of sewerage facilities, even in the city corporations, is extremely low.
It is of the order of 30% in Thiruvananthapuram and 5% in Kochi corporation areas,
probably one of the lowest in the country. Even in this system, the provision for
treating black liquor is almost absent. The remaining municipal and rural areas do not
even have such a facility. The septic tanks have volume constraints due to scarce
land available, and the leach pits overflow because of the high water table, especially
during the rainy season which extends up to about 150 days in a year. Therefore,
there is a requirement for the clearance and removal of septage, for which facilities
are not available anywhere in the state. The dangerous practice followed now is that
the septage is collected using vacuum suction into tankers which are then emptied
into open spaces and even water bodies.
Shortcomings of the current planning processThe current process of planning sanitation programmes in Kerala has the following
serious shortcomings:
It is a top down, target oriented, linear, project approach in which standardised z
designs and governance models borrowed from elsewhere are imposed without
any effort to adapt to local situations (e.g. two pit leaching type toilets).
Despite the boastful terminology of the state policy regarding community z
participation, the involvement of the people in planning, implementation and
management of public systems is only notional. In fact, these responsibilities are
squarely vested with the three-tier Panchayat governance systems, both rural and
urban.
Social acceptability is taken for granted, and if there is resistance from the people, z
it is assumed that an ‘awareness campaign’ will effect attitudinal changes in the
community.
All solutions are ‘curative’ in nature. Preventive measures are not even considered. z
It is important to remember that improvement in sanitation requires a value and
attitudinal change which cannot be achieved through ‘projects’.

73
concluSionWhile the personal and household hygiene of Kerala is better than elsewhere in
the country, with the state’s 100% coverage and usage of sanitary latrines and
the reasonably good water and food handling habits of its people, it faces serious
problems of environmental hygiene and related public issues.
The primary causes of sanitation problems in Kerala can broadly be classified into the
following:
Conventional, top-down, project approach in planning has led to the choice of z
inappropriate technology and governance systems. This has led to a failure of
individual as well as public sanitation systems.
The behavioural patterns of the people towards waste handling are not supportive of z
introducing efficient/sustainable systems for the management of solid and liquid
wastes.
The increased usage of plastic carry bags has resulted in increased production and z
accumulation of non-degradable wastes.
This also reveals that the problem is much more complex and a project approach
cannot lead to a sustainable solution.
the WAy forWArDAn approach that incorporates and integrates multiple sectors in three major areas is
required:
Adopt an iterative planning process leading to�
The choice of appropriate technologies in toilet designs, sewage disposal systems z
and waste management systems
The choice of appropriate governance systems in waste managementz
Inculcate better waste handling habits. This calls for a reform in the education �
system.
Control and/or ban the use of plastics through legislative and regulatory �
measures.
Section 11: concluSionS AnD WAy forWArD

74
FIGURE 12: TREE DIAGRAM FOR IMPROvED SANITATION
An iterative planning processThrough this method, planning and implementation should be taken up in a series of
iterative steps of spatial and temporal increments. These should be small loops of
‘doing-learning-doing’ until a reasonably satisfactory and sustainable solution is found
to the problem. The spatial system boundary of the first iteration should be a ward
or Gram Sabha, for a period of one year. This implies that a series of experimental
interventions should be made in a ward in the areas of technology choice, governance
models (planning, implementing and maintenance of systems), and strategies in
bringing about positive attitudinal changes in waste handling and environmental
protection.
Based on periodical (monthly, quarterly) observations and participatory evaluations,
the designs, governance and education models should be improved until sustainable
solutions are found. The time frame can be expanded if necessary. The entire process
should be carried out by the community with the support of trained and professional
facilitators. Subsequently, this approach should be extended to the whole Panchayat,
block, district and state.
A series of situations and the respective solutions (technology, institutional choice),
depending upon spatial variations of social, economic, cultural, and geographical
conditions can be defined, which can be used to develop guidelines for planning at the
district and state levels. Such planning tools are far more superior to the conventional
users’ manuals, most of which present standard designs and methodologies.
Success of Solid Waste Management Programmes
Better Quality of Water Sources
Reduced Non Degradable Wastes
Sustainable and Economical Projects
Ban/Control Use of Plastic
Carry Bags Wastes
Segregated & Stored at
Source
Easy to Manage & Maintain
Choice of Appropriate Technology
No Ground Water Pollution
No Surface Water Pollution Iterative
Planning process
Appropriate Governance
System
Improve Public Sanitation
Awareness & Attitude
Safe Handling & Disposal of Septage
Improved Toilets in Urban Areas
Improved sanitary Latrines in Rural Areas
Primary Interventions
Improved Environmental Sanitation

75
choice of appropriate technologyComprehensive research should be initiated in order to develop efficient, sustainable,
user-friendly and cost-effective technologies for the following situations:
z Toilets for waterlogged areas: various models of ecosan designs currently
available should be tried and their socio-cultural, economic and environmental
impacts monitored for at least one year. A comparative study should be carried out
to choose the most appropriate design under different situations.
z Improved designs of leach pit toilets: The design of leaching-type toilets should be
improved to prevent/reduce ground water contamination in rural areas.
z Toilets for urban areas including septage handling: The design of toilets should be
improved to separately handle excreta, urine and water so that the entire septage
is disposed off safely.
z Improved liquid waste management for urban/semi-urban areas: low cost,
environmentally sound and socially acceptable sewage handling and treatment
systems should be designed and implemented.
z Improved solid waste management for urban/semi-urban areas: low cost,
environmentally sound and socially acceptable solid waste handling and treatment
systems should be designed and implemented.
choice of appropriate governance/ delivery systemsOne of the major reasons for the failure of the public sanitation programmes is the
choice of an inappropriate governance system. A few experiments of community
managed environmental protection initiatives in which environmental sanitation is
an important component have thrown ample light on more appropriate governance
systems for environmental management in rural and urban areas. (See box 4).
Some important lessons that can be learned and used in developing governance
models for environmental protection and sanitation are as follows:
Continuous support of competent institutions/trained professionals as facilitators 1.
is essential in planning, implementing and managing environmental sanitation
systems. These professionals should be competent in iterative planning, capacity
building and technical aspects of environmental sanitation.
The institutional set-up of Kudumbashree, the state-sponsored women’s empow-2.
erment programme operating under the Panchayati Raj system of governance, is
ideal for spearheading governance systems of solid waste management in rural
and urban areas because:
Where many alternative community/Panchayat models have failed, Kudumbashree a.
units have managed to sustain not only the process of waste collection and
management but also to inculcate attitudinal changes in the community.
Kudumbashree is an officially recognised institutional entity which leads b.
development programmes at various levels of the Panchayat governance system.
This programme provides an opportunity for income generation for poor women.c.
The functionaries are already trained and motivated in addressing issues of public d.
interest.
They are available at every nook and corner of the state.e.

76
Involvement of children’s forums (6. Bala Sabhas) in creating awareness about the
imperatives of environmental sanitation and monitoring systems (water quality
and environmental indicators) has been implemented successfully. One needs to
undertake a pilot study about the involvement of Bala Sabhas and the science/
environmental clubs of schools, as well as educational curriculum reforms.
Special training should be provided to functionaries of Kudumbashree in iterative 7.
planning, implementation and management of decentralised sanitation pro-
grammes.
Special training should be provided to functionaries of the 8. Bala Sabhas in aware-
ness generation, monitoring of water quality, and other environmental indicators.
Funds can be earmarked from national and state programmes for supporting 9.
programme facilitation, hardware costs, and emoluments for the functionaries at
the Panchayat and municipality levels.
BOx 4: SOlID WASTE MANAGEMENT IN KERAlA
– AN EMERGING INSURMOUNTABlE PROBlEM?
There is hardly any informed person in Kerala who does not have an opinion
about waste being generated in the process of urbanisation, but nobody knows
how exactly to manage it. There is a serious crisis in urban waste management
that has manifested itself in the form of deadlocked garbage disposal plans in
some municipalities and Corporations in the State. It highlights the gap between
accepted standards in solid waste management and their achievement.
Caught in the struggle are the civic bodies, the people and the government. The
impasse in garbage disposal and treatment is acutely felt in the Corporations
of Thiruvananthapuram, Kochi, Kozhikode, Thrissur and Kollam, and the
municipalities of Kannur and Thalassery.
With an urban population share of nearly 48%, Kerala comes close to the global
rate. The hotspots of garbage management crisis in the State are a reflection of
the collective failure to devise an appropriate strategy and technology.
The crisis has turned local panchayats against municipalities and Corporations on
the one hand and the civic bodies against the government on the other.
Transportation of waste to the landfills triggers protests by local residents, who
raise the issue of their right to live in a clean environment. The waste disposal
systems of the civic bodies are naturally left in a mess, with mounds of rotting
garbage in parts of towns and cities.
The no-holds-barred battle between the vilappil Panchayat and the
Thiruvananthapuram Corporation over a solid waste treatment plant set up
there continues with no solution in sight. Even a decade after the plant started
functioning, the Corporation is unable to put in place a leachate treatment plant. In
spite of favourable High Court pronouncements, the district administration had to
abandon two attempts to bring the plant-related equipment and clay to the vilappil
plant in the face of local protests.
Source: The Hindu, August 12th, 2012

77
ensuring attitudinal and behavioural changes in the publicConventional methods of ‘awareness campaigns’ will not be effective in achieving this
herculean goal. The following strategies have a better chance of success:
launch model initiatives of cleaning in which all sections of the community will z
participate, followed by small pilot group activities consisting of segregation at
source, collection, and disposal of wastes. The involvement of Bala Sabhas and
Kudumbashree will add to the success of such initiatives.
Involve school children in monitoring water quality and environmental degeneration. z
They can influence their fellow students and their parents.
Design, produce and screen short films/advertisement clips that highlight the z
damage caused by environmental degeneration and unhealthy lifestyles, and the
virtues of the sound practices of keeping the environment clean and maintaining a
healthy lifestyle. Commercial Tv channels should be used to screen these films.
control/ ban the use of plastic packaging materialThe existing law prohibiting the use of plastic packaging materials and carry bags
should be amended to include more poor grades of plastics including bottles.
Implementation of this law must be ensured through the Panchayat level governance
system with incentives to those who report misuse, and stringent penal action against
those responsible for violation. This can only be successful through active public
participation, including that of shop owners.
School sanitation Schhol Sanitation and Hygiene (SSH) is an important component to ensure universal
sanitation coverage in rural areas of the country. School teachers, ASHA and
anganwadi workers should be trained to deal with the sanitation crisis. Education
departments in states and the centre should include the functionality and usage
of toilets and hygiene practices including handwashing with soap in all inspection
reports and reviews of programmes. Moreover, sanitation must be made a part of
school curricula. Efforts should be made to ensure that there are functional toilets in
schools and anganwadis located in private premises. Coverage should be extended
to schools and anganwadis housed in private buildings, in particular government-
aided schools.
community toiletsThe present concept of community toilets is limited to provisions for the landless and
migrant population apart from provisions at public places like bus stands and market
places in rural areas. Tie-ups with a concerned authority like the National Highway
Authority of India (NHAI) in order to provide public toilets along highways will certainly
help.
Government orders should be brought out to ensure appropriate sanitation facilities
at petrol pumps, and in restaurants and dhabas. The issue regarding operation and
maintenance of such facilities should also be suitably addressed and a one-time
option of funding by the government should be included in the TSC.
Data Management and MonitoringThe latest concepts for effective monitoring and reconciliation of data received
through various sources for consolidated reporting on sanitation status should be
introduced by the nodal ministry. A dedicated monitoring directorate should be
created for continuous and effective monitoring coupled with sufficient funds.
78
A fresh assessment of the status of coverage should be carried out with major
emphasis on the status of coverage of SC, ST and other deprived groups. The rural
sanitation coverage reported by census 2011 should become the basis for revised
project objectives to be identified for 100% access to sanitation facilities by all rural
households.
The online monitoring system maintained by the ministry should be upgraded to
evidence based on real-time monitoring in convergence with identifications like BPl
card number / UIDAI in addition to visual evidences.
Impact assessment of sanitation on incidence of water-borne and other related
diseases should be undertaken through ASHA workers and independent studies.
States should mandatorily conduct independent studies on TSC implementation
and impact every two years to assess the outcomes and plan the way forward. An
independent regulator to check programme implementation and actual progress at
the state and district level should be included in the plan. The system of independent
assessment of sanitation status should be more specific and periodic in nature with
fixed intervals to create a reliable database. This shall also help to implement mid-
course corrections in programme implementation through policy interventions.
79
referenceS:
Beck, Kent and Martin Fowler, 2000, ‘Planning Extreme Programming’, published by
Addision-Wesley, USA
Bhat, R. and N. Jain, 2004, ‘Analysis of public expenditure on health using state level
data’, Indian Institute of Management, Ahmedabad
CAG (Comptroller and Auditor General of India), 2010, Audit Report (lSGIs) of Kerala
for the year 2009-10, Ch. III, CAG, Supreme Audit Institution of India. Available at
http://saiindia.gov.in/english/home/Our_Products/Audit_report/Government_Wise/
local_bodies/Tabled_legislature/Kerala/2009_10/CH-III.pdf
CDS (Centre for Development Studies), 2006, ‘Human development report-2005’,
prepared by CDS and published by State Planning Board, Government of Kerala
CGWB (Central Groundwater Board), 2009, Ground water year Book of Kerala
2008-2009, CGWB, Ministry of Water Resources, Govt. of India.
CGWB (Central Groundwater Board), 2011, ‘Dynamic Groundwater Resources of
India’, As on 31 March, 2009, CGWB, Ministry of Water Resources, Govt. of India
COHRE, WaterAid, SDC and UN-HABITAT, 2008, ‘Sanitation: A human rights
imperative’, Geneva, Available at http://www.wsscc.org/sites/default/files/publications/
cohre_sanitation_a_human_rights_imperative_2008_en.pdf
Conradin, K., n.d., ‘Sustainable sanitation’, Sustainable sanitation and wastewater
management (SSWM), Available at http://www.sswm.info/category/concept/
sustainable-sanitation
CWC (Central Water Commission), 2012, ‘Integrated hydrological data book (Non-
classified river basins)’, New Delhi.
Cheriyan, O., 2004, ‘Changes in the mode of labour due to shift in the land use
pattern’, Discussion Paper no. 81, Kerala Research Programme on local level
Development, Centre for Development Studies, Thiruvananthapuram
Economic Review, 2012, State Planning Board, Thiruvananthapuram, Kerala.
Esrey, A., I. Andersson, A. Hillers and R. Sawyer, 2001, ‘Closing the loop: ecological
sanitation for food security’, publication on Water Resources No. 18, UNDP and
SIDA, Mexico, Available at, http://www.ecosanres.org/pdf_files/closing-the-loop.pdf
Haikin, Matt, 2013, ‘Reflections on applying iterative and incremental software
development methodologies (Agile, RAD etc.) to aid and development work in
developing countries’, Available at http://matthaikin.files.wordpress.com/2013/03/
agile-blarticle-part-11.pdf

80
Harikumar, P.S., and K.M. Chandran, 2013, ‘Bacteriological contamination of
groundwater due to onsite sanitation problems in Kerala state: a case study’,
International Journal of Life Sciences Biotechnology and Pharma Research, vol. 2
(3), ISSN 2250-313.
Jalanidhi, 2011, ‘Environmental Assessment and Environment Management
Framework for Jalanidhi-2’, prepared by ABC Environ Solutions ltd. for the proposed
second phase of Kerala Rural Water Supply and Sanitation Project, June 2011.
Available at http://www.jalanidhi.kerala.gov.in/docs/emf_final_report.pdf
KSCSTE (Kerala State Council for Science Technology and Environment), 2009,
Environmental Monitoring Programme on Health Quality, Government of Kerala
Kerala ENvIS Centre, 2013a, Information on water resources in Kerala, Kerala State
Council for Science, Technology and Environment, MoEF, Govt. of India. Available at
http://www.kerenvis.nic.in/Database/WATER_820.aspx
Kerala ENvIS Centre, 2013b, Groundwater pollution, Kerala State Council for
Science, Technology and Environment, MoEF, Govt. of India. Available at http://www.
kerenvis.nic.in/Database/Waterpollution_834.aspx
Kerala ENvIS Centre, 2013c, Waste generation in Kerala, Kerala State Council for
Science, Technology and Environment, MoEF, Govt. of India. Available at http://www.
kerenvis.nic.in/Database/Soil_836.aspx
Kumar, M., 1993, ‘literacy Movement in Kerala: one step forward, two steps
backward’, Economic and Political Weekly, vol. 9 (41).
Kunhikannan, T. P., and Aravindan, K. P., 2000, ‘Health transition in rural Kerala’,
1987-1996. Discussion Paper No. 20. Shaji, H. (Eds.). Kerala Research Programme
on local level Development, Centre for Development Studies, Thiruvananthapuram,
Available at 40pp. http://www.krpcds.org/kunhikannan.pdf
larman, C., 2004, ‘Agile & Iterative Development’, Pearson Education
MoWR (Ministry of Water Resources), 2012, ‘The National Water Policy’,
MoWR, Govt. of India, Available at http://mowr.gov.in/writereaddata/linkimages/
NWP2012Eng6495132651.pdf
Matuszek, D., 2008, ‘Extreme Programming’, University of Pennsylvania, Available at
http://www.cis.upenn.edu/~matuszek/cit591-2010/lectures/00-extreme-programming.
ppt
Minister of labour, ‘Statement by the Hon. Minister for labour on the Study on the
Domestic Migrant labour in Kerala’, Government of Kerala, Available at http://www.
minister-labour.kerala.gov.in/index.php?option=com_content&view=article&id=120:st
udy-on-the-domestic-migrant-labour-in-kerala&catid=34:frontslider
Nisha, K. R., n.d., ‘Is Water Supply Systems Effective and Sustainable? An Empirical
Analysis for Kerala’.
Parayil, G., 1996, ‘The Kerala Model of Development: development and sustainability
in the third world’, Third World Quarterly, vol.17 (5), pp. 941-957.
Planning Commission, 2011, ‘Draft Model Bill for the conservation, protection and
regulation of groundwater’, Working group 12, planning commission, Govt. of India.
Available at http://www.planningcommission.nic.in/aboutus/committee/wrkgrp12/wr/
wg_back.pdf

Rao, K. l., 1979, “India’s Water Wealth”, Orient longman ltd. New Delhi.
Rosemarin, A., 2008, ‘Sanitation Now’, a magazine on the global sanitation crisis, Stockholm Environment Institute
(SEI), Stockholm, Available at http://www.dgvn.de/fileadmin/user_upload/DOKUMENTE/sanitaerjahr2008/SEI-
SanitationNOW2008-lowres.pdf
SEUF (Socio-Economic Unit Foundatin), 2006, ‘Performance Assessment and Service Improvement Plan of
Community Managed Water Supply Schemes (CMWSS) in Kerala’.
The Hindu, 2012, ‘Reduction in rainfall across Kerala over past century’, Business line, 19th August, 2012,
Available at http://www.thehindubusinessline.com/news/states/reduction-in-rainfall-across-kerala-over-past-century/
article3795775.ece
Tsai, K., 2007, ‘Debating Decentralised Development: A reconsideration of the Wenzhou and Kerala Models’, Indian
Journal of Economics & Business, Special Issue China and India.
United Nations Development Programme (UNDP), 2006, ‘Beyond Scarcity: Poverty, power and the global water
crisis’, Human Development Report, UNDP.
veron, R., 2001, ‘The New Kerala Model: lessons for sustainable development’, World Development , vol.29 (4),
pp. 601-617.
WRD (Water Resource Department), 2008, Kerala Water Ploicy, Govt. of Kerala, Available at http://kerala.gov.in/
docs/policies/wp_08.pdf
Wells, D., 2009a, ‘Agile Software Development: A gentle introduction’, Agile Process, Available at www.agile-
process.org
Wells, D., 2009b, ‘Extreme Programming: A gentle introduction’, Agile Process, Available at www.
extremeprogramming.org
Zachariah, K.C. and S. Irudaya Rajan, 2012, ‘Inflexion in Kerala’s Gulf Connection’, Report on Kerala Migration
Survey 2011, Working paper 405, Centre for Development Studies, Available at http://www.cds.edu/wp-content/
uploads/2012/11/WP450.pdf


MAJOR PUBlICATIONS
Water Conflicts in India: A Million Revolts in the Making (Routledge) z
life, livelihoods, Ecosystems, Culture, Entitlements and Allocations of Water z
for Competing Uses
Water Conflicts on India: Towards a New legal and Institutional Framework z
linking lives-Reviving Flows: Towards Resolving Upstream Downstream z
Conflicts in Chalakudy River Basin.
Water Conflicts in Odisha: A Compendiu of Case Studies Floods, Fields and z
Factories: Towards Resolving Conflicts around Hirakud Dam
Agony of Floods: Floods Induced water Conflicts in India Water Conflicts in z
Northeast India: A Compendium of Case Studies
Conflicts around Domestic Water and Sanitation: Cases, Issues and z
Prospects
POlICy BRIEFS
Water Entitlements and Allocations for Basic Needs, Environment, z
livelihoods and Socio-cultural Needs: a framework for Preventing
and Managing Water Conflicts
Towards a New legal and Institutional Framework around Water: Resolving z
Water Conflicts in Equitable, Sustainable and Democratic Manner
Resolving Upstream-Downstream Conflicts in River Basins z
Right to Sanitation: Position Paper of Right to Sanitation Campaign in India z
City Makers and WASH: Towards a Caring city z
Sanitation Rights and Needs of Persons with Disabilities z
Adivasis and Right to Sanitation z
LiST OF PubLiCaTiONS