doingmore withless - unescap.org ii.pdf · a holistic program working for the long-term...
TRANSCRIPT

DoingMorewithLess
PaCT II
May 5, 2019
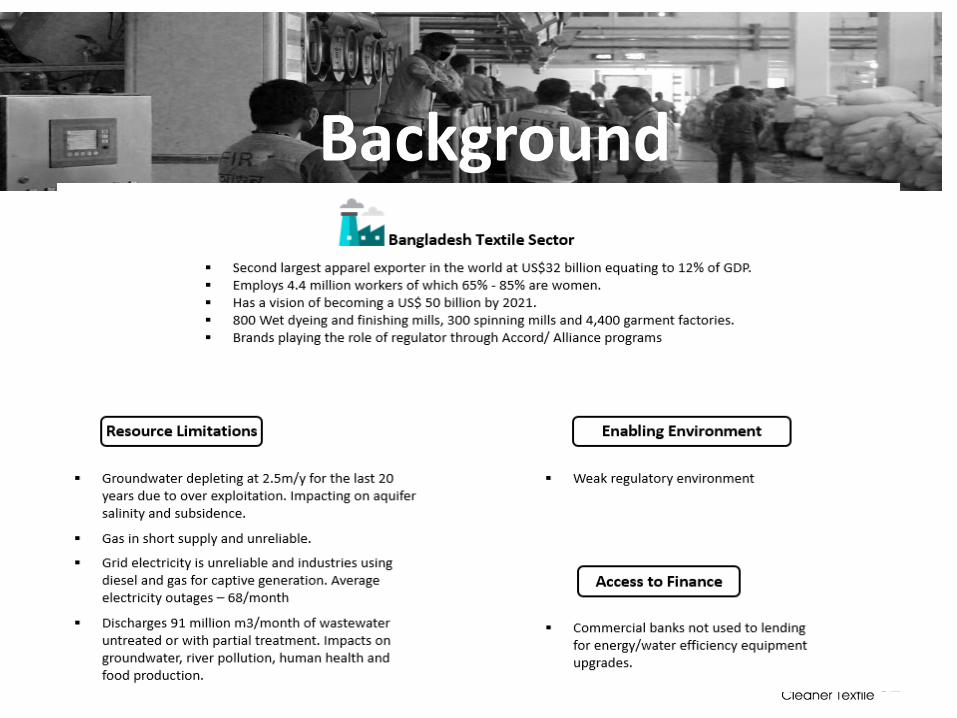
Background

A holistic program working for the long-term competitiveness and environmental sustainability of the textile wet processing sector-Washing, Dyeing and Finishing units
Program Objective
Addressing high water, energy, and chemical use through the adoption of industrial best
practices throughout the supply-chain

PaCT Partners
A Collaborative Effort

PaCT PillarsWorking within and beyond factory gates

Awareness Raising
Step 1 Step 3
Basic CP Assessments Targeting the low-hanging fruitsInstalling water and/or gas meters, Improving
Insulation, Installing trigger nozzles, Maintaining steam traps and systems, Replacing T-8 bulbs
with energy efficient lights (T-5/LED), etc.
Step 2
In-depth CP Assessments Targeting the Advanced Technologies
Recovering salts and caustic, Installing economizers, Recovering Heat from processes, etc.
Factory EngagementDoing more with less

Factory engagement (cont’d)
Awareness building
663
In-depth Cleaner Production
91
Basic Cleaner Production
173

In depth CP
Improving Efficiency of
Delivery of Utilities
Reducing Demand For Water, Energy, Chemicals in Wet
Processing and Finishing
Reducing Volume of Effluent
Improving Efficiency of ETP Treatment
Other Areas of Factory

Process Time
• Dyehouse Processes• ≈4-5 hrs to 12 -13 hrs
• Time is closely linked to Electricity• <Time = > Capacity
• Many expansion plans in place before optimising current installed capacity

• Lab to bulk• ≈ 60% to 85%
• Bulk to bulk• ≈ 70% to 95%
• Sometimes ~ 20% of water and energy is spent on corrections
• RFT is not always well recorded or defined in factories
Lab to Bulk Right First Time

• Total Investment – US$ 2.3m
• Cost Savings – US$ 3.8m/yr
• Payback Period - < 1 Year
Caustic Recovery Plant

• Total Investment - US$ 312, 500
• Cost Savings – US$ 146,000/yr
• Payback Period - 2.5 Years
Salt Recovery Plant
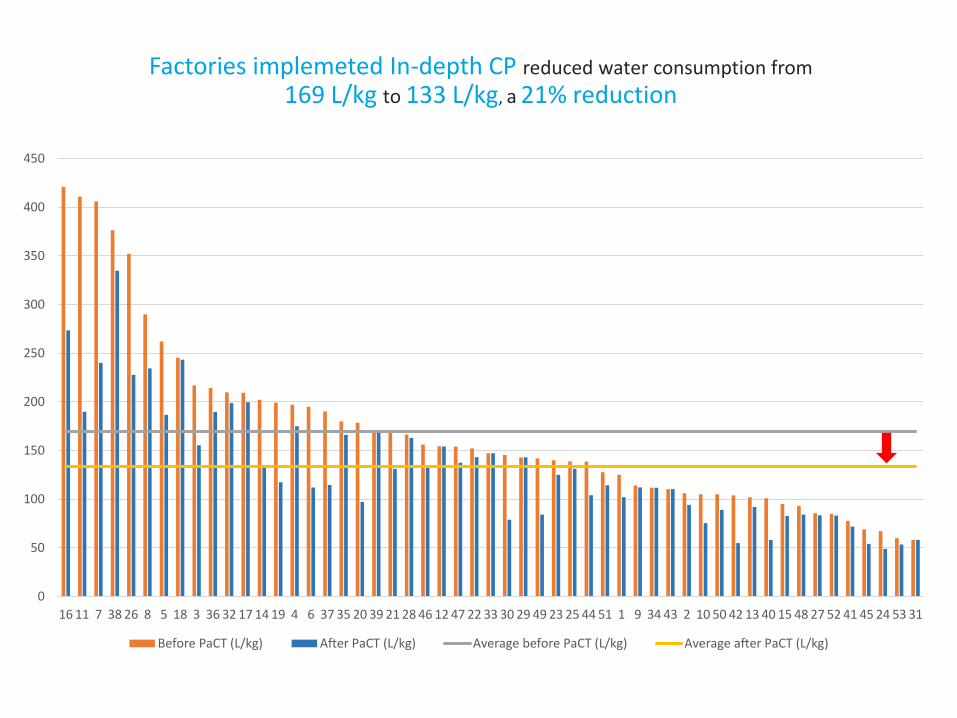
Factories implemeted In-depth CP reduced water consumption from
169 L/kg to 133 L/kg, a 21% reduction
0
50
100
150
200
250
300
350
400
450
16 11 7 38 26 8 5 18 3 36 32 17 14 19 4 6 37 35 20 39 21 28 46 12 47 22 33 30 29 49 23 25 44 51 1 9 34 43 2 10 50 42 13 40 15 48 27 52 41 45 24 53 31
Before PaCT (L/kg) After PaCT (L/kg) Average before PaCT (L/kg) Average after PaCT (L/kg)
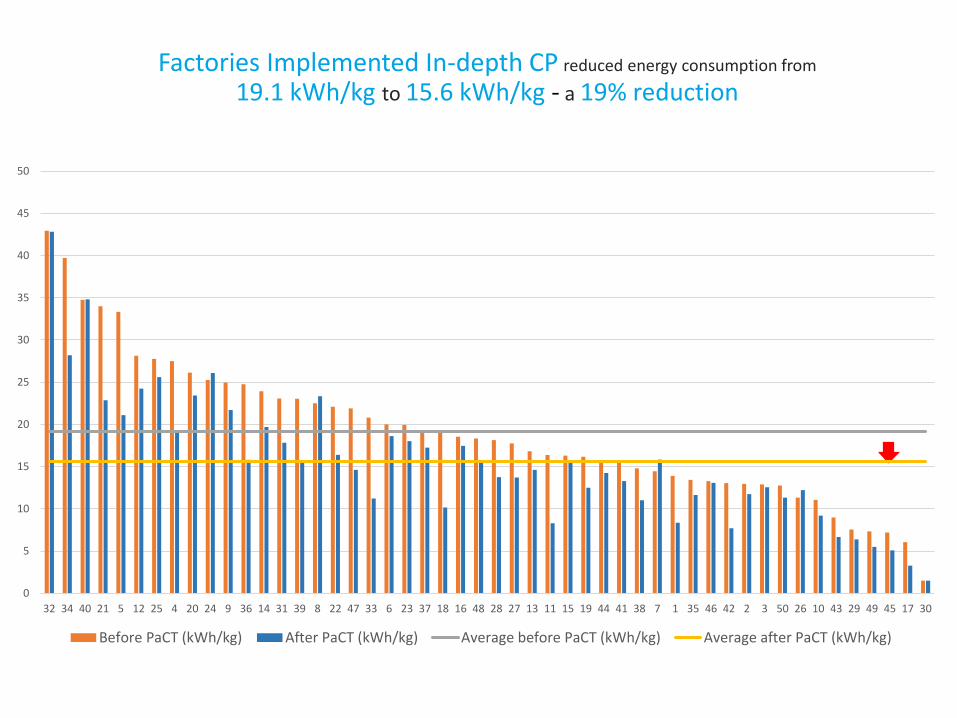
Factories Implemented In-depth CP reduced energy consumption from
19.1 kWh/kg to 15.6 kWh/kg - a 19% reduction
0
5
10
15
20
25
30
35
40
45
50
32 34 40 21 5 12 25 4 20 24 9 36 14 31 39 8 22 47 33 6 23 37 18 16 48 28 27 13 11 15 19 44 41 38 7 1 35 46 42 2 3 50 26 10 43 29 49 45 17 30
Before PaCT (kWh/kg) After PaCT (kWh/kg) Average before PaCT (kWh/kg) Average after PaCT (kWh/kg)
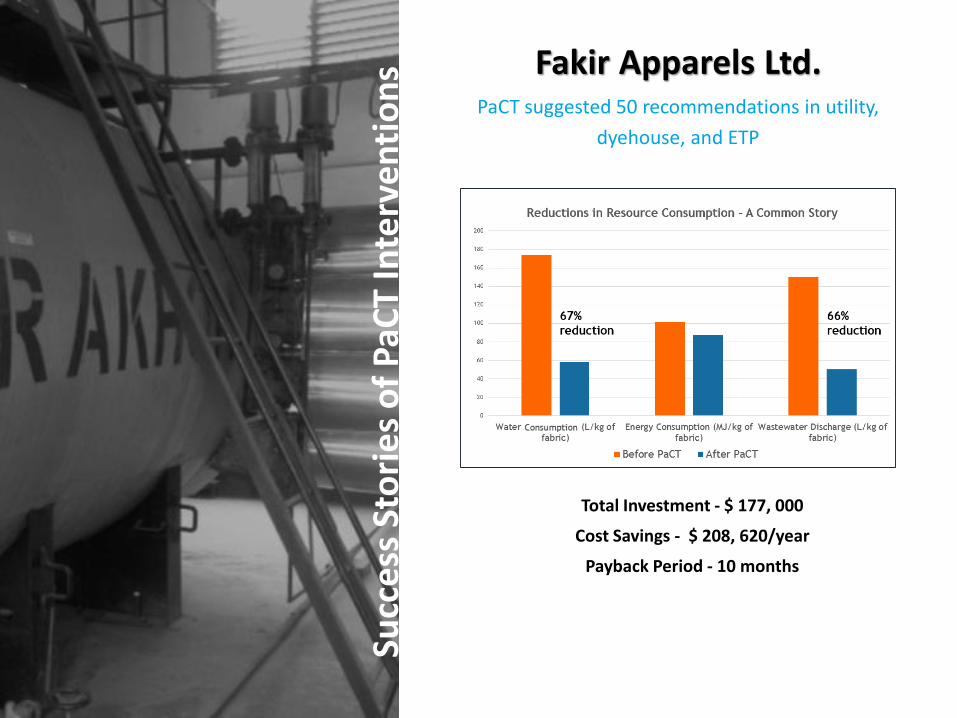
Fakir Apparels Ltd.PaCT suggested 50 recommendations in utility,
dyehouse, and ETP
Total Investment - $ 177, 000
Cost Savings - $ 208, 620/year
Payback Period - 10 months
Succ
ess
Sto
rie
s o
f P
aCT
Inte
rve
nti
on
s

2.9
7.8
13.4 14.4
18.4
0
2
4
6
8
10
12
14
16
18
20
31 December,2014
30 June, 2015 31 December,2015
30 June, 2016 31 December,2016
Cumulative Water Savings(Million m3/year)
Target - 15 Million
597,485
1,108,954 1,232,361
1,783,792
0
200,000
400,000
600,000
800,000
1,000,000
1,200,000
1,400,000
1,600,000
1,800,000
2,000,000
30 June, 2015 31 December,2015
30 June, 2016 31 December,2016
Cumulative Energy Savings (MWh/year)
Target - 1,250,000
64,000
169,400188,238
275,346
0
50,000
100,000
150,000
200,000
250,000
300,000
30 June, 2015 31 December,2015
30 June, 2016 31 December,2016
Cumulative GHG emission reduction (tonnes CO2 /year)
Target - 225,000
Program Achievements (cont’d)

4.66.7
10.6 10.7
15.9
0
2
4
6
8
10
12
14
16
18
31 December,2014
30 June, 2015 31 December,2015
30 June, 2016 31 December,2016
Cumulative Wastewater Reduction (Million m3/year)
Target - 12 Million
12
18.8
28.4 2931.4
0
5
10
15
20
25
30
35
31 December,2014
30 June, 2015 31 December,2015
30 June, 2016 31 December,2016
Cumulative Investments facilitated (Million USD)
Target - 32 Million
2.6
4.7
7.7
9.9
12.4
0
2
4
6
8
10
12
14
31 December,2014
30 June, 2015 31 December,2015
30 June, 2016 31 December,2016
Cumulative Expected Annual Savings (Million USD/year)
Target - 9 Million
Program Achievements (cont’d)

Program Achievements (cont’d)
✓ $200m Green Financing instrument;
✓Reduced use of hazardous chemicalsfrom policy reform;
✓ Increased uptake of green machineryfrom policy reducing tariff on greenmachinery
850
940
0
200
400
600
800
1000
2013 2014 2015 2016 2017Imp
ort
in
US
D M
illi
on
Trend in import value of 52 machineries
Business-as-usual(USD million)
Actual totalimport (USDmillion)

Program Achievements (cont’d)

Textile Technology Business CenterFirst ever knowledge hub for the Bangladesh textile industry
• Established in partnership with BGMEA • Offers reliable and comprehensive range of services• Access to specialized information• Capacity building through workshops and expert training programs,
worker training program• B2B linkages with a strong network of technology suppliers, factories,
and financial institutions and banks• Facilitating investments in resource efficiency technologies
To date TTBC has…
176 members
120 factories
56 technology suppliersUS $860,000 investment facilitated

Thank you…