doi:10.1093/braincomms/fcz035 brain communications 2019
TRANSCRIPT

Midget retinal ganglion cell dendritic andmitochondrial degeneration is an early featureof human glaucoma
James R. Tribble,1,2 Asta Vasalauskaite,3 Tony Redmond,1 Robert D Young,1
Shoaib Hassan,4 Michael P. Fautsch,5 Frank Sengpiel,3 Pete A. Williams2 andJames E. Morgan1,4
Glaucoma is characterized by the progressive dysfunction and loss of retinal ganglion cells. However, the earliest degenerative
events that occur in human glaucoma are relatively unknown. Work in animal models has demonstrated that retinal ganglion cell
dendrites remodel and atrophy prior to the loss of the cell soma. Whether this occurs in human glaucoma has yet to be elucidated.
Serial block face scanning electron microscopy is well established as a method to determine neuronal connectivity at high resolution
but so far has only been performed in normal retina from animal models. To assess the structure–function relationship of early
human glaucomatous neurodegeneration, regions of inner retina assessed to have none-to-moderate loss of retinal ganglion cell
number were processed using serial block face scanning electron microscopy (n¼ 4 normal retinas, n¼4 glaucoma retinas). This
allowed detailed 3D reconstruction of retinal ganglion cells and their intracellular components at a nanometre scale. In our data-
sets, retinal ganglion cell dendrites degenerate early in human glaucoma, with remodelling and redistribution of the mitochondria.
We assessed the relationship between visual sensitivity and retinal ganglion cell density and discovered that this only partially con-
formed to predicted models of structure–function relationships, which may be affected by these early neurodegenerative changes.
In this study, human glaucomatous retinal ganglion cells demonstrate compartmentalized degenerative changes as observed in ani-
mal models. Importantly, in these models, many of these changes have been demonstrated to be reversible, increasing the likelihood
of translation to viable therapies for human glaucoma.
1 School of Optometry and Vision Sciences, Cardiff University, Cardiff, CF24 4HQ Wales, UK2 Department of Clinical Neuroscience, Division of Eye and Vision, St. Erik Eye Hospital, Karolinska Institutet, 112 82 Stockholm,
Sweden3 School of Biosciences, Cardiff University, Cardiff, CF10 3AX Wales, UK4 School of Medicine, Cardiff University, Heath Park, Cardiff, CF14 4XW Wales, UK5 Department of Ophthalmology, Mayo Clinic, Rochester, Minnesota, USA
Correspondence to: Professor James E. Morgan, School of Optometry and Vision Sciences, Cardiff
University, Maindy Road, Cardiff, CF24 4HQ Wales, UK
E-mail: [email protected]
Keywords: glaucoma; retinal ganglion cell; electron microscopy; dendrite; mitochondria
Abbreviations: NND ¼ nearest neighbour distance; OCT ¼ optical coherence tomography; SBFSEM ¼ serial block face scanningelectron microscopy
Received July 19, 2019. Revised October 29, 2019. Accepted November 1, 2019. Advance Access publication November 28, 2019VC The Author(s) (2019). Published by Oxford University Press on behalf of the Guarantors of Brain.
This is an Open Access article distributed under the terms of the Creative Commons Attribution License (http://creativecommons.org/licenses/by/4.0/), which permits unrestricted reuse,
distribution, and reproduction in any medium, provided the original work is properly cited.
BBRAIN COMMUNICATIONSAIN COMMUNICATIONSdoi:10.1093/braincomms/fcz035 BRAIN COMMUNICATIONS 2019: Page 1 of 15 | 1
Dow
nloaded from https://academ
ic.oup.com/braincom
ms/article-abstract/1/1/fcz035/5645163 by Karolinska Institutet Library user on 31 D
ecember 2019

IntroductionWith an estimated 70 million patients worldwide, glau-
coma remains a leading cause of irreversible blindness
and a major economic burden (Tham et al., 2014). The
earliest detectable neurodegenerative changes in human
patients are yet to be fully elucidated, but their discovery
could provide novel biomarkers to support early diagno-
sis and treatment.
Glaucoma is characterized by the progressive dysfunc-
tion and death of retinal ganglion cells. Age, genetics,
and elevated intraocular pressure are prominent risk fac-
tors for the development of human glaucoma. Animal
models of glaucomatous ocular hypertension (which re-
capitulate the elevated intraocular pressure risk factor
seen in many glaucoma patients) have demonstrated that
retinal ganglion cell mitochondrial abnormalities
(Williams et al., 2017b), synapse loss (Della Santina
et al., 2013; Berry et al., 2015; Williams et al., 2016),
and dendritic atrophy (Williams et al., 2013a) precede
cell death. These disease features have been demonstrated
across model species; in mouse (Leung et al., 2011; Feng
et al., 2013; Williams et al., 2013a; Berry et al., 2015),
rat (Morgan et al., 2006; Urcola et al., 2006; Williams
et al., 2016), cat (Shou et al., 2003), and non-human
primate (Weber et al., 1998; Morgan et al., 2000).
Importantly, whereas axon regeneration does not occur
in the mammalian optic nerve, retinal ganglion cell den-
dritic and synaptic plasticity, regrowth, and re-innervation
could underpin visual recovery during early human glau-
coma. However, there is no evidence that these degenera-
tive changes occur as an early feature of human
glaucoma, with only a single study showing dendritic loss
in eyes, which had progressed to complete blindness
(Pavlidis et al., 2003). Current evidence of retinal
ganglion cell death in glaucoma comes from cell counts
in donor tissue (Quigley et al., 1989), live imaging of
apoptosis (Cordeiro et al., 2017), and retinal nerve fibre
layer thinning (retinal ganglion cell axons in the inner
retina) measured by optical coherence tomography (OCT;
Raza et al., 2011). Clinical measures of vision loss come
from functional tests, in which deficits at the level of sin-
gle retinal ganglion cells could be masked through the
summation of outputs in the visual centres of the brain
(Redmond et al., 2010; Mulholland et al., 2015).
In routine clinical practice, visual function is measured
in glaucoma by Standard Automated Perimetry in which
spot stimuli of modulated luminance are presented to de-
termine visual sensitivity at specific locations in the visual
field. Although this technique is regarded as a gold stand-
ard clinical test of visual function in glaucoma, it has
poor sensitivity to early disease (Tafreshi et al., 2009)
and high variability confounding the identification of stat-
istically significant visual deterioration (Artes et al.,
2002). The ‘hockey stick’ model of Swanson et al. (2004)
describes the relationship between visual field sensitivity
and retinal ganglion cell density in healthy eyes. It pre-
dicts that the rate of change in sensitivity with respect to
retinal ganglion cell number is low when the stimulus is
larger than the critical summation area (2.5 dB loss per
log unit reduction in cell number) and increases when the
stimulus is smaller than the critical summation area
(10 dB loss per log unit reduction in cell number; i.e. a
1:1 relationship since 1 dB ¼ 0.1 log unit attenuation of
stimulus luminance from the maximum). Since the peri-
metric stimuli are of fixed area and the critical summa-
tion area is known to enlarge in early glaucoma
(Redmond et al., 2010), the ‘hockey stick’ model predicts
an initial slow decline in visual field sensitivity when the
remaining retinal ganglion cell density is high, followed
Graphical Abstract
2 | BRAIN COMMUNICATIONS 2019: Page 2 of 15 J. R. Tribble et al.
Dow
nloaded from https://academ
ic.oup.com/braincom
ms/article-abstract/1/1/fcz035/5645163 by Karolinska Institutet Library user on 31 D
ecember 2019
by a steep decline once substantial retinal ganglion cell
loss has occurred. When sensitivity loss is mild, early
neurodegenerative changes may be masked by spatial
summation and within- and between-test variabilities
when assessed by Standard Automated Perimetry.
To assess the structure–function relationship of early
human glaucomatous neurodegeneration, we used two-
photon imaging of regions of whole human control and
glaucomatous retina to determine the relationship be-
tween retinal ganglion cell loss and visual field sensitivity
(as assessed by Standard Automated Perimetry). Regions
of inner retina assessed to have none-to-moderate cell
loss and visual deficit were processed using serial block
face scanning electron microscopy (SBFSEM) to generate
detailed 3D reconstructions of retinal ganglion cells and
their intracellular components at a nanometre scale. This
automated approach has been used to great effect to gen-
erate and analyse large-scale retinal connectomes in nor-
mal animal tissue (Briggman et al., 2011; Helmstaedter
et al., 2013) and to investigate pathophysiological
changes to single neurons in other neurodegenerations
(Yamasaki et al., 2014; Giacci et al., 2018). We applied
these methods to quantify mitochondrial and dendritic
abnormalities in regions of no-to-moderate visual deficit
in the human glaucomatous retina. To date, no studies of
human glaucomatous retinal ganglion cells have been
undertaken using SBFSEM, and as such, this study repre-
sents the first attempt to resolve human retinal ganglion
cells and their intracellular components in 3D at this scale.
Materials and methods
Human tissue
Donor tissue was obtained from the Minnesota Lions Eye
Bank (St. Paul, MN, USA) in accordance with local ethical
approval. Donor eyes (n¼ 4 eyes; mean age 74.5 years)
with primary open angle glaucoma and controls (n¼ 8
eyes; mean age 81.6 years) were used. Posterior globes
were fixed in 4% paraformaldehyde in 0.1 M phosphate
buffer within 24 h of the recorded time of death and then
transferred to Cardiff University, UK, and stored at 4�C
until used. Work carried out in Cardiff was in compliance
with the UK Human Tissue Act 2004. Donor information
is summarized in Table 1. The four glaucomatous eyes had
corresponding visual field tests (Humphrey Field Analyzer;
HFA II, Carl Zeiss Meditec, Dublin, CA, USA; SITA-
Standard, 24-2 test pattern, Goldmann III stimulus, and
200 ms duration) undertaken 7–21 months before death.
Two-photon imaging and cellcounting
Whole retinae (n¼ 4 for glaucoma, n¼ 6 for control)
were dissected free from the globes and stained overnight
at 4�C with 1 mg/ml Hoechst 33342 stain (H1399; Life
Technologies). A custom two-photon microscope compris-
ing a moveable objective microscope (MOMVR ; Sutter
Instruments) and Ti:Sapphire laser (Mai Tai DeepSee;
Newport Spectra-Physics) was used to collect images of
54 retinal regions corresponding to the visual field test
locations (Fig. 1A). Retinal distances were taken from the
centre of the optic nerve head and measured using a step-
per driven stage. Z-stack images (5mm slices from retinal
nerve fibre layer to top of inner nuclear layer) were col-
lected at 40�, giving an en face sample area of 350 mm2
for each of the 54 regions. All Hoechst-positive nuclei
within three sampling regions of 200 � 200 pixels were
counted manually using the cell counter plugin for FIJI
(Schindelin et al., 2012) and averaged to provide an esti-
mate of cells/mm2 for each of the 54 regions. Only round
medium-to-large cell nuclei were counted (to exclude vas-
cular endothelial cells identified by their more prolate nu-
clei). A correction to account for displaced amacrine cells
in the ganglion cell layer based on Curcio and Allen
(1990) was applied to each test region in control retina.
The average number of amacrine cells at each test loca-
tion was then calculated and subtracted from the cell
count for corresponding regions in glaucomatous retina.
Comparison of retinal ganglion celldensity and visual field sensitivity
Pointwise visual field sensitivity values were plotted
against log retinal ganglion cell density (cells/mm2). Log
retinal ganglion cell density was calculated as the number
of cells underlying the Goldmann III stimulus (0.431�
diameter), using the method outlined by Garway-Heath
et al. (2000). The area of a Goldmann III stimulus at
the fovea is 0.012 mm2 (using the conversion factor
q¼ 0.286 mm/�; Garway-Heath et al., 1998). A correction
was applied to account for an altered stimulus area with
increasing eccentricity from the fovea (Holden and Fitzke,
1988) calculated with the equation: qp ¼ qo �0.000014U2, where qp is the conversion factor for loca-
tions outside the fovea, qo is the conversion factor at the
fovea, and U is the eccentricity in degrees. Pointwise vis-
ual field data were corrected for an expected deterior-
ation in sensitivity as a function of age (but not of
disease) between the time of the visual field assessment
and death, using the age slopes provided by Heijl et al.(1987). To compare with the ‘hockey stick’ model, sensi-
tivity values from the current study were adjusted up-
wards by 0.9 dB, to account for the expected difference
between values from examinations performed with the
SITA-Standard strategy and the full threshold strategy.
Electron microscopy
Eleven retinal regions corresponding to visual field test
locations with no-to-moderate cell loss and visual deficit
were dissected free (n¼ 4 retinae, n¼ 5 regions for glau-
coma; n¼ 4 retinae, n¼ 6 regions for control). These
Retinal ganglion cell degeneration in glaucoma BRAIN COMMUNICATIONS 2019: Page 3 of 15 | 3
Dow
nloaded from https://academ
ic.oup.com/braincom
ms/article-abstract/1/1/fcz035/5645163 by Karolinska Institutet Library user on 31 D
ecember 2019
regions are overlaid on the visual field plots for glaucomat-
ous eyes in Fig. 1A; control regions were matched loca-
tions. The retinal regions were washed in 0.2 M sodium
cacodylate buffer for 2 days before further fixation in 2.5%
glutaraldehyde/2% Paraformaldehyde (PFA) in sodium
cacodylate buffer. The tissue was then infiltrated with
1.5% potassium ferricyanide (Arcos)/1% osmium tetroxide
(Agar Scientific, UK) in 0.1 M sodium cacodylate buffer,
1% thiocarbohydrazide (Sigma), 1% osmium tetroxide,
1% uranyl acetate (TAAB, Aldermaston, UK) and
Walton’s lead aspartate (Agar Scientific) with intermittent
washes with distilled water. The tissue was dehydrated
through a series of ethanol concentrations followed by pro-
pylene oxide and infiltration with Araldite CY212 resin
and dodecenyl succinic anhydride mix (Agar Scientific).
The resin was changed 14 times over 3 days before embed-
ding the tissue in moulds and curing at 60�C for 48 h. The
resin blocks were then trimmed and glued to cryopins
(Leica Microsystems Ltd, Milton Keynes, UK). Glass knives
were created using a Leica Electron Microscope (EM)
KMR2, and the tissue block planed on a UCE ultramicro-
tome (Reichert-Jung, Cambridge, UK). Conducting carbon
cement (Agar Scientific) was applied to avoid charging and
resultant damage to the block during imaging before gold
coating using an ACE600 sputtercoater (Leica
Microsystems). Serial block face scanning electron micros-
copy (SBFSEM) was performed using a Zeiss Sigma FEG
scanning electron microscope (Carl Zeiss, Cambridge, UK),
with attached 3ViewVR 2 system (Gatan, Pleasanton, CA,
USA). A total of 500–1000 slices (100 nm thickness) were
removed from the block surface by an in-chamber ultrami-
crotome, each alternating with automated imaging of the
remaining block face (79 � 79mm) to generate an aligned
data set with a voxel resolution of 19.2 � 19.2 � 100 nm.
3D data analysis
Retinal ganglion cells were identified and segmented using
the TrakEM2 plugin (Cardona et al., 2012) for FIJI. Due
to the block size and the relative low cell density, ana-
lysis was focused on midget retinal ganglion cells
(Fig. 2C, see also; Kolb and Dekorver, 1991; Kolb et al.,
1992), the predominant retinal ganglion cell sub-type in
the human retina (�80% of retinal ganglion cells; Dacey,
1993). Dendrites were segmented separately, and the den-
dritic length was measured. Mitochondria (identified by
the presence of cristae) and vacuoles (identified as a dou-
ble membranous structure without multi-lamellar struc-
tures and without easily identifiable electron dense
material) were segmented. The Cartesian co-ordinates of
each mitochondrion and vacuole were recorded. The dis-
tribution of these organelles was measured as the distance
from the soma centre along the dendrite and expressed as
a Sholl profile (frequency at binned distances), from
which an area under the curve was derived. Nearest
neighbour distances (NND; as Euclidean distances) were
calculated for individual mitochondria and vacuoles with-
in primary, secondary and tertiary dendrites using SPSS
NND analysis (k¼ 3). Individual morphometric analysis
of mitochondria was performed using Imaris (Bitplane).
New surfaces were generated for individual mitochondria,
and volume, sphericity, oblate ellipticity, and prolate el-
lipticity were calculated for each mitochondrion.
Statistical analysis
The sample size (n) is shown in each figure legend.
Graphing and statistical analysis were performed in R
and IBM SPSS statistics 23. Statistical tests are indicated
at the point of usage within the methods and results.
Sholl distributions of mitochondria and vesicles and den-
drite composition (primary, secondary and tertiary
expressed as a percentage of total) were compared be-
tween control and glaucoma using Fisher’s exact test in
R. Multiple regression analysis was performed to deter-
mine if tissue sampling and quality (eccentricity from
macula, time from death to fixation, time in fixation
prior to EM processing and donor age; independent
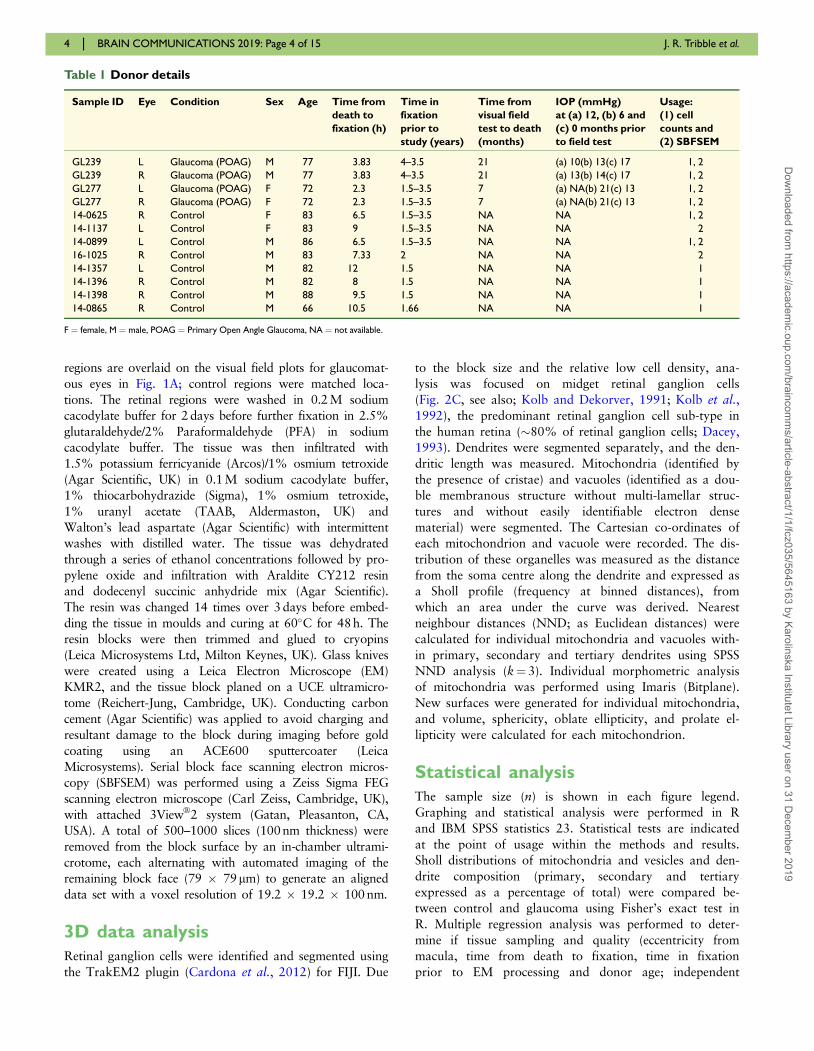
Table 1 Donor details
Sample ID Eye Condition Sex Age Time from
death to
fixation (h)
Time in
fixation
prior to
study (years)
Time from
visual field
test to death
(months)
IOP (mmHg)
at (a) 12, (b) 6 and
(c) 0 months prior
to field test
Usage:
(1) cell
counts and
(2) SBFSEM
GL239 L Glaucoma (POAG) M 77 3.83 4–3.5 21 (a) 10(b) 13(c) 17 1, 2
GL239 R Glaucoma (POAG) M 77 3.83 4–3.5 21 (a) 13(b) 14(c) 17 1, 2
GL277 L Glaucoma (POAG) F 72 2.3 1.5–3.5 7 (a) NA(b) 21(c) 13 1, 2
GL277 R Glaucoma (POAG) F 72 2.3 1.5–3.5 7 (a) NA(b) 21(c) 13 1, 2
14-0625 R Control F 83 6.5 1.5–3.5 NA NA 1, 2
14-1137 L Control F 83 9 1.5–3.5 NA NA 2
14-0899 L Control M 86 6.5 1.5–3.5 NA NA 1, 2
16-1025 R Control M 83 7.33 2 NA NA 2
14-1357 L Control M 82 12 1.5 NA NA 1
14-1396 R Control M 82 8 1.5 NA NA 1
14-1398 R Control M 88 9.5 1.5 NA NA 1
14-0865 R Control M 66 10.5 1.66 NA NA 1
F ¼ female, M ¼ male, POAG ¼ Primary Open Angle Glaucoma, NA ¼ not available.
4 | BRAIN COMMUNICATIONS 2019: Page 4 of 15 J. R. Tribble et al.
Dow
nloaded from https://academ
ic.oup.com/braincom
ms/article-abstract/1/1/fcz035/5645163 by Karolinska Institutet Library user on 31 D
ecember 2019

Figure 1 Retinal ganglion cell loss assessed in relation to visual field deficits. Human donor eyes from glaucoma donors (n ¼ 4)
complete with visual field tests conducted prior to death (A; upper row) were analysed in comparison to control donor eyes (n ¼ 6). Whole
retinas were imaged by two-photon microscopy, and cell counts made in regions of the retina corresponding to visual field test locations (A;
lower row). Regions were numbered 1–72 beginning superior-temporally, with regions corresponding to visual field test locations highlighted
(purple shading; n ¼ 54 locations). Following imaging, 11 regions were dissected out and processed for SBFSEM (magenta boxes). (B) Retinal
ganglion cell densities were estimated for each test location from z-stack counts within an en face area of 350 mm2 and expressed as cells/mm2.
Retinal ganglion cell degeneration in glaucoma BRAIN COMMUNICATIONS 2019: Page 5 of 15 | 5
(continued)
Dow
nloaded from https://academ
ic.oup.com/braincom
ms/article-abstract/1/1/fcz035/5645163 by Karolinska Institutet Library user on 31 D
ecember 2019
variables) influenced dendritic size and branch, mitochon-
drial and vacuole numbers, volume and distribution (de-
pendent variables). Analysis was performed in R using
the lm function (R stats package), and zero-order correla-
tions were calculated using the calc.relimp function
(relaimpo package; Gromping, 2006) on z scores. For
box plots, the centre hinge represents the mean with
upper and lower hinges representing the first and third
quartiles; whiskers represent 1.5 times the interquartile
range. Unless otherwise stated in the figure legends
(*P< 0.05, **P< 0.01, ***P< 0.001).
Data availability
All the data are presented in full in this article.
Results
Visual sensitivity measured byStandard Automated Perimetrydoes not accurately predict thedegree of retinal ganglion cell lossin glaucoma
Retinal ganglion cell loss in human glaucoma samples
was first assessed by two-photon imaging of Hoechst-
labelled nuclei. The relationship between cell density and
visual sensitivity (identified by Standard Automated
Perimetry prior to death) was determined. Two-photon z-
stack images from whole-mount retinas were collected
from 54 regions that corresponded to visual field test
locations (Fig. 1A). Average cell counts revealed that cell
density in the retinal ganglion cell layer was reduced in
glaucomatous eyes by 28% compared with controls when
averaged across all regions (P< 0.001; ‘Mann–Whitney’).
Heat maps of individual eyes demonstrated that the loss
was diffuse and did not qualitatively resemble the corre-
sponding visual field plots (Fig. 1B). Density reduction
was best matched in regions where field loss was moder-
ate, but this did not reflect regions of more advanced,
arcuate field loss (Fig. 1B). Importantly, the retinal gan-
glion cell density in the control retinas matched those
reported by Curcio and Allen (1990) (Fig. 1C). The rela-
tionship between visual field sensitivity and the number
of retinal ganglion cells underlying the perimetric stimulus
(log10 cells per Goldmann III stimulus area) was highly
non-linear in eyes with glaucoma (‘Spearman’s rho’,
r¼ 0.23, P< 0.001; Fig. 1C and D). The relationship was
similar to the ‘hockey stick’ model in regions where vis-
ual deficit was less pronounced (i.e. a shallow relation-
ship when retinal ganglion cell density is high), but a
steeper than expected drop-off in sensitivity in regions
with lower retinal ganglion cell density (Fig. 1D).
Retinal ganglion cell dendriticremodelling occurs early in humanglaucoma
For detailed analysis of retinal ganglion cell dendrites and
their ultrastructure, five regions corresponding to visual
field test locations (and six from region- and age-matched
control eyes; locations shown in Fig. 1A, lower row)
were processed for SBFSEM to generate 79 � 79 �100 mm cubes of retinal data [Fig. 2A; representative sin-
gle slice (cropped area) shown in Fig. 2B]. Retinal gan-
glion cells were identified by the presence of an initial
axon segment and were required to have a primary den-
drite to be processed for further analysis (amacrine cells,
the other major cell population of the inner retina, lack
an axon, and so were not included). Only midget retinal
ganglion cells, comprising �80% of the retinal ganglion
cell population in the human retina (Dacey, 1993), were
processed. In addition, due to their larger dendritic field
size, complete parasol retinal ganglion cells were less like-
ly to be captured within individual SBFSEM datasets.
Confirmed midget retinal ganglion cells were recon-
structed in 3D (example in Fig. 2C) allowing for meas-
urements of dendritic length, volume and surface area.
Seven control retinal ganglion cells (five ON centre and
two OFF centre; dendrites shown in Fig. 2D, upper
panel) and five glaucomatous retinal ganglion cells (five
Figure 1 Continued
Density plots for each glaucomatous retina (B; upper row) with corresponding percentage change from average control density at each region (B;
lower row). Region locations are inverted along the superior to inferior axis to correspond to the visual field plots (as the superior retina views
the inferior visual field and vice versa). Retinal ganglion cell density change against eccentricity was plotted for control (C; left panel) and
glaucoma eyes (C; right panel). The relationship between retinal ganglion cell density [expressed as log10 cells/area of the stimulus (Goldman III)]
and visual sensitivity is plotted in D. There was no correlation when retinas were grouped as shown by linear regression (‘Spearman’s rho’, r ¼0.23, P < 0.001; D). Individual retinas show high variation among eyes (D). The ‘hockey stick’ model fitted by Swanson et al. (2004) to a plot of
normal visual field sensitivity, corrected to a 34-year old (Heijl et al., 1987) against normal retinal ganglion cell counts (Curcio and Allen, 1990), is
superimposed on the data from the current study in D (red line). Individual retinas show a similar relationship when retinal ganglion cell density is
high but a greater than expected drop-off in sensitivity when cell density is low. Retinal ganglion cell abbreviated to RGC in B–D. For A, F ¼fovea, ON ¼ optic nerve; retinal orientation identified by N ¼ nasal, I ¼ inferior, S ¼ superior, T ¼ temporal. Retinal ganglion cell density scales
through low (purple) to high (yellow) (B; upper row). Retinal ganglion cell density change scales through þ100% of control average (purple) to
�100% of control average (yellow) (B; lower row). Black regions in B represent regions around the optic nerve where cell counts were not taken.
6 | BRAIN COMMUNICATIONS 2019: Page 6 of 15 J. R. Tribble et al.
Dow
nloaded from https://academ
ic.oup.com/braincom
ms/article-abstract/1/1/fcz035/5645163 by Karolinska Institutet Library user on 31 D
ecember 2019

ON centre; dendrites shown in Fig. 2D, lower panel)were identified. To account for dendritic field size differ-
ences between ON and OFF centre cells, measurements
(dendrite, synapse, mitochondria and vacuole) were nor-
malized to the total dendritic length of the cell. There
was no significant difference in the average volume of the
dendritic tree (P¼ 0.876) or the average surface area
(P¼ 0.530) in glaucomatous retinal ganglion cells com-
pared with controls; however, retinal ganglion cells from
glaucomatous regions of the retina had 69% fewer den-
dritic branches than those from control tissue (P¼ 0.048;
‘Mann–Whitney’; Fig. 2E). The proportions of primary,
Figure 2 Dendritic loss is a feature of human glaucoma. Retinal samples [n ¼ 5 from glaucoma (four eyes) and n ¼ 6 from controls (four
eyes) corresponding to visual field test locations were dissected and prepared for SBFSEM]. Volumetric EM data were generated (A) from 79 �79 � 100 mm tissue cube (19.2 � 19.2 � 100 nm resolution). A representative single slice (x–y plane) is shown in B (cropped in x), showing the
retinal layers analysed. Retinal ganglion cells were identified, and their dendrites were reconstructed within the IPL. A cartoon of a Golgi-stained
midget cell is shown for comparison in C alongside a reconstruction from the current SBFSEM data (for more examples see Kolb and Dekorver,
1991). Seven control (D, upper panel) and five glaucomatous (D, lower panel) retinal ganglion cells that met inclusion criteria were reconstructed.
Dendrites (yellow) and synapses (cyan) are shown, with the dendrite origin at the soma indicated (white arrowheads). Analysis of dendrites
demonstrated reduced dendritic branching (E) and fewer and shorter secondary and tertiary dendrites in glaucoma, indicating the presence of
dendritic atrophy (F and G; primary dendrites n ¼ 5 in glaucoma, n ¼ 7 in controls; secondary dendrites n ¼ 4 in glaucoma, n ¼ 14 in control;
tertiary dendrites n ¼ 0 in glaucoma, n ¼ 3 in control). *P < 0.05, NS ¼ non-significant (P > 0.05). For B, ILM ¼ inner limiting membrane, NFL
¼ nerve fibre layer, GCL ¼ ganglion cell layer, IPL ¼ inner plexiform layer, INL ¼ inner nuclear layer. Scale bar ¼ 5 lm for D.
Retinal ganglion cell degeneration in glaucoma BRAIN COMMUNICATIONS 2019: Page 7 of 15 | 7
Dow
nloaded from https://academ
ic.oup.com/braincom
ms/article-abstract/1/1/fcz035/5645163 by Karolinska Institutet Library user on 31 D
ecember 2019

secondary and tertiary dendrites were significantly altered
in glaucoma (P< 0.0001; ‘Fisher’s exact’ test; Fig. 2F).
Secondary and tertiary dendritic length was reduced sug-
gesting dendrite retraction prior to gross dendritic loss
(P¼ 0.036 and 0.049, respectively; Fig. 2G). To account
for changes to dendrites driven by age-related or tissue
processing factors, we performed multiple regression ana-
lysis. Multiple regression analysis revealed that differences
in dendritic branching and length were not driven by
variation in tissue fixation times, age of the donor, or the
foveal eccentricity of the retinal ganglion cell analysed
(Table 2). Time to fixation and donor age had a statistic-
ally significant effect on variance in dendrite volume
[accounting for up to 35% (P¼ 0.008) and 12%
(P¼ 0.022) of variance, respectively]. However, we saw
no statistically significant difference in dendrite volume
between control and glaucoma retinal ganglion cells in
our morphological analysis.
Changes to mitochondria andvacuoles in glaucomatous retinalganglion cell dendrites
Mitochondrial abnormalities and dysfunction are likely to
be early features of human glaucoma, and a systemic vul-
nerability to mitochondrial abnormalities has been
reported in glaucoma patients (Osborne et al., 2016b).
SBFSEM reconstructions allowed the analysis of
mitochondrial morphology and distribution within retinal
ganglion cell dendrites (examples and reconstructions
shown in Fig. 3A–D). Glaucomatous retinas had a
reduced number of mitochondria within retinal ganglion
cells (�62%, P¼ 0.048, ‘Mann–Whitney’) and occupied
74% less of the dendritic volume compared with those of
controls (P¼ 0.003; Fig. 3E and F). Mitochondria dem-
onstrated an altered distribution across dendrites (as
assessed by Sholl analysis; Fig. 3G–J). Mitochondrial dis-
tribution was significantly reduced in secondary dendrites
(Sholl area under the curve; P< 0.0001, ‘Mann–
Whitney’) with a significantly altered distributions across
the Sholl analyses (P< 0.0001; ‘Fisher’s exact’ test;
Fig. 3H and J). NND analysis of individual mitochondria
within dendrites demonstrated no significant increase in
distance between the three nearest neighbours (k¼ 3) for
mitochondria within primary dendrites (k¼ 1, P¼ 0.711;
k¼ 2, P¼ 0.901; k¼ 3, P¼ 0.921; ‘Mann–Whitney’) but
a substantial increase in NND in secondary dendrites
(P< 0.0001 for k¼ 1, k¼ 2 and k¼ 3) indicating that
mitochondria become increasingly isolated in more per-
ipheral dendritic segments (Fig. 3K–M).
We next assessed the morphology of individual mito-
chondria within retinal ganglion cells. Smaller mitochon-
dria have previously been observed in ophthalmic and
neurodegenerative diseases (including glaucoma) and are
typically indicative of a mitochondrial fusion/fission im-
balance and/or an imbalance in mitophagy (Knott et al.,
2008; Kong et al., 2009; Williams et al., 2012, 2017b;
Table 2 Multiple regression analysis
Dependent variable
Dendrite
branches
Dendrite
volume
Dendrite
length
Mito.
number
Total
mito.
volume
Total mito.
SAUC
Vacuole
number
Total
vacuole
volume
Total
vacuole
SAUC
Overall regression model
R2 0.685 0.745 0.639 0.508 0.499 0.492 0.489 0.624 0.461
Adj. R2 0.598 0.599 0.433 0.227 0.212 0.201 0.198 0.409 0.153
P 0.060 0.030 0.092 0.232 0.245 0.255 0.258 0.104 0.301
Intercept coef. 1.98 1144.42 204.21 58.37 53.47 374.42 604.94 156.48 3291.80
Independent variables
Eccentricity
Variable coef. �0.02 �3.52 �0.77 1.33 0.04 5.93 �0.66 �0.33 �5.87
Contribution (%) 13.4 27.2 17.5 0.1 5.4 0.2 6.3 22.0 3.2
P 0.687 0.228 0.275 0.304 0.884 0.368 0.683 0.409 0.510
Time to fixation
Variable coef. 0.30 46.29 6.98 7.42 2.92 36.92 8.01 5.51 42.52
Contribution (%) 27.7 35.1 25.7 20.0 26.3 19.0 12.7 34.2 10.7
P 0.115 0.008 0.055 0.236 0.069 0.249 0.320 0.019 0.332
Time in fixative
Variable coef. 0.10 27.33 �0.37 �5.99 0.53 �33.26 �5.67 2.19 �43.01
Contribution (%) 5.7 0.5 8.0 18.9 6.9 18.9 0.3 1.3 0.2
P 0.679 0.165 0.940 0.476 0.789 0.443 0.599 0.419 0.470
Age
Variable coef. �0.03 �16.96 �2.54 �1.15 �0.87 �6.51 �7.17 �2.27 �38.40
Contribution (%) 21.7 11.7 12.6 11.8 11.3 11.0 29.7 4.8 32.0
P 0.663 0.022 0.113 0.676 0.206 0.645 0.074 0.029 0.079
Adj. ¼ adjusted, coef. ¼ coefficient, mito. ¼ mitochondria, SAUC ¼ Sholl area under the curve.
8 | BRAIN COMMUNICATIONS 2019: Page 8 of 15 J. R. Tribble et al.
Dow
nloaded from https://academ
ic.oup.com/braincom
ms/article-abstract/1/1/fcz035/5645163 by Karolinska Institutet Library user on 31 D
ecember 2019

Figure 3 Mitochondrial morphometry and distribution are altered in human glaucoma. Organelles from five glaucomatous (n ¼ 4
eyes) and seven control retinal ganglion cells (n ¼ 4 eyes) were reconstructed in FIJI (ImageJ). Mitochondria (mitos, magenta; identified by the
presence of cristae; n ¼ 198 in controls, n ¼ 55 in glaucoma across all cells analysed) and vacuoles (green, double membranous structures devoid
of cristae and electron dense material; n ¼ 273 in controls, n ¼ 326 in glaucoma across all cells analysed) were reconstructed within retinal
ganglion cell dendrites (yellow). Representative EM images for control (A) and glaucoma (C) and reconstructions (B and D) are shown. The
number of mitochondria per micrometre of dendrite for individual retinal ganglion cells was reduced in glaucoma (E), and mitochondria occupied
a reduced percentage of dendritic volume in glaucoma compared with controls (F). Sholl analysis of mitochondria demonstrates that the
mitochondrial distribution across dendrites was altered in glaucoma when expressed as a distribution statistic for primary dendrites (G; ‘Fisher’s
Retinal ganglion cell degeneration in glaucoma BRAIN COMMUNICATIONS 2019: Page 9 of 15 | 9
(continued)
Dow
nloaded from https://academ
ic.oup.com/braincom
ms/article-abstract/1/1/fcz035/5645163 by Karolinska Institutet Library user on 31 D
ecember 2019

Coughlin et al., 2015). Shape factor analysis revealed
that individual mitochondria were smaller (53%,
P¼ 0.008, ‘Student’s t-test’) and more rounded (9%,
P¼ 0.010) in glaucomatous retinal ganglion cells com-
pared with those in controls (Fig. 3N–P). This is consist-
ent with mitochondrial morphological changes
demonstrated in model hypoxia systems (Campello and
Scorrano, 2010; Ahmad et al., 2013; Fuhrmann and
Brune, 2017; Zhang et al., 2018), and other groups have
demonstrated that glaucomatous retinal ganglion cells
likely undergo chronic intermittent hypoxia following
periods of elevated intraocular pressure (Tezel and Wax,
2004; Holcombe et al., 2008; Chidlow et al., 2017).
Mitochondria in glaucomatous retinal ganglion cells had
no significant changes to oblate (rounded; 1%,
P¼ 0.984) or prolate ellipticity (cigar shaped; 11%,
P¼ 0.76; Fig. 3Q).
Other double membranous structures (within the size
range of 0.1–5 mm) were grouped and segmented. These
comprised small vacuoles, granulovacuolar degeneration
bodies containing only small quantities of electron dense
material and mitochondria devoid of cristae structure
(examples in Fig. 3A and C). The appearance of vacuoles
is an age- and disease-related change observed in neurons
in aged rodents (de Estable-Puig and Estable-Puig, 1975)
and post-mortem human tissue from various dementias
(Ball and Lo, 1977; Nakamori et al., 2013).
Granulovacuolar degeneration bodies, a hallmark of
Alzheimer’s disease, are late-stage autophagocytic
vacuoles, the accumulation of which may relate to incom-
plete autophagy (Funk et al., 2011). Mitochondria devoid
of cristae have been reported in animal models of glau-
coma (Coughlin et al., 2015; Williams et al., 2017b) and
other neurodegenerations (Baloyannis, 2011; Williams
et al., 2012; Franco-Iborra et al., 2018). In the present
study, we could not confidently separate these structures
and so grouped them as vacuoles to generate a meaning-
ful index of degeneration. We observed that these
vacuoles occupied 12% of the dendritic volume in
glaucoma and 8% in control retinal ganglion cells
(P¼ 1.00, ‘Mann–Whitney’; Fig. 3E and F). These struc-
tures increased in frequency by 40% in glaucomatous ret-
inal ganglion cells compared with controls (P¼ 0.048,
‘Mann–Whitney’) and were distributed along a higher
proportion of the dendritic tree (as shown by Sholl area
under the curve; 62% increase, P¼ 0.073, ‘Mann–
Whitney’; and as assessed by ‘Fisher’s exact’ test,
P< 0.0001; Fig. 3R and S). NND analysis (Fig. 3T) dem-
onstrated a decrease in distance between individual
vacuoles in glaucomatous retinal ganglion cells
(P< 0.0001 for k ¼ 1, k ¼ 2 and k ¼ 3; ‘Mann–
Whitney’). These findings are consistent with imbalanced
fusion/fission and autophagy, and are an indicator of
increased neurodegenerative insults in glaucomatous ret-
inal ganglion cells.
We performed multiple regression analysis to deter-
mine whether age-related or tissue processing factors
influenced mitochondria and vacuole metrics. Multiple
regression analysis demonstrated that differences in
mitochondrial and vacuole numbers, volume and
distribution were not driven by variation in tissue fix-
ation times, age of the donor or the foveal eccentricity
of the retinal ganglion cell analysed (Table 2). No stat-
istically significant model was produced, and all
showed weak correlation (all R2 < 0.625, P> 0.1).
Time to fixation and donor age had a statistically sig-
nificant effect on variance in total vacuole volume
[accounting for up to 34% (P¼ 0.019) and 5%
(P¼ 0.029) of variance, respectively]. The magnitude of
change between control and glaucoma vacuole volume
may therefore be overestimated in these data due to the
variability of tissue but are not the predominant deter-
minant of difference.
Collectively, these data demonstrate that following
periods of elevated intraocular pressure, retinal gan-
glion cell dendrites degenerate prior to gross cell loss
with marked changes to mitochondrial frequency and
density.
Figure 3 Continued
exact’ test; for individual dendrites, n displayed in figure), secondary dendrites (H; ‘Fisher’s exact’ test) but not tertiary dendrites (I; ‘Fisher’s
exact’ test). When expressed as Sholl AUC (J), mitochondrial distribution is significantly changed in secondary dendrites in glaucoma compared
with controls but not for primary and tertiary dendrites. NND analysis demonstrated no significant change in the proximity of mitochondria to
one another in primary dendrites (K; mitochondria n ¼ 39 in controls, n ¼ 38 in glaucoma) but a significant isolation in secondary dendrites
[distances to the first, second and third nearest neighbours (k ¼ 1–3) increased; L; mitochondria n ¼ 151 in controls, n ¼ 17 in glaucoma].
There were no observable mitochondria in tertiary dendrites in retinal ganglion cells from glaucoma eyes (M). Individual mitochondrial surface
reconstructions were generated in Imaris (mitochondria n ¼ 149 in controls, n ¼ 55 in glaucoma), and representative images are shown for
control and glaucomatous retinal ganglion cells (N). Mitochondria demonstrated significantly reduced volumes in glaucoma (O) and were more
spherical compared with controls (P). Oblate (rounded) and prolate (cigar-shaped) ellipticity was not significantly altered (Q). Sholl analysis of
vacuoles across the dendritic tree as a whole demonstrated a significant change in distribution (R; ‘Fisher’s exact’ test) but not in the Sholl AUC
(S). The number of vacuoles per micrometre of dendrite was increased in glaucoma (E), but the percentage of dendritic volume occupied by
vacuoles was unchanged (F). Nearest neighbour distances in vacuoles for the k ¼ 3 nearest neighbours decreased significantly in glaucoma
indicating an increased density of vacuoles (T; vacuoles n ¼ 273 in controls, n ¼ 326 in glaucoma). *P < 0.05, **P < 0.01, ***P < 0.001, NS ¼non-significant (P > 0.05). Scale bar ¼ 5 lm for B and D and 3 lm for N.
10 | BRAIN COMMUNICATIONS 2019: Page 10 of 15 J. R. Tribble et al.
Dow
nloaded from https://academ
ic.oup.com/braincom
ms/article-abstract/1/1/fcz035/5645163 by Karolinska Institutet Library user on 31 D
ecember 2019

DiscussionRetinal connectomics by electron microscopy or genetic
labelling has established itself as the technique to dissect
neuronal tracts and pathways in detail. These studies are
usually undertaken using specially prepared tissue from
model animals, in either normal or developing retina
(Briggman et al., 2011; Helmstaedter et al., 2013; Kim
et al., 2014; Marc et al., 2014; Greene et al., 2016). Due
to the time to fixation, human donor tissue from glau-
coma patients has typically been of insufficient quality to
enable neuronal analysis. A short time to fixation is key
in preserving neuronal integrity, but prolonged fixation
raises considerable technical challenges with standard
techniques for visualizing neurons (e.g. Golgi staining,
intracellular filling and DiOlistic labelling; Dowling,
2012; Balendra et al., 2015). We sought to overcome
these challenges by using rare tissue with a shorter post-
death time to fixation (average �6 h) than typical for
post-mortem tissue, and specifically selecting regions of
retina with known clinical history (in particular, visual
field sensitivity data) and known retinal ganglion cell
densities (determined histologically).
Retinal ganglion cell degeneration in glaucoma is a
compartmentalized process, with different factors affecting
different compartments of the cell (axon, soma, dendrites,
synapses, and mitochondria; Whitmore et al., 2005; Della
Santina and Ou, 2017; Williams et al., 2017a). However,
our knowledge of this compartmentalized degeneration
comes primarily from animal models with only limited
data from human tissue (Wang et al., 2003; Morrison
et al., 2005). In our dataset, human glaucomatous retinal
ganglion cells undergo dendritic and mitochondrial
changes. Given the presence of dendritic degeneration, it
is reasonable to conclude that these RGCs have less syn-
aptic contacts, but this could not be definitively assessed
in these datasets due to the available resolution of
SBFSEM when capturing large image volumes. Further
studies on single retinal ganglion cells with higher reso-
lution and higher throughput methods are warranted to
explore synapses at this level. Synapse loss prior to
marked neurodegeneration has been demonstrated in ani-
mal models of glaucoma (Della Santina et al., 2013;
Berry et al., 2015; Williams et al., 2016) and is a com-
mon feature of other neurodegenerations (Reddy et al.,
2012; Williams et al., 2012). The process is predicted to
be an early driver of visual dysfunction in glaucoma.
Reduction in mitochondrial volume and distribution
may indicate that glaucomatous retinal ganglion cells are
under increased metabolic strain, an emerging aspect of
early glaucomatous degeneration in animal models
(Baltan et al., 2010; Ebneter et al., 2011; Osborne et al.,2016b; Inman and Harun-Or-Rashid, 2017; Williams
et al., 2017a, b). Furthermore, genomic analysis has dem-
onstrated increased mitochondrial DNA content and a
spectrum of mitochondrial DNA mutations in glaucoma
patients (Chrysostomou et al., 2013; Van Bergen et al.,
2015; Zhang et al., 2016). In addition, many diseases
caused by mutations in mitochondrial genes, or nuclear
genes encoding mitochondrial proteins, primarily affect
retinal ganglion cells and present as visual disorders with
little or no extra-ophthalmic symptoms (e.g. MT-ND1,
MT-ND4 and MT-ND6 in Leber’s hereditary optic neur-
opathy; OPA1 in autosomal dominant optic atrophy;
Yu-Wai-Man et al., 2011; Pilz et al., 2017), suggesting
retinal ganglion cell sensitivity to mitochondrial perturba-
tions (Williams et al., 2012).
The majority of cells in our SBFSEM datasets were de-
void of dendrites, which likely arose from the delay be-
tween death and fixation, where further neuronal
degeneration may have occurred. We have previously dem-
onstrated that axotomized rodent retina maintained in cul-
ture following extraction exhibit dendritic atrophy within
6 h (Binley et al., 2016). However, fresh, axotomized
human retina explant tissue culture has proven to be a use-
ful tool to assess neurodegenerative insults and treatments
despite this initial wave of degenerative changes (Osborne
et al., 2016a, 2018). The mean time from death to fixation
was shorter in the glaucoma eyes compared with controls
(3.1 6 1.1 and 7.33 6 1.2 h), while control eyes were from
older donors than glaucoma eyes. It is therefore reasonable
to consider that dendritic degeneration may have been
underestimated in the glaucoma eyes. Multiple regression
analysis demonstrated that time from death to fixation may
have contributed to changes in dendritic volume, but the
differences observed between control and glaucomatous ret-
inal ganglion cells were predominantly related to factors
other than tissue preparation. Intact, albeit, degenerated
dendrites are an indication that potentially functional cells
remain in regions of the retina that have no-to-moderate
cell loss and visual deficits.
We observed a reduction in the number of mitochondria,
with changes in size, shape and distribution across the dendrit-
ic tree. We also observed an increase in double membranous
structures, which likely include vacuoles, granulovacuolar
degeneration bodies and mitochondria devoid of cristae struc-
ture. While these structures are characteristics of neurodege-
nerative processes, we cannot exclude the possibility that they
occur as part of the normal aging process (as these eyes came
from significantly aged individuals) or that the rate and magni-
tude of the appearance of these structures differ in a disease
context. Since they were also present in control tissue, it is pos-
sible that they are artefacts arising from the delay in death to
fixation and the storage of tissue long term in PFA (as opposed
to osmium tetroxide or cacodylate buffer as standard in elec-
tron microscopy preparations). Multiple regression analysis
demonstrated that differences in tissue fixation time had no
significant relationship to mitochondria or vacuole variance,
but time from death to fixation may have contributed to
changes in vacuole volume. This suggests that the difference
between control and glaucomatous retinal ganglion cell vacu-
ole volume may be overestimate, but it remains predominantly
related to factors other than tissue quality. However, the de-
finitive evaluation and staging of this process would require
Retinal ganglion cell degeneration in glaucoma BRAIN COMMUNICATIONS 2019: Page 11 of 15 | 11
Dow
nloaded from https://academ
ic.oup.com/braincom
ms/article-abstract/1/1/fcz035/5645163 by Karolinska Institutet Library user on 31 D
ecember 2019

tissue available at post-mortem stages that are unrealistic.
Conservatively, our data support the neurodegenerative proc-
esses observed in animal models. Further studies with larger
numbers of eyes would be required to provide more detailed
quantification of the relationship between these degenerative
changes and visual dysfunction.
The compartmentalized degeneration of retinal ganglion
cells results in functional visual loss in animal models of
glaucoma (Weber and Harman, 2005; Howell et al.,
2007; Della Santina et al., 2013). These data suggest that
in humans, early degenerative changes prior to gross
axon and soma loss contributes to vision loss. The
‘hockey stick’ model of Swanson et al. (2004) predicts
that the rate of change in sensitivity with respect to ret-
inal ganglion cell number is low when the stimulus is
larger than the critical summation area but becomes
greater when the stimulus is smaller than the critical sum-
mation area. This model applies in healthy observers as
the critical summation area enlarges with increasing ec-
centricity, encompassing a constant number of retinal
ganglion cells. Although it is known that the critical sum-
mation area is enlarged at fixed locations in the visual
field in glaucoma (Redmond et al., 2010), the range over
which it can enlarge is unknown. The steeper than
expected drop-off in sensitivity at lower retinal ganglion
cell densities observed in the present study (Fig. 1D)
would suggest that the range of enlargement is shorter in
glaucoma than that observed across eccentricities in
healthy controls. A number of difficulties with the limita-
tions of Standard Automated Perimetry and cell counting
may have contributed to the discrepancy found in the
current study. Inter- and intra-test variabilities substan-
tially increase with the depth of visual field defect
(Henson et al., 2000; Artes et al., 2002), which may in-
crease variance in the functional data. Fixational drift
and microsaccades can vary the location of individual
stimuli (Henson et al., 1996), and if retinal ganglion cell
loss is heterogeneous, this could manifest as greater vari-
ability in sensitivity measurements. Pre-neuronal abbera-
tions (e.g. optical defects) could also influence sensitivity.
Nuclear counts will not distinguish between functional
retinal ganglion cells and those with reduced or absent
visual input (i.e. synapse and axon loss, which we
addressed further in our SBFSEM studies presented here).
The interval from the last visual field to time of death
was 7–21 months, in which time retinal ganglion cell de-
generation could have progressed, but given that regions
of no significant cell loss demonstrated a visual deficit,
this seems an unlikely source of discrepancy. The degree
of cell loss within visual field test areas has previously
been shown to have a weak relationship with visual sen-
sitivity (R2 ¼ 0.31; Kerrigan-Baumrind et al., 2000). In
these experiments, cell counts of four retinal sections
from 28 test locations were conducted across 17 eyes;
however, these data are caveated as the linear regression
fits were calculated against sensitivity (dB scale; a log
scale) without log scaling of retinal ganglion cell number
and performed on retinal sections rather than whole-
mounted retina. The present study suggests that visual
field sensitivity is lower, overall, than expected from the
‘hockey stick’ model for a range of retinal ganglion cell
densities, with considerable variance in the sensitivity
data, particularly in locations with lower retinal ganglion
cell density. Taken together, the findings of the current
study suggest that in glaucoma, deficits at the level of the
single cell may initially be masked when retinal ganglion
cell density is high and contribute to the steeper than
expected drop-off in sensitivity when the density is low.
The detection of the earliest signs of retinal damage
remains a sought after target for clinicians managing
glaucoma. The detection of retinal ganglion cell apoptotic
events using fluorescent annexin-V tagging suggests one
possibility (Cordeiro, 2007; Cordeiro et al., 2017).
However, the cells identified by this method are already
undergoing cell death, the temporal dynamics of which
are still unresolved, and, therefore, are unlikely to be tar-
gets for functional recovery. The demonstration of
changes in dendritic and mitochondrial structures and
distribution in the present study suggest that these may
present a clinically detectable target of early retinal neur-
onal damage. While these structures fall within the theor-
etical detection limit for high-resolution OCT (Morgan
et al., 2017), direct imaging is unlikely in view of their
relatively low contrast. However, changes in optical scat-
ter induced by neurodegenerative changes in the inner
retina are a realistic target. We have demonstrated that
changes in optical texture of the inner plexiform layer
can be detected by high-resolution OCT and correlated
with histological changes in retinal explants (Tudor et al.,2014). Preliminary work in human glaucoma suggests
that optical texture, as derived by OCT, can support the
early diagnosis of glaucoma (Anantrasirichai et al.,2013). In addition, there is increasing evidence for the de-
tection of Alzheimer’s disease by OCT of the inner retina
(den Haan et al., 2017; Liao et al., 2018). Mitochondrial
loss has been reported in retinal ganglion cells in mice
carrying Alzheimer’s disease-associated mutations
(Williams et al., 2013b) and may therefore also provide
optical texture changes for earlier and more sensitive de-
tection of Alzheimer’s disease.
In conclusion, we demonstrate a proof-of-concept, first-
in-glaucoma, high-resolution analysis of glaucomatous ret-
inal ganglion cells permitting the analysis of dendritic
and mitochondrial structures. Further studies with an
increased number of cells across various glaucoma path-
ologies will allow the delineation of the extent to which
these changes are common across glaucoma subgroups.
AcknowledgementsThe authors would like to thank Dr Philip Lewis and
Professor Keith Meek for their discussion, assistance and
support regarding SBFSEM and the Knut and Alice
12 | BRAIN COMMUNICATIONS 2019: Page 12 of 15 J. R. Tribble et al.
Dow
nloaded from https://academ
ic.oup.com/braincom
ms/article-abstract/1/1/fcz035/5645163 by Karolinska Institutet Library user on 31 D
ecember 2019

Wallenberg Foundation and Karolinska Institutet for sup-
porting the CLICK imaging facility.
FundingThis study was supported by Fight for Sight, UK (1580/
1581, J.E.M.), Medical Research Council, UK (1221470,
F.S.), National Eye Institute, USA (EY21727 and EY26490,
M.P.F.), Karolinska Institutet, Board of Research Faculty
Fund (P.A.W.), Vetenskapsradet (2018-02124, P.A.W.) and
Medical Research Council, UK (MR/K000837/1, Keith
Meek; operational costs of SBFSEM).
Competing interestsNo conflicting relationship exists for any author.
ReferencesAhmad T, Aggarwal K, Pattnaik B, Mukherjee S, Sethi T, Tiwari BK,
et al. Computational classification of mitochondrial shapes reflects
stress and redox state. Cell Death Dis 2013; 4: e461.Anantrasirichai N, Achim A, Morgan JE, Erchova I, Nicholson L.
SVM-based texture classification in Optical CoherenceTomography. In: 2013 IEEE 10th International Symposium onBiomedical Imaging, 7–11 April 2013.
Artes PH, Iwase A, Ohno Y, Kitazawa Y, Chauhan BC. Properties ofperimetric threshold estimates from full threshold, SITA standard,
and SITA fast strategies. Invest Ophthalmol Vis Sci 2002; 43:2654–9.
Balendra SI, Normando EM, Bloom PA, Cordeiro MF. Advances in
retinal ganglion cell imaging. Eye 2015; 29: 1260–9.Ball MJ, Lo P. Granulovacuolar degeneration in the ageing brain and
in dementia. J Neuropathol Exp Neurol 1977; 36: 474–87.
Baloyannis SJ. Mitochondria are related to synaptic pathology inAlzheimer’s disease. Int J Alzheimers Dis 2011; 2011: 305395.
Baltan S, Inman DM, Danilov CA, Morrison RS, Calkins DJ, HornerPJ. Metabolic vulnerability disposes retinal ganglion cell axons todysfunction in a model of glaucomatous degeneration. J Neurosci
2010; 30: 5644–52.Berry RH, Qu J, John SWM, Howell GR, Jakobs TC. Synapse loss
and dendrite remodeling in a mouse model of glaucoma. PLoS One2015; 10: e0144341.
Binley KE, Ng WS, Barde YA, Song B, Morgan JE. Brain-derived
neurotrophic factor prevents dendritic retraction of adult mouse ret-inal ganglion cells. Eur J Neurosci 2016; 44: 2028–39.
Briggman KL, Helmstaedter M, Denk W. Wiring specificity in the dir-ection-selectivity circuit of the retina. Nature 2011; 471: 183–8.
Campello S, Scorrano L. Mitochondrial shape changes: orchestrating
cell pathophysiology. Embo Rep 2010; 11: 678–84.Cardona A, Saalfeld S, Schindelin J, Arganda-Carreras I, Preibisch S,
Longair M, et al. TrakEM2 software for neural circuit reconstruc-
tion. PLoS One 2012; 7: e38011.Chidlow G, Wood JPM, Casson RJ. Investigations into hypoxia and
oxidative stress at the optic nerve head in a rat model of glaucoma.Front Neurosci 2017; 11: 478.
Chrysostomou V, Rezania F, Trounce IA, Crowston JG. Oxidative
stress and mitochondrial dysfunction in glaucoma. Curr OpinPharmacol 2013; 13: 12–5.
Cordeiro MF. DARC: a new method for detecting progressive neuron-al death. Eye 2007; 21: S15–S17.
Cordeiro MF, Normando EM, Cardoso MJ, Miodragovic S, Jeylani S,
Davis BM, et al. Real-time imaging of single neuronal cell apoptosisin patients with glaucoma. Brain 2017; 140: 1757–67.
Coughlin L, Morrison RS, Horner PJ, Inman DM. Mitochondrial
morphology differences and mitophagy deficit in murine glaucomat-ous optic nerve. Invest Ophthalmol Vis Sci 2015; 56: 1437–46.
Curcio CA, Allen KA. Topography of ganglion-cells in human retina.J Comp Neurol 1990; 300: 5–25.
Dacey DM. The mosaic of midget ganglion cells in the human retina.
J Neurosci 1993; 13: 5334–55.de Estable-Puig RF, Estable-Puig JF. Vacuolar degeneration in neurons
of aging rats. Virchows Archiv B 1975; 17: 337.
Della Santina L, Ou Y. Who’s lost first? Susceptibility of retinal ganglioncell types in experimental glaucoma. Exp Eye Res 2017; 158: 43–50.
Della Santina L, Inman DM, Lupien CB, Horner PJ, Wong RO.Differential progression of structural and functional alterations indistinct retinal ganglion cell types in a mouse model of glaucoma.
J Neurosci 2013; 33: 17444–57.den Haan J, Verbraak FD, Visser PJ, Bouwman FH. Retinal thickness
in Alzheimer’s disease: a systematic review and meta-analysis.Alzheimers Dement (Amst) 2017; 6: 162–70.
Dowling J. The retina: an approachable part of the brain. Revised edn.
Cambridge: Belknap Press, Harvard University Press; 2012.Ebneter A, Chidlow G, Wood JPM, Casson RJ. Protection of retinal
ganglion cells and the optic nerve during short-term hyperglycemiain experimental glaucoma. Arch Ophthalmol 2011; 129: 1337–44.
Feng L, Zhao Y, Yoshida M, Chen H, Yang JF, Kim TS, et al.
Sustained ocular hypertension induces dendritic degeneration ofmouse retinal ganglion cells that depends on cell type and location.Invest Ophthalmol Vis Sci 2013; 54: 1106–17.
Franco-Iborra S, Vila M, Perier C. Mitochondrial quality control inneurodegenerative diseases: focus on Parkinson’s disease and
Huntington’s disease. Front Neurosci 2018; 12: 342.Fuhrmann DC, Brune B. Mitochondrial composition and function
under the control of hypoxia. Redox Biol 2017; 12: 208–15.
Funk KE, Mrak RE, Kuret J. Granulovacuolar degeneration (GVD)bodies of Alzheimer’s disease (AD) resemble late-stage autophagic
organelles. Neuropathol Appl Neurobiol 2011; 37: 295–306.Garway-Heath DF, Caprioli J, Fitzke FW, Hitchings RA. Scaling the
hill of vision: the physiological relationship between light sensitivity
and ganglion cell numbers. Invest Ophthalmol Vis Sci 2000; 41:1774–82.
Garway-Heath DF, Rudnicka AR, Lowe T, Foster PJ, Fitzke FW,Hitchings RA. Measurement of optic disc size: equivalence of meth-ods to correct for ocular magnification. Br J Ophthalmol 1998; 82:
643–9.Giacci MK, Bartlett CA, Huynh M, Kilburn MR, Dunlop SA,
Fitzgerald M. Three dimensional electron microscopy reveals chang-ing axonal and myelin morphology along normal and partiallyinjured optic nerves. Sci Rep 2018; 8: 3979.
Greene MJ, Kim JS, Seung HS. Analogous convergence of sustainedand transient inputs in parallel on and off pathways for retinal mo-tion computation. Cell Rep 2016; 14: 1892–900.
Gromping U. Relative importance for linear regression in R: the pack-age relaimpo. J Stat Soft 2006; 17: 1–27.
Heijl A, Lindgren G, Olsson J. Normal variability of static perimetricthreshold values across the central visual field. Arch Ophthalmol1987; 105: 1544–9.
Helmstaedter M, Briggman KL, Turaga SC, Jain V, Seung HS, DenkW. Connectomic reconstruction of the inner plexiform layer in the
mouse retina. Nature 2013; 500: 168.Henson DB, Chaudry S, Artes PH, Faragher EB, Ansons A. Response
variability in the visual field: comparison of optic neuritis, glaucoma,
ocular hypertension, and normal eyes. Invest Ophthalmol Vis Sci2000; 41: 417–21.
Henson DB, Evans J, Chauhan BC, Lane C. Influence of fixation ac-curacy on threshold variability in patients with open angle glau-coma. Invest Ophthalmol Vis Sci 1996; 37: 444–50.
Retinal ganglion cell degeneration in glaucoma BRAIN COMMUNICATIONS 2019: Page 13 of 15 | 13
Dow
nloaded from https://academ
ic.oup.com/braincom
ms/article-abstract/1/1/fcz035/5645163 by Karolinska Institutet Library user on 31 D
ecember 2019

Holcombe DJ, Lengefeld N, Gole GA, Barnett NL. The effects of acute
intraocular pressure elevation on rat retinal glutamate transport.Acta Ophthalmol 2008; 86: 408–14.
Holden AL, Fitzke FW. Image size in the fundus: structural evidence
for wide-field retinal magnification factor. Br J Ophthalmol 1988;72: 228–30.
Howell GR, Libby RT, Jakobs TC, Smith RS, Phalan FC, Barter JW,et al. Axons of retinal ganglion cells are insulted in the optic nerveearly in DBA/2J glaucoma. J Cell Biol 2007; 179: 1523–37.
Inman DM, Harun-Or-Rashid M. Metabolic vulnerability in the neu-rodegenerative disease glaucoma. Front Neurosci 2017; 11: 146.
Kerrigan-Baumrind LA, Quigley HA, Pease ME, Kerrigan DF, Mitchell
RS. Number of ganglion cells in glaucoma eyes compared withthreshold visual field tests in the same persons. Invest Ophthalmol
Vis Sci 2000; 41: 741–8.Kim JS, Greene MJ, Zlateski A, Lee K, Richardson M, Turaga SC,
et al. Space-time wiring specificity supports direction selectivity in
the retina. Nature 2014; 509: 331.Knott AB, Perkins G, Schwarzenbacher R, Bossy-Wetzel E.
Mitochondrial fragmentation in neurodegeneration. Nat RevNeurosci 2008; 9: 505–18.
Kolb H, Dekorver L. Midget ganglion cells of the parafovea of the
human retina: a study by electron microscopy and serial sectionreconstructions. J Comp Neurol 1991; 303: 617–36.
Kolb H, Linberg KA, Fisher SK. Neurons of the human retina—aGolgi study. J Comp Neurol 1992; 318: 147–87.
Kong GYX, Van Bergen NJ, Trounce IA, Crowston JG. Mitochondrial
dysfunction and glaucoma. J Glaucoma 2009; 18: 93–100.Leung C. K-S, Weinreb RN, Li ZW, Liu S, Lindsey JD, Choi Nathan,
Liu L, et al. Long-term in vivo imaging and measurement of dendrit-
ic shrinkage of retinal ganglion cells. Invest Ophthalmol Vis Sci2011; 52: 1539–47.
Liao H, Zhu Z, Peng Y. Potential utility of retinal imaging forAlzheimer’s disease: a review. Front Aging Neurosci 2018; 10: 188.
Marc RE, Anderson JR, Jones BW, Sigulinsky CL, Lauritzen JS. The
all amacrine cell connectome: a dense network hub. Front NeuralCircuits 2014; 8: 104.
Morgan JE, Datta AV, Erichsen JT, Albon J, Boulton ME. Retinal gan-glion cell remodelling in experimental glaucoma. In: JG Anderson,RE LaVail, MM Hollyfield, editors. Retinal degenerative diseases.
Berlin, Germany: Springer; 2006. p. 397–402.Morgan JE, Tribble J, Fergusson J, White N, Erchova I. The optical
detection of retinal ganglion cell damage. Eye 2017; 31: 199–205.Morgan JE, Uchida H, Caprioli J. Retinal ganglion cell death in ex-
perimental glaucoma. Br J Ophthalmol 2000; 84: 303–10. doi:
10.1136/bjo.84.3.303.Morrison JC, Johnson EC, Cepurna W, Jia LJ. Understanding mecha-
nisms of pressure-induced optic nerve damage. Prog Retin Eye Res2005; 24: 217–40.
Mulholland PJ, Redmond T, Garway-Heath DF, Zlatkova MB,
Anderson RS. Spatiotemporal summation of perimetric stimuli inearly glaucoma. Invest Ophthalmol Vis Sci 2015; 56: 6473–82.
Nakamori M, Takahashi T, Nishikawa T, Yamazaki Y, Kurashige T,
Maruyama H, et al. “Molecular markers for granulovacuolar degen-eration are present in rimmed vacuoles. PLoS One 2013; 8: e80995.
Osborne A, Hopes M, Wright P, Broadway DC, Sanderson J. Humanorganotypic retinal cultures (HORCs) as a chronic experimentalmodel for investigation of retinal ganglion cell degeneration. Exp
Eye Res 2016a; 143: 28–38.Osborne A, Sanderson J, Martin KR. Neuroprotective effects of
human mesenchymal stem cells and platelet-derived growth factoron human retinal ganglion cells. Stem Cells 2018; 36: 65–78.
Osborne NN, Nunez-Alvarez C, Joglar B, del Olmo-Aguado S.
Glaucoma: focus on mitochondria in relation to pathogenesis andneuroprotection. Eur J Pharmacol 2016b; 787: 127–33.
Pavlidis M, Stupp T, Naskar R, Cengiz C, Thanos S. Retinal ganglioncells resistant to advanced glaucoma: a postmortem study of human
retinas with the carbocyanine dye DiI. Invest Ophthalmol Vis Sci
2003; 44: 5196–205.Pilz YL, Bass SJ, Sherman J. A review of mitochondrial optic neuropa-
thies: from inherited to acquired forms. J Optom 2017; 10: 205–14.
Quigley HA, Dunkelberger GR, Green WR. Retinal ganglion cell atro-phy correlated with automated perimetry in human eyes with glau-
coma. Am J Ophthalmol 1989; 107: 453–64.Raza AS, Cho J, de Moraes CGV, Wang M, Zhang X, Kardon RH,
et al. Retinal ganglion cell layer thickness and local visual field sensi-
tivity in glaucoma. Arch Ophthalmol 2011; 129: 1529–36.Reddy PH, Tripathi R, Troung Q, Tirumala K, Reddy TP, Anekonda
V, et al. Abnormal mitochondrial dynamics and synaptic degener-
ation as early events in Alzheimer’s disease: implications to mito-chondria-targeted antioxidant therapeutics. Biochim Biophys Acta
2012; 1822: 639–49.Redmond T, Garway-Heath DF, Zlatkova MB, Anderson RS.
Sensitivity loss in early glaucoma can be mapped to an enlargement
of the area of complete spatial summation. Invest Ophthalmol VisSci 2010; 51: 6540–8.
Schindelin J, Arganda-Carreras I, Frise E, Kaynig V, Longair M,Pietzsch T, et al. Fiji: an open-source platform for biological-imageanalysis. Nat Methods 2012; 9: 676–82.
Shou TD, Liu J, Wang W, Zhou YF, Zhao KX. Differential dendriticshrinkage of alpha and beta retinal ganglion cells in cats with chron-
ic glaucoma. Invest Ophthalmol Vis Sci 2003; 44: 3005–10.Swanson WH, Felius J, Pan F. Perimetric defects and ganglion cell
damage: interpreting linear relations using a two-stage neural model.
Invest Ophthalmol Vis Sci 2004; 45: 466–72.Tafreshi A, Sample PA, Liebmann JM, Girkin CA, Zangwill LM,
Weinreb RN, et al. Visual function-specific perimetry to identify
glaucomatous visual loss using three different definitions of visualfield abnormality. Invest Ophthalmol Vis Sci 2009; 50: 1234–40.
Tezel G, Wax MB. Hypoxia-inducible factor 1 alpha in the glaucomat-ous retina and optic nerve head. Arch Ophthalmol 2004; 122:1348–56.
Tham YC, Li X, Wong TY, Quigley HA, Aung T, Cheng CY. Globalprevalence of glaucoma and projections of glaucoma burden
through 2040: a systematic review and meta-analysis.Ophthalmology 2014; 121: 2081–90.
Tudor D, Kajic V, Rey S, Erchova I, Povazay B, Hofer B, et al. Non-in-
vasive detection of early retinal neuronal degeneration by ultrahighresolution optical coherence tomography. PLoS One 2014; 9:
e93916.Urcola JH, Hernandez M, Vecino E. Three experimental glaucoma
models in rats: comparison of the effects of intraocular pressure ele-
vation on retinal ganglion cell size and death. Exp Eye Res 2006;83: 429–37.
Van Bergen NJ, Crowston JG, Craig JE, Burdon KP, Kearns LS,Sharma S, et al. Measurement of systemic mitochondrial function inadvanced primary open-angle glaucoma and Leber hereditary optic
neuropathy. PLoS One 2015; 10: e0140919.Wang L, Dong J, Cull G, Fortune B, Cioffi GA. Varicosities of intrare-
tinal ganglion cell axons in human and nonhuman primates. Invest
Ophthalmol Vis Sci 2003; 44: 2–9.Weber AJ, Harman CD. Structure-function relations of parasol cells in
the normal and glaucomatous primate retina. Invest Ophthalmol VisSci 2005; 46: 3197–207.
Weber AJ, Kaufman PL, Hubbard WC. Morphology of single ganglion
cells in the glaucomatous primate retina. Invest Ophthalmol Vis Sci1998; 39: 2304–20.
Whitmore AV, Libby RT, John SWM. Glaucoma: thinking in newways—a role for autonomous axonal self-destruction and othercompartmentalised processes? Prog Retin Eye Res 2005; 24:
639–62.Williams PA, Harder JM, Foxworth NE, Cardozo BH, Cochran KE,
John SWM. Nicotinamide and WLDS act together to prevent neuro-degeneration in glaucoma. Front Neurosci 2017a; 11: 232.
14 | BRAIN COMMUNICATIONS 2019: Page 14 of 15 J. R. Tribble et al.
Dow
nloaded from https://academ
ic.oup.com/braincom
ms/article-abstract/1/1/fcz035/5645163 by Karolinska Institutet Library user on 31 D
ecember 2019
Williams PA, Harder JM, Foxworth NE, Cochran KE, Philip VM,
Porciatti V, et al. Vitamin B-3 modulates mitochondrial vulner-ability and prevents glaucoma in aged mice. Science 2017b; 355:756–60.
Williams PA, Howell GR, Barbay JM, Braine CE, Sousa GL, JohnSWM, et al. Retinal ganglion cell dendritic atrophy in DBA/2J glau-
coma. PLoS One 2013a; 8: e72282.Williams PA, Thirgood RA, Oliphant H, Frizzati A, Littlewood E,
Votruba M, et al. Retinal ganglion cell dendritic degeneration in a
mouse model of Alzheimer’s disease. Neurobiol Aging 2013b; 34:1799–806.
Williams PA, Tribble JR, Pepper KW, Cross SD, Morgan BP, Morgan
JE, et al. Inhibition of the classical pathway of the complement cas-cade prevents early dendritic and synaptic degeneration in glaucoma.
Mol Neurodegener 2016; 11: 26.
Williams PA, Piechota M, von Ruhland C, Taylor E, Morgan JE,
Votruba M. Opa1 is essential for retinal ganglion cell synaptic archi-tecture and connectivity. Brain 2012; 135: 493–505.
Yamasaki R, Lu HY, Butovsky O, Ohno N, Rietsch AM, Cialic R,
et al. Differential roles of microglia and monocytes in the inflamedcentral nervous system. J Exp Med 2014; 211: 1533–49.
Yu-Wai-Man P, Griffiths PG, Chinnery PF. Mitochondrial optic neuro-pathies—disease mechanisms and therapeutic strategies. Prog RetinEye Res 2011; 30: 81–114.
Zhang D, Liu YF, Tang Y, Wang XF, Li ZC, Li R, et al. Increasedmitochondrial fission is critical for hypoxia-induced pancreatic betacell death. PLoS One 2018; 13: e0197266
Zhang SH, Gao FJ, Sun ZM, Xu P, Chen JY, Sun XH, et al. Highpressure-induced mtDNA alterations in retinal ganglion cells and
subsequent apoptosis. Front Cell Neurosci 2016; 10: 254.
Retinal ganglion cell degeneration in glaucoma BRAIN COMMUNICATIONS 2019: Page 15 of 15 | 15
Dow
nloaded from https://academ
ic.oup.com/braincom
ms/article-abstract/1/1/fcz035/5645163 by Karolinska Institutet Library user on 31 D
ecember 2019