doi: 10.1093/glycob/cwn137 november 26, 2008 atomic-resolution
TRANSCRIPT
Glycobiology vol. 19 no. 4 pp. 344–355, 2009doi:10.1093/glycob/cwn137Advance Access publication on December 4, 2008
Atomic-resolution conformational analysis of the GM3 ganglioside in a lipid bilayer andits implications for ganglioside–protein recognition at membrane surfaces
Mari L DeMarco and Robert J Woods1
Complex Carbohydrate Research Center, University of Georgia, Athens, GA,30602-4712, USA
Received on September 26, 2008; revised on November 25, 2008; accepted onNovember 26, 2008
Eukaryotic cells depend on external surface markers,such as gangliosides, to recognize and bind various othermolecules as part of normal growth and maturation. Thelocalization of gangliosides in the outer leaflet of the plasmamembrane, also make them targets for pathogens tryingto invade the host cells. Since ganglioside-mediated inter-actions are critical to both beneficial and pathological pro-cesses, much effort has been directed at determining the3D structures of their carbohydrate head groups; however,technical difficulties have generally prevented the character-ization of the head group in intact membrane-bound gan-gliosides. Determining the 3D structure and presentation ofgangliosides at the surface of membranes is important inunderstanding how cells interact with their local environ-ment. Here, we employ all-atom explicit solvent moleculardynamics (MD) simulations, using the GLYCAM06 forcefield, to model the conformation and dynamics of ganglio-side GM3 (α-Neu5Ac-(2-3)-β-Gal-(1-4)-β-Glc-ceramide) in aDMPC lipid bilayer. By comparison with MD simulations ofthe carbohydrate head-group fragment of GM3 alone, it waspossible to quantify and characterize the extent of changesin head-group presentation and dynamics associated withmembrane anchoring. The accuracy of data from the MDsimulations was determined by comparison to NMR andcrystallographic data for the head group in solution andfor GM3 in membrane-mimicking environments. The exper-imentally consistent model of GM3, in a lipid bilayer, wasthen used to model the recognition of GM3 at the cell surfaceby known protein receptors.
Keywords: glycoplipid/molecular dynamics/recognition/sialoadhesin/wheat germ agglutinin
Introduction
Gangliosides are a class of glycosphingolipids (glycolipids thatcontain at least one sialic acid), which form an integral partof cellular membranes. Gangliosides predominantly colocalizein microdomains in the outer leaflet of the plasma membrane(Hansson et al. 1977; Parton 1994; Simons and Ikonen 1997;
1To whom correspondence should be addressed: Tel: +1-706-542-4454;Fax: +1-706-542-4412; e-mail: [email protected]
Kasahara and Sanai 1999; Sorice et al. 1999) and, as such,play a role in the cell’s interactions with its extracellular envi-ronment. As well as being critical to normal biological func-tions (Garofalo et al. 2003; Degroote et al. 2004; Todeschiniand Hakomori 2008), gangliosides participate in many disease-related processes, acting as targets for (or facilitating cell entryof) invading viral (influenza virus (Suzuki et al. 1992; Sato et al.1996), human immunodeficiency virus (Hug et al. 2000), humanrotavirus (Guo et al. 1999)) and bacterial (Escheria coli, Vib-rio cholerae, Clostridium tetani, Clostridium botulinum, Neis-seria gonorrhoeae (Eidels et al. 1983; Degroote et al. 2004;Sharon 2006)) pathogens and toxins. Additionally, gangliosideshave been implicated in cancer metastasis (Hakomori 1984)and many autoimmune disorders including Guillain–Barre syn-drome (Hughes and Cornblath 2005), multiple sclerosis (Endoet al. 1984), lupus erythematosus (Endo et al. 1984), insulin-dependent (type 1) diabetes (Misasi et al. 1997), Hashimoto’sthyroiditis, and Graves’ disease (Ariga et al. 1991).
To fully exploit ganglioside–protein interactions as potentialtargets for diagnostic, preventative, and therapeutic treatments,it is important to understand the fundamental properties thatgovern the relationship between presentation (relative to themembrane surface) and conformation-dependent recognition ofgangliosides in their biological milieu.
In order to characterize the 3D structural and dynamic proper-ties of gangliosides at high-resolution, several challenges mustfirst be overcome. Firstly, gangliosides (part carbohydrate, partlipid) are plastic molecules that can populate several well-defined conformational states under physiological conditions.Secondly, ganglioside function is often intrinsically linked tolocalization in lipid membranes. Although the conformationof the carbohydrate head group of a ganglioside may be onlyweakly influenced by the membrane environment, the accessi-bility of its protein-binding epitopes is inherently dependent onhead-group presentation relative to the membrane surface. Thus,to provide a structural basis for interpreting ganglioside recog-nition, the 3D structure should be determined in biologicallyrelevant (lipid membrane) contexts.
To characterize the structure and presentation of ganglio-sides at atomic resolution, a method that can capture the dy-namics of the flexible carbohydrate domain, in the membraneenvironment, is required. Here, we have employed all-atommolecular dynamics (MD) simulations in explicit water, tocharacterize the mammalian ganglioside, GM3 (α-Neu5Ac-(2-3)-β-Gal-(1-4)-β-Glc-ceramide, also known as 3′-sialyllactosyl-ceramide (SLC-ceramide)), embedded in a dimyristoylphos-phatidylcholine (DMPC) lipid bilayer. For comparativepurposes, two simulations were performed: (1) GM3 in aDMPC bilayer and (2) SLC, the GM3 carbohydrate headgroup, free in solution. The simulations were validated throughcomparison with data from NMR experiments of SLC in
c© The Author 2008. Published by Oxford University Press. All rights reserved. For permissions, please e-mail: [email protected] 344
Downloaded from https://academic.oup.com/glycob/article-abstract/19/4/344/1987961by gueston 24 March 2018

Atomic-resolution conformational analysis
Fig. 1. (A) Snapshots from the simulation of SLC superimposed on the ringatoms of the central Gal residue. (B) Snapshots from the simulation of GM3superimposed on the five nonhydrogen atoms of ceramide closest to Glc.Snapshots are shown at 1 ns intervals, with all hydrogen and oxygen atoms(except for ring oxygens) removed for clarity.
solution, and of GM3 in membrane-mimicking environments,and by comparison with crystallographic data for relevantcarbohydrate/ganglioside–protein complexes from the ResearchCollaboratory for Structural Bioinformatics Protein Data Bank(PDB). For SLC, structurally relevant NMR data, such as,residual dipolar couplings (Kiddle and Homans 1998), scalarJ-couplings (Milton et al. 1998), and nuclear Overhauser en-hancements (NOEs) (Siebert et al. 1992) have been reported. ForGM3, reported experimental NMR data include residual dipolarcouplings (measured in DMPC/CHAPSO bicelles) (Aubin et al.1993) and NOEs (measured for GM3 in dodecylphosphocholine(DPC) micelles) (Siebert et al. 1992).
Once obtained, the experimentally consistent conformationalmodels of GM3 in a lipid bilayer were employed to explore therole of head-group presentation, conformation, and dynamicsof the ganglioside in a membrane, on molecular recognition byknown GM3 protein receptors.
Results
MD simulations of GM3 in a DMPC lipid bilayer and SLC wereperformed using explicit water for 30 ns each (Figure 1). For themembrane simulation, after the heating and equilibration stages(described in Materials and methods), the bilayer exhibited anarea/DMPC molecule of 63.7 A2 and a thickness (dl) of 39.1A. These values may be compared to the experimental valuesmeasured for lamellar lattices of DMPC in excess water at 300 Kof 61.7 A2 (area/DMPC) and 35.7 A (dl), respectively (Rand andParsegian 1989). Over the course of the simulation, the overall
Fig. 2. Bilayer thickness parameters, calculated from the GM3 simulation,compared to experimental values. The dl values (MD and exp) are shown inthe upper two traces and the dhc (MD and exp) in the lower two traces.
bilayer thickness (dl) and the hydrophobic thickness (dhc) weremonitored to assess the stability of the membrane (Figure 2).From 0 to 1 ns, the bilayer continued to equilibrate, as evidencedby a slight decrease in its overall thickness (Figure 2). The firstns of the simulation was therefore excluded from subsequentanalysis of the GM3 and SLC simulations (the latter only forconsistency). Over the period of 1–30 ns, the average thicknessvalues for the DMPC bilayer were dl = 35.6 ± 0.5 A and dhc =26.3 ± 0.4 A, which can be compared with their experimentalcounterparts dl = 35.7 A and dhc = 22.3 A (Rand and Parsegian1989), and with our previous simulation of a pure DMPC bilayerdl = 33.1 ± 0.5 A and dhc = 23.9 ± 0.2 A (Tessier et al. 2008).
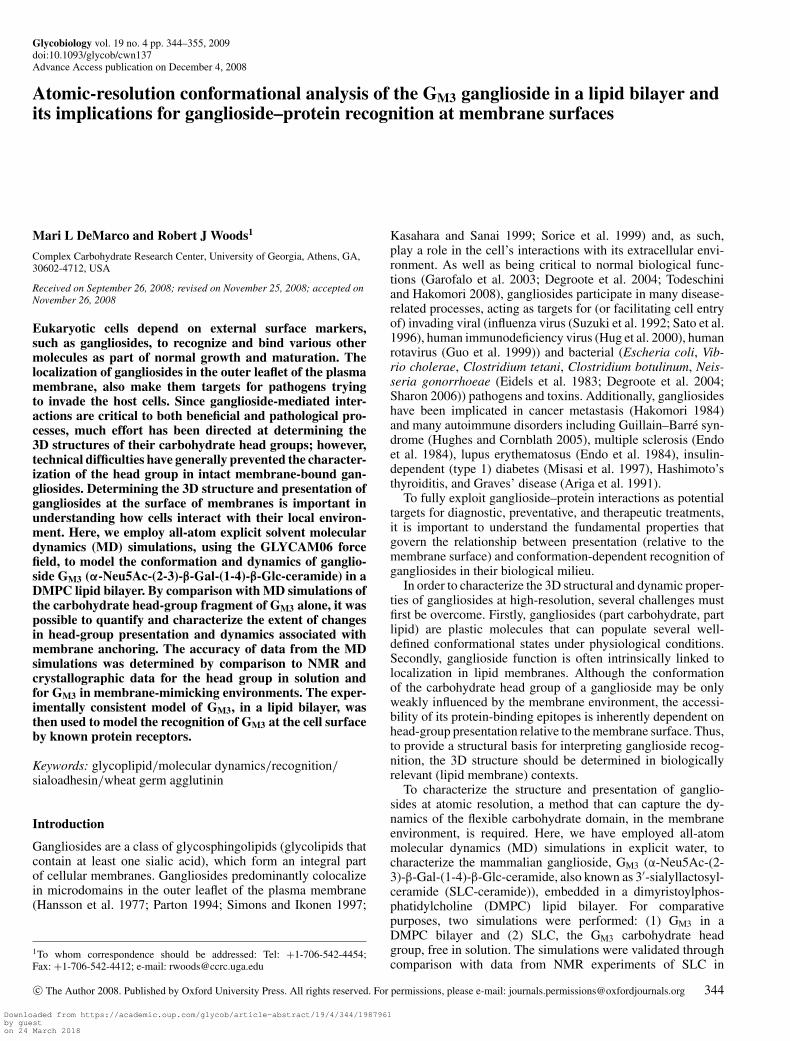
To assess the convergence of conformational sampling, gly-cosidic torsion angles were monitored for each simulation(Figure 3). The GM3 torsion angles populated the same con-formational space as those of SLC, with the exception of aminor population for the Gal–Glc linkage in SLC (Figure 3D).For comparison, φ/ψ angles for all deposited PDB structuresin the PDB that contained carbohydrates with α-Neu5Ac-(2-3)-β-Gal or β-Gal-(1-4)-β-Glc sequences are shown (Figure 3Eand F). For the Neu5Ac–Gal linkage, there were 52 dihedralpairs from 30 unique PDB crystal structures. For the Gal–Glclinkage, 244 dihedral angle pairs were extracted from 85 uniquePDB entries. Of these entries, seven structures contained theligand SLC (PDB IDs: 1dbn, 1hgg, 1qfo, 1se3, 1wgc, 2wgc,and 2zg3) and one (2osx) contained GM3.
The φ/ψ-scatter plots indicated that the carbohydrate head-group populated discrete conformational clusters (Figure 3).The average glycosidic torsion angles for each conformationalcluster can be found in Table I. For comparison, the relevantsets of PDB structures were similarly clustered (Table I). Forthe Neu5Ac–Gal linkages, GM3 and SLC populated the anti-φ (cluster A) and −gauche-φ (clusters B and C) conformersfor similar amounts of time (Table I). In the Neu5Ac-Gal PDBset, the ranking of the conformers were reversed, compared tothe MD populations, with the primary cluster populating the−gauche conformer. Due to the sparsity of structures in thePDB set, the −gauche PDB population could not be furthersubdivided, as was done for the MD simulations (where thisregion formed clusters B and C) (Table I). There was only oneoutlier in the PDB set, (φ, ψ) = (80.5◦, −17.2◦), from thestructure of parainfluenza hemagglutinin-neuramidase bound toSLC (1z4x) (Yuan et al. 2005).
For the Gal–Glc linkage, the average angles and rank of theprimary and secondary clusters from the MD and PDB sets wereconsistent, and significant differences arose only in the minor
345
Downloaded from https://academic.oup.com/glycob/article-abstract/19/4/344/1987961by gueston 24 March 2018
M L DeMarco and R J Woods
Fig. 3. The population density of glycosidic torsion angle pairs in thesimulations of GM3 (A and B) and SLC (C and D). For comparison,glycosidic torsion angles of carbohydrates from the PDB that contain either(E) α-Neu5Ac-(2-3)-β-Gal or (F) β-Gal-(1-4)-β-Glc linkages are shown.
populations. For instance, SLC populated a region of φ/ψ-spacefor 2% of the MD simulation (cluster C), but the same confor-mation was not populated in the GM3 simulation. There weretwo PDB structures found in this region (Table I). The PDB set
Table II. Interresidue scalar 3J-coupling constants (Hz) for SLC and GM3
Linkage Expt.a MDb
SLC SLC GM3
Neu5Ac–Gal φA C3-C2-O′3-C′3 1.9 ± 0.5 1.2 ± 1.2 1.8 ± 1.1ψB C2-O′3-C′3-C′2 1.8 ± 0.5 2.5 ± 0.8 2.5 ± 0.9ψC C2-O′3-C′3-C′4 <1 0.4 ± 0.7 0.9 ± 0.6ψD C2-O′3-C′3-H’3 4.7 ± 0.5 4.6 ± 1.6 4.6 ± 1.6
Gal–Glc φE H′1-C′1-O′ ′4-C′ ′4 3.5 ± 0.5 3.5 ± 2.0 3.7 ± 1.8φF C′2-C′1-O′ ′4-C′ ′4 1.9 ± 0.5 2.7 ± 1.2 2.7 ± 1.3ψG C′1-O′ ′4-C′ ′4-C′ ′5 2.6 ± 0.5 2.8 ± 0.2 2.2 ± 0.4ψK C′1-O′ ′4-C′ ′4-C′ ′3 <1 0.9 ± 0.7 1.1 ± 0.8
aExperimental error was estimated at 0.5 Hz (Milton et al. 1998).bAverage coupling and standard deviations calculated over 1–30 ns.
had one outlier, (φ, ψ) = (−18.3◦, 174.1◦), found in a region ofspace not sampled by either simulation (Figure 3B, D and F).Although comparisons between solution-phase simulations (orNMR data) and crystallographic data for flexible molecules arenot expected to give rise to excellent structural agreement, it isnotable that in the case of SLC, the dominant conformationalstates predicted by MD simulation were observed in the solidstate. This fact reinforces the proposal that proteins generallybind carbohydrates in their predominant solution conformations(DeMarco and Woods 2008). The differences in the populationdistributions of the states of the crystallographic and solutiondata were not surprising, particularly given that very few struc-tures from the PDB set included either SLC or GM3.
Trans-glycosidic scalar 3J-coupling constants were computedfrom the SLC and GM3 trajectories (Table II). For both simu-lations, the coupling constants were within the experimentalvalues determined for SLC in solution (Milton et al. 1998).For the C3-C2-O3′-C3′ (φA) angle of Neu5Ac-Gal, solving anappropriate Karplus relationship (3JCC(φA) = 3.70 cos2φA −0.18 cosφA + 0.11 (Cloran et al. 1999)) using the experimen-tal 3JCC(φA) value of 1.9 Hz yielded the values for φA con-sistent with either the anti or +gauche rotamers. Specifically,1.9 Hz for this linkage was consistent with the φA values be-tween approximately 44◦ and 132◦, which is equivalent to the“anti” φ values of 164◦ to −108◦ (φ = C2-C1-O3′-C3′) orwith the φA values between approximately −44◦ and −132◦,
Table I. Average glycosidic torsion angles (NMR definitions) for conformational clusters populated in simulations of SLC and GM3 and from experimentallydetermined structures with the relevant carbohydrate linkages
Cluster A Cluster B Cluster C
φ ψ %d φ ψ % φ ψ %
Neu5Ac–GalGM3
a −165.8 ± 10.4 −24.6 ± 11.5 64 −90.7 ± 13.0 −47.4 ± 13.6 27 −78.8 ± 20.8 20.8 ± 13.6 9SLCa −165.3 ± 10.3 −24.8 ± 11.2 67 −92.4 ± 12.4 −49.3 ± 12.3 28 −76.6 ± 15.7 2.6 ± 12.1 5PDBb 176.7 ± 2.9 −26.3 ± 10.6 12 −54.3 ± 19.0 −10.3 ± 13.6 87 80.5 ± 0.0 −17.2 ± 0.0 2
Gal–GlcGM3 45.4 ± 16.7 −0.6 ± 20.0 77 −23.6 ± 12.3 −28.3 ± 9.9 23SLC 46.5 ± 17.2 −2.8 ± 18.9 79 −21.7 ± 12.2 −27.7 ± 9.8 19 170.0 ± 15.6 1.3 ± 8.3 2PDBc 44.2 ± 11.9 −4.2 ± 20.9 95 −33.1 ± 16.7 −27.9 ± 11.7 4 176.2 ± 0.5 −5.9 ± 52.3 <1
−18.3 ± 0.0 174.1 ± 0.0 <1
aAverages calculated from 29001 MD snapshots.bAverages calculated from 52 PDB structures.cAverages calculated from 244 PDB structures.dPercentage of the total number of structures in each cluster.
346
Downloaded from https://academic.oup.com/glycob/article-abstract/19/4/344/1987961by gueston 24 March 2018
Atomic-resolution conformational analysis
Table III. Relative amounts of the Neu5Ac-Gal anti and −gauche conformers observed from MD simulations and calculated based on interresidue scalar3J-coupling data
Rotamer Average torsion angles from MD (◦) Calculated state3JCC(φA) (Hz)a
MD populations Experimentally-consistentpopulationsb
φ φA
GM3 anti −165.8 ± 10.4 76.1 ± 10.8 0.4 ± 0.3 64% 46%−gauchec −87.8 ± 16.1 155.8 ± 16.2 3.2 ± 0.7 36% 54%
SLC anti −165.3 ± 10.3 76.2 ± 10.7 0.4 ± 0.3 67% 44%−gauchec −90.4 ± 14.0 153.8 ± 14.7 3.1 ± 0.7 33% 56%
aEmploying the Karplus relationship from (Cloran et al. 1999).bBased on a rotational isomeric state analysis in which the experimental 3JCC(φA) = 1.9 Hz.cCombined average of −gauche clusters B and C from Table I.
equivalent to the “+gauche” φ values of −12◦ to 76◦. How-ever, the +gauche conformer of φ is rarely observed since itviolates the exo-anomeric effect (Wolfe et al. 1979; Booth andKhedhair 1985; Poveda et al. 2000). In addition to the anti ro-tamer, in the MD simulations we observed the population ofthe −gauche rotamer. Using the same Karplus relationship, the−gauche rotamer would produce a J-value for this linkage ofapproximately 4.0 Hz, which indicates that this conformationcannot be the dominant solution conformation. However, a valueof 1.9 Hz is consistent with a mixture of the anti and −gaucheconformers, as indicated by the MD simulations (Table II).
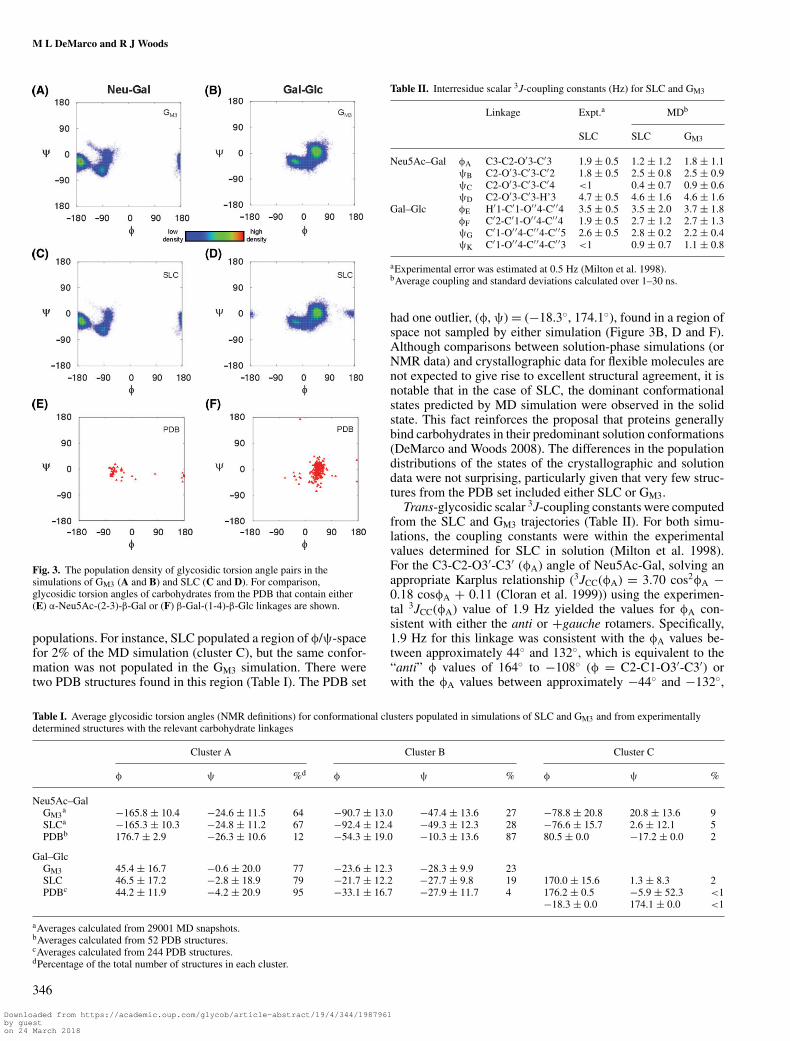
To determine more precisely the experimentally consistentratio of anti and −gauche conformers for the φ angle, we per-formed a rotational isomeric state analysis (Gonzalez-Outeirinoet al. 2006), in which average J-values for the anti and −gauchestates were computed, employing the MD snapshots for theseconformations with the appropriate Karplus relationship. Us-ing these state J-values, an experimentally consistent popula-tion ratio for the rotamers of approximately 1:1 was obtained(Table III). For comparison, the MD simulations gave rise to aratio of approximately 1:2 for the same rotamers (Table III). Todetermine whether the computed J-values had converged overthe timescale of the MD simulation, the average coupling con-stants were plotted as a function of simulation time (Figure 4).In the trajectories of both SLC and GM3, convergence wasachieved after approximately 10 ns.
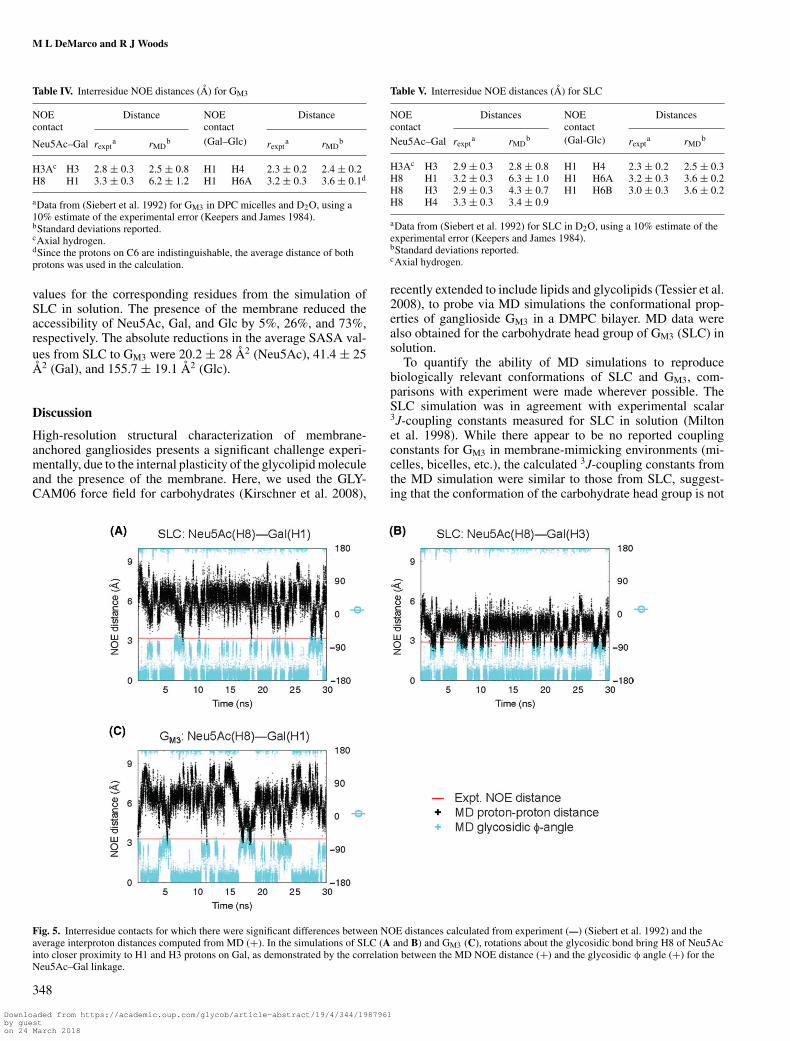
Along with scalar 3J-coupling constants, experimental inter-residue NOEs were available for comparison with the predictedconformations of both SLC and GM3 (Tables IV and V). TheMD simulations of GM3 and SLC reproduced all of the inter-
residue NOE contacts between Gal and Glc and a majority of thecontacts between Neu5Ac and Gal (Tables IV and V). Notably,for the Neu5Ac–Glc linkage, two NOE contacts for SLC andone for GM3 appeared initially to be inconsistent with those cal-culated from experimental NOE intensities (Tables IV and V).These NOEs involved contacts between proton H8 of Neu5Acand the H1 or H3 protons of Gal. For these particular contacts,experimentally consistent NOE distances were populated duringthe simulations, but only infrequently (Figure 5) and only whenthe φ angle for the Neu5Ac–Gal linkage populated the −gaucherotamer (Figure 5). The anti-rotamer for this linkage led to sig-nificantly longer interproton distances than predicted from theNOE data, suggesting that, in contrast to the 3J-coupling data,the φ angle for the Neu5Ac–Gal linkage adopted exclusivelythe −gauche orientation. The apparent discrepancy between the3J-coupling value and the NOE contact may have arisen fromerrors in both measurements, as well as from the use of theisolated spin pair approximation (ISPA), employed to convertthe observed NOEs to interproton distances (Keepers and James1984). Based on the MD results and the 3J-coupling analysis, itappears that the φ angle for the Neu5Ac–Gal linkage adopts amixture of −gauche and anti rotamers.
With the internal coordinates of the carbohydrate epitopesof SLC and GM3 characterized, we then sought to establish theextent to which external factors could affect the presentation ofGM3 in a bilayer. To quantitatively assess changes in the accessi-bility of protein-binding epitopes that occurred upon membraneanchoring, the relative solvent accessible surface area (SASA)of the head-group residues of GM3 was calculated (Figure 6).These SASA values were reported relative to the average SASA
Fig. 4. Running averages of the scalar 3J-coupling constants (labeled as in Table II) calculated from simulations of (A) GM3 and (B) SLC, which converge towithin the experimental values for SLC in solution.
347
Downloaded from https://academic.oup.com/glycob/article-abstract/19/4/344/1987961by gueston 24 March 2018
M L DeMarco and R J Woods
Table IV. Interresidue NOE distances (A) for GM3
NOEcontact
Distance NOEcontact
Distance
(Gal–Glc)Neu5Ac–Gal rexpta rMD
b rexpta rMD
b
H3Ac H3 2.8 ± 0.3 2.5 ± 0.8 H1 H4 2.3 ± 0.2 2.4 ± 0.2H8 H1 3.3 ± 0.3 6.2 ± 1.2 H1 H6A 3.2 ± 0.3 3.6 ± 0.1d
aData from (Siebert et al. 1992) for GM3 in DPC micelles and D2O, using a10% estimate of the experimental error (Keepers and James 1984).bStandard deviations reported.cAxial hydrogen.dSince the protons on C6 are indistinguishable, the average distance of bothprotons was used in the calculation.
values for the corresponding residues from the simulation ofSLC in solution. The presence of the membrane reduced theaccessibility of Neu5Ac, Gal, and Glc by 5%, 26%, and 73%,respectively. The absolute reductions in the average SASA val-ues from SLC to GM3 were 20.2 ± 28 A2 (Neu5Ac), 41.4 ± 25A2 (Gal), and 155.7 ± 19.1 A2 (Glc).
Discussion
High-resolution structural characterization of membrane-anchored gangliosides presents a significant challenge experi-mentally, due to the internal plasticity of the glycolipid moleculeand the presence of the membrane. Here, we used the GLY-CAM06 force field for carbohydrates (Kirschner et al. 2008),
Table V. Interresidue NOE distances (A) for SLC
NOEcontact
Distances NOEcontact
Distances
(Gal-Glc)Neu5Ac–Gal rexpta rMD
b rexpta rMD
b
H3Ac H3 2.9 ± 0.3 2.8 ± 0.8 H1 H4 2.3 ± 0.2 2.5 ± 0.3H8 H1 3.2 ± 0.3 6.3 ± 1.0 H1 H6A 3.2 ± 0.3 3.6 ± 0.2H8 H3 2.9 ± 0.3 4.3 ± 0.7 H1 H6B 3.0 ± 0.3 3.6 ± 0.2H8 H4 3.3 ± 0.3 3.4 ± 0.9
aData from (Siebert et al. 1992) for SLC in D2O, using a 10% estimate of theexperimental error (Keepers and James 1984).bStandard deviations reported.cAxial hydrogen.
recently extended to include lipids and glycolipids (Tessier et al.2008), to probe via MD simulations the conformational prop-erties of ganglioside GM3 in a DMPC bilayer. MD data werealso obtained for the carbohydrate head group of GM3 (SLC) insolution.
To quantify the ability of MD simulations to reproducebiologically relevant conformations of SLC and GM3, com-parisons with experiment were made wherever possible. TheSLC simulation was in agreement with experimental scalar3J-coupling constants measured for SLC in solution (Miltonet al. 1998). While there appear to be no reported couplingconstants for GM3 in membrane-mimicking environments (mi-celles, bicelles, etc.), the calculated 3J-coupling constants fromthe MD simulation were similar to those from SLC, suggest-ing that the conformation of the carbohydrate head group is not
Fig. 5. Interresidue contacts for which there were significant differences between NOE distances calculated from experiment (—) (Siebert et al. 1992) and theaverage interproton distances computed from MD (+). In the simulations of SLC (A and B) and GM3 (C), rotations about the glycosidic bond bring H8 of Neu5Acinto closer proximity to H1 and H3 protons on Gal, as demonstrated by the correlation between the MD NOE distance (+) and the glycosidic φ angle (+) for theNeu5Ac–Gal linkage.
348
Downloaded from https://academic.oup.com/glycob/article-abstract/19/4/344/1987961by gueston 24 March 2018

Atomic-resolution conformational analysis
Fig. 6. Changes in the accessibility of the carbohydrate epitope whenmembrane bound. (A) Relative SASA (%) values for the Neu5Ac (blue), Gal(magenta), and Glc (green) residues of GM3 relative to the ensemble averagedSASA calculated for the same residues from the SLC simulation. (B) 20 nssnapshot taken perpendicular to the plane of the bilayer (transparent spacefilling mode with hydrophilic region in blue and hydrophobic region in white)near the head group of GM3.
significantly altered by the presence of the membrane. Thisfinding is supported by the similarity of the interresidue NOEdistances reported for SLC in solution and GM3 in DPC mi-celles (Siebert et al. 1992). Additionally, the similar rates ofconvergence of coupling constants calculated from each sim-ulation (Figure 4) are indicative of a lack of influence of thelipid bilayer on the internal dynamics of the carbohydrate headgroup.
Further confidence in the MD results was provided by theagreement between the majority of NOE distances calculatedfrom the MD trajectories and those derived from experimen-tal intensities (Siebert et al. 1992) (Tables IV and V). Apparentinconsistencies between the MD-derived and experimentally de-rived NOE distances for the Neu5Ac–Gal linkage were notedfor the case of the H8 proton in Neu5Ac and the H1 and H3protons in the adjacent Gal residue. However, if a modest er-ror of 10% is allowed in the experimental distance, then theseinconsistencies may be resolved as follows. Taking the exam-ple of the GM3 Neu5Ac(H8)–Gal(H1) contact, assuming a 1/r6
distance dependence, an average NOE distance of 6.2 ± 1.2 Ais obtained from the anti and −gauche states, which comparespoorly with the reported ISPA-derived experimental distance of3.3 A (Table 4). If however, we allow an uncertainty in the ISPANOE distance of 10% (rexpt = 3.6 A) and use now the familyof −gauche geometries that forms the short interresidue contact(r−gauche = 3.3 A) rather than all −gauche geometries (leaving
the anti cluster unchanged), Eqs. (1) and (2) can be solved to de-termine a ratio of −gauche:anti conformations consistent withthe experimental distance:
1
r6exp t
= a⟨r6−gauche
⟩ + b⟨r6
anti
⟩ (1)
a + b = 1 (2)
By assuming an experimental distance of 3.6 A, the interresidueNOE contact is consistent with the presence of a significant pop-ulation the anti rotamer (41%), which is in excellent agreementwith the anti population (46%) derived from the experimen-tal J-coupling analysis (Table III). Thus, the experimental andtheoretically derived J-coupling constants and NOE distancesare all consistent with the Neu5Ac–Gal linkage of GM3 andSLC adopting a mixture of −gauche and anti rotamers, withapproximately 45% to 65% being anti.
Crystallographic data provide a further source of biologi-cally important glycan conformations for comparison with theMD data. Using all structures deposited in the PDB that con-tained carbohydrates with α-Neu5Ac-(2-3)-β-Gal or β-Gal-(1-4)-β-Glc sequences, Ramachandran-style plots of the glycosidiclinkages were generated (Figure 3E and F). Due to the limitednumber of crystallographic examples, it should be noted thatthese maps provide only an indication of accessible glycosidictorsion angles. For the Neu5Ac–Gal linkage, the MD torsionangles sampled similar conformational space to that seen inthe crystal structures (Figure 3A, C, E and Table I). For theGal–Glc linkage, the MD torsions also sampled the two majorPDB conformational clusters, which comprised 99% of the PDBset and corresponded to 100% and 98% of the structures fromthe GM3 and SLC simulations, respectively (Figure 3B, D, F andTable I).
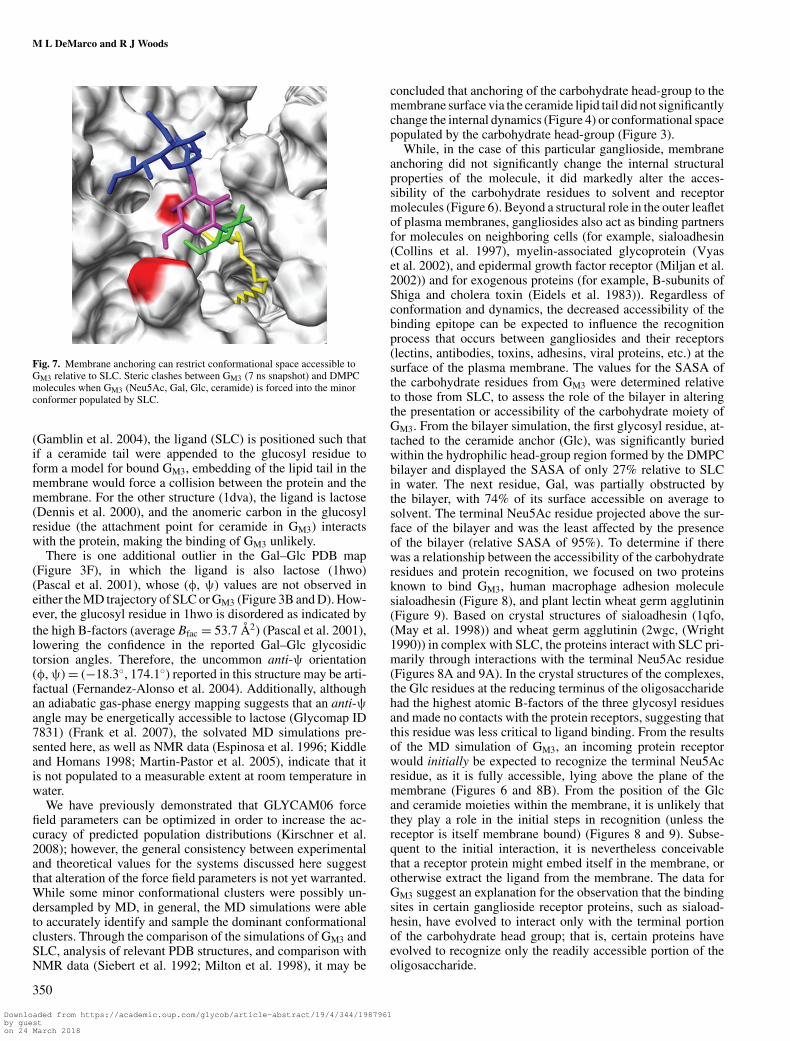
In the simulation of SLC, the Gal–Glc linkage occasionallypopulated a conformational cluster where the φ angle was in theanti rotamer, (φ, ψ) ≈ (170.0◦, 1.3◦) (Table I). This rotamer wasnot observed in the GM3 simulation, but was found in two PDBstructures (1rvt and 1dva) (Table I). In examining the combinedevolution of the φ/ψ-angles for the Neu5Ac–Gal and Gal–Glclinkages from the MD simulation of SLC, we determined thatSLC populated the Gal–Glc anti-φ rotamer as a transition fromcluster A (Gal–Glc (φ, ψ) = (46.5◦, 17.2◦)) to cluster C (Gal–Glc(φ, ψ) = (170.0◦, 1.3◦)), with the Neu5Ac–Gal linkage remain-ing in cluster A (Neu5Ac–Gal (φ, ψ) = (165.3◦, −24.8◦)). Toassess the ability of GM3 to populate the head-group conformerwith Gal–Glc in the anti rotamer, snapshots (at 6, 7, and 15ns) from the MD simulation of GM3 were selected in whichthe head group was in the primary conformation (cluster A) forboth the Neu5Ac–Gal and Gal–Glc linkages. For each struc-ture, the φ angle for the Gal–Glc linkage was rotated (from49◦, 13◦, and 57◦ in the snapshots, respectively) to φ = 180◦.In each case, rotation into the Gal–Glc anti-φ rotamer resultedin minor steric collisions between GM3 and DMPC molecules(Figure 7). While it may be possible to relieve these stericclashes by reorganization of the neighboring DMPC molecules,resistance to this appears to be sufficient to prevent GM3 frompopulating this minor conformer. It is also worth noting that theligands in two protein–carbohydrate complexes discussed above(1rvt and 1dva) were not GM3 and the binding mechanisms havelimited relevance to GM3 recognition. In the structure of 1rvt
349
Downloaded from https://academic.oup.com/glycob/article-abstract/19/4/344/1987961by gueston 24 March 2018
M L DeMarco and R J Woods
Fig. 7. Membrane anchoring can restrict conformational space accessible toGM3 relative to SLC. Steric clashes between GM3 (7 ns snapshot) and DMPCmolecules when GM3 (Neu5Ac, Gal, Glc, ceramide) is forced into the minorconformer populated by SLC.
(Gamblin et al. 2004), the ligand (SLC) is positioned such thatif a ceramide tail were appended to the glucosyl residue toform a model for bound GM3, embedding of the lipid tail in themembrane would force a collision between the protein and themembrane. For the other structure (1dva), the ligand is lactose(Dennis et al. 2000), and the anomeric carbon in the glucosylresidue (the attachment point for ceramide in GM3) interactswith the protein, making the binding of GM3 unlikely.
There is one additional outlier in the Gal–Glc PDB map(Figure 3F), in which the ligand is also lactose (1hwo)(Pascal et al. 2001), whose (φ, ψ) values are not observed ineither the MD trajectory of SLC or GM3 (Figure 3B and D). How-ever, the glucosyl residue in 1hwo is disordered as indicated bythe high B-factors (average Bfac = 53.7 A2) (Pascal et al. 2001),lowering the confidence in the reported Gal–Glc glycosidictorsion angles. Therefore, the uncommon anti-ψ orientation(φ, ψ) = (−18.3◦, 174.1◦) reported in this structure may be arti-factual (Fernandez-Alonso et al. 2004). Additionally, althoughan adiabatic gas-phase energy mapping suggests that an anti-ψangle may be energetically accessible to lactose (Glycomap ID7831) (Frank et al. 2007), the solvated MD simulations pre-sented here, as well as NMR data (Espinosa et al. 1996; Kiddleand Homans 1998; Martin-Pastor et al. 2005), indicate that itis not populated to a measurable extent at room temperature inwater.
We have previously demonstrated that GLYCAM06 forcefield parameters can be optimized in order to increase the ac-curacy of predicted population distributions (Kirschner et al.2008); however, the general consistency between experimentaland theoretical values for the systems discussed here suggestthat alteration of the force field parameters is not yet warranted.While some minor conformational clusters were possibly un-dersampled by MD, in general, the MD simulations were ableto accurately identify and sample the dominant conformationalclusters. Through the comparison of the simulations of GM3 andSLC, analysis of relevant PDB structures, and comparison withNMR data (Siebert et al. 1992; Milton et al. 1998), it may be
concluded that anchoring of the carbohydrate head-group to themembrane surface via the ceramide lipid tail did not significantlychange the internal dynamics (Figure 4) or conformational spacepopulated by the carbohydrate head-group (Figure 3).
While, in the case of this particular ganglioside, membraneanchoring did not significantly change the internal structuralproperties of the molecule, it did markedly alter the acces-sibility of the carbohydrate residues to solvent and receptormolecules (Figure 6). Beyond a structural role in the outer leafletof plasma membranes, gangliosides also act as binding partnersfor molecules on neighboring cells (for example, sialoadhesin(Collins et al. 1997), myelin-associated glycoprotein (Vyaset al. 2002), and epidermal growth factor receptor (Miljan et al.2002)) and for exogenous proteins (for example, B-subunits ofShiga and cholera toxin (Eidels et al. 1983)). Regardless ofconformation and dynamics, the decreased accessibility of thebinding epitope can be expected to influence the recognitionprocess that occurs between gangliosides and their receptors(lectins, antibodies, toxins, adhesins, viral proteins, etc.) at thesurface of the plasma membrane. The values for the SASA ofthe carbohydrate residues from GM3 were determined relativeto those from SLC, to assess the role of the bilayer in alteringthe presentation or accessibility of the carbohydrate moiety ofGM3. From the bilayer simulation, the first glycosyl residue, at-tached to the ceramide anchor (Glc), was significantly buriedwithin the hydrophilic head-group region formed by the DMPCbilayer and displayed the SASA of only 27% relative to SLCin water. The next residue, Gal, was partially obstructed bythe bilayer, with 74% of its surface accessible on average tosolvent. The terminal Neu5Ac residue projected above the sur-face of the bilayer and was the least affected by the presenceof the bilayer (relative SASA of 95%). To determine if therewas a relationship between the accessibility of the carbohydrateresidues and protein recognition, we focused on two proteinsknown to bind GM3, human macrophage adhesion moleculesialoadhesin (Figure 8), and plant lectin wheat germ agglutinin(Figure 9). Based on crystal structures of sialoadhesin (1qfo,(May et al. 1998)) and wheat germ agglutinin (2wgc, (Wright1990)) in complex with SLC, the proteins interact with SLC pri-marily through interactions with the terminal Neu5Ac residue(Figures 8A and 9A). In the crystal structures of the complexes,the Glc residues at the reducing terminus of the oligosaccharidehad the highest atomic B-factors of the three glycosyl residuesand made no contacts with the protein receptors, suggesting thatthis residue was less critical to ligand binding. From the resultsof the MD simulation of GM3, an incoming protein receptorwould initially be expected to recognize the terminal Neu5Acresidue, as it is fully accessible, lying above the plane of themembrane (Figures 6 and 8B). From the position of the Glcand ceramide moieties within the membrane, it is unlikely thatthey play a role in the initial steps in recognition (unless thereceptor is itself membrane bound) (Figures 8 and 9). Subse-quent to the initial interaction, it is nevertheless conceivablethat a receptor protein might embed itself in the membrane, orotherwise extract the ligand from the membrane. The data forGM3 suggest an explanation for the observation that the bindingsites in certain ganglioside receptor proteins, such as siaload-hesin, have evolved to interact only with the terminal portionof the carbohydrate head group; that is, certain proteins haveevolved to recognize only the readily accessible portion of theoligosaccharide.
350
Downloaded from https://academic.oup.com/glycob/article-abstract/19/4/344/1987961by gueston 24 March 2018

Atomic-resolution conformational analysis
Fig. 8. Cellular adhesion. (A) Sialoadhesin-SLC interactions (1qfo). (B) Crystal structure of sialoadhesin–SLC complex (SLC not shown) rigidly docked to asnapshot of the GM3-DMPC bilayer simulation. The amphipathic Glc-ceramide portion of the ganglioside is found within the DMPC bilayer and is aligned with thebilayer’s hydrophilic (light blue) and hydrophobic (gray) regions. Clashes occurring between sialoadhesin and DMPC molecules are shown in magenta.
In addition to the exposed glycosyl residues of gangliosidesregulating recognition, less exposed glycosyl residues can in-directly affect recognition. Rotations about the ceramide–Glcand Glc–Gal linkages determine the presentation of theNeu5Ac–Gal residues with respect to the membrane surface;therefore, alteration to the linkage position or to the anomericconfiguration would affect presentation of the primary recog-nition domain. Furthermore, the hydrophobic ceramide tail incombination with the polar Glc controls the insertion depthof the ganglioside within the membrane, mirroring the amphi-pathic character of the lipids that comprise the bilayer (Figures6B and 8B). This observation is in agreement with a previ-ous study of the cerebroside sulfate glycolipid in liposomes,wherein the composition of the lipid chain length of the ce-ramide residue was varied in order to observe its effects on gly-colipid recognition by a group of antibodies (Crook et al. 1986).That study, as well as others, found a correlation between in-creased acyl chain length of the ceramide (beyond that of thelipids in the membrane-mimicking environment) and improvedantibody-binding of the glycolipid (Alving and Richards 1977;Nudelman et al. 1982), presumably due to the glycolipid beingforced further above the surface of the membrane (Crook et al.1986). In general, membrane-occluded portions of gangliosidesappear to be important determinants of the presentation of theirprotein-binding epitopes (Alving and Richards 1977; Nudelmanet al. 1982; Crook et al. 1986).
In the case of GM3, the terminal and penultimate carbohydrateresidues (Neu5Ac and Gal) play a significant role in binding toprotein receptors such as sialoadhesin and wheat germ agglu-tinin, as they are presented above the surface of the membrane.On the other hand, the residue bound to the ceramide moiety(Glc) is found within the hydrophilic head-group region of themembrane, and along with the hydrophobic ceramide moiety,it may function to control the insertion depth of the ganglio-side within the membrane, as well as the presentation of theoligosaccharide relative to the membrane surface.
Material and methods
Parameter developmentThe GLYCAM06 force field parameters for carbohydrates(Kirschner et al. 2008) and lipids (Tessier et al. 2008) have beenpreviously described and charges and geometries reported forthe DMPC residues. Ensemble averaged atomic partial charges(Basma et al. 2001) were developed for the ceramide tail ofGM3 following the general protocol presented for the GLYCAMextension to lipids (Tessier et al. 2008). Specifically, ten confor-mations of β-Glc-(1-1)-ceramide were generated, based on thecrystal structure of GM3 bound to a lipid transfer protein (2bv7(Airenne et al. 2006)), by rotating heavy-atom torsion angles.The geometries of the 10 distinct structures were then optimized
351
Downloaded from https://academic.oup.com/glycob/article-abstract/19/4/344/1987961by gueston 24 March 2018
M L DeMarco and R J Woods
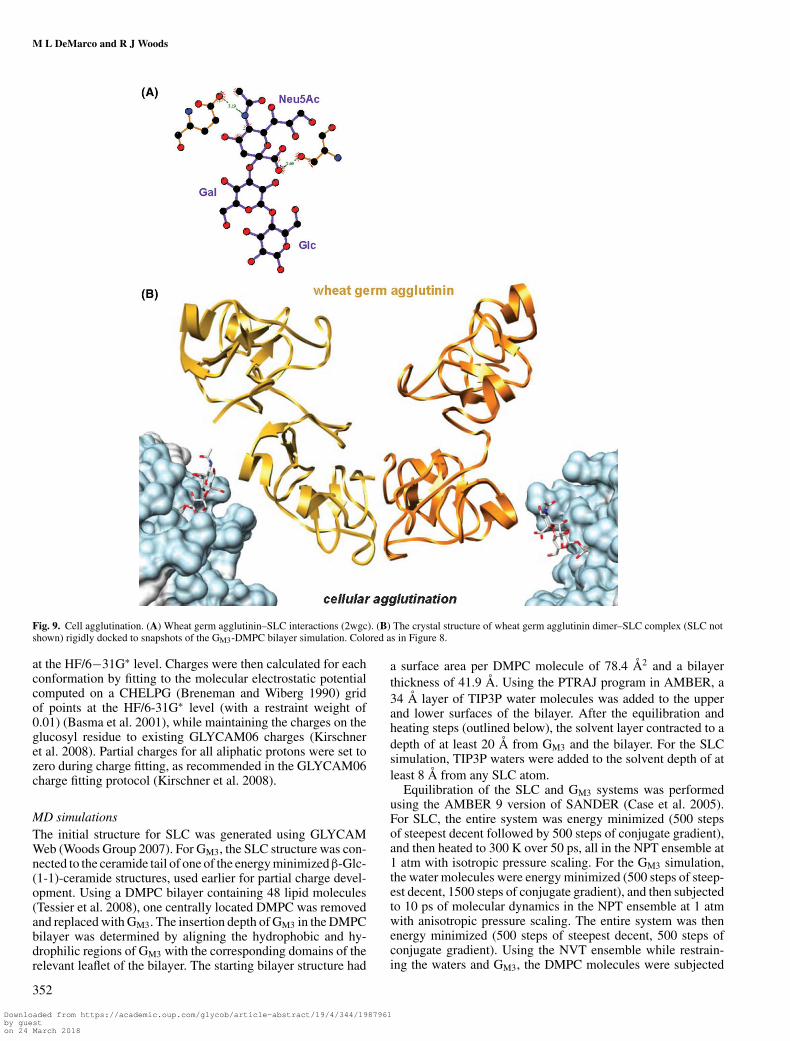
Fig. 9. Cell agglutination. (A) Wheat germ agglutinin–SLC interactions (2wgc). (B) The crystal structure of wheat germ agglutinin dimer–SLC complex (SLC notshown) rigidly docked to snapshots of the GM3-DMPC bilayer simulation. Colored as in Figure 8.
at the HF/6−31G∗ level. Charges were then calculated for eachconformation by fitting to the molecular electrostatic potentialcomputed on a CHELPG (Breneman and Wiberg 1990) gridof points at the HF/6-31G∗ level (with a restraint weight of0.01) (Basma et al. 2001), while maintaining the charges on theglucosyl residue to existing GLYCAM06 charges (Kirschneret al. 2008). Partial charges for all aliphatic protons were set tozero during charge fitting, as recommended in the GLYCAM06charge fitting protocol (Kirschner et al. 2008).
MD simulationsThe initial structure for SLC was generated using GLYCAMWeb (Woods Group 2007). For GM3, the SLC structure was con-nected to the ceramide tail of one of the energy minimized β-Glc-(1-1)-ceramide structures, used earlier for partial charge devel-opment. Using a DMPC bilayer containing 48 lipid molecules(Tessier et al. 2008), one centrally located DMPC was removedand replaced with GM3. The insertion depth of GM3 in the DMPCbilayer was determined by aligning the hydrophobic and hy-drophilic regions of GM3 with the corresponding domains of therelevant leaflet of the bilayer. The starting bilayer structure had
a surface area per DMPC molecule of 78.4 A2 and a bilayerthickness of 41.9 A. Using the PTRAJ program in AMBER, a34 A layer of TIP3P water molecules was added to the upperand lower surfaces of the bilayer. After the equilibration andheating steps (outlined below), the solvent layer contracted to adepth of at least 20 A from GM3 and the bilayer. For the SLCsimulation, TIP3P waters were added to the solvent depth of atleast 8 A from any SLC atom.
Equilibration of the SLC and GM3 systems was performedusing the AMBER 9 version of SANDER (Case et al. 2005).For SLC, the entire system was energy minimized (500 stepsof steepest decent followed by 500 steps of conjugate gradient),and then heated to 300 K over 50 ps, all in the NPT ensemble at1 atm with isotropic pressure scaling. For the GM3 simulation,the water molecules were energy minimized (500 steps of steep-est decent, 1500 steps of conjugate gradient), and then subjectedto 10 ps of molecular dynamics in the NPT ensemble at 1 atmwith anisotropic pressure scaling. The entire system was thenenergy minimized (500 steps of steepest decent, 500 steps ofconjugate gradient). Using the NVT ensemble while restrain-ing the waters and GM3, the DMPC molecules were subjected
352
Downloaded from https://academic.oup.com/glycob/article-abstract/19/4/344/1987961by gueston 24 March 2018

Atomic-resolution conformational analysis
to 5 ps of molecular dynamics. The entire system was thenminimized again for 1000 steps (500 steps of steepest decent,500 steps of conjugate gradient). In the NPT ensemble at 1 atmwith anisotropic pressure scaling, the water molecules were sub-jected to 10 ps of dynamics at 300 K. This step was employedto allow the density of the system to adjust in accordance withthe desired temperature for the production run. Finally, in theNVT ensemble, the entire system was brought to the desiredtemperature of 300 K over 50 ps. Production MD simulationsof SLC and GM3 were then performed for 30 ns at 300 K inthe NPT and NVT ensembles, respectively. Scaling of non-bonded 1–4 van der Waals and electrostatic interactions wasnot employed (SCEE = SCNB = 1), as is standard when usingonly GLYCAM force field parameters. A 2 fs time step wasemployed throughout for integrating the equations of motion.Hydrogen-containing bonds were constrained with the SHAKEalgorithm (Ryckaert et al. 1977) and long-range electrostaticswere treated using the particle mesh Ewald method (Darden et al.1993). Snapshots were collected at 1 ps intervals for subsequentanalysis.
Bilayer analysisThe average bilayer thickness values dl and dhc were calcu-lated using the distance along the bilayer normal (the z-axis) ofthe centers of mass of selected atom(s) from the top and bot-tom leaflets. The overall bilayer thickness (dl) was calculatedusing the center of mass of the N(CH3)3 moiety in the headgroup, and the hydrophobic thickness (dhc) was calculated us-ing the carbon situated at the branch point of the hydrocarbontails.
Conformational analysisSince the GM3-bilayer system required an initial 1 ns of equili-bration time, all subsequent analyses were performed from 1 to30 ns, for both the SLC and GM3 simulations. Scalar 3J-couplingconstants were calculated from snapshots collected at 1 ps inter-vals using the Karplus relationships (3) (Bose et al. 1998) and(4) (Cloran et al. 1999):
3 JCH(θ) = 7.49 cos2 θ − 0.96 cos θ + 0.15 (3)
3 JCC(θ) = 3.70 cos2 θ − 0.18 cos θ + 0.11 (4)
For the ψG (C1-O′4-C′4-C′5) angle, Eq. (5) (Cloran et al. 1999)parameterized specifically for C1-O′4-C′4-C′5 linkages wasemployed:
3 JCC(θ) = 6.17 cos2 θ − 0.51 cos θ + 0.30 (5)
For scatter plots of the glycosidic torsion angles (Figure 3),the NMR definitions of φ and ψ were used, namely for theGal–Glc linkage, φ = H1-C1-O′4-C′4 and ψ = C1-O′4-C′4-H′4, and for the Neu5Ac–Gal linkage, φ = C1-C2-O′3-C′3and ψ = C2-O′3-C′3-H′3. Glycosidic torsions angles were ex-tracted from the PDB using GlyTorsions (Lutteke et al. 2005).To define conformational clusters populated in the trajectories(Table I), low density areas in the scatter plots (Figure 3)were used to define boundaries between populations inφ/ψ-space.
Experimental NOE cross-peak intensities are proportional tothe inverse of the sixth power of the distance between the two in-
teracting protons. Thus, interresidue NOE distances (rMD) werecalculated from the MD simulations as in Eq. (6):
1
r6MD
= a
〈r6A〉 + b
〈r6B〉 + c
〈r6C〉 + . . . (6)
where a, b, and c represent the relative populations and rA, rB,and rC are the proton–proton distances, for the conformationalclusters A, B, and C, respectively.
Ganglioside presentation and recognitionThe NACCESS program was used to compute SASA values,using a 1.4 A probe radius (Hubbard and Thornton 1993). Toobtain a reference value for each glycosyl residue, the all-atomSASA was calculated from the SLC simulation for snapshotsextracted at 10 ps intervals. The following average SASA valueswere determined for each glycosyl residue from SLC: 212.2 ±5.32 A2 (Glc), 156.4 ± 6.90 A2 (Gal), and 395.4 ± 7.11 A2
(Neu5Ac). The average SASAs of the monosaccharides fromGM3 in the lipid bilayer were also collected at 10 ps granularityand were reported as a percent of the average values for SLC freein solution. The standard deviations reported for the reductionsin the average absolute SASA values from SLC to GM3 werecomputed as the square root of the sum of the squares of theindividual values.
For docking of protein–SLC structures to snapshots from theGM3 simulation, GM3 structures with similar glycosidic torsionangles to SLC in the PDB structure were selected, and thenrigidly docked by superimposing the ring atoms of the Neu5Acresidue in the crystal structure with those in the GM3 headgroup. For wheat germ agglutinin (PDB ID: 2wgc) and siaload-hesin (PDB ID: 1qfo), the structures were rigidly docked to the4849 ps and 11 601 ps snapshots, respectively; at these timepoints, the glycosidic torsion angles of GM3 were similar tothose of SLC in the crystal structures. Potential clashes be-tween the protein and the bilayer were identified by searchingfor protein–DMPC nonhydrogen atom contacts within a 3 Aradius.
Molecular graphic images were produced using the UCSFChimera package from the Resource for Biocomputing, Visu-alization, and Informatics at the University of California, SanFrancisco (supported by NIH P41 RR-01081) (Pettersen et al.2004). Figures 8A and 9A were created using Ligplot (Wallaceet al. 1995).
Funding
National Institutes of Health (Grant RR05357) and theGeorgia Research Alliance (Collaborative Planning GrantGRA.VAC08.E).
Conflict of interest statement
None declared.
Abbreviations
DMPC, dimyristoylphosphatidylcholine; DPC, dodecylphos-phocholine; Gal, galactopyranose; Glc, glucopyranose; GM3,
353
Downloaded from https://academic.oup.com/glycob/article-abstract/19/4/344/1987961by gueston 24 March 2018
M L DeMarco and R J Woods
α-Neu5Ac-(2-3)-β-Gal-(1-4)-β-Glc-(1-1)-ceramide; ISPA, iso-lated spin pair approximation; MD, molecular dynamics;Neu5Ac, N-acetylneuraminic acid; NOE, nuclear Overhauserenhancement; PDB, Protein Data Bank; SASA, solvent accessi-ble surface area; SLC, 3′-sialyllactose (α-Neu5Ac-(2-3)-β-Gal-(1-4)-β-Glc).
References
Airenne TT, Kidron H, Nymalm Y, Nylund M, West G, Mattjus P, Salminen TA.2006. Structural evidence for adaptive ligand binding of glycolipid transferprotein. J Mol Biol. 355:224.
Alving CR, Richards RL. 1977. Immune reactivities of antibodies against glycol-ipids: I. Properties of anti-galactocerebroside antibodies purified by a noveltechnique of affinity binding to liposomes. Immunochemistry. 14:373–381.
Ariga T, Yoshida T, Mimori T, Yu RK. 1991. Autoantibodies against Forss-man glycolipids in Graves’ disease and Hashimoto’s thyroiditis. Clin ExpImmunol. 86:483–488.
Aubin Y, Ito Y, Paulson JC, Prestegard JH. 1993. Structure and dynamics ofthe sialic acid moiety of GM3-ganglioside at the surface of a magneticallyoriented membrane. Biochemistry. 32:13405–13413.
Basma M, Sundara S, Calgan D, Vernali T, Woods RJ. 2001. Solvated ensembleaveraging in the calculation of partial atomic charges. J Comput Chem.22:1125–1137.
Booth H, Khedhair KA. 1985. Endo-anomeric and exo-anomeric effects in 2-substituted tetrahydropyrans. J Chem Soc, Chem Commun. 467–468.
Bose B, Zhao S, Stenutz R, Cloran F, Bondo PB, Bondo G, Hertz B, CarmichaelI, Serianni AS. 1998. Three-bond C-O-C-C spin-coupling constants incarbohydrates: Development of a Karplus relationship. J Am Chem Soc.120:11158–11173.
Breneman CM, Wiberg KB. 1990. Determining atom-centered monopoles frommolecular electrostatic potentials – The need for high sampling density informamide conformational-analysis. J Comput Chem. 11:361–373.
Case DA, Cheatham TE 3rd, Darden T, Gohlke H, Luo R, Merz KM Jr, OnufrievA, Simmerling C, Wang B, Woods RJ. 2005. The Amber biomolecularsimulation programs. J Comput Chem. 26:1668–1688.
Cloran F, Carmichael I, Serianni AS. 1999. Density functional calcula-tions on disaccharide mimics: Studies of molecular geometries andtrans-O-glycosidic 3JCOCH and 3JCOCC spin-couplings. J Am Chem Soc.121:9843–9851.
Collins BE, Kiso M, Hasegawa A, Tropak MB, Roder JC, Crocker PR, SchnaarRL. 1997. Binding specificities of the sialoadhesin family of I-type lectins.Sialic acid linkage and substructure requirements for binding of myelin-associated glycoprotein, Schwann cell myelin protein, and sialoadhesin.J Biol Chem. 272:16889–16895.
Crook SJ, Boggs JM, Vistnes AI, Koshy KM. 1986. Factors affecting sur-face expression of glycolipids: Influence of lipid environment and ceramidecomposition on antibody recognition of cerebroside sulfate in liposomes.Biochemistry. 25:7488–7494.
Darden T, York D, Pedersen L. 1993. Particle mesh Ewald – An N.Log(N)method for Ewald sums in large systems. J Chem Phys. 98:10089–10092.
Degroote S, Wolthoorn J, van Meer G. 2004. The cell biology of glycosphin-golipids. Semin Cell Dev Biol. 15:375.
DeMarco ML, Woods RJ. 2008. Structural glycobiology: A game of snakes andladders. Glycobiology. 18:426–440.
Dennis MS, Eigenbrot C, Skelton NJ, Ultsch MH, Santell L, Dwyer MA,O’Connell MP, Lazarus RA. 2000. Peptide exosite inhibitors of factor VIIaas anticoagulants. Nature. 404:465.
Eidels L, Proia RL, Hart DA. 1983. Membrane receptors for bacterial toxins.Microbiol Rev. 47:596–620.
Endo T, Scott DD, Stewart SS, Kundu SK, Marcus DM. 1984. Antibodies toglycosphingolipids in patients with multiple sclerosis and SLE. J Immunol.132:1793–1797.
Espinosa JF, Canada FJ, Asensio JL, Martin-Pastor M, Dietrich H, Martin-Lomas M, Schmidt RR, Jimenez-Barbaro J. 1996. Experimental evidenceof conformational differences between C-glycosides and O-glycosides insolution and in the protein-bound state: The C-lactose/O-lactose case. J AmChem Soc. 118:10862–10871.
Fernandez-Alonso MD, Canada FJ, Solis D, Cheng XH, Kumaran G, Andre S,Siebert HC, Mootoo DR, Gabius HJ, Jimenez-Barbero J. 2004. Computa-
tional and experimental NMR definition of differences in the conformationalbehavior of free and lectin-bound glycomimetic aza/carba-lactosides. Eur JOrg Chem. 1604–1613.
Frank M, Lutteke T, von der Lieth CW. 2007. GlycoMapsDB: A database of theaccessible conformational space of glycosidic linkages. Nucleic Acids Res.35:D287–D290.
Gamblin SJ, Haire LF, Russell RJ, Stevens DJ, Xiao B, Ha Y, Vasisht N,Steinhauer DA, Daniels RS, Elliot A, et al. 2004. The structure and receptorbinding properties of the 1918 influenza hemagglutinin. Science. 303:1838–1842.
Garofalo T, Misasi R, Mattei V, Giammarioli AM, Malorni W, Pontieri GM,Pavan A, Sorice M. 2003. Association of the death-inducing signalingcomplex with microdomains after triggering through CD95/Fas. Evidencefor caspase-8-ganglioside interaction in T cells. J Biol Chem. 278:8309–8315.
Gonzalez-Outeirino J, Kirschner KN, Thobhani S, Woods RJ. 2006. Reconcilingsolvent effects on rotamer populations in carbohydrates – A joint MD andNMR analysis. Can J Chem. 84:569–579.
Guo C-T, Nakagomi O, Mochizuki M, Ishida H, Kiso M, Ohta Y, Suzuki T,Miyamoto D, Hidari RIPJ, Suzuki Y. 1999. Ganglioside GM1a on the cellsurface is involved in the infection by human rotavirus KUN and MO strains.J Biochem. 126:683–688.
Hakomori S. 1984. Tumor-associated carbohydrate antigens. Annu Rev Im-munol. 2:103–126.
Hansson HA, Holmgren J, Svennerholm L. 1977. Ultrastructural localization ofcell membrane GM1 ganglioside by cholera toxin. Proc Natl Acad Sci USA.74:3782–3786.
Hubbard SJ, Thornton JM. 1993. ‘NACCESS’, Computer Program, Departmentof Biochemistry and Molecular Biology, University College of London.
Hug P, Lin HM, Korte T, Xiao X, Dimitrov DS, Wang JM, Puri A, BlumenthalR. 2000. Glycosphingolipids promote entry of a broad range of human im-munodeficiency virus type 1 isolates into cell lines expressing CD4, CXCR4,and/or CCR5. J Virol. 74:6377–6385.
Hughes RA, Cornblath DR. 2005. Guillain–Barre syndrome. Lancet.366:1653–1666.
Kasahara K, Sanai Y. 1999. Possible roles of glycosphingolipids in lipid rafts.Biophys Chem. 82:121.
Keepers JW, James TL. 1984. A theoretical study of distance determinationsfrom NMR – Two-dimensional nuclear Overhauser effect spectra. J MagnReson. 57:404–426.
Kiddle GR, Homans SW. 1998. Residual dipolar couplings as new conforma-tional restraints in isotopically 13C-enriched oligosaccharides. FEBS Lett.436:128.
Kirschner KN, Yongye AB, Tschampel SM, Gonzalez-Outeirino J, Daniels CR,Foley BL, Woods RJ. 2008. GLYCAM06: A generalizable biomolecularforce field. Carbohydrates. J Comput Chem. 29:622–655.
Lutteke T, Frank M, von der Lieth C-W. 2005. Carbohydrate structure suite(CSS): Analysis of carbohydrate 3D structures derived from the PDB. NuclAcids Res. 33:D242–D246.
Martin-Pastor M, Canales A, Corzana F, Asensio JL, Jimenez-Barbaro J. 2005.Limited flexibility of lactose detected from residual dipolar couplings usingmolecular dynamics simulations and steric alignment methods. J Am ChemSoc. 127:3589–3595.
May AP, Robinson RC, Vinson M, Crocker PR, Jones EY. 1998. Crystal struc-ture of the N-terminal domain of sialoadhesin in complex with 3′ sialyllac-tose at 1.85 A resolution. Mol Cell. 1:719.
Miljan EA, Meuillet EJ, Mania-Farnell B, George D, Yamamoto H, Simon H-G,Bremer EG. 2002. Interaction of the extracellular domain of the epidermalgrowth factor receptor with gangliosides. J Biol Chem. 277:10108–10113.
Milton MJ, Harris R, Probert MA, Field RA, Homans SW. 1998. New confor-mational constraints in isotopically (13C) enriched oligosaccharides. Glyco-biology. 8:147–153.
Misasi R, Dionisi S, Farilla L, Carabba B, Lenti L, Mario UD, Dotta F.1997. Gangliosides and autoimmune diabetes. Diabetes/Metabolism re-views. 13:163–179.
Nudelman E, Hakomori S, Kannagi R, Levery S, Yeh MY, Hellstrom KE,Hellstrom I. 1982. Characterization of a human melanoma-associated gan-glioside antigen defined by a monoclonal antibody, 4.2. J Biol Chem.257:12752–12756.
Parton RG. 1994. Ultrastructural localization of gangliosides; GM1 is concen-trated in caveolae. J Histochem Cytochem. 42:155–166.
Pascal JM, Day PJ, Monzingo AF, Ernst SR, Robertus JD, Iglesias R, Perez Y,Ferreras JM, Citores L, Girbes T. 2001. 2.8-A crystal structure of a nontoxictype-II ribosome-inactivating protein, ebulin l. Proteins. 43:319–326.
354
Downloaded from https://academic.oup.com/glycob/article-abstract/19/4/344/1987961by gueston 24 March 2018
Atomic-resolution conformational analysis
Pettersen EF, Goddard TD, Huang CC, Couch GS, Greenblatt DM,Meng EC, Ferrin TE. 2004. UCSF Chimera – A visualization sys-tem for exploratory research and analysis. J Comput Chem. 25:1605–1612.
Poveda A, Asensio JL, Polat T, Bazin H, Linhardt RJ, Jimenez-Barbero J.2000. Conformational behavior of C-glycosyl analogues of sialyl-a-(2-3)-galactose. Eur J Org Chem. 2000:1805–1813.
Rand RP, Parsegian VA. 1989. Hydration forces between phospholipid bilayers.Biochim Biophys Acta Rev Biomembr. 988:351.
Ryckaert JP, Ciccotti G, Berendsen HJC. 1977. Numerical-integration of carte-sian equations of motion of a system with constraints – Molecular-dynamicsof N-alkanes. J Comput Phys. 23:327–341.
Sato T, Serizawa T, Okahata Y. 1996. Binding of influenza A virus to monosialo-ganglioside (GM3) reconstituted in glucosylceramide and sphingomyelinmembranes. Biochim Biophys Acta Biomembr. 1285:14.
Sharon N. 2006. Carbohydrates as future anti-adhesion drugs for infectiousdiseases. Biochim Biophys Acta Gen Subj. 1760:527.
Siebert HC, Reuter G, Schauer R, von der Lieth CW, Dabrowski J. 1992.Solution conformations of GM3 gangliosides containing different sialicacid residues as revealed by NOE-based distance mapping, molecularmechanics, and molecular dynamics calculations. Biochemistry. 31:6962–6971.
Simons K, Ikonen E. 1997. Functional rafts in cell membranes. Nature. 387:569.Sorice M, Garofalo T, Misasi R, Dolo V, Lucania G, Sansolini T, Parolini I,
Sargiacomo M, Torrisi MR, Pavan A. 1999. Glycosphingolipid domains oncell plasma membrane. Biosci Rep. 19:197–208.
Suzuki Y, Nakao T, Ito T, Watanabe N, Toda Y, Guiyun X, Suzuki T, KobayashiT, Kimura Y, et al. 1992. Structural determination of gangliosides that bind
to influenza A, B, and C viruses by an improved binding assay: Strain-specific receptor epitopes in sialo-sugar chains. Virology. 189:121.
Tessier MB, DeMarco ML, Yongye A, Woods RJ. 2008. Extension of the GLY-CAM06 biomolecular force field to lipids, lipid bilayers and glycolipids.Mol Simul. 34:349–364.
Todeschini AR, Hakomori S-i. 2008. Functional role of glycosphingolipidsand gangliosides in control of cell adhesion, motility, and growth, throughglycosynaptic microdomains. Biochim Biophys Acta. 1780:421.
Vyas AA, Patel HV, Fromholt SE, Heffer-Lauc M, Vyas KA, Dang J, SchachnerM, Schnaar RL. 2002. Gangliosides are functional nerve cell ligands formyelin-associated glycoprotein (MAG), an inhibitor of nerve regeneration.Proc Natl Acad Sci USA. 99:8412–8417.
Wallace AC, Laskowski RA, Thornton JM. 1995. Ligplot – A program togenerate schematic diagrams of protein ligand interactions. Protein Eng.8:127–134.
Wolfe S, Whangbo MH, Mitchell DJ. 1979. On the magnitudes and origins ofthe ‘anomeric effects’, ‘exo-anomeric effects’, ‘reverse anomeric effects’,and C-X and C-Y bond lengths in XCH2YH molecules. Carbohydr Res.69:1–26.
Woods Group. 2005–2008. GLYCAM Web. Complex Carbohydrate ResearchCenter, University of Georgia, Athens, GA. (http://www.glycam.com)
Wright CS. 1990. 2.2 A resolution structure analysis of two refinedN-acetylneuraminyl-lactose–wheat germ agglutinin isolectin complexes.J Mol Biol. 215:635.
Yuan P, Thompson TB, Wurzburg BA, Paterson RG, Lamb RA, JardetzkyTS. 2005. Structural studies of the parainfluenza virus 5 hemagglutinin-neuraminidase tetramer in complex with its receptor, sialyllactose. Structure.13:803–815.
355
Downloaded from https://academic.oup.com/glycob/article-abstract/19/4/344/1987961by gueston 24 March 2018