does import protection discourage exports? · the model contains five sectors: two export goods,...
TRANSCRIPT
WP/06/20
Does Import Protection Discourage Exports?
Stephen Tokarick


© 2006 International Monetary Fund WP/06/20
IMF Working Paper
Research Department
Does Import Protection Discourage Exports?
Prepared by Stephen Tokarick1
Authorized for distribution by Kalpana Kochhar
January 2006
Abstract
This Working Paper should not be reported as representing the views of the IMF. The views expressed in this Working Paper are those of the author(s) and do not necessarily represent those of the IMF or IMF policy. Working Papers describe research in progress by the author(s) and are published to elicit comments and to further debate.
This paper points out that while many developing countries seek to increase their export earnings, they have not embraced fully the notion that their own pattern of import protection hurts their export performance. The paper quantifies the extent to which import protection acts as a tax on a country’s export sector and finds that for many developing countries, the magnitude of the implicit tax is substantial—about 12 percent, on average, for the countries studied. The paper also illustrates the effects of various tariff-cutting scenarios in the Doha Round on export incentives and concludes that, in general, developing countries could increase their export earnings by reducing their own import tariffs, but countries must be careful about how these tariff reductions are achieved. For example, tariff-cutting schemes that exempt certain sectors could actually be harmful. JEL Classification Numbers: F13, C68 Keywords: Tariffs, export tax, welfare, restrictiveness Author(s) E-Mail Address: [email protected]
1 Prepared by Stephen Tokarick, Senior Economist, Research Department, International Monetary Fund. Carlos Ludena, Purdue University, provided Tables 3 and 7. This paper has benefited from comments by Mary Amiti, Olivia Armengol, Kalpana Kochhar, Hans-Peter Lankes, Will Martin, Phil McCalman, Doug Nelson, Raghuram Rajan, Shang-Jin Wei, Yi Wu, and Yongzheng Yang.
- 2 -
Contents Page
I. Introduction ............................................................................................................................3
II. Channels Through Which Tariffs Act as a Tax on Exports ..................................................3 A. Effects on Relative Prices of Goods .........................................................................3 B. Tariffs and Cost of Inputs..........................................................................................4 C. Evidence From Existing Studies ...............................................................................5
III. Quantifying Export Disincentives That Arise from Import Tariffs in Developing Countries ........................................................................................................................6 A. Estimates of Export-Tax Equivalents .......................................................................7 B. Role of Nontariff Barriers in Influencing Export Disincentives ...............................7 C. Effects of Rich-Country Barriers Against Developing Country Exports..................9
IV. Tariff Cuts in Doha Round and Effects on Export Incentives...........................................10
V. Conclusions.........................................................................................................................15 References……………………………………………………………………………………24 Tables 1. Effective Rates of Protection or “Cost Penalties” Facing Exports in Four Selected
Countries……...……………………………………………….………………………...5 2. Export-Tax Equivalents of Import Tariffs in Selected Developing Countries……...…..8 3. Export-Tax Equivalents of Tariff Barriers Applied by Both Rich and Developing
Countries on the Real Income of Developing Countries……………………………… 10 4. Effects of Alternative Tariff-Cutting Formulas on Export Disincentives…………….. 11 5. Effects of Alternative Tariff-Cutting Formulas on Export Values by Country……….. 13 6. Importance of Imported Intermediate Input Costs for Each Sector…………………… 14 7. Effects of Tariff Elimination by Both Rich and Developing Countries on Developing Country Exports………………………………………………………….. 15 Appendixes I. Symmetry Between Import Tariffs and Export Taxes…………………………....……17 II. Summary of Previous Work on Quantifying the Disincentive to Export Introduced by Import Tariffs…..………………………………………………………………………………18 III. Methodology Used to Compute Export-Tax Equivalents……………………………... 20
- 3 -
I. INTRODUCTION
The purpose of this paper is to demonstrate that a country’s own pattern of import protection—its tariff structure—acts as a tax on its export sector and, thus, frustrates its goal of increasing export earnings.
• Developing countries frequently complain that barriers (e.g., tariffs) applied against
their exports in rich-country markets make it difficult for them to increase their export earnings. However, developing countries have not fully embraced the notion that their own pattern of import protection may be retarding their export performance.
• Tariff reductions work as an “export-promotion” strategy—a strategy that developing countries could pursue independent of the policy stance of rich countries. That is, reducing their import restrictions is a policy option that developing countries could implement to improve incentives to export.
The major findings presented in this paper are the following:
• Import tariffs in many developing countries hamper their ability to export. For the 26 developing countries studied in this paper, import tariffs are equivalent to about a 12½ percent tax on a country’s exports, on average, while 7 countries had export-tax equivalents in excess of 16 percent and 4 had export-tax equivalents in excess of 25 percent. Taking into account nontariff barriers is likely to raise this average rate of taxation.
• Tariff barriers in many developing countries discourage their exports to a greater extent than rich-country tariffs. Certainly, tariffs applied by industrial countries reduce exports from developing countries, but developing countries’ own tariff (and nontariff) barriers introduce quantitatively larger export disincentives.
• Tariff reductions would increase exports, but whether they raise real income depends on how the reductions are structured. The simulations demonstrate that selective tariff reductions in which high-tariff sectors are exempt from cuts may actually leave some countries worse off, even although exports increase.
II. CHANNELS THROUGH WHICH TARIFFS ACT AS A TAX ON EXPORTS
A. Effects on Relative Prices of Goods
Tariffs on imports create a disincentive to export by directly raising the domestic price of imports relative to exports, or equivalently, by reducing the price of exports relative to imports. As shown by Lerner (1936), there exists a symmetry, or an equivalence, between the effects of an import tariff and an export tax on domestic relative prices, and

- 4 -
Appendix I reviews the logic in detail. Appendix I also provides a simple equation that shows how to calculate the export-tax equivalent of an import tariff.
Import tariffs also indirectly alter the price of exports relative to the prices of goods produced solely for the domestic market—nontraded or home goods. Since a tariff raises the price of imports, consumers have an incentive to shift consumption away from the more expensive imports toward home goods, which will raise the price of home goods if these two types of goods are substitutes. Thus, a tariff on imports will reduce the price of exports relative to nontraded goods in this case. This appreciation in the real exchange rate would shift production away from exports and toward nontraded goods.
Import tariffs can also affect a country’s ability to export by altering the prices of primary factor inputs—wages and rentals on capital. For example, if the production of imports in many developing countries requires relatively larger amounts of capital than labor, then a higher tariff would raise the rental rate on capital. If capital is mobile across all sectors of the economy, the higher rental rate on capital would be spread across all sectors, which, by itself, would raise costs of production in the export sector and reduce output. It is also true that in this example, a tariff will reduce the wage rate, so the extent to which a tariff affects factor costs in a sector depends on how intensively that sector uses various factors of production.
B. Tariffs and Cost of Inputs
Tariffs and other import barriers discourage exports by raising the price of imported and domestic intermediate inputs used by exporters, other things constant. For a given price of exports, tariffs on imported intermediate inputs increase the cost of producing goods for export and therefore, will reduce output of exportables.2 The World Bank (2004) presents estimates of the “cost penalties” or effective rates of protection (Table 1), that apply to various export sectors in four countries (Brazil, China, India, and Malawi) for 1986 and 1997. As Table 1 shows, although tariff reductions on imports in each of these countries have lessened the bias against exports, it still remains high in certain sectors. Ironically, these are often the very sectors that policymakers would like to promote. In particular: • In 1986, import tariffs imposed a significant tax on exports in all four countries,
especially in the agricultural processing sectors.
2 Tariffs result in negative rates of effective protection for exports because the nominal rate of protection applied to their output is zero, while the protection applied to inputs (imported intermediate goods) is positive. The effective rate of protection is calculated by taking the tariff rate on final output of a given sector and subtracting the sum of tariffs applied to intermediate inputs weighted by the share of inputs in total costs.

- 5 -
• Given the large tariff reductions that occurred between 1986 and 1997, the implicit tax on exports declined in each country and sector, but remains high in agricultural processing and manufacturing.
Duty-drawback schemes, which provide a rebate to exporters for the tariff duties paid on imported intermediate inputs, often do not remove the bias against exports completely. The reasons for this are: (i) these schemes can be costly to administer; (ii) a drawback reduces government revenue when it is introduced, so other distorting taxes would have to be increased, which themselves, might discourage exports; and (iii) drawbacks do not reverse the decline in the relative price of exports or the higher price of domestic inputs as a result of a higher tariff.
Table 1. Effective Rates of Protection or “Cost Penalties” Facing
Exports in Four Selected Countries (percentage change in value added as a result of tariffs)
Brazil China India Malawi 1986 1997 1986 1997 1986 1997 1986 1997 Agriculture -43 -5 -28 -15 -14 -5 -9 -7 Agricultural processing
-83
-28
-72
-54
-64
-39
-20
-16
Resources -45 -6 -14 -7 -9 -3 -6 -5 Labor-intensive manufacturing
-72
-17
-54
-35
-45
-23
-18
-15
Capital-intensive manufacturing
-79
-22
-46
-28
-60
-35
-11
-9
Services -31 -3 -26 -14 -16 -6 -5 -4 Source: World Bank, Global Economic Prospects, 2004, pp. 77.
C. Evidence From Existing Studies
A number of studies have found that the magnitude of the anti-export bias from tariffs can be quite large. See Appendix II for a summary of the findings from some recent studies. The major themes that emerge from past work are:
• Protection of manufacturing sectors in developing countries resulted in a substantial
bias against agricultural exports. In some cases, the indirect taxation of agriculture resulting from import protection was far greater than the amount of direct protection applied to manufactured goods and exceeded the negative effects of exchange rate overvaluation.
• Clements and Sjaastad (1984) found that a substantial fraction of import protection is borne by exporters in developing countries through a decline in the price of exportables relative to home goods. In some countries (e.g. Malaysia), the anti-export bias that arises from tariffs can outweigh the direct assistance provided to exporters, resulting in net taxation of exports.

- 6 -
As existing studies use somewhat outdated information and are limited in country coverage, the present paper assesses how import protection discourages exports for twenty-six developing countries using a dataset that contains the most recent information available. This study also uses an internally consistent modeling methodology that takes into account complex interactions within an economy. In comparison, some of the previous studies did not use models that took into account all the channels through which import protection affects exports.
III. QUANTIFYING EXPORT DISINCENTIVES THAT ARISE FROM
IMPORT TARIFFS IN DEVELOPING COUNTRIES
This section reports estimates of export-tax equivalents of tariff distortions in twenty- six developing countries for 2001. The model contains five sectors: two export goods, two import goods, and a good that is not traded internationally. One of the import and export sectors represents primary products (agriculture and natural resources) while the other consists of imports and exports of different manufactured products. Appendix III contains a detailed description of the methodology used. To arrive at the export-tax equivalents, a considerable amount of data is required on a country basis, such as the amounts of intermediate inputs (both imported and domestic) used on a sectoral basis. These export-tax equivalents are estimated based on the current levels of applied tariff rates in the countries considered. The choice of the twenty-six countries was based on the availability of detailed data and on the levels of per-capita GDP. Except for five countries (Argentina, Botswana, Malaysia, Singapore, and Uruguay) all countries chosen had a per-capita GDP in 2001 less than US$3000 per year and eleven had per-capita GDPs of less than US$1000 per year.
Two concepts of the export-tax equivalent are computed: one that would leave the economy as well off as it is under its current structure of tariffs and one that keeps export volumes constant.3 Each country for which a uniform export-tax equivalent is computed is assumed to be “small” in world markets, that is, changes in tariffs in each of these countries are assumed to have no effect on world prices of the affected products.4
3 The literature has established that the export tax rate that keeps export volume constant cannot be higher than the one that keeps real income constant. The reason for this is that in moving to a uniform export tax rate, some rates need to be reduced, while others need to be raised. The gain in real income gain from reducing the high rate, however, exceeds the loss from raising the low rate by the same amount.
4 This assumption rules out the possibility that countries may exploit possible monopoly power in trade by enacting an optimal tariff.
- 7 -
A. Estimates of Export-Tax Equivalents
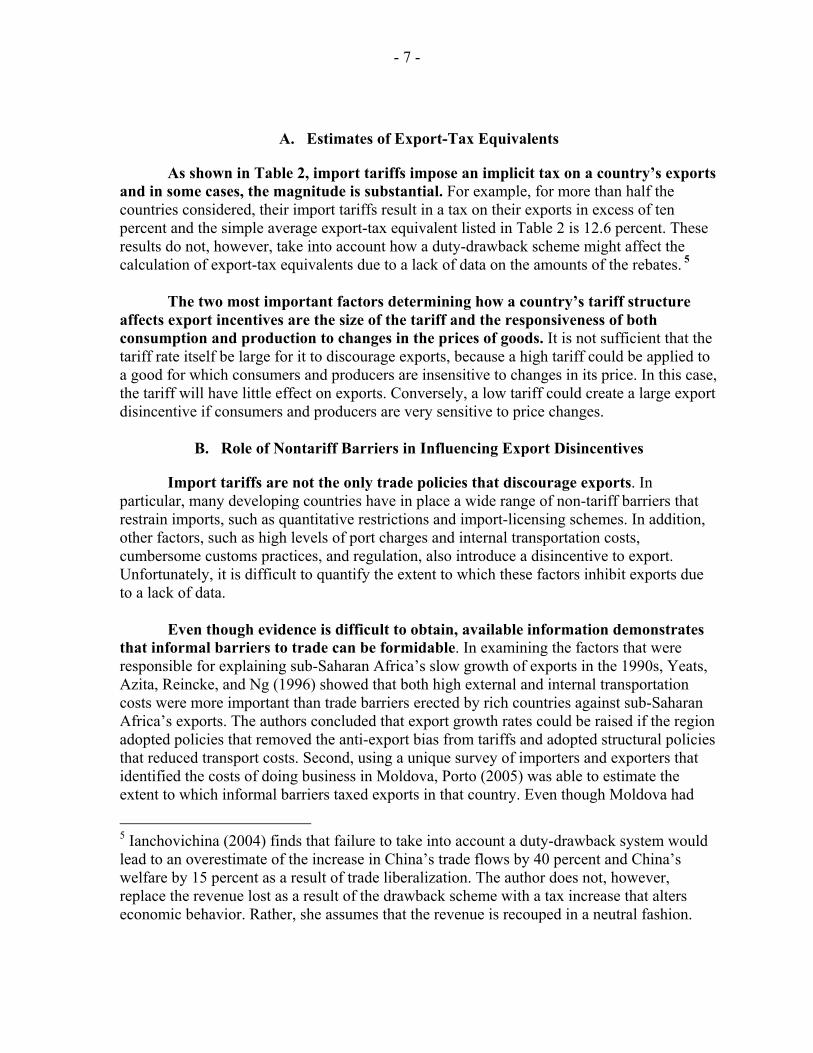
As shown in Table 2, import tariffs impose an implicit tax on a country’s exports and in some cases, the magnitude is substantial. For example, for more than half the countries considered, their import tariffs result in a tax on their exports in excess of ten percent and the simple average export-tax equivalent listed in Table 2 is 12.6 percent. These results do not, however, take into account how a duty-drawback scheme might affect the calculation of export-tax equivalents due to a lack of data on the amounts of the rebates. 5
The two most important factors determining how a country’s tariff structure affects export incentives are the size of the tariff and the responsiveness of both consumption and production to changes in the prices of goods. It is not sufficient that the tariff rate itself be large for it to discourage exports, because a high tariff could be applied to a good for which consumers and producers are insensitive to changes in its price. In this case, the tariff will have little effect on exports. Conversely, a low tariff could create a large export disincentive if consumers and producers are very sensitive to price changes.
B. Role of Nontariff Barriers in Influencing Export Disincentives
Import tariffs are not the only trade policies that discourage exports. In particular, many developing countries have in place a wide range of non-tariff barriers that restrain imports, such as quantitative restrictions and import-licensing schemes. In addition, other factors, such as high levels of port charges and internal transportation costs, cumbersome customs practices, and regulation, also introduce a disincentive to export. Unfortunately, it is difficult to quantify the extent to which these factors inhibit exports due to a lack of data.
Even though evidence is difficult to obtain, available information demonstrates
that informal barriers to trade can be formidable. In examining the factors that were responsible for explaining sub-Saharan Africa’s slow growth of exports in the 1990s, Yeats, Azita, Reincke, and Ng (1996) showed that both high external and internal transportation costs were more important than trade barriers erected by rich countries against sub-Saharan Africa’s exports. The authors concluded that export growth rates could be raised if the region adopted policies that removed the anti-export bias from tariffs and adopted structural policies that reduced transport costs. Second, using a unique survey of importers and exporters that identified the costs of doing business in Moldova, Porto (2005) was able to estimate the extent to which informal barriers taxed exports in that country. Even though Moldova had
5 Ianchovichina (2004) finds that failure to take into account a duty-drawback system would lead to an overestimate of the increase in China’s trade flows by 40 percent and China’s welfare by 15 percent as a result of trade liberalization. The author does not, however, replace the revenue lost as a result of the drawback scheme with a tax increase that alters economic behavior. Rather, she assumes that the revenue is recouped in a neutral fashion.

- 8 -
low formal barriers to trade (e.g. an average import tariff of 5.2 percent in 2002), its informal barriers were equivalent to a tax on exports of around 25 percent. His results showed that reducing these costs would result in a substantial reduction in poverty in Moldova.
Table 2. Export-Tax Equivalents of Import Tariffs in Selected Developing Countries
(based on data for 2001) Export-Tax Equivalents of Tariff Barriers (Rates in percent) Country Real income constant Export volume constant Tunisia 33.6 26.6 India 31.0 28.5 Morocco 26.7 25.6 Egypt 26.2 15.8 Romania 18.4 10.1 Bangladesh 18.2 16.3 Thailand 16.5 11.5 Tanzania 14.1 13.2 Vietnam 1/ 12.7 12.6 China 12.1 12.0 Peru 10.9 10.4 Mozambique 10.8 9.6 Sri Lanka 10.4 8.1 Malawi 9.8 9.8 Philippines 9.7 5.4 Albania 9.4 9.3 Colombia 9.3 9.1 Zambia 8.6 8.4 Brazil 8.1 7.9 Argentina 8.0 8.0 South Africa 6.2 6.1 Uruguay 5.5 5.3 Malaysia 5.0 4.4 Botswana 3.7 3.3 Madagascar 3.6 3.6 Singapore 0.0 0.0 Source: Author’s calculations. 1/ Not a member of the World Trade Organization (WTO).
Simulations demonstrate that the inclusion of nontariff barriers (NTBs) would
worsen export disincentives. Export-tax equivalents of both tariffs and NTBs were calculated by treating NTBs as if they were equivalent to a tariff of a given magnitude and Kee, Nicita, and Olarreaga (2004) provide estimates of the ad-valorem tariff equivalents (AVEs) of NTBs for a large number of countries. Using these, along with tariff rates themselves, export-tax equivalents of tariffs and NTBs were computed for two countries (Tunisia and Tanzania) as an illustration and were compared to the export-tax equivalents of
- 9 -
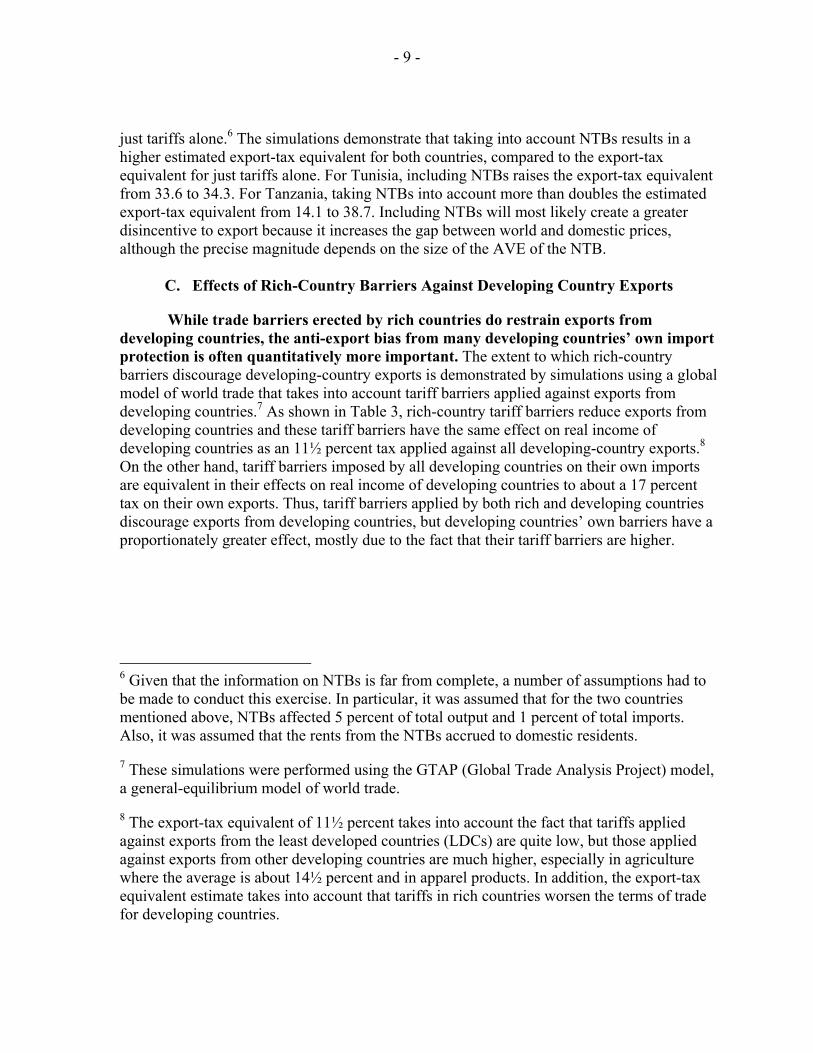
just tariffs alone.6 The simulations demonstrate that taking into account NTBs results in a higher estimated export-tax equivalent for both countries, compared to the export-tax equivalent for just tariffs alone. For Tunisia, including NTBs raises the export-tax equivalent from 33.6 to 34.3. For Tanzania, taking NTBs into account more than doubles the estimated export-tax equivalent from 14.1 to 38.7. Including NTBs will most likely create a greater disincentive to export because it increases the gap between world and domestic prices, although the precise magnitude depends on the size of the AVE of the NTB.
C. Effects of Rich-Country Barriers Against Developing Country Exports
While trade barriers erected by rich countries do restrain exports from developing countries, the anti-export bias from many developing countries’ own import protection is often quantitatively more important. The extent to which rich-country barriers discourage developing-country exports is demonstrated by simulations using a global model of world trade that takes into account tariff barriers applied against exports from developing countries.7 As shown in Table 3, rich-country tariff barriers reduce exports from developing countries and these tariff barriers have the same effect on real income of developing countries as an 11½ percent tax applied against all developing-country exports.8 On the other hand, tariff barriers imposed by all developing countries on their own imports are equivalent in their effects on real income of developing countries to about a 17 percent tax on their own exports. Thus, tariff barriers applied by both rich and developing countries discourage exports from developing countries, but developing countries’ own barriers have a proportionately greater effect, mostly due to the fact that their tariff barriers are higher.
6 Given that the information on NTBs is far from complete, a number of assumptions had to be made to conduct this exercise. In particular, it was assumed that for the two countries mentioned above, NTBs affected 5 percent of total output and 1 percent of total imports. Also, it was assumed that the rents from the NTBs accrued to domestic residents.
7 These simulations were performed using the GTAP (Global Trade Analysis Project) model, a general-equilibrium model of world trade.
8 The export-tax equivalent of 11½ percent takes into account the fact that tariffs applied against exports from the least developed countries (LDCs) are quite low, but those applied against exports from other developing countries are much higher, especially in agriculture where the average is about 14½ percent and in apparel products. In addition, the export-tax equivalent estimate takes into account that tariffs in rich countries worsen the terms of trade for developing countries.

- 10 -
Table 3. Export-Tax Equivalents of Tariff Barriers Applied by Both Rich and Developing Countries on the Real
Income of Developing Countries
Region
Export-Tax Equivalent (In percent)
Rich-country tariff barriers
11.5
Developing country tariff barriers
16.8
Source: Authors’ calculations using the GTAP model and database, Version 6. IV. TARIFF CUTS IN DOHA ROUND AND EFFECTS ON EXPORT INCENTIVES
This section reports how export disincentives would be affected under some hypothetical tariff-cutting scenarios. Negotiations on tariff reductions in the Doha Round are mainly focused on bound tariff rates9 and for most of the twenty-six countries listed in Table 2, there is significant “binding overhang,” where bound rates exceed applied rates. In order to have some impact, the tariff cuts must affect applied rates. Therefore, three tariff-cutting scenarios that result in cuts to applied rates are considered. Scenario 1 considers a situation in which the high tariff is reduced by a larger percentage than the lower one and therefore captures the spirit of a “tiered formula” reduction. For purposes of illustration, it assumes that the high tariff is reduced by 20 percent and the lower tariff is reduced by 10 percent. Scenario 2 assumes that the high tariff is reduced by 40 percent, while the low tariff is reduced by 10 percent. Scenario 3 assumes that a country’s higher tariff is not reduced and the lower tariff declines by 10 percent. This is to approximate the case in which the high-tariff sector is classified as a “sensitive sector” and is exempt from a tariff reduction. In order to achieve cuts in applied rates of these magnitudes, bound rates would need to be reduced by 50 to 100 percent depending on the country. Table 4 reports the export-tax equivalents on a country basis for each of these three scenarios and compares them to the initial situation. Table 5 reports how the value of exports would change in each of the three scenarios described above. In addition, Table 5 reports the change in exports that would result from the elimination of all import tariffs.
Generally speaking, the simulation results demonstrate that the deeper the tariff cuts, the larger the reduction in export disincentives. Export disincentives decline in both scenarios 1 and 2 compared to the initial situation, but export disincentives decline by a larger magnitude under scenario 2 because the higher tariff rate is reduced by a larger percentage than the lower tariff (Table 4).
9 An exception is the proposal by the United States, which is based on applied tariff rates.
- 11 -
Table 4. Effects of Alternative Tariff-Cutting Formulas on Export Disincentives
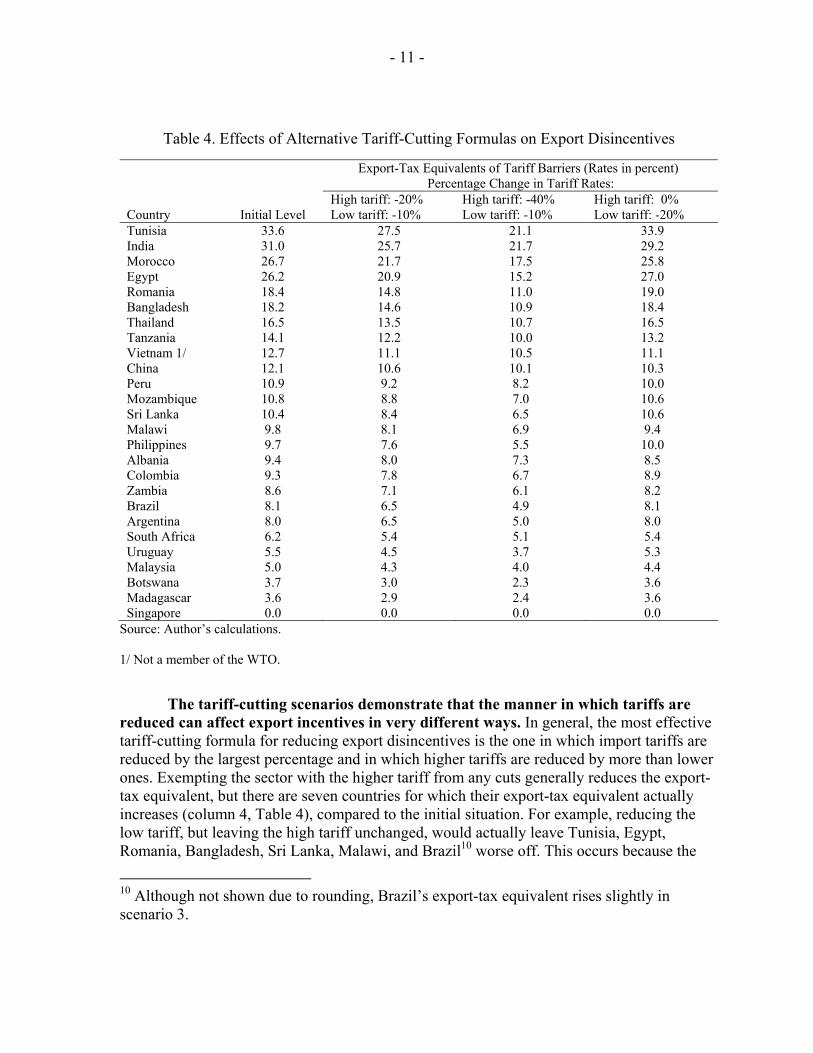
Export-Tax Equivalents of Tariff Barriers (Rates in percent) Percentage Change in Tariff Rates: High tariff: -20% High tariff: -40% High tariff: 0% Country Initial Level Low tariff: -10% Low tariff: -10% Low tariff: -20% Tunisia 33.6 27.5 21.1 33.9 India 31.0 25.7 21.7 29.2 Morocco 26.7 21.7 17.5 25.8 Egypt 26.2 20.9 15.2 27.0 Romania 18.4 14.8 11.0 19.0 Bangladesh 18.2 14.6 10.9 18.4 Thailand 16.5 13.5 10.7 16.5 Tanzania 14.1 12.2 10.0 13.2 Vietnam 1/ 12.7 11.1 10.5 11.1 China 12.1 10.6 10.1 10.3 Peru 10.9 9.2 8.2 10.0 Mozambique 10.8 8.8 7.0 10.6 Sri Lanka 10.4 8.4 6.5 10.6 Malawi 9.8 8.1 6.9 9.4 Philippines 9.7 7.6 5.5 10.0 Albania 9.4 8.0 7.3 8.5 Colombia 9.3 7.8 6.7 8.9 Zambia 8.6 7.1 6.1 8.2 Brazil 8.1 6.5 4.9 8.1 Argentina 8.0 6.5 5.0 8.0 South Africa 6.2 5.4 5.1 5.4 Uruguay 5.5 4.5 3.7 5.3 Malaysia 5.0 4.3 4.0 4.4 Botswana 3.7 3.0 2.3 3.6 Madagascar 3.6 2.9 2.4 3.6 Singapore 0.0 0.0 0.0 0.0
Source: Author’s calculations. 1/ Not a member of the WTO.
The tariff-cutting scenarios demonstrate that the manner in which tariffs are reduced can affect export incentives in very different ways. In general, the most effective tariff-cutting formula for reducing export disincentives is the one in which import tariffs are reduced by the largest percentage and in which higher tariffs are reduced by more than lower ones. Exempting the sector with the higher tariff from any cuts generally reduces the export-tax equivalent, but there are seven countries for which their export-tax equivalent actually increases (column 4, Table 4), compared to the initial situation. For example, reducing the low tariff, but leaving the high tariff unchanged, would actually leave Tunisia, Egypt, Romania, Bangladesh, Sri Lanka, Malawi, and Brazil10 worse off. This occurs because the
10 Although not shown due to rounding, Brazil’s export-tax equivalent rises slightly in scenario 3.

- 12 -
reduction in the lowest tariff rate reduces output of that sector and releases labor for employment in other sectors. Some of the labor is absorbed by the high-tariff sector, which exacerbates the cost of protection in that sector and thus, raises the export-tax equivalent. Although exports would expand regardless of the magnitude and the composition of the tariff reductions, countries are not necessarily better off in all cases. The simulations reported in Table 5 reveal that a reduction in import tariffs increases exports in all scenarios. This is because tariff reductions raise the price of exports relative to both imports and nontraded goods.11 However, there are seven countries, mentioned above, that would experience a decline in real income as a result of tariff cuts under scenario 3, even though exports increase, because the tariff cut causes resources to move into the sector that is exempt from a tariff reduction, which increases inefficiency. These results demonstrate that an increase in exports is not synonymous with an increase in real income.
Reducing tariffs would serve to increase exports and lead to greater specialization. As tariffs are reduced, countries would tend to specialize in the production of the commodity for which they have a comparative advantage. The pattern of tariffs facing developing-country exports may actually induce countries to specialize in products for which they do not possess a comparative advantage. An example of this is the existence of preferential tariff schemes whereby exports of particular products enter markets at low tariff rates.
The results show that an important factor in determining how exports respond to tariff reductions is the extent to which a country’s export sectors use imported intermediate inputs. Table 6 reports the ratio of expenditures on imported and domestic intermediate inputs to the value of output in each sector (at producer prices). These ratios provide some sense of how price changes affect intermediate input costs, since a tariff directly affects the price of imported and domestically produced intermediates. The last two columns of Table 6 show that the elimination of all tariffs would reduce the cost of imported intermediate inputs for both export sectors in each country with one exception.12 Although not captured by the simulations in this paper, tariff reductions also make a wider variety of imported goods available to the economy at a lower price. 11 These results could be interpreted as long-run effects, as they are based on assumptions that prices have adjusted fully and resources remain fully employed. The actual adjustment may take some time, depending in part on the degree of flexibility in the labor and capital markets.
12 Eliminating all tariffs would raise imported intermediate input costs in the manufactured export sector in Bangladesh because it increases production of exports, which raises the demand for imported intermediate inputs. The increase in the quantity of imported intermediate inputs used outweighs the reduction in the price of imported inputs, so total costs rise in this case.

- 13 -
Developing-country exports would expand proportionately more if they were to eliminate their own tariffs compared with tariff elimination by rich countries. As shown in Table 7, elimination of all tariffs by developing countries would increase the value of their exports by about 20 percent and about 70 percent of this increase would come from eliminating tariffs against exports from other developing countries. This expansion in exports is the result of two effects: (i) a reduction in the cost of imported intermediate inputs used by exporters; and (ii) an increase in access to other markets, namely other developing-country markets. Exports from developing countries would increase by only 4 percent if they were to forgo liberalization themselves and rely exclusively on tariff reductions by rich countries. From a policy point of view, developing countries could expand their exports by a much larger percentage by eliminating their own tariff barriers. Both types of reforms could help developing countries increase their exports.
Table 5. Effects of Alternative Tariff-Cutting Formulas on Export Values by Country
Percentage Change in the Value of Exports, (Relative to 2001 base)
High tariff: -20% High tariff: -40% High tariff: 0% High tariff: -100% Country Low tariff: -10% Low tariff: -10% Low tariff: -20% Low tariff: -100% Tunisia 2.3 4.6 0.7 17.7 India 5.8 10.0 4.0 45.1 Morocco 4.7 8.7 1.7 29.0 Egypt 1.8 3.4 0.5 10.8 Romania 0.8 1.4 0.3 4.6 Bangladesh 8.1 16.2 1.1 46.0 Thailand 0.3 0.5 0.2 2.1 Tanzania 4.0 6.6 2.9 28.1 Vietnam 1/ 0.7 0.9 0.8 5.5 China 2.3 3.2 3.0 19.5 Peru 1.7 2.7 1.7 13.3 Mozambique 1.4 2.5 0.6 8.7 Sri Lanka 1.0 1.6 0.6 6.4 Malawi 1.6 2.8 0.6 9.3 Philippines 0.2 0.4 0.1 1.1 Albania 2.5 4.1 1.8 17.4 Colombia 2.3 3.9 1.4 15.2 Zambia 1.7 3.1 0.9 10.1 Brazil 2.5 5.0 0.1 12.7 Argentina 1.8 3.6 0.1 9.4 South Africa 0.9 1.2 1.2 7.5 Uruguay 1.1 2.0 0.4 6.6 Malaysia 0.2 0.2 0.3 1.8 Botswana 0.5 1.0 0.1 2.9 Madagascar 1.2 2.3 0.2 6.7 Singapore 0.0 0.0 0.0 0.0 Source: Author’s calculations. 1/ Not a WTO member.

- 14 -
Table 6. Importance of Imported Intermediate Input Costs for Each Sector
Ratio of Imported Intermediate Input Costs to the Value of output (at producer prices)
Elimination of All Tariffs
Country Exports of
primary products
Exports of manufactured
products
Percentage change in imported intermediate input costs in the
primary export sector
Percentage change in imported intermediate input costs in the
manufactured export sector Tunisia 0.10 .29 -18.0 -10.7 India 0.13 .20 -23.3 -15.8 Morocco 0.26 .20 -16.8 -9.2 Egypt 0.25 .10 -14.8 -11.6 Romania 0.22 .34 -11.4 -2.7 Bangladesh 0.55 .31 -13.0 3.2 Thailand 0.21 .35 -14.0 -7.2 Tanzania 0.23 .36 -8.7 -5.3 Vietnam 1/ 0.42 .41 -11.2 -10.0 China 0.19 .30 -8.9 -3.7 Peru 0.23 .29 -9.9 -6.8 Mozambique 0.32 .30 -5.8 -1.1 Sri Lanka 0.14 .40 -6.0 -0.9 Malawi 0.24 .22 -6.9 -5.3 Philippines 0.23 .54 -4.5 -1.6 Albania 0.34 .27 -6.9 -6.6 Colombia 0.20 .27 -6.8 -3.1 Zambia 0.28 .50 -4.7 -1.2 Brazil 0.37 .35 -5.9 -0.7 Argentina 0.31 .23 -5.6 -4.1 South Africa 0.14 .12 -5.4 -2.8 Uruguay 0.22 .20 -4.7 -4.6 Malaysia 0.15 .16 -5.7 -3.4 Botswana 0.24 .47 -1.6 -0.4 Madagascar 0.16 .52 -2.4 -0.3 Source: Data for all countries except Egypt were taken from the GTAP database, version 6. 1/ Not a member of the WTO.

- 15 -
Table 7. Effects of Tariff Elimination by Both Rich and Developing Countries on Developing Country Exports
Percentage Change in the
Value of Developing Country Exports
Percentage Change in the Volume of Developing Country
Exports Rich-country liberalization Eliminate tariffs against exports from developing countries
4.0
2.6
Eliminate tariffs against exports from both rich and developing countries
2.0
2.6
Developing country liberalization Eliminate tariffs against exports from rich countries
9.9
12.9
Eliminate tariffs against exports from developing countries
14.1
12.9
Eliminate tariffs against exports from both rich and developing countries
20.1
22.4
Source: Author’s calculations using the GTAP model and database, version 6.
V. CONCLUSIONS
A central message of this paper is that a consequence of import protection is to create disincentives that diminish a country’s ability to export. The anti-export bias from import tariffs arises for at least three reasons: (1) they lower the domestic relative price of exports; (2) they alter wages and rental rates which must be absorbed by the export sector; and (3) they raise the cost of imported intermediate inputs used by export sectors. The simulations reported in this paper demonstrate that the export-tax equivalents of import tariffs can be quite large for some developing countries—the average rate of implicit taxation in the sample of countries examined in this paper is about 12½ percent.
From a policy point of view, reducing import barriers (e.g., tariffs) would serve
as an export promotion strategy by ameliorating the implicit tax they introduce on exports. It is not possible for a country to simultaneously protect their import-competing sectors and promote their export sectors—these policies work at cross purposes to each other.
Reductions in a country’s import tariffs can be accomplished unilaterally—they do not depend on the actions of rich countries. While developing countries frequently look for ways to increase their exports, tariff reductions represent one way to do this. The extent to which exports increase following a reduction in import tariffs will depend on how easily

- 16 -
relative prices can adjust. Of course, tariff reductions by both developed and developing countries would provide the biggest boost to developing country exports.
The manner in which countries choose to reduce tariffs has important implications for the effects on export incentives and well being. Generally speaking, reducing import tariffs will improve export incentives, but tariff-reduction schemes that exempt high-tariff or sensitive sectors could actually leave countries worse off. Thus, a strategy whereby all tariffs are reduced, and high tariffs are cut more than low ones, would do the most to improve export incentives and real incomes in developing countries.

- 17 - Appendix I
I. Symmetry Between Import Tariffs and Export Taxes
To illustrate the symmetry between an export tax and an import tariff, consider a simple model of two goods (exports and imports), which are traded at exogenous world prices and with balanced trade, an ad-valorem tariff on imports at rate t will alter domestic relative prices according to:
(1 )X X
M M
P PWP PW t
=+
( 1 )
where PX and PM are the domestic prices of exports and imports and PWX and PWM are the corresponding world prices. An export tax, levied as a percent of the world price at rate τ, would alter relative prices as follows:
(1 )X X
M M
P PWP PW
τ−= ( 2 )
because an export tax reduces the net-of-tax price received by an exporter. Domestic relative prices will be the same under an import tariff or an export tax when equation (1) equals equation (2), or when the export tax rate, τ , equals13.
1
tt
τ =+
( 3 )
For example, a 25 percent tariff on imports would have the same effect on relative prices as a 20 percent export tax.
The crucial factor that leads to this equivalence is that trade must be balanced. Note that taxes on exports and imports have different effects on the balance of trade: export taxes tend to worsen the trade balance, while import tariffs are likely to improve the trade balance.
13 If the export tax is expressed as a proportion of the domestic price, instead of the world price, then (1 )X XPW P τ= + , and an export tax of rate τ would have the same effect on domestic relative prices as an import tariff of rate t.

- 18 - Appendix II
II. Summary of Previous Work on Quantifying the Disincentive to Export Introduced By Import Tariffs
Schiff and Valdes (1992) specifically examined the bias against agricultural
production and exports across a range of developing countries as a result of import protection by comparing producer prices relative to world prices. In analyzing the extent of taxation of agriculture across 18 developing countries between 1960 and 1985, the authors found that on average, the indirect tax on agriculture from protection applied to industrial goods was about 22 percent, about three times the magnitude of direct protection. Industrial protection taxed agriculture more than overvaluation of the exchange rate in these countries. On average, the direct protection of importables was 18 percent (which raised the price of imports relative to the price of exports), while the direct taxation of exportables was 16 percent (which lowered the price of exports relative to imports). The total increase in the relative price of importables to exportables was about 40 percent.
Various authors estimated the proportion of import protection that falls on exporters and found it to be quite substantial. Using a model based on three sectors: exports, imports, and home (nontraded) goods, these studies estimated the extent to which import protection increases the price of home goods, and therefore, the degree to which the price of exports falls relative to home goods. In general, these studies showed that between 40 and 90 percent of import protection fell on exporters. For example, Clements and Sjaastad (1984) report the proportion of protection borne by exporters in seven countries in Latin America and concluded that on average, 66 percent of each country’s pattern of import protection acted as a tax on exporters. Using a large-scale model of the Australian economy (the ORANI model), the same authors simulated the effect of a rise in Australian tariffs that produced a 5 percent increase in the prices of imported goods and found that the output of every export-oriented industry would decline by about 2 percent on average. The effects of this simulation are equivalent to a 3.2 percent tax on exports. From their analysis, the authors conclude that import protection benefits import-competing producers at the expense of exporters.
Manzur and Subramaniam (1995) estimated that import protection in Malaysia resulted in a significant tax on exporters. Using data for 1989, the authors demonstrated that a country’s nominal tariff structure can convey a very misleading picture of who actually bears the burden of tariffs. For 1989, the authors estimated that the tariff equivalent of all import restrictions was about 18 percent and the nominal assistance provided to exporters was only 1 percent. Using a general equilibrium model of trade, the authors demonstrated that this nominal structure of assistance actually resulted in a tax on exporters of about 9 percent. That is, the structure of tariff protection in Malaysia imposed a substantial tax on exporters which more than wiped out the 1 percent nominal rate of assistance they received.
Valdes (1986) reported the results from seven studies that showed a fairly high degree of substitution between imports and home goods, suggesting that import protection acts as a significant tax on the export sector in each country because protection increased both the price of imports and nontraded goods relative to the price of exports. For example, for the Philippines, Bautista and Valdes (1993) found that a 10 percent increase in the price of
- 19 - Appendix II
importables was associated with an 8 percent decline in the domestic price of agricultural exports relative to home goods. For Peru, Valdes (1986) found that raising the uniform tariff on manufacturing goods by 10 percent imposed an implicit tax of 5.6 percent on the production of some agricultural goods (rice) and a 6.7 percent tax on exports.
- 20 - Appendix III
III. Methodology Used to Compute Export-Tax Equivalents
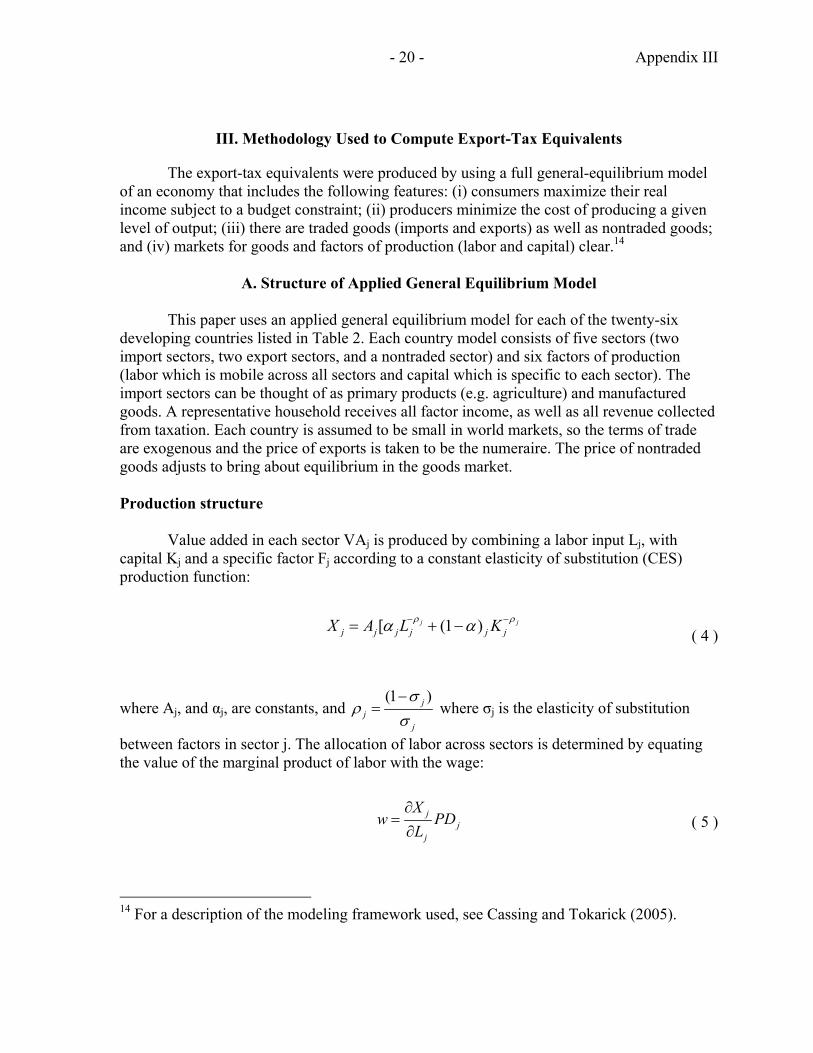
The export-tax equivalents were produced by using a full general-equilibrium model of an economy that includes the following features: (i) consumers maximize their real income subject to a budget constraint; (ii) producers minimize the cost of producing a given level of output; (iii) there are traded goods (imports and exports) as well as nontraded goods; and (iv) markets for goods and factors of production (labor and capital) clear.14
A. Structure of Applied General Equilibrium Model
This paper uses an applied general equilibrium model for each of the twenty-six developing countries listed in Table 2. Each country model consists of five sectors (two import sectors, two export sectors, and a nontraded sector) and six factors of production (labor which is mobile across all sectors and capital which is specific to each sector). The import sectors can be thought of as primary products (e.g. agriculture) and manufactured goods. A representative household receives all factor income, as well as all revenue collected from taxation. Each country is assumed to be small in world markets, so the terms of trade are exogenous and the price of exports is taken to be the numeraire. The price of nontraded goods adjusts to bring about equilibrium in the goods market. Production structure
Value added in each sector VAj is produced by combining a labor input Lj, with capital Kj and a specific factor Fj according to a constant elasticity of substitution (CES) production function:
[ (1 )j jj j j j j jX A L Kρ ρα α− −= + −
( 4 )
where Aj, and αj, are constants, and (1 )j
jj
σρ
σ−
= where σj is the elasticity of substitution
between factors in sector j. The allocation of labor across sectors is determined by equating the value of the marginal product of labor with the wage:
jj
j
Xw PD
L∂
=∂
( 5 )
14 For a description of the modeling framework used, see Cassing and Tokarick (2005).

- 21 - Appendix III
where jPD is the consumption price of the jth good and W is the wage rate. Since capital is sector specific, its return, jr is determined as a residual:
j j j j jPVA VA wL r K= + ( 6 )
where jPVA is the value-added price in sector j, jVA is value added in sector j, and jL is the amount of labor employed in sector j. Since labor is fully employed,
_
jj
L L=∑ ( 7 )
where L is the endowment of labor. Capital stocks are fixed by sector:
j jK K= ( 8 )
Intermediate demand One channel through which tariffs affect export incentives is by altering the cost of intermediate inputs used by export sectors. In each sector, the value of output at producer prices jPX must equal the total costs of production:
j j j j j i ij i ij
i i
PX X wL r K PD D I PM M I= + + +∑ ∑
( 9 )
where i iji
PD DI∑ represents the cost of domestic intermediate inputs, ijDI is the amount of
good i used in a unit of good j, and i iji
PM MI∑ is the cost of imported intermediate inputs,
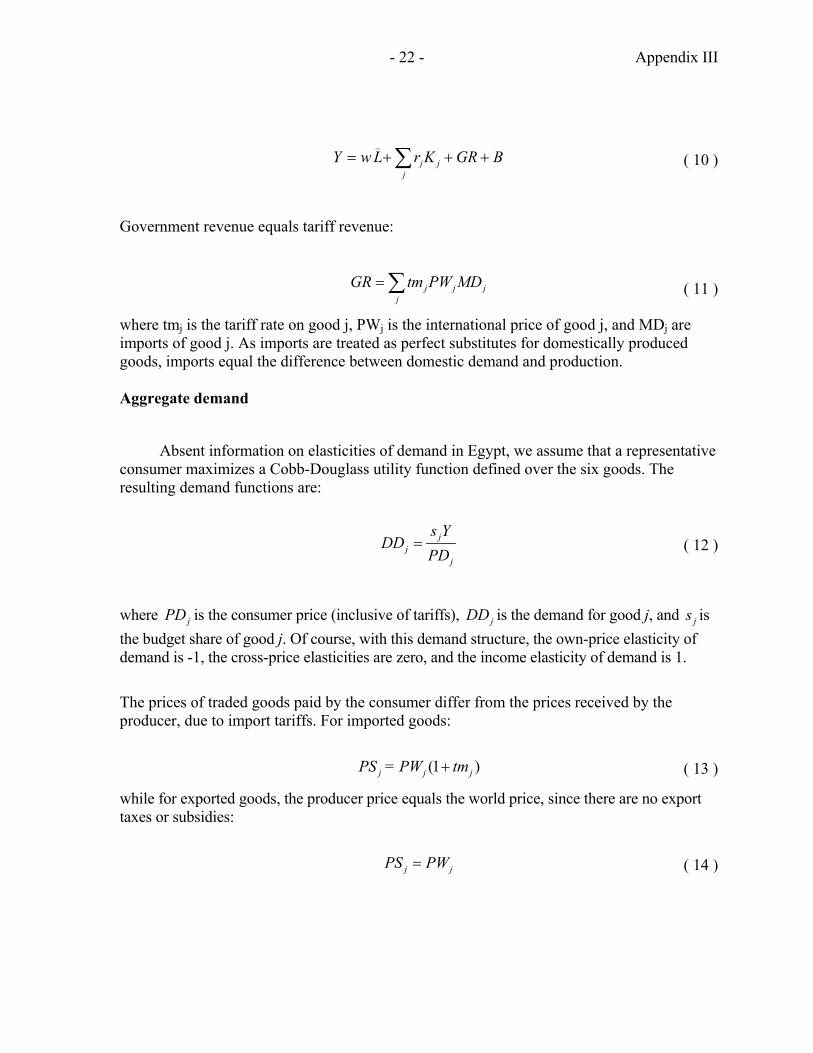
where ijMI is the amount of imports of good i used in a unit of good j. Changes in tariffs therefore affect the costs facing the export industry through changes in iPD and iPM , the prices of domestic and imported intermediates respectively. Aggregate income and demand Aggregate income available for spending by the representative consumer (Y) equals the sum of factor income, government revenue, and foreign borrowing, B, which is assumed to be fixed in terms of the numeraire:
- 22 - Appendix III
_
j jj
Y w L r K GR B= + + +∑ ( 10 )
Government revenue equals tariff revenue:
j j jj
GR tm PW MD= ∑ ( 11 )
where tmj is the tariff rate on good j, PWj is the international price of good j, and MDj are imports of good j. As imports are treated as perfect substitutes for domestically produced goods, imports equal the difference between domestic demand and production. Aggregate demand
Absent information on elasticities of demand in Egypt, we assume that a representative consumer maximizes a Cobb-Douglass utility function defined over the six goods. The resulting demand functions are:
jj
j
s YDD
PD= ( 12 )
where jPD is the consumer price (inclusive of tariffs), jDD is the demand for good j, and js is the budget share of good j. Of course, with this demand structure, the own-price elasticity of demand is -1, the cross-price elasticities are zero, and the income elasticity of demand is 1.
The prices of traded goods paid by the consumer differ from the prices received by the producer, due to import tariffs. For imported goods:
(1 )j j jPS = PW tm+ ( 13 )
while for exported goods, the producer price equals the world price, since there are no export taxes or subsidies:
j jPS PW= ( 14 )
- 23 - Appendix III
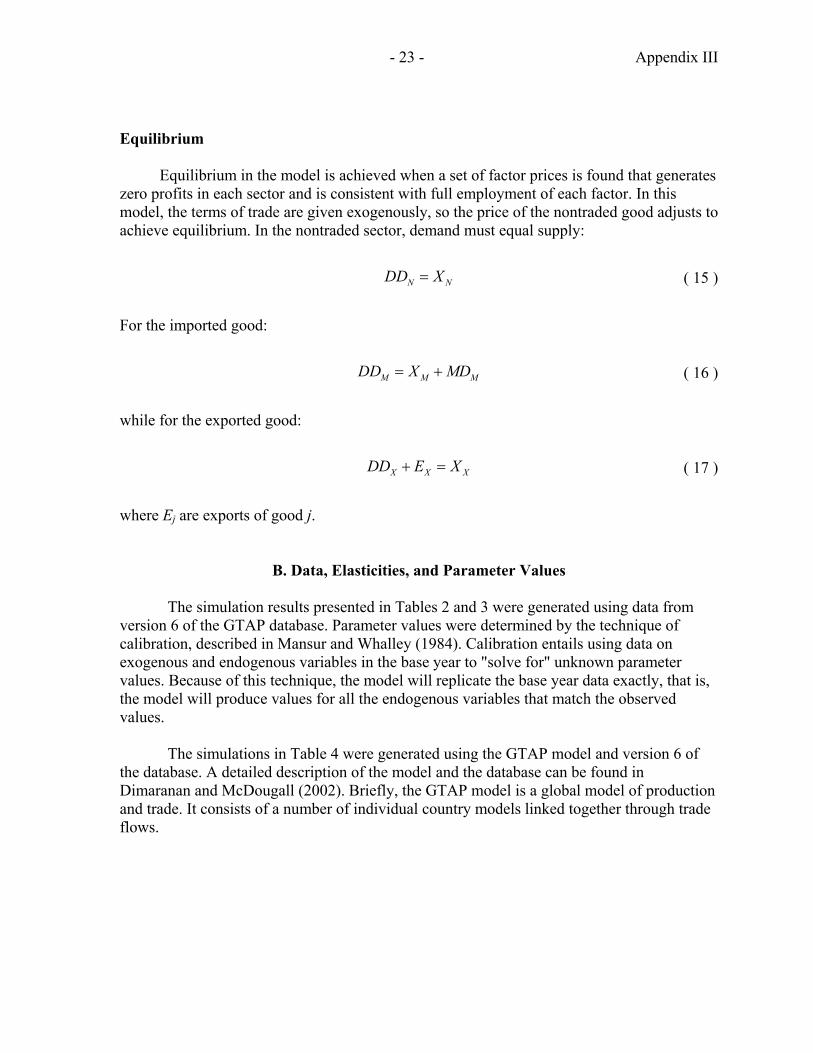
Equilibrium Equilibrium in the model is achieved when a set of factor prices is found that generates zero profits in each sector and is consistent with full employment of each factor. In this model, the terms of trade are given exogenously, so the price of the nontraded good adjusts to achieve equilibrium. In the nontraded sector, demand must equal supply:
N NDD X= ( 15 )
For the imported good:
M M MDD X MD= + ( 16 )
while for the exported good:
X X XDD E X+ = ( 17 )
where Ej are exports of good j.
B. Data, Elasticities, and Parameter Values The simulation results presented in Tables 2 and 3 were generated using data from version 6 of the GTAP database. Parameter values were determined by the technique of calibration, described in Mansur and Whalley (1984). Calibration entails using data on exogenous and endogenous variables in the base year to "solve for" unknown parameter values. Because of this technique, the model will replicate the base year data exactly, that is, the model will produce values for all the endogenous variables that match the observed values.
The simulations in Table 4 were generated using the GTAP model and version 6 of the database. A detailed description of the model and the database can be found in Dimaranan and McDougall (2002). Briefly, the GTAP model is a global model of production and trade. It consists of a number of individual country models linked together through trade flows.

- 24 -
REFERENCES
Bautista, R. M., and Alberto Valdes, 1993, “The Relevance of Trade and Macroeconomic Policies For Agriculture,” in The Bias Against Agriculture: Trade and Macroeconomic Policies in Developing Countries, ed. by R.M Bautista and A. Valdes (Washington: International Center for Economic Growth and International Food Policy Research Institute).
Cassing, James, and Stephen Tokarick, 2005, “Tariffs and Distortions in the Presence of
Growth,” IMF Working Paper 05/12 (Washington: International Monetary Fund). Clements, Ken, and Larry Sjaastad, 1984, How Protection Taxes Exporters, Thames Essay
No. 39 (London: Trade Policy Research Center). Dimaranan, Betina V., and Robert A. McDougall, 2002, Global Trade, Assistance, and
Production: The GTAP5 Data Base, Center for Global Trade Analysis, Purdue University.
Ianchovichina, Elena, 2004, “Trade Policy Analysis in the Presence of Duty Drawbacks,”
Journal of Policy Modeling, Vol. 26, pp. 353–71. Kee, Hiau Looi, Alessandro Nicita, and Marcelo Olarreaga, 2004, “Ad-Valorem Equivalents
of Non-Tariff Barriers” (Washington: World Bank). Lerner, Abba, 1936, “The Symmetry Between Import and Export Taxes,” Economica, Vol. 3,
No. 11 (August). Mansur, Ahsan, and John Whalley, 1984, “Numerical Specifications of Applied General
Equilibrium Models: Estimation, Calibration, and Data,” in Applied General Equilibrium Analysis, Herbert Scarf and John Shoven (Cambridge: Cambridge University Press) pp. 69–127.
Manzur, Meher, and Alamelu Subramaniam, 1995, “Who Pays For Protection in Malaysia?:
A New General Equilibrium Approach,” Journal of Economic Integration, Vol. 10, (September), pp. 372–85.
Porto, Guido, 2005, “Informal Export Barriers and Poverty,” Journal of International
Economics, Vol. 66, pp. 447–70. Schiff, Maurice, and Alberto Valdes, 1992, The Political Economy of Agricultural Pricing
Policy, Volume 4, A Synthesis of the Economics in Developing Countries (Baltimore, Maryland: Johns Hopkins University Press).
- 25 -
Valdes, Alberto, 1986, “Exchange Rates and Trade Policy: Help or Hindrance to Economic Growth,” in Agriculture in a Turbulent World Economy, Proceedings of the Nineteenth International Conference of Agricultural Economists, Gower.
World Bank, 2004, “Trade Patterns and Policies: Doha Options To Promote Development,”
Global Economic Prospects (Washington: World Bank) pp. 76–78. Yeats, Alexander, Amjadi Azita, Ulrich Reincke, and Francis Ng, 1996, “What Caused Sub- Saharan Africa’s Marginalization in World Trade?” Finance & Development, Vol. 33 (December), pp. 38–41