doe award no.: de-fe-0028967 phase 1 scientific/technical
TRANSCRIPT

DOE Award No.: DE-FE-0028967
Phase 1 Scientific/Technical Report (Period Ending 3/31/2018)
A multi-scale experimental investigation of flow properties in coarse-grained hydrate reservoirs
during production Project Period (10/1/2016-9/30/2019)
Submitted by: Peter B. Flemings
_____________________________________
Signature
The University of Texas at Austin DUNS #: 170230239
101 East 27th Street, Suite 4.300 Austin, TX 78712-1500
Email: [email protected] Phone number: (512) 475-8738
Prepared for: United States Department of Energy
National Energy Technology Laboratory
OIL & GAS
June 20, 2018
Office of Fossil Energy
DocuSign Envelope ID: 7B44DA5D-A1A4-448D-9FEA-8CE6C2810995

Hydrate Production Properties Phase 1 Report Page 1 of 97
DISCLAIMER “This report was prepared as an account of work sponsored by an agency of the United States Government. Neither the United States Government nor any agency thereof, nor any of their employees, makes any warranty, express or implied, or assumes any legal liability or responsibility for the accuracy, completeness, or usefulness of any information, apparatus, product, or process disclosed, or represents that its use would not infringe privately owned rights. Reference herein to any specific commercial product, process, or service by trade name, trademark, manufacturer, or otherwise does not necessarily constitute or imply its endorsement, recommendation, or favoring by the United States Government or any agency thereof. The views and opinions of authors expressed herein do not necessarily state or reflect those of the United States Government or any agency thereof.”
DocuSign Envelope ID: 7B44DA5D-A1A4-448D-9FEA-8CE6C2810995

Hydrate Production Properties Phase 1 Report Page 2 of 97
Abstract In Phase 1 of the project, “A multi-scale experimental investigation of flow properties in coarse-grained hydrate reservoirs during production” we developed methods and began exploring the permeability, relative permeability and dissipation behavior of coarse-grained methane hydrate - sediment reservoirs at both the macro- (core) and micro (pore) scale. At the macro- (core) scale, we: 1) developed sand pack and hydrate formation methods to explore the relative permeability of the hydrate reservoir to gas and water flow in the presence of hydrate at various pore saturations; and 2) depressurized the hydrate reservoir at a range of initial saturations to observe mass transport and at what time scale local equilibrium describes disassociation behavior. Simultaneously, at the micro (pore) scale, we developed methods and used those methods to 1) observe the habit of the hydrate, gas, and water phases within the pore space at a range of initial saturations with micro-CT; and 2) imaged phases and molecules/salinity present both at initial saturations and at stages of dissociation with optical micro-Raman Spectroscopy.
Table of Contents Abstract ......................................................................................................................................................... 2 Summary ....................................................................................................................................................... 5 Introduction .................................................................................................................................................. 6 Results and Discussion .................................................................................................................................. 8
1.0 Macro‐Scale: Relative Permeability of Methane Hydrate Sand Packs ............................................... 8
2.0 Macro‐Scale: Depressurization of Methane Hydrate Sand Packs .................................................... 15
3.0 Micro‐Scale: CT Observation of Methane Hydrate Sand Packs ........................................................ 21
4.0 Micro‐Scale: Raman Observation of Methane‐Gas‐Water Systems................................................. 29
Conclusions ................................................................................................................................................. 35 References .................................................................................................................................................. 36 Appendix A .................................................................................................................................................. 39 Appendix B .................................................................................................................................................. 45 Appendix C .................................................................................................................................................. 49 Appendix D .................................................................................................................................................. 58 Appendix E .................................................................................................................................................. 74 Appendix F .................................................................................................................................................. 86 Appendix G .................................................................................................................................................. 90
DocuSign Envelope ID: 7B44DA5D-A1A4-448D-9FEA-8CE6C2810995

Hydrate Production Properties Phase 1 Report Page 3 of 97
Table of Figures Figure 1. Permeameter experimental design. .............................................................................................. 9 Figure 2. Photograph of permeameter experimental setup......................................................................... 9 Figure 3. Stability zone for sI hydrate with pure water. ............................................................................. 10 Figure 4. Hydrate formation in the permeameter using excess gas method. ............................................ 12 Figure 5. Pressure drop at 1 mL/min indicating hydrate blockage. ............................................................ 13 Figure 6. Pressure drop at different flow rates showing no hydrate blockage. ......................................... 14 Figure 7. Diagram showing the setup of the depressurization chamber. .................................................. 15 Figure 8. Three stages of depressurization: initial free gas release, hydrate dissociation, and residual free
gas release. .................................................................................................................................... 17 Figure 9. Mass balance of methane consumed during formation (light blue) and recovered during
depressurization. ........................................................................................................................... 18 Figure 10. Results of slow depressurization compared to an equilibrium model based on homogenous
salinity and temperature. .............................................................................................................. 18 Figure 11. Pressure rebounds between each gas release step, normalized to the magnitude of initial
pressure drop. ................................................................................................................................ 19 Figure 12. The depressurization vessel within the medical CT scanner. .................................................... 20 Figure 13. Changes in bulk density in the depressurization vessel derived from CT-scanning at 1 hour, 3
hours, and 120 hours after a pressure drop and release of gas. ................................................... 20 Figure 14. Workflow for micro CT hydrate studies at the microscale ........................................................ 21 Figure 15. Schematic setup of micro-consolidation device for micro CT studies. ...................................... 22 Figure 16. Long-term aluminum micro-consolidation device mounted in a micro-CT scanner with its
radiography (center) and CT slice (right). ...................................................................................... 23 Figure 17. PEEK micro-consolidation device for micro CT studies. ............................................................. 24 Figure 18. Temperature (a) and pressure (b) of Exp3 in the micro CT device during the first 3 days. ....... 25 Figure 19. CT image taken before hydrate formation and CT image taken at 5 hours after the
temperature and the pressure are shifted into hydrate stability zone during Exp3. .................... 26 Figure 20. Left: original axial CT image of methane hydrate bearing sand after 4 hours of hydrate growth
during Exp4 .................................................................................................................................... 26 Figure 21. The original (left) and the segmented (right) CT slices of the sand at the same position after 5
hours of hydrate growth in Exp3. .................................................................................................. 27 Figure 22. The co-existence of methane gas, methane hydrate and brine in sandy sediments after 2 days
of hydrate growth in brine during Exp4. ........................................................................................ 28 Figure 23. Raman chamber under the Raman spectrometer in the Mineral Physics Lab, UT-Austin. ....... 29 Figure 24. Left image of the Micro Raman vessel. Right schematic diagram of the Raman Chamber. ...... 30 Figure 25. Schematic circuit diagram and photograph of Micro Raman data acquisition system. ............ 30 Figure 26. Pressure and temperature evolution of a Micro Raman hydrate formation and dissociation
experiment. .................................................................................................................................... 32 Figure 27. Annotated optical images and Raman peak intensity ratios of large to small cages (intensity of
Raman peak at 2902 cm-1 to peak at 2912 cm-1). ........................................................................ 32
DocuSign Envelope ID: 7B44DA5D-A1A4-448D-9FEA-8CE6C2810995

Hydrate Production Properties Phase 1 Report Page 4 of 97
Figure 28. During hydrate formation, the fractions of structure I (sI) and structure II (sII) hydrates over time. ............................................................................................................................................... 33
Figure 29. Pressure and temperature evolution during dissociation in the Micro Raman vessel. ............. 34 Figure 30. During hydrate dissociation, gaseous methane radially expanded in the pore network and
carried out further hydrate dissociation. ....................................................................................... 34 Figure 31. Raman maps and schematic illustrations of methane hydrates dissociation by controlled
depressurization. ........................................................................................................................... 35
Table of Tables Table 1. Phase 1 Milestones ......................................................................................................................... 6 Table 2. List of Acronyms ............................................................................................................................ 37
DocuSign Envelope ID: 7B44DA5D-A1A4-448D-9FEA-8CE6C2810995

Hydrate Production Properties Phase 1 Report Page 5 of 97
Summary The goals of this project are to provide a systematic understanding of permeability, relative permeability and dissipation behavior in coarse-grained methane hydrate - sediment reservoirs. The results will inform reservoir simulation efforts, which will be critical to determining the viability of the coarse-grained hydrate reservoir as an energy resource. We will perform our investigation at the macro- (core) and micro- (pore) scale.
In Phase 1, we developed methods and began exploring the permeability, relative permeability and dissipation behavior of coarse-grained methane hydrate - sediment reservoirs at both the macro- (core) and micro (pore) scale. At the macro- (core) scale, we: 1) developed methods and measured the relative permeability of the hydrate reservoir to gas and water flow in the presence of hydrate at various pore saturations; and 2) depressurized the hydrate reservoir at a range of initial saturations to observe mass transport and at what time scale local equilibrium describes disassociation behavior. Simultaneously, at the micro (pore) scale, we developed methods and used those methods to 1) observe the habit of the hydrate, gas, and water phases within the pore space at a range of initial saturations with micro-CT; and 2) imaged phases and molecules/salinity present both at initial saturations and at stages of dissociation with optical micro-Raman Spectroscopy.
In Phase 1, we first demonstrated our ability to systematically manufacture sand-pack hydrate samples at a range of hydrate saturations. We then measured the permeability of the hydrate-saturated sand pack to flow a single brine phase and depressurized the hydrate-saturated sand packs and observed the kinetic (time-dependent) behavior. Simultaneously we built a micro-CT pressure container and a micro-Raman Spectroscopy chamber and imaged the pore-scale habit, phases, and pore fluid chemistry of sand-pack hydrate samples. We then made observations on our hydrate-saturated sand-packs.
In Phase 2, we will measure relative permeability to water and gas in the presence of hydrate in sand-packs using co-injection of water and gas. We will also extend our measurements from sand-pack models of hydrate to observations of actual Gulf of Mexico material. We will also measure relative permeability in intact samples to be recovered from the upcoming Gulf of Mexico 2017 hydrate coring expedition. We will also perform dissipation experiments on intact Gulf of Mexico pressure cores. At the micro-scale we will perform micro-Raman and micro-CT imaging on hydrate samples composed from Gulf of Mexico sediment.
DocuSign Envelope ID: 7B44DA5D-A1A4-448D-9FEA-8CE6C2810995

Hydrate Production Properties Phase 1 Report Page 6 of 97
Introduction This project “A multi-scale experimental investigation of flow properties in coarse-grained hydrate reservoirs during production” was funded from the Department of Energy in October of 2016. Phase 1 of this project encompasses the first year and a half; October 1, 2016 to March 31, 2018. This report provides a summary of activities in Phase 1, the first budget period, of the project and a collection of key deliverables as attached Milestone Reports. All Phase 1 Tasks were completed and all Phase 1 Milestones met. The Phase 1 Milestones are listed in Table 1.
Table 1. Phase 1 Milestones
Milestone Description Planned Completion
Actual Completion
Verification Method
Comments
Milestone 1.A: Project Kick-off Meeting
11/22/16 (Y1Q1)
11/22/16 Presentation Complete
Milestone 1.B: Achieve hydrate formation in sand-pack (Subtask 2.1)
6/27/17 (Y1Q3)
8/11/17 Documentation of milestone achievement (Deliverable 2.1)
Complete, See Attachment A. Milestone 1B Report
Milestone 1.C: Controlled and measured hydrate saturation using different methods (Subtask 2.2)
3/27/18 (Y2Q2)
3/27/18 Documentation of milestone achievement (Deliverable 2.1)
Complete, See Attachment B. Milestone 1C Report
3 Milestone 1.D: Achieved depressurization and demonstrated mass balance (Subtask 3.1)
3/27/18 (Y2Q2)
12/18/17 Documentation of milestone achievement (Deliverable 3.1)
Complete, See Attachment C. Milestone 1D Report
Milestone 1.E: Built and tested micro-consolidation device (Subtask 4.1)
6/27/17 (Y1Q3)
6/27/17 Documentation of milestone achievement (Deliverable 4.1)
Complete, See Attachment D. Milestone 1E Report.
Milestone 1.F: Achieved Hydrate formation and measurements in Micro-CT consolidation device (Subtask 4.2)
3/27/18 (Y2Q2)
2/15/18 Documentation of milestone achievement (Deliverable 4.1)
Complete, See Attachment E. Milestone 1F Report
Milestone 1.G: Built and integrated high-pressure gas mixing chamber (Subtask 5.1)
3/27/18 (Y2Q2)
6/27/17 Documentation of milestone
Complete, See Attachment F.
DocuSign Envelope ID: 7B44DA5D-A1A4-448D-9FEA-8CE6C2810995

Hydrate Production Properties Phase 1 Report Page 7 of 97
achievement (Deliverable 5.1)
Milestone 1G Report
Milestone 1.H: Micro-Raman analysis of synthetic complex methane hydrate (Subtask 5.2 and 5.3)
3/28/2018 (Y2Q2)
3/27/2018 Documentation of milestone achievement (Deliverable 5.1)
Complete, See Attachment G. Milestone 1H Report
DocuSign Envelope ID: 7B44DA5D-A1A4-448D-9FEA-8CE6C2810995

Hydrate Production Properties Phase 1 Report Page 8 of 97
Results and Discussion 1.0 Macro‐Scale: Relative Permeability of Methane Hydrate Sand Packs
1.1 Summary
We have successfully built a laboratory apparatus for the measurement of relative permeability at the core scale, creating a sand pack, and forming hydrate in that sand pack. We then optimized our method of sand packing to directly control the mass of water added. Finally we generated hydrate, obtaining final hydrate saturations (Sh) of up to 43%, and began looking at pressure profiles within the sand pack.
1.2 Hydrate Formation
1.2.1 The Pressure Vessel and Experimental Setup The schematic in Figure 1 shows the final design of the experimental set up. Six differential pressure transducers were assembled and connected to six pressure taps along the pressure vessel. The pressure transducers were calibrated, leak tested, and pressure tested. Once the transducers were operational, we began leak testing the entire setup. The transducers and many lines were pressure and leak tested for an extended period while the core holder was packed with a sand pack and pressurized to experimental conditions and left to maintain pressure. After adjustments, the set up was deemed to be sufficiently leak-proof, and we began taking two phase relative permeability measurements using nitrogen and deionized water. The goal with this is to practice taking relative permeability measurements using our new set up before we introduce methane and hydrates into the system.
The entire set up was placed on a cart, Figure 2, to be able to move into the cold room for hydrate formation.
In addition to preparing our setup for the measurements, an environmental chamber to house our experiment inside of the cold storage room is being built. The temperature inside of the cold room is ~6.0°C±1.0°C. This temperature is sufficient for producing hydrates as it lies within the stability zone (see Figure 3). However, to conduct more accurate relative permeability measurements, we would like the temperature to be more constant than ±1.0°C. Therefore, we are building a chamber that will house our cart/set up where we will be able to control the temperature to ±0.1°C. This will give us a much more stable environment for our hydrates and more control over our experimental conditions. More information about the device can be found in the Milestone 1.B Report in Appendix A.
DocuSign Envelope ID: 7B44DA5D-A1A4-448D-9FEA-8CE6C2810995

Hydrate Production Properties Phase 1 Report Page 9 of 97
Figure 1. Permeameter experimental design.
Figure 2. Photograph of permeameter experimental setup.
DocuSign Envelope ID: 7B44DA5D-A1A4-448D-9FEA-8CE6C2810995

Hydrate Production Properties Phase 1 Report Page 10 of 97
Figure 3. Stability zone for sI hydrate with pure water.
1.2.2 Hydrate Formation Method The first step in forming hydrate is to pack the sample into the core holder with a known water saturation (35-40%). Sand was prepared in a moist state, mixed with kaolinite for better hydrate nucleation, and tamped into the core holder to a porosity of 35% and water saturation of 40%. Once the sample is packed, the confining pressure is increased to ~500 psi and a constant effective stress of 500 psi is applied to the sample.
Once the sample reaches 1250 psi and the confining is 1750 psi, we allow the sample to reach equilibrium. The pressure transducer lines are then opened to the core and pressure drops across the core are measured. At this point, since there is no flow, all pressure transducers should be reading 0 psi. After we ensure there are no leaks in the system, the entire setup/cart is transported in the cold room and allowed to reach experimental conditions ~6°C. The pore pressure is controlled by an additional ISCO pump which is set to constant pressure mode at 1250 psi. As the system cools, gas is injected to maintain the pressure. After 6-15 hours, hydrate formation will begin and can be seen by the amount of gas injected by the pump. In order to allow maximum conversion, we allow the system to continue to form hydrate for 2-3 days.
0
200
400
600
800
1000
1200
1400
1600
0 2 4 6 8 10 12 14
Pres
sure
(PSI
)
Temperature (C)
P-T for Hydrates with DI water
Stability
Experiment Conditions
Hydrate Stable
Hydrate Unstable
DocuSign Envelope ID: 7B44DA5D-A1A4-448D-9FEA-8CE6C2810995

Hydrate Production Properties Phase 1 Report Page 11 of 97
1.3 Determining the Hydrate saturation
The resulting hydrate saturation, Sh, is calculated as follows:
𝑆𝑆ℎ = 𝑉𝑉𝐶𝐶𝐶𝐶4𝜌𝜌𝐶𝐶𝐶𝐶4𝑀𝑀𝐶𝐶𝑀𝑀𝐶𝐶𝐶𝐶4𝜌𝜌𝐶𝐶𝑉𝑉𝑝𝑝
, (Eq. 1)
where VCH4 is the volume of methane injected into the core during hydrate formation, ρCH4 is the density of methane gas at experimental conditions (0.07225 g/cm3), MH is the molar mass of sI hydrate (119.5 g/mol), MCH4 is the molar mass of methane (16 g/mol), ρH is the density of sI hydrate (0.925 g/cm3), and Vp is the pore volume of the sandpack. The conversion rate R, which is the ratio of the number of moles of water taken up in hydrate to the total number of moles of water initially present, is calculated as
𝑅𝑅 = 𝑉𝑉𝑊𝑊𝜌𝜌𝑊𝑊𝑀𝑀𝐶𝐶𝐶𝐶45.75𝑀𝑀𝑊𝑊𝑉𝑉𝐶𝐶𝐶𝐶4𝜌𝜌𝐶𝐶𝐶𝐶4𝑀𝑀𝐶𝐶
, (Eq. 2)
where VW is the initial volume of water present, ρw is the density of water, and Mw is the molar mass of water.
1.4 Hydrate Formation Results
The process for conducting steady state relative permeability measurements relies on Darcy’s law to solve for relative permeability:
𝑄𝑄𝑖𝑖 = 𝑘𝑘𝑘𝑘𝑟𝑟𝑟𝑟𝜇𝜇𝑟𝑟
𝐴𝐴 ∆𝑃𝑃𝑟𝑟𝐿𝐿
, (Eq. 3)
where Qi is the volumetric flow rate of phase i (either water or gas), k is the intrinsic (hydrate-free, single-phase flow) permeability of the sandpack, kri is the relative permeability to phase i, μi is the viscosity of phase i, A is the cross-sectional area of the sandpack, and ΔPi is the pressure drop of phase i over length L. With our setup, we will be able to control Q, and will measure ΔP. A, k, µ, and L are all known constants. This allows us to solve for kri. Using a mass flow controller for the gas and a continuous injection pump for the brine/water, we will be able to control the flow rates of the two fluids. We will use the pressure taps and differential pressure transducers to measure ΔP. Once we have reached steady state and the ΔP is constant, we will be able to solve for kri for each phase. By determining kri at multiple saturations, we will be able to generate complete relative permeability curves for the two phases.
DocuSign Envelope ID: 7B44DA5D-A1A4-448D-9FEA-8CE6C2810995

Hydrate Production Properties Phase 1 Report Page 12 of 97
1.4.1 Results Hydrate formation began after approximately 16 hours (Figure 4), and continued for more than 65 hours. Once hydrate formation is complete, the hydrate saturation is ~30% with a water conversion rate of 75%.
Figure 4. Hydrate formation in the permeameter using excess gas method. Methane pressure is 1250 psi.
In experiments performed, starting with initial water saturations of 40%, we obtained final hydrate saturations of up to 43% with conversion rates of up to 86%. We are therefore able to control the final hydrate saturation by manipulating the initial water saturation.
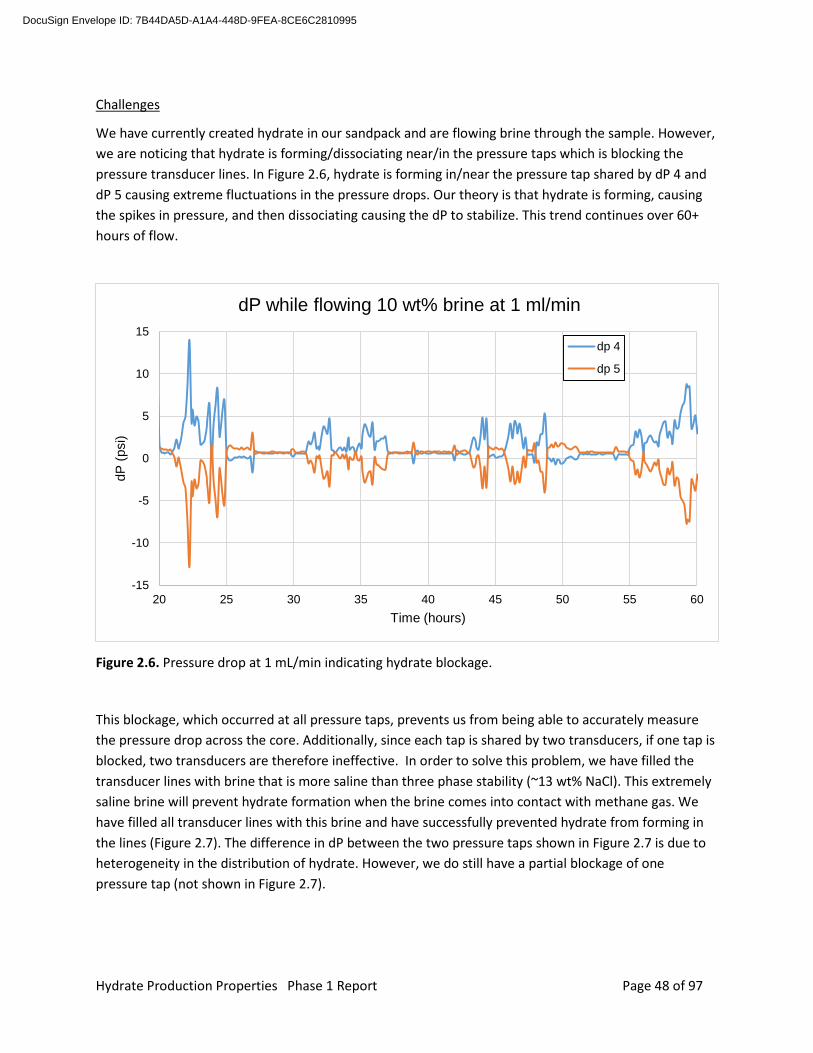
1.4.2 Challenges We have currently created hydrate in our sandpack and are flowing brine through the sample. However, we are noticing that hydrate is forming/dissociating near/in the pressure taps which is blocking the pressure transducer lines. In Figure 5, hydrate is forming in/near the pressure tap shared by dP 4 and dP 5 causing extreme fluctuations in the pressure drops. Our theory is that hydrate is forming, causing the spikes in pressure, and then dissociating causing the dP to stabilize. This trend continues over 60+ hours of flow.
DocuSign Envelope ID: 7B44DA5D-A1A4-448D-9FEA-8CE6C2810995

Hydrate Production Properties Phase 1 Report Page 13 of 97
Figure 5. Pressure drop at 1 mL/min brine at hydrate stable conditions indicating hydrate blockage. dP4 is the differential pressure between taps 4 and 5 and dP5 between taps 5 and 6.
This blockage, which occurred at all pressure taps, prevents us from being able to accurately measure the pressure drop across the core. Additionally, since each tap is shared by two transducers, if one tap is blocked, two transducers are therefore ineffective. In order to solve this problem, we have filled the transducer lines with brine that is more saline than three phase stability (~13 wt% NaCl). This extremely saline brine will prevent hydrate formation when the brine comes into contact with methane gas. We have filled all transducer lines with this brine and have successfully prevented hydrate from forming in the lines (Figure 6). The difference in dP between the two pressure taps shown in Figure 6 is due to heterogeneity in the distribution of hydrate. However, we do still have a partial blockage of one pressure tap (not shown in Figure 6).
-15
-10
-5
0
5
10
15
20 25 30 35 40 45 50 55 60
dP (p
si)
Time (hours)
dP while flowing 10 wt% brine at 1 ml/min
dp 4
dp 5
DocuSign Envelope ID: 7B44DA5D-A1A4-448D-9FEA-8CE6C2810995
Hydrate Production Properties Phase 1 Report Page 14 of 97
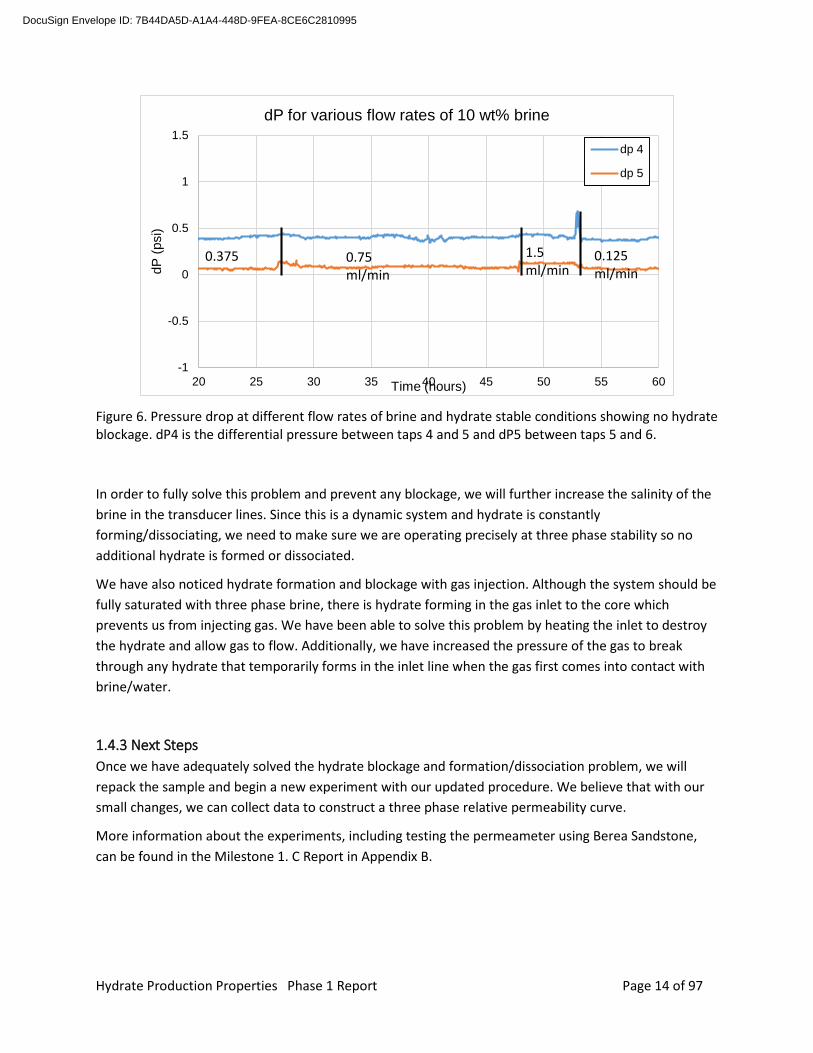
Figure 6. Pressure drop at different flow rates of brine and hydrate stable conditions showing no hydrate blockage. dP4 is the differential pressure between taps 4 and 5 and dP5 between taps 5 and 6.
In order to fully solve this problem and prevent any blockage, we will further increase the salinity of the brine in the transducer lines. Since this is a dynamic system and hydrate is constantly forming/dissociating, we need to make sure we are operating precisely at three phase stability so no additional hydrate is formed or dissociated.
We have also noticed hydrate formation and blockage with gas injection. Although the system should be fully saturated with three phase brine, there is hydrate forming in the gas inlet to the core which prevents us from injecting gas. We have been able to solve this problem by heating the inlet to destroy the hydrate and allow gas to flow. Additionally, we have increased the pressure of the gas to break through any hydrate that temporarily forms in the inlet line when the gas first comes into contact with brine/water.
1.4.3 Next Steps Once we have adequately solved the hydrate blockage and formation/dissociation problem, we will repack the sample and begin a new experiment with our updated procedure. We believe that with our small changes, we can collect data to construct a three phase relative permeability curve.
More information about the experiments, including testing the permeameter using Berea Sandstone, can be found in the Milestone 1. C Report in Appendix B.
-1
-0.5
0
0.5
1
1.5
20 25 30 35 40 45 50 55 60
dP (p
si)
Time (hours)
dP for various flow rates of 10 wt% brine
dp 4
dp 5
0.375 0.75ml/min
1.5 ml/min
0.125ml/min
DocuSign Envelope ID: 7B44DA5D-A1A4-448D-9FEA-8CE6C2810995

Hydrate Production Properties Phase 1 Report Page 15 of 97
2.0 Macro‐Scale: Depressurization of Methane Hydrate Sand Packs 2.1 Summary
We have successfully formed and dissociated hydrates, some while scanning with a CT, and achieved a mass balance in the total amount of methane through consumed during formation and recovered during dissociation.
2.2 Hydrate Formation
2.2.1 The Pressure Vessel and Experimental Setup Figure 7 shows a schematic diagram of the hydrate chamber. We created a sand pack by filling a Viton rubber sleeve with industrial sand with steel end caps on each end. The synthetic sand core is housed within an aluminum vessel filled with a confining fluid. Inlet and outlet ports at each end of the sample allow the flow of gas and water into and out of the sample. Pressure was measured at the inlet/outlet valves and in the confining fluid. Temperature was measured in the confining fluid.
Figure 7. Diagram showing the setup of the depressurization chamber.
DocuSign Envelope ID: 7B44DA5D-A1A4-448D-9FEA-8CE6C2810995
Hydrate Production Properties Phase 1 Report Page 16 of 97
2.2.2 Hydrate formation method Methane was injected into the sand pack saturated with NaCl brine or freshwater while the system was within the hydrate stability zone. Methane gas at the upstream end was held at constant pressure while brine was removed at a constant rate. The volume of the upstream gas pump and downstream brine pump were monitored continuously as well as the pressure at the inlet and outlet valves. The methane hydrate saturation was calculated by the mass balance of gas and water consumed.
2.3 Depressurization Results
We depressurized the sample by releasing a constant volume of gas from the top of the sample into a constant volume of tubing. This gas was then expanded into an inverted graduated cylinder and the volume at atmospheric pressure was recorded. We monitored the pressure in the sample at each step and the pressure rebound that occurred between each step.
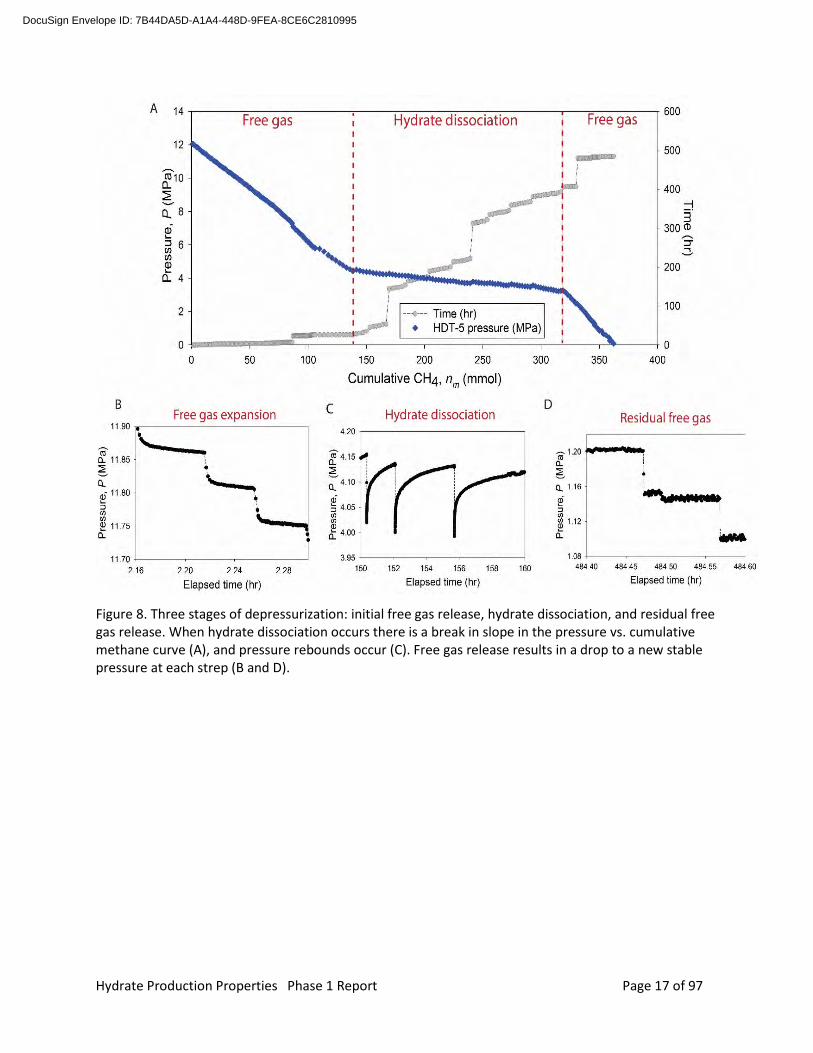
Hydrate formation with the gas injection method yielded hydrate saturations ranging from 13% to 32%. The depressurization of each sample yielded a consistent pressure vs. volume curve in which free gas was released, followed by hydrate dissociation, then release of residual gas (Figure 8). During hydrate dissociation, there is a decrease in the slope in the pressure vs. methane released curve, and pressure rebounds occur between gas releases during dissociation while the sample is shut-in.
Overall, we observed an excellent mass balance between total methane consumed during formation to methane recovered during depressurization (Figure 9). The methane mass balance matched to within 6% (within the uncertainty of our experimental set up) due to the temperature gradient in the gas at the top of the sample. We show that there are no significant leaks and the pressure rebound behavior we observe is a result of dissociation of the specimen.
The decrease in pressure during dissociation is larger than predicted by an equilibrium model assuming well-mixed salinity and temperature conditions (Figure 10). Even a very slow stepwise depressurization over several weeks will not follow conditions expected for a homogenous sample. During dissociation we also observe pressure rebounds that occur over several days with the slowest pressure recover occurring the highest salinity samples (Figure 11).
DocuSign Envelope ID: 7B44DA5D-A1A4-448D-9FEA-8CE6C2810995
Hydrate Production Properties Phase 1 Report Page 17 of 97
Figure 8. Three stages of depressurization: initial free gas release, hydrate dissociation, and residual free gas release. When hydrate dissociation occurs there is a break in slope in the pressure vs. cumulative methane curve (A), and pressure rebounds occur (C). Free gas release results in a drop to a new stable pressure at each strep (B and D).
DocuSign Envelope ID: 7B44DA5D-A1A4-448D-9FEA-8CE6C2810995

Hydrate Production Properties Phase 1 Report Page 18 of 97
Figure 9. Mass balance of methane consumed during formation (light blue) and recovered during depressurization. The average difference is 6% and within the analytical uncertainty of our experimental setup.
Figure 10. Results of slow depressurization compared to an equilibrium model based on homogenous salinity and temperature. The actual pressures, even with hours to days long recovery between each gas release step, decrease more rapidly than predicted, especially for a high salinity sample.
Experiment
HDT 4HDT 5
HDT 6HDT 8
HDT 9
Tota
l CH
4 (mm
ol)
0
100
200
300
400
FormationDepressurization
Pre
ssur
e, P
, Pf (
MP
a)
3.0
3.5
4.0
4.5
5.0
HDT-5 measured HDT-5 modeled
Cumulative hydrate CH4, nh (mmol)0 50 100 150 200
Tim
e (h
r)
0
100
200
300
400
HDT-5 (1 °C, 9.6 wt% NaCl) a
b
10
8
6
42
[NaC
l], Xsw
,f (wt%
)
P
ress
ure,
P, P
f (M
Pa)
2.0
2.5
3.0
3.5
4.0
HDT-7 measuredHDT-7 modeled
Cumulative hydrate CH4, nh (mmol)0 20 40 60 80 100
Tim
e (h
r)
0
100
200
300
400
HDT-7 (~1 °C, freshwater)e
f
2.0
1.00.0
T ( °C
)
DocuSign Envelope ID: 7B44DA5D-A1A4-448D-9FEA-8CE6C2810995

Hydrate Production Properties Phase 1 Report Page 19 of 97
Figure 11. Pressure rebounds between each gas release step, normalized to the magnitude of initial pressure drop.
2.4 Depressurization with CT Scanning
One experiment was formed and dissociated within a medical X-ray computed tomography (CT) scanner (Figure 12). The scans were collected as slices every 3 mm with a 0.23 mm pixel resolution using an X-ray tube energy of 130 kV and 100 Ma.
CT scans during pressure rebounds show a decrease in bulk density several cm into the sample and an increase in bulk density at the top of the sample (Figure 13). These results suggest the possibility of water movement and/or hydrate reformation during dissociation in these samples.
More information about all the depressurization experiments can be found in the Milestone Report 1.D in Appendix C
DocuSign Envelope ID: 7B44DA5D-A1A4-448D-9FEA-8CE6C2810995

Hydrate Production Properties Phase 1 Report Page 20 of 97
Figure 12. The depressurization vessel within the medical CT scanner.
Figure 13. Changes in bulk density in the depressurization vessel derived from CT-scanning at 1 hour, 3 hours, and 120 hours after a pressure drop and release of gas. Blue shades represent a decrease in bulk density and green-yellow shades represent an increase in bulk density.
DocuSign Envelope ID: 7B44DA5D-A1A4-448D-9FEA-8CE6C2810995

Hydrate Production Properties Phase 1 Report Page 21 of 97
3.0 Micro‐Scale: CT Observation of Methane Hydrate Sand Packs
3.1 Summary
We have successfully built and tested a micro-consolidation device for forming and imaging gas hydrate in sediments and successfully used that device to create and image methane hydrate. The following sections summarize the device conception, construction, and testing, and summarize the hydrate formation and imaging results.
3.2 Building and Testing the Device
3.2.1 Device Concept Figure 14 shows the initial conception of the device and experimental workflow. The micro consolidation device consists of a hard-walled pressure vessel transparent to X-rays that permits applying a constant vertical effective stress to the sediment. The vessel is small enough to obtain high scanning magnification and observe hydrate pore habit. The vessel should account with permeable endcaps for fluid injection. The vessel should resist pressure and temperature typical of natural hydrate bearing sediments (500 to 3500 psi and 1 to 10°C).
Figure 14. Workflow for micro CT hydrate studies at the microscale (1) Example of pore scale imaging (Chaouachi et al., 2015). (2) Micro consolidation device that we will build to use with microCT imaging. (3) X-ray tomography schematics.
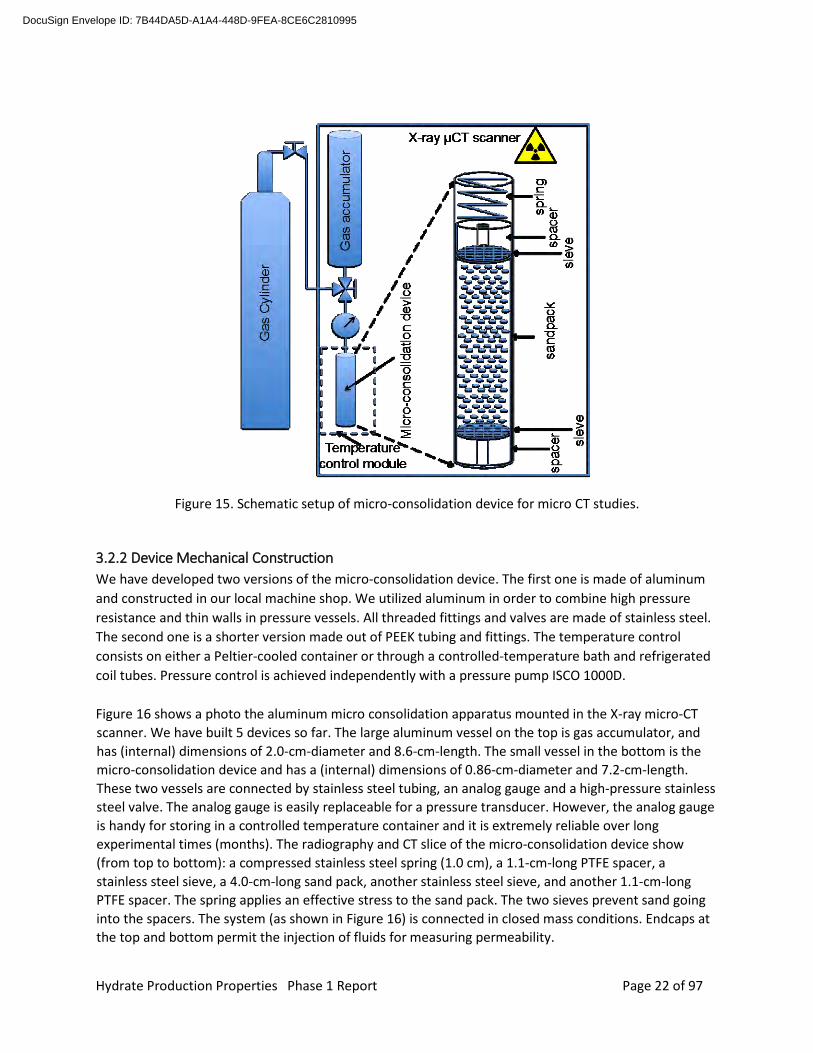
Figure 15 shows a diagram of the device for fluid flow, pressure and temperature control. The micro consolidation device connects to a small gas accumulator which is filled directly from the gas cylinder or from a pressure pump. A needle valve connects to the accumulator with the micro consolidation device. A pressure transducer/gauge monitors pressure and a thermocouple monitors temperature. The micro consolidation device accounts with endcaps able to provide fluid injection and extraction. Inside the micro consolidation device the vessel accounts with permeable spacers to confine the sand pack. A stainless-steel spring provides effective stress to the sand pack through the movable spacers. An external heat sink provides temperature controlled to the entire device.
DocuSign Envelope ID: 7B44DA5D-A1A4-448D-9FEA-8CE6C2810995
Hydrate Production Properties Phase 1 Report Page 22 of 97
Figure 15. Schematic setup of micro-consolidation device for micro CT studies.
3.2.2 Device Mechanical Construction We have developed two versions of the micro-consolidation device. The first one is made of aluminum and constructed in our local machine shop. We utilized aluminum in order to combine high pressure resistance and thin walls in pressure vessels. All threaded fittings and valves are made of stainless steel. The second one is a shorter version made out of PEEK tubing and fittings. The temperature control consists on either a Peltier-cooled container or through a controlled-temperature bath and refrigerated coil tubes. Pressure control is achieved independently with a pressure pump ISCO 1000D. Figure 16 shows a photo the aluminum micro consolidation apparatus mounted in the X-ray micro-CT scanner. We have built 5 devices so far. The large aluminum vessel on the top is gas accumulator, and has (internal) dimensions of 2.0-cm-diameter and 8.6-cm-length. The small vessel in the bottom is the micro-consolidation device and has a (internal) dimensions of 0.86-cm-diameter and 7.2-cm-length. These two vessels are connected by stainless steel tubing, an analog gauge and a high-pressure stainless steel valve. The analog gauge is easily replaceable for a pressure transducer. However, the analog gauge is handy for storing in a controlled temperature container and it is extremely reliable over long experimental times (months). The radiography and CT slice of the micro-consolidation device show (from top to bottom): a compressed stainless steel spring (1.0 cm), a 1.1-cm-long PTFE spacer, a stainless steel sieve, a 4.0-cm-long sand pack, another stainless steel sieve, and another 1.1-cm-long PTFE spacer. The spring applies an effective stress to the sand pack. The two sieves prevent sand going into the spacers. The system (as shown in Figure 16) is connected in closed mass conditions. Endcaps at the top and bottom permit the injection of fluids for measuring permeability.
DocuSign Envelope ID: 7B44DA5D-A1A4-448D-9FEA-8CE6C2810995
Hydrate Production Properties Phase 1 Report Page 23 of 97
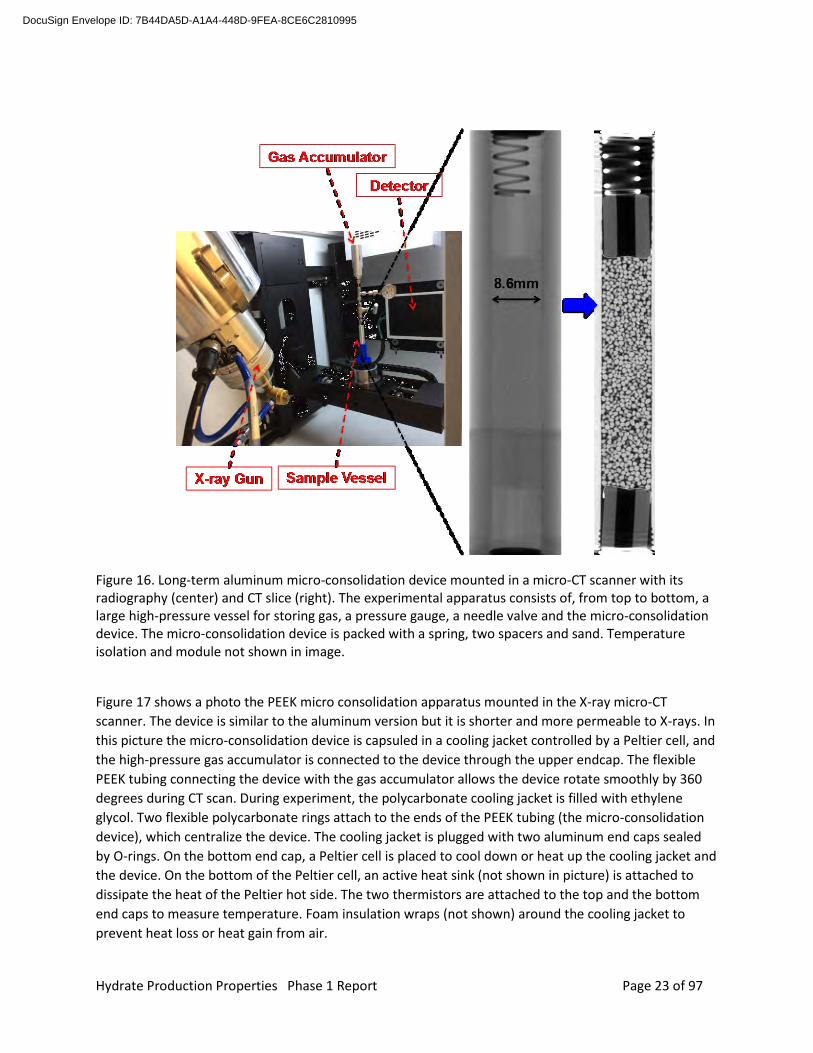
Figure 16. Long-term aluminum micro-consolidation device mounted in a micro-CT scanner with its radiography (center) and CT slice (right). The experimental apparatus consists of, from top to bottom, a large high-pressure vessel for storing gas, a pressure gauge, a needle valve and the micro-consolidation device. The micro-consolidation device is packed with a spring, two spacers and sand. Temperature isolation and module not shown in image.
Figure 17 shows a photo the PEEK micro consolidation apparatus mounted in the X-ray micro-CT scanner. The device is similar to the aluminum version but it is shorter and more permeable to X-rays. In this picture the micro-consolidation device is capsuled in a cooling jacket controlled by a Peltier cell, and the high-pressure gas accumulator is connected to the device through the upper endcap. The flexible PEEK tubing connecting the device with the gas accumulator allows the device rotate smoothly by 360 degrees during CT scan. During experiment, the polycarbonate cooling jacket is filled with ethylene glycol. Two flexible polycarbonate rings attach to the ends of the PEEK tubing (the micro-consolidation device), which centralize the device. The cooling jacket is plugged with two aluminum end caps sealed by O-rings. On the bottom end cap, a Peltier cell is placed to cool down or heat up the cooling jacket and the device. On the bottom of the Peltier cell, an active heat sink (not shown in picture) is attached to dissipate the heat of the Peltier hot side. The two thermistors are attached to the top and the bottom end caps to measure temperature. Foam insulation wraps (not shown) around the cooling jacket to prevent heat loss or heat gain from air.
DocuSign Envelope ID: 7B44DA5D-A1A4-448D-9FEA-8CE6C2810995

Hydrate Production Properties Phase 1 Report Page 24 of 97
More details about the device construction and automations can be found in the Milestone 1.E Report in Appendix D.
Figure 17. PEEK micro-consolidation device for micro CT studies. The experimental setup includes temperature reading and control system, the micro-consolidation device itself in the cooling jacket and pressure control through a high-pressure gas accumulator.
3.3 Hydrate Formation Method
We use NaBr brine as the aqueous phase instead of using NaCl brine in methane hydrate experiments. X-ray contrast between methane hydrate and NaCl brine is low. For instance, previous synchrotron CT images on methane hydrate bearing sand cannot clearly segment between NaCl brine phase and methane hydrate phase due to the low X-ray contrast (Kerkar et al., 2014). NaBr brine is a stronger X-ray attenuating material and our experiments do show clearer segmentation between the aqueous phase and methane hydrate phase in X-ray CT images.
3.4 X-ray Image Segmentation Procedure
First, we segment for the grain phase using built-in threshold algorithm in ImageJ, since the CT grayscale difference between sand and all other phases are large enough. Second, we remove grain from the original image using the segmented grain image. The remaining phases are methane gas, methane hydrate and brine. Since the CT grayscale number of methane gas is significantly lower than hydrate and brine, we segment the image again to obtain methane gas. Third, we remove both sand and methane gas from the original CT image, such that only hydrate and brine are left. Since brine has a higher CT grayscale number than hydrate, these two phases can be separated. The challenge of separating brine
DocuSign Envelope ID: 7B44DA5D-A1A4-448D-9FEA-8CE6C2810995
Hydrate Production Properties Phase 1 Report Page 25 of 97
with hydrate is that, the CT grayscale difference between hydrate and brine is not as large as the differences in the first two steps. Hence, manual thresholding is necessary in this final step
3.5 Micro‐Scale CT Observations and Analysis
In summary, we have conducted 4 experiments of methane hydrate growth in sandy sediments (Exp1-Exp4). During the recent two experiments (Exp3 and Exp4), we achieved hydrate formation and evidence of methane hydrate formation with X-ray microtomography.
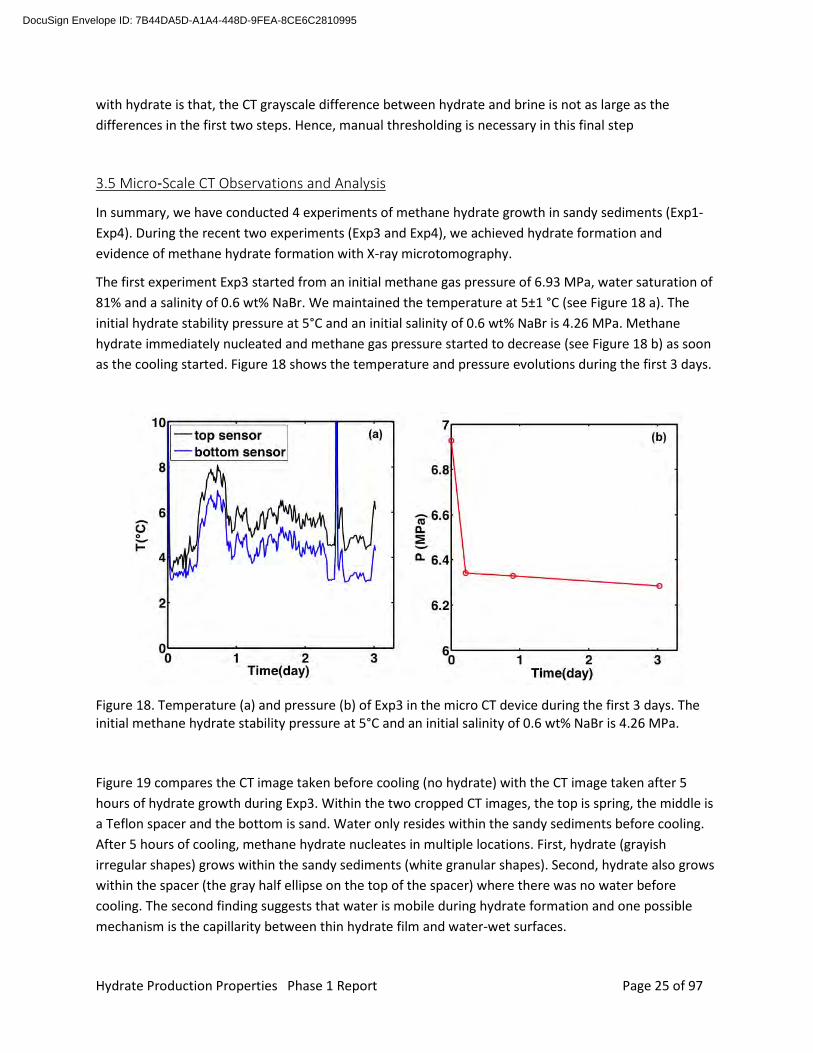
The first experiment Exp3 started from an initial methane gas pressure of 6.93 MPa, water saturation of 81% and a salinity of 0.6 wt% NaBr. We maintained the temperature at 5±1 °C (see Figure 18 a). The initial hydrate stability pressure at 5°C and an initial salinity of 0.6 wt% NaBr is 4.26 MPa. Methane hydrate immediately nucleated and methane gas pressure started to decrease (see Figure 18 b) as soon as the cooling started. Figure 18 shows the temperature and pressure evolutions during the first 3 days.
Figure 18. Temperature (a) and pressure (b) of Exp3 in the micro CT device during the first 3 days. The initial methane hydrate stability pressure at 5°C and an initial salinity of 0.6 wt% NaBr is 4.26 MPa.
Figure 19 compares the CT image taken before cooling (no hydrate) with the CT image taken after 5 hours of hydrate growth during Exp3. Within the two cropped CT images, the top is spring, the middle is a Teflon spacer and the bottom is sand. Water only resides within the sandy sediments before cooling. After 5 hours of cooling, methane hydrate nucleates in multiple locations. First, hydrate (grayish irregular shapes) grows within the sandy sediments (white granular shapes). Second, hydrate also grows within the spacer (the gray half ellipse on the top of the spacer) where there was no water before cooling. The second finding suggests that water is mobile during hydrate formation and one possible mechanism is the capillarity between thin hydrate film and water-wet surfaces.
DocuSign Envelope ID: 7B44DA5D-A1A4-448D-9FEA-8CE6C2810995

Hydrate Production Properties Phase 1 Report Page 26 of 97
Figure 19. CT image taken before hydrate formation and CT image taken at 5 hours after the temperature and the pressure are shifted into hydrate stability zone during Exp3.
Figure 20. Left: original axial CT image of methane hydrate bearing sand after 4 hours of hydrate growth during Exp4, middle: segmented image that show grain as gray, brine as blue and hydrate as red and methane gas as white, right: hydrate and brine saturation profiles.
DocuSign Envelope ID: 7B44DA5D-A1A4-448D-9FEA-8CE6C2810995

Hydrate Production Properties Phase 1 Report Page 27 of 97
Figure 20 shows the axial CT image of methane hydrate bearing sand after 4 hours of hydrate growth during Exp4 along with phase segmentation and saturation profiles. In Figure 20 middle, grain is shown as gray, brine is shown as blue, methane hydrate is shown as red and methane gas is shown as white. Since methane gas enters the sandpack from the bottom, the original water saturation increases towards the bottom and so does the hydrate saturation profile. After 4 hours of hydrate formation, less than 20% of original brine converts to hydrate. The average hydrate saturation in this case is 1.3% and the average brine saturation is 5.5%.
3.5.1 Observation of methane hydrate and pore habit In both successful experiments, we clearly observe methane hydrate within sandy sediments. Figure 21 shows one original CT slice and its segmented analog after 5 hours of methane hydrate growth in Exp3. Similar to previous micro-CT observations on xenon hydrate bearing sand (Chen & Espinoza, 2018), methane hydrate also displays a porous structure, irregular shapes and heterogeneous distribution at the initial growth stage. The calculated hydrate saturation is 58.2 % and the porosity is 42.6 % in this particular region. In Exp3, there is difficulty in defining the brine phase and the hydrate phase.
The second experiment (Exp4) started from an initial methane gas pressure of 6.83 MPa, water saturation of 6.0 % and a salinity of 1.5 wt% NaBr. We maintained the temperature at 4.4±1 °C. The initial hydrate stability pressure at 4.4°C and an initial salinity of 1.5 wt% NaBr is 4.09 MPa.
Figure 21. The original (left) and the segmented (right) CT slices of the sand at the same position after 5 hours of hydrate growth in Exp3. In the segmented CT slice, black is sand grain, white is methane gas and the gray is methane hydrate. The porosity is 42.6% and the hydrate saturation is 58.2%. The image resolution is 12.0 µm.
Figure 22 shows one slice of original CT and its segmented CT after 2 days of methane hydrate growth in sand. The upper-left quarter of the original CT (Figure 22 upper left) shows that the pore space formed by three sand grains is filled with a mixture of NaBr brine and methane hydrate. Figure 22 bottom shows the grayscale profile of the red arrow in the original CT (Figure 22 upper left). The decrease in grayscale
DocuSign Envelope ID: 7B44DA5D-A1A4-448D-9FEA-8CE6C2810995

Hydrate Production Properties Phase 1 Report Page 28 of 97
number indicates that, the outside of the water droplets has converted to methane hydrates, while the inside is still brine and more concentrated in NaBr. A threshold of 22000 (16-bit gray scale) is chosen herein to segment between brine and hydrate. The segmented CT image (Figure 22 upper right) shows the coexistence of four different phases, including, sand, brine, hydrate, and methane gas.
More information about the experiments including initial experiments with Xenon hydrate can be found in the Milestone 1.F Report in Appendix E.
Figure 22. The co-existence of methane gas, methane hydrate and brine in sandy sediments after 2 days of hydrate growth in brine during Exp4. Upper left: original CT of the sample; upper right: segmented CT showing sand as black, brine as dark gray, methane hydrate as light gray and gas as white; bottom, CT grayscale profile of the red arrow in original CT, which shows the inside of the pore is brine and the outside of the pore is methane hydrate with a threshold of 22000. Image resolution: 12.50 µm.
DocuSign Envelope ID: 7B44DA5D-A1A4-448D-9FEA-8CE6C2810995
Hydrate Production Properties Phase 1 Report Page 29 of 97
4.0 Micro‐Scale: Raman Observation of Methane‐Gas‐Water Systems 4.1 Summary
This section summarizes our achievement of building and integrating the high-pressure gas mixing chamber including the chamber design, data acquisition system, and testing of the device. And, summarizes our achievement of Micro-Raman analysis of synthetic complex methane hydrate during formation and dissociation
4.2 Hydrate Formation
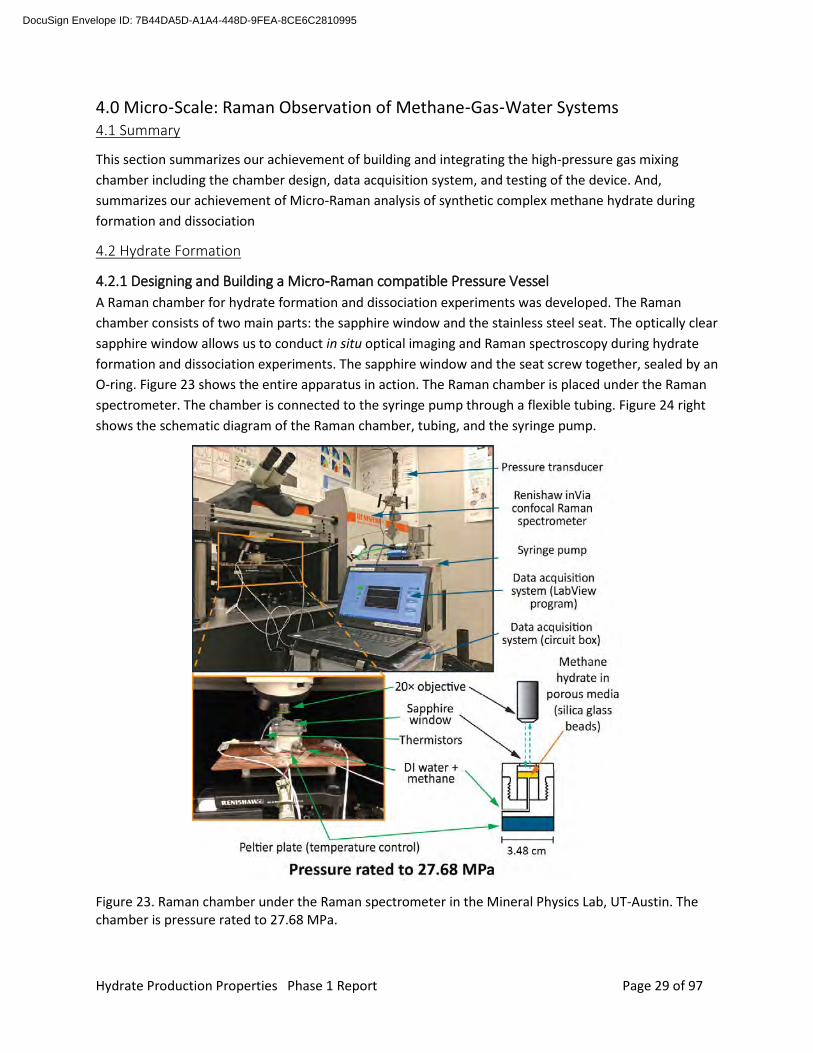
4.2.1 Designing and Building a Micro‐Raman compatible Pressure Vessel A Raman chamber for hydrate formation and dissociation experiments was developed. The Raman chamber consists of two main parts: the sapphire window and the stainless steel seat. The optically clear sapphire window allows us to conduct in situ optical imaging and Raman spectroscopy during hydrate formation and dissociation experiments. The sapphire window and the seat screw together, sealed by an O-ring. Figure 23 shows the entire apparatus in action. The Raman chamber is placed under the Raman spectrometer. The chamber is connected to the syringe pump through a flexible tubing. Figure 24 right shows the schematic diagram of the Raman chamber, tubing, and the syringe pump.
Figure 23. Raman chamber under the Raman spectrometer in the Mineral Physics Lab, UT-Austin. The chamber is pressure rated to 27.68 MPa.
DocuSign Envelope ID: 7B44DA5D-A1A4-448D-9FEA-8CE6C2810995
Hydrate Production Properties Phase 1 Report Page 30 of 97
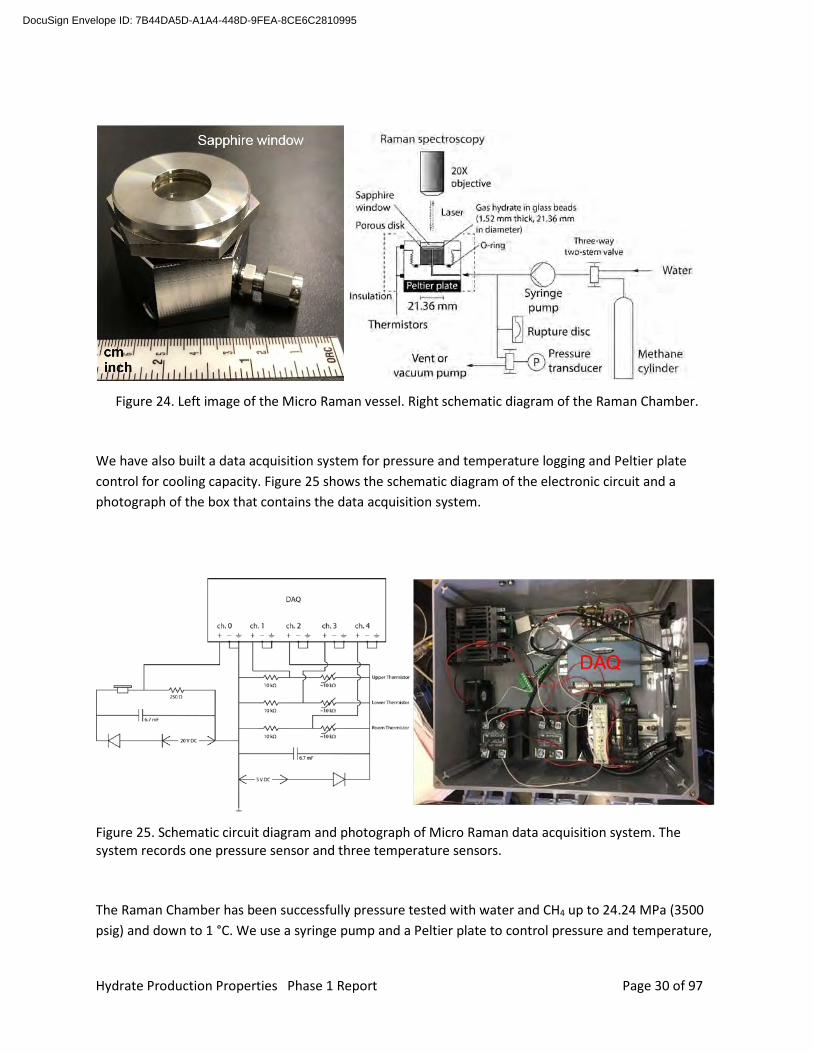
Figure 24. Left image of the Micro Raman vessel. Right schematic diagram of the Raman Chamber.
We have also built a data acquisition system for pressure and temperature logging and Peltier plate control for cooling capacity. Figure 25 shows the schematic diagram of the electronic circuit and a photograph of the box that contains the data acquisition system.
Figure 25. Schematic circuit diagram and photograph of Micro Raman data acquisition system. The system records one pressure sensor and three temperature sensors.
The Raman Chamber has been successfully pressure tested with water and CH4 up to 24.24 MPa (3500 psig) and down to 1 °C. We use a syringe pump and a Peltier plate to control pressure and temperature,
DocuSign Envelope ID: 7B44DA5D-A1A4-448D-9FEA-8CE6C2810995
Hydrate Production Properties Phase 1 Report Page 31 of 97
respectively. We have conducted experiments at conditions of 500 psig – 3500 psig, 1 °C to 22 °C to simulate natural hydrate reservoir conditions. More information about the design, testing and data acquisition can be found in the Milestone 1.G Milestone Report in Appendix F.
4.2.2 Hydrate Formation Method Methane hydrate was synthesized using an “excess water” technique. The glass beads were initially filled with methane vapor. Water was then supplied to compress the methane vapor and elevate the pressure to hydrate stability zone (15 MPa and 3 °C). We monitored the hydrate formation with optical imaging and micro-Raman spectroscopy. In addition to hydrate formation, we dissociated the methane hydrate by slowly decreasing the pressure.
We characterized the formation and dissociation stages using micro-Raman spectroscopy and optical imaging. We utilized the advantages of high spatial and spectral resolution of the Renishaw inVia Raman spectrometer in the Mineral Physics Lab at the University of Texas at Austin. The spatial resolution of the Raman spectrometer is below 1 µm on a dry sample. However, in our Raman Chamber, the spatial resolution was limited to 3 – 5 µm, as the sample contained liquid water and was probed through a sapphire viewing window of 4 mm in thickness.
4.3 Micro-Raman Observations and Analysis
4.3.1 Observations during Hydrate Formation Based on thermodynamic calculations, methane hydrate is only known to form structure I (sI) hydrate as the thermodynamically stable phase, under pressure and temperature conditions relevant to natural reservoirs (< 50 MPa and T < 310 K). However, previous experiments in bulk phase without porous media have observed the coexistence of stable structure I and metastable structure II (sII) methane hydrate (Schicks and Ripmeester, 2004). As a metastable phase, sII hydrate is less stable than sI hydrate. Schicks and Ripmeester (2004) observed the structural transformation of sII hydrate recrystallizing into sI hydrate.
The coexistence of sI and sII hydrate in porous media was observed in our experiments, after forming methane hydrate in glass beads (Figure 26). Figure 27 shows the structural transformation initiated on the glass bead surfaces and progressed into the pore center over hundreds of hours. The sII hydrate converted to sI hydrate at the consumption of sII hydrate. Figure 28 shows the fractions of sI and sII hydrate over time.
DocuSign Envelope ID: 7B44DA5D-A1A4-448D-9FEA-8CE6C2810995

Hydrate Production Properties Phase 1 Report Page 32 of 97
Figure 26. Pressure and temperature evolution of a Micro Raman hydrate formation and dissociation experiment.
Figure 27. Annotated optical images and Raman peak intensity ratios of large to small cages (intensity of Raman peak at 2902 cm-1 to peak at 2912 cm-1). The circles outline glass beads. Upon hydrate formation, we observed the coexistence of stable sI (yellow) and metastable sII (blue) hydrate. Metastable sII to stable sI transformation initiated on grain surfaces and then progressed into the pore center. Stable sI hydrate grew into the pore space at the consumption of sII hydrate.
DocuSign Envelope ID: 7B44DA5D-A1A4-448D-9FEA-8CE6C2810995

Hydrate Production Properties Phase 1 Report Page 33 of 97
Figure 28. During hydrate formation, the fractions of structure I (sI) and structure II (sII) hydrates over time. Since sII hydrate is metastable under the experimental conditions, sII hydrate converted to sI hydrate at the consumption of sII hydrate.
4.3.2 Observations during Hydrate dissociation We dissociated methane hydrates by depressurization at constant temperature in the Raman Chamber over 1 hour (Figure 29). We acquired Raman 2D mapping and optical images of the samples in glass beads. In the pore network (Figure 30), methane hydrate dissociated into gaseous methane and liquid water. The gaseous methane expanded radially in the pore network and carried out further hydrate dissociation. At the pore scale, as shown in Figure 31, dissociation started around porous medium grains (by means of spherical glass beads in this experiment). Gradually, hydrate dissociation propagated into the pore space. Methane hydrate dissociation is an endothermal reaction. We interpret that the porous medium grains (silica glass beads) provide heat to the hydrate dissociation due to their high heat capacities. We interpret that the hydrate dissociation along grains creates a connected fluid network on grain surfaces and pore networks. This connected fluid flow path may be crucial to gas hydrate reservoir permeability evolution during production. More information about the experiments can be found in the Milestone 1.H report in Appendix G.
DocuSign Envelope ID: 7B44DA5D-A1A4-448D-9FEA-8CE6C2810995
Hydrate Production Properties Phase 1 Report Page 34 of 97
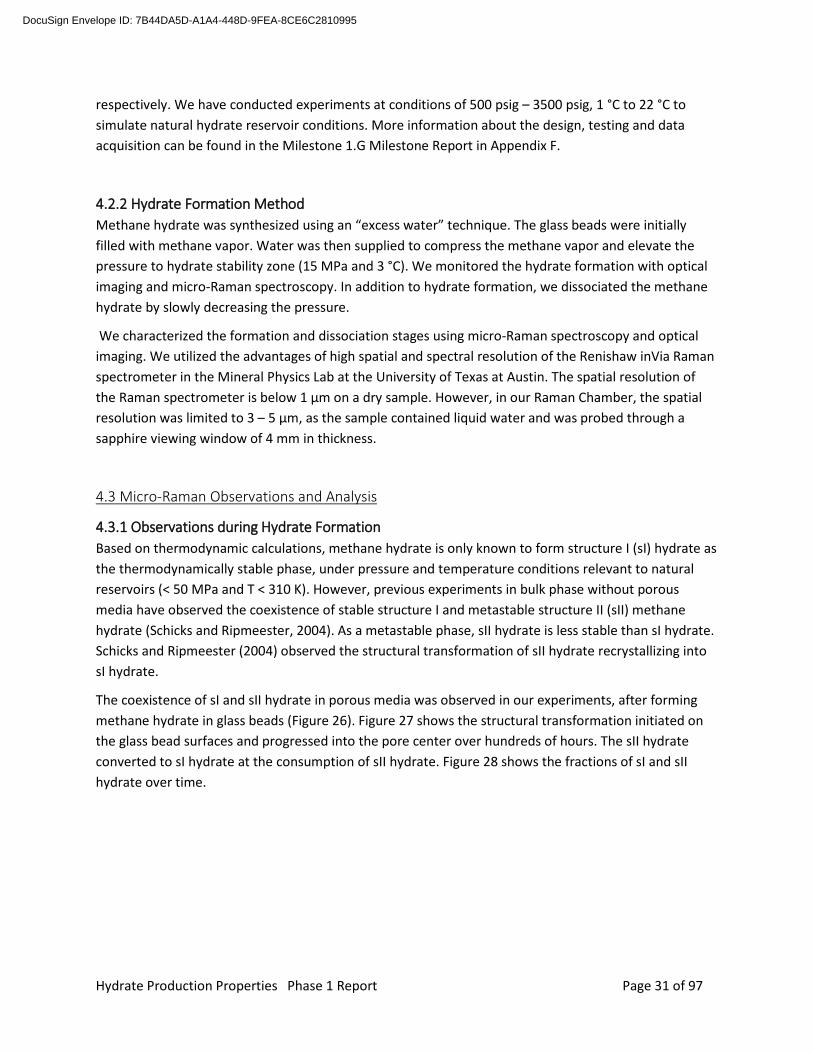
Figure 29. Pressure and temperature evolution during dissociation in the Micro Raman vessel. Time zero (t0) is aligned to the start of the hydrate dissociation. The pressure was decreased in 0.1 MPa steps at constant temperature. Due to the small size of the sample, all hydrate dissociated after about an hour.
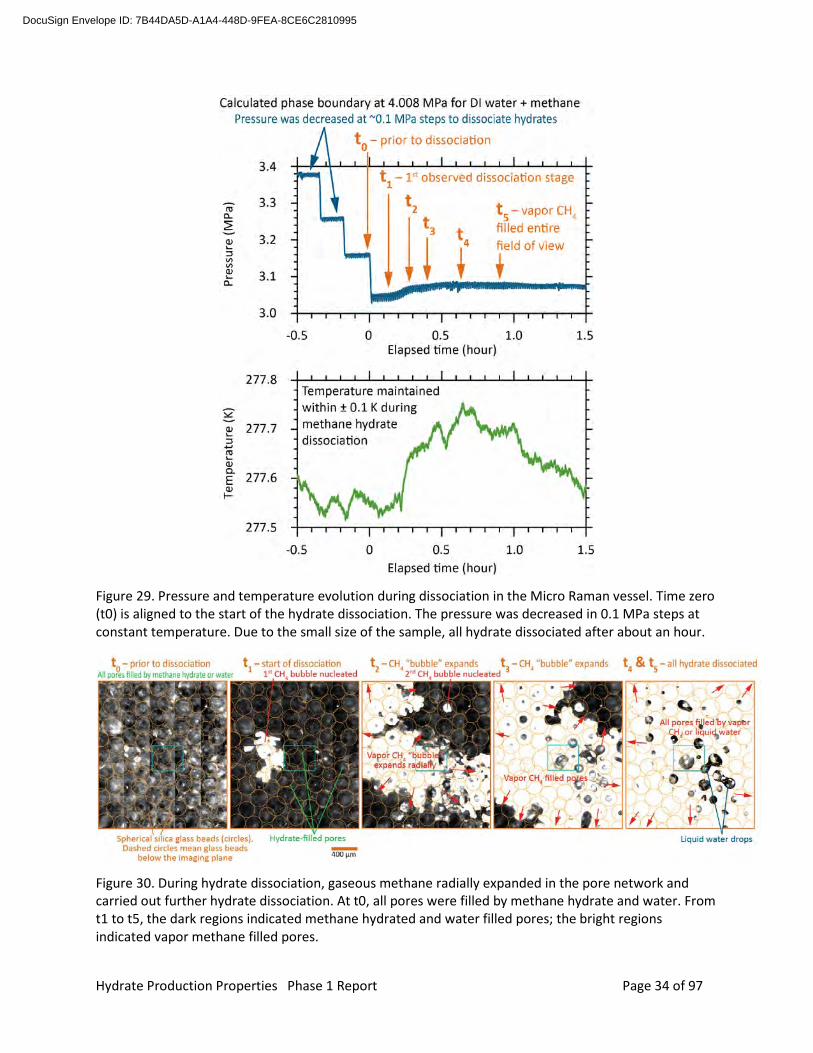
Figure 30. During hydrate dissociation, gaseous methane radially expanded in the pore network and carried out further hydrate dissociation. At t0, all pores were filled by methane hydrate and water. From t1 to t5, the dark regions indicated methane hydrated and water filled pores; the bright regions indicated vapor methane filled pores.
DocuSign Envelope ID: 7B44DA5D-A1A4-448D-9FEA-8CE6C2810995
Hydrate Production Properties Phase 1 Report Page 35 of 97
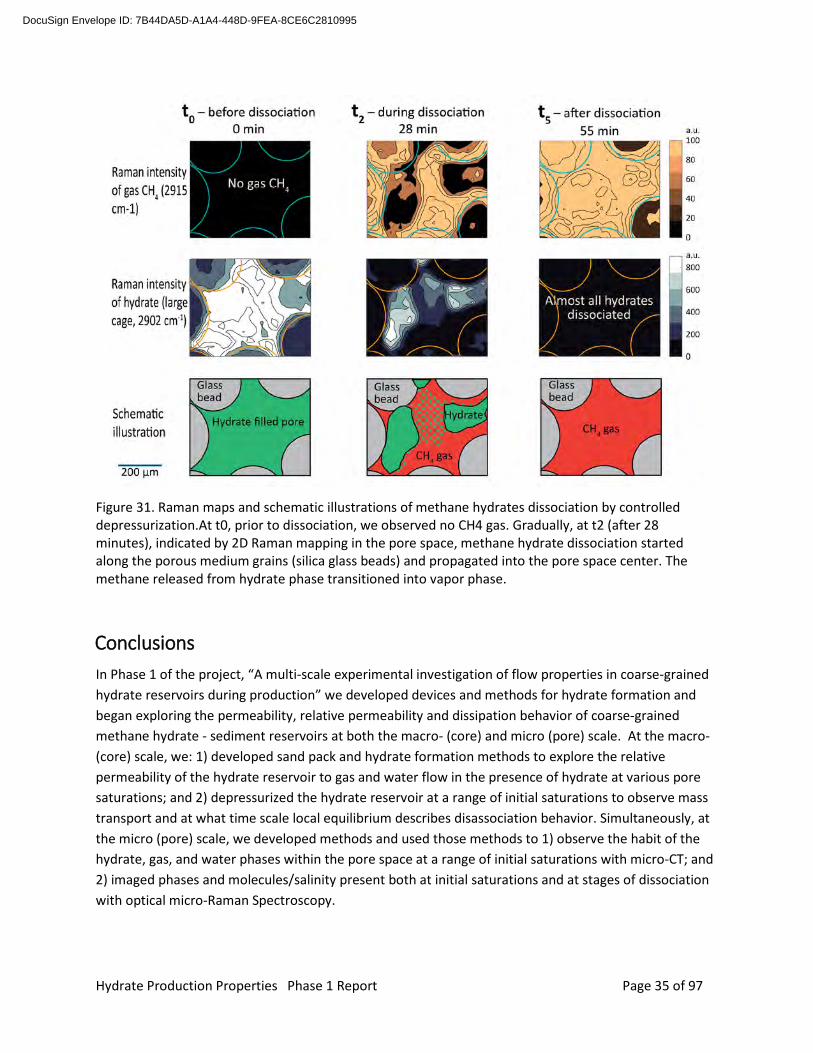
Figure 31. Raman maps and schematic illustrations of methane hydrates dissociation by controlled depressurization.At t0, prior to dissociation, we observed no CH4 gas. Gradually, at t2 (after 28 minutes), indicated by 2D Raman mapping in the pore space, methane hydrate dissociation started along the porous medium grains (silica glass beads) and propagated into the pore space center. The methane released from hydrate phase transitioned into vapor phase.
Conclusions In Phase 1 of the project, “A multi-scale experimental investigation of flow properties in coarse-grained hydrate reservoirs during production” we developed devices and methods for hydrate formation and began exploring the permeability, relative permeability and dissipation behavior of coarse-grained methane hydrate - sediment reservoirs at both the macro- (core) and micro (pore) scale. At the macro- (core) scale, we: 1) developed sand pack and hydrate formation methods to explore the relative permeability of the hydrate reservoir to gas and water flow in the presence of hydrate at various pore saturations; and 2) depressurized the hydrate reservoir at a range of initial saturations to observe mass transport and at what time scale local equilibrium describes disassociation behavior. Simultaneously, at the micro (pore) scale, we developed methods and used those methods to 1) observe the habit of the hydrate, gas, and water phases within the pore space at a range of initial saturations with micro-CT; and 2) imaged phases and molecules/salinity present both at initial saturations and at stages of dissociation with optical micro-Raman Spectroscopy.
DocuSign Envelope ID: 7B44DA5D-A1A4-448D-9FEA-8CE6C2810995

Hydrate Production Properties Phase 1 Report Page 36 of 97
References Chaouachi, M., Falenty, A., Sell, K., Enzmann, F., Kersten, M., Haberthür, D., & Kuhs, W. F. (2015). Microstructural evolution of gas hydrates in sedimentary matrices observed with synchrotron X-ray computed tomographic microscopy. Geochemistry, Geophysics, Geosystems, 16(6), 1711–1722. https://doi.org/10.1002/2015GC005811
Chen, X., & Espinoza, D. N. (2018). Ostwald ripening changes the pore habit and spatial variability of clathrate hydrate. Fuel, 214, 614–622. https://doi.org/10.1016/j.fuel.2017.11.065
Chen, X., Verma, R., Nicolas Espinoza, D., & Prodanović, M. (2018). Pore-Scale Determination of Gas Relative Permeability in Hydrate-Bearing Sediments Using X-Ray Computed Micro-Tomography and Lattice Boltzmann Method. Water Resources Research, 54(1), 600–608. https://doi.org/10.1002/2017WR021851
Creagh, D. C., & Hubbell, J. H. (1992). X-Ray Absorption (or Attenuation) Coefficients, Sec. 4.2.4. In International Tables for Crystallography (A.J.C. Wilson, ed., Vol. C, pp. 189–206). Dordrecht: Kluwer Academic Publishers.
Jin, Y., Nagao, J., Hayashi, J., Shimada, W., Ebinuma, T., & Narita, H. (2008). Observation of Xe Hydrate Growth at Gas−Ice Interface by Microfocus X-ray Computed Tomography. The Journal of Physical Chemistry C, 112(44), 17253–17256. https://doi.org/10.1021/jp803525m
Jin, Y., Konno, Y., & Nagao, J. (2014). Pressurized subsampling system for pressured gas-hydrate-bearing sediment: Microscale imaging using X-ray computed tomography. Review of Scientific Instruments, 85(9), 094502. https://doi.org/10.1063/1.4896354
Kerkar, P. B., Horvat, K., Jones, K. W., & Mahajan, D. (2014). Imaging methane hydrates growth dynamics in porous media using synchrotron X-ray computed microtomography. Geochemistry, Geophysics, Geosystems, 15(12), 4759–4768. https://doi.org/10.1002/2014GC005373
Kumar, A., Maini, B., Bishnoi, P. R., Clarke, M., Zatsepina, O., & Srinivasan, S. (2010). Experimental determination of permeability in the presence of hydrates and its effect on the dissociation characteristics of gas hydrates in porous media. Journal of Petroleum Science and Engineering, 70(1–2), 114–122. https://doi.org/10.1016/j.petrol.2009.10.005
Schicks, J. M., & Ripmeester, J. A. (2004). The coexistence of two different methane hydrate phases under moderate pressure and temperature conditions: Kinetic versus thermodynamic products. Angewandte Chemie International Edition, 43(25), 3310-3313.
Sloan Jr, E. D., & Koh, C. (2007). Clathrate hydrates of natural gases. CRC press. Retrieved from http://books.google.com/books?hl=en&lr=&id=T7LC8ldaVR4C&oi=fnd&pg=PP1&dq=info:q1B6AsGWX8QJ:scholar.google.com&ots=Hxkt7iI_Tx&sig=JJlgOhIxIYIp8UDGMIPRu9DJHP0
Uchida, T., Takeya, S., Chuvilin, E. M., Ohmura, R., Nagao, J., Yakushev, V. S., ... & Narita, H. (2004). Decomposition of methane hydrates in sand, sandstone, clays, and glass beads. Journal of geophysical research: solid earth, 109(B5).
DocuSign Envelope ID: 7B44DA5D-A1A4-448D-9FEA-8CE6C2810995

Hydrate Production Properties Phase 1 Report Page 37 of 97
Acronyms Table 2. List of Acronyms
Acronym or Term Definition
A cross-sectional area of the sandpack
C Celsius
CH4 Methane
cm centimeter
CT Computed Tomography
dP Pressure difference between two adjacent pressure taps, dP1 being the difference between tap 1 and 2
dP Total Pressure difference between the first and last pressure taps
EXP Experiment
g gallons
HDT Hydrate Depressurization Test
K Kelvin
k intrinsic (hydrate-free, single-phase flow) permeability
kri relative permeability to phase i
mL milliliters
mm, µm Millimeter, micrometer
mmol millimoles
MPa Megapascals
MCH4 molar mass of methane (16 g/mol)
MH molar mass of sI hydrate (119.5 g/mol)
Mw molar mass of water
μi is the viscosity of phase i
NaCl Sodium Chloride
P Temperature
ΔPi pressure drop of phase i over length L
PEEK Polyether ether ketone
DocuSign Envelope ID: 7B44DA5D-A1A4-448D-9FEA-8CE6C2810995

Hydrate Production Properties Phase 1 Report Page 38 of 97
psi Pounds per square inch
psig Pounds per square inch as measured on the pressure gauge
ρH density of sI hydrate (0.925 g/cm3)
ρCH4 density of methane gas at experimental conditions (0.07225 g/cm3)
ρw density of water
Qi volumetric flow rate of phase i (either water or gas)
R conversion rate of moles of H2O from water/brine to hydrate
sI structure one hydrate
sII structure two hydrate
Sh hydrate saturation, % of pore volume occupied by hydrate
Sw Water saturation, percentage of pore volume occupied by water
t Time
T Pressure
VCH4 volume of methane injected into the core during hydrate formation
Vp pore volume of the sandpack
VW initial volume of water present
DocuSign Envelope ID: 7B44DA5D-A1A4-448D-9FEA-8CE6C2810995

Hydrate Production Properties Phase 1 Report Page 39 of 97
Appendix A
DOE Award No.: DE-FE-0028967
Milestone Report
Milestone 1.B: Achieve hydrate formation in sand-pack
SUMMARY
This milestone report summarizes our achievement of hydrate formation in sand-pack. This Millstone is specific to Sub-task 2.1 Laboratory Creation of Sand‐Pack Samples at Varying Hydrate Levels however, hydrate formation was achieved in all four chambers associated with Sub-tasks 2.1, Task 3, Task 4, and Task 5. The following sections summarize the conception, testing, experimental procedure, and results. Evidence for the formation of hydrate in the other chambers are outlined in Milestone reports 1.D, 1.E, 1.F, and 1.G. The PIs in charge of this task are H. Daigle and D DiCarlo. Z. Murphy executed design, followed device construction, and performed experiments with assistance from Peter Polito and Joshua O’Connell.
A. Device Conception
Once all of the equipment was acquired, the six differential pressure transducers were assembled and placed on our cart to be able to move the entire set up into the cold room for hydrate formation. Additionally, the pressure transducers were calibrated, leak tested, and pressure tested. Once the transducers were operational, we began leak testing the entire setup. The transducers and many lines were pressure and leak tested for an extended period while the core holder was packed with a sand pack and pressurized to experimental conditions and left to maintain pressure. After adjustments, the set up was deemed to be sufficiently leak-proof, and we began taking two phase relative permeability measurements using nitrogen and deionized water. The goal with this is to practice taking relative permeability measurements using our new set up before we introduce methane and hydrates into the system.
In addition to preparing our setup for the measurements, we also built an environmental chamber to house our experiment inside of the cold storage room. The temperature inside of the cold room is ~6.0°C±1.0°C. Given our experimental conditions, this temperature is sufficient for producing hydrates as it lies within the stability zone (see Figure 2.1). However, to conduct more accurate relative permeability measurements, we would like the temperature to be more constant than ±1.0°C. Therefore, we are
DocuSign Envelope ID: 7B44DA5D-A1A4-448D-9FEA-8CE6C2810995

Hydrate Production Properties Phase 1 Report Page 40 of 97
building a chamber that will house our cart/set up where we will be able to control the temperature to ±0.1°C. This will give us a much more stable environment for our hydrates and more control over our experimental conditions.
Figure 2.1 Stability zone for sI hydrate with pure water.
After completing the construction of the system to conduct steady state relative permeability measurements, we have been testing the equipment with rock cores and are now conducting permeability measurements on hydrate bearing sediment. Due to the complications of sand packs and hydrate, we tested the system with a Berea Sandstone core to confirm that our setup worked with minimal fluid leakage. We conducted intrinsic permeability and relative permeability to gas measurements on the Berea core. The intrinsic permeability was 325 mD, and the relative permeability curve is shown in Figure 2.2. We decided that the results were acceptable and moved forward with tests with the sandpack.
0
200
400
600
800
1000
1200
1400
1600
0 2 4 6 8 10 12 14
Pres
sure
(PSI
)
Temperature (C)
P-T for Hydrates with DI water
Stability
Experiment Conditions
Hydrate Stable
Hydrate Unstable
DocuSign Envelope ID: 7B44DA5D-A1A4-448D-9FEA-8CE6C2810995

Hydrate Production Properties Phase 1 Report Page 41 of 97
Figure 2.2. Relative permeability to water (blue) in gas (orange) in Berea sandstone measured with our experimental setup.
After dealing with some complications from pressurizing the sandpack, we began forming hydrates in the core holder with six pressure taps hooked up to the differential pressure transducers, as seen in Figure 2.3 below. A photograph of the setup is shown in Figure 2.4.
DocuSign Envelope ID: 7B44DA5D-A1A4-448D-9FEA-8CE6C2810995

Hydrate Production Properties Phase 1 Report Page 42 of 97
Figure 2.3. Experimental design.
DocuSign Envelope ID: 7B44DA5D-A1A4-448D-9FEA-8CE6C2810995

Hydrate Production Properties Phase 1 Report Page 43 of 97
Figure 2.4. Photograph of experimental setup.
B. Hydrate formation
Sand was prepared in a moist state, mixed with kaolinite for better hydrate nucleation, and tamped into the core holder to a porosity of 35% and water saturation of 40%. The core holder was raised to 1300 psi confining pressure and 1250 psi pore (methane) pressure. Then, the entire setup placed in cold room at 6°C, and pore pressure was maintained as 1250 psi as hydrate formed and consumed methane. Hydrate formation was evidenced by rapid consumption of methane that was detectable by the pump. This shows up in the data as a large drop in pump volume around 16 hours:
DocuSign Envelope ID: 7B44DA5D-A1A4-448D-9FEA-8CE6C2810995

Hydrate Production Properties Phase 1 Report Page 44 of 97
Figure 2.5. Hydrate Formation
In a typical experiment, hydrate formation began after approximately 16 hours (Figure 2.5), and continued for more than 65 hours. Once hydrate formation is complete, the hydrate saturation is ~30% with a water conversion rate of 75%.
C. Determining the Hydrate Saturation
In order to determine the hydrate saturation, the properties of the core and of methane hydrate were used. Since the core had a volume of 180.18 cm3, a porosity of 35%, and a water saturation of 40%, the amount of methane that should theoretically be consumed can be calculated. The following values were used in the calculation: Initial water volume = 25.23 cm3; Density of water=1.000 g/cm3; Density of methane= 0.07224 g/cm3; Density of hydrate = 0.925 g/cm3; molar mass of hydrate = 119.5 g/mol. We assume 1 mole of hydrate contains 1 mole of methane and 5.75 moles of water Initial moles of water present: (25.23 cm3)*(1/(18.02 g/mol))=1.40 mol Moles of methane required for complete coversion of water: 1.40/5.75 = 0.243 mol Mass of methane required for complete conversion: 0.243*(16.04 g/mol) = 3.91 g Volume of hydrate required for complete conversion = 3.91/0.07224 = 54.13 mL In example 1, there was about 40 mL of methane consumed which is a 74% conversion rate. This 40 mL of methane is equal to 0.1801 mol, so 0.1801 mol of hydrate was formed with a mass of 21.52 g and a volume of 23.27 cm3. This filled 37% of the pore volume for a 37% hydrate saturation. In a subsequent experiment, converted 86% of the initial methane to achieve a hydrate saturation of 43%
DocuSign Envelope ID: 7B44DA5D-A1A4-448D-9FEA-8CE6C2810995

Hydrate Production Properties Phase 1 Report Page 45 of 97
Appendix B
DOE Award No.: DE-FE-0028967
Milestone Report
Milestone 1.C: Controlled and measured hydrate saturation using different methods
SUMMARY
This milestone report summarizes our achievement of controlled and measured hydrate saturation using different methods. This Millstone is specific to Sub-task 2.2 Steady‐State Permeability of Gas and Water of Sand‐Pack Hydrate Samples. The method of formation of hydrate in the other chambers are outlined in Milestone reports 1.D, 1.E, 1.F, and 1.G. We experimented with different methods of making a sand pack and found the best results by preforming a moist sand pack in a plastic tube and freezing it. Using this method, the saturation of the sand pack mixture could be directly controlled by the mass of water added. The frozen sand could then be extruded and maintain integrity while loading into the core holder.
The PIs in charge of this task are H. Daigle and D DiCarlo. Z. Murphy executed design, followed device construction, and performed experiments. P. Polito and J. O’Connell assisted with device construction, testing, and integrating into existing cold room infrastructure.
A. Description of Method
The process for conducting steady state relative permeability measurements relies on Darcy’s law to solve for relative permeability:
𝑄𝑄𝑖𝑖 = 𝑘𝑘𝑘𝑘𝑟𝑟𝑟𝑟𝜇𝜇𝑟𝑟
𝐴𝐴 ∆𝑃𝑃𝑟𝑟𝐿𝐿
, (Eq. 1)
where Qi is the volumetric flow rate of phase i (either water or gas), k is the intrinsic (hydrate-free, single-phase flow) permeability of the sandpack, kri is the relative permeability to phase i, μi is the viscosity of phase i, A is the cross-sectional area of the sandpack, and ΔPi is the pressure drop of phase i over length L. With our setup, we will be able to control Q, and will measure ΔP. A, k, µ, and L are all known constants. This allows us to solve for kri. Using a mass flow controller for the gas and a continuous injection pump for
DocuSign Envelope ID: 7B44DA5D-A1A4-448D-9FEA-8CE6C2810995

Hydrate Production Properties Phase 1 Report Page 46 of 97
the brine/water, we will be able to control the flow rates of the two fluids. We will use the pressure taps and differential pressure transducers to measure ΔP. Once we have reached steady state and the ΔP is constant, we will be able to solve for kri for each phase. By determining kri at multiple saturations, we will be able to generate complete relative permeability curves for the two phases.
The first step in our experiment is to pack the sample into the core holder with a known water saturation (35-40%). Once the sample is packed, the confining pressure is increased to ~500 psi and a constant effective stress of 500 psi is applied to the sample. We then increase the pore pressure of the sample as we increase the confining pressure. Once the sample reaches 1250 psi and the confining is 1750 psi, we allow the sample to reach equilibrium. The pressure transducer lines are then opened to the core and pressure drops across the core are measured. At this point, since there is no flow, all pressure transducers should be reading 0 psi. After we ensure there are no leaks in the system, the entire setup/cart is transported in the cold room and allowed to reach experimental conditions ~6°C. The pore pressure is controlled by an additional ISCO pump which is set to constant pressure mode at 1250 psi. As the system cools, gas is injected to maintain the pressure. After 6-15 hours, hydrate formation will begin and can be seen by the amount of gas injected by the pump. In order to allow maximum conversion, we allow the system to continue to form hydrate for 2-3 days. The resulting hydrate saturation Sh is calculated as follows:
𝑆𝑆ℎ = 𝑉𝑉𝐶𝐶𝐶𝐶4𝜌𝜌𝐶𝐶𝐶𝐶4𝑀𝑀𝐶𝐶𝑀𝑀𝐶𝐶𝐶𝐶4𝜌𝜌𝐶𝐶𝑉𝑉𝑝𝑝
, (Eq. 2)
where VCH4 is the volume of methane injected into the core during hydrate formation, ρCH4 is the density of methane gas at experimental conditions (0.07225 g/cm3), MH is the molar mass of sI hydrate (119.5 g/mol), MCH4 is the molar mass of methane (16 g/mol), ρH is the density of sI hydrate (0.925 g/cm3), and Vp is the pore volume of the sandpack. The conversion rate R, which is the ratio of the number of moles of water taken up in hydrate to the total number of moles of water initially present, is calculated as
𝑅𝑅 = 𝑉𝑉𝑊𝑊𝜌𝜌𝑊𝑊𝑀𝑀𝐶𝐶𝐶𝐶45.75𝑀𝑀𝑊𝑊𝑉𝑉𝐶𝐶𝐶𝐶4𝜌𝜌𝐶𝐶𝐶𝐶4𝑀𝑀𝐶𝐶
, (Eq. 3)
where VW is the initial volume of water present, ρw is the density of water, and Mw is the molar mass of water.
We used the following values and assumptions:
Density of water=1.000 g/cm3;
DocuSign Envelope ID: 7B44DA5D-A1A4-448D-9FEA-8CE6C2810995

Hydrate Production Properties Phase 1 Report Page 47 of 97
Density of methane= 0.07224 g/cm3
Density of hydrate = 0.925 g/cm3
molar mass of hydrate = 119.5 g/mol.
1 mole of hydrate contains 1 mole of methane and 5.75 moles of water
B. Results
In a typical experiment, hydrate formation began after approximately 16 hours (Figure 2.5), and continued for more than 65 hours. Once hydrate formation is complete, the hydrate saturation is ~30% with a water conversion rate of 75%.
Figure 2.5. Hydrate formation using excess gas method. Methane pressure is 1250 psi.
In other experiments performed, starting with initial water saturations of 40%, we obtained final hydrate saturations of 37% and 43% with conversion rates of 74% and 86%. We are therefore able to control the final hydrate saturation by manipulating the initial water saturation.
The next step is to begin flowing three phase brine through the core. Since brine with buffer the formation of hydrates, we have calculated the salinity for three phase brine at our PT conditions (1250 psi and 6°C). At our conditions, the three phase brine is 10.5 wt% NaCl. We inject brine and bleed off any excess gas in the system until the sample is fully brine saturated. Once fully saturated, multiple flow rates are injected to determine the pressure drops and measure the effective permeability of the sample.
DocuSign Envelope ID: 7B44DA5D-A1A4-448D-9FEA-8CE6C2810995
Hydrate Production Properties Phase 1 Report Page 48 of 97
Challenges
We have currently created hydrate in our sandpack and are flowing brine through the sample. However, we are noticing that hydrate is forming/dissociating near/in the pressure taps which is blocking the pressure transducer lines. In Figure 2.6, hydrate is forming in/near the pressure tap shared by dP 4 and dP 5 causing extreme fluctuations in the pressure drops. Our theory is that hydrate is forming, causing the spikes in pressure, and then dissociating causing the dP to stabilize. This trend continues over 60+ hours of flow.
Figure 2.6. Pressure drop at 1 mL/min indicating hydrate blockage.
This blockage, which occurred at all pressure taps, prevents us from being able to accurately measure the pressure drop across the core. Additionally, since each tap is shared by two transducers, if one tap is blocked, two transducers are therefore ineffective. In order to solve this problem, we have filled the transducer lines with brine that is more saline than three phase stability (~13 wt% NaCl). This extremely saline brine will prevent hydrate formation when the brine comes into contact with methane gas. We have filled all transducer lines with this brine and have successfully prevented hydrate from forming in the lines (Figure 2.7). The difference in dP between the two pressure taps shown in Figure 2.7 is due to heterogeneity in the distribution of hydrate. However, we do still have a partial blockage of one pressure tap (not shown in Figure 2.7).
-15
-10
-5
0
5
10
15
20 25 30 35 40 45 50 55 60
dP (p
si)
Time (hours)
dP while flowing 10 wt% brine at 1 ml/min
dp 4
dp 5
DocuSign Envelope ID: 7B44DA5D-A1A4-448D-9FEA-8CE6C2810995
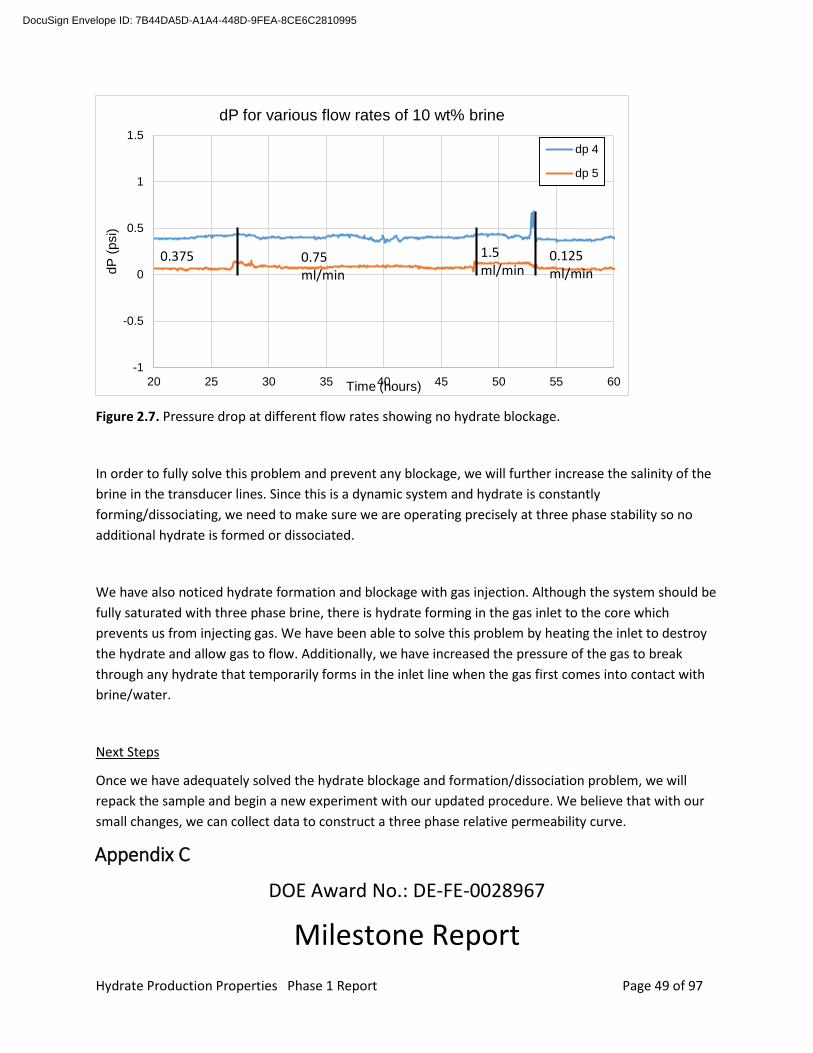
Hydrate Production Properties Phase 1 Report Page 49 of 97
Figure 2.7. Pressure drop at different flow rates showing no hydrate blockage.
In order to fully solve this problem and prevent any blockage, we will further increase the salinity of the brine in the transducer lines. Since this is a dynamic system and hydrate is constantly forming/dissociating, we need to make sure we are operating precisely at three phase stability so no additional hydrate is formed or dissociated.
We have also noticed hydrate formation and blockage with gas injection. Although the system should be fully saturated with three phase brine, there is hydrate forming in the gas inlet to the core which prevents us from injecting gas. We have been able to solve this problem by heating the inlet to destroy the hydrate and allow gas to flow. Additionally, we have increased the pressure of the gas to break through any hydrate that temporarily forms in the inlet line when the gas first comes into contact with brine/water.
Next Steps
Once we have adequately solved the hydrate blockage and formation/dissociation problem, we will repack the sample and begin a new experiment with our updated procedure. We believe that with our small changes, we can collect data to construct a three phase relative permeability curve.
Appendix C
DOE Award No.: DE-FE-0028967
Milestone Report
-1
-0.5
0
0.5
1
1.5
20 25 30 35 40 45 50 55 60
dP (p
si)
Time (hours)
dP for various flow rates of 10 wt% brine
dp 4
dp 5
0.375 0.75ml/min
1.5 ml/min
0.125ml/min
DocuSign Envelope ID: 7B44DA5D-A1A4-448D-9FEA-8CE6C2810995

Hydrate Production Properties Phase 1 Report Page 50 of 97
Milestone 1.D: Achieved depressurization and demonstrated mass balance
SUMMARY
This milestone report summarizes our achievement of depressurization and demonstrated mass balance. This Millstone is specific to Sub-task 3.1 Depressurization Tests. The following sections summarize the experimental setup, results, and achievement of the milestone. At the time being, we have successfully formed and dissociated hydrates and achieved a mass balance in the total amount of methane through consumed during formation and recovered during dissociation. The PI in charge of this task is P.B. Flemings. S.C. Phillips designed and performed the experiments. D Meyer assisted with hydrate formation prior to depressurization.
Methods
1.1 Experimental setup
Fig. 1 shows a schematic diagram of the hydrate chamber. We created a sand pack by filling a Viton rubber sleeve with industrial sand with steel end caps on each end. The synthetic sand core is housed within an aluminum vessel filled with a confining fluid. Inlet and outlet ports at each end of the sample allow the flow of gas and water into and out of the sample. Pressure was measured at the inlet/outlet valves and in the confining fluid. Temperature was measured in the confining fluid.
DocuSign Envelope ID: 7B44DA5D-A1A4-448D-9FEA-8CE6C2810995

Hydrate Production Properties Phase 1 Report Page 51 of 97
Figure 1. Diagram showing the setup of the hydrate formation / depressurization chamber.
1.2 Hydrate formation
Methane hydrate was injected into the sand pack saturated with NaCl brine or freshwater within the hydrate stability zone. Methane gas at the upstream end was held at constant pressure while brine was removed at a constant rate. The volume of the upstream gas pump and downstream brine pump were monitored continuously as well as the pressure at the inlet and outlet valves. The methane hydrate saturation was calculated by the mass balance of gas and water consumed.
1.3 Depressurization
We depressurized the sample by releasing a constant volume of gas from the top of the sample into a constant volume of tubing. This gas was then expanded into an inverted graduated cylinder and the
DocuSign Envelope ID: 7B44DA5D-A1A4-448D-9FEA-8CE6C2810995

Hydrate Production Properties Phase 1 Report Page 52 of 97
volume at atmospheric pressure was recorded. We monitored the pressure in the sample at each step and the pressure rebound that occurred between each step.
CT Scanning
One experiment was formed and dissociated within a medical X-ray computed tomography (CT) scanner (Fig. 2). The scans were collected as slices every 3 mm with a 0.23 mm pixel resolution using an X-ray tube energy of 130 kV and 100 Ma.
Figure 2. The hydrate vessel within the medical CT scanner.
Results
Hydrate formation with the gas injection method yielded hydrate saturations ranging from 13% to 32%. The depressurization of each sample yielded a consistent pressure vs. volume curve in which free gas was released, followed by hydrate dissociation, then release of residual gas (Fig. 3). During hydrate dissociation, there is a decrease in the slope in the pressure vs. methane released curve, and pressure rebounds occur between gas releases during dissociation while the sample is shut-in.
Overall, we observed an excellent mass balance between total methane consumed during formation to methane recovered during depressurization (Fig 4). The methane mass balance matched to within 6% (within the uncertainty of our experimental set up) due to the temperature gradient in the gas at the
DocuSign Envelope ID: 7B44DA5D-A1A4-448D-9FEA-8CE6C2810995

Hydrate Production Properties Phase 1 Report Page 53 of 97
top of the sample. We show that there are no significant leaks and the pressure rebound behavior we observe is a result of dissociation of the specimen.
The decrease in pressure during dissociation is larger than predicted by an equilibrium model assuming well-mixed salinity and temperature conditions (Fig. 5). Even a very slow stepwise depressurization over several weeks will not follow conditions expected for a homogenous sample. During dissociation we also observe pressure rebounds that occur over several days with the slowest pressure recover occurring the highest salinity samples (Fig. 6). CT scans during pressure rebounds show a decrease in bulk density several cm into the sample and an increase in bulk density at the top of the sample (Fig. 7). These results suggest the possibility of water movement and/or hydrate reformation during dissociation in these samples.
Figure 3. Three stages of depressurization: initial free gas release, hydrate dissociation, and residual free gas release. When hydrate dissociation occurs there is a break in slope in the pressure vs. cumulative
DocuSign Envelope ID: 7B44DA5D-A1A4-448D-9FEA-8CE6C2810995
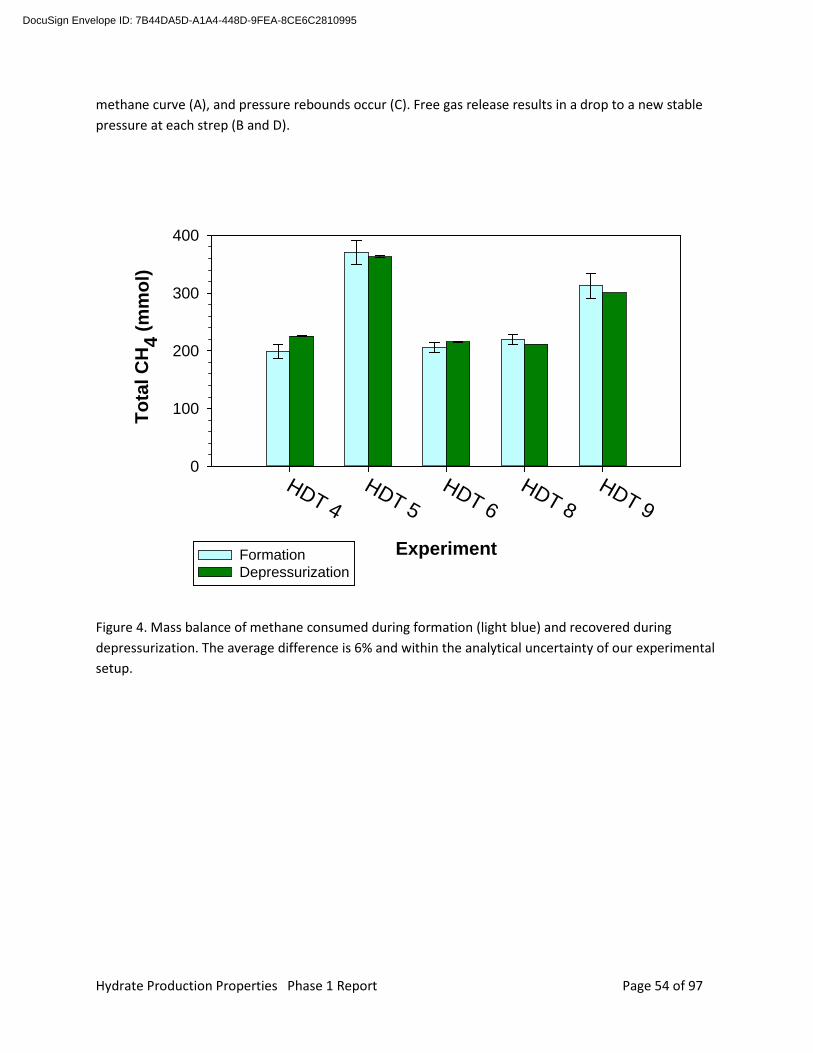
Hydrate Production Properties Phase 1 Report Page 54 of 97
methane curve (A), and pressure rebounds occur (C). Free gas release results in a drop to a new stable pressure at each strep (B and D).
Figure 4. Mass balance of methane consumed during formation (light blue) and recovered during depressurization. The average difference is 6% and within the analytical uncertainty of our experimental setup.
Experiment
HDT 4HDT 5
HDT 6HDT 8
HDT 9
Tota
l CH
4 (mm
ol)
0
100
200
300
400
FormationDepressurization
DocuSign Envelope ID: 7B44DA5D-A1A4-448D-9FEA-8CE6C2810995

Hydrate Production Properties Phase 1 Report Page 55 of 97
Figure 5. Results of slow depressurization compared to an equilibrium model based on homogenous salinity and temperature. The actual pressures, even with hours to days long recovery between each gas release step, decrease more rapidly than predicted, especially for a high salinity sample.
Pre
ssur
e, P
, Pf (
MP
a)
3.0
3.5
4.0
4.5
5.0
HDT-5 measured HDT-5 modeled
Cumulative hydrate CH4, nh (mmol)0 50 100 150 200
Tim
e (h
r)
0
100
200
300
400
HDT-5 (1 °C, 9.6 wt% NaCl) a
b
10
8
6
42
[NaC
l], Xsw
,f (wt%
)
P
ress
ure,
P, P
f (M
Pa)
2.0
2.5
3.0
3.5
4.0
HDT-7 measuredHDT-7 modeled
Cumulative hydrate CH4, nh (mmol)0 20 40 60 80 100
Tim
e (h
r)0
100
200
300
400
HDT-7 (~1 °C, freshwater)e
f
2.0
1.00.0
T ( °C
)
DocuSign Envelope ID: 7B44DA5D-A1A4-448D-9FEA-8CE6C2810995

Hydrate Production Properties Phase 1 Report Page 56 of 97
Figure 6. Pressure rebounds between each gas release step, normalized to the magnitude of initial pressure drop.
DocuSign Envelope ID: 7B44DA5D-A1A4-448D-9FEA-8CE6C2810995

Hydrate Production Properties Phase 1 Report Page 57 of 97
Figure 7. Changes in bulk density derived from CT-scanning at 1 hour, 3 hours, and 120 hours after a pressure drop and release of gas. Blue shades represent a decrease in bulk density and green-yellow shades represent an increase in bulk density.
DocuSign Envelope ID: 7B44DA5D-A1A4-448D-9FEA-8CE6C2810995

Hydrate Production Properties Phase 1 Report Page 58 of 97
Appendix D
DOE Award No.: DE-FE-0028967
Milestone Report
Milestone 1.E: Build and Test Micro-Consolidation Device
SUMMARY
This milestone report summarizes our achievement of building and testing the micro-consolidation device for forming and imaging gas hydrate in sediments. The following sections summarize the conception, construction and testing of the device. At the time being, we have successfully tested the device. The device is accounts with standalone data acquisition to record and control pressure and temperature remotely. This feature is useful for controlling the device inside the microCT cabinet. The PIs in charge of this task are D.N. Espinoza and N. Tisato. X. Chen executed design, followed device construction, and performed experiments. J. Luo assisted with automation and data acquisition.
Device Conception
Figure 1 shows the initial conception of the device and experimental workflow. The micro consolidation device consists of a hard-walled pressure vessel transparent to X-rays that permits applying a constant vertical effective stress to the sediment. The vessel is small enough to obtain high scanning magnification and observe hydrate pore habit. The vessel should account with permeable endcaps for fluid injection. The vessel should resist pressure and temperature typical of natural hydrate bearing sediments (500 to 3500 psi and 1 to 10°C).
DocuSign Envelope ID: 7B44DA5D-A1A4-448D-9FEA-8CE6C2810995

Hydrate Production Properties Phase 1 Report Page 59 of 97
Figure1. Workflow for hydrate studies at the microscale (1) Example of pore scale imaging (Chaouachi et al., 2015). (2) Micro consolidation device that we will build to use with microCT imaging. (3) X‐ray tomography schematics.
Figure 2 shows a diagram of the device for fluid flow, pressure and temperature control. The micro consolidation device connects to a small gas accumulator which is filled directly from the gas cylinder or from a pressure pump. A needle valve connects to the accumulator with the micro consolidation device. A pressure transducer/gauge monitors pressure and a thermocouple monitors temperature. The micro consolidation device accounts with endcaps able to provide fluid injection and extraction. Inside the micro consolidation device the vessel accounts with permeable spacers to confine the sand pack. A stainless-steel spring provides effective stress to the sand pack through the movable spacers. An external heat sink provides temperature controlled to the entire device.
DocuSign Envelope ID: 7B44DA5D-A1A4-448D-9FEA-8CE6C2810995

Hydrate Production Properties Phase 1 Report Page 60 of 97
Figure 2. Schematic setup of micro-consolidation device.
Mechanical Construction
We have developed two versions of the micro-consolidation device. The first one is made of aluminum and constructed in our local machine shop. We utilized aluminum in order to combine high pressure resistance and thin walls in pressure vessels. All threaded fittings and valves are made of stainless steel. The second one is a shorter version made out of PEEK tubing and fittings. The temperature control consists on either a Peltier-cooled container or through a controlled-temperature bath and refrigerated coil tubes. Pressure control is achieved independently with a pressure pump ISCO 1000D.
Fig. 3 shows a photo the aluminum micro consolidation apparatus mounted in the X-ray micro-CT scanner. We have built 5 devices so far. The large aluminum vessel on the top is gas accumulator, and has (internal) dimensions of 2.0-cm-diameter and 8.6-cm-length. The small vessel in the bottom is the micro-consolidation device and has a (internal) dimensions of 0.86-cm-diameter and 7.2-cm-length. These two vessels are connected by stainless steel tubing, an analog gauge and a high-pressure stainless steel valve. The analog gauge is easily replaceable for a pressure transducer. However, the analog gauge is handy for storing in a controlled temperature container and it is extremely reliable over long experimental times (months). The radiography and CT slice of the micro-consolidation device show (from top to bottom): a compressed stainless steel spring (1.0 cm), a 1.1-cm-long PTFE spacer, a stainless steel sieve, a 4.0-cm-long sand pack, another stainless steel sieve, and another 1.1-cm-long
DocuSign Envelope ID: 7B44DA5D-A1A4-448D-9FEA-8CE6C2810995

Hydrate Production Properties Phase 1 Report Page 61 of 97
PTFE spacer. The spring applies an effective stress to the sand pack. The two sieves prevent sand going into the spacers. The system (as shown in Figure 3) is connected in closed mass conditions. Endcaps at the top and bottom permit the injection of fluids for measuring permeability.
Figure 3. Long-term aluminum micro-consolidation device mounted in a micro-CT scanner with its radiography (center) and CT slice (right). The experimental apparatus consists of, from top to bottom, a large high-pressure vessel for storing gas, a pressure gauge, a needle valve and the micro-consolidation device. The micro-consolidation device is packed with a spring, two spacers and sand. Temperature isolation and module not shown in image.
Fig. 4 shows a photo the PEEK micro consolidation apparatus mounted in the X-ray micro-CT scanner. The device is similar to the aluminum version but it is shorter and more permeable to X-rays. In this
DocuSign Envelope ID: 7B44DA5D-A1A4-448D-9FEA-8CE6C2810995
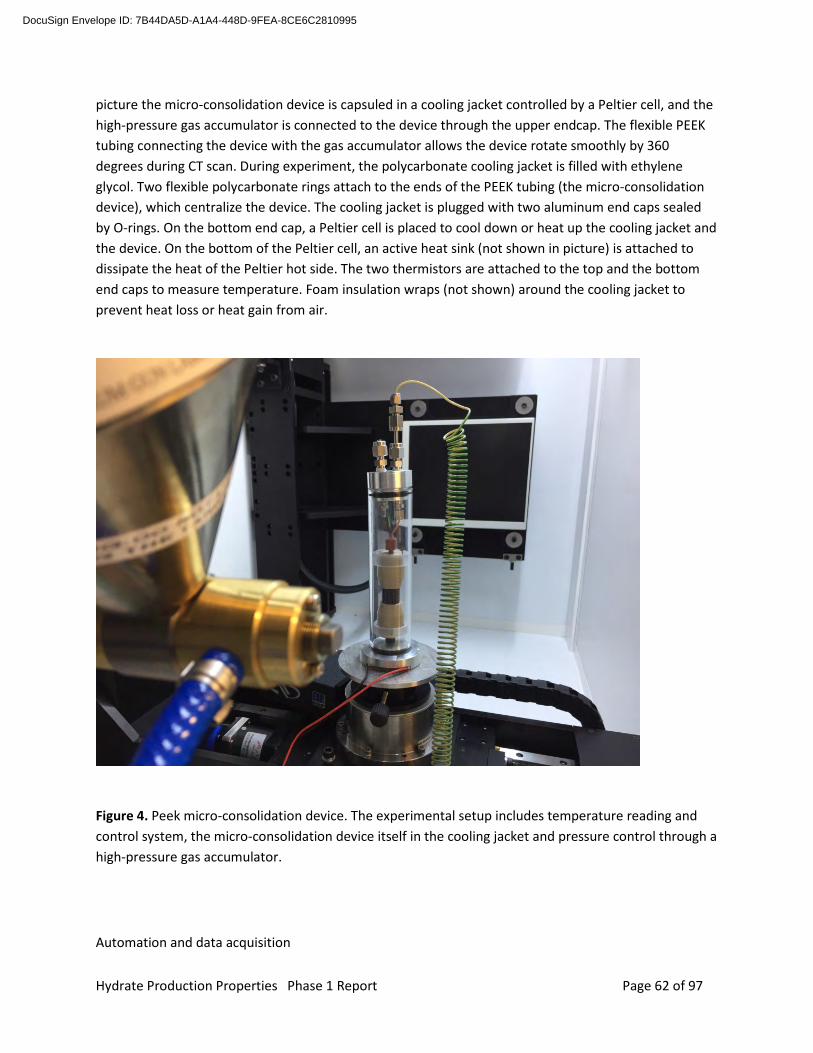
Hydrate Production Properties Phase 1 Report Page 62 of 97
picture the micro-consolidation device is capsuled in a cooling jacket controlled by a Peltier cell, and the high-pressure gas accumulator is connected to the device through the upper endcap. The flexible PEEK tubing connecting the device with the gas accumulator allows the device rotate smoothly by 360 degrees during CT scan. During experiment, the polycarbonate cooling jacket is filled with ethylene glycol. Two flexible polycarbonate rings attach to the ends of the PEEK tubing (the micro-consolidation device), which centralize the device. The cooling jacket is plugged with two aluminum end caps sealed by O-rings. On the bottom end cap, a Peltier cell is placed to cool down or heat up the cooling jacket and the device. On the bottom of the Peltier cell, an active heat sink (not shown in picture) is attached to dissipate the heat of the Peltier hot side. The two thermistors are attached to the top and the bottom end caps to measure temperature. Foam insulation wraps (not shown) around the cooling jacket to prevent heat loss or heat gain from air.
Figure 4. Peek micro-consolidation device. The experimental setup includes temperature reading and control system, the micro-consolidation device itself in the cooling jacket and pressure control through a high-pressure gas accumulator.
Automation and data acquisition
DocuSign Envelope ID: 7B44DA5D-A1A4-448D-9FEA-8CE6C2810995
Hydrate Production Properties Phase 1 Report Page 63 of 97
We have added an automatic data acquisition feature for temperature and pressure recording. A Peltier cell controlled with a MOSFET H-bridge circuit permits both increasing and decreasing the temperature of the device at desired rates and desired temperatures. Figure 5 shows the schematic wiring connecting from an Arduino processor to a MOSFET H-bridge, a 5V battery (for Arduino), a Peltier cell, a 12V (nominal) auto battery (for Peltier), two thermistor circuits, and a micro-SD breakout. Instead of directly connecting the Peltier cell to the 12V battery, the H-bridge is used to bridge between the battery and the Peltier cell. The H-bridge has two couple of gates that allow low-voltage signal inputs (such as 5V) to switch on, such that the Peltier cell is connected to the battery. The Arduino processor sends out 5V signals to either couple of the H-bridge gates (never turn on two couples together), such that, the current flow can be bi-directional to make Peltier cool down or heat up the micro-consolidation device. The temperature control system reads the temperature inputs from the two thermistor circuits (thermistors are attached to the micro-consolidation device) and substitute the average offset between targeted and measured temperatures into a PID algorithm to determine the output percentage from the battery. Although Arduino only sends out 5V signals, a pulse-wave-modulation (PWM) algorithm is used to adjust the output percentage from 0% to 100%. Furthermore, the micro-SD card inside the breakout module records temperatures from the two thermistor circuits every 15 seconds. The whole process described in this paragraph is realized using the Arduino code in Appendix A.
DocuSign Envelope ID: 7B44DA5D-A1A4-448D-9FEA-8CE6C2810995

Hydrate Production Properties Phase 1 Report Page 64 of 97
Figure 5. Schematic wiring from Arduino board to (from left to right) MOSFET H-bridge, Peltier cell, thermistors, and micro-SD breakout (snapshot from fritzing,org open source software).
Pressure Testing and Experimental Procedure
The aluminum micro-consolidation device has been successfully pressure tested with water, N2, Xe, and CH4 up to 1500 psi.
The procedure for pressure testing and hydrate formation is as follows:
Connect the apparatus and leak test it at objective pressure, first with water and then with nitrogen gas.
Pack the micro-consolidation device as shown in Fig. 2b and fill the accumulator with hydrate-forming gas.
Fill the sand pack with water until desired water saturation.
DocuSign Envelope ID: 7B44DA5D-A1A4-448D-9FEA-8CE6C2810995

Hydrate Production Properties Phase 1 Report Page 65 of 97
Set the micro-consolidation device to target temperature.
Connect the micro-consolidation device with the gas accumulator to start the hydrate formation experiment.
Record the temperature and pressure of the micro-consolidation device with time.
Image the micro-consolidation device with the X-ray micro-CT at different resolutions to capture the hydrate nucleation and growth in the sand pack.
Apply pressure gradient and measure permeability if required.
We have successfully also successfully tested the PEEK micro-consolidation device for temperature reading and control system and are running methane hydrate experiments.
Example of Hydrate Formation in Sand Pack
Fig. 6 shows an example of xenon hydrate growth in sand. Xenon hydrate is easily differentiated from sand grain and xenon gas in the CT slices because its high attenuation coefficient. The images highlight that (1) there is significant spatial heterogeneity in hydrate saturation, and (2) at low hydrate saturation (left), hydrate pore habit is mainly grain-coating while at high hydrate saturation (right), hydrate pore habit is a combination of grain-coating, pore-filling and grain-cementing.
Figure 6. CT slices at two positions in sand after 4 days xenon hydrate growth (resolution: 28.77 μm). Xenon hydrate is white, sand grain is black and xenon gas is gray.
References
DocuSign Envelope ID: 7B44DA5D-A1A4-448D-9FEA-8CE6C2810995

Hydrate Production Properties Phase 1 Report Page 66 of 97
Chaouachi, M., Falenty, A., Sell, K., Enzmann, F., Kersten, M., Haberthür, D., and Kuhs, W. F., (2015),Microstructural evolution of gas hydrates in sedimentary matrices observed with synchrotron Xray computed tomographic microscopy: Geochemistry, Geophysics, Geosystems, v. 16, no. 6, p. 1711‐1722, 10.1002/2015GC005811.
Circone, S., S. H. Kirby, and L. A. Stern (2005), Direct Measurement of Methane Hydrate Composition along the Hydrate Equilibrium Boundary, J. Phys. Chem. B, 109(19), 9468–9475, doi:10.1021/jp0504874.
Ohgaki, K., T. Sugahara, M. Suzuki, and H. Jindai (2000), Phase behavior of xenon hydrate system, Fluid Phase Equilibria, 175(1–2), 1–6, doi:10.1016/S0378-3812(00)00374-5.
Appendix A: Arduino code for temperature control feature
#include <SPI.h>
#include <SD.h>
#include <math.h>
File myFile;
// how many cylces data are logged, the period is approximately
// log_period/100 seconds
int log_period = 1500;
// Temp sensors def
double D1=1023; // Voltage at A0, for thermistor 1
double D2=1023; // Voltage at A1, for thermistor 2
double T1=23; // Temp measured by thermistor 1
double T2=23; // Temp measured by thermistor 2
// Initialization of T1 and T2 are room temp
double R1=20; // Resistance of thermistor 1
double R2=20; // Resistance of thermistor 2
double R3=19890; // Voltage divider for R1
double R4=19920; // Voltage divider for R2
double lnR1=20; // Natural log of R1
DocuSign Envelope ID: 7B44DA5D-A1A4-448D-9FEA-8CE6C2810995

Hydrate Production Properties Phase 1 Report Page 67 of 97
double lnR2=20; // Natural log of R2
// PID part def
double P_value=10; // PID parameters, proportional
double I_value=0; // PID parameters, derivative
double T_tar=4; // targeted temperature in C
double T_offset=T1-T_tar; // temp offset in C,
// The room temp is 23 C, assuming to cool down to 0C, Then initial
// T_offset is 23. To be safe, assuming the max T_offset is 30
double T_cumul; // cumulative T_offset along the time, for I_value
// Output part def
int led1 = 7; // Connected to Z, Switch on NPN transistor
// and the P channel mosfet, switch device ground to positive Volt
int led2 = 6; // connceted to u, Gate of N channel mosfet
// Switch device ground to ground.
// Warning, never turn on led1 and led2 at the same time. SHORTCUT
int led3 = 5; // connected to A, Switch on NPN transistor
// and the P channel mosfet, switch device positive to positive Volt
int led4 = 4; // connceted to H, Gate of N channel mosfet
// Switch device positive to ground.
// Warning, never turn on led3 and led4 at the same time. SHORTCUT
// led1 and led4 HIGH, led2 and led3 LOW, Device heating
// led2 and led3 HIGH, led1 and led4 LOW, Device cooling
// All low, device idle
// Warning, if led1 and led2 HIGH or led3 and led4 HIGH, SHORTCUT
double outpercent=T_offset*P_value; // This is the output percetage of the maxi
DocuSign Envelope ID: 7B44DA5D-A1A4-448D-9FEA-8CE6C2810995

Hydrate Production Properties Phase 1 Report Page 68 of 97
// -mum voltage of 13.02 V.
// This outpercent is [-100, 100]
// In my setup, positive means cooling, negative means heating
double maxvolt = 13.03; // the max voltage at battery
double x;
// This is the linear transformation from output percentage
// to the high duration
int high_duration;
// This is the duration of high
// After testing, this works when outpercent is between 11 and 100,
// But I think the output should be within [11, 80]%
// In most range, the relative error is 1% of expected voltage.
int maxtime = 10000; // This is the period in micro seconds, 0.01s
int count=0;
// int filtn=32;
void setup()
// put your setup code here, to run once:
Serial.begin(9600);
pinMode(led1, OUTPUT);
pinMode(led2, OUTPUT);
pinMode(led3, OUTPUT);
pinMode(led4, OUTPUT);
Serial.print("Initializing, ");
pinMode(10,OUTPUT);
if(!SD.begin(10))
DocuSign Envelope ID: 7B44DA5D-A1A4-448D-9FEA-8CE6C2810995
Hydrate Production Properties Phase 1 Report Page 69 of 97
Serial.println("failed");
return;
Serial.println("done");
void loop()
// put your main code here, to run repeatedly:
// Give the manual calibrated output to cool down or heat up
// positive is cooling, negative is warming
// default: set everything low, this is true when outpercent is
// [-10.99, 10.99]
if(outpercent < 11)
if(outpercent > -11)
digitalWrite(led1, LOW);
digitalWrite(led2, LOW);
digitalWrite(led3, LOW);
digitalWrite(led4, LOW);
// Cooling
if(outpercent > 10.99) // output 11,100]
if(outpercent > 100)
DocuSign Envelope ID: 7B44DA5D-A1A4-448D-9FEA-8CE6C2810995

Hydrate Production Properties Phase 1 Report Page 70 of 97
outpercent=100;
digitalWrite(led1, LOW);
digitalWrite(led2, HIGH);
digitalWrite(led4, LOW);
x = 784.83*(0.01*outpercent*maxvolt)-1117.04;
high_duration = x;
digitalWrite(led3, HIGH);
delayMicroseconds(high_duration); // Approximately outpercent %
// duty cycle @ 100 Hz
digitalWrite(led3, LOW);
delayMicroseconds(maxtime - high_duration);
// Heating
if(outpercent < -10.99)
if(outpercent < -100)
outpercent=-100;
digitalWrite(led2, LOW);
digitalWrite(led3, LOW);
digitalWrite(led4, HIGH);
x = 784.83*(0.01*(-outpercent)*maxvolt)-1117.04;
high_duration = x;
DocuSign Envelope ID: 7B44DA5D-A1A4-448D-9FEA-8CE6C2810995

Hydrate Production Properties Phase 1 Report Page 71 of 97
digitalWrite(led1, HIGH);
delayMicroseconds(high_duration); // Approximately outpercent %
// duty cycle @ 100 Hz
digitalWrite(led1, LOW);
delayMicroseconds(maxtime - high_duration);
// read T1 and T2, and use T1 to update output percent
//D1=0;
//D2=0;
//for(int n=1;n<=filtn;n++)
// D1=D1+analogRead(A0);
// D2=D2+analogRead(A1);
//
//D1=D1/filtn;
//D2=D2/filtn;
D1=analogRead(A0);
D2=analogRead(A1);
R1=R3*(1023-D1)/D1;
R2=R4*(1023-D2)/D2;
lnR1=log(R1);
lnR2=log(R2);
T1=319.72-36.471*lnR1+0.052763*lnR1*lnR1*lnR1;
T2=319.72-36.471*lnR2+0.052763*lnR2*lnR2*lnR2;
T_offset=T1-T_tar; // update temp offset
outpercent=T_offset*P_value; // update output percentage
DocuSign Envelope ID: 7B44DA5D-A1A4-448D-9FEA-8CE6C2810995

Hydrate Production Properties Phase 1 Report Page 72 of 97
if(outpercent > 100)
outpercent = 100;
if(outpercent < -100)
outpercent = -100;
// print out T1 and T2 every 10 seconds
count=count+1;
if(count > log_period)
// print out the data
Serial.print(T1); // T1
Serial.print(" ");
Serial.print(T2); // T2
Serial.print(" ");
Serial.print(outpercent); // outpercent
Serial.print("\n");
// Write data to micro-SD card
myFile =SD.open("temp.txt",FILE_WRITE);
myFile.print(T1);
myFile.print(" ");
myFile.print(T2);
myFile.print(" ");
myFile.print(outpercent);
myFile.println("\n");
// close the file:
DocuSign Envelope ID: 7B44DA5D-A1A4-448D-9FEA-8CE6C2810995

Hydrate Production Properties Phase 1 Report Page 73 of 97
myFile.close();
//Serial.println("done");
count=0;
DocuSign Envelope ID: 7B44DA5D-A1A4-448D-9FEA-8CE6C2810995

Hydrate Production Properties Phase 1 Report Page 74 of 97
Appendix E
DOE Award No.: DE-FE-0028967
Milestone Report
Milestone 1.F: Achieved Hydrate formation and measurements in Micro-CT consolidation
device
SUMMARY
This milestone report summarizes our achievement of hydrate formation and measurements in the Micro-CT consolidation device developed during this project (Task 4.1). This Milestone report is specific to Task 4.2 Micro‐Scale CT Observations and Analysis. The following sections summarize our achievements in imaging and analyzing hydrate-bearing sediments at the pore scale using X-ray micro-CT. The PIs in charge of this task are D.N. Espinoza and N. Tisato. X. Chen executed design, followed device construction, and performed experiments.
Xenon Hydrate-Bearing Sediments: Pore Habit and Core-Scale Distribution
We started experiments with xenon hydrate in sandy sediments within the micro-CT consolidation device (Chen et al., 2018; Chen & Espinoza, 2018). Xenon hydrate and methane hydrate are both structure I clathrate hydrates (Sloan Jr & Koh, 2007), and X-ray mass attenuation coefficients of xenon are one order of magnitude higher than those of methane (Creagh & Hubbell, 1992), which makes it easier to differentiate the hydrate phase from the water phase. Hence, many previous X-ray micro-CT experiments used xenon (and krypton) hydrate as an analog and benchmark for studying methane hydrate at the pore scale (Chaouachi et al., 2015; Jin et al., 2008, 2014).
In summary, we have conducted 6 xenon hydrate formation experiments in different porous media, including sandy sediments, PTFE beads (hydrophobic) and non-porous media. In all experiments hydrate growth is conducted with constant mass conditions (closed system after pressurization). Table 1 lists the temperature, the initial pressure (Pini), salinity and initial hydrate stability pressure (Peq) and durations for the six experiments. We also monitor the dissociation processes for Exp3, Exp4 and Exp5, during
DocuSign Envelope ID: 7B44DA5D-A1A4-448D-9FEA-8CE6C2810995
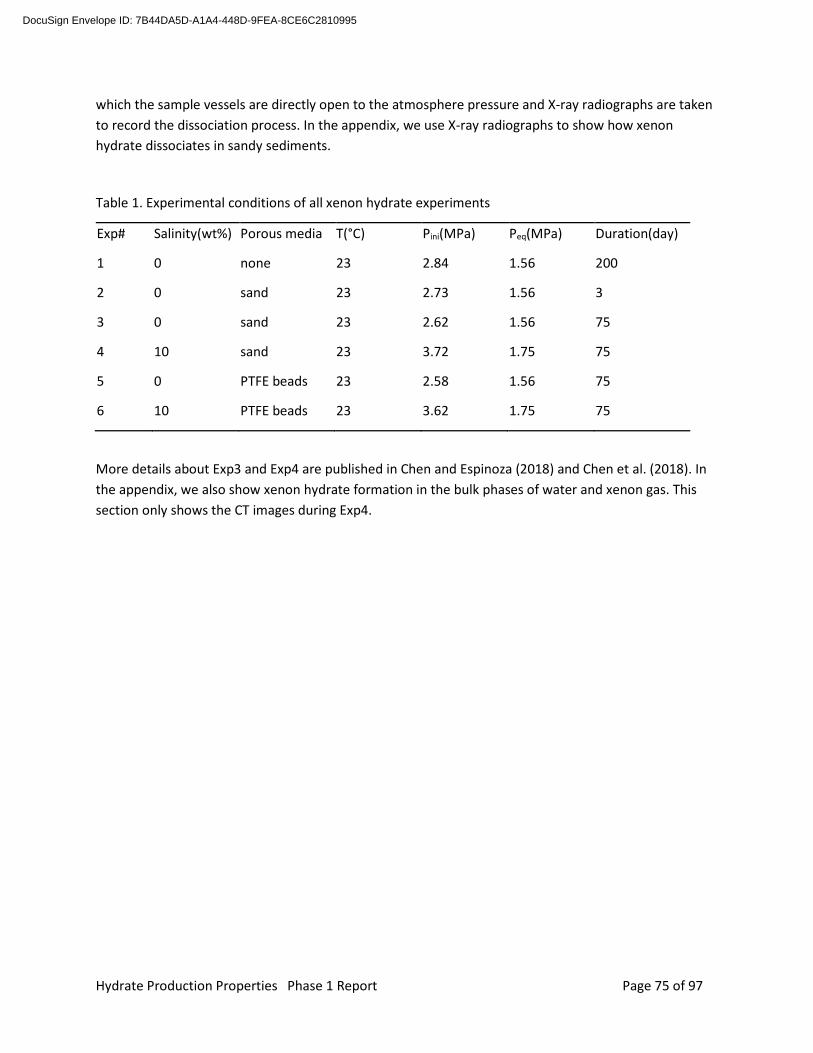
Hydrate Production Properties Phase 1 Report Page 75 of 97
which the sample vessels are directly open to the atmosphere pressure and X-ray radiographs are taken to record the dissociation process. In the appendix, we use X-ray radiographs to show how xenon hydrate dissociates in sandy sediments.
Table 1. Experimental conditions of all xenon hydrate experiments
Exp# Salinity(wt%) Porous media T(°C) Pini(MPa) Peq(MPa) Duration(day)
1 0 none 23 2.84 1.56 200
2 0 sand 23 2.73 1.56 3
3 0 sand 23 2.62 1.56 75
4 10 sand 23 3.72 1.75 75
5 0 PTFE beads 23 2.58 1.56 75
6 10 PTFE beads 23 3.62 1.75 75
More details about Exp3 and Exp4 are published in Chen and Espinoza (2018) and Chen et al. (2018). In the appendix, we also show xenon hydrate formation in the bulk phases of water and xenon gas. This section only shows the CT images during Exp4.
DocuSign Envelope ID: 7B44DA5D-A1A4-448D-9FEA-8CE6C2810995

Hydrate Production Properties Phase 1 Report Page 76 of 97
Figure 1 Xenon hydrate growth in sand: Ostwald ripening makes hydrate prefers to grow in large pores (bottom spacer) and heterogeneously distribute in sand. a. Axial X-ray CT slices of xenon hydrate (white) growth in sand (black) and PTFE spacer (black) from xenon gas (gray) and brine (black), and corresponding water saturation and hydrate saturation profiles (* after 2h, water is not detectable at present resolution); b. temperature and pressure vs. time
The CT images and hydrate saturation profiles in Figure 1 shows the xenon hydrate growth process in sandy sediments within a 4-day duration. Starting from 1 hour, hydrate (white) starts to nucleate in sand (black granular shapes) and hydrate becomes heterogeneously distributed. First, the top half of the sand has higher hydrate saturations than the bottom half. The hydrate saturation in the top half of the sand is up to 60%, while the hydrate saturation in the bottom half is only up to 30%. Second, hydrate
DocuSign Envelope ID: 7B44DA5D-A1A4-448D-9FEA-8CE6C2810995

Hydrate Production Properties Phase 1 Report Page 77 of 97
preferentially grows as a big aggregate within the big pore formed by the bottom spacer, which is an Ostwald ripening process that minimizes surface energy. Third, hydrate is porous in the pore space.
Figure 2 Xenon hydrate growth in sand: CT images at two locations at different growth times (resolution: 28.77 μm)
Figure 2 shows the evolution of hydrate pore habit as hydrate grows and hydrate saturation increases at two locations. At earlier stage of hydrate growth and low hydrate saturation state, hydrate mostly attaches on the grain surface. While at the late stage of hydrate growth and high hydrate saturation state, hydrate starts to fill and further cement the pore space.
Methane Hydrate-Bearing Sediments: Pore scale observations
2.1 Methane Hydrate Formation Procedure
We use NaBr brine as the aqueous phase instead of using NaCl brine in methane hydrate experiments. X-ray contrast between methane hydrate and NaCl brine is low. For instance, previous synchrotron CT images on methane hydrate bearing sand cannot clearly segment between NaCl brine phase and methane hydrate phase due to the low X-ray contrast (Kerkar et al., 2014). NaBr brine is a stronger X-ray
DocuSign Envelope ID: 7B44DA5D-A1A4-448D-9FEA-8CE6C2810995

Hydrate Production Properties Phase 1 Report Page 78 of 97
attenuating material and our experiments do show clearer segmentation between the aqueous phase and methane hydrate phase in X-ray CT images.
In summary, we have conducted 4 experiments of methane hydrate growth in sandy sediments (Exp1-Exp4). The first two experiments (Exp1 and Exp2) do not show evidence of methane hydrate in sandy sediments. The potential reasons are: (1) temperature outside the hydrate-stability zone, and (2) inadequate CT image quality due to excessive confining vessel attenuation. During the recent two experiments (Exp3 and Exp4), we have overcome the two problems and achieve hydrate formation and evidence of methane hydrate formation with X-ray microtomography.
Figure 3 Temperature (a) and pressure (b) of Exp3 during the first 3 days. The initial methane hydrate stability pressure at 5°C and an initial salinity of 0.6 wt% NaBr is 4.26 MPa.
We conduct the two recent experiments (Exp3 and Exp4) of methane hydrate growth in sandy sediments at excess gas conditions with different salinities and initial water saturations. The first experiment Exp3 started from an initial methane gas pressure of 6.93 MPa, water saturation of 81% and a salinity of 0.6 wt% NaBr. We maintained the temperature at 5±1 °C (see Figure 3 a). The initial hydrate stability pressure at 5°C and an initial salinity of 0.6 wt% NaBr is 4.26 MPa. Methane hydrate immediately nucleated and methane gas pressure started to decrease (see Figure 3b) as soon as the cooling started. Figure 3 shows the temperature and pressure evolutions during the first 3 days.
2.2 X-ray Image Segmentation Procedure
First, we segment for the grain phase using built-in threshold algorithm in ImageJ, since the CT grayscale difference between sand and all other phases are large enough. Second, we remove grain from the
DocuSign Envelope ID: 7B44DA5D-A1A4-448D-9FEA-8CE6C2810995

Hydrate Production Properties Phase 1 Report Page 79 of 97
original image using the segmented grain image. The remaining phases are methane gas, methane hydrate and brine. Since the CT grayscale number of methane gas is significantly lower than hydrate and brine, we segment the image again to obtain methane gas. Third, we remove both sand and methane gas from the original CT image, such that only hydrate and brine are left. Since brine has a higher CT grayscale number than hydrate, these two phases can be separated. The challenge of separating brine with hydrate is that, the CT grayscale difference between hydrate and brine is not as large as the differences in the first two steps. Hence, manual thresholding is necessary in this final step.
2.3 Core-Scale Distribution of Methane Hydrate in Sandy Sediments
Figure 4 CT image taken before hydrate formation and CT image taken at 5 hours after the temperature and the pressure are shifted into hydrate stability zone during Exp3
Figure 4 compares the CT image taken before cooling (no hydrate) with the CT image taken after 5 hours of hydrate growth during Exp3. Within the two cropped CT images, the top is spring, the middle is a Teflon spacer and the bottom is sand. Water only resides within the sandy sediments before cooling. After 5 hours of cooling, methane hydrate nucleates in multiple locations. First, hydrate (grayish irregular shapes) grows within the sandy sediments (white granular shapes). Second, hydrate also grows within the spacer (the gray half ellipse on the top of the spacer) where there was no water before cooling. The second finding suggests that water is mobile during hydrate formation and one possible mechanism is the capillarity between thin hydrate film and water-wet surfaces.
DocuSign Envelope ID: 7B44DA5D-A1A4-448D-9FEA-8CE6C2810995
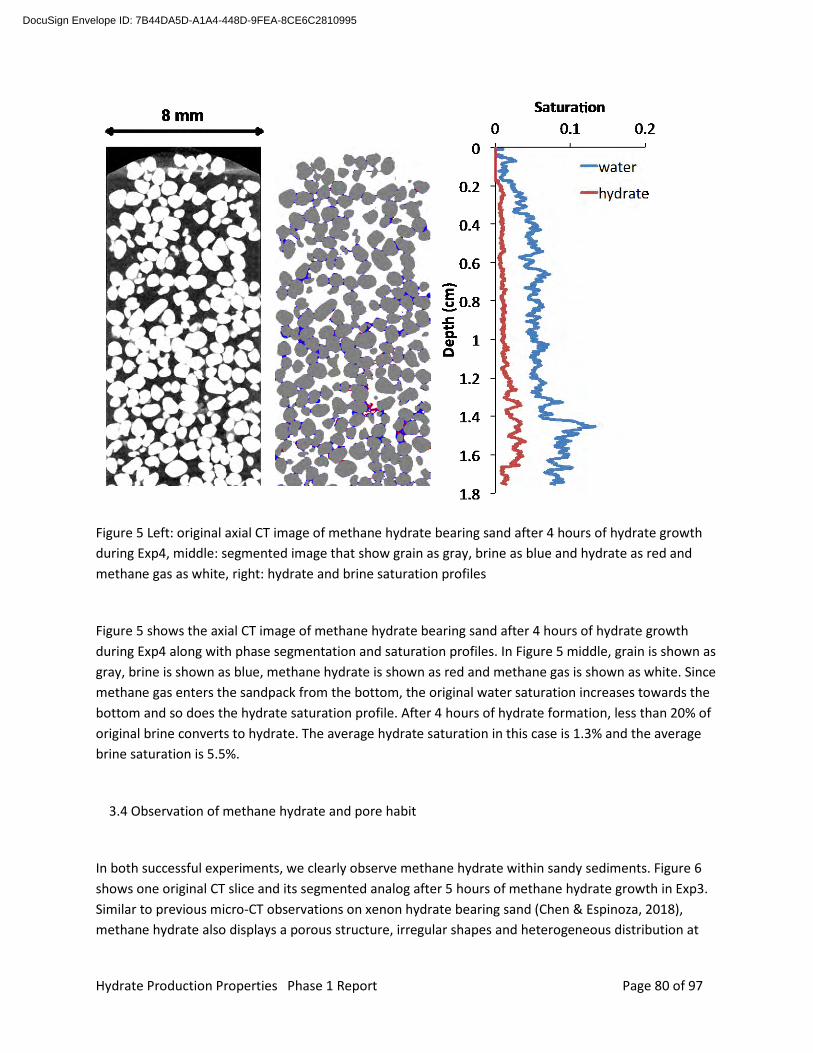
Hydrate Production Properties Phase 1 Report Page 80 of 97
Figure 5 Left: original axial CT image of methane hydrate bearing sand after 4 hours of hydrate growth during Exp4, middle: segmented image that show grain as gray, brine as blue and hydrate as red and methane gas as white, right: hydrate and brine saturation profiles
Figure 5 shows the axial CT image of methane hydrate bearing sand after 4 hours of hydrate growth during Exp4 along with phase segmentation and saturation profiles. In Figure 5 middle, grain is shown as gray, brine is shown as blue, methane hydrate is shown as red and methane gas is shown as white. Since methane gas enters the sandpack from the bottom, the original water saturation increases towards the bottom and so does the hydrate saturation profile. After 4 hours of hydrate formation, less than 20% of original brine converts to hydrate. The average hydrate saturation in this case is 1.3% and the average brine saturation is 5.5%.
3.4 Observation of methane hydrate and pore habit
In both successful experiments, we clearly observe methane hydrate within sandy sediments. Figure 6 shows one original CT slice and its segmented analog after 5 hours of methane hydrate growth in Exp3. Similar to previous micro-CT observations on xenon hydrate bearing sand (Chen & Espinoza, 2018), methane hydrate also displays a porous structure, irregular shapes and heterogeneous distribution at
DocuSign Envelope ID: 7B44DA5D-A1A4-448D-9FEA-8CE6C2810995

Hydrate Production Properties Phase 1 Report Page 81 of 97
the initial growth stage. The calculated hydrate saturation is 58.2 % and the porosity is 42.6 % in this particular region. In Exp3, there is difficulty in defining the brine phase and the hydrate phase.
Figure 6 The original (left) and the segmented (right) CT slices of the sand at the same position after 5 hours of hydrate growth in Exp3. In the segmented CT slice, black is sand grain, white is methane gas and the gray is methane hydrate. The porosity is 42.6% and the hydrate saturation is 58.2%. The image resolution is 12.0 µm.
DocuSign Envelope ID: 7B44DA5D-A1A4-448D-9FEA-8CE6C2810995
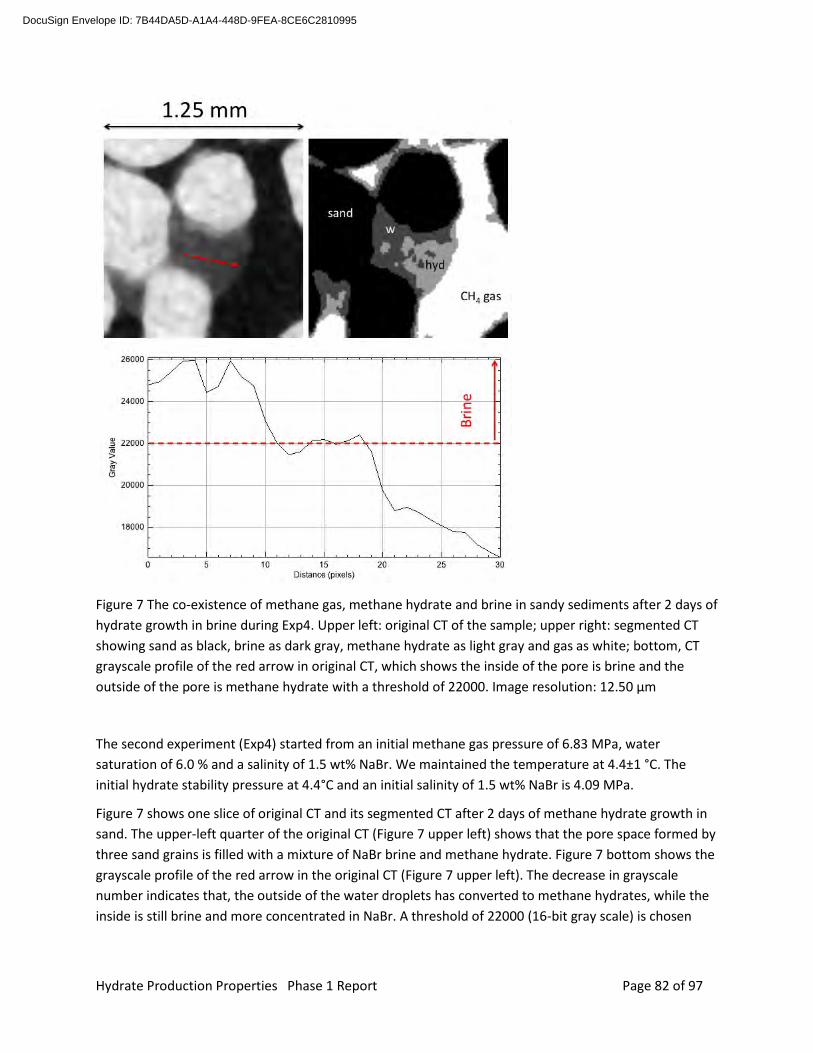
Hydrate Production Properties Phase 1 Report Page 82 of 97
Figure 7 The co-existence of methane gas, methane hydrate and brine in sandy sediments after 2 days of hydrate growth in brine during Exp4. Upper left: original CT of the sample; upper right: segmented CT showing sand as black, brine as dark gray, methane hydrate as light gray and gas as white; bottom, CT grayscale profile of the red arrow in original CT, which shows the inside of the pore is brine and the outside of the pore is methane hydrate with a threshold of 22000. Image resolution: 12.50 µm
The second experiment (Exp4) started from an initial methane gas pressure of 6.83 MPa, water saturation of 6.0 % and a salinity of 1.5 wt% NaBr. We maintained the temperature at 4.4±1 °C. The initial hydrate stability pressure at 4.4°C and an initial salinity of 1.5 wt% NaBr is 4.09 MPa.
Figure 7 shows one slice of original CT and its segmented CT after 2 days of methane hydrate growth in sand. The upper-left quarter of the original CT (Figure 7 upper left) shows that the pore space formed by three sand grains is filled with a mixture of NaBr brine and methane hydrate. Figure 7 bottom shows the grayscale profile of the red arrow in the original CT (Figure 7 upper left). The decrease in grayscale number indicates that, the outside of the water droplets has converted to methane hydrates, while the inside is still brine and more concentrated in NaBr. A threshold of 22000 (16-bit gray scale) is chosen
DocuSign Envelope ID: 7B44DA5D-A1A4-448D-9FEA-8CE6C2810995

Hydrate Production Properties Phase 1 Report Page 83 of 97
herein to segment between brine and hydrate. The segmented CT image (Figure 7 upper right) shows the coexistence of four different phases, including, sand, brine, hydrate, and methane gas.
References
Chaouachi, M., Falenty, A., Sell, K., Enzmann, F., Kersten, M., Haberthür, D., & Kuhs, W. F. (2015). Microstructural evolution of gas hydrates in sedimentary matrices observed with synchrotron X-ray computed tomographic microscopy. Geochemistry, Geophysics, Geosystems, 16(6), 1711–1722. https://doi.org/10.1002/2015GC005811
Chen, X., & Espinoza, D. N. (2018). Ostwald ripening changes the pore habit and spatial variability of clathrate hydrate. Fuel, 214, 614–622. https://doi.org/10.1016/j.fuel.2017.11.065
Chen, X., Verma, R., Nicolas Espinoza, D., & Prodanović, M. (2018). Pore-Scale Determination of Gas Relative Permeability in Hydrate-Bearing Sediments Using X-Ray Computed Micro-Tomography and Lattice Boltzmann Method. Water Resources Research, 54(1), 600–608. https://doi.org/10.1002/2017WR021851
Creagh, D. C., & Hubbell, J. H. (1992). X-Ray Absorption (or Attenuation) Coefficients, Sec. 4.2.4. In International Tables for Crystallography (A.J.C. Wilson, ed., Vol. C, pp. 189–206). Dordrecht: Kluwer Academic Publishers.
Jin, Y., Nagao, J., Hayashi, J., Shimada, W., Ebinuma, T., & Narita, H. (2008). Observation of Xe Hydrate Growth at Gas−Ice Interface by Microfocus X-ray Computed Tomography. The Journal of Physical Chemistry C, 112(44), 17253–17256. https://doi.org/10.1021/jp803525m
Jin, Y., Konno, Y., & Nagao, J. (2014). Pressurized subsampling system for pressured gas-hydrate-bearing sediment: Microscale imaging using X-ray computed tomography. Review of Scientific Instruments, 85(9), 094502. https://doi.org/10.1063/1.4896354
Kerkar, P. B., Horvat, K., Jones, K. W., & Mahajan, D. (2014). Imaging methane hydrates growth dynamics in porous media using synchrotron X-ray computed microtomography. Geochemistry, Geophysics, Geosystems, 15(12), 4759–4768. https://doi.org/10.1002/2014GC005373
Kumar, A., Maini, B., Bishnoi, P. R., Clarke, M., Zatsepina, O., & Srinivasan, S. (2010). Experimental determination of permeability in the presence of hydrates and its effect on the dissociation characteristics of gas hydrates in porous media. Journal of Petroleum Science and Engineering, 70(1–2), 114–122. https://doi.org/10.1016/j.petrol.2009.10.005
Sloan Jr, E. D., & Koh, C. (2007). Clathrate hydrates of natural gases. CRC press. Retrieved from http://books.google.com/books?hl=en&lr=&id=T7LC8ldaVR4C&oi=fnd&pg=PP1&dq=info:q1B6AsGWX8QJ:scholar.google.com&ots=Hxkt7iI_Tx&sig=JJlgOhIxIYIp8UDGMIPRu9DJHP0
DocuSign Envelope ID: 7B44DA5D-A1A4-448D-9FEA-8CE6C2810995

Hydrate Production Properties Phase 1 Report Page 84 of 97
Appendix E.1.
Figure A1 X-ray radiographs of the micro-consolidation device at different times of xenon hydrate dissociation. Xenon hydrate is the black pixels that gradually disappear with time. The sand is packed between two PTFE spacers and confined by a stainless steel spring in the bottom.
Figure A1 shows the X-ray radiographs of xenon hydrate dissociation in sandy sediments. From top to bottom, the vessel contains a PTFE spacer, a sandpack, another PTFE spacer with sand inside, and a compressed stainless steel spring. Hydrate crystals are the black pixels that gradually disappear with time. In the sand, hydrate is heterogeneously distributed with the bottom sand having higher hydrate saturation. In the spring area, there is large chunk hydrate. During dissociation, the heterogeneous hydrate distribution in the sandy sediments gradually becomes homogeneous due to different dissociation rates in space. We are working on a paper to quantify the dissociation rate in the sandy sediments.
DocuSign Envelope ID: 7B44DA5D-A1A4-448D-9FEA-8CE6C2810995

Hydrate Production Properties Phase 1 Report Page 85 of 97
Figure A2 Xenon hydrate growth in single pore (Exp1): As Ostwald Ripening develops, hydrate changes from wall-attaching to pore-filling: X-ray radiographs of xenon hydrate (black) growth in xenon gas (dark to medium gray) and water (light gray), resolution: 48.39 μm
Figure A2 shows xenon hydrate growth from the bulk water phase (bottom) and the bulk xenon gas phase at no presence of porous media during Exp1. This entire vessel can be seen as a large pore. Hydrate (black) starts to nucleate on the vessel wall in gas phase as soon as 10 minutes of initiation. Furthermore, hydrate also grows at the interface between water and gas and grows as an aggregate (chunk hydrate) on the top fitting of the vessel. Hydrate volume increase mostly occurs in the first 1 day. Afterwards, we observe hydrate gradually dissociates on the vessel wall and the large chunk hydrate on the top grows bigger. This process of large crystal grows at the expense of small ones is called Ostwald ripening and gradually changes the hydrate pore habit from grain-attaching to pore-filling, which is consistent to our finding in sandy sediments.
DocuSign Envelope ID: 7B44DA5D-A1A4-448D-9FEA-8CE6C2810995

Hydrate Production Properties Phase 1 Report Page 86 of 97
Appendix F
DOE Award No.: DE-FE-0028967
Milestone Report
Milestone 1.G: Built and integrated high-pressure gas mixing chamber
SUMMARY
This milestone report summarizes our achievement of building and integrating the high-pressure gas mixing chamber. This Milestone report is specific to Task 5.1 Design and Build a Micro‐Raman compatible Pressure Vessel. The following sections summarize the chamber design, data acquisition system, and testing of the device. We have successfully formed and dissociated methane hydrates under controlled conditions. The PI in charge of this task is Jung-fu Lin. Graduate student Tiannong Dong, undergraduate student Jesse Gu, Lab Director Peter Polito, and Research Engineer Joshua O’Connell executed high-pressure chamber design, constructed the chamber and data logging system, and performed experiments.
Raman Chamber Design and Construction
We have developed a Raman chamber for hydrate formation and dissociation experiments. The Raman chamber consists of two main parts: the sapphire window and the stainless steel seat. The optically clear sapphire window allows us to conduct in situ optical imaging and Raman spectroscopy during hydrate formation and dissociation experiments. The sapphire window and the seat screw together, sealed by an O-ring. We sourced the sapphire window from Rayotek company. We designed the seat and machined it with 216L stainless steel. Figure 1 shows the entire apparatus in action. The Raman chamber is placed under the Raman spectrometer. The chamber is connected to the syringe pump through a flexible tubing. The chamber is rated to 27.68 MPa (4000 psig). Figure 2 shows the schematic diagram of the Raman chamber, tubing, and the syringe pump.
DocuSign Envelope ID: 7B44DA5D-A1A4-448D-9FEA-8CE6C2810995

Hydrate Production Properties Phase 1 Report Page 87 of 97
Figure 1. Raman chamber under the Raman spectrometer in the Mineral Physics Lab, UT-Austin. The chamber is pressure rated to 27.68 MPa.
Figure 2. Schematic diagram of the Raman Chamber.
DocuSign Envelope ID: 7B44DA5D-A1A4-448D-9FEA-8CE6C2810995

Hydrate Production Properties Phase 1 Report Page 88 of 97
Data Acquisition System
We have built a data acquisition system for pressure and temperature logging and Peltier plate control for cooling capacity. Figure 3 shows the schematic diagram of the electronic circuit and a photograph of the box that contains the data acquisition system. We use analog electronic devices for pressure and temperature data acquisition. The Data Acquisition device (DAQ) supplies voltage and measures voltage across specified electronic devices. In Channel 0 (ch. 0 in Figure 2), the pressure transducer passes through a unique amount of current as a function of a given pressure measured. We put a high-precision resistor of 250 Ω in series with the pressure transducer. By measuring the voltage across the 250 Ω resistor, we may calculate the current passed through the pressure transducer and thus infer the pressure measured. The resistance of the temperature sensor (thermistor) changes as a function of the temperature measured. The temperature information can be calculated in a similar fashion to the pressure transducer.
Figure 3. Schematic circuit diagram and photograph of data acquisition system. The system records one pressure sensor and three temperature sensors.
Pressure and Temperature Testing
The Raman Chamber has been successfully pressure tested with water and CH4 up to 24.24 MPa (3500 psig) and down to 1 °C. We use a syringe pump and a Peltier plate to control pressure and temperature, respectively. We have conducted experiments at conditions of 500 psig – 3500 psig, 1 °C to 22 °C to simulate natural hydrate reservoir conditions.
Example of Experiments
Figure 4 and Figure 5 show an example set of data of hydrate formation and dissociation in the Raman Chamber. We synthesized methane hydrate by increasing the pressure and decreasing the temperature. We dissociated hydrate by slowly decreasing the pressure, controlled by the syringe pump. Raman 2D maps indicate that hydrate dissociation initiated on glass bead grain surfaces and progressed into the pore center.
DocuSign Envelope ID: 7B44DA5D-A1A4-448D-9FEA-8CE6C2810995
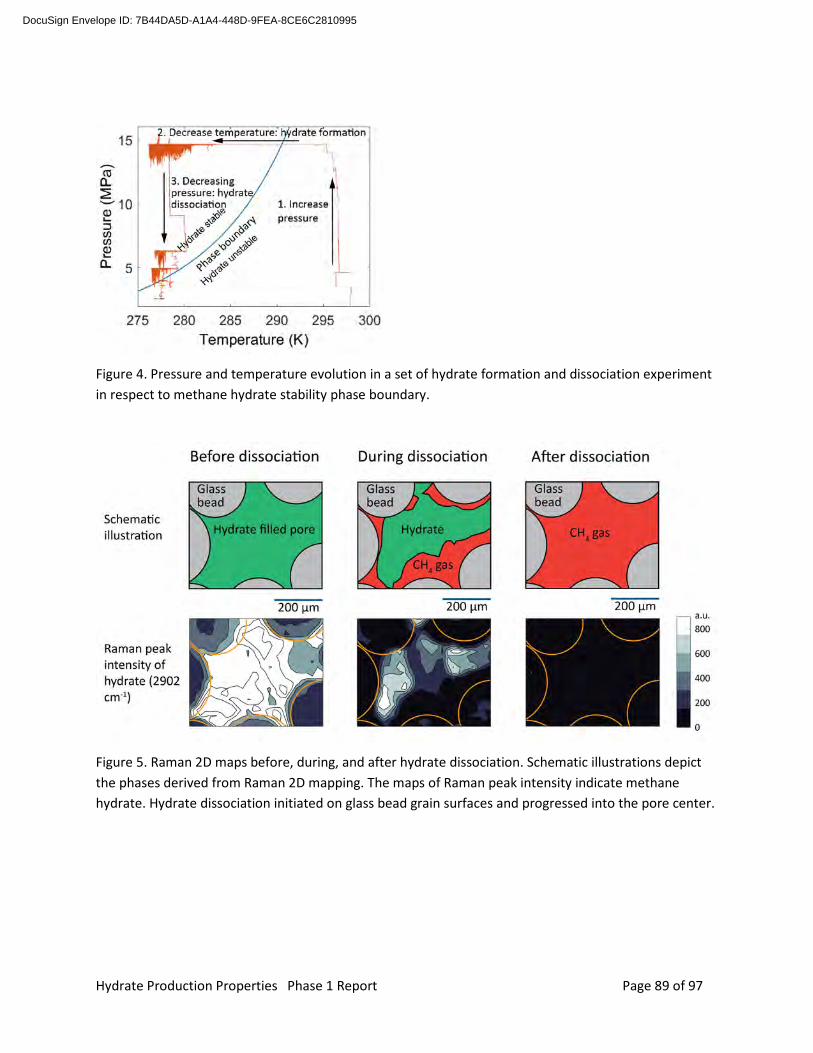
Hydrate Production Properties Phase 1 Report Page 89 of 97
Figure 4. Pressure and temperature evolution in a set of hydrate formation and dissociation experiment in respect to methane hydrate stability phase boundary.
Figure 5. Raman 2D maps before, during, and after hydrate dissociation. Schematic illustrations depict the phases derived from Raman 2D mapping. The maps of Raman peak intensity indicate methane hydrate. Hydrate dissociation initiated on glass bead grain surfaces and progressed into the pore center.
DocuSign Envelope ID: 7B44DA5D-A1A4-448D-9FEA-8CE6C2810995

Hydrate Production Properties Phase 1 Report Page 90 of 97
Appendix G
DOE Award No.: DE-FE-0028967
Milestone Report
Milestone 1.H: Micro-Raman analysis of synthetic complex methane hydrate
SUMMARY
This milestone report summarizes our achievement of Micro-Raman analysis of synthetic complex methane hydrate. This Milestone report is specific to Tasks 5.2 Micro‐scale petrochemistry and 5.3 Diffusion kinetics of methane release. The following sections summarize the methods and results. The PI in charge of this task is Jung-Fu Lin. Graduate student Tiannong Dong and undergraduate student Jesse Gu performed experiments.
Methods
We synthesized methane hydrate with research-grade methane (certified 99.97% purity by Airgas) and deionized water in glass beads of 210 μm – 300 μm in diameter. Silica glass beads were used as the porous media because (1) glass beads have well-defined spherical shape, which simplifies the data interpretation and (2) the surface chemistry and physics of amorphous silica are similar to those of quartz sand. Uchida et al. (2004) experimentally demonstrated that the surface textures of natural quartz sand do not significantly affect the methane hydrate phase equilibria based on experimental data and concluded that using spherical glass beads is an effective method to study hydrate formation in natural sand.
We characterized the formation and dissociation stages using micro-Raman spectroscopy and optical imaging. We utilized the advantages of high spatial and spectral resolution of the Renishaw inVia Raman spectrometer in the Mineral Physics Lab at the University of Texas at Austin. The spatial resolution of the Raman spectrometer is below 1 µm on a dry sample. However, in our Raman Chamber, the spatial resolution was limited to 3 – 5 µm, as the sample contained liquid water and was probed through a sapphire viewing window of 4 mm in thickness.
Results
DocuSign Envelope ID: 7B44DA5D-A1A4-448D-9FEA-8CE6C2810995

Hydrate Production Properties Phase 1 Report Page 91 of 97
Based on thermodynamic calculations, methane hydrate is only known to form structure I (sI) hydrate as the thermodynamically stable phase, under pressure and temperature conditions relevant to natural reservoirs (< 50 MPa and T < 310 K). However, previous experiments in bulk phase without porous media have observed the coexistence of stable structure I and metastable structure II (sII) methane hydrate (Schicks and Ripmeester, 2004). As a metastable phase, sII hydrate is less stable than sI hydrate. Schicks and Ripmeester (2004) observed the structural transformation of sII hydrate recrystallizing into sI hydrate.
We observed the coexistence of sI and sII hydrate in porous media, after forming methane hydrate in glass beads (Figure 1). Figure 2 shows the structural transformation initiated on the glass bead surfaces and progressed into the pore center over hundreds of hours. The sII hydrate converted to sI hydrate at the consumption of sII hydrate. Figure 3 shows the fractions of sI and sII hydrate over time. Figure 4 shows the Raman spectrum evolution from sII hydrate to sI hydrate at the same location over time.
Figure 1. Pressure and temperature evolution of a hydrate formation and dissociation experiment.
DocuSign Envelope ID: 7B44DA5D-A1A4-448D-9FEA-8CE6C2810995

Hydrate Production Properties Phase 1 Report Page 92 of 97
Figure 2. Annotated optical images and Raman peak intensity ratios of large to small cages (intensity of Raman peak at 2902 cm-1 to peak at 2912 cm-1). The circles outline glass beads. Upon hydrate formation, we observed the coexistence of stable sI (yellow) and metastable sII (blue) hydrate. Metastable sII to stable sI transformation initiated on grain surfaces and then progressed into the pore center. Stable sI hydrate grew into the pore space at the consumption of sII hydrate.
Figure 3. During hydrate formation, the fractions of structure I (sI) and structure II (sII) hydrates over time. Since sII hydrate is metastable under the experimental conditions, sII hydrate converted to sI hydrate at the consumption of sII hydrate.
DocuSign Envelope ID: 7B44DA5D-A1A4-448D-9FEA-8CE6C2810995

Hydrate Production Properties Phase 1 Report Page 93 of 97
Figure 4. Raman spectra at the same location throughout the hydrate formation stage. Raman spectra show sII hydrate slowly converted to sI hydrate over time.
We dissociated methane hydrates by depressurization at constant temperature in the Raman Chamber over 1 hour (Figure 5). We acquired Raman 2D mapping and optical images of the samples in glass beads. In the pore network (Figure 6), methane hydrate dissociated into gaseous methane and liquid water. The gaseous methane expanded radially in the pore network and carried out further hydrate dissociation. At the pore scale, as shown in Figure 7, dissociation started around porous medium grains (by means of spherical glass beads in this experiment). Gradually, hydrate dissociation propagated into the pore space. Methane hydrate dissociation is an endothermal reaction. We interpret that the porous medium grains (silica glass beads) provide heat to the hydrate dissociation due to their high heat capacities. We interpret that the hydrate dissociation along grains creates a connected fluid network on grain surfaces and pore networks. This connected fluid flow path may be crucial to gas hydrate reservoir permeability evolution during production.
DocuSign Envelope ID: 7B44DA5D-A1A4-448D-9FEA-8CE6C2810995

Hydrate Production Properties Phase 1 Report Page 94 of 97
Figure 5. Pressure and temperature evolution during the dissociation stage. Time zero (t0) is aligned to the start of the hydrate dissociation. Hydrate dissociation was carried out by decreasing pressure at 0.1 MPa steps. The temperature was maintained constant. The dissociation of hydrate is characterized by the pressure in a constant volume chamber. Due to the small size of the sample, all hydrate dissociated after about an hour.
Figure 6. During hydrate dissociation, gaseous methane radially expanded in the pore network and carried out further hydrate dissociation. At t0, all pores were filled by methane hydrate and water. From t1 to t5, the dark regions indicated methane hydrated and water filled pores; the bright regions indicated vapor methane filled pores.
DocuSign Envelope ID: 7B44DA5D-A1A4-448D-9FEA-8CE6C2810995
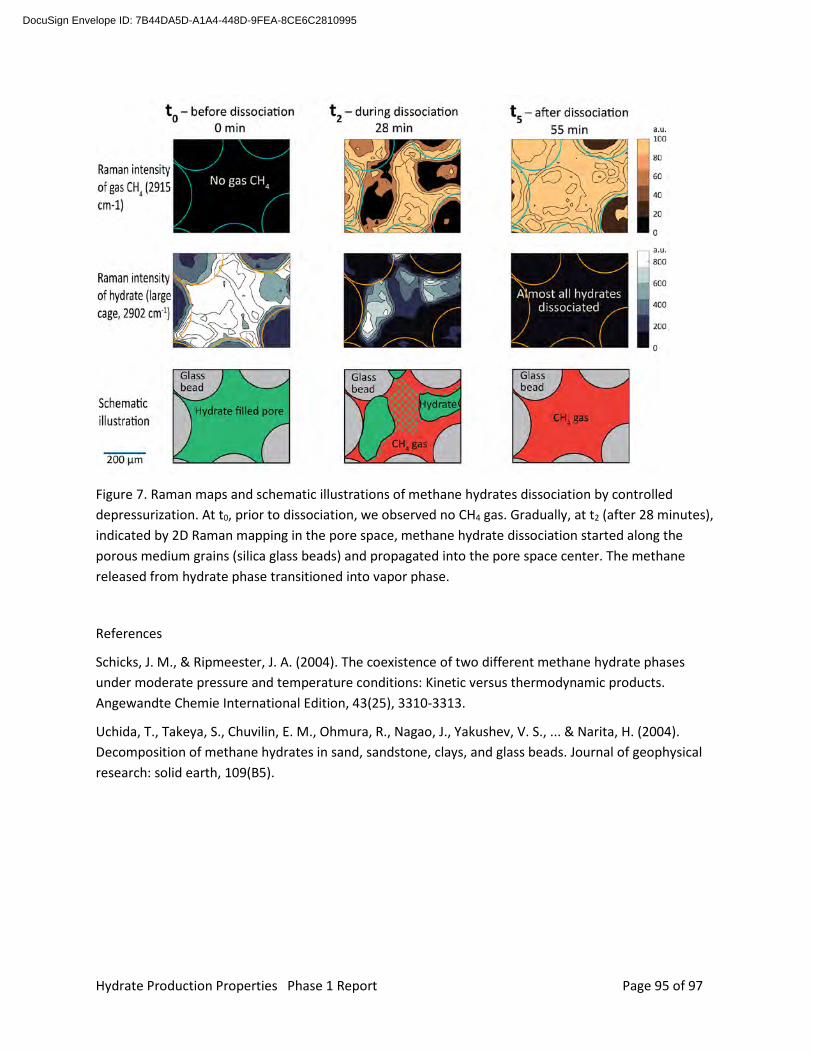
Hydrate Production Properties Phase 1 Report Page 95 of 97
Figure 7. Raman maps and schematic illustrations of methane hydrates dissociation by controlled depressurization. At t0, prior to dissociation, we observed no CH4 gas. Gradually, at t2 (after 28 minutes), indicated by 2D Raman mapping in the pore space, methane hydrate dissociation started along the porous medium grains (silica glass beads) and propagated into the pore space center. The methane released from hydrate phase transitioned into vapor phase.
References
Schicks, J. M., & Ripmeester, J. A. (2004). The coexistence of two different methane hydrate phases under moderate pressure and temperature conditions: Kinetic versus thermodynamic products. Angewandte Chemie International Edition, 43(25), 3310-3313.
Uchida, T., Takeya, S., Chuvilin, E. M., Ohmura, R., Nagao, J., Yakushev, V. S., ... & Narita, H. (2004). Decomposition of methane hydrates in sand, sandstone, clays, and glass beads. Journal of geophysical research: solid earth, 109(B5).
DocuSign Envelope ID: 7B44DA5D-A1A4-448D-9FEA-8CE6C2810995

DocuSign Envelope ID: 7B44DA5D-A1A4-448D-9FEA-8CE6C2810995