document of the world bank · lapg learner assessment and progression guidelines ... qer quality...
TRANSCRIPT

Document of
The World Bank
Report No: ICR2025
IMPLEMENTATION COMPLETION AND RESULTS REPORT
(IDA-37940 TF-91092)
ON A
CREDIT
IN THE AMOUNT OF SDR 32.7 MILLION
(US$45 MILLION EQUIVALENT)
AND A
EUROPEAN COMMISION GRANT
IN THE AMOUNT OF
€32.4 MILLION (US$43 MILLION EQUIVALENT)
TO THE
STATE OF ERITREA
FOR A
ERITREA EDUCATION SECTOR INVESTMENT PROJECT
February 28, 2012
Human Development: Education
Eastern Africa 2
Africa Region
Pub
lic D
iscl
osur
e A
utho
rized
Pub
lic D
iscl
osur
e A
utho
rized
Pub
lic D
iscl
osur
e A
utho
rized
Pub
lic D
iscl
osur
e A
utho
rized
Pub
lic D
iscl
osur
e A
utho
rized
Pub
lic D
iscl
osur
e A
utho
rized
Pub
lic D
iscl
osur
e A
utho
rized
Pub
lic D
iscl
osur
e A
utho
rized

ii
CURRENCY EQUIVALENTS
(Exchange Rate Effective December 31, 2011)
Currency Unit = Nakfa
Nakfa 1.00 = US$0.67
US$ 1.00 = Nakfa 15
FISCAL YEAR
January 1 – December 31
ABBREVIATIONS AND ACRONYMS
AA Administration Agreement
AfDB African Development Bank
ANED Division of Assessment and National Examinations
ATEI Asmara Teacher Education Institute –
ATTI Asmara Teacher Training Institute –
CAS Country Assistance Strategy
CDC Curriculum Development Center –
CP Community Participation
DANIDA Danish International Development Agency
DCA Development Credit Agreement
DHS Demographic and Household Surveys
DTP Desktop Publishing Unit
EC European Commission
ECD Early Childhood Development
ECTF EC Trust Fund
EEBC Eritrea-Ethiopia Boundary Commission
EESIP Eritrea Education Sector Investment Project
EHRDP Eritrea Human Resource Development Project
EIT Eritrea Institute of Technology
EMIS Education Management Information System
ESDP Education Sector Development Program
iii
ESMF Environmental and Social Management Framework
FMR Financial Management Report
GDP Gross Domestic Product
GER Gross Enrollment Rate
GIS Geographic Information System
GOE Government of Eritrea
GPI gender parity index
ICB International Competitive Bidding
ICR Implementation Completion and Results report
ICT information communication and technology
IDA International Development Association
IRR Internal Rate of Return
ISR Implementation Status and Results
ISS Interim Support Strategy
IT Information Technology
LAPG Learner Assessment and Progression Guidelines
LC Letters of Credit
M&E Monitoring and Evaluation
MDG Millennium Development Goals
MLA Monitoring Learning Achievement
MOE Ministry of Education
MOE Ministry of Education
NAEC National Accreditation and Evaluation Center -
NCB National Competitive Bidding
NPV Net Present Value
ODLP Open Distance Learning Program
PAD Project Appraisal Document
PDO Project Development Objectives
PIM Project Implementation Manual
PMU Project Management Unit
PRCs Pedagogic Resource Centers
PRR Procedures, Rules and Regulations
QER Quality Enhancement Review
QSA Quality of Supervision Assessment
RRA Rapid Results Approach
SENA Supervision, Examinations and National Assessment
SIL Sector Investment Loan

iv
SWAP Sector Wide Approach
SY School Year
TSZ Temporary Security Zone
TTL Task Team Leader
TVET Technical and Vocational Education and Training
UN United Nations
UNICEF United Nations Children's Fund
UNMEE UN Peace Keeping Mission
Vice President: Obiageli K. Ezekwesili
Country Director: Johannes C.M. Zutt
Sector Manager: Peter N. Materu
Project Team Leader: Susan E. Hirshberg
ICR Team Leader:
ICR Primary Authors:
Susan E. Hirshberg
Sandra Beemer
Franco Russo
v
STATE OF ERITREA
Eritrea Education Sector Investment Project
CONTENTS
Data Sheet
A. Basic Information
B. Key Dates
C. Ratings Summary
D. Sector and Theme Codes
E. Bank Staff
F. Results Framework Analysis
G. Ratings of Project Performance in ISRs
H. Restructuring
I. Disbursement Graph
1. Project Context, Development Objectives and Design ............................................... 1
2. Key Factors Affecting Implementation and Outcomes .............................................. 6
3. Assessment of Outcomes .......................................................................................... 12
4. Assessment of Risk to Development Outcome ......................................................... 19
5. Assessment of Bank and Borrower Performance ..................................................... 20
6. Lessons Learned ....................................................................................................... 22
7. Comments on Issues Raised by Borrower/Implementing Agencies/Partners .......... 23
Annex 1. Project Costs and Financing .......................................................................... 24
Annex 2. Outputs by Component ................................................................................. 26
Annex 3. Economic and Financial Analysis ................................................................. 35
Annex 4. Bank Lending and Implementation Support/Supervision Processes ............ 39
Annex 5. Beneficiary Survey Results ........................................................................... 41
Annex 6. Stakeholder Workshop Report and Results ................................................... 42
Annex 7. Summary of Borrower's ICR and/or Comments on Draft ICR ..................... 43
Annex 8. Comments of Cofinanciers and Other Partners/Stakeholders ....................... 53
Annex 9. List of Supporting Documents ...................................................................... 54
Annex 10. ICR Mission Project Outcome Analysis ..................................................... 55
MAP


vi
A. Basic Information
Country: Eritrea Project Name:
Eritrea Education
Sector Investment
Project
Project ID: P070272 L/C/TF Number(s): IDA-37940,TF-91092
ICR Date: 01/17/2012 ICR Type: Core ICR
Lending Instrument: SIL Borrower: GOVERNMENT OF
ERITREA
Original Total
Commitment: XDR 32.7M Disbursed Amount:
XDR 31.16M
Euro 31M
Revised Amount: XDR 32.7M
Euro 32.4M
Environmental Category: B
Implementing Agencies:
Ministry of Education and Project Management Unit
Cofinanciers and Other External Partners:
European Commission
B. Key Dates
Process Date Process Original Date Revised / Actual
Date(s)
Concept Review: 02/06/2003 Effectiveness: 09/23/2003 09/23/2003
Appraisal: 04/21/2003 Restructuring(s):
06/28/2007
06/25/2010
08/23/2010
12/09/2010
Approval: 06/19/2003 Mid-term Review: 04/24/2006
Closing: 02/28/2009 08/31/2011
C. Ratings Summary
C.1 Performance Rating by ICR
Outcomes: Moderately Unsatisfactory
Risk to Development Outcome: Significant
Bank Performance: Moderately Unsatisfactory
Borrower Performance: Moderately Unsatisfactory
C.2 Detailed Ratings of Bank and Borrower Performance (by ICR)
Bank Ratings Borrower Ratings
Quality at Entry: Moderately Government: Moderately

vii
Unsatisfactory Unsatisfactory
Quality of Supervision: Moderately
Unsatisfactory
Implementing
Agency/Agencies: Moderately Satisfactory
Overall Bank
Performance:
Moderately
Unsatisfactory Overall Borrower
Performance:
Moderately
Unsatisfactory
C.3 Quality at Entry and Implementation Performance Indicators
Implementation
Performance Indicators
QAG Assessments
(if any) Rating
Potential Problem Project
at any time (Yes/No): Yes
Quality at Entry
(QEA): None
Problem Project at any
time (Yes/No): Yes
Quality of
Supervision (QSA):
Moderately
Unsatisfactory
DO rating before
Closing/Inactive status:
Moderately
Unsatisfactory
D. Sector and Theme Codes
Original Actual
Sector Code (as % of total Bank financing)
General education sector 8 8
Primary education 62 62
Secondary education 30 30
Theme Code (as % of total Bank financing)
Education for all 100 100
E. Bank Staff
Positions At ICR At Approval
Vice President: Obiageli Katryn Ezekwesili Callisto E. Madavo
Country Director: Johannes C.M. Zutt Makhtar Diop
Sector Manager: Peter Nicolas Materu Dzingai B. Mutumbuka
Project Team Leader: Susan E. Hirshberg Patrick D. Murphy
ICR Team Leader: Sandra F. Beemer
ICR Primary Author: Sandra F. Beemer/Franco Russo
F. Results Framework Analysis
Project Development Objectives (from Project Appraisal Document) Attain increased and more equitable enrolment in basic education and to enhance the
quality of its basic and secondary education.
viii
Revised Project Development Objectives (as approved by original approving
authority) n/a
(a) PDO Indicator(s)
Indicator Baseline Value
Original Target
Values (from
approval
documents)
Formally
Revised
Target
Values
Actual Value
Achieved at
Completion or
Target Years
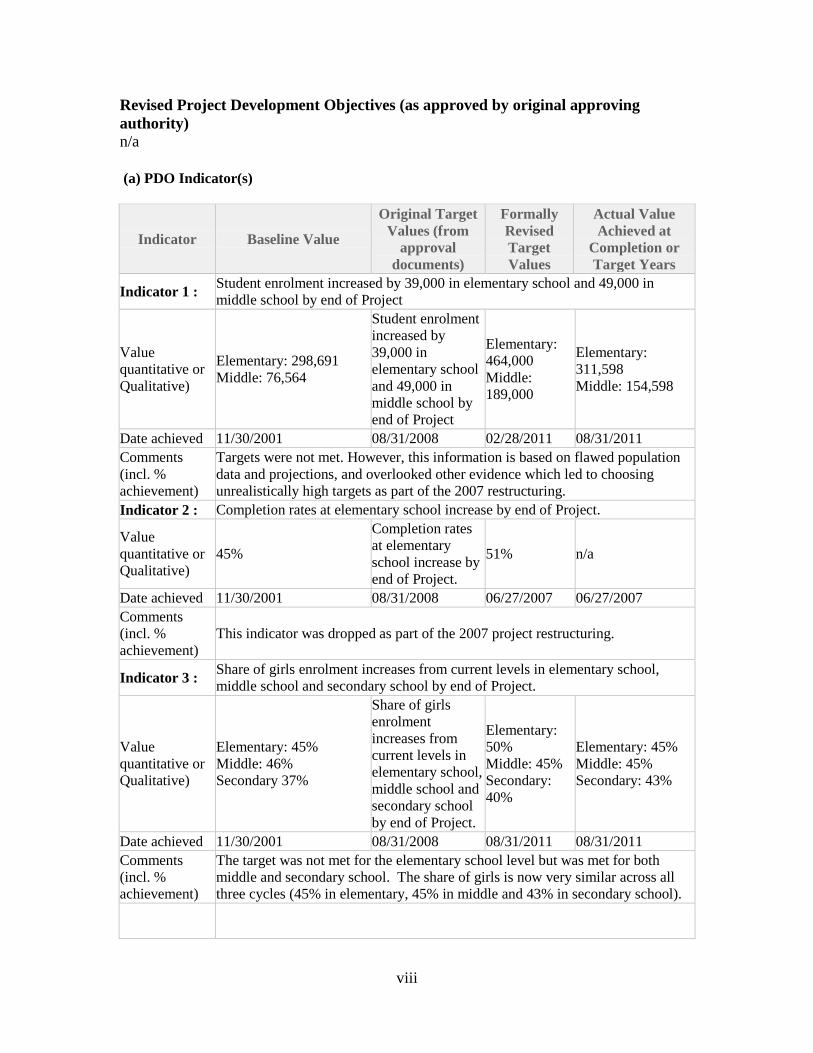
Indicator 1 : Student enrolment increased by 39,000 in elementary school and 49,000 in
middle school by end of Project
Value
quantitative or
Qualitative)
Elementary: 298,691
Middle: 76,564
Student enrolment
increased by
39,000 in
elementary school
and 49,000 in
middle school by
end of Project
Elementary:
464,000
Middle:
189,000
Elementary:
311,598
Middle: 154,598
Date achieved 11/30/2001 08/31/2008 02/28/2011 08/31/2011
Comments
(incl. %
achievement)
Targets were not met. However, this information is based on flawed population
data and projections, and overlooked other evidence which led to choosing
unrealistically high targets as part of the 2007 restructuring.
Indicator 2 : Completion rates at elementary school increase by end of Project.
Value
quantitative or
Qualitative)
45%
Completion rates
at elementary
school increase by
end of Project.
51% n/a
Date achieved 11/30/2001 08/31/2008 06/27/2007 06/27/2007
Comments
(incl. %
achievement)
This indicator was dropped as part of the 2007 project restructuring.
Indicator 3 : Share of girls enrolment increases from current levels in elementary school,
middle school and secondary school by end of Project.
Value
quantitative or
Qualitative)
Elementary: 45%
Middle: 46%
Secondary 37%
Share of girls
enrolment
increases from
current levels in
elementary school,
middle school and
secondary school
by end of Project.
Elementary:
50%
Middle: 45%
Secondary:
40%
Elementary: 45%
Middle: 45%
Secondary: 43%
Date achieved 11/30/2001 08/31/2008 08/31/2011 08/31/2011
Comments
(incl. %
achievement)
The target was not met for the elementary school level but was met for both
middle and secondary school. The share of girls is now very similar across all
three cycles (45% in elementary, 45% in middle and 43% in secondary school).
ix
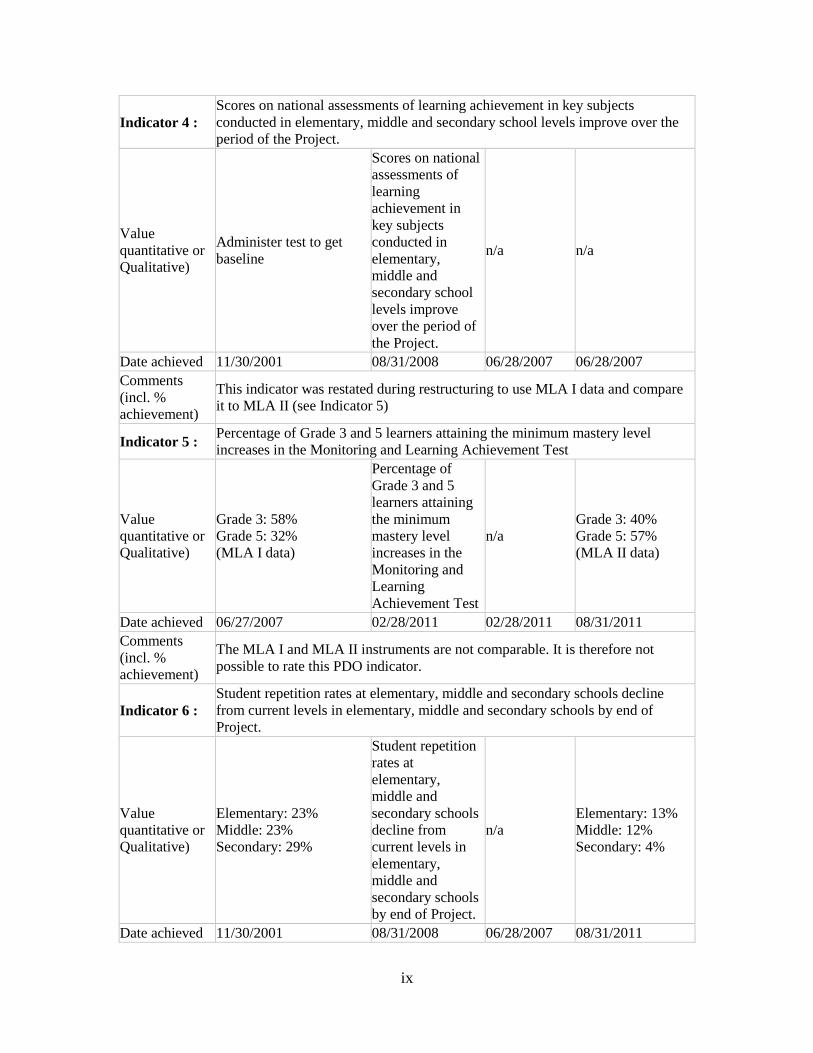
Indicator 4 :
Scores on national assessments of learning achievement in key subjects
conducted in elementary, middle and secondary school levels improve over the
period of the Project.
Value
quantitative or
Qualitative)
Administer test to get
baseline
Scores on national
assessments of
learning
achievement in
key subjects
conducted in
elementary,
middle and
secondary school
levels improve
over the period of
the Project.
n/a n/a
Date achieved 11/30/2001 08/31/2008 06/28/2007 06/28/2007
Comments
(incl. %
achievement)
This indicator was restated during restructuring to use MLA I data and compare
it to MLA II (see Indicator 5)
Indicator 5 : Percentage of Grade 3 and 5 learners attaining the minimum mastery level
increases in the Monitoring and Learning Achievement Test
Value
quantitative or
Qualitative)
Grade 3: 58%
Grade 5: 32%
(MLA I data)
Percentage of
Grade 3 and 5
learners attaining
the minimum
mastery level
increases in the
Monitoring and
Learning
Achievement Test
n/a
Grade 3: 40%
Grade 5: 57%
(MLA II data)
Date achieved 06/27/2007 02/28/2011 02/28/2011 08/31/2011
Comments
(incl. %
achievement)
The MLA I and MLA II instruments are not comparable. It is therefore not
possible to rate this PDO indicator.
Indicator 6 :
Student repetition rates at elementary, middle and secondary schools decline
from current levels in elementary, middle and secondary schools by end of
Project.
Value
quantitative or
Qualitative)
Elementary: 23%
Middle: 23%
Secondary: 29%
Student repetition
rates at
elementary,
middle and
secondary schools
decline from
current levels in
elementary,
middle and
secondary schools
by end of Project.
n/a
Elementary: 13%
Middle: 12%
Secondary: 4%
Date achieved 11/30/2001 08/31/2008 06/28/2007 08/31/2011

x
Comments
(incl. %
achievement)
This indicator was dropped during the 2007 restructuring.
Indicator 7 : Student dropout rates at elementary, middle and secondary school levels decline
by end of Project.
Value
quantitative or
Qualitative)
Elementary: 6%
Middle: 10%
Secondary: 9%
Student dropout
rates at
elementary,
middle and
secondary school
levels decline by
end of Project.
n/a
Elementary: 6%
Middle: 6%
Secondary: 9%
Date achieved 11/30/2001 08/31/2008 06/28/2007 08/31/2011
Comments
(incl. %
achievement)
This indicator was dropped during the 2007 restructuring.
Indicator 8 : Share of expatriate teachers in general secondary schools decline by end of
Project.
Value
quantitative or
Qualitative)
19%
Share of expatriate
teachers in general
secondary schools
decline by end of
Project.
n/a 14% (SY04/05)
Date achieved 11/30/2001 08/31/2008 06/28/2007 08/31/2005
Comments
(incl. %
achievement)
This indicator was dropped during the 2007 restructuring.
Indicator 9 : Percentage of Grade 8 national examination pass rate increases
Value
quantitative or
Qualitative)
Grade 8: 71%
Percentage of
Grade 8 national
examination pass
rate increases
n/a 74.8%
Date achieved 06/28/2007 02/28/2011 06/28/2007 08/31/2011
Comments
(incl. %
achievement)
This indicator was not documented until just after the 2007 restructuring. The
target was reached for SY8/09, but declined by 1.2 percent in 2009/10, which the
ICR team does not consider to be a significant decline.
(b) Intermediate Outcome Indicator(s)
Indicator Baseline Value
Original Target
Values (from
approval
documents)
Formally
Revised
Target Values
Actual Value
Achieved at
Completion or
Target Years
Indicator 1 : New and cost-effective school designs approved
Value
(quantitative
or Qualitative)
No Yes n/a Yes
Date achieved 06/28/2007 02/28/2011 08/31/2011

xi
Comments
(incl. %
achievement)
This target was achieved. Designs have been prepared, approved and used in all
civil works activities.
Indicator 2 : Classrooms built and/ or rehabilitated (Bank-wide Core Indicator)
Value
(quantitative
or Qualitative)
0 1,603 1,400 1,638
Date achieved 11/30/2001 08/31/2008 02/28/2011 08/31/2011
Comments
(incl. %
achievement)
The total school construction was exceeded, reaching 117% of the restructured
target.
Indicator 3 : Number of teachers trained/upgraded through fast-track or summer training
programs
Value
(quantitative
or Qualitative)
0 2,500 n/a 4,522
Date achieved 06/27/2007 02/28/2011 08/31/2011
Comments
(incl. %
achievement)
Target was exceeded, reaching 180% of target value.
Indicator 4 : Number of teachers trained/upgraded through open and distance learning
Value
(quantitative
or Qualitative)
0 2,080 n/a 1,600
Date achieved 06/27/2007 02/28/2011 08/31/2011
Comments
(incl. %
achievement)
There were 2,080 teachers that entered the program, however only 1,600
participants completed the program successfully.
Indicator 5 : % of subjects requiring revisions under the curriculum reform completed new
materials development
Value
(quantitative
or Qualitative)
0 100% n/a 100%
Date achieved 06/27/2007 02/28/2011 08/31/2011
Comments
(incl. %
achievement)
This target was met. GOE completed the new curriculum for grades 1-12,
developed syllabi to support it, trained teachers in new curriculum, developed
textbooks, printed textbooks and distributed them.
Indicator 6 : New round of MLA testing prepared, implemented and results analyzed.
Value
(quantitative
or Qualitative)
0 completed completed
Date achieved 06/27/2007 02/28/2011 08/31/2011
Comments
(incl. %
achievement)
This target was achieved. Although MLA I and II results cannot be compared,
meaningful lessons were learned through TA for future student assessment in
Eritrea.
xii
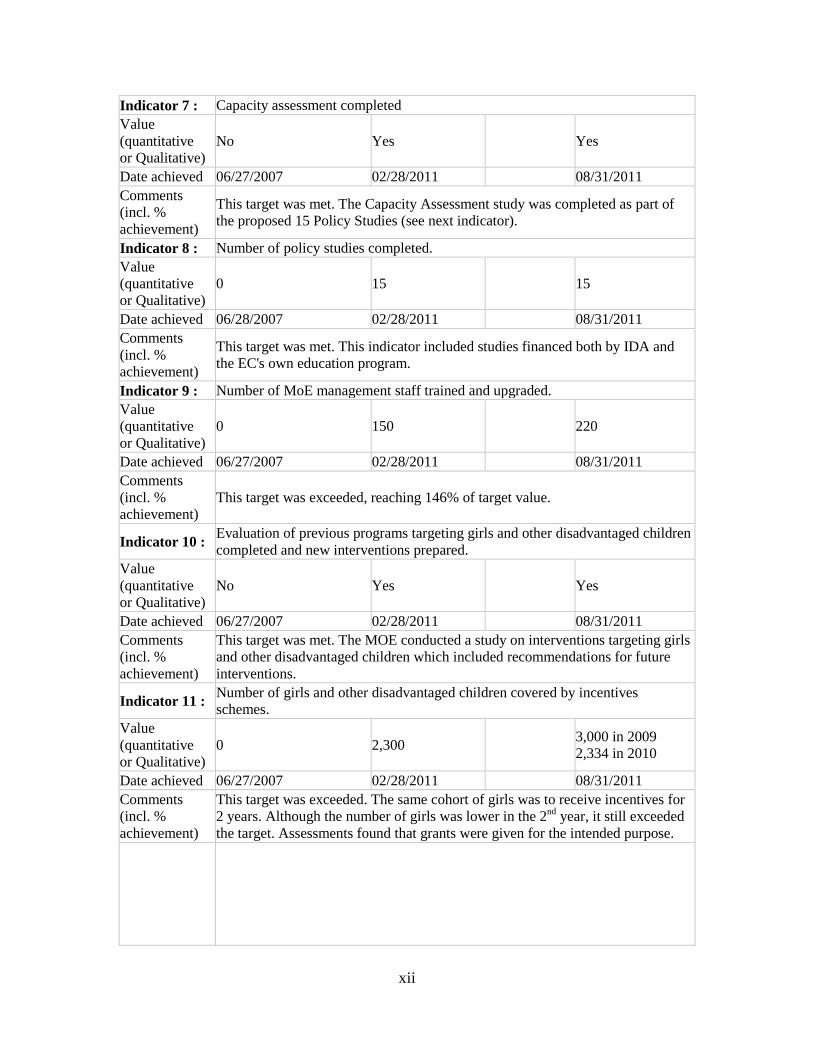
Indicator 7 : Capacity assessment completed
Value
(quantitative
or Qualitative)
No Yes Yes
Date achieved 06/27/2007 02/28/2011 08/31/2011
Comments
(incl. %
achievement)
This target was met. The Capacity Assessment study was completed as part of
the proposed 15 Policy Studies (see next indicator).
Indicator 8 : Number of policy studies completed.
Value
(quantitative
or Qualitative)
0 15 15
Date achieved 06/28/2007 02/28/2011 08/31/2011
Comments
(incl. %
achievement)
This target was met. This indicator included studies financed both by IDA and
the EC's own education program.
Indicator 9 : Number of MoE management staff trained and upgraded.
Value
(quantitative
or Qualitative)
0 150 220
Date achieved 06/27/2007 02/28/2011 08/31/2011
Comments
(incl. %
achievement)
This target was exceeded, reaching 146% of target value.
Indicator 10 : Evaluation of previous programs targeting girls and other disadvantaged children
completed and new interventions prepared.
Value
(quantitative
or Qualitative)
No Yes Yes
Date achieved 06/27/2007 02/28/2011 08/31/2011
Comments
(incl. %
achievement)
This target was met. The MOE conducted a study on interventions targeting girls
and other disadvantaged children which included recommendations for future
interventions.
Indicator 11 : Number of girls and other disadvantaged children covered by incentives
schemes.
Value
(quantitative
or Qualitative)
0 2,300 3,000 in 2009
2,334 in 2010
Date achieved 06/27/2007 02/28/2011 08/31/2011
Comments
(incl. %
achievement)
This target was exceeded. The same cohort of girls was to receive incentives for
2 years. Although the number of girls was lower in the 2nd
year, it still exceeded
the target. Assessments found that grants were given for the intended purpose.
xiii
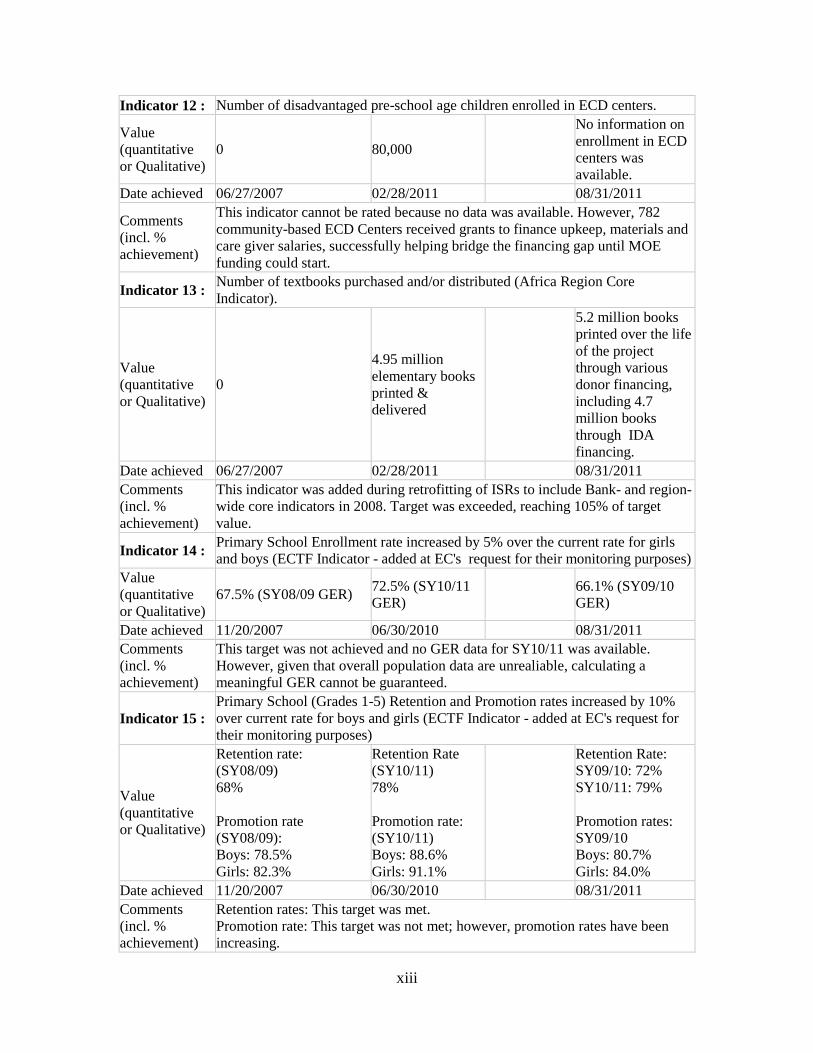
Indicator 12 : Number of disadvantaged pre-school age children enrolled in ECD centers.
Value
(quantitative
or Qualitative)
0 80,000
No information on
enrollment in ECD
centers was
available.
Date achieved 06/27/2007 02/28/2011 08/31/2011
Comments
(incl. %
achievement)
This indicator cannot be rated because no data was available. However, 782
community-based ECD Centers received grants to finance upkeep, materials and
care giver salaries, successfully helping bridge the financing gap until MOE
funding could start.
Indicator 13 : Number of textbooks purchased and/or distributed (Africa Region Core
Indicator).
Value
(quantitative
or Qualitative)
0
4.95 million
elementary books
printed &
delivered
5.2 million books
printed over the life
of the project
through various
donor financing,
including 4.7
million books
through IDA
financing.
Date achieved 06/27/2007 02/28/2011 08/31/2011
Comments
(incl. %
achievement)
This indicator was added during retrofitting of ISRs to include Bank- and region-
wide core indicators in 2008. Target was exceeded, reaching 105% of target
value.
Indicator 14 : Primary School Enrollment rate increased by 5% over the current rate for girls
and boys (ECTF Indicator - added at EC's request for their monitoring purposes)
Value
(quantitative
or Qualitative)
67.5% (SY08/09 GER) 72.5% (SY10/11
GER)
66.1% (SY09/10
GER)
Date achieved 11/20/2007 06/30/2010 08/31/2011
Comments
(incl. %
achievement)
This target was not achieved and no GER data for SY10/11 was available.
However, given that overall population data are unrealiable, calculating a
meaningful GER cannot be guaranteed.
Indicator 15 :
Primary School (Grades 1-5) Retention and Promotion rates increased by 10%
over current rate for boys and girls (ECTF Indicator - added at EC's request for
their monitoring purposes)
Value
(quantitative
or Qualitative)
Retention rate:
(SY08/09)
68%
Promotion rate
(SY08/09):
Boys: 78.5%
Girls: 82.3%
Retention Rate
(SY10/11)
78%
Promotion rate:
(SY10/11)
Boys: 88.6%
Girls: 91.1%
Retention Rate:
SY09/10: 72%
SY10/11: 79%
Promotion rates:
SY09/10
Boys: 80.7%
Girls: 84.0%
Date achieved 11/20/2007 06/30/2010 08/31/2011
Comments
(incl. %
achievement)
Retention rates: This target was met.
Promotion rate: This target was not met; however, promotion rates have been
increasing.

xiv
Indicator 16 : Project-constructed and upgraded schools occupied (ECTF Indicator - added at
EC's request for their monitoring purposes)
Value
(quantitative
or Qualitative)
n/a 95% occupancy No data available
Date achieved 11/20/2007 06/30/2010 08/31/2011
Comments
(incl. %
achievement)
The project did not track this information. Therefore this indicator cannot be
evaluated. Anecdotal information data based on field visits to newly constructed
schools seems to indicate 100% of schools are functioning.
Indicator 17 : Basic Training of TVET instructors ongoing at project-constructed TVET
facilities (ECTF Indicator - added at EC's request for their monitoring purposes)
Value
(quantitative
or Qualitative)
n/a Trainings ongoing ongoing
Date achieved 11/20/2007 06/30/2010 08/31/2011
Comments
(incl. %
achievement)
This target was not fully met because TVET centers could not be built due to
imminent project closure. However, trainings are being carried out with EC
funds, training a total of 102 instructors.
G. Ratings of Project Performance in ISRs
No. Date ISR
Archived DO IP
Actual
Disbursements
(USD millions)
1 07/23/2003 Satisfactory Satisfactory 0.00
2 11/13/2003 Satisfactory Satisfactory 2.00
3 03/12/2004 Unsatisfactory Unsatisfactory 2.98
4 11/22/2004 Unsatisfactory Unsatisfactory 7.63
5 05/06/2005 Moderately
Unsatisfactory
Moderately
Unsatisfactory 8.94
6 12/19/2005 Moderately Satisfactory Moderately Satisfactory 12.72
7 06/19/2006 Moderately Satisfactory Moderately
Unsatisfactory 13.58
8 01/11/2007 Moderately Satisfactory Moderately
Unsatisfactory 15.27
9 06/29/2007 Moderately Satisfactory Moderately
Unsatisfactory 17.71
10 12/11/2007 Moderately Satisfactory Moderately
Unsatisfactory 18.95
11 02/14/2008 Moderately Satisfactory Moderately
Unsatisfactory 19.14
12 06/20/2008 Moderately Satisfactory Moderately
Unsatisfactory 20.52
13 11/10/2008 Moderately Satisfactory Moderately
Unsatisfactory 23.60
14 12/31/2008 Moderately Satisfactory Moderately
Unsatisfactory 25.08

xv
15 06/29/2009 Moderately Satisfactory Moderately
Unsatisfactory 25.48
16 11/17/2009 Moderately Satisfactory Moderately Satisfactory 26.66
17 04/06/2010 Moderately Satisfactory Moderately Satisfactory 27.21
18 10/24/2010 Moderately Satisfactory Moderately Satisfactory 30.44
19 07/13/2011 Moderately Satisfactory Moderately Satisfactory 34.08
20 08/28/2011 Moderately
Unsatisfactory
Moderately
Unsatisfactory 41.85
H. Restructuring (if any)
Restructuring
Date(s)
Board
Approved
PDO Change
ISR Ratings at
Restructuring
Amount
Disbursed at
Restructuring
in USD
millions
Reason for Restructuring &
Key Changes Made DO IP
06/28/2007 N MS MU 17.71
Realign IDA resources and
harmonize with other donor
financing to better support the
government Education Sector
Development Plan, and to add
the EC trust fund for € 32.4
million.
06/25/2010 MS MS 27.81
Temporary extension of closing
date of ECTF to allow EC
Brussels to extend the
Administrative Agreement with
the Bank
08/23/2010 MS MS 29.42
Extension of the ECTF until
August 31, 2011 in anticipation
of the IDA project also being
extended from Feb. 28, 2011 to
August 31, 2011.
12/09/2010 MS MS 31.13
Extension of the IDA project
until August 31, 2011 and
reallocation of funds.

xvi
I. Disbursement Profile


1
1. Project Context, Development Objectives and Design
1.1 Context at Appraisal
1. Country Context. At the time of project appraisal, Eritrea had been independent for
12 years, two of which were marked by a border war with Ethiopia (1998 – 2000). The war
had a negative effect on Eritrea‘s physical, economic and social infrastructure. After having
grown by an average of almost 11 percent per year, the economy shrank considerably (by 12
percent in 2000 and 2.8 percent in 2002), although end-of-2003 figures portrayed a more
optimistic picture with a Gross Domestic Product (GDP) increase of 3 percent. Inflation
increased from 7.7 percent in 1997 to 20.8 percent in 2003, while foreign exchange reserves
decreased as did exports.
2. Sector Context. The shortage of skilled labor due to having been enlisted during the
war also affected the efficient functioning of the government, businesses and households and
hampered public service delivery, including education. The lack of qualified personnel in the
education system led to weak student learning achievements at the elementary levels,
inadequate proxies for learning at middle and secondary school levels, high student to teacher
ratios at all levels and reliance on costly expatriate teachers. The inability of the public sector
to provide sufficient student places led to overcrowding in elementary, middle, and secondary
schools, and the total net enrollment rate was only 43 percent (net enrollment rate for girls
was 39 percent).
3. Despite these challenges, the government of Eritrea recognized the importance of
improving its human development indicators and reaffirmed its commitment to achieve the
Millennium Development Goals (MDG). Understanding the negative impact of the financial
and institutional constraints on the social sectors, and in order to sustain and increase the
gains made during the first ten years of independence, the government pledged to increase
public spending and prioritize acceleration of the education sector development.
4. At the time of project preparation, the education sector suffered from several
weaknesses: (i) low access to education; (ii) low quality of education; (iii) low internal
efficiency; (iv) equity and HIV/AIDS issues, and (v) poor delivery and planning capacity.
The Government of Eritrea understood that for its economy to grow and for the people of
Eritrea to be leading productive and successful lives, it had to tackle issues impeding access
to and delivery of quality education. Therefore, the government produced a series of reports
outlining its vision for creating ―a well educated and learning society‖. The main report was
the Education Sector Development Program (EDSP) which was produced by a technical
committee meeting and was discussed with the Bank March 31-April 2, 2004.. The ESDP
was comprised of four pillars: (i) improve access and equity in basic education; (ii) improve
quality of education by consolidating teacher training programs; (iii) promote science and
technology by intensifying vocation education and training; and (iv) expand provision of
education by involving the private sector and by promoting and strengthening the formal and
non-formal, distance and out-of-school learning and educational programs..
5. Project Context. To cover the cost of the sector-wide program that emerged as a
result of this national framework, the government requested the Bank to provide financial

2
support to help it implement the program. Although the Bank recognized the importance of
the proposed sector program, the Bank also felt that the program was not yet fully developed.
It was agreed that certain areas of the program required additional analysis before Eritrea
could embark on a comprehensive sector-wide program (i.e. analysis of the financial impact
of such a program on the government‘s resources, both human and financial). Therefore, the
Bank agreed to support the government‘s program in the form of a sector-specific project
(rather than a sector-wide approach) to serve as a first attempt at implementing the program.
This led to the development of a project that covered all sectors of education, which was a
high risk approach, given that the country was just emerging from conflict and had weak
capacity. Project activities were to be implemented in two phases to allow moving ahead with
those properly developed and ready to be implemented as well as those still needing further
analysis. Specifically, the two phases were planned as follows:
Phase I included implementation of project components with fully-developed
implementation plans, finalization of implementation plans for remaining project
components and support for the development of a sector-wide program. Activities to be
supported under Phase I (and for which implementation plans had been completed at
the time of project preparation) included: (i) the expansion of access to basic education
where plans have been developed, low cost classroom designs agreed and sites
identified; (ii) support for upgrading and developing teachers in-service and for
supporting teachers of minority groups, while temporarily help financing expatriate
teachers and subsequently phasing them out; (iii) implementation of the curriculum
reform plan; and (iv) the carrying of a national assessment for Grades 3 and 5.
Phase II included the sustained support to components started under Phase I,
implementation of components developed as part of Phase I and the roll out of a sector-
wide approach.
6. Midway through project implementation, the project more than doubled in size with
the inclusion of a European Commission (EC) Trust Fund for Education Construction grant
in the amount of €32.4 million (US$43 million equivalent). The grant was given to address
access issues in primary and secondary schools and also added coverage of the TVET
subsector to the project.
1.2 Original Project Development Objectives (PDO) and Key Indicators
7. The objective of the Eritrea Education Sector Investment Project (EESIP), as stated in
the 2003 Development Credit Agreement (DCA) was to assist the Borrower‘s effort to
reform and develop its education sector to attain increased and more equitable enrollment in
basic education and to enhance the quality of its basic and secondary education. The expected
outcomes were increased enrollment and completion rates, improved equity and quality of
education at all levels.
8. Progress towards achieving these objectives was to be measured through the
following indicators:
3
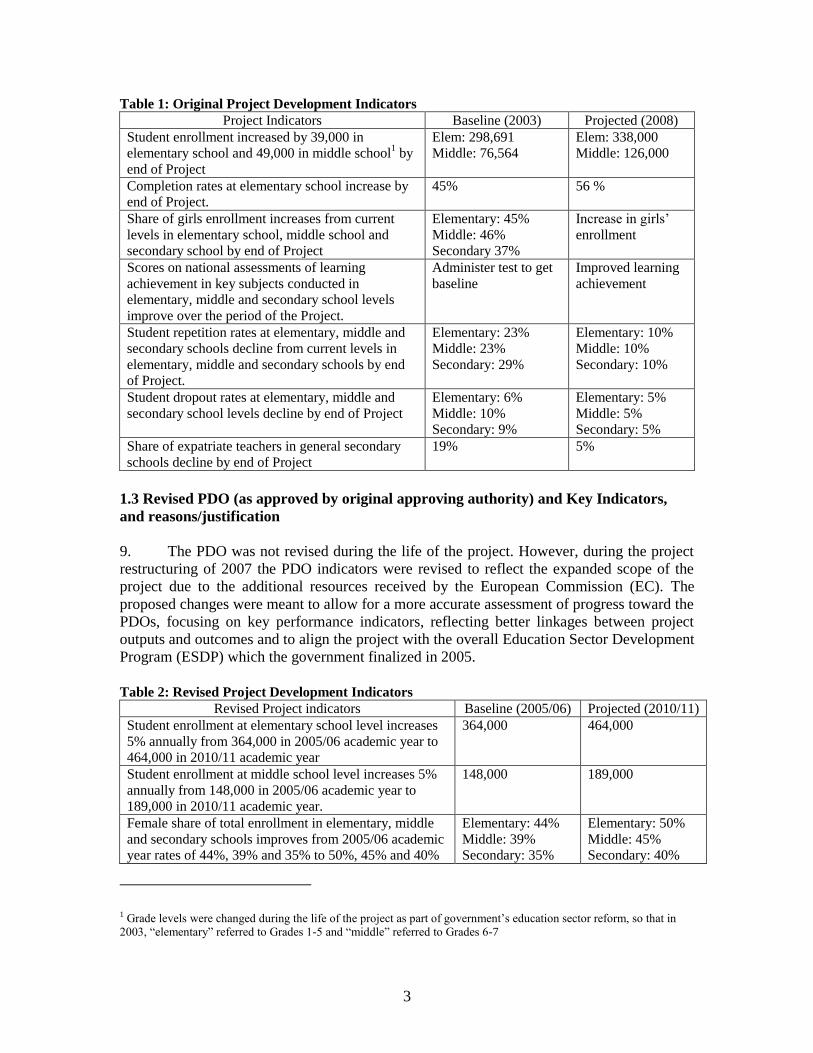
Table 1: Original Project Development Indicators
Project Indicators Baseline (2003) Projected (2008)
Student enrollment increased by 39,000 in
elementary school and 49,000 in middle school1 by
end of Project
Elem: 298,691
Middle: 76,564
Elem: 338,000
Middle: 126,000
Completion rates at elementary school increase by
end of Project.
45% 56 %
Share of girls enrollment increases from current
levels in elementary school, middle school and
secondary school by end of Project
Elementary: 45%
Middle: 46%
Secondary 37%
Increase in girls‘
enrollment
Scores on national assessments of learning
achievement in key subjects conducted in
elementary, middle and secondary school levels
improve over the period of the Project.
Administer test to get
baseline
Improved learning
achievement
Student repetition rates at elementary, middle and
secondary schools decline from current levels in
elementary, middle and secondary schools by end
of Project.
Elementary: 23%
Middle: 23%
Secondary: 29%
Elementary: 10%
Middle: 10%
Secondary: 10%
Student dropout rates at elementary, middle and
secondary school levels decline by end of Project
Elementary: 6%
Middle: 10%
Secondary: 9%
Elementary: 5%
Middle: 5%
Secondary: 5%
Share of expatriate teachers in general secondary
schools decline by end of Project
19% 5%
1.3 Revised PDO (as approved by original approving authority) and Key Indicators,
and reasons/justification
9. The PDO was not revised during the life of the project. However, during the project
restructuring of 2007 the PDO indicators were revised to reflect the expanded scope of the
project due to the additional resources received by the European Commission (EC). The
proposed changes were meant to allow for a more accurate assessment of progress toward the
PDOs, focusing on key performance indicators, reflecting better linkages between project
outputs and outcomes and to align the project with the overall Education Sector Development
Program (ESDP) which the government finalized in 2005.
Table 2: Revised Project Development Indicators
Revised Project indicators Baseline (2005/06) Projected (2010/11)
Student enrollment at elementary school level increases
5% annually from 364,000 in 2005/06 academic year to
464,000 in 2010/11 academic year
364,000 464,000
Student enrollment at middle school level increases 5%
annually from 148,000 in 2005/06 academic year to
189,000 in 2010/11 academic year.
148,000 189,000
Female share of total enrollment in elementary, middle
and secondary schools improves from 2005/06 academic
year rates of 44%, 39% and 35% to 50%, 45% and 40%
Elementary: 44%
Middle: 39%
Secondary: 35%
Elementary: 50%
Middle: 45%
Secondary: 40%
1 Grade levels were changed during the life of the project as part of government‘s education sector reform, so that in 2003, ―elementary‖ referred to Grades 1-5 and ―middle‖ referred to Grades 6-7
4
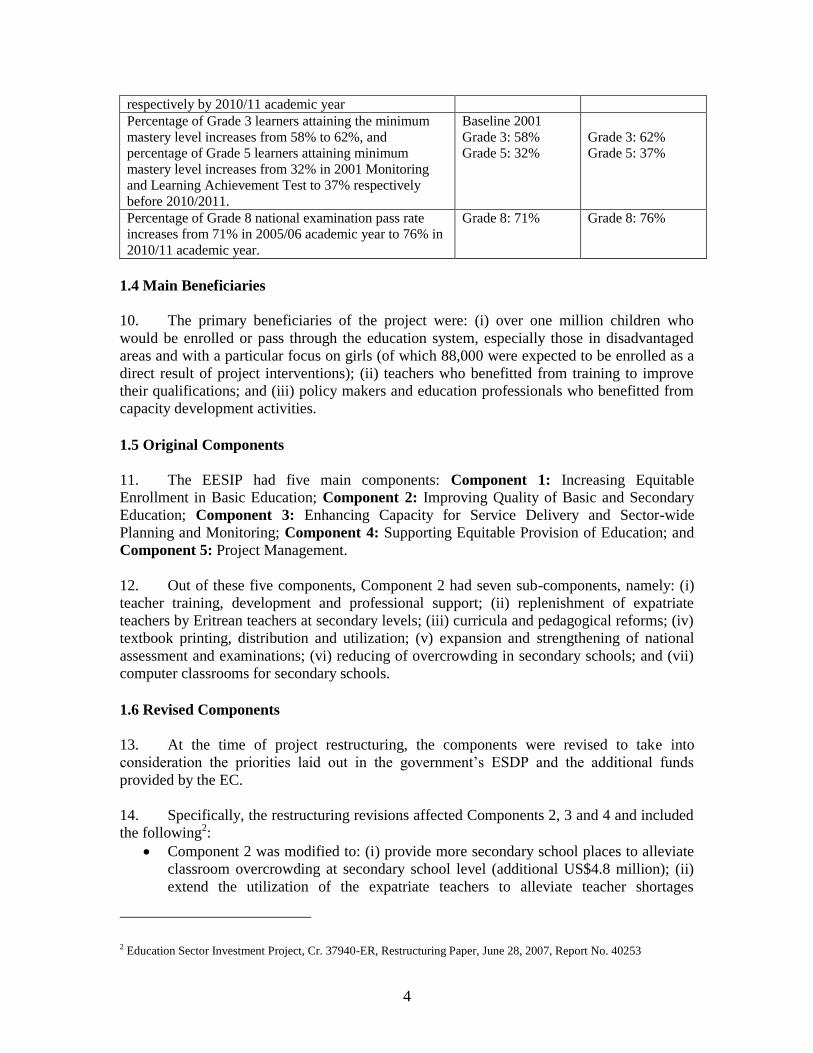
respectively by 2010/11 academic year
Percentage of Grade 3 learners attaining the minimum
mastery level increases from 58% to 62%, and
percentage of Grade 5 learners attaining minimum
mastery level increases from 32% in 2001 Monitoring
and Learning Achievement Test to 37% respectively
before 2010/2011.
Baseline 2001
Grade 3: 58%
Grade 5: 32%
Grade 3: 62%
Grade 5: 37%
Percentage of Grade 8 national examination pass rate
increases from 71% in 2005/06 academic year to 76% in
2010/11 academic year.
Grade 8: 71% Grade 8: 76%
1.4 Main Beneficiaries
10. The primary beneficiaries of the project were: (i) over one million children who
would be enrolled or pass through the education system, especially those in disadvantaged
areas and with a particular focus on girls (of which 88,000 were expected to be enrolled as a
direct result of project interventions); (ii) teachers who benefitted from training to improve
their qualifications; and (iii) policy makers and education professionals who benefitted from
capacity development activities.
1.5 Original Components
11. The EESIP had five main components: Component 1: Increasing Equitable
Enrollment in Basic Education; Component 2: Improving Quality of Basic and Secondary
Education; Component 3: Enhancing Capacity for Service Delivery and Sector-wide
Planning and Monitoring; Component 4: Supporting Equitable Provision of Education; and
Component 5: Project Management.
12. Out of these five components, Component 2 had seven sub-components, namely: (i)
teacher training, development and professional support; (ii) replenishment of expatriate
teachers by Eritrean teachers at secondary levels; (iii) curricula and pedagogical reforms; (iv)
textbook printing, distribution and utilization; (v) expansion and strengthening of national
assessment and examinations; (vi) reducing of overcrowding in secondary schools; and (vii)
computer classrooms for secondary schools.
1.6 Revised Components
13. At the time of project restructuring, the components were revised to take into
consideration the priorities laid out in the government‘s ESDP and the additional funds
provided by the EC.
14. Specifically, the restructuring revisions affected Components 2, 3 and 4 and included
the following2:
Component 2 was modified to: (i) provide more secondary school places to alleviate
classroom overcrowding at secondary school level (additional US$4.8 million); (ii)
extend the utilization of the expatriate teachers to alleviate teacher shortages
2 Education Sector Investment Project, Cr. 37940-ER, Restructuring Paper, June 28, 2007, Report No. 40253

5
(additional US$1.5 million); (iii) provide additional technical assistance for the
curriculum reform and increase support to curriculum implementation, including
supervision and monitoring activities and e-content provision (additional US$2.1
million); and (iv) increase support to learning materials provision including textbooks
printing and distribution (US$0.6 million).
Component 3 was modified to: (i) intensify capacity building activities and provide
more training and study opportunities for better education sector management and
service delivery (US$2.6 million).
Component 4 was modified to: (i) strengthen demand-side interventions by piloting
an incentive scheme (i.e. scholarship program) for girls and disadvantaged children‘s
education (US$0.5 million); and (ii) support early childhood development (ECD) 3
centers in rural villages to improve the possibilities of rural children‘s school entry,
grade retention and promotion (US$0.6 million).
1.7 Other significant changes
15. In May and August 2004, amendments introduced minor adjustments to the DCA
language and reallocated funds between disbursement categories.
16. In addition to changes to project components as spelled out in 1.6 above, the 2007
restructuring: (i) extended the closing date to February 28, 2011; (ii) expanded the project
scope to accommodate €32.4 million from the EC; (iii) reallocated IDA funds due to
increased financing from the EC; (iv) added four EC Trust Fund (ECTF) monitoring
indicators to the project‘s intermediate indicators (see ―Data Sheet‖); and (v) revised the
PDO indicators to reflect the expanded project scope.
17. The ECTF provided support for: (i) construction of primary and middle schools, the
construction of two education support facilities and radio station extension, as well as three
Technical and Vocational Education and Training (TVET) centers; and (ii) capacity building
through training for the Ministry of Education (MOE). On November 2, 2007, the EC and
IDA signed an Administration Agreement (AA) that sought to clarify roles and
responsibilities to facilitate fund administration and grant activity implementation. On
November 20, 2007, a subsidiary Grant Agreement, between IDA and the government, was
signed with the objectives of ―improving access to, and quality of, basic education,
comprising the primary, middle and technical-vocational levels, by providing the necessary
physical facilities for basic education‖. Since the ECTF grant focused specifically on civil
works and enhanced construction management capacity within the Ministry of Education, the
project‘s component 1 was significantly reduced from US$18 million to US$5.4 million. The
difference was reallocated to cover costs associated with activities mentioned in Section 1.6.
18. The 2007 restructuring also: (i) introduced the Rapid Results Approach (RRA) to
facilitate the community participation (CP) construction activities for elementary schools for
IDA and ECTF activities because of significant delays in civil works; (ii) decentralized
project implementation to accommodate the RRA and incentive schemes; and (iii)
strengthened monitoring and evaluation activities to help measure progress towards meeting
3 The funds were to cover stipends of the existing ECD care givers as a stop gap measure until the GOE could assume
the cost in future budgets.
6
the PDO as well as the impact on the ECTF‘s indicators which were different from the
project indicators. The rational for restructuring the project in 2007 was based on the need to
streamline/consolidate the different donor interventions and funds in line with the
government‘s newly developed ESDP. The plan had been prepared by the government, and
subsequently discussed with and endorsed by the donor community. However, a
Memorandum of Understanding (MOU) between the different development partners and the
government to support the ESDP could not be agreed on and was therefore never signed. As
a result, donors such as the African Development Bank (AfDB) and the EC, separate from
the project‘s ECTF resources, provided parallel financing to support the ESDP.
19. In 2010 the project was restructured again to extend the project closing date from
February 28, 2011 to August 31, 2011. This restructuring was required to accommodate
implementation delays and to reallocate funds to cover the escalated costs of civil works and
equipment. Prior to the extension of the IDA project closing date, several actions were
required related to the European Commission Trust Fund (ECTF) and the Administrative
Agreement (AA). These actions included: (i) extending the ECTF grant closing date from
June 30, 2010 until August 31, 2010 to allow the EC sufficient time to process the extension
of the AA‘s completion date from Brussels; (ii) subsequent extension of the AA‘s completion
date from December 30, 2010 until February 28, 2012; (iii) extension of the ECTF grant
closing date from August 31, 2010 to August 31, 2011 (approved August 23, 2010); and (iv)
finally, extension of the IDA credit closing date from February 28, 2011 to August 31, 2011
(approved December 9, 2010).
2. Key Factors Affecting Implementation and Outcomes
2.1 Project Preparation, Design and Quality at Entry
20. Project Preparation. At the time of project preparation, the Government of Eritrea
asked the Bank to assist in the development of a sector program. The Bank felt that more
analytical work was required for a sector wide approach. Therefore, it was agreed that the
EESIP would support studies that would be the first step towards an ESDP while also
providing needed sector support with a sector investment loan (SIL). Although the
government agreed to this approach, there was tension over the scope and sequencing of
sectoral interventions that remained after preparation. The project was also prepared quickly
in an effort to respond to the government‘s request to support the education sector. The rapid
preparation led to uneven preparation of components that created a phased approach to
project implementation. The Bank fielded a large appraisal mission to accommodate the rapid
preparation and included the appropriate technical experts to appraise the project. However,
Phase I still included a large number of activities for which implementation plans had not
been completed. Low-cost classroom designs, for instance, had not been agreed and
contributed to major delays not only for construction but overall project implementation.
Phase I was also supposed to help finalize a number of implementation plans (i.e. plans for
textbook printing, distribution and utilization, computer classrooms for secondary schools
and supporting equitable provision of education) which also took more time than anticipated
and contributed to major delays in project implementation.
21. Project Design. Project design was more ambitious than advisable, as the Bank tried
to respond to the Government‘s drive for a comprehensive and ambitious sector-wide
program. As mentioned above, the quick preparation led to weakly detailed project
components that resulted in the phased project implementation described above. The MOE

7
and Project Management Unit (PMU) were also continuing to prepare the wider sector
program in parallel with the phasing of the project. In retrospect, this was a unwise decision
because of limited capacity within the MOE and PMU to simultaneously prepare and
implement a project although, at the time, there were considerable deficiencies in the
education sector.
22. The design of the access component (which was largely classroom construction)
relied heavily on National Competitive Bidding (NCB) and International Competitive
Bidding (ICB) construction. The over reliance on NCB and ICB for construction of rural and
village schools was found not to be the appropriate design for implementing this component.
Project implementation delays related to construction may have been avoided had the Bank
team worked with the MOE during project preparation to develop cost effective school
designs. Instead, the PMU used a firm of architectural consultants to develop school designs
that were entirely inconsistent with the project objectives of cost reduction and working with
communities and district authorities. The restructuring of the project attempted to rectify this
problem by focusing more on community participation construction of schools with greater
success.
23. The original quality sub-components of teacher training, curriculum and textbook
development, provision of textbooks and learning materials, educational testing and
evaluation and information communication and technology (ICT) in secondary school were
appropriate and by the end of the project can be judged to be successful. This is particularly
true in the case of curriculum and textbook development. The intermediate indicators were
also useful for measuring outputs. In retrospect, the original PDO indicators seemed more
appropriate, than those introduced during the restructuring, to measure impact even though
they were sector wide indicators.
24. Quality at Entry. There was no quality enhancement review (QER) conducted for
the project although there were external peer reviewers who provided comments and input
during the project decision meeting. Although there was not a QER, a Quality of Supervision
Assessment (QSA) conducted in September 2006, pointed out that the project design was
overambitious and that all project components were not ready at the time of entry. The lack
of project readiness and limited capacity within MOE for the phased project implementation,
present problems for project implementation throughout its life.
25. The preparation team identified limited capacity within MOE as a high risk and
included technical assistance mitigation measures. The ICR team believes that the
preparation team should have also identified government ownership as a risk especially in
light of the expressed desire for a sector-wide program instead of a specific investment
project.
26. Restructuring Design. The 2007 restructuring of the project included but was not
limited to: (i) additional parallel co-financing from the European Commission (ECTF) in the
amount of €32.4 million (approximately US$43 million) for school and other educational
support facility construction; (ii) expansion of community participation (CP) in the
construction of schools; (iii) modification of project indicators; (iv) gap financing of salaries
for caregivers in early childhood development centers and expatriate teachers; and (v)
incentives to girls to increase their participation in school.

8
27. The Bank‘s willingness to accept approximately US$43 million from the EC for
school construction at the time of project restructuring was an unusual decision. At that time,
only two percent of the Credit allocation for school construction had been disbursed,
resulting in an overall disbursement lag of over 50 percent. Furthermore, all the ISRs
indicated moderately unsatisfactory or unsatisfactory progress in the construction component.
However, the inclusion of the EC trust fund did allow for a reallocation of the IDA credit for
some of the quality investments such as support to the curriculum reform and capacity
building as well as construction of secondary school places to alleviate overcrowding.
28. The ICR team feels that the modified PDO indicators were not the appropriate
indicators or targets to measure PDO success. Firstly, the original enrollment targets set in
2003 were quite reasonable and based on detailed analysis. In 2007, the restructuring team
felt pressured to raise the target since the initial targets had already been met. Unfortunately,
the new targets were not entirely supported by the data available at the time. The 2002
Demographic and Household Survey (DHS) came out in 2003 and noted already high rates of
school participation at the elementary level as well as a decline in the size of birth cohorts.
The restructuring team should have used these two factors to project that enrollments would
be stabilizing or declining. The ICR team also questions whether using the grade 8
examination scores as a PDO indicator has true value added. Finally, the ICR team does not
see a strong link between the project interventions and the selected PDO indicators (see PDO
indicator discussion for more details.) The project intermediate indictors seem to have been
appropriate for monitoring project outputs and all targets for the intermediate indicators were
achieved.
2.2 Implementation
29. Project Implementation. Implementation progress was extremely slow over the life
of the project until the last 18 months. Initially, there was limited capacity in the PMU to
cope with the two phased approach to the project described above. At the same time, the
PMU had to deal with the other donor procedures that further stretched capacity and slowed
implementation. There were also no schools constructed between 2003-06 due, in large part,
to the fact that it took the PMU 24 months to hire a consultant and develop school designs.
The PMU finally had seven construction packages that were evaluated but the process was
stopped because of conflict of interest related to the consultant and the construction firm
which was awarded the contract. Finally, in 2006 the government suspended licenses of
private contractors. After the mid-term review and restructuring in 2007, the project began to
move largely to school construction at the community level which led to considerable
improvements in the civil works components. The Bank also raised the procurement
thresholds which gave communities the flexibility to construct elementary schools of
maximum eight classrooms. This was when the Rapid Results Approach (RRA) was
introduced. However, it took until 2009 for the RRA to be fully operational and required
continuous technical assistance support. The expansion of Community Participation (CP)
RRA was instrumental in ensuring that the project completed the construction of elementary
and middle school classrooms. Moreover, the CP-RRA was responsible for the substantial
increase in project disbursements related to construction in the last two years of project
implementation, along with the NCB and ICB works (a 77 percent increase for IDA and 79

9
percent increase for ECTF disbursements). Although, construction progress remained a
problem, in the end, all but US$216,000 of the ECTF was disbursed.4
30. Despite the construction delays, there was considerable achievement in the project
and the broader program related to quality improvement. The project successfully carried out
the Open Distance Learning Program (ODLP) in two batches, one financed by IDA, the other
by the EC. The training of teachers through ―Fast-Track‖ and ―Summer Programs‖ was also
successful, as were trainings to empower female teachers in classrooms. The GOE launched a
new curriculum for grades 1-12 in 2003 and developed syllabi to support it. With the support
of DANIDA, IDA, AfDB and EC, the GOE trained teachers in the new curriculum,
developed and printed new textbooks, reprinted textbooks and distributed them for all the
grades over the eight year life of the project. This is an extraordinary accomplishment of the
GOE. The result of all of this effort is that the GOE has institutionalized the process of
curriculum and textbook development and they own the copyrights to all of the materials.
Support from the EESIP project and the AfDB provided computer knowledge and equipment
to 69 secondary schools. This is an indication that the government pursued the
implementation of its 2005 Education Sector Development Program (ESDP) without a
Memorandum of Understanding between the government and the development partners. The
government was also finally able to complete the Monitoring Learning Achievement II
(MLA II) and the project contributed technical assistance that resulted in substantial capacity
building in the area of assessment.
31. The overall coordination between the PMU and various Directorates within the MOE
was effective. However, timely sharing of documentation and data could have been better.
The PMU should have been the main repository for all project documentation and data. Bank
supervision teams often needed to visit several units to get updates on project activities. PMU
capacity for analysis of data should have been upgraded during project implementation. It
would have been useful for the PMU to utilize the TA made available through the project for
the purposes of strengthening capacity for analysis as recommended by Bank supervision
missions.
32. Other factors affecting project implementation were: (i) the 2006 suspension of the
private construction firms licenses due to government review of and subsequent changes in
regulations which led to long delays in construction; (ii) importation of all construction
materials through the parastatal Red Sea Corporation which also led to significant stress on
the Bank procurement rules and occasional unavailability of imported materials; (iii)
development of difficult relations between the senior levels of the GOE and World Bank in
the last two years of implementation; (iv) the GOE going into arrears to the Bank twice
creating issues which led to problems in the last 6-7 months of implementation. Specifically,
the arrears prevented the Bank from being able to process payments and Letters of Credit
(LCs) for contracts as well as the call for funds from the EU Delegation; (v) lack of harmony
between the various donor procedures presented challenges for the PMU; and (vi) lack of
continuity in Bank Task Team Leaders (TTLs); there were five over the life of the project
4 Three large Skills Development Centers and two educational support facilities to be designed and constructed through
ICB were not able to be constructed in a reasonable time frame and the June 2010 mission informed the GOE and EU
Delegation that the Bank would not be able to oversee their completion. The designs were finalized with IDA support
under the project.
10
which led to a slow response from the Bank particularly on no objection letters and technical
support.
33. European Commission Collaboration. The ECTF activities focused mainly on
improving access to and quality of basic education, comprising the primary, middle, and
technical-vocational levels, by providing the necessary physical facilities for basic education.
Specifically, the ECTF supported: (a) increasing access to primary education; (b) improving
the quality of instruction in Technical-Vocational Education and Training (TVET) facilities;
and (c) enhancing construction management at the recipient's Ministry of Education.
34. The ECTF was instrumental in advancing the civil works component of the project,
and the achievement of the target for classrooms to be constructed under the project.
Specifically, ECTF resources financed the construction and equipment of 59 elementary and
18 middle schools, totaling 668 classrooms, fencing for 62 schools, 60 teachers' quarters, 30
school extensions and ten PRCs. It also supported the recurrent costs of the PMU during the
last 14 months of project implementation, helping ensure continued smooth carrying out of
activities. The ECTF was also supposed to finance the construction of facilities related to
radio education, curriculum development and educational evaluation and accreditation, as
well as TVET. Unfortunately, these activities could not be carried out. The extension of the
radio station was dropped due to changes in priorities of the government. The remaining
facilities could not be constructed because of insufficient time between activity start-up and
project closing to allow for the completion of these works. Therefore, it was agreed to use
ECTF funds to support the preparation and review of the architectural drawings, which was
successfully done in collaboration with the consultant architect, the PMU's engineering
section and the Ministry of Public Works.
35. The EC provided the Bank with supervision funds to support consultants and travel
costs for those consultants. In terms of enhancing MOE's construction management capacity,
the EC supervision funds were used to support the RRA consultant, who worked closely with
the PMU to get the community-level projects underway, as well as the hiring of an architect
who reviewed, commented and helped improve school designs. Both the RRA modality and
revised school designs are expected to be applied by the MOE in the future.
2.3 Monitoring and Evaluation (M&E) Design, Implementation and Utilization
36. The PMU collected data on some project outcome and output indicators and made the
data available to the Bank. Other MOE directorates also collected data but there was no
central repository for all project data. The project also purchased Geographic Information
System (GIS) technology to facilitate a school mapping exercise and collection of school-
level data that could be used with the education management information system (EMIS).
Data collected through the GIS system was routinely used to produce statistical yearbooks to
track progress. Furthermore, with the help of the GIS technology, the project kept a database
with information about all schools in the country, including existing ones as well as those
financed by donors during the life of the project, which allowed the government to make
informed decisions about its school construction program. A separate EMIS was also
developed for the entire education sector and is being used to compile the annual education
statistics and to inform policy decisions. This is a remarkable achievement considering all of
the exogenous factors that affected project implementation. However, the government and
the project would have benefited from full integration of the two systems which would have

11
made tracking and reporting easier and improved the effectiveness of the M&E officer
assigned to the Bank and ECTF activities.
37. Quarterly IFRs provided accounting and financial information on the program,
including procurement activities and physical progress. A progress report was prepared twice
a year to provide information on the status of program implementation and outcomes as well
as updated data on performance indicators for discussion among the relevant government
agencies, the Bank and EC. This was an approach that further reinforced ownership and
helped build capacity. Even though the analysis presented in these reports could have been
more robust, they were prepared and presented to the Bank and EC. Supervision missions and
other project activities were carried out jointly with other technical and financing partners
when appropriate.
2.4 Safeguard and Fiduciary Compliance
38. Safeguards. The project was classified as a Category B based on the Bank‘s
Operational Policy due to the potential environmental and social impacts of its construction
program. An Environmental and Social Management Framework (ESMF) was prepared and
approved by the time of project appraisal in 2003. The ESMF proposed specific institutional
arrangements to enable sustainable execution of all measures identified in the ESMF. In 2006,
the Bank and the GOE decided to eliminate fences from all schools. In 2009, the Bank
approved the designs for teacher‘s quarters without latrines, water or bathing facilities as a
cost saving measure and to build as many classrooms as possible to achieve the PDO. Both of
these decisions seems to have been done without taking safeguard compliance into
consideration. In addition, Bank supervision missions did not request a safeguards specialist
to support the team until the last year and a half of implementation. By that time it was too
late to ensure adequate compliance with all the safeguards. At the closing of the project, and
with Bank support, some modest improvements in compliance with environment safeguard
were noted, particularly regarding water and sanitation and providing fences for most schools.
However, it fell short of overall compliance.
39. Fiduciary Compliance. The fiduciary team of the PMU was adequately staffed and
performed well. Initially, capacity to handle procurement-related issues was limited, which
caused delays during the first three years. The PMU subsequently contracted the necessary
technical assistance for one year to train procurement staff and hired additional staff.
Thereafter, the procurement unit was able to handle and process the increased volume
efficiently, especially during the last two years of implementation. Also, close collaboration
between the Bank‘s procurement staff and the PMU helped facilitate processing of
procurement packages and no-objections. Regularly conducted procurement reviews showed
that procurement was conducted according to the guidelines, revealed no major discrepancies
and was found satisfactory. However, frequent TTL turn-over led to delays from the Bank‘s
side in responding to government requests and slowed implementation at certain times.
40. In terms of financial management, the PMU conducted financial transactions
according to project implementation arrangements, had adequate internal controls5 and had
clear monitoring system in place. The PMU‘s accounting unit was adequately staffed and is
5 i.e. updated fixed assets register, internal auditor, monthly bank reconciliations and segregation of duties
12
headed by a Finance Officer assisted by a Grants Accountant, four other accountants and a
cashier. The decentralized accounting functions were reinforced as part of the CP-RRA
inclusion to allow monitoring of transfers to be made to the communities. As such, the
necessary manuals and mechanisms were put in place and each Zoba office adequately
reinforced with an accountant and accounting clerks to allow tracking and disbursing
community grants. The PMU has in-house accounting computer software, which has been
used for all accounting and financial reporting purposes. The project submitted quarterly
Financial Management Reports (FMR) to the Bank within the stipulated deadline and in the
agreed format. The final FMR was also only received on February 8, 2012 and is being
reviewed by the Bank at the time of submission of the ICR. Despite these delays, financial
management is judged satisfactory and annual audit reports for both IDA and ECTF
resources were always unqualified.
2.5 Post-completion Operation/Next Phase
41. Not Applicable. This project will be the last Bank supported project in Eritrea for the
time being as the Bank is currently not engaged with the Government of Eritrea.
3. Assessment of Outcomes
3.1 Relevance of Objectives, Design and Implementation
42. Relevance of Objectives. The development objectives were aligned with the Bank‘s
1996 Eritrea Country Assistance Strategy (CAS) and the 2005 Interim Support Strategy (ISS).
In addition, the objectives were within the ESDP that was developed to return the education
sector to a path of growth and quality.
43. Relevance of Design. In retrospect, the original PDO indicators were more
appropriate to monitor achievement than those indicators selected at the time of restructuring.
The elementary and middle school enrollment indicators were only somewhat appropriate
due to the problems with the accuracy of the underlying population data in Eritrea. It may
have been more useful to rely on indicators linked to project interventions, such as the
number of classrooms built and put to good use rather than aggregate targets for the system
as a whole (see detailed discussion below).
44. The original target of increasing girls‘ share of enrollments at all levels was
somewhat appropriate because the original project design included a girls‘ education
component that was mainly intended to finance research, build awareness and mobilization,
and amounted to 2.5 percent of the project budget. The targets introduced at restructuring,
however, were very ambitious: to reach 2010/2011 elementary school level parity, enrollment
of an additional 15,000 girls was needed. However, the restructured project was never to
benefit more than a total of 3,000 girls at all levels. Thus, the link between project activities
and the targets adopted in the restructured project was weak. Finally, selecting a target higher
than 49 percent of girls‘ participation is unreasonable since: (i) data is never perfect and (ii)
and the number of girls and boys is never exactly the same in any given population 6 .
Although the Gender Parity Index (GPI) might have been a better indicator of gender parity,
6 it is widely accepted that a gender parity index of 0.97 – 1.03 indicates parity

13
in the case of Eritrea, the girls‘ share of enrollments was an appropriate choice of indicator
given the weaknesses of population data.7
45. The quality indicator that measured the results of the grade 8 national examination
pass rate was not appropriate. It was not realistic to expect an improvement in learning
outcomes as a result of the project because most investments were in school construction.
Those interventions which support increased learning (e.g.: teacher training and textbooks)
were implemented later in the project and therefore did not have an immediate impact on
learning outcomes.
3.2 Achievement of Project Development Objectives
46. The project did contribute to a number of positive outcomes for the Eritrean
education system despite the fact that the PDO indicator targets were not achieved. This
section evaluates the outcomes against the results framework developed during the 2007
restructuring and other indicators of system performance. Those selected to measure
achievement of the project PDO were as follows:
47. Increased enrollment in basic education was to be measured by: (i) an increase in
student enrollment at elementary school; and (ii) an increase in student enrollment at middle
school. Although the relevant PDO indicator targets were not met, looking at Table 1 shows
that: (i) elementary student enrollment did, even if only very slightly, increase over the life of
the project from 298,691 to 311,598; (ii) middle school enrollment targets exceeded the
original target of 126,000 but fell short of the restructured target of 189,000; and (iii) middle
school enrollments more than doubled over the life of the project. Therefore, the higher-level
objective of increasing access to schooling may well have been achieved, since there has
been a drop in the number of repeaters, increased transition rates and most likely a possible
contraction in the school-age population over the life of the project.
48. Elementary school enrollment. The ICR team believes that the overall targets for
this indicator were inappropriate. According to MOE yearbook data, the elementary school
gross enrollment rate has gained about five percentage-points since the beginning of the
project, although much of the increase happened before most project activities began. For a
period of four years, enrollment number actually declined, only increasing again the last year
of the project. 8 Furthermore, calculating indicators of school participation using official
population data in a country that has never carried out a proper census is not reliable. In such
circumstance, the Demographic and Household Surveys (DHS) would probably have
constituted a more reliable source of data on school participation. Although three DHSs were
conducted in Eritrea in 1995, 2002 and 2009, they were underused by Government and
development partners, even though they might have contained more dependable information.
For instance, the 2002 DHS found a gross enrollment rate of 100.5 percent for elementary
school9, compared to MOE yearbook figures of 56 and 65 percent10 for 2000/01 and 2001/02
7 In order to accurately calculate the GPI, reliable population data is necessary, which was not available in Eritrea 8 This increase occurred after the CPI schools were completed which could indicate a high impact of that intervention.
The possible causal relationship needs analysis. 9 Demographic and Health Survey 2002: Table 2.5.1. Primary school attendance ratios. 10 The large jump in the GER was due to a revision in the population data as of the 2001/02 yearbook.

14
respectively. Therefore, with school participation rates likely being much higher than what
official data were showing at the time of project preparation, the scope for increasing
enrollments was consequently lower. In that light, the target of 464,000 was unrealistically
high. Using unreliable population data and projections and overlooking other evidence, the
team set an unrealistically high target for elementary enrollments.
49. The project preparation team projected that elementary enrollments would increase
from 298,691 in 2000/01 to 449,622 in 2007/08, i.e. an increase of more than 150,000 pupils.
Yet, the PAD results framework target was set at 338,000 pupils, i.e. a more modest increase
of 39,000 pupils. This figure seems to be a function of the number of classrooms to be built
by the project and thus reflected what could be reasonably attributed to the project.
50. At restructuring in 2007, enrollments had already grown to 364,000, exceeding the
original goal of 338,000 pupils and prompting the team to set the new target at 464,000. The
new target seems to correspond to an annual increase of five percent between the 2005/06
and 2010/11 school years. It is not clear why the restructuring team decided on a five percent
increase since: (i) the ICR team has not found any detailed projections from the time of
restructuring; (ii) by then, official population projections were forecasting declining school-
age population so new forecasts would have looked very different than those of 2003; (iii) an
education sector plan had been prepared shortly before that predicted enrollments to grow to
only 422,662 which was not mentioned in the restructuring paper; and (iv) results of the 2002
DHS were available and indicated a much higher gross enrollment rate (100.5 percent) and
by implication, overestimated official population data. The high target of 464,000 was clearly
not a function of the number of classrooms planned, so perhaps the restructuring team
considered this to be more of a program goal for the ESDP as a whole rather than a result of
the project alone. However, such a decision was not clearly laid out in the project
restructuring documentation.
51. Middle school enrollment. The original 2003 target of 126,000 was met, but the
expanded 2007 target of 189,000 was not met despite enrollments having more than doubled
between the 2000/01 baseline (76,564) and project closing in 2010/11 (154,598). During this
period the middle school cycle was also expanded by one year. The initial enrollment target
was loosely based on projections made during project preparation; in this case assuming that
the middle school GER would increase from 3811 to 40 percent, or 130,550 students, by
2007/08 (again, taking into account that the cycle was being extended by a year). The 2007
target was too high and not based on any new analysis, but rather on the assumption that
enrollment would continue to grow by 5 percent per year until closing.
52. After project approval, middle school enrollments rapidly increased to 122,966 in
2003/04 with the addition of one year to the cycle and then to 139,029 in 2004/05, surpassing
the initial target of 126,000. However, since 2005/06, middle school enrollments have been
flat at around 150,000, although many new middle schools have been added since that time.
Given that middle school enrollments in Eritrea are directly dependent on the output from
elementary education (i.e. largely following the primary enrollment and transition trend – see
11 The 2002 DHS found a middle school GER of 69 percent, thus much higher than the official estimate of around 40 percent at the time.

15
Table 3), it should not be surprising that middle school enrollments have plateaued in the past
5 years.
Table 3: Transition rate elementary – middle school, at baseline and project closing
Year 2000/01 2001/02 2008/09 2009/10
Enrollments excl. repeaters,
grade 5 (elementary)
37,392 55,111
Enrollments, excl. repeaters,
grade 6 (middle school)
33,126 49,684
Transition rate
elementary – middle school
89% 90%
53. Although enrollment indicators were not met, there have been many improvements at
the elementary and middle school level between 2000/01 and 2009/10: Elementary School
level: (i) the completion rate improved from 45 to 51 percent; (ii) the repetition rate dropped
from 23 to 13 percent, a very impressive improvement; (iii) the dropout rate remained at 6
percent; (iv) the pupil-classroom ratio improved from 63:1 to 53:1; (v) the share of schools
that use double-shifting dropped from 56 to 48 percent; (vi) the pupil-teacher ratio improved
from 45:1 to 41:1; and (vii) the share of qualified teachers improved from 70 to 94 percent.
Middle School level: (i) the repetition rate dropped from 23 to 12 percent, a significant
improvement even if short of the 10 percent target; (ii) the dropout rate fell from 10 to 6
percent, another considerable improvement; (iii) the pupil-classroom ratio improved from
83:1 to 49:1; (iv) the pupil-teacher ratio improved from 56:1 to 42:1; and (v) the share of
qualified teachers improved from 35 to 61 percent. Moreover, the key intermediate access
indicator targets were met: (i) cost effective school designs were developed and remain with
the MOE and (ii) 1,638 classrooms were built and rehabilitated reaching 117 percent of the
target. While there are no enrollment figures for early childhood development centers (ECD),
the project provided 782 grants to community ECD center to finance upkeep, materials and
care giver salaries that successfully bridged a two year MOE financing gap.
Table 4: Status of PDO indicators of 2003 project that were not retained in the
2007 restructuring Baseline 2000/01 Original
target for
2008/09
Actual 2010/11
or latest
available year as
indicated
Completion rate in elementary school1 45% 56% 51% (2009/10)
Repetition rates in elementary, middle
and secondary schools
23%
23%
29%
10%
10%
10%
13%
12%
4%
(all 2009/10)
Dropout rates in elementary, middle and
secondary schools
6%
10%
9%
5%
5%
5%
6%
6%
9%
(all 2009/10)
Share of expatriate general secondary
teachers
19% 5% 14.7% (2004/05)
1 Due to problems with the underlying population data, as explained in the text, this indicator is not reliable. The other
indicators in this table are more reliable, as they do not depend on population data.
Source: MOE yearbooks ‗Basic Education Statistics and ‗Essential Education Indicators‘ for the years indicated.

16
54. Improve equity in basic education enrollments was to be measured by an
increase in the female share of total enrollment in elementary, middle and secondary schools.
The target for girls‘ share of enrollments was not met for the elementary school level but was
achieved for both middle and secondary school.12 The share of girls is now very similar
across all three cycles: 45 percent in elementary school, 45 percent in middle school, and 43
percent in secondary school; this suggests that once girls enroll, they remain in school and
progress through the system at almost the same rate as boys. The gain in the indicator at the
secondary school level, particularly upper secondary level where the share of girls grew from
35 percent in 2005/06 to 43 percent in 2010/11, is impressive. Many countries struggle with
closing the gap at the secondary level, which is typically harder to do than in primary
education.
55. Key intermediate targets related to equity were met or exceeded: (i) the MOE carried
out a study on interventions targeting girls and other disadvantaged children that included
recommendations for future interventions and (ii) incentives for girls and disadvantaged
children exceed the target of 2,300 in both 2009 and 2010 to 3,000 and 2,334 respectively.
56. Increased quality in basic and secondary education was to be measured by: (i)
percentage of Grade 3 and Grade 5 learners attaining the minimum mastery level increases in
the Monitoring Learning Achievement Test (MLA) and (ii) an increased percentage of Grade
8 National Examination pass rate.
57. Results in the MLA. The 2001 baseline for this PDO was 58 percent (Gr. 3) and 32
percent (Gr. 5), and the targets were 62 percent (Gr. 3) and 37 percent (Gr. 5). The results of
the MLA II analysis were an average of 40.2 percent (Gr. 3) and 57.2 percent (Gr.5).
However, it is not clear how the end-of-project targets were established or calculated at the
2007 restructuring since the MLA tests three subjects: Mathematics, English and mother
tongue. An average score is not reflective of achievement in any one subject. In addition, it
was determined during a MLA II workshop in Eritrea in June 2011 that comparability
between MLA I and MLA II could not be ensured. Since the MLA I and MLA II instruments
were not comparable, it is not possible to rate this PDO indicator. However, during the last
12 months of implementation, the project did provide assessment-related technical assistance
that proved to be successful in building local capacity for measuring achievement for the
longer run. This is viewed as a positive project intervention by the ICR team and the
government.
58. Results in the grade 8 National Examination pass rate. The PDO indicator of
increasing the of Grade 8 National Examination pass rates was not documented until just
after the restructuring of the project in mid 2007. The target was to reach a pass rate of 76
percent by the end of the project over the 2005/06 SY result of 71 percent. Subsequent results
can be seen in Table 5. Whether the indicator met its target is inconclusive. Because of the
considerable variations from one year to the next, the ICR team judges that this indicator was
not appropriate to monitor system quality/student performance over time.
12 The female share in middle school reached 44.3 percent; just 0.7 percent shy of the 45 percent target
which the team believes is negligible.
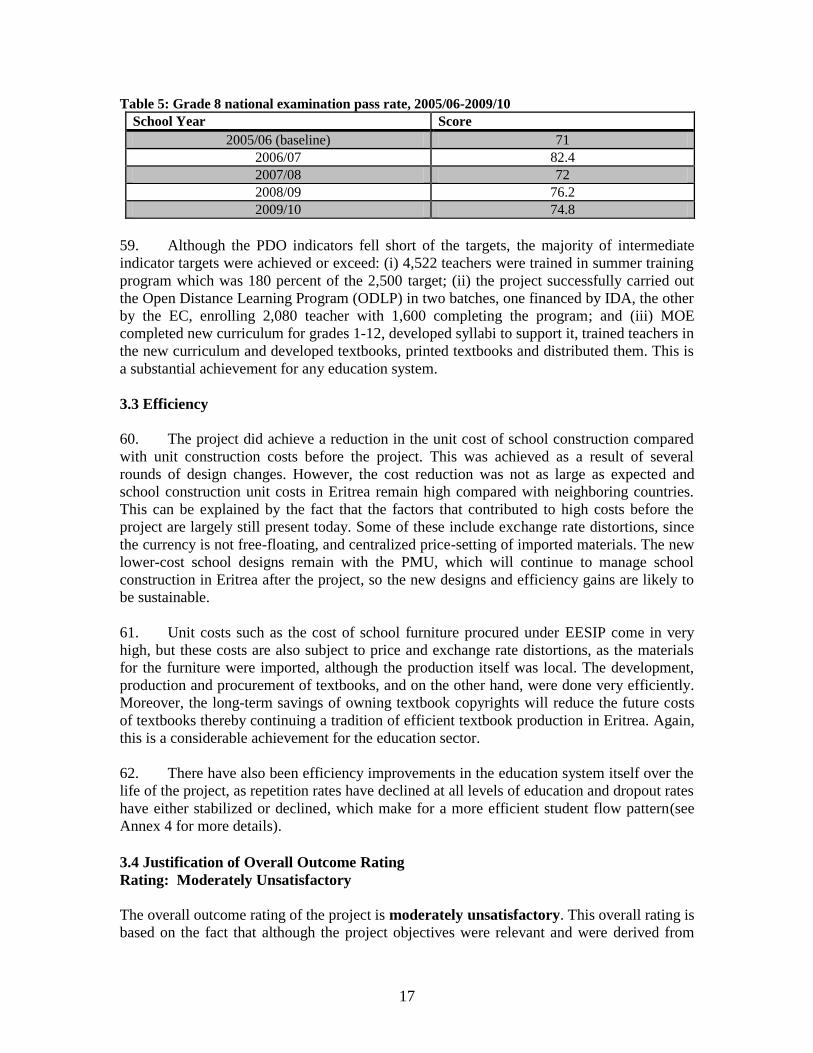
17
Table 5: Grade 8 national examination pass rate, 2005/06-2009/10
School Year Score
2005/06 (baseline) 71
2006/07 82.4
2007/08 72
2008/09 76.2
2009/10 74.8
59. Although the PDO indicators fell short of the targets, the majority of intermediate
indicator targets were achieved or exceed: (i) 4,522 teachers were trained in summer training
program which was 180 percent of the 2,500 target; (ii) the project successfully carried out
the Open Distance Learning Program (ODLP) in two batches, one financed by IDA, the other
by the EC, enrolling 2,080 teacher with 1,600 completing the program; and (iii) MOE
completed new curriculum for grades 1-12, developed syllabi to support it, trained teachers in
the new curriculum and developed textbooks, printed textbooks and distributed them. This is
a substantial achievement for any education system.
3.3 Efficiency
60. The project did achieve a reduction in the unit cost of school construction compared
with unit construction costs before the project. This was achieved as a result of several
rounds of design changes. However, the cost reduction was not as large as expected and
school construction unit costs in Eritrea remain high compared with neighboring countries.
This can be explained by the fact that the factors that contributed to high costs before the
project are largely still present today. Some of these include exchange rate distortions, since
the currency is not free-floating, and centralized price-setting of imported materials. The new
lower-cost school designs remain with the PMU, which will continue to manage school
construction in Eritrea after the project, so the new designs and efficiency gains are likely to
be sustainable.
61. Unit costs such as the cost of school furniture procured under EESIP come in very
high, but these costs are also subject to price and exchange rate distortions, as the materials
for the furniture were imported, although the production itself was local. The development,
production and procurement of textbooks, and on the other hand, were done very efficiently.
Moreover, the long-term savings of owning textbook copyrights will reduce the future costs
of textbooks thereby continuing a tradition of efficient textbook production in Eritrea. Again,
this is a considerable achievement for the education sector.
62. There have also been efficiency improvements in the education system itself over the
life of the project, as repetition rates have declined at all levels of education and dropout rates
have either stabilized or declined, which make for a more efficient student flow pattern(see
Annex 4 for more details).
3.4 Justification of Overall Outcome Rating
Rating: Moderately Unsatisfactory
The overall outcome rating of the project is moderately unsatisfactory. This overall rating is
based on the fact that although the project objectives were relevant and were derived from

18
those of the ESDP, the 2007 project restructuring set overly ambitious system-wide outcome
targets which were not met.
63. The project outcomes paint a somewhat contradictory picture: two key indicator
targets (enrollment at the elementary level and percentage of girls at that level) were not met,
yet all trends in the system point upward including (i) large increases in participation at the
middle school and senior secondary levels, (ii) significant numeric and percentage increases
of girls at the higher levels of the system, (iii) a completely revised curriculum with
textbooks developed and distributed to support it, (iv) a significant improvement in the
number and percentage of teachers with upgraded qualifications, and (v) a decrease in
repetition and dropout rates. All of these gains are despite uneven performance of the Bank
and the Borrower (see Section 5). One can only conclude that these successes in system
outcomes resulted despite a poorly designed, overly ambitious and unevenly implemented
project.
64. The result is a complex program that experienced many achievements but perhaps too
little too late for measuring outcome related to this particular project for which the ICR team
ultimately judges these overall achievements to be moderately unsatisfactory. (See Annex 2
for more details.)
Project Relevance Achievement of PDO Efficiency Overall Rating
Modest Moderately
Unsatisfactory Modest
Moderately
Unsatisfactory
3.5 Overarching Themes, Other Outcomes and Impacts
(a) Poverty Impacts, Gender Aspects, and Social Development
65. In Eritrea, girls‘ share of enrollments has plateaued at around 45 percent at the
elementary school level over the past ten years. This corresponds to a gender parity index of
0.81, assuming equal numbers of boys and girls in the population. However, three pieces of
information indicate that the gender gap in elementary school is not quite as wide as those
two figures would indicate: (i) the government‘s own population data suggest there are
slightly more boys than girls in the primary school-age population, so parity may be achieved
already at a female enrollment share of 0.49; (ii) among students of official age for
elementary school—i.e. excluding the overage students, of which many are boys—the female
share of enrollments increases to 46 percent; (iii) the 2002 DHS indicates a gender parity
index of 0.89 for all ages (based on the gross attendance rate of 94.6 percent for girls divided
with 106.1 for boys) and a gender parity index of 0.95 for at-age pupils (based on the net
attendance rate for girls divided with that for boys). All in all, it seems that the gender gap is
narrower, and that it will partly self-correct when the older children leave the school system.
The 2009 DHS household survey, which is not yet released, will be able to shed more light
on how much of a gender gap remains, and permit analysis by region, urban/rural location,
and income group, to understand better in what population groups these gender differences
persist.
(b) Institutional Change/Strengthening
66. Capacity within the planning unit for service delivery, sector-wide planning and
monitoring has been enhanced through the preparation of the ESDP, the implementation of a

19
coordinated approach to donor interventions as well as the management of curriculum reform
in Grades 1-12. The project assisted in strengthening capacity of the MOE in assessment. An
assessment consultant helped the Eritreans better understand how to structure learning
assessments through two workshops that transferred knowledge and analytical capacity.
Project preparation and implementation capacity within the MOE and PMU were improved
through continuous training provided by the project and the ECTF. At the time of project
closing, the PMU was comprised of 30 staff at the central level, with a full-time director, an
operations officer, an administrator and internal auditor funded by the government. These
staff are predominately officials from the MOE and will be absorbed back into the MOE and
provide ongoing support to the MOE in its daily operations. At the Zoba (district) levels,
engineers and finance officers received training which greatly improved implementation of
community-level activities. The PMU has shown good procurement, financial management,
monitoring, engineering and administrative capacity to manage a complex and large project
such as the ESIP.
(c) Other Unintended Outcomes and Impacts (positive or negative)
Nothing significant.
3.6 Summary of Findings of Beneficiary Survey and/or Stakeholder Workshops
Not Applicable.
4. Assessment of Risk to Development Outcome
Rating: Significant
67. The overall rating of significant for this assessment results from concerns over the
government‘s ability to maintain the current level of expenditures for education. It will be
difficult for the government to sustain the investments made and continue the reform
program, in that most of the development partners are no longer active in the education sector.
The MOE continues to be committed to the ESDP; however limited resources for the overall
sector will most certainly limit the government‘s efforts to improve the education sector.
68. The risks identified during project preparation were appropriate: two were rated high,
two were substantial, and one was modest. The risk related to increased unit costs for schools
did materialize initially. However over time the implementation team was able to reduce the
costs with more cost effective designs and saw some efficiency gains. In addition to being
more cost-effective, these structures were deemed robust, of high quality and easy to
maintain. Therefore, the risks to sustainability of investments in civil works can be
considered significant.
69. The preparation team did not identify lack of broader government ownership for the
project as a risk. As pointed out earlier, the government wanted a sector-wide approach as
opposed to a SIL. When the decision was made not to develop a sector-wide approach the
government spent much time developing and implementing their sector program which may
have limited their focus on the EESIP. In retrospect, the preparation team should have
identified this as a high risk to project implementation. Overall, the government‘s capacity,
20
both at the central and local level, to implement projects has improved and could be
considered modest upon project completion.
5. Assessment of Bank and Borrower Performance
5.1 Bank Performance
(a) Bank Performance in Ensuring Quality at Entry Rating: Moderately Unsatisfactory
70. Bank Performance. The Bank preparation team included the appropriate technical
experts to appraise the project. However, the project design was more ambitious that it should
have been given the Bank‘s effort to respond to the government‘s drive for a comprehensive
and ambitious sector wide program. The project was prepared quickly which led to a project
design that was weakly detailed which resulted in a phased project implementation. The
design team also assumed that the borrower had the capacity to implement part of the project
while completing preparation. In retrospect, this was a poor decision because of limited
capacity within the MOE and PMU to simultaneously continue to prepare and implement a
project. During the 2007 restructuring the design team used unreliable data for the PDO
enrollment targets which led to the projects problems in meeting the PDO indicator targets.
(b) Quality of Supervision
Rating: Moderately Unsatisfactory
71. The Bank conducted regular supervision missions during project implementation.
The Bank also recognized the need to restructure the project and to include an increased level
of community participation (CP) in school construction using the Rapid Results Approach
(RRA) although it was not fully operational until 2009. This led to an increase in the number
of classrooms constructed as well as a substantial increase in disbursements. This was a
positive outcome resulting from the restructuring process. Furthermore, the Bank‘s
procurement team raised the prior review threshold several times throughout the life of the
project which also helped speed up implementation. One year after the restructuring, in 2008,
the Bank also added an RRA consultant to its team who provided implementation support
and advice during the remaining three years of the project. The consultant‘s continuing
involvement was essential for the successful implementation of this component. At the time
of restructuring the Bank showed flexibility by responding to the government‘s request to
include payments to ECD caregivers and a girls‘ scholarship program. This was highly
appreciated by the government.
72. The project had five Bank Task Team Leaders (TTLs) during its lifetime. This
provided little continuity for implementation and the rapid turnover often led to long delays
in approving PMU requests and providing no objections. The Bank did not consistently
provide timely notification to the PMU of TTL changes which led to confusion. At the time
of the 2007 restructuring, the Bank did not fully study data available to establish PDO
indicator targets. This led to PDO assessment problems and established a false foundation on
which to judge the project. The supervision team‘s also consistently rated PDO achievement
as moderately satisfactory based on information provided by the MOE, while there was no
real indication of improvement in the PDO indicator: (i) enrollment rates were falling; (ii)
MLA II analysis was unavailable until 2010; and (iii) share of girls‘ enrollment had plateaued.
21
Reports submitted to the Bank only after the final supervision mission in spring 2011 pointed
to the scale of the deficiencies. This created a ―disconnect‖ between the ISR ratings and the
actual achievement of the PDO indicators.
73. Bank supervision teams did not include safeguards colleagues until the last 18
months of implementation which meant that safeguards were not regularly supervised and
little attention was paid to the inclusion of safeguards in construction contracts. At the mid-
term review, the Bank approved the designs for teacher‘s quarters without latrines, water or
bathing facilities as a cost saving measure and to build as many classrooms as possible to
achieve the PDO. The final supervision mission aides-memoire and ICR team view the
elimination of these facilities as major shortcoming in Bank supervision and implementation.
During the last two years of implementation, the Bank made an effort to rectify this situation
but there were still teachers‘ quarters that did not receive water and latrines and few school
fences.
(c) Justification of Rating for Overall Bank Performance
Rating: Moderately Unsatisfactory
74. Bank‘s overall performance is rated moderately unsatisfactory based on the above
discussion.
5.2 Borrower Performance
(a) Government Performance
Rating: Moderately Unsatisfactory
75. The government created bottlenecks to project implementation that were difficult to
overcome and slowed implementation. In 2006 the government suspended licenses of the
private construction firms in order to review and modify regulations. Furthermore, all
construction materials are imported through the paristatal Red Sea Corporation which led to
significant stress on the Bank procurement rules and occasional unavailability of imported
materials. Both of these led to school construction delays. The GOE went into arrears to the
Bank twice which created issues that led to problems in the last 6-7 months of
implementation. Specifically, the arrears prevented the Bank from being able to process
payments and Letters of Credit (LCs) for contracts as well as the call for funds from the EC
Delegation.
Government implementation
(b) Implementing Agency or Agencies Performance
Rating: Moderately Satisfactory
76. The implementation team was always organized, available to Bank mission members
and they were willing to engage in open and frank discussions, which contributed to steady
improvements in project implementation, especially towards the end of the project when their
skills had been well developed. However, periodically there were delays in getting travel
permits that restricted mission travel that caused some difficulties in properly supervising the
project. The quality components were implemented effectively by the MOE. The new
curriculum and textbooks were developed. The textbooks were printed and delivered to
schools and copyrights for the textbooks are owned by the government making it more cost

22
effective for future textbook revision and printing. The teacher training components met the
project targets and several policy studies were completed under the project.
(c) Justification of Rating for Overall Borrower Performance
Rating: Moderately Unsatisfactory
77. In light of the government performance and its impact on implementation as
discussed above, the overall performance of the Borrower is rated moderately
unsatisfactory.
6. Lessons Learned
78. Lesson 1. When there are severe limitations in the baseline data informing project
design, this should be clearly laid out in the PAD (even when this means questioning official
data). In these situations, teams should exercise additional care when preparing the results
framework, choosing indicators that do not directly depend on problematic data. During both
design and restructuring, due to problems with the official population data, the team did not
understand how far Eritrea had actually come with regard to providing access to elementary
education.
79. Lesson 2. To be able to claim attribution, projects‘ outcome targets should generally
be in line with the scope of the interventions. However, when an operation is part of a wider
sector program guided by an Education Sector Plan, the PAD should explain if targets differ
from those used to monitor the Plan itself. Targets should normally not exceed those of the
Education Sector Plan. The 2007 targets for the increase in enrollments were very high
considering the number of classrooms that were planned to be built, and higher than those of
the Education Sector Plan.
80. Lesson 3. Development of a sector-wide approach for post conflict countries with
weak capacity is not appropriate unless there is strong donor coordination and governments
view donor coordination as essential to the development of the sector. Although the MOE
and donors discussed and drafted a MOU for donor coordination, the government and donors
did not pursue the idea of stronger coordination.
81. Lesson 4. Project teams and Bank management should be cautious when making
decisions on accepting donor trust funds that more than double the size of projects,
particularly when the majority is for civil works. The Bank agreed to accept the EC grant
despite poor civil works implementation progress, limited capacity and country issues with
Bank procurement procedures.
82. Lesson 5. Civil works components need to be carefully developed and evaluated to
avoid implementation delays. Plans and designs should be done as part of project preparation.
Sufficient time to review and comment on designs is crucial, as is the need to complete works
at least one year prior to project closing to be able to measure impact. High construction costs
should not automatically be assumed to have room for reduction as it could jeopardize school
functionality or safeguards compliance.
83. Lesson 6. Continuity of Bank TTLs is essential for smooth project supervision. The
project had five Bank TTLs during its lifetime, which led to little continuity, delays in

23
responding to client requests and at times confusion as to who was the TTL at a given
moment.
84. Lesson 7. Donor coordination with respect to procedures helps governments and
implementation units process documentation more efficiently. However, the absence of a
MOU in support of the ESDP forced the PMU to follow each donor‘s particular procedures,
which created additional work and slowed implementation progress. Also, adjusting certain
procedures (i.e. procurement) to particular country circumstances can help avoid
implementation delays and lessen the burden on the PMU. 13
85. Lesson 8. Coordination mechanisms within a decentralized system are essential for
effective implementation. The project supported a culture of working together effectively
from the minister to the local Zobas which facilitated implementation. This was supported by
capacity building during implementation and the introduction of the CP-RRA process, which
sped up implementation.
86. Lesson 9. Bank TTLs need to be more aware of Bank safeguard requirements for
supervision, which can help avoid making decisions that might negatively impact the project
(i.e. elimination of essential aspects of school design that lead to non compliance of the Bank
safeguards or schools that were not fully functional). Safeguard specialists should be
included on project supervision missions on a regular basis to ensure safeguards compliance.
Also, the Bank‘s safeguards department‘s functions should not be confined only to initial
project document reviews and organizing training workshops but needs to include follow-up
and monitoring mechanisms to ensure full compliance.
7. Comments on Issues Raised by Borrower/Implementing Agencies/Partners
(a) Borrower/implementing agencies
(b) Cofinanciers
(c) Other partners and stakeholders (e.g. NGOs/private sector/civil society)
13 It should be noted that in 2006 the government requested donors to support the broader ESDP using coordinated procedures, but discussions on the conditions under which all donors would agree were inconclusive.

24
Annex 1. Project Costs and Financing
(a) Project Cost by Component (in USD Million equivalent)
Components
Appraisal
Estimate (USD
millions)
Actual/Latest
Estimate (USD
millions)
Percentage of
Appraisal
Increasing equitable enrollment
in basic education 16.1 16.2 101
Improved quality of basic and
secondary education 20.4 23.3 114
Enhanced capacity for service
delivery and sector-wide
planning and monitoring
1.6 4.2 263
Support equitable provision of
education 0.9 3.1 344
Project management 1.0 0.8 80
Total Baseline Cost 40.0 47.6
Physical Contingencies
2.0
0.00
0.00
Price Contingencies
3.00
0.00
0.00
Total Project Costs 45.00 47.6
Front-end fee PPF 0.00 0.00 .00
Front-end fee IBRD 0.00 0.00 .00
Total Financing Required 45.0 47.6
(b) Financing
Source of Funds Type of
Cofinancing
Appraisal
Estimate
(USD
millions)
Actual/Latest
Estimate
(USD
millions)
Percentage of
Appraisal
Borrower 14.50 not available not available
European Commission (EC) 44.96 41.2 92
International Development
Association (IDA) 45.00 47.6 106

25
(c) European Commission Trust Fund Financing Table
Category
Category
Description
Allocated Disbursed Undisbursed
Funds
Available
EUR EUR EUR EUR
1
CIVIL
WORKS 9,000,000 8,449,663 550,337 550,337
2
COMMUNIT
Y GRANTS 16,650,000 17,100,372 -450,372 -450,372
3 GOODS 4,510,000 4,271,355 238,645 238,645
4
TECHNICAL
ASSISTANCE 509,280 560,874 -51,594 -51,594
5
PMU
OPERATING
COSTS 500,000 572,378 -72,378 -72,378
Totals 31,169,280 30,954,642 214,638 214,638

26
Annex 2. Outputs by Component
1. Component 1: Increasing Equitable Enrollment in Basic Education. The
objectives of this component were to: (a) increase access to education nationally through
construction of new schools and classrooms and rehabilitation of existing schools; (b) reduce
disparities in enrolment rates across Zobas by targeting construction in disadvantaged areas;
(c) encourage greater enrolment of girls in schools through provision of adequate and
carefully sited sanitary facilities; (d) introduce improved methods for school mapping to
support the process of identification of locations for new schools and classrooms; (e) develop
and produce new cost-effective standard designs for school buildings; (f) establish functional
requirements for schools of varying sizes at each level of education that are both adequate
and economical; (g) introduce improved methods for contract supervision and administration;
and (h) increase capacity and resources to manage the physical implementation component.
2. The project encountered significant delays in terms of civil works, which hampered
progress towards achieving the target number of classrooms to be built, largely due to an
overly optimistic view of how quickly this component could be implemented. Despite these
initial difficulties, the project was successful in exceeding the initial target for number of
classrooms to be constructed: 1,638 classrooms were built compared to an initial target of
1,603 or the restructuring target of 1,400. In addition to classrooms, the project financed the
construction of 10 PRCs, 60 teachers‘ quarters and the extension of the ATEI. It also
succeeded in building latrines for both boys and girls in each newly-constructed school and
constructed fences for 62 schools. The project also exceeded the target of constructing 20
computer laboratories by establishing and equipping 44 computer labs. All the laboratories
were equipped with computers and furniture, and teachers trained for the use of ICT in
classrooms (see Component 2 for more information regarding teacher training).
3. The ECTF was also to finance the construction of Educational Support Facilities
(National Accreditation and Evaluation Center - NAEC and the Curriculum Development
Center - CDC), the expansion of the educational radio station, and construction of three
Technical and Vocational Education Training centers). Although these facilities could not be
built due to insufficient time remaining under the project to complete them, the project was
successful in reviewing and improving the designs.
4. In terms of enrollments, the project missed achieving the targets chosen as part of the
restructuring but it did meet the original goal of increasing primary enrollment by 39,000.
Although none of the post-restructuring enrollment targets, nor the targeted female share at
elementary level were met, the project was able to meet the share of girls at the middle-
school level and surpass the percentage of girls enrolled in secondary schools (43 percent vs.
40 percent target). Disparities amongst student enrolled rates at the elementary level also
improved, with the Southern Red Sea Zoba having closed the greatest gap (jumping from 9.8
in 2000/01 to 47.4 in 2009/10) but the Zobas Debub and Maekel continue to have the highest
GER.
5. The project also intended to procure GIS technology to facilitate the school mapping
exercise and collection of school-level data that could be used with the EMIS. The GIS
technology was procured and the project regularly collected data and produced statistical
yearbooks to track progress. Furthermore, with the help of the GIS technology, the project

27
kept a database with information about all schools in the country, including existing ones as
well as those financed by other donors, which allowed the government to make informed
decisions about its school construction program. The EMIS questionnaires were updated as
part of project activities.
6. The project also supported the development of new and more cost-effective school
designs (including functional requires for each school) for elementary, middle and secondary
schools in different sizes and with both highland and lowland versions. These designs were
reviewed and approved by the Bank and the government and effectively used for all new
school constructions irrespective of sources of financing. However, the Bank‘s push for
reducing construction costs might have come at the expense of some critical ancillary
structures such as fencing and washing facilities for teachers‘ quarters. Ultimately, the costs
were reduced as much as possible even though they might still be higher than in other parts
of Africa. This is due in part to country circumstances and the fact that some construction
modalities (i.e. community participation) included paying workers equitable wages.
Furthermore, assessments by the Bank team‘s architect of the project-financed structures
revealed them to be robust, of high-quality and easy to maintain.
7. The project also successfully put in place the necessary resources to supervise the
implementation of this component. This was done through the hiring of additional qualified
personnel, the establishment of clear guidelines for handing over newly constructed schools
and the management of grants to communities. Personnel both at the central and zoba-level
PMUs was adequately reinforced by the time the construction component got fully underway
and allowed for regular supervision missions and funds tracking. The Bank‘s agreement to
delegate part of the supervision and design activities to the Ministry of Public Works helped
to further ease the pressure on the PMU. The preparation of procurement documents and
carrying out of the bidding process also greatly improved as evidenced by shorter time
between preparation of the bidding package and contract award. Management of funds
transferred to communities for the construction of schools and other decentralized activities
was also successfully managed as no irregularities were found during audits or Bank
supervision missions. There have been mixed results in the upkeep of schools and ancillary
facilities after handing over was completed but the government has recognized the need for
additional support to the zobas through its decentralization policy. Unfortunately, project
closing has not allowed the Bank to follow up on the effects of such additional support.
8. Component 2: Improved quality of basic and secondary education had seven sup-
components: (a) teacher training, professional development and support and (b) replacement
of expatriate teachers by Eritrean teachers at secondary level; (c) curriculum and pedagogical
reforms; (d) textbook printing, distribution, and utilization; (e) expanding and strengthening
national assessment and examinations and (f) reducing overcrowding in secondary schools
(g) computer classrooms for secondary schools
9. Teacher and professional development and replacement of expatriate teachers
(Sub-components (a) and (b)). These two sub-components were designed to train sufficient
numbers of qualified teachers to answer the needs of the expanded system at elementary and
middle school levels through: (i) establishment of a distance learning program to increase the
supply of middle school teachers; (ii) improvement of facilities at teacher training
institutions; (iii) improvement of methods of teacher education at TTI; (iv) establishment of a
‗Fast Track‘ program for the conversion of elementary school teachers into middle-school

28
teachers and for teachers being recruited from amongst high school graduates; (v)
development of a program to encourage women to join the teaching profession; (vi)
evaluation of the Mai Nefhi teacher training program for ethnic and linguistic minorities;
(vii) development of a master plan to address issues of both quality and quantity in the
teaching profession; (viii) interventions to raise the professional competence of key staff in
the education service; and (ix) strategies for increasing the supply of Eritrean secondary
teachers and phasing out expatriates.
10. The project successfully carried out the Open Distance Learning Program (ODLP) in
two batches, one financed by IDA, the other by the EC. Although only 1,665 teachers
completed and graduated from the program, the target number of 2,080 teachers enrolled and
trained was in fact met. The project was also successful in improving methods of teacher
training at the two teacher training colleges with the completion of the tertiary education
reform and the adaptation of the teacher training program in line with the revised curriculum.
The Asmara Teacher Education Institute - ATEI (previously Asmara Teacher Training
Institute - ATTI) was expanded with project financing to include five additional classrooms
and 60 dormitories, benefitting approximately 240 additional teachers. Both, ATEI and
Eritrea Institute of Technology (EIT) in Mai Nefhi started to accept students again in 2008
after the government had completed its tertiary education reform, which is also likely to
reduce the need for expatriate teachers14. Although there does not appear enough evidence to
suggest that the share of expatriate teachers dropped to 5 percent at the end of the project,
data does show that the percentage had declined in 2004/2005 to 14.7 percent. The ―share of
expatriate teachers‖ indicator was dropped as part of the 2007 restructuring although the
restructuring did make available more funds to cover the cost of extending the use of
expatriate teachers (an additional US$1.5 million) to deal with the shortage of teachers.
These funds were fully depleted and any subsequent costs were covered by non-IDA
resources.
11. The training of teachers through ―Fast-Track‖ and ―Summer Programs‖ was also
successful: over the life of the project, a total of 4,522 teachers were trained through IDA
financing compared to the expected 2,500 teachers. Furthermore, different donors in addition
to IDA were actively involved in supporting female teachers through trainings to empower
female teachers in classrooms and learn about gender-fair teaching. IDA also financed the
upgrading of 1,015 uncertified female teachers compared to 254 male teachers.
12. The government also successfully prepared a ―Master Plan for Teacher Training‖ in
2006. In 2009, it proceeded to develop a ―National Policy for Teacher Education 2010 – 2020‖
and a follow-on document entitled ―National Strategy for Teacher Education 2010 – 2020
drafted in 2010. In addition, the document ―Part 1: Meeting Immediate Needs‖ to guide
continued professional development of teachers was completed in 2008 and subsequent
guidelines for implementation drafted.
13. Curriculum and pedagogical reforms. The two key objectives of this sub-
component were to: (a) enhance the capacity of the curriculum development division to plan
14 IDA support to support salaries for expatriate teachers stopped once the allocated amount was depleted in 2008; subsequent financing was assured through government resources.

29
for and implement ongoing curriculum reforms and (b) enhance the capacity of curriculum
implementers-teachers, school directors, supervisors and examiners-to effectively implement
the new curriculum. The capacity of the Curriculum Development Division was to be
enhanced through study tours and learning from positive experiences of others; provision of
technical assistance; and employing teachers on an ad hoc basis, to push the volume of
curriculum development work that will result from the reform process and from the
expansion of access. Curriculum developers were to also receive training from international
experts who were to be hired to provide technical assistance. In turn, curriculum developers
would have trained curriculum implementers. There was a reallocation of project funds
during the 2007 restructuring to support these reforms and to strengthen monitoring and
supervision functions, as well as the development of e-content.
14. The GOE launched a new curriculum for grades 1 - 12 in 2003 and developed syllabi
to support it. With the support of DANIDA, IDA, AfDB and EC, the GOE trained teachers in
the new curriculum, developed textbooks, printed new textbooks and distributed them for all
the grades over the life of the project. This process included conducting pilot studies in 18
schools in fours zobas to review the design for monitoring and evaluating the curriculum and
preparing a plan to coordinate and harmonize curriculum development. Furthermore, IDA
financed equipment and software upgrades for editorial and production teams of the General
Education Department. As part of this process, GOE has successfully institutionalized the
procedure for curriculum and textbook development, which is a remarkable achievement for
any country.
15. Training of curriculum implementers was supported through the provision of
technical assistance that provided training at the MOE for curriculum and materials
development specialists and teachers and for various central and Zoba staff. From 2006
through 2008, EC-supported consultants provided training to 3,750 educators on curriculum
development. In the area of training on the use of new curriculum materials, including
textbooks, DANIDA supported the training of 12,690 teachers on the use of textbooks in
2003–04, the Bank supported the training of 605 trainers and school administrators on ICT in
2005–09, and the European Commission supported the training of 9,685 teachers on the use
of textbooks and teacher guides during 2006–08.
16. Textbook printing, distribution, and utilization. This sub-component supported the
printing, publishing and distribution of textbooks and instructional materials for the new
curriculum, as well as the training of curriculum implementers in the use of those materials.
During the 2007 and 2010 restructuring, the reallocation of resources provided and an
additional US$0.6 million and US$0.46 million respectively to increase support to learning
materials provision.
17. The project supported the printing of pilot editions of elementary Grades 3-5
textbooks and middle school Grades 7-8 textbooks, reprinting of elementary Grade 1
workbooks, middle school Grades 6-8 textbooks, and various syllabus guides, totaling almost
900,000 copies. Furthermore, the project supported the development of textbooks and
teachers‘ guides for secondary education, grades 9 – 12 (2.8 million copies in 9 subjects15)
15 English, Mathematics, Biology, Chemistry, Physics, Geography, History, Agriculture and Business & Economics

30
and the reprinting of Grades 7 - 8 textbooks (816,000 copies). With the support of other
donors, the Education Sector Development Program as a whole was able to produce
approximate 10.5 million textbooks and teachers‘ guides.
18. In addition to having greatly increased the availability of textbooks and teachers‘
guides, another great achievement is that the State of Eritrea owns the copyrights to all of the
materials. This will also facilitate the government‘s ability to update and reproduce the
material in the future, which is commendable and hard to find in developing countries.
19. Expanding and Strengthening National Assessment and Examinations. This sub-
component supported the Supervision, Examinations and National Assessment (SENA)
Division of the Department of General Education to carry out national assessments (NA) in
two subjects at three levels in years one, three and five of the project.
20. By 2006, the SENA of the Department of General Education was reorganized into
two divisions, namely the Division of Assessment and National Examinations (ANED) and
the Division of Monitoring and Quality Assurance, with the former taking the lead for this
sub-component. Also, instead of conducting the assessment at three levels, only Grades 3 and
5 were considered for MLA II and the associated indicator changed as part of the 2007
project restructuring.
21. The results of the Grade 3 and 5 examination results conducted in 2008 with
UNICEF support were only shared with the Bank supervision team in February 2010, which
left little time for an in-depth analysis of the data. Nevertheless, workshops organized with
the support of a Student Assessment consultant in June 2010 and July 2011 to go over the
results led to the following findings: (i) the instruments are psychometrically sound; (ii) the
comparability between MLA I and MLA II is not ensured; and (iii) much more analysis could
have been done with respect to depth and scope of the competencies that the children are
expected to acquire in vis-a-vis the curriculum. Although it cannot be stated that numeric
targets of improvement of student learning have been met, there has been success in building
capacity for measuring achievement for the longer run.
22. The decision to invite a Student Assessment consultant to help the Eritrean MLA
team further analyze their MLA II data and extract additional information, while building
capacity for future analysis, was of great importance. Although the results of the two MLAs
could not be compared, the exercise of analyzing and re-working the data helped the
Eritreans better understand how to structure the next round of MLA. Transfer of knowledge
and analytical capacity as part to project intervention should therefore be regarded as a
success.
23. Although no specific intervention aimed at improving Grade 8 national examination
pass rate was included in the restructured project, this pass rate became part of the modified
PDO indicators, and was tracked only after the first half of 2007. The target was to reach a
pass rate of 76 percent by the end of the project over the 2005/06 SY result of 71 percent.
The target was reached for the 2008/09 SY, but declined by 1.2 percent in 2009/10, which the
team does not consider a significant decline. Therefore, this target was met.
24. Reducing Overcrowding in Secondary Schools (See Component 1). As mentioned
under Component 1, the project successfully supported the expansion of secondary education.

31
The project financed the building of 16 new schools to provide 329 additional classrooms as
well as numerous science and technology laboratories, and supported the procurement of
furniture and equipment (including lab materials). One of the short-comings of the project
was that civil works did not begin until the last 24 months of project implementation which
meant that the schools were only completed by the project closing date. The last-minute push
to finish all civil works was successful in terms of building the structures but did not allow
enough time to evaluate their effects on reducing overcrowding. It can only be assumed that
the 16 additional secondary schools will help alleviate overcrowding but no evidence could
be collected post-project closing.
25. Computer Classrooms for Secondary Schools. This sub-component was to
introduce information and communication technology (ICT) to 20 Eritrean secondary schools
together with supporting technical, pedagogical and management training necessary to
support the process. Where and as feasible, schools were to be connected to the internet to
allow access to up-to-date electronic educational content. The component was to also support
the training of Eritrean teachers in the use of ICT as a teaching and learning tool.
26. As mentioned under Component 1, the project exceeded its target of constructing 20
computer laboratories by establishing and equipping 4416 computer labs and procuring 835
computers and associated equipment and furniture. However, IDA was not the only supporter
of ICT in secondary schools: in collaboration with the AfDB and the government, a total of
5,482 desktop and 284 laptop computers were procured and distributed over four and a half
years, which is an impressive achievement. If the initial goal of providing 15 computers to
each school with at least 2,000 students has been maintained, a total of 380 schools would
have benefitted. However, given that nationally, only 10517 secondary schools exist, it is safe
to assume that more than 15 computers were provided to each school, thereby exceeding the
initial target. Unfortunately, no information on pupil:computer ratio has been tracked and
connectivity to internet and electricity remains a challenge in certain areas.
27. Awareness and Professional Development for School Administrators and MOE Staff
was supported through the training of approximately 208 elementary and middle school
teachers through EC financing. The EC also financed the training of 153 MOE staff in Basic
Computer Skills during summer trainings but no target figures are available.
28. Teacher Professional Development was supported in three phases between 2005 and
2010, and led to ICT training of 496 Master Trainers and 221 Education Managers. Initially,
the project was supposed to track the number of hours being trained, which was changed to
tracking the number of people receiving training. The project exceeded its target and had the
supplemental effect of encouraging more educational administrators and directors to use ICT
in their daily work. Although not required, further analysis on the effects of using ICT in
secondary schools might be useful if carried out in the future as it could provide valuable
information for new interventions. Access to Electronic Educational Content was supposed to
support the implementation of a ―simulated internet environment‖ where internet
connectivity was not available.
16 This includes the 16 computer labs of the secondary schools constructed through ICB 17 Including the 16 secondary schools constructed under ICB

32
29. Component 3: Enhanced capacity for service delivery and sector-wide planning
and monitoring. This component was to strengthen the delivery capacities of the Ministry
headquarters, Zobas, and sub-Zobas. The component would also support the background
work that the MoE was required to do in preparation for a sector-wide program. This
component was intended to provide the technical support required to: (i) provide equipment,
work space, and logistical support; (ii) provide scholarships for TVET lecturers; (iii)
strengthen the capacity of the planning unit; (iv) undertake technical studies required to
underpin the finalization of sub-sector policies and strategic plans; (v) refine and finalize sub-
sector policies and strategic plans; (vi) conduct a systematic and systemic assessment of the
delivery capacity of the MoE, Zobas and sub-Zobas; (vii) develop a comprehensive capacity
development program; and (viii) implement the capacity development program. As part of
the 2007 and 2010 restructurings, this component received an additional US$2.8 million total
to help intensify capacity building activities and provide more training and study
opportunities for better management of the education sector and service delivery.
30. This component was successfully carried out in the sense that the government
prepared, shared with developing partners and subsequently adopted its ―Education Sector
Development Program – ESDP‖ in 2005. However, a Memorandum of Understanding
(MOU) between the different development partners and the government to support the ESDP
could not be agreed on and was therefore never signed. Nonetheless, the government ensured
that all donor interventions were carried out as part of the ESDP and avoided overlapping
interventions, a fact which became apparent during the May/June 2010 joint IDA-EC
supervision mission. Therefore, the government demonstrated successfully that it could
manage a sector-wide approach (SWAPs) in the education sector.
31. After initial delays, the project supported study tours to South Africa and Namibia to
draw lessons from other countries who successfully implemented SWAPs. Several policy
studies were also carried out, including in the areas of Technical and Vocational Training,
Adult Education and Media, Capacity Assessment of MOE and PMU, ICT in education and
girls education. In total, 15 policy studies were to be carried out. The studies were carried out
but there does not seem to be an exact record of all of them. However, the ICR team did
confirm when possible that GOE has used the findings of the studies when preparing
interventions in each area (i.e. capacity building activities at both the central and
decentralized levels, Master Plan for Teacher training, ICT, girls‘ incentives etc.). What is
less clear is how effective each intervention was and their outcomes given that no analysis
was carried out.
32. The provision of training scholarships for lecturers in TVET schools seems to have
been carried out, but it difficult to identify the beneficiaries or measure their outcomes. There
is supposed to exist an evaluation report on the use of Eritrea Human Resource Development
Project (EHRDP) training fellowships, but no such report was available at the time of the
ICR mission and it is unclear if these EHRDP fellowships were used for TVET lecturers.
33. The project also provided equipment, work space and logistical support at both the
central and zoba levels, including the procurement of motor cycles at the zoba levels to
facilitate construction supervision, and radios and servers at the central level as the MOE‘s IT
capacity expanded. Based on the capacity assessment study mentioned above, IDA supported
the training of 127 Ministry staff (Directors, Supervisors, Zoba officers) in ―Management and
Leadership Skills‖ at the Diploma level awarded by the Eritrea Institute of Technology (EIT),

33
and an additional 93 through a summer program, exceeding the target of training 150 MOE
management staff. An additional 1,493 MOE staff were trained at the Zoba level in
―Management and Leadership Skills‖ to the Certificate level, and 72 administrative staff in
―Secretarial Science and Office Management‖ with a certificate from the University of
Asmara. The MOE has also financed 124 staff members (Directors, Supervisors, Zoba
officers) in ―School Management and Leadership Skills‖ who are currently enrolled at the
EIT. In addition to IDA support, the MOE has benefitted from other donor financing to train
its staff, including the EC which financed 209 senior officials to get a post- or undergraduate
degree through distance education.
34. Strengthening the capacity of the planning unit seems to have been achieved although
not explicitly tracked as part of project supervision. However, the preparation of the ESDP,
the implementation of a coordinated approach to donor interventions in the education sector
and the management of the curriculum reform of Grades 1 – 12 seems to indicate that
capacity for service delivery and sector-wide planning and monitoring has been enhanced.
35. Component 4: Support equitable provision of education. In line with the
objectives of the Government‘s National Education Policy and the Education Sector Program,
the EESIP was to support the GOE in its efforts to increase equity in educational
opportunities. The activities to be supported under this component included: (i) targeted
intervention to support the education of girls and other disadvantaged children; and (ii)
community sensitization and mobilization. These intervention complemented support
planned under each of EESIP‘s project component and other interventions currently being
implemented by GOE and other partners.
36. This component originally intended to review the situation for girls and other
disadvantaged groups, build awareness by conducting stakeholder workshops and
mobilization campaigns, design and implement targeted interventions for these vulnerable
groups, and conduct evaluations of these interventions. Following the study on girl‘s
education and other disadvantaged groups, the government developed and implemented an
incentives program 18 as part of the restructured project activities. Specifically, the
restructured project included the following activities: (i) a scholarship pilot program for girls
and disadvantaged children; and (ii) support to early childhood development (ECD) centers
in rural villages. Both these activities achieved their targets: 3,000 girls received incentives in
academic year 2008/09 and 2,334 girls in 2009/10; and 782 community-based ECD centers
receiving grants for those same two years19.
37. This component also supported targeted community-level interventions to heighten
awareness regarding the importance of educating girls especially in areas with the lowest
level of girls in schools (i.e. Afar region in the Southern Red Sea Zoba). The project financed
the procurement of small equipment used in drama plays (i.e. costumes, musical equipments
etc.). These interventions appear to have been well received and shown promising results
18 Incentives included the provision of books, bicycles, uniforms, and scholarships 19 Community-care centers run by local women to provide them with management training and grants to purchase
equipment and pay for upkeep; the project financing helped cover these costs until the government could make
provisions to include them in their national budget
34
based on beneficiary feedback. Furthermore, UNICEF supported the construction of eight
nomadic schools in Northern Red Sea, Gash Barka, Anseba and Southern Red Sea Zobas.
38. The project also helped develop a detailed financial management manual. This
manual ensured proper use and tracking of resources transferred to the community level in
the case of community-led school construction, girl‘s incentives and support to ECD centers.
As no evidence of misuse of such funds has been found neither by the auditors nor the
Bank‘s financial management specialists, this activity can be considered successful.
39. Component 5: Project Management. Project management was to be coordinated by
the MOE through a Project Management Unit (PMU) that had already been established. The
MOE was to provide strategic guidance and supervision through a Steering Committee
composed of all four Director Generals, chaired by the Director General for Research and
Human Resources Development. The PMU would be managed by a senior education planner,
and would also include a senior financial management specialist, procurement specialist and
engineer/architect. A Project Implementation Manual (PIM) was to be finalized and was to be
adopted prior to project effectiveness.
40. The PMU was initially understaffed, which contributed to the slow progress at the
onset of the project. However, both the Bank and government teams soon realized that a
strengthened engineering section (both at the central and zoba levels) was required if
components such as the civil works component were to be effectively carried out. The teams
also recognized the need for proper fiduciary oversight especially with the introduction of
community participation and incentives for girls‘ education, and strengthened both the
procurement and financial management units accordingly. However, the M&E department‘s
effectiveness could have been improved with a fully integrated M&E system which would
have made tracking and reporting on progress much easier and more accurate.
41. At the time of project closing, the PMU was comprised of 30 staff at the central level,
with a full-time director, an operations officer, an administrator and internal auditor funded
by the government. At the decentralized levels, each zoba was staffed with one engineer, one
accountant and accounting clerks, which greatly improved implementation of community-
level activities. The PMU has shown good procurement, financial management, monitoring,
engineering and administrative capacity to manage a complex and large project such as the
EESIP.

35
Annex 3. Economic and Financial Analysis
1. The economic analysis of the project in the PAD did not calculate an Net Present
Value (NPV) or Internal Rate of Return (IRR), but argued that investments in education are
generally justified because they increase the productivity of labor and are associated with
beneficial social outcomes. It also argued that public investment in education is warranted
because of market failures that lead individuals to under-invest in education. The financial
analysis included projections of the public recurrent and development costs of the sector over
the life of the project based on assumptions about the population growth, increase in
educational coverage, unit costs, etc. The economic and financial analysis for the PAD was
comparable with that of similar projects at the time. The main weakness of the analysis was
that several of the assumptions were out of touch with reality (particularly population, but
also unit construction costs).
2. This ICR provides: (i) a detailed discussion of the efficiency aspects of the project;
and (ii) a discussion of the impact of the project on the efficiency of the education system as
a whole. The ICR has not calculated an NPV or IRR in the absence of good data linking
project activities with specific outcomes that can be clearly attributed to the project.
3. School construction. The project was successful in exceeding the initial target for
number of classrooms to be constructed: 1,638 classrooms were built (elementary, middle
and secondary) compared to an initial target of 1,603 or the restructuring target of 1,400. In
addition to classrooms, the project financed the construction of 10 Pedagogical Resource
Centers, 60 teachers‘ quarters and the extension of the ATEI. The construction contracts
totaled about US$43 million according to project files, excluding the amount spent later on
fences and solar-powered water pumps, etc.
4. Most of the school construction was new school construction (but new schools would
often replace some temporary or dilapidated structures, so a school would often be present
already at the location); only 100 of the 1,638 classrooms were built as extensions of existing
schools. Table 1 shows the unit construction costs for new school construction as a function
of type of construction and procurement modality. For elementary school classrooms, the per
classroom cost of new school construction was in the range of US$26,891-29,430 depending
on the procurement method (and for middle school classrooms between US$28,645 and
30,400). For both elementary and middle schools, unit costs were a little lower for schools
built under the community participation mode than under NCB. The lower cost for
construction with community participation is consistent with experience from other countries
(Theunynck 200920). Due to higher contract amounts, all new secondary schools were built
under ICB at an average per classroom cost of US$39,393. Teacher quarters cost an average
of US$9,688 per dorm room and pedagogical resource centers cost an average of US$83,604.
20 Theunynck, Serge (2009). School Construction Strategies for Universal Primary Education in Africa:
Should Communities be Empowered to Build Their Schools?

36
Table 1: Relationship between Unit Construction Costs and Procurement Method, around
2009-10
Community
participation (CP)
National
Competitive
Bidding (NCB)
International
Competitive
Bidding (ICB)
New elementary school (per
classroom, US$)
26,891 29,430 -
New middle school (per
classroom, US$)
28,645 30,400 -
New secondary school (per
classroom, US$)
- - 39,393
Teacher quarter (per room for
sharing between two teachers,
US$)
9,688 - -
Pedagogical Resource Center
(per center, US$)
83,604 - -
Source: Analysis of data from project files.
5. According to the PAD, the construction cost of an elementary school classroom was
US$35,000 at the time of project preparation (2003), and the project files indicate that the
cost of a secondary classroom was around US$45,000 in 2005. The PAD notes that the cost
for similar classrooms in other countries of the Africa region was a quarter of that, and that
the government should reduce the functional requirements for the schools. The PAD
allocated a budget of US$15,000 for elementary schools and US$20,000 for secondary
schools. With this optimistic goal in mind, a larger number of schools were planned for at the
appraisal stage than were eventually built. The PAD indicates possible reasons for the high
cost of school construction noting the harsh physical environment, the recently-ended war,
lack of capacity to revise standard designs, and inability of the MoE‘s Project Management
Division to follow up on contracts and supervise construction. It also speaks to design
features that made school construction more expensive, such as school fences.
6. The project led to a reduction in the cost of school construction in Eritrea. Several
rounds of design changes to reduce the functional requirements brought down the
construction costs, which were roughly reduced by a one third21. This reduction was not as
large as anticipated in the PAD but nevertheless impressive and a direct result of the project.
One of the reasons for the relatively high construction costs in Eritrea, even after design
changes, was that fair wages were paid to all workers who worked in the construction of
schools under Community Participation. This contributed to employment and higher local
incomes in project areas, which were often remote rural areas with few other opportunities
for paid employment. The new lower-cost school designs remain with the PMU, which will
continue to manage school construction in Eritrea after the project, so this efficiency gain is
likely to be sustainable.
21 When inflation is taking into account, the cost of construction dropped by a third for elementary school
classroom, by 30 percent for middle school classrooms, and by a quarter for secondary school classrooms.

37
7. Other reasons for the high costs of school construction include: i) the need to import
many building materials including such high-cost items as steel and cement, ii) the fixed rate
of exchange between the Nakfa and foreign currencies while the parallel market value of the
Nakfa may be about half of its officially traded value, iii) limited competition in the
construction industry since no large private construction firms are allowed to operate and v)
the near-monopoly of the Red Sea Trading Company in importing building materials (or any
other goods) from abroad.
8. The project did experiment with an alternative method of school construction
involving greater use of local materials (locally quarried stone and mud mortar rather than of
concrete hollow-core block and cement mortar), but this did not reduce further reduce costs
although it did result in greater local employment and income.
9. Textbooks. The PAD describes how the GoE already had ‗an excellent track record of
producing low-cost textbooks at a cost of less than a dollar a book‘ at the time of project
preparation. Textbooks procured under EESIP were also low-cost: EESIP financed the
printing of textbooks for middle and secondary schools at a cost of only US$0.60 and
US$0.69 a book, respectively (for a total disbursement of US$2.2 million). This cost includes
delivery to a central warehouse but not distribution. Books have subsequently been
distributed to schools by the MOE, who considers the distribution successful. Other partners
have supported the printing of books for elementary education.
Table 2: Unit costs of printing textbooks, ca. 2010 (US$)
Middle Secondary
Eritrea (EESIP)a 0.60 per book 0.69 per book
a Costs include deliver of textbooks to central warehouse but not distribution to schools.
10. School furniture. EESIP procured furniture for new schools and classrooms at a per
classroom cost of about US$5,000 for primary schools, US$7,100 for middle schools and
US$5,800 for secondary schools. These costs include the prorated cost of one staff room and
one or more administrative offices, depending on the size of the school, and the cost of
deliver of furniture to schools. Unit costs of school furniture under ESIP are comparatively
high compared with the average for 10 SSA countries shown in Table 3. Although most of
the school furniture was locally produced, wood for furniture is imported in Eritrea leading to
higher costs (again, as a result of exchange rate distortions

38
and import monopoly). Also, most schools and classrooms constructed and furnished under
ESIP are located in rural areas, in particular the CP elementary schools.
Table 3: Cost of school furniture per classroom, ca. 2010 (US$)
Primary Middle Secondary
Eritrea (ESIP)a 5,023 7,148 5,804
SSA averageb 1,603
a ESIP unit costs include transportation costs to schools. Cost also includes furnishing of one staff room and between 1
and 3 offices (depending on school size). b Average cost in selected projects in 10 SSA countries (Theunynck 2009). The per classroom cost included the cost of
furnishing a staff room.
11. Science labs for secondary schools. EESIP also financed equipment and supplies for
science laboratories for all secondary schools, including both new schools and existing
schools (90 secondary schools in total in Eritrea). New schools were fully equipped, while
existing schools received a smaller package based on a needs assessment. The average cost
per school was US$8,351 (for a total disbursement of US$ 0.8 million). It has not been
possible to find data from other countries to compare with.
Table 4: Cost of science lab per secondary school, ca. 2010 (US$)
Secondary
Eritrea (ESIP) 8,351
12. Efficiency of the Education System. The fiscal impact of the project on public
education expenditures have not been analyzed, as data on government budget execution are
not in the public domain. However, given recent years‘ decline in enrollments, the pressure
on the education budget has likely eased somewhat. Further, there have been efficiency
improvements in the education system itself over the life of the project, as repetition rates
have declined at all levels of education and dropout rates have either stabilized or declined,
which make for a more efficient student flow pattern.

39
Annex 4. Bank Lending and Implementation Support/Supervision Processes
(a) Task Team members
Names Title Unit
Lending
Paud Murphy Lead Education Specialist/Task Team
Leader
Mmantsetsa Marope Sr. Education Specialist
Dandan Chen Economist
Marylou Bradley Operations Officer
Jacob Bregman Lead Education Specialist
Birger Fredriksen Sr. Education Advisor
Surendra Agarwal Lead Specialist
Eduardo Velez Lead Human Development Specialist
Francesco Samo Consultant, Procurement
Brighton Musungwa Sr. Financial Management Specialist
Ivar Strand Consultant
Gordon Temple Consultant
Edith Mwenda Counsel
Steve Gaginis Finance Officer
Victoria Fofanah Program Assistant
Phil Khorassandjian Consultant, Architect
Robert Smith Consultant, Teacher Development
Specialist
Saba S. Tekle Executive Assistant
Supervision/ICR
Henry A. Amuguni Sr Financial Management Specialist AFTFM
Carla Bertoncino Senior Economist AFTED
Marylou R. Bradley Senior Operations Officer WBIHS
Dandan Chen Senior Economist EASHE
Efrem Fitwi Procurement Specialist AFTPC
Donald B. Hamilton Consultant AFTED
Susan E. Hirshberg Sr Education Spec. AFTED
John H. Juma Consultant AFTED
Rogati A. Kayani Consultant AFTPC
Bjorn Lunoe Consultant AFTH1 - HIS
Isaac Matzner Junior Professional Associate OPCRX
Aidan Gerard Mulkeen Consultant MNSHD
Brighton Musungwa Sr Financial Management Specialist AFTFM
Patrick Lumumba Osewe Lead Specialist AFTHE
E. Gail Richardson Lead Operations Officer ECSO1
Franco Russo Operations Analyst AFTED
Raisa Inkeri Venalainen Consultant ECSHD
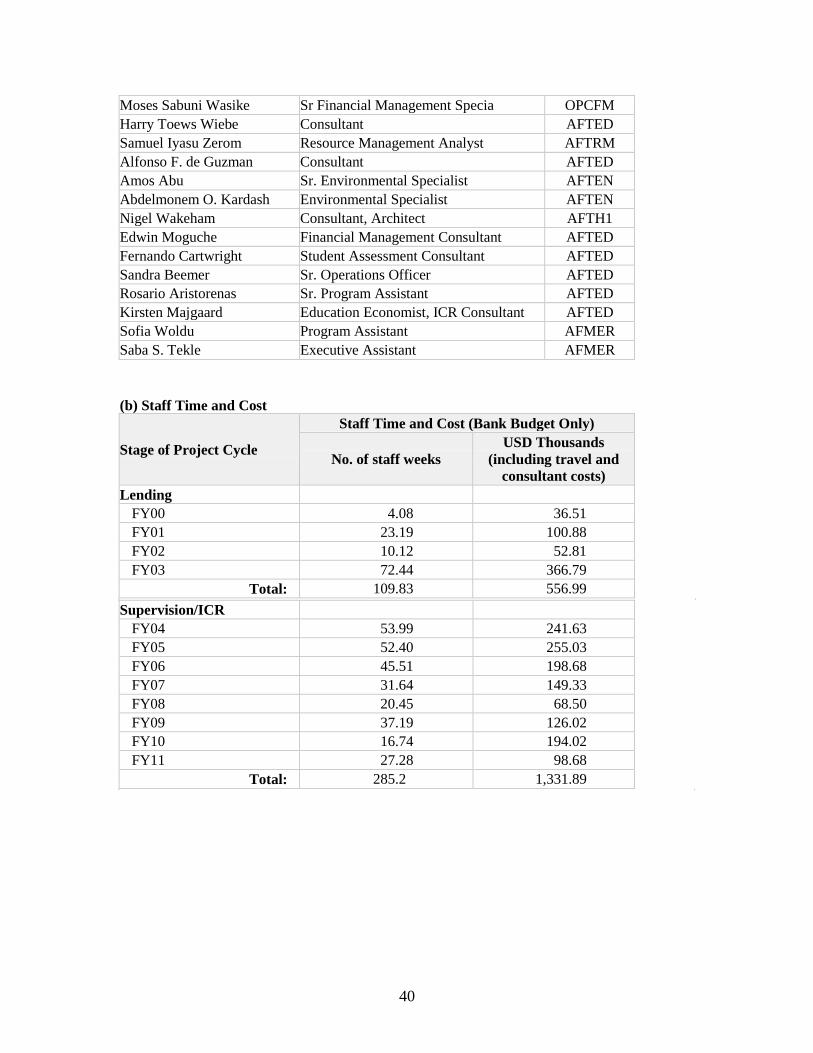
40
Moses Sabuni Wasike Sr Financial Management Specia OPCFM
Harry Toews Wiebe Consultant AFTED
Samuel Iyasu Zerom Resource Management Analyst AFTRM
Alfonso F. de Guzman Consultant AFTED
Amos Abu Sr. Environmental Specialist AFTEN
Abdelmonem O. Kardash Environmental Specialist AFTEN
Nigel Wakeham Consultant, Architect AFTH1
Edwin Moguche Financial Management Consultant AFTED
Fernando Cartwright Student Assessment Consultant AFTED
Sandra Beemer Sr. Operations Officer AFTED
Rosario Aristorenas Sr. Program Assistant AFTED
Kirsten Majgaard Education Economist, ICR Consultant AFTED
Sofia Woldu Program Assistant AFMER
Saba S. Tekle Executive Assistant AFMER
(b) Staff Time and Cost
Stage of Project Cycle
Staff Time and Cost (Bank Budget Only)
No. of staff weeks
USD Thousands
(including travel and
consultant costs)
Lending
FY00 4.08 36.51
FY01 23.19 100.88
FY02 10.12 52.81
FY03 72.44 366.79
Total: 109.83 556.99
Supervision/ICR
FY04 53.99 241.63
FY05 52.40 255.03
FY06 45.51 198.68
FY07 31.64 149.33
FY08 20.45 68.50
FY09 37.19 126.02
FY10 16.74 194.02
FY11 27.28 98.68
Total: 285.2 1,331.89

41
Annex 5. Beneficiary Survey Results
Not Applicable

42
Annex 6. Stakeholder Workshop Report and Results
Not applicable

43
Annex 7. Summary of Borrower's ICR and/or Comments on Draft ICR
Excerpts of the Borrower’s ICR (full document on file). The main results achieved have
been summarized below.
Component 1: Increasing equitable enrollment in basic education
1. Student Enrollment. The actual enrollment for elementary school at the close of the
project has been low as compared to the revised target which assumed a continued rapid
growth in enrollments of five percent per year.
2. There has been modest increase in aggregate enrollments. The new schools and
classrooms constructed are in use, and have thus helped relieve the severe overcrowding and
also minimized make-shift schools that were in use at the outset of the project. The pupil-
classroom ratio has improved from 63 to 53 since the baseline. Likewise, the share of schools
that use double-shifting has declined from 56 to 48 percent.
3. Middle school enrollments saw a 43 percent increase and the student-classroom ratio
improved from 83 to the more acceptable 49. This was achieved as the result of the
expansion in the number of middle schools over the period. However, the project did not
achieve the target of 189,000.
4. ESDP projection of enrollment was more realistic as actual figures from EMIS are
very close to ESDP estimates, ESIP could have benefited by using more realistic enrollment
projections.
5. The target for girls‘ share of enrollments was achieved for both middle and secondary
school levels, but not for the elementary school level. Preliminary studies have indicated that
major impediments to girls‘ education include factors including economic, social, cultural
barriers, school distance etc. Girls‘ enrollment in education particularly in elementary school,
thus calls for further study and an in-depth analysis of the barriers.

44
Table 1: PDO indicators of 2003 and 2007 restructured project Indicators 2003 PAD 2007 Restructuring Paper Status at
closing
Baseline
2000/01
Original
target for
2008/09
Revised
baseline
2005/06
Revised
target for
2010/11
Actual
2010/11 or
latest
available
year as
indicated
Student enrollment at
elementary school level
increases.
298,691 338,000 364,000 464,000 311,598
Student enrollment at
middle school level
increases.
76,564
(2-year
cycle)
126,000
(3-year
cycle)
148,000 189,000 154,598
Female share of total
enrollment in elementary,
middle and secondary
schools improves.
45%
46%
37%
Increase
in all three
44%
39%
34%
50%
45%
40%
45%
45%
43%
Percentage of Grade 3 and
Grade 5 learners attaining
the minimum mastery level
increases in the Monitoring
Learning Achievement
Test (MLA).
58% (Gr. 3)
32% (Gr. 5)
(2001)
Increase
in both
n/a 62% (Gr. 3)
37% (Gr. 5)
40% (Gr. 3)
57% (Gr. 5)
(2008)
Percentage of grade 8
national examination pass
rate increases.
Not
applicable
Not
applicable
71% 76% 74.8%
(2009/10)
(76.2%
2008/09)
6. Community Participation (CP I). The construction of schools under the
Community Participation Approach I (CPI) has been completed successfully as follows:
IDA-financed: 14 schools have been constructed to accommodate 3,192
students and furniture has been delivered to all schools.
ECTF-financed: 53 schools have been constructed through CPI providing
20,700 students when double-shifted. Furniture has been delivered.
7. Construction under CP II. The construction of schools under the Community
Participation Approach II (CPII) comprised 2 elementary and 1 middle school; 60 teacher
quarters; extension of classroom in the existing 30 schools; and 10 PRC‘s (See Table 2).
Table 2: Construction of Schools and Classrooms
Source Type of activity # of
classrooms
# of student places Status
CPI
IDA Construction of 14
elementary schools
76 3,192 (all in lowland) Completed
ECTF Construction of 50
elementary and 3
middle schools
350 20,700 (142 class
rooms in highland
and 208 in lowland)
Completed
CP II
ECTF Construction of 2
elementary and 1
14 756 (1 highland and
2 in lowland)
Completed

45
middle school
ECTF Construction of 60
teacher quarters
360 Not Applicable (720
teachers will benefit )
Completed
ECTF Extension of
classroom in 30
existing schools
100 5964 (58 class rooms
in lowland and 42 in
highland)
Completed
ECTF Construction of 10
PRC‘s
NA Not Applicable Completed
National Competitive Bidding (NCB)
8. IDA-financed: The construction of the Asmara Teacher Education Institute (ATEI) is
completed and 8 schools have been constructed. These schools with 100 classrooms in total
will provide about 7,392 student places when double shifted.
9. ECTF-financed: 21 large schools (7 elementary schools and 14 middle schools) are
constructed using this procurement method. These schools have 304 classrooms in total and
will provide 23,016 new students when double shifted. Furniture and equipment have been
delivered.
Component 2: Improving the Quality of basic and secondary education
10. International Competitive Bidding (ICB). ICB was used for two groups of building
types: for the 16 secondary schools financed by ESIP, and for expansion of the radio station,
the construction of the Curriculum Development Center (CDC), the National Accreditation
and Evaluation Center (NAEC), and for three Skill Development Centers (SDC‘s), all
financed under the ECTF.
11. However, the radio station, CDC, NAEC and SDC could not be built before the
project‘s closing date and thus not be financed through ECTF; and only the design of these
facilities was supported by the project. This funds which had been earmarked for the centers,
were utilized for fencing of 62 schools that had been constructed by the project.
12. Teacher training, development, and professional support. The achievements made
with regard to the training of teachers and provision of professional support including
through the Open and Distance Learning Program (ODLP) are summarized in Table 3.

46
Table 3: Overview of the major Teacher Training Activities financed by ESIP
Type of Training No. Of Beneficiaries
ODLP 1 441
FT1 535
FT2 479
Training and certification of Elementary school
teachers
1711
English proficiency and upgrading 197
Mentoring scheme 139
Induction program 2000
13. Curriculum and Pedagogical reforms. The curriculum and pedagogical reforms
introduced included the following:
Development and printing of secondary school textbooks and teachers‘ guides, in total 66
books for 9 subject areas;
Recruitment of English, Civics, History, national textbook designer and curriculum
development experts
Development and printing of Elementary and Middle school Textbooks and Teachers‘
guides.
Various capacity development training and workshops
Strengthening the Desktop Publishing Unit (DTP) through the provision of IT equipment
Support in curriculum development through the provision of core team writers,
illustrators and translators.
14. Textbook printing, distribution and utilization. The overall target of ESDP in
Textbook Provision is to reach a student/textbook ration of 1:1. And ESIP has contributed a
great deal towards achieving that target.
The project‘s outputs in Textbook Printing are presented in Table 4.
Table 4: Textbook Printing
SN Description Year Quantity Cost
(US$)
1 Grades 7-8 textbooks, teacher guides in
mathematics, science, social studies – pilot
edition
2005 68,340 71,872
2 Grade 1 workbooks in mother tongue,
mathematics
2006 619,836 248,330
3 Reprinting of Grade 7&8 Textbooks and
Teachers guides (4 subjects , 16 titles
2011 816,000 488,000
4 Grade 3 mother tongue, mathematics,
science in 10 languages of instruction – pilot
edition
Grade 7 textbooks, teacher guides of English
– piloted
130,663 147,747
5 Grade 9-12 textbooks of English – reprint 55,500 60,000

47
6 Secondary education syllabus guides – 11
subject areas
2007 7,888 14,131
7 Textbooks for 9 teacher pre-service teacher
training subjects – ATEI
2009 9,000 16,050
8 Grade 11 textbooks in business and
economics
12,300 40,698
9 Printing of Secondary School Textbooks and
Teachers‘ guides ( grades 9-12, 8 subjects,
58 titles)
2011 2,703,209 1,918,321
Total 4,422.736 US$3,005,147
15. Expanding and Strengthening of National assessment and examinations
Various trainings and studies were conducted to strengthen supervision and
monitoring and National assessment and examinations. Some of the major
achievements include:
MLA II has been conducted and Preliminary data analysis suggests that the
instruments appear to be psychometrically sound. Nevertheless, there is a
need for further improvement.
Two exam-marking machines procured along with readable answer sheet
forms and spare parts.
Learner Assessment and Progression Guidelines (LAPG) developed and
disseminated
Various capacity building workshops and trainings conducted for
supervisors and education administrators
16. ICT in Education. The ―ICT in Education‖ program was launched in January 2005.
The program is intended to introduce ICT as a subject and as a teaching/learning tool across
all subjects of the national curriculum as well as for educational management information
systems (EMIS) across all levels of the education system. In other words:
ICT Policy paper has been prepared
ICT will be an essential and fundamental component for capacity development
in all education sub-sectors.
ICT infrastructure and interconnected network will be procured and installed
throughout the entire administration education sector , and utilized to its fullest
extent for a more efficient management of the education system.
A comprehensive network use policy and training program will be developed
and deployed to ensure all employees in the sector use the network competently
and safely.
In total 5482 desktop and 284 laptop computers have been deployed across the
country during 2005-2010.
17. The ICT related human capacity development comprised training of 496 Master
Trainers and 221 Education Managers (See Table 5).
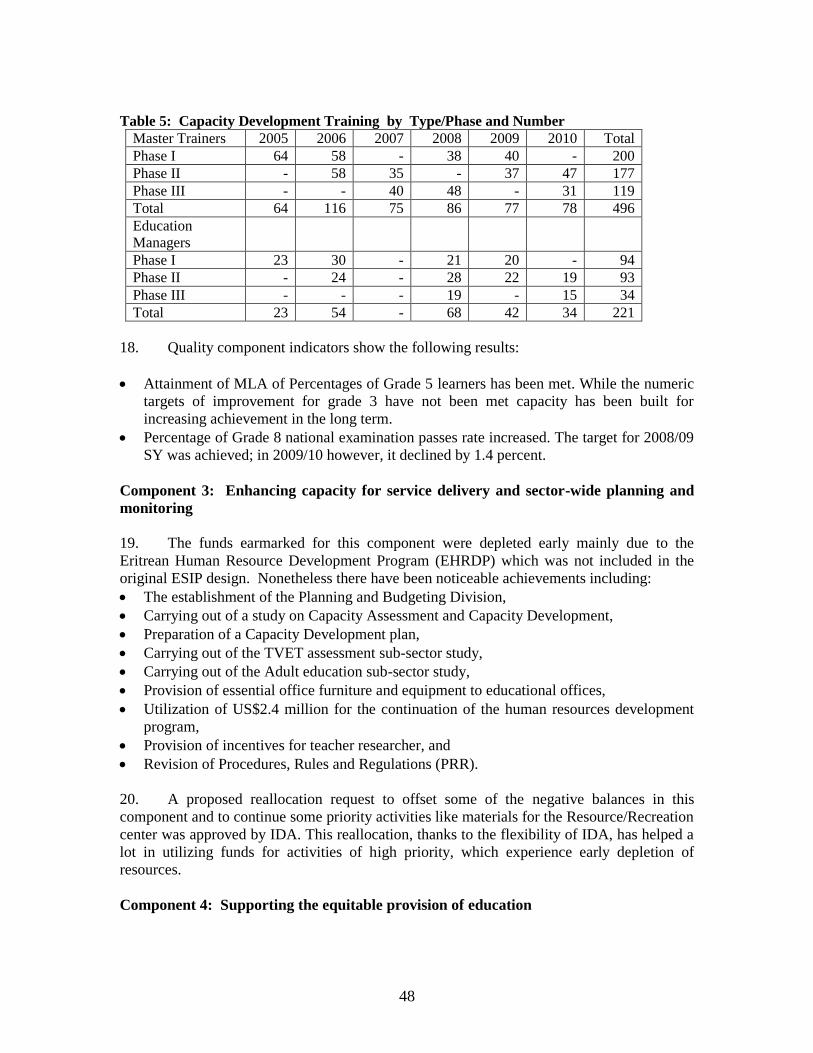
48
Table 5: Capacity Development Training by Type/Phase and Number
Master Trainers 2005 2006 2007 2008 2009 2010 Total
Phase I 64 58 - 38 40 - 200
Phase II - 58 35 - 37 47 177
Phase III - - 40 48 - 31 119
Total 64 116 75 86 77 78 496
Education
Managers
Phase I 23 30 - 21 20 - 94
Phase II - 24 - 28 22 19 93
Phase III - - - 19 - 15 34
Total 23 54 - 68 42 34 221
18. Quality component indicators show the following results:
Attainment of MLA of Percentages of Grade 5 learners has been met. While the numeric
targets of improvement for grade 3 have not been met capacity has been built for
increasing achievement in the long term.
Percentage of Grade 8 national examination passes rate increased. The target for 2008/09
SY was achieved; in 2009/10 however, it declined by 1.4 percent.
Component 3: Enhancing capacity for service delivery and sector-wide planning and
monitoring
19. The funds earmarked for this component were depleted early mainly due to the
Eritrean Human Resource Development Program (EHRDP) which was not included in the
original ESIP design. Nonetheless there have been noticeable achievements including:
The establishment of the Planning and Budgeting Division,
Carrying out of a study on Capacity Assessment and Capacity Development,
Preparation of a Capacity Development plan,
Carrying out of the TVET assessment sub-sector study,
Carrying out of the Adult education sub-sector study,
Provision of essential office furniture and equipment to educational offices,
Utilization of US$2.4 million for the continuation of the human resources development
program,
Provision of incentives for teacher researcher, and
Revision of Procedures, Rules and Regulations (PRR).
20. A proposed reallocation request to offset some of the negative balances in this
component and to continue some priority activities like materials for the Resource/Recreation
center was approved by IDA. This reallocation, thanks to the flexibility of IDA, has helped a
lot in utilizing funds for activities of high priority, which experience early depletion of
resources.
Component 4: Supporting the equitable provision of education

49
21. Education of Girls and Other Disadvantaged Children. Sensitization for girl‘s
education has been conducted using drama, plays, songs, documentary films and the like.
Girls have received incentives based on the following criteria:
Social factors: (i) Disadvantaged parents who have demonstrated their
determination by sending their children to school;(ii) Children from
nomadic communities and minorities who have been deprived of educating
their children; (iii) Children with special learning needs; Female students
who have decided to go back to school after marriage or after having
children; (iv) High performing girls and other disadvantaged children in
targeted areas (such beneficiaries will only be given awards at the end of
semester exam).
Economic Factors: (i) Girls from poor families in the targeted areas; (ii)
Families who are unable to send and keep their children in school; (iii) Poor
families in targeted areas who send their children to remote middle or
secondary schools.
School Factors: Schools where participation rate of girls is below 30%.
Moreover support was provided to the ECD Centers and incentive was
given to Kindergarten teachers.
22. Over all around USD 1.1 (US$600,000 for Sensitization and US$500,000 for
Incentive schemes) million was disbursed to support equitable provision of education
Component 5: Project Management.
23. As already indicated, initially established to deal with only ESIP, the PMU has grown
both in size and experience to handle the challenges of implementing the rather larger
Program, the ESDP. The PMU has been playing a vital role in coordinating, planning,
monitoring and implementation of different project activities. Among the key lessons learned
with regard to the management of the project the following stand in the forefront:
Need for timely establishment of the PMU and proper identification and
recruitment of staff;
Need for timely preparation of the Project Implementation Manual (PIM);
Timely institutional assessment during project appraisal to identify
weakness in capacity and develop appropriate mitigation measures;
Timely provision of training to staff and provision of technical support to
facilitate smooth procurement operation and preparation of school designs;
Timely establishment of a coordination mechanisms from the Minister to
Zoba levels (including the establishment of a Steering Committee) to ensure
effective implementation of the project;
Need for promotion and supporting the culture of working together during
planning and implementation and the timely introduction of the CP-RRA
process, which was very effective in producing remarkable results.
2.3 Project Impact on ESDP and other associated reforms.
24. Human development has been recognized as one of the key strategies for attaining
national development goals and objectives. Education is acknowledged as a key pillar for

50
human development. Hence the need to improve access to education, completion rates, and
quality of basic and secondary education as means of providing the required skilled labor.
25. As already stated, the ESDP was developed to serve as a comprehensive, sector-wide
approach for the development of education with four basic objectives, that is, (i) increase
equitable access to basic and secondary education; (ii) improve the quality of basic and
secondary education; (iii) develop vocational, technical and technological skills; and (iv)
strengthen institutional capacity to deliver better quality education services.
26. The ESIP project has had undoubtedly a positive impact on the ESDP in as much as
its achievements have been quite significant in contributing to the overall objectives of ESDP.
To recap the major achievements of ESIP included the following.
Despite the modest increase in aggregate enrollments due to low increases
in elementary school level, increases have been recorded in middle school
education and girl‘s education in both middle and secondary school levels
(ESDP‘s first objective).
The new schools and classrooms that have been constructed have helped
relieve the severe overcrowding in schools (ESDP‘s first objective).
The curriculum and pedagogical reforms introduced in terms of
development of secondary school textbooks and teachers‘ guides;
manuscripts etc. and the printing and distribution of educational materials
have ushered invaluable benefits. (ESDP‘s second objective).
The introduction of ICT as a subject and as a teaching or learning tool
across all subjects of the national curriculum as well as for educational
management information systems (EMIS) across all levels of the education
system has been advantageous (ESDP‘s second objective).
The achievements made with regard to the training of teachers &
Managerial capacity building of directors etc and provision of professional
support including through the ODLP have contributed significantly to the
improvement of their capacity (ESDP‘s third objective).
The steps taken to improve the capacity of the MoE and PMU through
carrying out pertinent studies and establishment and strengthening of
appropriate implementing units have been quite effective (ESDP‘s fourth
objective).
27. The ESIP has contributed to the strengthening of the formal education system for the
development of skilled human power and thereby to poverty reduction in a variety of ways,
including:
Improved access to good quality education for many who were not being
served;
Targeting disadvantaged groups and poor areas;
Enabling developmental gains and improvement of the quality of life
associated with education, especially with the education of girls.

51
III Actions Taken by World Bank, Government and Technical Assistance22
3.1 Assessment of WB Performance. The performance of the Bank has been assessed as
follows:
WB supported MOE on project appraisal & planning
The Bank conducted regular supervisory missions during project
implementation.
The Bank also recognized the need to restructure the project and to include
an increased level of community participation (CP) in school construction
using Rapid Results Approach (RRA). This led to an increase in the number
of classroom constructed as well as a substantial increase in investments.
The inclusion of RRA consultant in the Bank‘s team during the remaining
three years of the project was essential for the successful completion of this
component.
The project had five Bank Task Team Leaders (TTLs)) during its lifetime.
This provided little continuity for implementation and the rapid turnover
often led to long delays in approving PMU‘s requests and providing no
objections.
The Bank, at times, did not provide timely notification to the PMU of the
TTL changes.
Bank supervision missions did not regularly include safeguards colleagues
until the last year of implementation neither did the PMU sent a reminder,
which meant that safeguards were not regularly supervised and little
attention was paid to the inclusion of safeguards in construction of schools
such as fencing for schools, due to price escalation in school construction.
This was a major shortcoming in the Bank‘s supervision and
implementation responsibility.
3.2 Government Actions Assessment. The performance of the Government has been
assessed as follows:
The quality components were effectively implemented.
New curriculum and textbooks were developed.
The textbooks were printed and delivered to schools and copyrights for the
textbooks are owned by the government making it cost effective for future
revision and printing.
The teacher training components met the project targets.
Several policy studies were completed under the project, e.g. a master plan
for teacher development; an ICT strategy for education; a technical and
vocational education and training (TVET); and a girls‘ education strategy.
Implementation of the project was delayed mostly related to construction of
schools.
22 ESIP-Implementation Completion Mission Draft Aide-Memoire, August 22 – September 2, 2011

52
The overall coordination between the PMU and MoE units was effective.
However, there could be better sharing of data and documentation.
School level data have been collected. EMIS is not fully operational
however suggesting annual school data could have been more timely and
reliable.
The key lessons learned are summarized as follows:
Community participation in school construction needs to be encouraged.
Development of realistic cost estimates based on country context in
advance can reduce the risk of not attaining the project outputs and stated
objectives. The cost comparison made between Eritrea and other sub-
Saharan countries was not appropriate.
Development of appropriate safeguard policies, procedures and instruments
are essential prerequisites for an effective guidance of project during its
implementation.
Strict adherence to safeguard requirements coupled with careful follow-up,
supervision and monitoring of project implementation guarantees stated
objectives.
3.3 Other Organizations Performance Assessment.
Major Partners include, Ministry of Public Works, Ministry of Land Water and Environment,
Bank of Eritrea, etc. The performance of most of the partners was commendable. However,
some delays and inefficiencies have been witnessed by some of the partners during
implementation.

53
Annex 8. Comments of Cofinanciers and Other Partners/Stakeholders
Not applicable.

54
Annex 9. List of Supporting Documents
World Bank. Project Appraisal Document. Report Number 25909-ER. Washington, DC,
2003
World Bank. Project Paper on a proposed restructuring. Report Number 40253-ER.
Washington, DC, 2007
UNMEE website: http://www.un.org/en/peacekeeping/missions/past/unmee/index.html
World Bank. Aide memoires of missions between April 2003 and August 2011.
Ministry of Education. Basic Education Statistics 2000/2001 until 2009/2010
Ministry of Education. Essential Education Indicators 2000/2001 until 2009/2010
National Statistics and Evaluation Office & ORC Macro. Eritrea Demographic and Health
Survey 2002.
World Bank. Eritrea Education and Training Sector Note. Report Number 24448-ER,
Washington, DC, 2002
World Bank. School Construction Strategies for Universal Primary Education in Africa:
Should Communities be Empowered to Build Their Schools? Africa Human Development
Series. ISBN: 978-0-8213-7720-8. Theunynck, Serge (2009).
World Bank. Eritrea Country Assistance Strategy. Report Number 15324-ER. Washington,
DC, 1996
World Bank. Eritrea Interim Strategy Note. Report Number 31665-ER. Washington, DC,
2005.
Ministry of Education. Eritrea Education Sector Development Program. Asmara, 2005
Ministry of Education. Annual and Semi-Annual Progress Reports. Asmara (2009, 2010,
2011).
ICR mission economic analysis. Mission Report. Majgaard, Kirsten. 2011
Initial review and recommendations for MLA II. Mission Report. Cartwright, Fernando. 2011.
Consultant Architect report for ICR. Mission Report. Wiebe, Harry. 2011.

55
Annex 10. ICR Mission Project Outcome Analysis
1. Project Outcomes: Although most of the PDO indicators did not achieve their
targets, the project did contribute to considerable improvements in the learning conditions of
students in elementary, middle and secondary schools:
As a result of the many new classrooms built, the pupil-classroom ratio reached more
acceptable levels at all levels of schooling, and the share of elementary schools using
double-shifting dropped;
As a result of teacher training, the share of qualified teachers grew at all levels of
schooling and the share of expatriate teachers in secondary schools declined;
The (official) gross enrollment rates for elementary and middle school both increased
by 4-5 percentage-points and the (official) primary completion rate grew by 6
percentage-points (note: the calculation of these indicators depend on best
available—but unreliable—population data);
There was a considerable improvement in student flow patterns through a drop in
repetition at all levels of schooling and a lowering of dropout from middle schools;
and
There was a substantial increase in the share of girls enrolled in secondary schools.
2. Appropriateness of the Results Framework: The PDO indicators concerning
student enrollments were somewhat appropriate and the targets defined in the PAD were
reasonable given the scope of the project. It was not appropriate to include learning outcomes
as a PDO indicator in this project since it mainly financed an expansion of the education
system. At restructuring, the targets for several of the PDO indicators, particularly
enrollments and share of girls, were raised substantially without sufficient justification. The
new targets did not reflect the scope of the project, in terms of number of classrooms built
and number of girls supported through grants. This contributed to the PDO indicators not
being met.
3. Project Efficiency. The project did achieve a reduction in the unit cost of school
construction compared with unit construction costs before the project. This was achieved as a
result of several rounds of design changes. However, the cost reduction was not as large as
expected and school construction unit costs in Eritrea remain high compared with
neighboring countries. This can be explained by the fact that the factors that contributed to
high costs before the project are largely still present today. Some of these include exchange
rate distortions, since the currency is not free-floating, and centralized price-setting of
imported materials. The new lower-cost school designs remain with the PMU, which will
continue to manage school construction in Eritrea after the project, so the new designs and
efficiency gains are likely to be sustainable.
4. Other unit costs such as the cost of school furniture procured under ESIP come in
very high, but these costs are also subject to price and exchange rate distortions, as the
materials for the furniture were imported, although the production itself was local. The
development, production and procurement of textbooks, on the other hand, was done very
efficiently in the project, continuing a tradition of efficient textbook production as described
in the 2003 PAD.
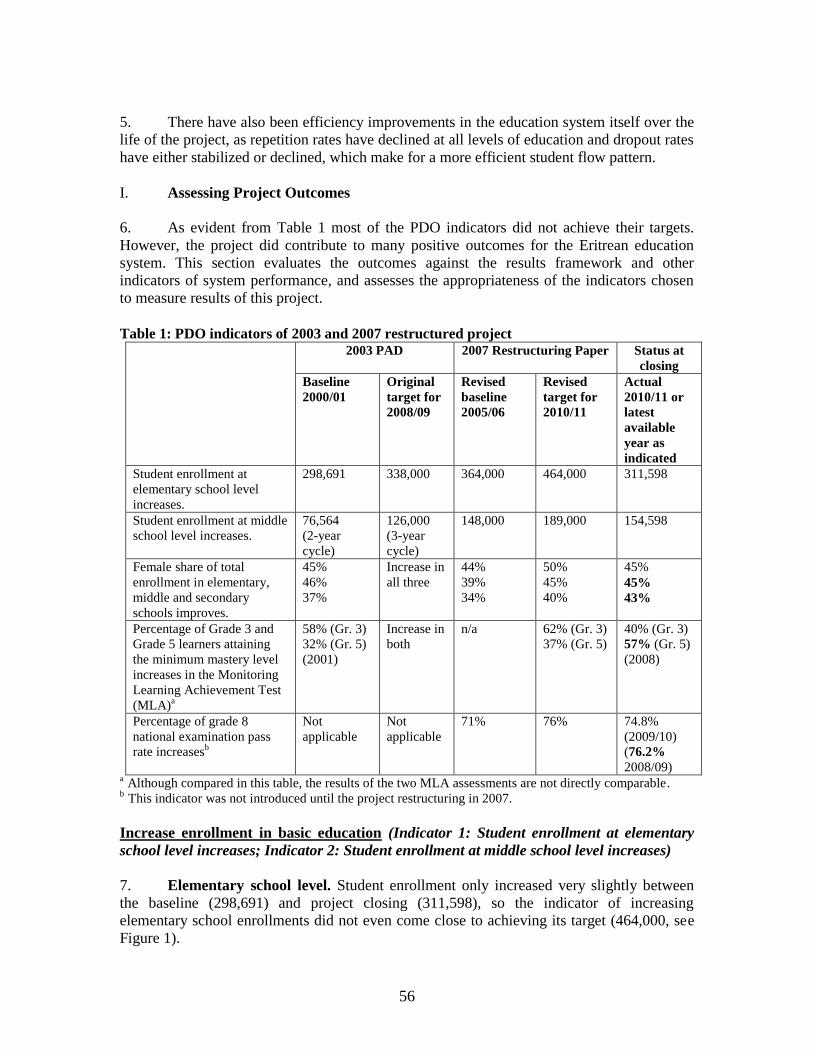
56
5. There have also been efficiency improvements in the education system itself over the
life of the project, as repetition rates have declined at all levels of education and dropout rates
have either stabilized or declined, which make for a more efficient student flow pattern.
I. Assessing Project Outcomes
6. As evident from Table 1 most of the PDO indicators did not achieve their targets.
However, the project did contribute to many positive outcomes for the Eritrean education
system. This section evaluates the outcomes against the results framework and other
indicators of system performance, and assesses the appropriateness of the indicators chosen
to measure results of this project.
Table 1: PDO indicators of 2003 and 2007 restructured project
2003 PAD 2007 Restructuring Paper Status at
closing
Baseline
2000/01
Original
target for
2008/09
Revised
baseline
2005/06
Revised
target for
2010/11
Actual
2010/11 or
latest
available
year as
indicated
Student enrollment at
elementary school level
increases.
298,691 338,000 364,000 464,000 311,598
Student enrollment at middle
school level increases.
76,564
(2-year
cycle)
126,000
(3-year
cycle)
148,000 189,000 154,598
Female share of total
enrollment in elementary,
middle and secondary
schools improves.
45%
46%
37%
Increase in
all three
44%
39%
34%
50%
45%
40%
45%
45%
43%
Percentage of Grade 3 and
Grade 5 learners attaining
the minimum mastery level
increases in the Monitoring
Learning Achievement Test
(MLA)a
58% (Gr. 3)
32% (Gr. 5)
(2001)
Increase in
both
n/a 62% (Gr. 3)
37% (Gr. 5)
40% (Gr. 3)
57% (Gr. 5)
(2008)
Percentage of grade 8
national examination pass
rate increasesb
Not
applicable
Not
applicable
71% 76% 74.8%
(2009/10)
(76.2%
2008/09) a Although compared in this table, the results of the two MLA assessments are not directly comparable. b This indicator was not introduced until the project restructuring in 2007.
Increase enrollment in basic education (Indicator 1: Student enrollment at elementary
school level increases; Indicator 2: Student enrollment at middle school level increases)
7. Elementary school level. Student enrollment only increased very slightly between
the baseline (298,691) and project closing (311,598), so the indicator of increasing
elementary school enrollments did not even come close to achieving its target (464,000, see
Figure 1).
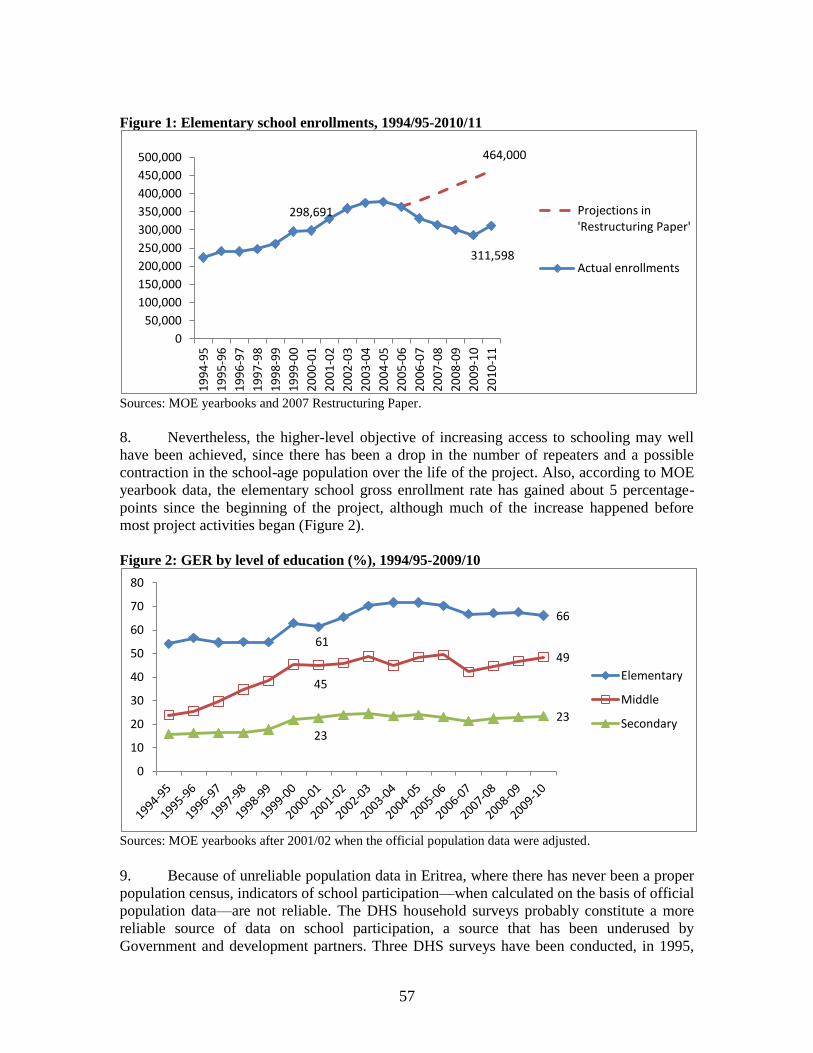
57
Figure 1: Elementary school enrollments, 1994/95-2010/11
Sources: MOE yearbooks and 2007 Restructuring Paper.
8. Nevertheless, the higher-level objective of increasing access to schooling may well
have been achieved, since there has been a drop in the number of repeaters and a possible
contraction in the school-age population over the life of the project. Also, according to MOE
yearbook data, the elementary school gross enrollment rate has gained about 5 percentage-
points since the beginning of the project, although much of the increase happened before
most project activities began (Figure 2).
Figure 2: GER by level of education (%), 1994/95-2009/10
Sources: MOE yearbooks after 2001/02 when the official population data were adjusted.
9. Because of unreliable population data in Eritrea, where there has never been a proper
population census, indicators of school participation—when calculated on the basis of official
population data—are not reliable. The DHS household surveys probably constitute a more
reliable source of data on school participation, a source that has been underused by
Government and development partners. Three DHS surveys have been conducted, in 1995,
464,000
298,691
311,598
0
50,000
100,000
150,000
200,000
250,000
300,000
350,000
400,000
450,000
500,000
19
94
-95
19
95
-96
19
96
-97
19
97
-98
19
98
-99
19
99
-00
20
00
-01
20
01
-02
20
02
-03
20
03
-04
20
04
-05
20
05
-06
20
06
-07
20
07
-08
20
08
-09
20
09
-10
20
10
-11
Projections in 'Restructuring Paper'
Actual enrollments
61
66
45
49
23
23
0
10
20
30
40
50
60
70
80
Elementary
Middle
Secondary
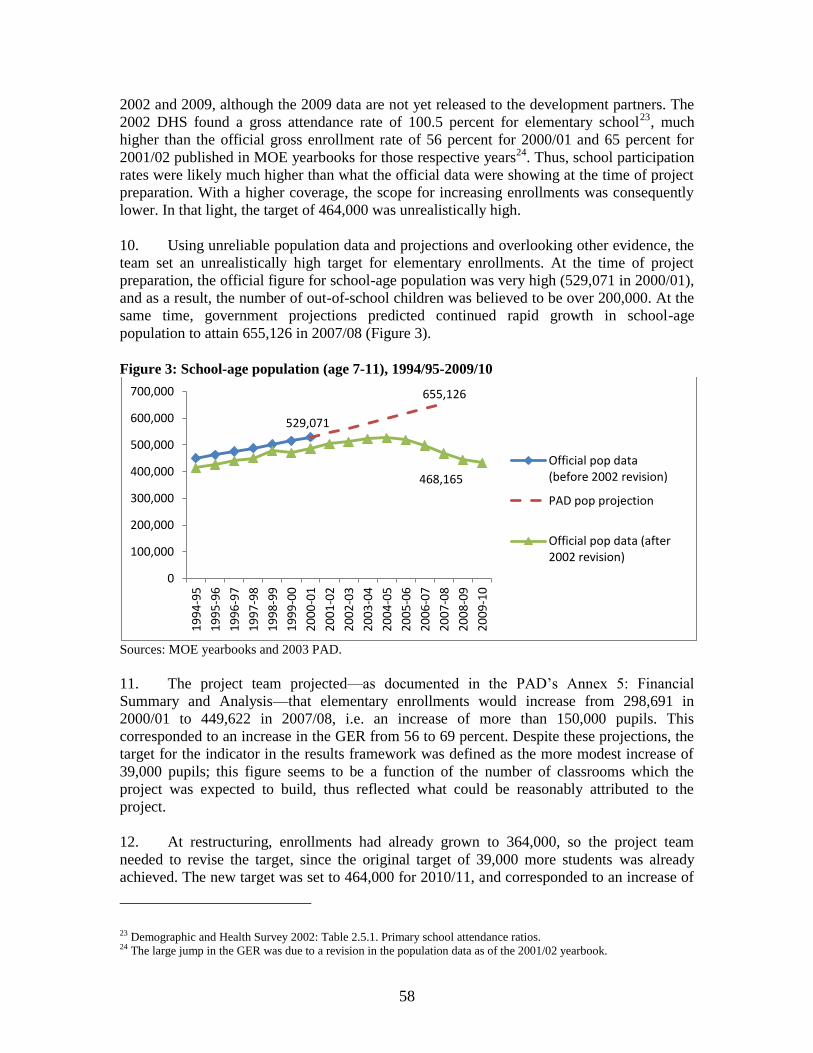
58
2002 and 2009, although the 2009 data are not yet released to the development partners. The
2002 DHS found a gross attendance rate of 100.5 percent for elementary school23, much
higher than the official gross enrollment rate of 56 percent for 2000/01 and 65 percent for
2001/02 published in MOE yearbooks for those respective years24. Thus, school participation
rates were likely much higher than what the official data were showing at the time of project
preparation. With a higher coverage, the scope for increasing enrollments was consequently
lower. In that light, the target of 464,000 was unrealistically high.
10. Using unreliable population data and projections and overlooking other evidence, the
team set an unrealistically high target for elementary enrollments. At the time of project
preparation, the official figure for school-age population was very high (529,071 in 2000/01),
and as a result, the number of out-of-school children was believed to be over 200,000. At the
same time, government projections predicted continued rapid growth in school-age
population to attain 655,126 in 2007/08 (Figure 3).
Figure 3: School-age population (age 7-11), 1994/95-2009/10
Sources: MOE yearbooks and 2003 PAD.
11. The project team projected—as documented in the PAD‘s Annex 5: Financial
Summary and Analysis—that elementary enrollments would increase from 298,691 in
2000/01 to 449,622 in 2007/08, i.e. an increase of more than 150,000 pupils. This
corresponded to an increase in the GER from 56 to 69 percent. Despite these projections, the
target for the indicator in the results framework was defined as the more modest increase of
39,000 pupils; this figure seems to be a function of the number of classrooms which the
project was expected to build, thus reflected what could be reasonably attributed to the
project.
12. At restructuring, enrollments had already grown to 364,000, so the project team
needed to revise the target, since the original target of 39,000 more students was already
achieved. The new target was set to 464,000 for 2010/11, and corresponded to an increase of
23 Demographic and Health Survey 2002: Table 2.5.1. Primary school attendance ratios. 24 The large jump in the GER was due to a revision in the population data as of the 2001/02 yearbook.
529,071
655,126
468,165
0
100,000
200,000
300,000
400,000
500,000
600,000
700,000
19
94
-95
19
95
-96
19
96
-97
19
97
-98
19
98
-99
19
99
-00
20
00
-01
20
01
-02
20
02
-03
20
03
-04
20
04
-05
20
05
-06
20
06
-07
20
07
-08
20
08
-09
20
09
-10
Official pop data (before 2002 revision)
PAD pop projection
Official pop data (after 2002 revision)

59
5 percent per year since the new baseline year, 2005/06. It is not clear how the team came up
with this revised target as: (a) it does not appear that any detailed projections were made at
the time of restructuring; (b) by then, official population projections were now forecasting
declining school-age population so new forecasts would have looked very different than
those of 2003; (c) an education sector plan had been prepared shortly before that predicted
enrollments to grow to 422,662, but this lower target was not mentioned in the restructuring
paper; and (d) results of the 2002 DHS were now available, which indicated a much higher
gross enrollment rate (100.5 percent) and by implication, that official population data were
overestimated. The high target of 464,000 was clearly not a function of the number of
classrooms planned, so perhaps the restructuring team considered this to be more of a
program goal for the Education Sector Plan as a whole than a result of the project alone.
However, such a decision was not clearly laid out in the project documentation.
13. Appropriateness of the targets: The original target set in 2003 was quite reasonable
and based on detailed analysis. In 2007, the restructuring team was forced to raise the target,
since the initial target had already been met. However, the new target was not entirely
supported by the data available at the time. The 2002 DHS came out in 2003 and noted a
rapid decline in birth rates resulting in shrinking birth cohorts (fewer in the 0-4 age group
than in the 5-9 age group). It also noted already high rates of school participation at the
elementary school level (Gross Attendance Rate of 100.5 percent). The restructuring team
should have used these two factors to project that enrollments would be stabilizing or
declining. This would have meant ignoring official population data, but it was widely known
that Eritrea‘s population data were problematic, since this was clearly mentioned in the
World Bank‘s Education and Training Sector Note.25
14. Although the 2003 target was on the whole appropriate, even in 2003, it was known
that Eritrea‘s population data were unreliable. Therefore, the preparation team could have
showed more care in using them for projections, or should at least have explained the
limitations of the population data.
15. Appropriateness of the indicator: The indicator is somewhat appropriate, but given
the problems with the accuracy of the underlying population data in Eritrea, it may have been
better to rely on indicators, such as the number of classrooms built and put to good use, and
to focus indicators on project areas or project schools rather than aggregate targets for the
system as a whole. Ironically, because of the choice of aggregate indicators, the project‘s
M&E system did not even collect data on enrollments in the new schools built under the
project. When the ICR mission asked the MOE for access to school-level enrollment data,
this was also not granted. Although no school-level enrollment data were made available, it is
the impression of the ICR team that project schools are fully enrolled.
25 The 2002 Education and Training Sector Note mentions that the population was probably considerably lower than
the official figure. This is also mentioned in the front matter of the MED yearbooks published at the time, so it was common knowledge that population data were over estimated.

60
16. Although the enrollment indicator was not met, there were many improvements at the
elementary school level over the project period, but the narrow choice of outcome indicators
does not reflect these improvements. Some of these improvements are documented below:
17. Table shows the status at the time of project closing of several indicators related to
elementary schooling that were included in the original results framework, but taken out
during restructuring:
The elementary school completion rate improved from 45 to 51 percent between
2000/01 and 2009/10, but did not achieve the target of 56 percent (however, as
discussed above, these rates are not reliable as they are based on unreliable
population data).
The elementary school repetition rate dropped from 23 to 13 percent between
2000/01 and 2009/10, a very impressive improvement, although it fell short of the
target of 10 percent.
The dropout rate remained at 6 percent, and thus fell short of the 5 percent target.
18. Thus, of the original indicators that were removed at restructuring, a considerable
improvement was made in the elementary school repetition rate.
Table 2: Status of PDO indicators of 2003 project that were not retained in the 2007
restructuring Baseline 2000/01 Original target
for
2008/09
Actual 2010/11 or
latest available
year as indicated
Completion rate in elementary school* 45% 56% 51% (2009/10)
Repetition rates in elementary, middle and
secondary schools
23%
23%
29%
10%
10%
10%
13%
12%
4%
(all 2009/10)
Dropout rates in elementary, middle and
secondary schools
6%
10%
9%
5%
5%
5%
6%
6%
9%
(all 2009/10)
Share of expatriate general secondary
teachers
19% 5% 14.7% (2004/05)
*Due to problems with the underlying population data, as explained in the text, this indicator is not reliable.
The other indicators in this table are more reliable, as they do not depend on population data.
Source: MOE yearbooks ‗Basic Education Statistics and ‗Essential Education Indicators‘ for the years
indicated.
19. During the ICR mission, data were also collected on the evolution in a number of
other indicators over the life of the project. These data are shown in Table 3. In elementary
education, there has been an improvement in the following indicators:
the pupil-classroom ratio improved from 63 to a more acceptable 53 (see Figure 4);
the share of schools that use double-shifting dropped from 56 to 48 percent;
the pupil-teacher ratio improved from 45 to 41; and
the share of qualified teachers improved from 70 to 94 percent (Figure 5).

61
Table 3: Evolution of other relevant indicators of system performance, 2000/01-2010/11 Baseline 2000/01 Actual 2010/11
or latest
available year as
indicated
Result
Elementary
Number of schools 667 833 Improved
Pupil-classroom ratio 63 53 Improved
Share of schools that use double-shifting 56%
(2004-05)
48%
(2009-10)
Improved
Pupil-teacher ratio 45 41 Improved
Share of qualified teachers 70 94 (2009-10) Improved
Middle
Number of schools 142 302 Improved
Pupil-classroom ratio 83 49 Improved
Pupil-teacher ratio 56 42 Improved
Share of qualified teachers 35 61 (2009-10) Improved
Secondary
Number of schools 43 89 Improved
Pupil-classroom ratio 97 67 Improved
Pupil-teacher ratio 54 39 Improved
Share of qualified teachers 73 80 (2009-10) Improved
Source: MOE yearbooks ‗Basic Education Statistics and ‗Essential Education Indicators‘ for years
indicated.
Figure 4: Pupil-classroom ratio in elementary school, 1994/95-2010/11
Source: Calculated based on MOE yearbook data.
62 64 62 60 63 64 63 67 69 70 70 68
61 57
54 51 53
0
10
20
30
40
50
60
70
80
19
94
-95
19
95
-96
19
96
-97
19
97
-98
19
98
-99
19
99
-00
20
00
-01
20
01
-02
20
02
-03
20
03
-04
20
04
-05
20
05
-06
20
06
-07
20
07
-08
20
08
-09
20
09
-10
20
10
-11
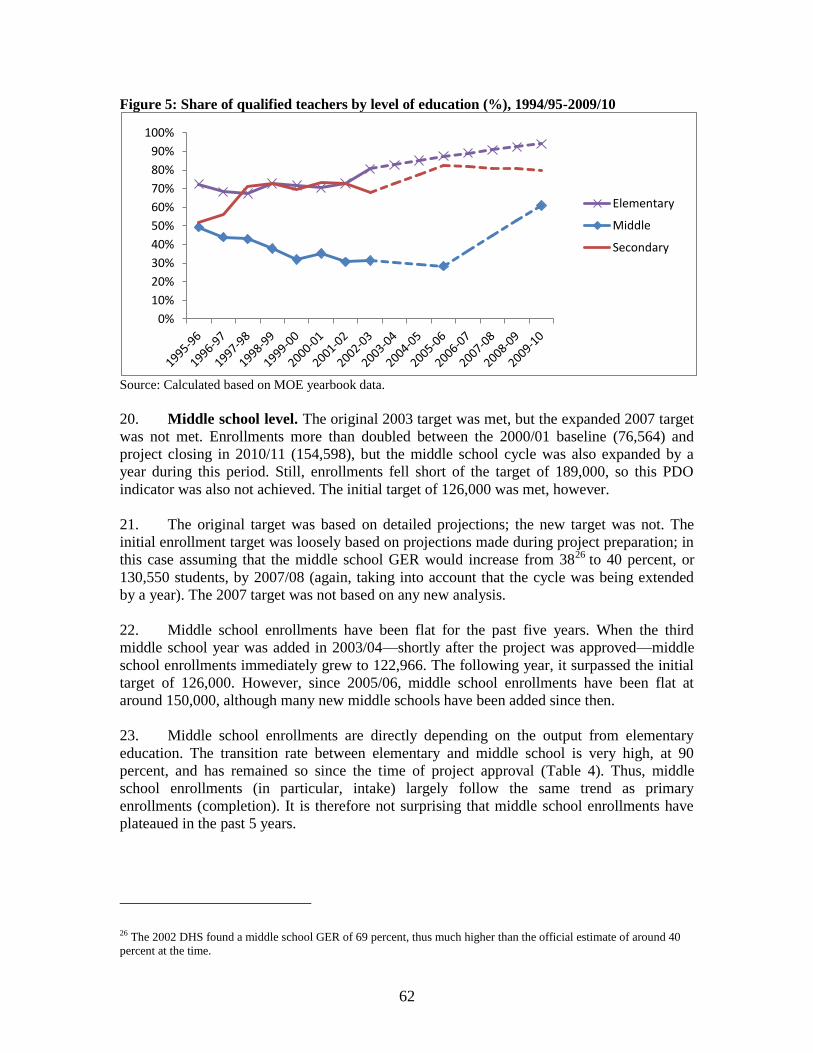
62
Figure 5: Share of qualified teachers by level of education (%), 1994/95-2009/10
Source: Calculated based on MOE yearbook data.
20. Middle school level. The original 2003 target was met, but the expanded 2007 target
was not met. Enrollments more than doubled between the 2000/01 baseline (76,564) and
project closing in 2010/11 (154,598), but the middle school cycle was also expanded by a
year during this period. Still, enrollments fell short of the target of 189,000, so this PDO
indicator was also not achieved. The initial target of 126,000 was met, however.
21. The original target was based on detailed projections; the new target was not. The
initial enrollment target was loosely based on projections made during project preparation; in
this case assuming that the middle school GER would increase from 3826 to 40 percent, or
130,550 students, by 2007/08 (again, taking into account that the cycle was being extended
by a year). The 2007 target was not based on any new analysis.
22. Middle school enrollments have been flat for the past five years. When the third
middle school year was added in 2003/04—shortly after the project was approved—middle
school enrollments immediately grew to 122,966. The following year, it surpassed the initial
target of 126,000. However, since 2005/06, middle school enrollments have been flat at
around 150,000, although many new middle schools have been added since then.
23. Middle school enrollments are directly depending on the output from elementary
education. The transition rate between elementary and middle school is very high, at 90
percent, and has remained so since the time of project approval (Table 4). Thus, middle
school enrollments (in particular, intake) largely follow the same trend as primary
enrollments (completion). It is therefore not surprising that middle school enrollments have
plateaued in the past 5 years.
26 The 2002 DHS found a middle school GER of 69 percent, thus much higher than the official estimate of around 40
percent at the time.
0%
10%
20%
30%
40%
50%
60%
70%
80%
90%
100%
Elementary
Middle
Secondary
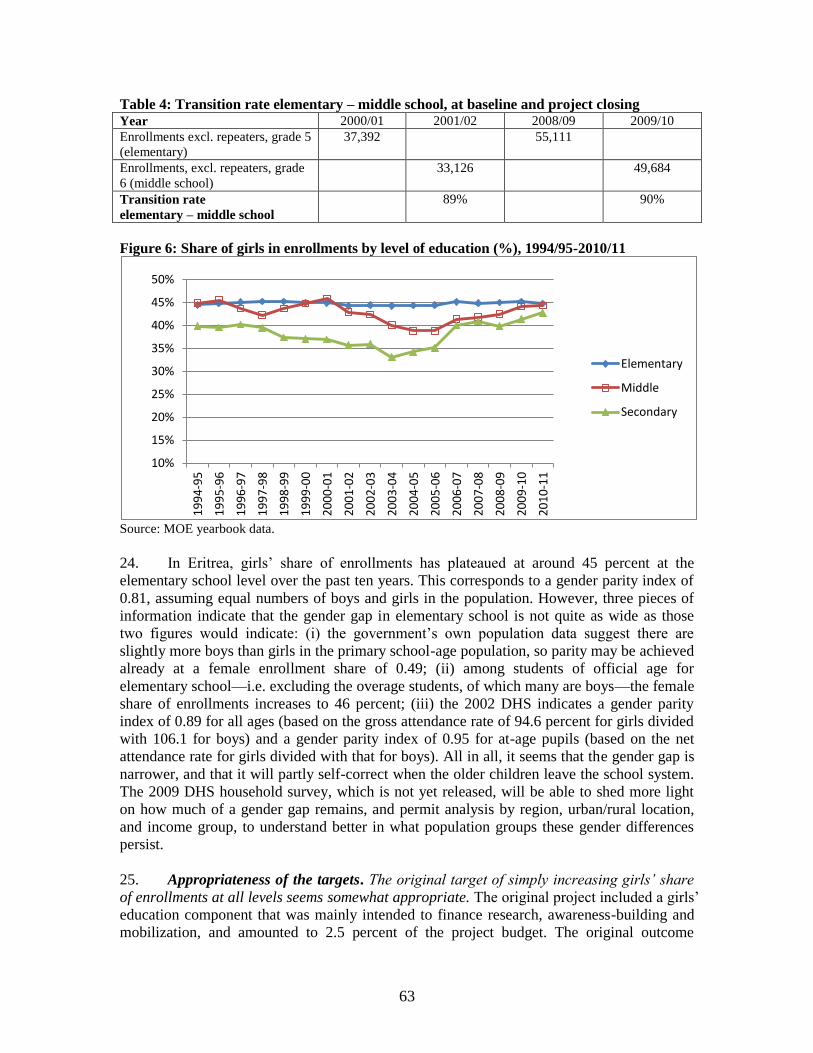
63
Table 4: Transition rate elementary – middle school, at baseline and project closing Year 2000/01 2001/02 2008/09 2009/10
Enrollments excl. repeaters, grade 5
(elementary)
37,392 55,111
Enrollments, excl. repeaters, grade
6 (middle school)
33,126 49,684
Transition rate
elementary – middle school
89% 90%
Figure 6: Share of girls in enrollments by level of education (%), 1994/95-2010/11
Source: MOE yearbook data.
24. In Eritrea, girls‘ share of enrollments has plateaued at around 45 percent at the
elementary school level over the past ten years. This corresponds to a gender parity index of
0.81, assuming equal numbers of boys and girls in the population. However, three pieces of
information indicate that the gender gap in elementary school is not quite as wide as those
two figures would indicate: (i) the government‘s own population data suggest there are
slightly more boys than girls in the primary school-age population, so parity may be achieved
already at a female enrollment share of 0.49; (ii) among students of official age for
elementary school—i.e. excluding the overage students, of which many are boys—the female
share of enrollments increases to 46 percent; (iii) the 2002 DHS indicates a gender parity
index of 0.89 for all ages (based on the gross attendance rate of 94.6 percent for girls divided
with 106.1 for boys) and a gender parity index of 0.95 for at-age pupils (based on the net
attendance rate for girls divided with that for boys). All in all, it seems that the gender gap is
narrower, and that it will partly self-correct when the older children leave the school system.
The 2009 DHS household survey, which is not yet released, will be able to shed more light
on how much of a gender gap remains, and permit analysis by region, urban/rural location,
and income group, to understand better in what population groups these gender differences
persist.
25. Appropriateness of the targets. The original target of simply increasing girls’ share
of enrollments at all levels seems somewhat appropriate. The original project included a girls‘
education component that was mainly intended to finance research, awareness-building and
mobilization, and amounted to 2.5 percent of the project budget. The original outcome
10%
15%
20%
25%
30%
35%
40%
45%
50%
19
94
-95
19
95
-96
19
96
-97
19
97
-98
19
98
-99
19
99
-00
20
00
-01
20
01
-02
20
02
-03
20
03
-04
20
04
-05
20
05
-06
20
06
-07
20
07
-08
20
08
-09
20
09
-10
20
10
-11
Elementary
Middle
Secondary

64
indicator was to increase the share of female enrollments at all levels, without specifying how
large the increase needed to be. This target was not met. Still, it was a modest, appropriate
target for such a small project component.
26. The targets introduced at restructuring were very ambitious, considering the
relatively small scope of the component to support girls education, which never reached
more than 3,000 beneficiaries at any given time. The girls‘ incentives component in the
restructured project never benefited more than a total of 3,000 (elementary, middle, and
secondary school) students. This number is much below the increase in female enrollment
that would be needed to reach the goal of equitable school enrollment. For elementary
education alone, about 15,000 more girls are needed for parity in 2010/11. Thus, the link
between project activities and the targets adopted in the restructured project was weak.
27. Finally, the target should not have been a full 50 percent for elementary education,
since data are never perfect, and the number of girls and boys in the underlying population is
never exactly the same. Therefore, a target higher than 49 percent is unreasonable in an
environment with less than perfect data (for the same reasons, it is widely accepted that a
gender parity index of 0.97 – 1.03 indicates parity).
28. Appropriateness of the indicator. The gender parity index (GPI) is under normal
circumstances a better indicator of gender parity. But in the case of Eritrea, the girls‘ share of
enrollments was an appropriate choice of indicator, given the weaknesses of population data,
which are needed to calculate the GPI.
29. Again, it would have been desirable to ask the M&E unit to collect data at school
level, rather than only at the national aggregate level.
Increase quality in basic and secondary education (Indicator 1: Percentage of Grade 3
and Grade 5 learners attaining the minimum mastery level increases in the Monitoring
Learning Achievement Test (MLA); Indicator 2: Percentage of grade 8 national
examination pass rate increases.
30. Results in the MLA. As described in the Aide Memoire of the ICR mission, the
results in the 2008 MLA are not comparable with the results of the 2001 MLA because the
test instruments are different. Although the two tests had some common test items, the
Ministry has original data files that would be needed to establish a correspondence between
the two tests. There is also not necessarily an expectation that elementary school test scores
have improved. Much of the focus of education policy has been on increasing access and
relieve overcrowding, not on improving quality per se. The large expansion of middle
schooling that happened around the time of project approval also absorbed many of the more
qualified primary teachers into middle schools.
31. Appropriateness of the indicator. This indicator was not appropriate. Since most of
the project financing was invested in school and classroom construction, it was not realistic
to expect an improvement in learning outcomes as a result of the project, although the project
did finance some teacher training and textbook development and printing.
32. Results in the grade 8 national examination pass rate. Because this indicator
varies so substantially from one year to the next, without a clear trend, it seems the grade 8

65
exam is not of the same level of difficulty every year. For example, the pass rate exceeded
the target of 76 percent in 2006/07 and 2008/09, but was below target in 2007/08 and
2009/10 (Table 5). Whether the indicator met its target is inconclusive.
33. Appropriateness of the indicator. Because of the considerable variations from one
year to the next, it does not appear to be a good indicator of system quality/student
performance over time.
Table 5: Grade 8 national examination pass rate, 2005/06-2009/10
School Year Score
2005/06 (baseline) 71
2006/07 82.4
2007/08 72
2008/09 76.2
2009/10 74.8

Erghershatu(2576 m)
D e n a k i l
Hagar NishPlateau
CENTRAL(MAEKEL)
A N S E B A
S O U T H E R NR E D S E A(DEBUB-KEIH-
BAHRI)
NORTHERNREDSEA
S O U T H E R N
(DEBUB)
G A S H - B A R K A
(SEMIEN-KEIH-BAHRI)
Karora
Sala
Andale
Teseney
Um-Hajer
Sebderat
Akurdet
Nakfa
Dekemhare
Idi
Adi Keyh FatumaAreza
Adi Quala
Buia
ASMARA
Keren
Barentu
Mendeferas
Alighede CENTRAL
(MAEKEL)
A N S E B A
S O U T H E R NR E D S E A(DEBUB-KEIH-
BAHRI)
NORTHERNREDSEA
S O U T H E R N
(DEBUB)
G A S H - B A R K A
(SEMIEN-KEIH-BAHRI)
Karora
Sala
Beylul
Andale
Teseney
Um-Hajer
Sebderat
Akurdet
Gulbub
Nakfa
Dekemhare
Jemahit
Idi
Tio
Adi Keyh FatumaAreza
Adi Quala
Ingal
Buia
Keren
Assab
Massawa
Barentu
Mendeferas
ASMARA
SUDAN
DJIBOUTI
REP. OFYEMEN
E T H I O P I A
Bark
a
Anseba
Tekeze
Alighede
Gash
RE
D
SE
A
To Adi Abun
To Kassala
To Port Sudan
To Djoboiti
To Adirgat
To Logiya
D e n a k i l
Dahlac
Archipelago
Hagar NishPlateau
Erghershatu(2576 m)
36°E 38°E 40°E
36°E 38°E 40°E
42°E
42°E
18°N 18°N
16°N
14°N 14°N
ERITREA
0 20 40 60 80
0 20 40 60 80 100 Miles
100 Kilometers
IBRD 33403R
MA
RCH
2007
ER ITREA
SELECTED CITIES AND TOWNS
REGION CAPITALS
NATIONAL CAPITAL
RIVERS
MAIN ROADS
RAILROADS
REGION BOUNDARIES
INTERNATIONAL BOUNDARIES
This map was produced by the Map Design Unit of The World Bank. The boundaries, colors, denominations and any other information shown on this map do not imply, on the part of The World Bank Group, any judgment on the legal status of any territory, o r any endo r s emen t o r a c c e p t a n c e o f s u c h boundaries.