do we really know what makes us happy - a review of the economic literature on the factors...
TRANSCRIPT

Available online at www.sciencedirect.com
Journal of Economic Psychology 29 (2008) 94–122
www.elsevier.com/locate/joep
Do we really know what makes us happy?A review of the economic literature on the
factors associated with subjective well-being
Paul Dolan a,*, Tessa Peasgood a, Mathew White b
a Tanaka Business School, Imperial College London, United Kingdomb Department of Psychology, University of Plymouth, United Kingdom
Received 18 June 2007; received in revised form 5 September 2007; accepted 10 September 2007Available online 19 September 2007
Abstract
There is increasing interest in the ‘‘economics of happiness’’, reflected by the number of articlesthat are appearing in mainstream economics journals that consider subjective well-being (SWB) andits determinants. This paper provides a detailed review of this literature. It focuses on papers thathave been published in economics journals since 1990, as well as some key reviews in psychologyand important unpublished working papers. The evidence suggests that poor health, separation,unemployment and lack of social contact are all strongly negatively associated with SWB. However,the review highlights a range of problems in drawing firm conclusions about the causes of SWB;these include some contradictory evidence, concerns over the impact on the findings of potentiallyunobserved variables and the lack of certainty on the direction of causality. We should be able toaddress some of these problems as more panel data become available.� 2007 Elsevier B.V. All rights reserved.
JEL classification: D60; I31
PsycINFO classification: 2900; 2910
Keywords: Subjective well-being; Happiness; Life satisfaction; Public policy
0167-4870/$ - see front matter � 2007 Elsevier B.V. All rights reserved.
doi:10.1016/j.joep.2007.09.001
* Corresponding author. Tel.: +44 (0)20 759 42 075.E-mail address: [email protected] (P. Dolan).

P. Dolan et al. / Journal of Economic Psychology 29 (2008) 94–122 95
1. Introduction
For the last one hundred years, neoclassical economists have inferred the utility that anindividual derives from goods and services from the decisions that she makes – thepreferences that she reveals – in her market behaviour. This is based on the premise thatindividual utility or well-being is the extent to which the individual’s preferences are sat-isfied. If it is assumed that individuals are rational, fully informed and seek to maximiseutility, then the choices they make are those that, by definition, maximise expected utility.
However, economists and psychologists have become increasingly concerned that pref-erences are often not a very good guide of the well-being associated with the consequencesof choices, and are turning to alternative ways of thinking about and measuring utility.Self-reported measures of utility are more familiar within psychology. Subjective well-being (SWB) is often used by psychologists as an umbrella term for how we think and feelabout our lives (see Diener, Suh, Lucas, & Smith, 1999). Despite earlier concerns, theseappear to be relatively robust indicators of a person’s SWB (Dolan & White, 2007). Ratherthan the ‘decision utility’ approach of revealed preferences (as reflected in market behav-iour) or stated preference studies (e.g. using the contingent valuation method), SWB takesan individual’s well-being to be their overall assessment of their life (Sumner, 1996).
Through the analysis of large datasets, economists and psychologists have gainedimportant insights into the determinants of SWB, such as the effect of income and relativeincome (Clark & Lelkes, 2005) and the possible effects of the trade-offs between inflationand unemployment (Di Tella, MacCulloch, & Oswald, 2001). Studies on the determinantsof well-being adopt the general form:
SWBreport ¼ rðhÞ
where the self-reported SWB, often a response to a single life satisfaction or overall hap-piness question, is some reporting function (r) of true SWB (h), and true SWB is deter-mined by a range of social, economic and environmental factors (X’s). This is usuallymodelled empirically as an additive function:
SWBit ¼ aþ b1X 1it þ b2X 2it þ � � � þ eit
where individual differences in reporting are captured within the error term.How SWB responses are treated differs across studies: some empirical work treats SWB
responses as cardinal whilst others respect the strict ordinality of the data and treat trueSWB as a latent variable (analysed by ordered logit or probit). However they are esti-mated, interpreting the coefficients from empirical work relies upon the assumptionswithin the model; critically, that causality runs from explanatory to dependent variable,and that no unobserved variables are correlated with the included explanatory variables.
This paper reviews the evidence relating to how a range of personal, economic andsocial factors are associated with SWB. We make no substantive claims about the superi-ority of SWB over preferences as a representation of individual utility but rather seek toprovide fresh insights into the determinants of SWB so that others can more fully considertheir relevance to policy, etc. We focus our review on analyses of large datasets and, assuch, we do not consider the results from studies conducted by Kahneman, Krueger, Schk-ade, Schwarz, and Stone (2004), for example, which measure well-being as the aggregationof mood over the course of day. The measures of SWB we review here are ‘experienced’ inthe sense that individuals assess how well life is going but these assessments do not have to

96 P. Dolan et al. / Journal of Economic Psychology 29 (2008) 94–122
be duration-weighted aggregations of well-being over time in the way that Kahneman’sconception of ‘experienced utility’ does (Kahneman, Wakker, & Sarin, 1997).
A significant review of the economic literature was conducted by Frey and Stutzer(2002) but, since then, the number of studies exploring SWB has burgeoned. In particular,there are now many more papers using panel data, which allow us to shed more light onthe vexing issue of causality than was possible five years ago and control for time-invariantindividual effects, such as personality. Our aim is to provide economists, psychologists andother researchers interested in SWB the opportunity to learn more about the state-of the-art research being carried out in the economics literature, including the measures and ana-lytical techniques used as well as emerging results. The degree to which such evidence isrobust and provides any suggestions about causality is given particular emphasis.
In Section 2, we present the review strategy and in Section 3, we present the results ofthe review. In Section 4, we consider some implications of the findings. One firm conclu-sion that can be drawn is that the existing evidence base is not quite as strong as some peo-ple may have suggested and there are some important avenues for future research thatcould be explored with the existing panel datasets. This, in addition to the lack of clearevidence on causality, makes it difficult to make clear policy recommendations at thisstage. Nevertheless, our findings suggest researchers – and perhaps policy makers too –should be aware of the impact of income, relative income, health, personal and communityrelationships and employment status in their analyses.
2. Review strategy
Although a number of reviews of the correlates of SWB have been conducted on thepsychological literature (e.g. Diener & Seligman, 2004), these tend to rely on a great manysmall scale studies, where the list of factors associated with SWB reflect the interest of psy-chologists (e.g. personality), where generalisability is questionable and where the possibil-ity for isolating the impact of one factor upon SWB through controlling for other factorsis limited. Therefore, our focus is on research conducted on large datasets where more fac-tors can be considered and controlled for. There were four strands to the search strategy.The first was to identify all original papers that explored the determinants of SWB pub-lished in economics journals since 1990 (there were very few rigorous analyses before thisdate) and up to January 2006 via ‘Econlit’ using the search terms: ‘subjective well-being’,‘happiness’ and ‘life satisfaction’. Whilst satisfaction with certain aspects of well-being (jobsatisfaction, relationship satisfaction, health satisfaction), are important to understandingwell-being, they are not a full measure of individual well-being, and are therefore not thefocus of this work. Papers that did not contain original data analysis or focused on an out-come measure which was only part of subjective well-being were excluded.
Although our primary focus was on the economics literature, we were aware that sev-eral recent papers in psychology used the same large-scale datasets as economists and sim-ilar analytical techniques. To investigate these cross-disciplinary overlaps, the secondstrand of the literature search was to locate this collection of papers (identified via ‘Psy-chinfo’) using the same search terms as above with the names of the datasets identifiedvia the search on economics journals. Third, for comprehensiveness, we identify all reviewsof the psychology literature on the causes and correlates of well-being published since 2000(later reviews build on earlier ones so the most recent evidence is most relevant here).Finally, we identified significant grey literature, which contains original data analysis,

P. Dolan et al. / Journal of Economic Psychology 29 (2008) 94–122 97
from the key economists working on SWB. This search strategy identified a total of 153papers.
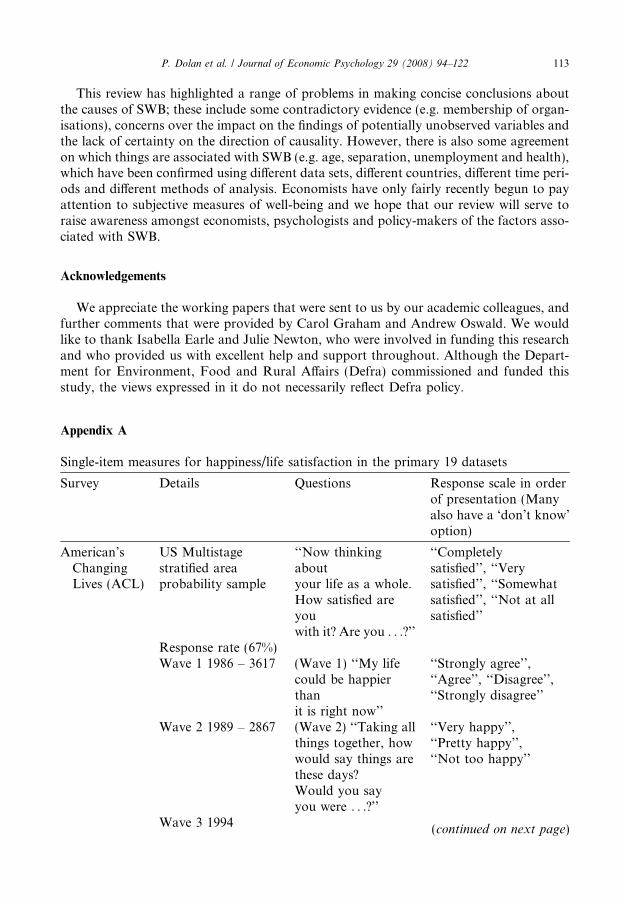
Together, this review strategy revealed 19 major national and cross-national data setsthat included measures of SWB. Many of these used only a single, or sometimes two,single item measures. A full list of these questions and response formats by survey canbe seen in Appendix A. A typical example is from the British Household Panel Survey(BHPS), ‘‘How satisfied are you with your life overall’’ (1 ‘‘Not satisfied at all’’ to 7 ‘‘Com-pletely satisfied’’). In addition to these single item measures, some surveys, for instance theBHPS and the Midlife in the US (MIDUS) survey have included SWB scales composed ofmore than one item. These have included the Positive and Negative Affective Scale(PANAS, Watson, Clark, & Tellegen, 1988), the Satisfaction with Life Scale (SWLS, Die-ner, Emmons, Larson, & Griffin, 1985), and the General Health Questionnaire (GHQ,Goldberg & Williams, 1988) often in a short form (e.g. GHQ12) which also contains sev-eral items measuring SWB.
The papers were reviewed according to a template where consideration is given to thedataset and sample used, the specific measure of well-being used, the statistical and econo-metric analysis conducted, and the findings relating to the correlates with, and causes of,well-being. We give less weight to correlation studies that do not control for other vari-ables and give greatest weight to the limited but increasing number of studies that controlfor unobserved individual effects (this is usually done by fixed effects models using paneldata which allow us to control for unobserved individual-specific effects which may be cor-related with other explanatory variables). Further details of the review strategy, and sum-maries for all the studies, are available from the authors upon request.
3. Review results
We have considered all the potential influences on well-being that have been identifiedin the literature. These fall under seven broad headings: (1) income; (2) personal charac-teristics; (3) socially developed characteristics; (4) how we spend our time; (5) attitudesand beliefs towards self/others/life; (6) relationships; and (7) the wider economic, socialand political environment. Of course, many of the characteristics may interact with oneanother and so we highlight any important interaction effects where the evidence is avail-able. In some cases (e.g. in relation to age and gender), we present results that can befound in the papers we review but which do not form the focus of the authors’ ownanalyses.
3.1. Income
This is a very complex area where much research has been undertaken. Clark, Frijters,and Shields (2007) provide a comprehensive review of the relationship between income andSWB, and so we provide only a brief overview here. The results generally suggest positivebut diminishing returns to income. Some of this positive association is likely to be due toreverse causation, as indicated by studies which show higher well-being leading to higherfuture incomes (Diener, Lucas, Oishi, & Suh, 2002; Graham, Eggers, & Sukhtankar, 2004;Marks & Flemming, 1999; Schyns, 2001), and some is likely to be due to unobserved indi-vidual characteristics, such as personality factors, as indicated by studies which find a

98 P. Dolan et al. / Journal of Economic Psychology 29 (2008) 94–122
reduced income effect after controlling for individual effects (Ferrer-i-Carbonell & Frijters,2004; Luttmer, 2005).
Studies that have included relative income (defined in a range of different ways with arange of different reference groups) suggest well-being is strongly affected by relativities(Dorn, Fischer, Kirchgassner, & Sousa-Poza, 2007; Ferrer-i-Carbonell, 2005; Luttmer,2005; Weinzierl, 2005). This suggests that additional income may not increase well-beingif those in the relevant comparison group also gain a similar increase in income. However,increases in income that result in increases in tax yield, which could be used to fund publicservices that may themselves enhance well-being. For a given income level, having highaspirations and expectations have a negative effect on SWB (Macdonald & Douthitt,1992; Stutzer, 2004). Aspirations themselves appear to be driven in part by past incomes,implying adaptation to higher levels of income (Stutzer, 2004; Di Tella, Haisken-De New,& MacCulloch, 2005). The importance of aspirations reinforces findings that the percep-tions of financial status have stronger predictive power than actual income (Haller &Hadler, 2006; Johnson & Krueger, 2006; Wildman & Jones, 2002). These findings implythat additional income for those who are not at low levels of income is unlikely to increaseSWB in the long run if the additional income serves to increase expectations of necessaryincome.
As noted by Easterlin (1995), if the relative income effect dominates the absoluteincome effect, this would explain why cross section data show that wealthier individualswithin a society are happier, but that average SWB levels remain constant as all membersbecome wealthier. However, positive correlations between average SWB and nationalincome found in international cross section data, particularly in lower income countrysamples (Di Tella, MacCulloch, & Oswald, 2003; Fahey & Smyth, 2004; Helliwell,2003; Rehdanz & Maddison, 2005), requires either that comparisons of relative positionare made across nations, or that an absolute income effect operates in many countries.Evidence on international relative income effects is limited. Fahey and Smyth (2004)argue that the significance of GDP quartile when holding income constant suggests thatrelatives between countries matters. Graham and Felton (2006) analyse Latin Americanresponses in which people are asked to place themselves on a ladder where one stands forthe poorest level of society and ten the richest and found that average country wealthincreases responses suggesting individuals compare themselves to a society external totheir own country and ‘‘people in part judge themselves by their place in the internationalsphere’’.
3.2. Personal characteristics (who we are, our genetic makeup)
3.2.1. Age
Studies consistently find a negative relationship between age and SWB and a positiverelationship between age squared and SWB (e.g. Blanchflower & Oswald, 2004a; Ferrer-i-Carbonell, & Gowdy, 2007). Studies suggest a U-shaped curve with higher levels ofwell-being at the younger and older age points and the lowest life satisfaction occurringin middle age, between about 32 and 50 years, depending on the study. Easterlin (2006)notes that this U-shaped relationship found when many age-related differences in lifecircumstances (income, health, employment, etc.) have been controlled for may bemisleading since it says little about how the SWB of young and old compare to those atmiddle age.

P. Dolan et al. / Journal of Economic Psychology 29 (2008) 94–122 99
3.2.2. Gender
Women tend to report higher happiness (Alesina, Di Tella, & MacCulloch, 2004) butworst scores on the GHQ (Clark & Oswald, 1994), although a few studies report no genderdifferences (e.g. Louis & Zhao, 2002) even using the same datasets. This suggests that othercorrelates may also be more important than gender per se given that different studies havedifferent control variables. Indeed, when specific subsets are examined, such as those whocannot work due to health problems (Oswald & Powdthavee, 2006) or those who provideinformal care for others (van den Berg & Ferrer-i-Carbonell, forthcoming), the gendereffect often disappears.
3.2.3. Ethnicity
In the US, whites have higher SWB than African Americans (Thoits & Hewitt, 2001).There is also some suggestion that ethnicity may interact with age (or cohort, which is dif-ficult to distinguish), since older respondents tend to show less differences as a function ofethnicity (Baker, Cahalin, Gerst, & Burr, 2005; Greenfield & Marks, 2004). Comparingwhites to the category ‘‘Other’’ may not be particularly helpful since it is hard to interpretnull effects such as those reported by Theodossiou (1998) using the BHPS. One reason isthat some ethnicities, in particular Hispanics (Luttmer, 2005), tend to show higher levels ofSWB than whites and thus the outcome of the comparison may depend upon the propor-tion of different ethnic groups within this ‘‘Other’’ category.
3.2.4. Personality
A considerable amount of psychological research has considered the relationshipbetween personality and SWB (for a review see, DeNeve & Cooper, 1998). However,few studies have examined this relationship using large scale surveys of the kind includedin our review. Using the WVS data, Helliwell (2006) found a very moderate relationshipbetween personality and SWB once other factors such as social trust and religious beliefswere controlled for. People higher in self-esteem seem less likely to suffer from depression.In addition, many of the sub-scales of the GHQ, which could also be interpreted as per-sonality variables (e.g. self-worth), correlate positively with life satisfaction using the UK,BHPS data (Ferrer-i-Carbonell & Gowdy, 2007).
3.3. Socially developed characteristics
3.3.1. Education
Some studies find a positive relationship between each additional level of educationand SWB (e.g. Blanchflower & Oswald, 2004b), while others find that middle level edu-cation is related to the highest life satisfaction (e.g. Stutzer, 2004). However, there issome evidence that education has more of a positive impact on low income countries(Fahey & Smyth, 2004; Ferrer-i-Carbonell, 2005). Flouri (2004) finds no significant rela-tionship with the GHQ in the BHPS, and some studies find that education is associatedwith worse GHQ scores (e.g. Clark, 2003a).
Education qualifications may be related to unobservable traits at the individual level,such as motivation, intelligence or family background and so ideally we should look tothose studies which control for unobserved heterogeneity. However, fixed effects modelscan only pick up the effect of individuals completing their education or returning to

100 P. Dolan et al. / Journal of Economic Psychology 29 (2008) 94–122
education at a later date and most adult survey respondents are unlikely to changetheir education level during their time in a panel survey, and consequently fixed effectsmodels are unlikely to find any significant effect for education (e.g. Meier & Stutzer,2006).
In addition, the coefficient on education is often responsive to the inclusion of othervariables within the model. Education is likely to be positively correlated with incomeand health, and if these are not controlled for we would expect the education coefficientto be more strongly positive. For example, the positive effect of education on overall hap-piness found by Blanchflower and Oswald (2004a) could be picking up a health effect sincethis is not controlled for. However, the inclusion of variables correlated with education ascontrols raises a further problem – if the correlation is due in part to a causal path fromeducation to, say higher income, then fully controlling for income will underestimate thefull contribution which education is making to well-being.
To the extent that education has caused greater income and health, we would ideallywish to include this fact in the effect of education. The indirect effect of education onSWB via health is explored by Bukenya, Gebremedhin, and Schaeffer (2003) on US dataand Gerdtham and Johannesson (2001) on Swedish data. They both find that the positivecoefficient on high school and attending college increases by about one third from the stan-dard model, which suggests that this indirect effect is considerable. Graham and Pettinato(2001) find that years of education increases overall happiness in Latin America, but thatthe effect becomes non-significant once social mobility and relative economic standing isincluded, which indicates that the benefits to education may be positional rather thanabsolute.
3.3.2. Health
Studies consistently show a strong relationship between SWB and both physical andpsychological health. Psychological health appears to be more highly correlated withSWB than physical health but this is not surprising given the close correspondencebetween psychological health and SWB. Some of the association may be caused by theimpact that well-being has on health but the effect sizes of the health variables are substan-tial suggesting that even accounting for the impact of SWB on health, health is stillimpacting on SWB. Furthermore, specific conditions, such as heart attacks and strokesreduce well-being (Shields & Wheatley Price, 2005), and the causality here is most likelyto be from the health condition to SWB. Of course, a third factor (such as personality)may be related to both SWB and health, and this would make finding a significant rela-tionship between health and SWB more likely. Studies using fixed effects models continueto show a strong effect of health on SWB but they are still unable to control for time var-iant unobservable variables, such as current mood, and using self-rated health as thehealth variable may serve to exacerbate this problem.
Oswald and Powdthavee (2006) present some evidence that individuals adapt somewhatto disability status, finding that the length of time an individual has experienced the dis-ability reduces the negative impact of the disability. However, adaptation is far from com-plete. The fixed effects model finds that disability reduces life satisfaction (on a 1–7 scale)by 0.596 points for those with no past disability, by 0.521 points after 1 year of disability,0.447 points after 2 years and 0.372 after 3 years. An interpretation of adaptation requiresthat the scale is being consistently used throughout the time period, and is independent ofhealth status.
P. Dolan et al. / Journal of Economic Psychology 29 (2008) 94–122 101
3.3.3. Type of work
There is insufficient evidence to draw clear conclusions about the impact of type ofwork on well-being. Given the amount of time people spend at work, this is an area thatrequires more investigation. Some evidence from the UK suggests that casual work is det-rimental to SWB (Bardasi & Francesconi, 2004), and that belonging to a union is benefi-cial to life satisfaction (Blanchflower & Oswald, 1998). There is a little more evidence onself-employment. Many European studies fail to find any significant difference betweenbeing employed and being self employed but Blanchflower and Oswald (1998) find arobust positive effect of self-employment using UK, International (ISSP) and US (GSS)data. Using US and European data, Alesina et al. (2004) find that the positive effect ofself-employment is limited to the rich.
3.3.4. Unemployment
Studies consistently show a large negative effect of individual unemployment on SWB.Models which treat life satisfaction scales as a continuous variable, tend to find that theunemployed have around 5–15% lower scores than the employed (e.g. Di Tella et al.,2001; Frey & Stutzer, 2000, 2002; Helliwell, 2003; Stutzer, 2004). Using European data,Lelkes (2006) found that unemployment reduces the probability of a high life satisfactionscore (at least 8/10) by 19%, and a high overall happiness score by 15%. Data for Switzer-land suggest this reduction may be even higher (Frey & Stutzer, 2000, 2002). Studies whichuse a reduced form model, instrumenting for health, suggest that the full effect size may bean underestimate when health status is controlled for (Bukenya et al., 2003; Gerdtham &Johannesson, 2001). Whilst there are some exceptions to the finding of strong negativeeffect of unemployment (Graham & Pettinato, 2001; Smith, 2003), these may have arisendue to small numbers of unemployed in their data.
The possibility that unhappy people have selected into unemployment has been raisedin the past. Individuals who have low SWB may be more likely to become employed, if forexample, they are less productive, have poorer health or are more likely to choose tobecome unemployed. Lucas, Clark, Georgellis, and Diener (2004) use the GSOEP to showthat people who are later unemployed do not start out with low life satisfaction, and whenin the reaction phase (a year before, the period of unemployment and a year after) theyexperience more than half a point lower life satisfaction on a 0–10 scale. This mirroredWinkelmann and Winkelmann (1998) earlier findings and suggests any selection effectsare minimal. Furthermore, controlling for psychological distress in earlier periods (Korpi,1997) and controlling for individual heterogeneity using fixed effects models, again finds astrongly robust impact of unemployment (e.g. Ferrer-i-Carbonell & Gowdy, 2007; Wein-zierl, 2005; Winkelmann, 2004). Some studies have found a reduction in effect size oncefixed effects are controlled for (Gerlach & Stephan, 1996; Luttmer, 2005; Oswald & Pow-dthavee, 2006), while others have found that it remains virtually identical (Meier & Stut-zer, 2006).
Men have been found to suffer most from unemployment (Clark, 2003a, 2003b; Doc-kery, 2003; Gerlach & Stephan, 1996; Lucas et al., 2004; Theodossiou, 1998) and somestudies also find that the middle aged suffer more than the young or old (Clark & Oswald,1994; Pichler, 2006; Winkelmann & Winkelmann, 1998). Those with higher education suf-fer more in Britain (Clark & Oswald, 1994), those with right wing political leanings in theUS (Alesina et al., 2004) and those in high income countries (Fahey & Smyth, 2004). Inthe UK, Shields and Wheatley Price (2005) find that the impact of unemployment on

102 P. Dolan et al. / Journal of Economic Psychology 29 (2008) 94–122
the GHQ is related to the extent of employment deprivation in the area, with the individ-ual unemployment effect being neutralised in areas with employment deprivation of over22%. Using the BHPS, Clark (2003a) finds that the negative effect of unemployment wouldbe neutralised at a rate of 24%. The same study also finds that, for those working, havingan unemployed partner is detrimental to well-being, but for the unemployed it is beneficial.These findings suggest that the impact may be dependent upon the extent to which theindividual can substitute other activities for work, belong to non-work based social net-works and are able to legitimise their unemployment.
There is some mixed evidence of adaptation to unemployment. Using the BHPS, Clarkand Oswald (1994) find that the negative coefficient on unemployment reduces with thelength of unemployment but, using the GSOEP, Winkelmann and Winkelmann (1998) failto find a duration effect and Lucas et al. (2004) find that individuals who are unemployedfor more than a year experience a more negative reaction to unemployment, and previousunemployment experience does not reduce the harm of current unemployment. They alsofind that once unemployment has ended, individuals do not return to their pre-unemploy-ment levels of life satisfaction. Similarly, Louis and Zhao (2002) find that any period ofunemployment over the last 10 years has a negative impact on a combined general happi-ness scale. The impact of unemployment beyond the current spell alleviates concerns thatlower life satisfaction is being driven by social pressure to report lower life satisfactionduring unemployment.
Using a fixed effects model, Wildman and Jones (2002) find that the negative unemploy-ment coefficient for men, falls from 1.979 points (on a 0–36 GHQ Likert scale), to 0.989once satisfaction with finances and expectations of future financial position is controlledfor. Studies which have controlled for income and found a negative effect of unemploy-ment have interpreted this as a non-financial loss. However, Wildman and Jones (2002)findings suggest that current income may not be the most suitable measure of financialposition, and that some of the damage of unemployment arises due to increased concernsover future finances.
3.4. How we spend our time (the work and activities we engage in)
3.4.1. Hours worked
While the evidence is relatively clear that employment is better than unemployment, therelationship between the amount of work (e.g. number of hours worked) and well-being isless straightforward. Data from the German GSOEP suggests that life satisfaction rises ashours worked increases, controlling for individual fixed effects (Meier & Stutzer, 2006;Weinzierl, 2005). This supports evidence from the UK’s NCDS, which suggests thatpart-time work is associated with lower life satisfaction among men than full-time work(Schoon, Hansson, & Salmela-Aro, 2005). However, other studies report no differencesbetween full-time and part-time work and SWB in the BHPS (Bardasi & Francesconi,2004) or in the GSS or ISSP (Blanchflower & Oswald, 2004a, 2005).
Luttmer (2005) reports a negative relationship between the log of usual working hoursand happiness using the NSFH data. Using the GSOEP, Meier and Stutzer (2006) find aninverse U-shaped curve between life satisfaction and hours worked (including when fixedeffects are controlled for) suggesting that well-being rises as hours worked rise but only upto a certain point before it then starts to drop as hours become excessive. Across all thestudies, there is little consideration given to the type of work undertaken and this could

P. Dolan et al. / Journal of Economic Psychology 29 (2008) 94–122 103
also be an important moderating effect. Of course, the impact of work hours is likely tovary depending upon whether the number of hours worked is voluntarily chosen.
3.4.2. Commuting
In Germany, Stutzer and Frey (2005) find lower life satisfaction with greater commut-ing time (using both normal and fixed effect models) and also find that this does not seemto result in greater well-being for other family members. Research to explore the conse-quences of different types of commuting may help minimise the loss caused by commuting.This research will obviously need to take into consideration a range of other factors (suchas living in a particular area) to see the net effect of commuting on well-being.
3.4.3. Caring for others
The evidence from the few studies that examined the effects of the amount of timeengaged in informal care-giving suggests that more care is associated with worse GHQscores (Hirst, 2003, 2005), lower happiness (Marks, Lambert, & Choi, 2002; van den Berg& Ferrer-i-Carbonell, forthcoming) and more depressive symptoms (Marks et al., 2002).The effects are especially strong for close kin as opposed to non-kin (Marks et al., 2002),which may be due to more hours of kin care-giving or because of greater emotional attach-ment. The transition into and out of care-giving has also been explored. Not surprisingly,transition into care-giving is associated with a range of negative well-being outcomes (Hirst,2005;Marks et al., 2002). Using BHPS data, Hirst (2005) found that women’s GHQ scoreswere also negatively affected by the transition out of a high load care-giving role. It is unclearwhether this is due to the loss of a defined role or because the person being cared for eitherhad to leave the house to receive more professional care (indicating a worsening of the state),or maybe even passed away but the losses in well-being are such that they might be givengreater prominence in debates about informal care in health and social care policy.
Autonomy has been proposed as an essential pre-condition for well-being (Ryan &Deci, 2001) and the losses associated with caring may arise from a loss of autonomyand choice a full-time caring role imposes. However, as noted by Brown, Nesse, Vinokur,and Smith (2003), if the negative impact of personal circumstances were adequatelyaccounted for, then the act of giving help to others may have potentially beneficialimpacts.
3.4.4. Community involvement and volunteeringA positive relationship has been found in some studies between SWB and membership
in (non-church) organisations. Pichler’s (2006) analysis of the ESS found that membershipof more organisations increases life satisfaction. Helliwell (2003) found that both individ-ual involvement in non-church organisation and national average membership of non-church organisations are significantly positively related to life satisfaction in his analysisof 49 countries from the WVS. Helliwell and Putnam (2004) confirm these positive rela-tionships with life satisfaction found in the WVS, noting also that national average mem-bership significantly increases overall happiness but that individual membership does not.In the US Benchmark data, they find a significant positive relationship between individualmembership and overall happiness, but a non-significant (and negative) relationshipbetween national average membership and overall happiness. However, contrasting resultsare found by Li, Pickles, and Savage (2005) who find that civic participation has a negativebut non-significant relationship on life satisfaction in the BHPS and Bjørnskov (2003) who
104 P. Dolan et al. / Journal of Economic Psychology 29 (2008) 94–122
finds that when trust and social norms are controlled for associational activity in the WVShas a strong negative significant effect on life satisfaction. However, Bjørnskov finds thiseffect disappears when regional dummies are left out of the equation.
In terms of volunteering, Haller and Hadler (2006) found no relationship betweenvolunteering and happiness or life satisfaction (across 34 countries using the WVS data).However, Greenfield and Marks (2004) found that among a sub-set of older people,volunteering was associated with more positive affect, more meaning in life, but not lessnegative affect. Furthermore, although Thoits and Hewitt (2001) did find a positive rela-tionship, it also seemed to be the case that happier people tended to do more voluntarywork, questioning the argument that volunteering is the cause of greater well-being.
Meier and Stutzer (2006) take advantage of data from Eastern Germany (GSOEP)where institutional breakdown following the collapse of the German Democratic Republicresulted in a dramatic reduction in volunteering – frequent volunteering falling from 17%to 9% between 1990 and 1992. They find that more regular volunteering (less thanmonthly, monthly and weekly) increases life satisfaction, monotonically. However,although income, employment and personal characteristics were controlled for, trustwas not. The impact of volunteering reduces considerably when fixed effects are controlledfor, and only volunteering weekly remains significant, suggesting part of the higher well-being levels arise from individual heterogeneity (Meier & Stutzer, 2006). Therefore, whilesome observers have claimed that greater community involvement is a win-win situation,providing better outcomes for the community at large and making those involved feel bet-ter about themselves, the evidence we review here suggests more caution is needed.
3.4.5. Exercise
There is evidence that even simple types of exercise such as gardening (Ferrer-i-Carbo-nell & Gowdy, 2007) may be associated with higher life satisfaction and that this may beespecially important for the over 60s (Baker et al., 2005). The amount of time engaged inphysical activity among the over 60s was also negatively associated with depressive symp-toms (Baker et al., 2005). Although a review of the broader literature on exercise and well-being has recently appeared (Biddle & Ekkekakis, 2005), little use has been made of largedatasets and thus there seems to be an important gap in research here. Given that exercisemay not only help to reduce a number of negative outcomes (e.g. weight gain and depres-sive symptoms), but also promote a range of positive ones (e.g. higher levels of happinessand life satisfaction) it would seem to have high policy potential.
3.4.6. Religious activities
The evidence is fairly consistent and suggests that regular engagement in religious activ-ities is positively related to SWB (e.g. Clark & Lelkes, 2005; Hayo, 2004). While somestudies only examine whether or not the person actually attends church, others examinedifferent amounts of time spent in these activities. Using WVS data, Helliwell (2003) findshigher life satisfaction to be associated with church attendance of once or more a week. Asimilar finding is found in Eastern Europe (Hayo, 2004) though less frequent attendancedid not result in higher levels of life satisfaction than no attendance. Contrary to this latterfinding, and using ESS data, Clark and Lelkes (2005) report that church attendance of atleast once a month is enough to have an effect on life satisfaction. However, since atten-dance of once a week or more is included within ‘at least once a month’, the significanteffect may be due to weekly attendance rather than less frequent attendance. There is some

P. Dolan et al. / Journal of Economic Psychology 29 (2008) 94–122 105
evidence to suggest that religious attendance reduces the effect of income on happiness,especially for African Americans (Dehejia et al., 2005).
3.5. Attitudes and beliefs towards self/others/life
3.5.1. Attitudes towards our circumstances
The evidence suggests that perceptions of our circumstances can be very important pre-dictors of life satisfaction. One domain that has been relatively extensively researched isfinancial satisfaction. As might be expected, poorer perceptions of one’s current financialsituation are usually associated with lower life satisfaction (e.g. Graham & Pettinato, 2001;Hayo & Seifert, 2003; Louis & Zhao, 2002). There is also evidence suggesting that percep-tions of change in financial circumstances, as opposed to current circumstances, may alsobe important for well-being. Using the BHPS and controlling for current income, Brown,Taylor, and Wheatley Price (2005) find lower GHQ scores when people perceived theircurrent financial situation to be worse than last year and when next year’s situation is pre-dicted to be even worse (see also Wildman & Jones, 2002). Similar findings are reportedwhen perceptions of job security are examined (e.g. Dockery, 2003; Graham & Pettinato,2001). Importantly, perceptions of financial circumstances appear to fully mediate theeffects of objective circumstances (Johnson & Krueger, 2006) suggesting they have a moredirect influence on global life satisfaction.
3.5.2. Trust
The evidence is relatively clear from the few studies that have looked at trust and theeffects are relatively large. Using WVS and ESS data, Helliwell (2003, 2006) and Helliwelland Putnam (2004) has found that social trust (trust in most other people) is associatedwith higher life satisfaction and happiness, and a lower probability of suicide. For theUK, Li et al. (2005) use a cross-section, ordered logit on BHPS and find neighbourhoodsocial trust increases life satisfaction. Bjørnskov (2007) uses WVS data to show that gen-eralised trust increases life satisfaction, and a social capital factor score (comprised fromprincipal components analysis of responses to generalised trust, civic participation andperceptions of corruption) are robustly positively related to life satisfaction. A changein social capital score of 10% of the distance between the highest and lowest score resultsin an increase in life satisfaction of 4.5%. An equivalent change would require a halving ofinflation or increase in per capita income of about 25%. Moreover, trust in key publicinstitutions such as the police, the legal system and government is also associated withhigher life satisfaction (Helliwell & Putnam, 2004; Hudson, 2006), as are beliefs aboutthe wrongness to cheat on one’s taxes (Helliwell, 2003).
3.5.3. Political persuasion
Few studies have explored the direct effect of holding a particular political view. Oneexception is Graham and Pettinato (2001) who find that preferences for democracy andpro-market values are associated with higher life satisfaction in Latin America and Russia.However, it may be that these attitudes are held by people who have benefited more fromthese systems. Studies have also considered the differential impact of economic and socialcircumstances depending upon political view, via interaction effects. For example, there issome evidence that being unemployed had worse effects on the happiness of ‘‘rightwingers’’ in the US and in Europe inequality was worse for the life satisfaction of ‘‘left

106 P. Dolan et al. / Journal of Economic Psychology 29 (2008) 94–122
wingers’’ and inflation was worse for the life satisfaction of ‘right wingers’ (Alesina et al.,2004). Such results lend support to the idea that the impact of external circumstances isdependent upon perceptions and attitudes.
3.5.4. Religion
Again, the evidence here supports the idea that our beliefs affect our SWB, with reli-gious people generally being happier than non-religious people, irrespective of their faith.Taking perhaps the broadest approach, Helliwell (2003, 2006) reviews WVS data and findsthat belief in a God is associated higher levels of life satisfaction, However, the effects seemto be stronger in the US than in Europe (Helliwell & Putnam, 2004) and are sometimes notfound at all (Smith, 2003).
It seems to make relatively little difference which religion one belongs to (Christian,Judaism, Hinduism, Buddhism, etc.). Reviewing data in the World Database of Happi-ness, Rehdanz and Maddison (2005) found that the average happiness of different coun-tries was not affected by the proportion of the population with different religiousbeliefs. More specifically, Ferris (2002) found no differences in happiness in the US as afunction of whether respondents were Jewish, Catholic or Protestant (see also Cohen,2002). However, there tend to be wide variances in SWB scores within the same religionssuggesting that individual differences are important and it would be unwise to talk simplyabout all Catholics, all Jews, etc. (Haller & Hadler, 2006). For instance, within religionsthere are differences in the strength of people’s beliefs, the degree to which they useGod to help cope with difficulties and their degree of spirituality, all of which have beenfound to be associated with different levels of SWB (Cohen, 2002).
Stronger religious beliefs may also ‘‘insure’’ people against a loss of income or employ-ment (UK data, Clark & Lelkes, 2005) since religious people’s well-being (especially Cath-olics) drops as little as half as non-religious people following these negative shocks.Nevertheless, some negative shocks may be hard to deal with in a religious context. Forinstance, there is evidence that divorced women in the UK gain little in terms of life sat-isfaction from greater religiosity (Clark & Lelkes, 2005).
3.6. Relationships
3.6.1. Marriage and intimate relationship
Generally speaking, being alone appears to be worse for SWB than being part of a part-nership. Regular sex was also associated with more positive SWB and since the effects werestrongest when this was with the same partner, it seems that being in a caring relationshipis important for well-being rather than simply being in a string of less close relationships(Blanchflower & Oswald, 2004a). Although there is some variation across studies, is seemsthat being married is associated with the highest level of SWB and being separated is asso-ciated with the lowest level of SWB, lower even than being divorced or widowed (e.g.Helliwell, 2003).
There is evidence that the amount of SWB associated with being an unmarried cohab-itor depends on the degree to which the relationship is perceived to be stable (Brown,2000). As opposed to unstable unmarried partnerships, stable ones are associated withsimilar levels of SWB as married partnerships. Therefore, the evidence again suggests thatobjective circumstances do not always have direct effects on well-being and that it isimportant how these experiences are perceived. A number of studies have considered

P. Dolan et al. / Journal of Economic Psychology 29 (2008) 94–122 107
gender differences and most find similar effects for men and women (e.g. Frey & Stutzer,2000).
Using BHPS data, Wildman and Jones (2002) report that while men and women appearto suffer equally following widowhood, divorce and separation, single women may actuallyhave higher well-being than married women. Other longitudinal evidence suggests someselection effects with people who become divorced being less happy even before being mar-ried (e.g. Lucas, 2005). These studies also show how well-being tends to drop in the periodleading up to divorce or widowhood and takes a number of years to stabilise again, andthat it may never reach original baseline levels. However, as with much of the evidencereported here, there are widespread individual differences in the rate and degree of adap-tation to the new state. Some people recover fairly quickly, others appear to never fullyrecover. On a more positive note, finding someone new is often associated with a returnto something like original levels of well-being.
There is also evidence that parental divorce negatively effects well-being in adulthood(e.g. Blanchflower & Oswald, 2004a) but this was not found in all studies (Louis & Zhao,2002). Moreover, subsequent remarriage of a parent who has suffered widowhood seemsto be associated with lower levels of later well-being than subsequent remarriage of a par-ent due to divorce (Biblarz & Gottainer, 2000). In general, then, stable and secure intimaterelationships are beneficial for well-being and the dissolution of relationships is damaging.
3.6.2. Having children
The evidence with regard to the well-being effects of having children is mixed and differsacross measure and country. Haller and Hadler (2006) using WVS find that, controllingfor income, and financial satisfaction, children have a non-significant effect on happinessbut a positive, and significant effect on life satisfaction. This is consistent with theorizingthat children put demands on day-to-day positive emotions (happiness) but nonethelesspeople consider them an important part of their overall well-being at a more cognitivelevel. However, if financial satisfaction is controlled for this extracts one of the potentialnegative consequences of additional children. A positive relationship between children andlife satisfaction is more likely to arise when income has been equivalised to account forhousehold composition (Lelkes, 2006; Schwarze & Harpfer, 2003).
On closer inspection, it seems that children generally affect well-being more negativelyfor single parents (e.g. Frey & Stutzer, 2000), divorced mothers (Schoon et al., 2005), whenthe children are over 3 years (e.g. Shields & Wheatley Price, 2005), if the family hasrecently moved (e.g. Magdol, 2002), if the family is poor (Alesina et al., 2004 for theUS) or if the child is sick and needs more than average care (Marks et al., 2002). In otherwords, if other circumstances are relatively negative, children seem to be an additionalchallenge to well-being. The impact of children may also depend upon broader socialand cultural factors, the presence of children having a stronger negative effect in UKand the US than in Europe or Russia (Di Tella et al., 2003; Smith, 2003). It should alsobe noted that most studies have explored the impact of children living in the household.However, there may be a variety of differential impacts of living with ones own children,or step-children, or grandchildren, or having children who have left home.
3.6.3. Seeing family and friends
It would appear that, overall, socialising with family and friends is positively associatedwith SWB (e.g. Lelkes, 2006; Pichler, 2006) and that this positive effect applies into older

108 P. Dolan et al. / Journal of Economic Psychology 29 (2008) 94–122
age (Ritchey, Ritchey, & Dietz, 2001), and remains even when controlling for levels of lifesatisfaction in previous periods (Baker et al., 2005). A generally positive relationshipbetween social contact and SWB may have implications for government policies whichencourage a geographically mobile labour force thereby weakening networks of familyand friends.
One of the few studies that differentiates between contact with family and friends finds asignificant positive effect on life satisfaction only for contact with family but not friends,though the effect was small (Martin & Westerhof, 2003). However, despite the generallypositive association there may also be a few circumstances where greater contact with oth-ers is not indicative of better well-being. Martin and Westerhof (2003), for instance, reportthat global satisfaction is lower when contact involves care from friends and family andPichler (2006) suggests potential problems when an adult is still living at home with theirparents. Again, cause and effect are unclear here.
3.7. Wider economic, social and political environment (Where we live)
3.7.1. Income inequality
The evidence on the impact of income inequality on well-being is mixed. Looking atinternational data using the World Values Survey, Fahey and Smyth (2004) find thatinequality reduces life satisfaction and Hagerty (2000) finds a negative relationship withSWB, whereas Haller and Hadler (2006) find that inequality increases life satisfaction.One explanation for these contrasting findings using international data may be that theinclusion of particular countries can be influential on the results (Bjørnskov, 2003). Spe-cifically, the relatively happy Latin American countries tend to have fairly unequal incomedistributions, and relatively unhappy former-Communist countries tend to have fairlyequal income distributions. Individual data has shown equality to be negatively relatedto SWB in Latin America (Graham & Felton, 2006) and the US (Hagerty, 2000), althoughAlesina et al. (2004) find this result to be only significant for the rich. In contrast, Senik(2004) finds inequality to have no significant effect on SWB in Russia.
European data show mixed results. O’Connell (2004) finds a positive relationship usingEurobarometer data, whereas Schwarze and Harpfer (2003) using the GSOEP and Alesinaet al. (2004) using Eurobarometer data with more controls and a longer time span, findthat inequality reduces life satisfaction, particularly for those with left wing political lean-ings and the poor. For Britain, Clark (2003b) finds that for full time employed individuals,income inequality in one’s reference group (based on gender, region and year) increases lifesatisfaction, particularly for those under 40, those on below average incomes and thosewho have experienced a greater increase in income over the last 3 years. The effect ofincome inequality is likely to vary depending on the how the inequality is interpreted.Clark (2003b) and Alesina et al. (2004) explain findings for the UK and US in terms ofincome equality communicating messages of opportunity. What will be communicatedthrough income inequality is likely to vary according to perceptions of mobility. Wheremobility is perceived to be lower, such as Europe and Germany, inequality is found tohave a negative impact.
3.7.2. Unemployment rates
National unemployment rates have been found to reduce SWB in the US (Alesina et al.,2004) and in Europe (Di Tella et al., 2001, 2003; Wolfers, 2003). Di Tella et al. (2001)
P. Dolan et al. / Journal of Economic Psychology 29 (2008) 94–122 109
suggest this may be due to the fear of personal unemployment which arises from a highernational unemployment rate. However, Alesina et al. (2004) fail to find a significant effectof the unemployment rate using the same European data. If the unemployment rate is pos-itively correlated with income inequality in Europe (Cysne, 2004), then the fact that this isonly study using the Eurobarometer data to control for income inequality casts somedoubt of the clarity of interpretation of this unemployment rate effect. Therefore, moreresearch is needed to gain greater understanding on the extent of the well-being losses froma higher unemployment rate.
3.7.3. Inflation
Investigating the impact of inflation is limited to comparisons across countries overtime. Within the same country it would be impossible to isolate an inflation effect fromany other time effects. Using aggregate data, Bjørnskov (2003) failed to find a significanteffect of inflation on life satisfaction. However, controlling for individual personal charac-teristics and country and year fixed effects inflation has been found to have a consistentnegative effect on SWB in Europe (Alesina et al., 2004; Di Tella et al., 2001, 2003; Wolfers,2003), in Latin America (Graham & Pettinato, 2001) and in the US (Alesina et al., 2004;Di Tella et al., 2003). The inflation impact is worst for those with right wing political lean-ings (Alesina et al., 2004). In addition, a volatile inflation rate also reduces life satisfaction(Wolfers, 2003). Many studies have a limited number of macro variables, which opens thepossibility that other important variables are not adequately controlled for. For example,inflation may correlate with income inequality or lack of trust.
The relative harm caused by inflation and unemployment has been estimated in somestudies however, this varies from 1.6:1 (Di Tella et al., 2001), 2.9:1 (Di Tella et al.,2003) up as high as to 5:1 (Wolfers, 2003). Hence a percentage increase in unemploymentis more damaging than a percentage increase in inflation (exactly how much more damag-ing remains uncertain) and macroeconomic policy might wish to take this into account. DiTella and MacCulloch (2005) provide interesting evidence on life satisfaction from a sam-ple of people living in the OECD over the period 1975–1992 that is consistent with thehypothesis that left-wing individuals care more about unemployment relative to inflationthan right-wingers.
3.7.4. Welfare system and public insuranceEvidence on the impact of the welfare state is limited. Veenhoven (2000) finds no cor-
relation between welfare expenditure and average happiness or average life satisfaction.However, Di Tella et al. (2003) analyse individual level European data and find that ahigher benefit replacement rate (using the OECD index of (pre-tax) replacement ratesi.e. unemployment benefit entitlements divided by an estimate of the expected wage)increases life satisfaction for both the unemployed and the employed. Since the replace-ment rate does not automatically change in line with the business cycle, it is a preferablemeasure to use.
3.7.5. Degree of democracy
The Swiss federal structure gives variation in political institutions and in direct popularrights between 26 Cantons (which deal with education, welfare, and police for example).Thus, it is particularly useful for studying the effects of political institutions. Frey andStutzer (2000) find that extended individual participation in the form of initiatives and

110 P. Dolan et al. / Journal of Economic Psychology 29 (2008) 94–122
referenda, and of decentralised (federal) government structures raises life satisfaction. Thisis generated not just by the outcomes of democracy but also by the political process itself.However, Dorn et al. (2007), cast some doubt on the robustness of these findings, showingthat controlling for language group, the democracy index used by Frey and Stutzer (2000)is only significant in their survey data at 10%, and using a new, more representative survey,the Swiss Household Panel, it is insignificant. Using international data needs to addressthe high correlation between income and democracy, however, when controlling forincome (Inglehart & Klingemann, 2000) and language group (Dorn et al., 2005) a positivelink between democracy and life satisfaction is still found.
3.7.6. Climate and the natural environment
Current evidence of the impact of pollution and environmental factors on well-being isvery limited. Welsch (2002) notes the difficulty of isolating any effect of pollution due tothe high negative correlation between income and pollution. However, he does provideevidence that suggests that pollution, as measured by nitrogen dioxide, has a detrimentalimpact on overall happiness (Welsch, 2002, 2006). Ferrer-i-Carbonell and Gowdy (2007)find that environmental problems where one lives reduce life satisfaction but althoughincome is controlled for in this model, this could still be picking up socio-economic statusand household wealth. There is little evidence on the impact of climate on SWB but Reh-danz and Maddison (2005) study gives a reasonable indication that extreme weather is det-rimental to SWB. In relation to attitudinal variables, Ferrer-i-Carbonell and Gowdy(2007) find that caring about the ozone layer is negatively associated with SWB whilst car-ing about species extinction is positively associated with SWB.
3.7.7. Safety and deprivation of the area
Controlling for ones own income, the evidence suggests that living in an unsafe ordeprived area is detrimental to life satisfaction (Ferrer-i-Carbonell & Gowdy, 2007; Lel-kes, 2006; Shields & Wheatley Price, 2005). However, given the correlation between vic-timisation and socio-economic status (Pease, 2001) conclusions on the SWB loss ofvictimisation and fear of crime needs to be derived from studies which control fully forsocio-economic status, which, as this review has suggested, includes considering currentincome but also perceptions of current and future financial status.
3.7.8. UrbanisationThere is some evidence across a range of geographical locations that living in large cities
is detrimental to life satisfaction and living in rural areas is beneficial (e.g. Hudson (2006)for Europe; Dockery (2003) for Australia; Gerdtham and Johannesson (2001) for Sweden;Graham and Felton (2006) for Latin America; Hayo (2004) for Eastern Europe). How-ever, some results are non-significant and population density was not found to effect hap-piness (Rehdanz & Maddison, 2005), or mental health (Shields & Wheatley Price, 2005),or the Satisfaction with Life Scale (Peterson, Park, & Seligman, 2005). It is important tonote that many of these studies control for income, at least to some extent, and sinceincomes are likely to be lower in rural areas, this may give a deceptive appearance ofgreater rural well-being.
For the purposes of geographical equity, the bivariate relationship between geograph-ical area and SWB may be more helpful than a pure location effect. More research is
P. Dolan et al. / Journal of Economic Psychology 29 (2008) 94–122 111
needed to explore the source of the benefit of living in less urban areas and to explore theeffectiveness of recreating these in an urban environment.
4. Discussion
Measures of subjective well-being (SWB) can increasingly be found in large (sometimeslongitudinal) datasets and, partly as a result, economists are showing increasing interest inthem as proxies for utility. This review has focused on the findings from analyses of theselarge datasets to see if any clear conclusions can be reached about the determinants of SWB.
Many of the measures of SWB we review appear to be picking up differences in objec-tive circumstances that we would expect to find. For instance, even simple one-item hap-piness and life satisfaction questions are showing significant differences between those whoare employed versus unemployed, single versus living with a partner and so on. However,it is difficult to compare the results across studies. One important source of apparent dis-crepancy between results arises from the use of different categorisation of variables andchoice of reference category. For example, marital status, employment status and educa-tion can all be categorised in slightly different ways (e.g. treating married and those cohab-iting together or separately) and the choice of reference category can vary (e.g. theemployment category may be compared to those employed, those out of the labour marketor those employed and self-employed). Therefore, care is needed in making comparisonsbetween studies.
Different findings may also arise due to the inclusion of different control variables e.g.both coefficient size and significance levels are often not robust to the inclusion of health.Moreover, many papers only include a full model without showing the impact of includingdifferent variables upon the relationship between the main independent and dependentvariables. A greater understanding of the robustness of relationships could be gained ifvariables are systematically introduced into different models.
It has been shown by Ferrer-i-Carbonell and Frijters (2004) that controlling for theindividual unobserved effects can impact on the findings of what influences SWB. Moststudies reviewed here which compare different models find that controlling for fixedeffects weakens the coefficient sizes and (as would be expected when only the within-sub-ject effects are being considered) the significance level. Fixed effects models are unsuitedto exploring the impact of variables with little or no variability within people (e.g. edu-cation), so whilst being theoretically superior in some respects, the evidence cannot betaken as evidence of non-significance of such variables. It is an ongoing challenge forresearchers to develop methods to best explore the impact of variables with minimalindividual life time variance yet which are also likely to be correlated with the unob-served individual effect.
Moreover, it is not always clear what should be controlled for in any model of SWB.Consider the case of expectations. If we control for income and other variables, we gen-erally find that high expectations are detrimental to well-being (Graham & Pettinato,2001, ‘frustrated achievers’). But should we really be controlling for income, since peoplewith high expectations generally earn more money, perhaps precisely because they havehigh expectations? In this example, along with issues of equity raised above, researchersand policy-makers may gain important information from bi-variate analysis.
Further investigation of existing data should consider more fully the household as aunit of analysis and the potential trade-offs in well-being across family members. For

112 P. Dolan et al. / Journal of Economic Psychology 29 (2008) 94–122
example, commuting might be bad for the commuter but bring benefits (from higherincome and a nicer house) to other household members. To date most well-being researchhas focused on the well-being of the individual. However, there are good reasons for alsofocusing on well-being at the household level. Magdol (2002), for instance, finds higherlevels of depressive symptoms amongst women who feel they have sacrificed their careersfor their partners. Whether or not any increases in their partner’s well-being is sufficientcompensation for this loss remains to be explored.
One very firm conclusion that can be drawn from our review is that the existing evi-dence base is not quite as strong as some people may have suggested and there aresome important avenues for future research that could be explored with the existingpanel datasets. This, in addition to the lack of clear evidence on causality, makes it dif-ficult to make clear policy recommendations at this stage. Nevertheless, our findingssuggest researchers should at least be aware of the impact of income, relative income,health, personal and community relationships, employment status and marital status intheir analysis. We are also able to make some clear recommendations about wherefuture research into some of these and other policy relevant variables should bedirected.
The importance of income rank and perception of income rank are just beginning to berecognised, and new models of how income and happiness are related are being developed(see, for example, Rojas, 2007). More research is needed to understand how income rankimpacts upon SWB, and how income comparisons work. This would include exploring towhom people compare themselves. A greater understanding of precisely why and how ref-erence incomes impact on well-being is also needed, for example, is it driven by an order-ing effect or by the distance between an individual’s income and the income of thosearound them; does it operate by making the individual dissatisfied with their own incomeor does it create a pressure on individuals for them to overspend and put themselves underfinancial pressure? Recent evidence suggests that comparisons are upward looking (Ferrer-i-Carbonell, 2005) and that it is the income of the top income group which dominates thereference income (Blanchflower & Oswald, 2004b). This finding requires validating in arange of different settings.
Another policy relevant relationship is the one between education and SWB. However,the evidence currently available is ambiguous. Some studies find a positive relationshipbetween each additional level of education and life satisfaction while others find that mid-dle level education is related to the highest satisfaction. The coefficient on education isoften responsive to the inclusion of other variables within the model and there is a sugges-tion that, like income, the benefits to education may be positional rather than absolute.The effect of social status and rank across a range of domains in life is therefore somethingthat requires urgent attention.
The role of social capital and contact with local community has been under exploredwithin the literature, particularly within fixed effects models. Future research is needed tounderstand the link between contact with friends, family and neighbours and well-beingand critically the direction of causality in this relationship. Unlike many variables, thereis unlikely to be a time delay in the causal pathways between social contact and well-being, which complicates any investigation into the direction of causality. One optionmay be the use of instrumental variables to address the potential endogeneity of thesocial capital variables. Such approaches could be used to establish causality moregenerally.
P. Dolan et al. / Journal of Economic Psychology 29 (2008) 94–122 113
This review has highlighted a range of problems in making concise conclusions aboutthe causes of SWB; these include some contradictory evidence (e.g. membership of organ-isations), concerns over the impact on the findings of potentially unobserved variables andthe lack of certainty on the direction of causality. However, there is also some agreementon which things are associated with SWB (e.g. age, separation, unemployment and health),which have been confirmed using different data sets, different countries, different time peri-ods and different methods of analysis. Economists have only fairly recently begun to payattention to subjective measures of well-being and we hope that our review will serve toraise awareness amongst economists, psychologists and policy-makers of the factors asso-ciated with SWB.
Acknowledgements
We appreciate the working papers that were sent to us by our academic colleagues, andfurther comments that were provided by Carol Graham and Andrew Oswald. We wouldlike to thank Isabella Earle and Julie Newton, who were involved in funding this researchand who provided us with excellent help and support throughout. Although the Depart-ment for Environment, Food and Rural Affairs (Defra) commissioned and funded thisstudy, the views expressed in it do not necessarily reflect Defra policy.
Appendix A
Single-item m
Survey
American’sChangingLives (ACL
easures for happiness/life satisfaction in the primary 19 datasets
Details Questions Response scale in orderof presentation (Manyalso have a ‘don’t know’option)
)
US Multistagestratified areaprobability sample
‘‘Now thinkingaboutyour life as a whole.How satisfied areyouwith it? Are you . . .?’’
‘‘Completelysatisfied’’, ‘‘Verysatisfied’’, ‘‘Somewhatsatisfied’’, ‘‘Not at allsatisfied’’
Response rate (67%)Wave 1 1986 – 3617 (Wave 1) ‘‘My life
could be happierthanit is right now’’
‘‘Strongly agree’’,‘‘Agree’’, ‘‘Disagree’’,‘‘Strongly disagree’’
Wave 2 1989 – 2867 (Wave 2) ‘‘Taking allthings together, howwould say things arethese days?Would you sayyou were . . .?’’
‘‘Very happy’’,‘‘Pretty happy’’,‘‘Not too happy’’
Wave 3 1994 (continued on next page)

Appendix A (continued)
Survey Details Questions Response scale in orderof presentation (Manyalso have a ‘don’t know’option)
BritishHouseholdPanelSurvey(BHPS)
Began in 1991 and isa multi-purposestudy following thesame representativesample ofindividuals. It ishousehold-based,interviewing everyadult member ofsampled households.Wave 1 consists ofsome 5500households and10,300 individuals.Samples fromWales, ScotlandNorthern Irelandadded later
‘‘How satisfied areyou with your lifeoverall?’’
Would you saythat you are moresatisfied with life,less satisfied, orfeel about thesame as you did ayear ago?
1 = ‘‘not satisfied atall’’, 7 = ‘‘completelysatisfied’’
‘‘More satisfied’’,‘‘Less satisfied’’,‘‘About the same’’
CanadianGeneralSocialSurvey(CGSS)
Established in 1985,conducts telephonesurveys from asample selectedacross the 10provinces. Until1998, the sample sizewas about 10,000.This was increasedin 1999 to 25,000
Introduced in Cycle12
‘‘Very happy?’’,‘‘Somewhat happy?’’,‘‘Somewhat unhappy?’’,‘‘Very unhappy?’’
Presently, would youdescribe yourself as. . .
‘‘I am going to askyou to rate certainareas of your life.Please rate yourfeelings about them’’(Including) ‘‘Yourlife as a whole rightnow?’’
‘‘Very satisfied’’,‘‘Somewhat satisfied’’,‘‘Somewhatdissatisfied’’, ‘‘Verydissatisfied’’
Eurobaro-meter
300,000 people in 12European countries
‘‘On the whole, areyou . . . or. . . with the life youlead?’’
‘‘Very satisfied’’, ‘‘Fairlysatisfied’’, ‘‘Not verysatisfied’’Interviews are one to
one in people’shomes
‘‘Not at all satisfied’’
114 P. Dolan et al. / Journal of Economic Psychology 29 (2008) 94–122

Appendix A (continued)
Survey Details Questions Response scale in orderof presentation (Manyalso have a ‘don’t know’option)
EuropeanSocial(Values)Survey(ESS)
Nationallyrepresentative crosssection in over 20European countries
‘‘All thingsconsidered, howsatisfied are you withyour life as a wholenowadays?’’
1 ‘‘Dissatisfied’’,10 ‘‘Satisfied’’
GermanSocio-EconomicPanelSurvey(GSOEP)
Households selectedusing multistagerandom sampling, allmembers ofhousehold asked toparticipate. Annualface to faceinterviews. Theentire sample is over24,000 respondentswho participated in aleast one of the 1–15waves
‘‘How satisfied areyou at present withyour life as a whole?’’
0 (‘‘Completelydissatisfied’’), 10(‘‘Completely satisfied’’)
‘‘How happy are youat present with yourlife as a whole?’’
0 (‘‘Completelyunhappy’’), 10(‘‘Completely happy’’)
Household,Income andLabourDynamicsin AustraliaSurvey(HILDA)
National probabilityinterview sample
‘‘All thingsconsidered, howsatisfied are you withyour life?’’
‘‘The more satisfied youare, the higher thenumber you shouldpick. The less satisfiedyou are, the lower thenumber.’’ ‘‘0 – 10’’
Wave 1 2001 had7682 householdswith 13,969successful interviewsWave 2 interviewswith 13,041, 12,000from wave 1
HungarianHouseholdPanelSurvey(Run byTarki)(HHPS)
Between 1991 and1997, a nation-widesample of 2600households wassurveyed on a yearlybasis
Please tell me towhat extent you aresatisfied with each ofthe following parts ofyour life. (Including)‘‘the way your lifehas worked out’’ and‘‘your standard ofliving’’
0 (‘‘Notat all satisfied’’),10 (‘‘Fully satisfied’’)
(continued on next page)
P. Dolan et al. / Journal of Economic Psychology 29 (2008) 94–122 115

Appendix A (continued)
Survey Details Questions Response scale in orderof presentation (Manyalso have a ‘don’t know’option)
InternationalSocialSurveyProgramme(ISSP)
Annual programmeof cross-nationalcollaboration onsurveys coveringtopics important forsocial scienceresearch. 41 membercountries
‘‘If you were toconsider your life ingeneral these days,how happy orunhappy would yousay you are, on thewhole?’’
‘‘Very happy’’, ‘‘Fairlyhappy’’, ‘‘Not veryhappy’’, ‘‘Not at allhappy’’
Latino-baro-meter
17spanish speakingcountries (1997–2000) 1000interviews percountry by MORI,not nationallyrepresentative in allcountries
‘‘How satisfied areyou with your life?’’
‘‘Not at all’’,‘‘Somewhat’’,‘‘Satisfied’’, ‘‘Very’’
Midlife in theUS(MIDUS)
US Nationalprobability sample,random digitdialling. Englishspeaking. Oversampling of 65–74years. (Has alsoincluded the PANASand SWLS at somepoints.)
‘‘Please rate your lifeoverall these days ona scale from 0 to 10where 0 is the worstpossible life overalland 10 is the bestpossible life overall.’’
0 = Worst possiblelife overall, 10 = Bestpossible life overall
NationalChildDevelopmentSurvey(NCDS), UK
Cohort of peopleborn in Britain, from03/03/58 to 09/03/58.Most recent data2000, age 42. Of theinitial 17,414individuals 11,419 in2000
‘‘How satisfied areyou with your life sofar?’’
0 (‘‘Completelydissatisfied’’), 10(‘‘Completelysatisfied’’)‘‘How satisfied were
you with your life 5years ago?’’‘‘How satisfied doyou expect to be withyour life in 5 yearstime?’’
116 P. Dolan et al. / Journal of Economic Psychology 29 (2008) 94–122

Appendix A (continued)
Survey Details Questions Response scale in orderof presentation (Manyalso have a ‘don’t know’option)
NationalSurvey ofFamilies andHouseholds(NSFH), US
Representativesample living inEnglish/Spanishspeaking homes.1987–1988 (Wave 1)1992–1994 (Wave 2 )10,000 in panel
‘‘Taking things alltogether, How wouldyou say things arethese days?’’
1 (‘‘Very unhappy’’), 7(‘‘Very happy’’)
Social CapitalCommunityBenchmarkSurvey(SCBS), US
National sample of3000 r andrepresentativesamples in 40communitiesnationwide (across29 states) coveringan additional 26,200respondents
‘‘All thingsconsidered, wouldyou say you are . . .’’
‘‘Very happy’’,‘‘Happy’’, ‘‘Not veryHappy’’, ‘‘Not happyat all’’
RussianLongitudinalMonitoringSurvey(RLMS)
An approximateprobability sample(restricted bypractical limitations)with households in20 regions in Russia1995–1998. Phase1 = 6,334 households(17,154 individuals)
e.g. Wave 8 ‘‘Fully satisfied’’,‘‘Rather satisfied’’,‘‘Both yes and no’’,‘‘Less than satisfied’’‘‘Not at all satisfied’’
‘‘To what extent areyou satisfied withyour life in general atthe present time?’’
Swedish Levelof LivingSurvey(LNU)
Taken several timesbetween 1968 and1991. In 1991 therewere 6773individuals
‘‘We have now beenthrough a lot ofquestions about yourliving conditions indifferent areas. Howdo you yourself viewyour ownconditions? By andlarge, do you thinkthat your situationis:’’
‘‘Very good’’, ‘‘Rathergood’’, ‘‘Neither goodnor bad’’, ‘‘Ratherbad’’, ‘‘Very bad’’
(continued on next page)
P. Dolan et al. / Journal of Economic Psychology 29 (2008) 94–122 117

Appendix A (continued)
Survey Details Questions Response scale in orderof presentation (Manyalso have a ‘don’t know’option)
SwissHouseholdPanelSurvey(SHPS)
1999–2004, roughly4000 households and7000 individuals peryear
‘‘In general howsatisfied are you withyour life?’’
0 (‘‘Not at all satisfied’’),10 (‘‘Completelysatisfied’’)
US GeneralSocialSurvey(USGSS)
30,000 individualsover period 1972–1994
‘‘Taken all togetherhow would you saythings are these days?Would you say youare . . .?’’
‘‘Very happy’’, ‘‘Prettyhappy’’, ‘‘Not toohappy’’
WorldValuesSurvey(WVS)
Grew out of theEuropean ValuesSurvey group (EVS).Nationallyrepresentative UKsamples of around1000 individuals in1998 and 1999collected by Moriand Gallup
‘‘All thingsconsidered, howsatisfied are you withyour life as a wholethese days?’’ (2005)
1 ‘‘Dissatisfied’’, 10‘‘Satisfied’’, ‘‘Veryhappy’’, ‘‘Quite happy’’,‘‘Not very happy’’, ‘‘Notat all happy’’
‘‘Taken all thingstogether, would yousay you are . . .’’
118 P. Dolan et al. / Journal of Economic Psychology 29 (2008) 94–122
References
Alesina, A., Di Tella, R., & MacCulloch, R. (2004). Inequality and happiness: Are Europeans and Americansdifferent? Journal of Public Economics, 88, 2009–2042.
Baker, L. A., Cahalin, L. P., Gerst, K., & Burr, J. A. (2005). Productive activities and subjective well-being amongolder adults: The influence of number of activities and time commitment. Social Indicators Research, 73,431–458.
Bardasi, E., & Francesconi, M. (2004). The impact of atypical employment on individual well-being: Evidencefrom a panel of British workers. Social Science and Medicine, 58, 1671–1688.
Biblarz, T. J., & Gottainer, G. (2000). Family structure and children’s success: A comparison of widowed anddivorced single-mother families. Journal of Marriage and the Family, 62, 533–548.
Biddle, S. J. H., & Ekkekakis, P. (2005). Physical active lifestyles and well-being. In F. A. Huppert, N. Baylis, &B. Keverne (Eds.), The science of well-being (pp. 141–168). Oxford: Oxford University Press.
Bjørnskov, C. (2003). The happy few: Cross-country evidence on social capital and life satisfaction. Kyklos, 56(1),3–16.
Bjørnskov, C. (2007). The multiple facets of social capital. European Journal of Political Economy, 22, 22–40.Blanchflower, D. G., & Oswald, A. J. (1998). What makes an Entrepreneur? Journal of Labor Economics, 16(1),
26–60.Blanchflower, D. G., & Oswald, A. J. (2004a). Money, sex and happiness: An empirical study. Scandavian Journal
of Economics, 106(3), 393–415.Blanchflower, D. G., & Oswald, A. J. (2004b). Well-being over time in Britain and the USA. Journal of Public
Economics, 88, 1359–1386.

P. Dolan et al. / Journal of Economic Psychology 29 (2008) 94–122 119
Blanchflower, D. G., & Oswald, A. J. (2005). Happiness and the Human Development Index: The Paradox ofAustralia. The Australian Economic Review, 38(3), 307–318.
Brown, S. L. (2000). The effect of union type on psychological well-being: Depression among cohabitors versusmarrieds. Journal of Health and Social Behaviour, 41, 241–255.
Brown, S. L., Nesse, R. M., Vinokur, A. D., & Smith, D. M. (2003). Providing social support may be morebeneficial than receiving it: Results from a prospective study of mortality. Psychological Science, 14(4),320–327.
Brown, S., Taylor, K. B., & Wheatley Price, S. (2005). Debt and distress: Evaluating the psychological cost ofcredit. Journal of Economic Psychology, 26, 642–666.
Bukenya, J. O., Gebremedhin, T. G., & Schaeffer, P. V. (2003). Analysis of rural quality of life and health: Aspatial approach. Economic Development Quarterly, 17(3), 280–293.
Clark, A. (2003a). Unemployment as a social norm: Psychological evidence from panel data. Journal of Labor
Economics, 21(2), 323–351.Clark, A. (2003b). Inequality-aversion and income mobility: A direct test.Clark, A., Frijters, P., & Shields, M. A. (2007). A survey of the income happiness gradient. Journal of Economic
Literature (forthcoming).Clark, A. & Lelkes, O. (2005). Deliver us from evil: Religion as insurance. PSE, Paris.Clark, A., & Oswald, A. (1994). Unhappiness and Unemployment. The Economic Journal, 104(424), 648–659.Cohen, A. (2002). The importance of spirituality in well-being for Jews and Christians. Journal of Happiness
Studies, 3, 287–310.Cysne, R.P. (2004). On the positive correlation between income inequality and unemployment. No. 561, Ensaios
Economicos, Fundacao Getulio Vargas.Dehejia, R., DeLeire T., & Luttmer, E.F.P., (2005). Insuring consumption and happiness through religious
organizations. RWP05-047, KSG Faculty Research Working Paper Series, John F. Kennedy School ofGovernment, Harvard University.
DeNeve, K. M., & Cooper, H. (1998). The happy personality: A meta-analysis of 137 personality traits andsubjective well-being. Psychological Bulletin, 124, 197–229.
Diener, E., Emmons, R. A., Larson, R. J., & Griffin, S. (1985). The satisfaction with life scale. Journal of
Personality Assessment, 49, 71–75.Diener, E., Lucas, R. E., Oishi, S., & Suh, E. (2002). Looking up and looking down: Weighting good and bad
information in life satisfaction judgements. Personality and Social Psychology Bulletin, 28(4), 437–445.Diener, E., & Seligman, M. E. P. (2004). Beyond money. Toward and economy of well-being. Psychological
Science in the Public Interest, 5(1).Diener, E., Suh, E. M., Lucas, R. E., & Smith, H. L. (1999). Subjective well-being: Three decades of progress.
Psychological Review, 125, 276–302.Di Tella, R., Haisken-De New, J., & MacCulloch, R. (2005). Happiness Adaptation to Income and to Status in an
Individual Panel, 5, 1–5.Di Tella, R., & MacCulloch, R. (2005). Partisan social happiness. Review of Economic Studies, 72(2), 293–
367.Di Tella, R., MacCulloch, R., & Oswald, A. (2001). Preferences over inflation and unemployment. Evidence from
surveys of happiness. The American Economic Review, 91(1), 335–341.Di Tella, R., MacCulloch, R., & Oswald, A. (2003). The macroeconomics of happiness. The Review of Economics
and Statistics, 85(4), 809–827.Dockery, A.M. (2003). Happiness, life satisfaction and the role of work: Evidence from two Australian surveys.
Working Paper No. 03.10, School of Economics and Finance, Curtin Business School, Curtin University ofTechnology.
Dolan, P., & White, M. P. (2007). How can measures of subjective well-being be used to inform public policy?Perspectives in Psychological Science, 2, 71–85.
Dorn, D., Fischer, J. A., Kirchgassner, G., & Sousa-Poza, A. (2007). Is it culture of democracy? The impact ofdemocracy, and culture on happiness. Social Indicators Research, 82(3), 505–526.
Easterlin, R. (1995). Will raising the incomes of all increase the happiness of all. Journal of Economic Behaviour
and Organization, 27, 35–47.Easterlin, R. (2006). Life cycle happiness and its sources. Intersections of psychology, economics and
demography. Journal of Economic Psychology, 27, 463–482.Fahey, T., & Smyth, E. (2004). Do subjective indicators measure welfare? Evidence from 33 European societies.
European Societies, 6(1), 5–27.

120 P. Dolan et al. / Journal of Economic Psychology 29 (2008) 94–122
Ferrer-i-Carbonell, A. (2005). Income and well-being: An empirical analysis of the comparison income effect.Journal of Public Economics, 89, 997–1019.
Ferrer-i-Carbonell, A., & Frijters, P. (2004). How important is methodology for the estimates of the determinantsof happiness. The Economic Journal, 114, 641–659.
Ferrer-i-Carbonell, A., & Gowdy, J. M. (2007). Environmental degradation and happiness. Ecological Economics,
60(3), 509–516.Ferris, A. L. (2002). Religion and the quality of life. Journal of Happiness Studies, 3(3), 199–215.Flouri, E. (2004). Subjective well-being in midlife: The role of involvement of and closeness to parents in
childhood. Journal of Happiness Studies, 5, 335.Frey, B. S., & Stutzer, A. (2000). Happiness, economy and institutions. The Economic Journal, 110, 918–938.Frey, B. S., & Stutzer, A. (2002). Happiness and economics. Princeton: University Press.Gerdtham, U. G., & Johannesson, M. (2001). The relationship between happiness, health, and socio-economic
factors: Results based on Swedish microdata. Journal of Socio-Economics, 30, 553–557.Gerlach, K., & Stephan, G. (1996). A paper on unhappiness and unemployment in Germany. Economic Letters,
52(3), 325–330.Goldberg, D.P. & Williams, P. (1988). Users’ guide to the general health questionnaire. Windsor: NFER-Nelson.Graham, C., Eggers, A., & Sukhtankar, S. (2004). Does happiness pay? An exploration based on panel data from
Russia. Journal of Economic Behavior and Organization, 55(3), 319–342.Graham, C., & Felton, A. (2006). Inequality and happiness: Insights from Latin America. Journal of Economic
Inequality, 4(1), 107–122.Graham, C., & Pettinato, S. (2001). Happiness, markets and democracy: Latin America in comparative
perspective. Journal of Happiness Studies, 2, 237–268.Greenfield, E. A., & Marks, N. F. (2004). Formal volunteering as a protective factor for older adult’s
psychological well-being. Journals of Gerontology, Series B: Psychological Sciences and Social Sciences, 59B,258–264.
Hagerty, M. R. (2000). Social comparisons of income in one’s community: Evidence from national surveys ofincome and happiness. Journal of Personality and Social Psychology, 78(4), 746–771.
Haller, M., & Hadler, M. (2006). How social relations and structures can produce happiness and unhappiness: Aninternational comparative analysis. Social Indicators Research, 75, 169–216.
Hayo, B. (2004). Happiness in Eastern Europe. Mimeo, Philipps University Marburg, Number 12/2004.Hayo, B., & Seifert, W. (2003). Subjective economic well-being in Eastern Europe. Journal of Economic
Psychology, 24, 329–348.Helliwell, J. F. (2003). How’s life? Combining individual and national variables to explain subjective well-being.
Economic Modelling, 20, 331–360.Helliwell, J. F. (2006). Well-being, social capital and public policy: What’s new? Economic Journal, 116, C34–C45.Helliwell, J. F., & Putnam, R. (2004). The social context of well-being. Philosophical Transactions of the Royal
Society London, 359, 1435–1446.Hirst, M. (2003). Caring-related inequalities in psychological distress in Britain during the 1990s. Journal of
Public Health Medicine, 25, 343–346.Hirst, M. (2005). Carer distress: A prospective, population-based study. Social Science & Medicine, 61,
697–708.Hudson, J. (2006). Institutional trust and subjective well-being across the EU. Kyklos, 59(1), 43–62.Inglehart, R., & Klingemann, H-D. (2000). Democracy and happiness. In E. Diener & E. M. Suh (Eds.), Genes,
culture, culture and subjective wellbeing. Cambridge, MA: MIT Press.Johnson, W., & Krueger, R. F. (2006). How money buys happiness: Genetic and environmental processes linking
finances and life satisfaction. Journal of Personality and Social Psychology, 90, 680–691.Kahneman, D., Krueger, A. B., Schkade, D. A., Schwarz, N., & Stone, A. A. (2004). Toward national well-being
accounts. American Economic Review, 94(2), 429–434.Kahneman, D., Wakker, P., & Sarin, R. (1997). Back to Bentham? Explorations of experienced utility. Quarterly
Journal of Economics, 112, 375–405.Korpi, T. (1997). Is utility related to employment status? Employment, unemployment, labor market policies and
subjective well-being among Swedish youth. Labour Economics, 4(2), 125–147.Lelkes, O. (2006). Knowing what is good for you. Empirical analysis of personal preferences and the ‘‘objective
good’’. The Journal of Socio-Economics, 35, 285–307.Li, Y., Pickles, A., & Savage, M. (2005). Social capital and social trust in Britain. European Sociological Review,
21(2), 109–123.

P. Dolan et al. / Journal of Economic Psychology 29 (2008) 94–122 121
Louis, V. V., & Zhao, S. (2002). Effects of family structure, family SES, and adulthood experiences on lifesatisfaction. Journal of Family Issues, 23, 986–1005.
Lucas, R. E. (2005). Time does not heal all wounds: A longitudinal study of reaction and adaptation to divorce.Psychological Science, 16, 945–950.
Lucas, R. E., Clark, A. E., Georgellis, Y., & Diener, E. (2004). Unemployment alters the set point for lifesatisfaction. Psychological Science, 15(1), 8–13.
Luttmer, E. F. P. (2005). Neighbors as negatives: Relative earnings and well-being. The Quarterly Journal of
Economics, 20(3), 963–1002.Macdonald, M., & Douthitt, R. A. (1992). Consumption theories and consumers’ assessments of subjective well-
being. The Journal of Consumer Affairs, 26(2), 243–261.Magdol, L. (2002). Is moving gendered? The effects of residential mobility on the psychological well-being of men
and women. Sex Roles, 47, 553–560.Marks, G. N., & Flemming, N. (1999). Influences and consequences of well-being among Australian young
people: 1980–1995. Social Indicators Research, 46, 301–323.Marks, N. F., Lambert, J. D., & Choi, H. (2002). Transitions to caregiving, gender, and psychological well-being:
A prospective US national study. Journal of Marriage and the Family, 64, 657–667.Martin, M., & Westerhof, G. J. (2003). Do you have to have them or should you believe you have them?
Resources, their appraisal, and well-being in adulthood. Journal of Adult Development, 10, 99–112.Meier, S. & Stutzer, A. (2006). Is volunteering rewarding in itself? Center for Behavioral Economics and Decision-
Making, Federal Reserve Bank of Boston.O’Connell, M. (2004). Fairly satisfied: Economic equality, wealth and satisfaction. Journal of Economic
Psychology, 25, 297–305.Oswald, A. & Powdthavee, N. (2006).Does happiness adapt? A longitudinal study of disability with implications for
economists and judges. Institute for the Study of Labour, IZA DP No. 2208.Pease, K. (2001). Distributive justice and crime. European Journal on Criminal Policy and Research, 9, 413–425.Peterson, C., Park, N., & Seligman, M. E. (2005). Orientations to happiness and life satisfaction: The full life
versus the empty life. Journal of Happiness Studies, 6, 25–41.Pichler, F. (2006). Subjective quality of life of young Europeans. Feeling happy but who knows why? Social
Indicators Research, 75, 419–444.Rehdanz, K., & Maddison, D. (2005). Climate and happiness. Ecological Economics, 52(1), 111–125.Ritchey, L. H., Ritchey, P. N., & Dietz, B. E. (2001). Clarifying the measurement of activity. Activities, Ageing &
Adaptation, 26, 1–21.Rojas, M. (2007). Heterogeneity in the relationship between income and happiness: A conceptual-referent-theory
explanation. Journal of Economic Psychology, 28(1), 1–14.Ryan, R.M. & Deci, E.L. (2001). To be happy or to be self-fulfilled: A review of research on hedonic and
eudaimonic well-being. In Fiske, S. (Ed.), Annual review of psychology, Vol. 52 (pp. 141–166). Palo Alto, CA:Annual Reviews, Inc.
Schoon, I., Hansson, L., & Salmela-Aro, K. (2005). Combining work and family life: Life satisfaction amongmarried and divorced men and women in Estonia, Finland and the UK. European Psychologist, 10, 309–319.
Schwarze, J. & Harpfer, M. (2003). Are people inequality averse, and do they prefer redistribution by the State? A
revised version. Institute for the Study of Labour, IZA DP No. 974.Schyns, P. (2001). Income and satisfaction in Russia. Journal of Happiness Studies, 2, 173–204.Senik, C. (2004). When information dominates comparison learning from Russian subjective panel data. Journal
of Public Economics, 88, 2099–20123.Shields, M., & Wheatley Price, S. (2005). Exploring the economic and social determinants of psychological well-
being and perceived social support in England. Journal Royal Statistical Society(Part 3), 513–537.Smith, K. (2003). Individual welfare in the Soviet Union. Social Indicators Research, 64, 75–105.Stutzer, A. (2004). The role of income aspirations in individual happiness. Journal of Economic Behaviour and
Organisation, 54, 89–109.Stutzer, A. & Frey, B.S. (2005). Stress that doesn’t pay: The commuting paradox. University of Zurich.Sumner, L. W. (1996). Welfare, happiness and ethics. Oxford: Clarendon Press.Theodossiou, I. (1998). The effects of low-pay and unemployment on psychological well-being: A logistic
regression approach. Journal of Health Economics, 17, 85–104.Thoits, P. A., & Hewitt, L. N. (2001). Volunteering work and well-being. Journal of Health and Social Behaviour,
42, 115–131.

122 P. Dolan et al. / Journal of Economic Psychology 29 (2008) 94–122
van den Berg, B. & Ferrer-i-Carbonell, A. (forthcoming). Monetary valuation of informal care: The well-beingvaluation method. Health Economics.
Veenhoven, R. (2000). Well-being in the welfare state: Level not higher, distribution not more equitable. Journal
of Comparative Policy Analysis: Research and Practice, 2, 91–125.Watson, D., Clark, L. A., & Tellegen, A. (1988). Development and validation of brief measures of positive and
negative affect: The PANAS scale. Journal of Personality and Social Psychology, 54, 1063–1070.Weinzierl, M. (2005). Estimating a relative utility function. Harvard University.Welsch, H. (2002). Preferences over prosperity and pollution: Environmental valuation based on happiness
studies. Kyklos, 55, 473–494.Welsch, H. (2006). Environment and happiness: Valuation of air pollution using life satisfaction data. Ecological
Economics, 58, 801–813.Wildman, J. & Jones, A. (2002). Is it absolute income or relative deprivation that leads to poor psychological well
being? A test based on individual-level longitudinal data. University of York: YSHE.Winkelmann, R. (2004). Subjective well-being and the family: Results from an ordered probit model with multiple
random effects. Institute for the Study of Labor, Bonn, IZA DP No. 1016.Winkelmann, L., & Winkelmann, R. (1998). Why are the unemployed so unhappy? Evidence from panel data.
Economica, 65, 1–15.Wolfers, J. (2003). Is business cycle volatility costly? Evidence from surveys of subjective well-being. International
Finance, 6(1), 1–26.