do public subsidies sell green cars? evidence from the u.s. “cash
TRANSCRIPT

December 2010December 2010
Do Public Subsidies Sell Green Cars? Evidence from the U.S. “Cash for Clunkers” ProgramBy Edward Huang
Energy Technology Innovation Policy Research Group

Discussion Paper #2010-17Energy Technology Innovation Policy Discussion Paper Series
Belfer Center for Science and International AffairsHarvard Kennedy School79 JFK StreetCambridge, MA 02138Fax: (617) 495-8963Email: [email protected]: http://belfercenter.org
Copyright 2010 President and Fellows of Harvard College

Do Public Subsidies Sell Green Cars? Evidence from the U.S. “Cash for Clunkers” Program
Edward Huang1
Energy Technology Innovation Policy
Belfer Center for Science and International Affairs
Harvard Kennedy School, Harvard University
79 John F. Kennedy Street
Cambridge, MA 02138
USA
Belfer Center Discussion Paper 2010-17
December 2010
1Former Research Fellow, Energy Technology Innovation Policy Research Group, Belfer Center for Science and International Affairs, Harvard Kennedy School, Harvard University.

CITATION
This paper may be cited as: Huang, Edward, “Do Public Subsidies Sell Green Cars?
Evidence from the U.S. ‘Cash for Clunkers’ Program.” Discussion Paper 2010-17, Cambridge,
MA: Belfer Center for Science and International Affairs, December 2010.
Comments are welcome and may be directed to: Edward Huang at the Belfer Center for
Science and International Affairs, Harvard Kennedy School, Harvard University, 79 JFK Street,
Cambridge, MA 02138, [email protected]. This paper is available at
www.belfercenter.org/energy.
DISCLAIMER
The views expressed within this paper are those of the author and do not necessarily reflect those
of the organization he is affiliated with, its members, nor any employee or persons acting on
behalf of them. In addition, none of these make any warranty, expressed or implied, assumes any
liability or responsibility for the accuracy, completeness or usefulness of any information,
apparatus, product or process disclosed or represents that its use would not infringe privately
owned rights, including any party’s intellectual property rights. References herein to any
commercial product, process, service or trade name, trade mark or manufacturer does not
necessarily constitute or imply any endorsement, or recommendation or any favoring of such
products.

ENERGY TECHNOLOGY INNOVATION POLICY
The overarching objective of the Energy Technology Innovation Policy (ETIP) research group is
to determine and then seek to promote adoption of effective strategies for developing and
deploying cleaner and more efficient energy technologies, primarily in three of the biggest
energy-consuming nations in the world: the United States, China, and India. These three
countries have enormous influence on local, regional, and global environmental conditions
through their energy production and consumption.
ETIP researchers seek to identify and promote strategies that these countries can pursue,
separately and collaboratively, for accelerating the development and deployment of advanced
energy options that can reduce conventional air pollution, minimize future greenhouse-gas
emissions, reduce dependence on oil, facilitate poverty alleviation, and promote economic
development. ETIP's focus on three crucial countries rather than only one not only multiplies
directly our leverage on the world scale and facilitates the pursuit of cooperative efforts, but also
allows for the development of new insights from comparisons and contrasts among conditions
and strategies in the three cases.
ACKNOWLEDGEMENTS
I have benefited from the discussions with Henry Lee, Bill Hogan, Raj Chetty, Erich
Muehlegger, Offer Grembek, colleagues at the Belfer Center and the Harvard Kennedy School,
and many seminar participants. This study is sponsored in part by the U.S. Environmental
Protection Agency; however, I am solely responsible for its contents and views. All data used in
the analysis are public records, and program codes to process them are available upon request.

ABSTRACT One question about the 2009 U.S. “Cash for Clunkers” program is whether it induced consumers
to purchase greener vehicles than they would otherwise have purchased. This paper views the
program as a natural experiment, which offered higher rebates to consumers buying more fuel-
efficient vehicles, and shows that awarding an extra $1,000 on a vehicle made 7.2% of
consumers switch. Hence the program – giving away nearly $3 billion – should have drawn
many consumers to the subsidized greener vehicles, producing substantial environmental gains.
This finding should interest policymakers evaluating similar programs to stimulate the economy
while benefiting the environment.

TABLE OF CONTENTS
INTRODUCTION .......................................................................................................................... 1
1. “CASH FOR CLUNKERS” AS A NATURAL EXPERIMENT ....................................................... 3
2. DATA AND GRAPHS ............................................................................................................... 5
3. MODELS AND ESTIMATES ..................................................................................................... 9
4. CONCLUSION ....................................................................................................................... 11
REFERENCES ............................................................................................................................ 12

DO PUBLIC SUBSIDES SELL GREEN CARS? BELFER CENTER 2010-17
1
INTRODUCTION
Announced at a difficult time for consumers and automakers, the U.S. “Cash for Clunkers”
program attracted significantly more attention than anticipated. The program offered up to a
$4,500 rebate on the purchase of a fuel-efficient vehicle that would replace a gas-guzzler.
Consumers rushed to auto showrooms across the country to take advantage of the program. Only
days in to the program the projected payout exceeded the initial budget of $1 billion; and, despite
another $2 billion pledged by U.S. Congress, the program used up the entire fund and had to
conclude two months ahead of schedule. In the end, the program helped nearly 700,000
consumers exchange vehicles in only 55 days.
The efficacy of the program has been at the center of public interest. In particular, there is
concern that consumers may have been taken advantage of the subsidies and purchased vehicles
they would have bought anyway. In this case, the program itself could not take credit for
reducing emissions because even without the program the fleet’s fuel economy would still have
improved. If it can be shown that vehicle demand cannot be manipulated by subsidies,
policymakers should focus on alternative regulatory options such as setting more stringent fuel
economy standards to green the fleet.
Thus, a central question in evaluating the program is whether it lured consumers to purchase
greener vehicles than they otherwise would have purchased in the absence of the program. There
are two possible methods to answer this question: conduct a survey or analyze actual purchases.
As mentioned in the DOT Report to Congress (2009), the agency surveyed consumers when they
applied for rebates, asking what they would have purchased in the absence of the program.
Roughly 23 percent of respondents stated that they would have chosen larger, presumably less
efficient, cars or trucks. While this was a response to a hypothetical survey, it seems to indicate
that the program succeeded in selling fuel-efficient vehicles to people who had not planned to
buy them.
This paper uses the second method, analyzing the actual transactions based on a special
feature of the program: consumes had the opportunity to receive either $3,500 or $4,500
depending on how much they “improved” the fuel economy between their trade-in and a new
DO PUBLIC SUBSIDES SELL GREEN CARS? BELFER CENTER 2010-17
2
vehicle. The higher rebate was granted only if the improvement reached a certain threshold (e.g.
for a new car, running at least 10 more miles to the gallon than the trade-in vehicle). As a result,
consumers trading in very inefficient vehicles could pick among most new vehicles to collect the
rebate of $4,500, while consumers trading in more-efficient vehicles had to choose from a
smaller pool of options or forgo the extra $1,000. Because of this variation in rebates among
consumers, the program may be seen as a “natural” experiment revealing the relationship
between subsidies and the subsequent vehicle selection by new car buyers.
Analysis results suggest that awarding $1,000 more for a given vehicle made 7.2% of
consumers switch to that more-efficient vehicle or trade-in their less-efficient model. By
extrapolating from this relationship, the program – granting an average of $4,200 per vehicle –
may have made 25-30% of consumers change their vehicle selection; a range not far from the
stated 23% in the DOT survey. Both methods suggest – consistently – that the program prompted
a large number of consumers to buy the subsidized, more-efficient vehicles. Not only did the
program stimulate economic activity, but it also benefited the environment by reducing
emissions and fuel consumption. This finding should encourage policymakers to consider similar
proposals, such as a feebate program that subsidizes fuel-efficient vehicles by taxing gas-
guzzlers and distorting vehicle prices without incurring additional budget deficits (see Greene et
al. 2005 for more discussion).
Scholars have found that subsidies can help expand a vehicle’s market share. For example,
see the work of Gallagher and Muehlegger (2008) and Beresteanu and Li (2009) on hybrid cars.
These studies, however, often rely on subsidy variations between cities or states over a few
years. During this period vehicle demand could have influenced, or have been influenced by,
gasoline prices, vehicle supply, and decisions to grant subsidies. As a result, the causality
between subsidies and vehicle selections indicated by the above studies may not be as
established. This paper’s analysis is based on the “Cash for Clunkers” program that was in effect
for less than two months.
This paper builds on other studies investigating what factors affect vehicle selection at the
consumer level (see Berry et al. 2004; Train and Winston 2007). In these studies, vehicle price is
often a strong decision driver, and it is no surprise that the program’s rebates, directly altering

DO PUBLIC SUBSIDES SELL GREEN CARS? BELFER CENTER 2010-17
3
vehicle price, have also swayed consumer decisions. Nevertheless, this paper uses a different
approach to arrive at the same conclusion. Thanks to the experimental design of the program (see
Meyer 1995; Angrist and Pischke 2009 for literature review on natural experiments), this paper
uses graphical comparisons and simple statistical tests, rather than assuming and estimating the
consumers’ utility function with an exhaustive list of variables – a challenging task in choice
modeling as pioneered by McFadden (1972).
This paper is organized as follows. Section 1 puts the program in the context of a natural
experiment. Section 2 introduces the data and their descriptive analysis. Section 3 discusses the
results from formal statistical tests. Section 4 summarizes the paper’s findings.
1. “CASH FOR CLUNKERS” AS A NATURAL EXPERIMENT Established by the Consumer Assistance to Recycle and Save Act of 2009, the U.S. “Cash for
Clunkers” program awarded two distinct cash rebates - $3,500 or $4,500 – to a consumer
replacing a gas-guzzler with a new, more fuel-efficient vehicle. The actual rebate amount
depended strictly on the improvement of fuel economy. For example, a consumer would receive
$3,500 for a new car rated 4 to 9 MPG (miles per gallon) higher than the trade-in vehicle and the
rebate would move up to $4,500 for an improvement of 10 MPG or more. For consumers looking
to buy new trucks (including most sport utility vehicles (SUVs)), the program lowered the
requirement, awarding $3,500 for an improvement of 2 to 4 MPG and $4,500 for 5 MPG or
more.
Table 1 shows the rebates for consumers buying new cars. Obviously, customers faced
different rebate schedules while choosing from the same stock of cars. From this aspect, the
program worked like an experiment. The treatment is the extra $1,000, applicable to some
vehicles for some consumer groups, assembled according to the MPG ratings of their trade-ins.
The observable outcome is each consumer group’s selections, defined as the percentage of the
consumers buying certain vehicles (e.g., 10% of the group purchased 22 MPG cars, 15%
purchased 23 MPG cars, etc.). The null hypothesis is that the treatment had no effect on these
percentages; that is, consumers bought the vehicles they always had in mind regardless of the
rebates.

DO PUBLIC SUBSIDES SELL GREEN CARS? BELFER CENTER 2010-17
4
In this regard, the program had two additional restrictions that strengthened and simplified
this natural experiment. First, consumers could not change their rebate schedules by buying used
vehicles at the last minute, since trade-in vehicles were accepted only if they had been insured
and registered to the same consumers for the year before. Second, the program did not issue
credits for future orders so the consumers had to choose from a limited set of existing vehicles,
sign the contracts, and turn in their gas-guzzlers all at the same time.
As in any other experiment, artificial or natural, having a good control group is essential in
order to test this hypothesis as it can shed light on what would happen to the treatment group in
the absence of the treatment, thereby revealing the treatment effect. Here one consumer group
may be considered a suitable control for another if they both have similar tastes in vehicles. To
be more specific, when two consumer groups choose from several vehicle models under the
same conditions (e.g., prices, warranties, etc.), each model should attract similar percentages of
the consumers in either group.
Following this train of thought, it is convenient to focus on adjacent consumer groups such as
the groups trading-in vehicles rated 14 and 15 MPG. They both were eligible for the same
rebates, except that the 14 MPG consumer group would collect $1,000 more for buying 24 MPG
cars. So both groups can be compared in two steps. The first step is to study their selections on
vehicles with identical rebates; if similar percentages of both groups bought these cars, then one
group can control for the other in this experiment. The next step is to analyze the purchase of 24
DO PUBLIC SUBSIDES SELL GREEN CARS? BELFER CENTER 2010-17
5
MPG cars; the difference in their attractiveness to either group may be attributed to the extra
$1,000 for the 14 MPG consumer group.
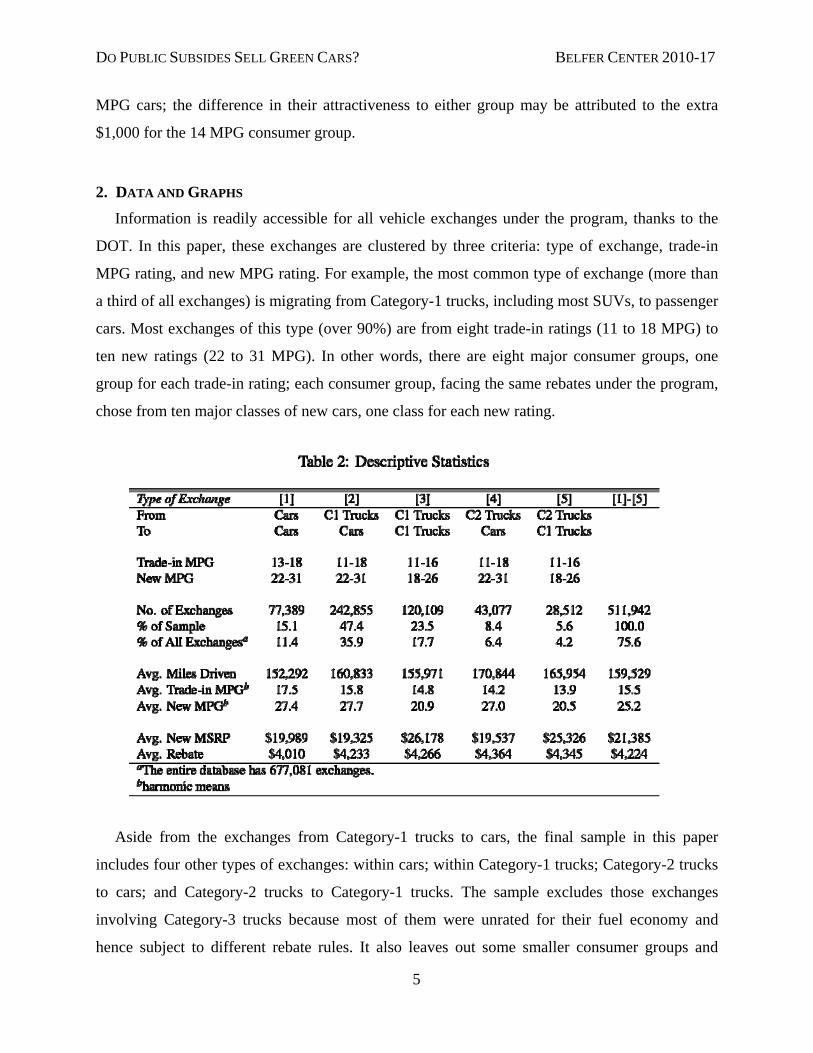
2. DATA AND GRAPHS Information is readily accessible for all vehicle exchanges under the program, thanks to the
DOT. In this paper, these exchanges are clustered by three criteria: type of exchange, trade-in
MPG rating, and new MPG rating. For example, the most common type of exchange (more than
a third of all exchanges) is migrating from Category-1 trucks, including most SUVs, to passenger
cars. Most exchanges of this type (over 90%) are from eight trade-in ratings (11 to 18 MPG) to
ten new ratings (22 to 31 MPG). In other words, there are eight major consumer groups, one
group for each trade-in rating; each consumer group, facing the same rebates under the program,
chose from ten major classes of new cars, one class for each new rating.
Aside from the exchanges from Category-1 trucks to cars, the final sample in this paper
includes four other types of exchanges: within cars; within Category-1 trucks; Category-2 trucks
to cars; and Category-2 trucks to Category-1 trucks. The sample excludes those exchanges
involving Category-3 trucks because most of them were unrated for their fuel economy and
hence subject to different rebate rules. It also leaves out some smaller consumer groups and

DO PUBLIC SUBSIDES SELL GREEN CARS? BELFER CENTER 2010-17
6
vehicle classes. After these exclusions, the sample has 34 consumer groups choosing from 10
classes of cars and 9 classes of Category-1 trucks, representing 75.6% of all of the exchanges
under the program (see Table 2 for other descriptive statistics).
Under each type of exchange, one consumer group’s selections are defined as the shares of its
purchased vehicles. For example, moving from Category-1 trucks to cars, 5.1% of the 14 MPG
consumer group bought 22 MPG cars, 3.1% bought 23 MPG cars, and so on. Once expressed this
way, these selections can be plotted and compared between adjacent consumer groups.
Figure 1[a] begins with the groups trading in 14 and 15 MPG Category-1 trucks for cars. As
outlined earlier, the first step is to compare both groups as they received the same rebates (i.e.,

DO PUBLIC SUBSIDES SELL GREEN CARS? BELFER CENTER 2010-17
7
$3,500 for cars rated 22 to 23 MPG and $4,500 for cars rated 25 to 31 MPG). These group
differences, highlighted in shades, are small. This suggests that both groups, making similar
selections under the same conditions, should have similar tastes in vehicles, making them good
control groups for each other. Next, the focus is on the remaining 24 MPG cars. The 14 MPG
consumer group received $1,000 more for these cars, and clearly a much larger percentage of
consumers bought them.
The same comparison expands to the other three pairs of consumer groups (see Figure 1[b],
1[c], and 1[d]). Repeatedly, adjacent groups showed very little differences in their preferences
for the cars tagged with identical rebates. But when one group received higher rebates on certain
cars, it favored these cars much more than the other group did. The extra rebates seem to have
sparked interest in the cars they sponsored, effectively changing the selections of the consumers.
To further investigate the connection between rebates and vehicle selections, all the consumer
groups in the sample are compared. While it is possible to replicate the earlier graphs many
times, these comparisons can also go into one place as in Figure 2, a density plot with two
cumulative distributions. The first distribution, formed by dots, represents all the differences in
selections with the same rebates. For example, the earlier Figure 1[a] supplies nice such
differences, calculated as follows: -0.04% for 22 MPG cars (5.12% of the 14 MPG consumer
group buying these cars minus 5.16% of the 15 MPG group doing so); 0.13% for 23 MPG cars
(3.13% of the former group minus 3.00% of the latter); and seven more differences for cars rated
25 to 31 MPG. The second distribution, formed by squares, represents the differences with one
consumer group receiving $1,000 more, and there is one such difference from Figure 1[a], which
is 6.64% for 24 MPG cars (16.65% of the 14 MPG consumer group minus 10.01% of the 15
MPG group).

DO PUBLIC SUBSIDES SELL GREEN CARS? BELFER CENTER 2010-17
8
As Figure 2 shows, the dots (group differences with identical rebates) cluster around 0% with
a mean of -0.57% and they are trapped in a narrow band: the 10th percentile is -2.23% and the
90th is 0.91%. In the comparisons covering the entire sample, adjacent consumer groups, when
offered the same rebates, still appeared to have similar tastes in vehicles when they were subject
to the same rebates. On the other hand, when the subsidies increased by $1,000 for one group,
the group differences are pronounced, as almost all of the representative squares are located at
the far right of the other distribution. That is, consumers seem to have strongly preferred vehicles
with higher rates.
So with the entire sample, the positive relationship between rebates and preferences is
consistent. Could it be a coincidence? When Congress initiated the program, it set only two
thresholds for higher rebates: fuel economy had to improve by at least 5 MPG for new trucks or
by 10 MPG for new cars. As a result, the extra $1,000 fell on different vehicles for any two
adjacent groups. It seems unlikely that this simple rule would by chance match the selections of
consumers so precisely, and a more plausible explanation is that the rebates caused some
consumers to ignore their original vehicles of choice and purchase those more generously
subsidized vehicles.
DO PUBLIC SUBSIDES SELL GREEN CARS? BELFER CENTER 2010-17
9
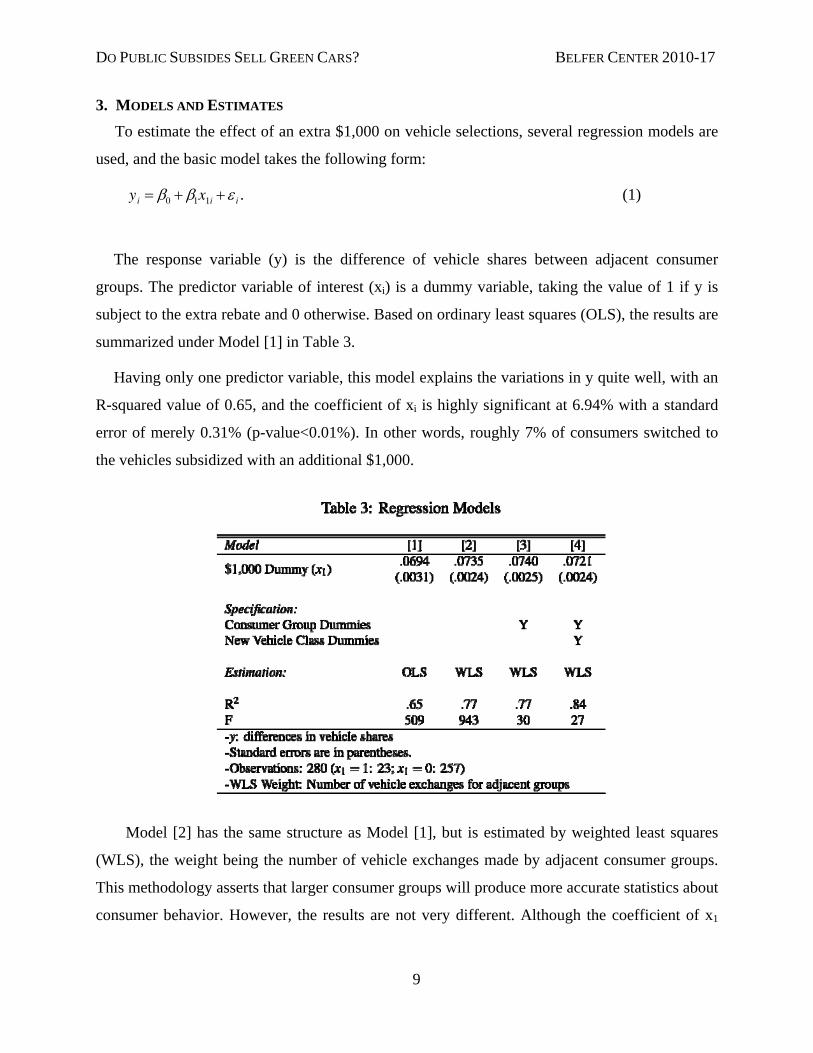
3. MODELS AND ESTIMATES To estimate the effect of an extra $1,000 on vehicle selections, several regression models are
used, and the basic model takes the following form:
yi = β0 + β1x1i +ε i . (1)
The response variable (y) is the difference of vehicle shares between adjacent consumer
groups. The predictor variable of interest (xi) is a dummy variable, taking the value of 1 if y is
subject to the extra rebate and 0 otherwise. Based on ordinary least squares (OLS), the results are
summarized under Model [1] in Table 3.
Having only one predictor variable, this model explains the variations in y quite well, with an
R-squared value of 0.65, and the coefficient of xi is highly significant at 6.94% with a standard
error of merely 0.31% (p-value<0.01%). In other words, roughly 7% of consumers switched to
the vehicles subsidized with an additional $1,000.
Model [2] has the same structure as Model [1], but is estimated by weighted least squares
(WLS), the weight being the number of vehicle exchanges made by adjacent consumer groups.
This methodology asserts that larger consumer groups will produce more accurate statistics about
consumer behavior. However, the results are not very different. Although the coefficient of x1

DO PUBLIC SUBSIDES SELL GREEN CARS? BELFER CENTER 2010-17
10
swells to 7.35%, the increase is not much more than the standard error. The effect of the rebates
seems to be stable on consumer groups of various sizes.
To control for predictor variables other than the rebates, Model [3] adds a dummy variable
for every consumer group and Model [4] introduces yet another dummy variable for every
vehicle class from which consumers chose. As before, both models yield similar results: the
coefficients of the $1,000 dummy range from 7.2% to 7.4% (Models [2], [3], [4]) with the
standard errors almost identical. In fact, the robustness of the estimates is expected: given that
the rebates were imposed without regard to other factors that could affect vehicle selections, the
effect of the rebates should not be sensitive to whether a model includes or excludes these other
factors.
In all four models, the differences of vehicle shares between groups (the y’s) are assumed to
be independent; however, they are actually dependent because shares of vehicles chosen by any
consumer group must add up to 100%. As consumers flocked to vehicles with higher rebates, the
shares of these vehicles would increase, but the shares of the other vehicles would also fall (for
example, up 8% for 15 MPG cars, but down 2% for 16 MPG cars, 2% for 17 MPG cars, and so
on). Compared to a control group, these changes in selections would result in a positive y with x1
= 1, and several negative y’s with x1 = 0. In a regression, then, the coefficient of x1 may be
exaggerated, making the effect of the rebates bias upward. Fortunately, this should be a minor
bias since only a small portion (8.2%) of the observations come with x1 = 1, and it is unlikely
that they are able to suppress the remaining observations to any meaningful degree.
In summary, all the models confirm that awarding an additional $1,000 clearly had an effect
on consumers, drawing roughly 7.2% of them to those subsidized vehicles, even though $1,000
was only 4.7% of the average vehicle price of $21,385 (or 5.6% after the initial $3,500 for all the
consumers in the program). This point estimate may be extrapolated to shed light on the overall
effect of the program, which on average gave away $4,224 per vehicle (19.8% of the price). For
example, if consumers responded to percentage drops in price, the program could have
convinced roughly 25% of them to buy more fuel-efficient vehicles (19.8%/5.6% × 7.2%). On
the other hand, if they responded to each rebate dollar the same way, the estimate grows to 30%
($4,224/$1,000 × 7.2%). These two estimates are not far off what the DOT found in its survey; in

DO PUBLIC SUBSIDES SELL GREEN CARS? BELFER CENTER 2010-17
11
which 23% of the consumers stated that they gave up plans to buy larger vehicles because of the
rebates.
4. CONCLUSION This paper views the 2009 U.S. “Cash for Clunkers” program as a natural experiment in
evaluating the relationship between public subsidies and consumer vehicle choice. Based on
actual purchase data, this paper shows that not only did the program create a surge in vehicle
sales at a difficult time for the economy, but it may have also induced a substantial number of
consumers to purchase more fuel-efficient vehicles – vehicles they would not have purchased
otherwise, resulting in reductions in fuel consumption and emissions. This finding suggests that
public subsidies may be used to advance environmental goals in addition to stimulating the
economy. However, these subsidies are costly and future research and policy should focus on
how to fund these types of programs. One option, as many have pointed out, is to tax sales of
gas-guzzlers and use the revenues to subsidize green vehicles, thereby alleviating the burden on
the general budget. In fact, this option could magnify the price difference between both types of
vehicles and provide an even stronger incentive for consumers to choose green vehicles.

DO PUBLIC SUBSIDES SELL GREEN CARS? BELFER CENTER 2010-17
12
REFERENCES [1] J.D. Angrist and J.S. Pischke, Mostly Harmless Econometrics: An Empiricist’s Companion,
Princeton University Press, 2009.
[2] S. Berry, J. Levinsohn, and A. Pakes, Automobile prices in market equilibrium, Econometrica
63 (1995), no. 4, 841–890.
[3] _____, Differentiated products demand systems from a combination of micro and macro
data: the new car market, Journal of Political Economy 112 (2004), no. 1, 68–105.
[4] M. Busse, J. Silva-Risso, and F. Zettelmeyer, $1,000 Cash back: The pass-through of auto
manufacturer promotions, American Economic Review 96 (2006), no. 4, 1253–1270.
[5] A. Cooper, Y. Chen, and S. McAlinden, The Economic and Fiscal Contributions of the
“Cash for Clunkers” Program—National and State Effects, Center for Automotive Research,
January 2010.
[6] R.W. Crandall, Policy watch: corporate average fuel economy standards, Journal of
Economic Perspectives 6 (1992), no. 2, 171–180.
[7] K.S. Gallagher and E. Muehlegger, Giving Green to Get Green? Incentives and consumer
adoption of hybrid vehicle technology, John F. Kennedy School of Government Faculty Research
Working Paper Series (2008).
[8] D.L. Greene, P.D. Patterson, M. Singh, and J. Li, Feebates, rebates and gas-guzzler taxes: a
study of incentives for increased fuel economy, Energy Policy 33 (2005), no. 6, 757 – 775.
[9] S. Li and A. Beresteanu, Gasoline prices, government support, and the demand for hybrid
vehicles, International Economic Review (forthcoming).
[10] P.S. McCarthy, Market price and income elasticities of new vehicle demands, Review of
Economics and Statistics 78 (1996), no. 3, 543–547.
[11] D. McFadden, Conditional logit analysis of qualitative choice behavior, Frontiers in Econo-
metrics (1974), 105.
[12] B.D. Meyer, Natural and quasi-experiments in economics, Journal of business & economic
statistics 13 (1995), no. 2, 151–161.
[13] M. Sivak and B. Schoettle, The effect of the “Cash for Clunkers” program on the overall fuel
economy of purchased new vehicles, Report No. UMTRI-2009-34, University of Michigan, Ann
Arbor, Transportation Research Institute, September 2009.

DO PUBLIC SUBSIDES SELL GREEN CARS? BELFER CENTER 2010-17
13
[14] K.E. Train and C. Winston, Vehicle choice behavior and the declining market share of US
automakers, International Economic Review 48 (2007), no. 4, 1469–1496.
[15] U.S. Department of Transportation National Highway Traffic Safety Administration National
Highway Traffic Safety Administration, Transaction Data and Reports, www.cars.gov/carsreport
(data date: November 11, 2009).
[16] _____, Consumer Assistance to Consumer Assistance to Recycle and Save Act of 2009: Report
to Congress, December 2009.


Belfer Center for Science and International AffairsHarvard Kennedy School79 JFK StreetCambridge, MA 02138Fax: (617) 495-8963Email: [email protected]: http://belfercenter.org
Copyright 2010 President and Fellows of Harvard College