do not refresh this file - gmr - investor...
TRANSCRIPT
Do not refresh this file
0
GMR INFRASTRUCTURE LTD FINANCIAL / OPERATIONAL OVERVIEW
Q4 FY 2012-13
1
Presentation Flow
Glossary … 2
Major Highlights … 3
Industry Overview … 8
Airports Sector … 11
Energy Sector … 31
Highways Sector … 47
EPC & Others: Financial Performance … 64
Consolidated Financial Performance … 67

2
Glossary
PG Power Gas
PC Power Coal
PL Power LSHS
PS Power Solar
PT Power Transmission
CL Coal
HEG Homeland Energy Group
GEMs Golden Energy Mines
HMACPL Hyderabad Menzies Air Cargo
GETL GMR Energy Trading
PTD Power Trading
HT Highways Toll
HA Highways Annuity
Disclaimer: Totals in some columns / rows may not agree due to rounding off.

3
Airports
Operational Highlights: DIAL
• Tariff Order by AERA – An increase of 352% on Aero Charges implemented from 15th May 2012.
• AERA has reduced ADF rates at IGI Airport to Rs. 100/- per embarking domestic passenger and Rs. 600/- per embarking international passenger w.e.f. 01.01.2013 while extending its collection duration to April ‘16. Consequently, the threat of discontinuation of ADF does not subsist.
• Sydney and Delhi Airports announced a strategic partnership to strengthen the Australia-India market and work on bringing together the largest markets not yet connected with direct services.
GHIAL
• Saudi Arabian Airlines freighter commenced “HYD” as technical stop for its route Hong Kong – Hyderabad – Jeddah from 29th Dec, 12. (1 frequency per week)
• Cathay Pacific Airways announced the commencement of their Hyderabad to Hong Kong flights from 1st of December, 2012.
• Andhra Pradesh State Road Transport Corporation (APSRTC) officially flagged off Pushpak bus services from Hyderabad Airport on 14th December, 2012. GHIAL partnered with APSRTC as the new operator for the Luxury Express Bus Services between the airport and city.
Major Highlights during FY13
Passenger Traffic (mn) Q4-2013 Q4-2012 FY 2013 FY 2012 ATM (Nos '000) Q4-2013 Q4-2012 FY 2013 FY 2012
DIAL 9.25 9.10 34.37 35.88 DIAL 74.07 78.47 300.92 317.28
GHIAL 2.12 2.13 8.38 8.60 GHIAL 21.94 25.18 90.65 99.66
ISGIA 3.45 2.98 15.34 13.82 ISGIA 28.08 24.90 128.38 117.24
Total 14.82 14.21 58.08 58.31 Total 124.09 128.55 519.95 534.18

4
ISGIA • Turkish Airlines has announced to progressively base 5 more aircrafts at ISGAI starting from summer 2013 (CY). This development
will add at least 0.4 mn International passengers in CY 2013.
Awards & Recognition DIAL • DIAL has been awarded the ‘Highly Commended’ Award in over 20 million passengers category in the Routes Airport Marketing
Awards 2013 held in Mumbai from 17th – 19th March, 2013.
• Delhi Airport ranked 2nd in the world in 25-40 mppa category in Service Quality (ASQ)
• First airport in the world and the second such company in the world to be Certified in Standards -based SAM for Organizations (CSSO) ISO 19770-1, by Business Software Alliance (BSA).
• CII Award for best energy efficient building and most informative presentation on energy efficiency.
• Became the 5th Asia-Pacific Airport to be Airport Carbon Accredited.
• DIAL becomes 6th Airport in World to attain ITSMS (Information Technology Service Management System) - ISO 20K Certification.
• CNBC Awaaz Travel Awards 2012 - Delhi Airport adjudged as the Best Managed Airport.
Major Highlights during FY13

5
GHIAL
• GHIAL added another feather to its cap by winning the 2013 Air Transport News (ATN) award for Airport of the Year under 10 Million Passengers, at the 2013 ATN Awards Ceremony held at the Hilton Bonaventure in Montreal, Canada.
• GHIAL has been awarded the prestigious National Tourism Award 2011-’12 under the Best Airport category. The airport has been adjudged as the best airport in India for actively promoting tourism, not only in Andhra Pradesh but also at the pan India level.
• Hyderabad Airport ranked 2nd in the world in 5-15 mppa category in Service Quality (ASQ).
• Adjudged as “The Best Cargo Airport & Best Cargo Terminal of the Year” by Air Cargo Association of India.
• GHIAL has won the prestigious “Best Management Award” from the Government of Andhra Pradesh at the State May Day function held on 1st May, 2013, at Ravindra Bharathi Auditorium, Hyderabad.
• Level 2 Accreditation awarded by ACI on Airport Carbon Emission reduction initiative.
ISGIA
• Sabiha Gokcen Airport was awarded the SUPERBRAND 2012 status during the Turkey’s Super Brands - 2012 Program in Turkey, Istanbul.
Major Highlights during FY13

6
Energy Operational Highlights:
• Divested entire 70% interest in GMR Energy (Singapore) Pte Ltd (“GMRE”).
• Divested stakes in Eloff and Kendal mines of Homeland Energy.
• The first unit of GMR Group's 2 X 300 MW coal based power project at Warora (EMCO), near Nagpur in Maharashtra, has successfully commissioned Commercial Operation on March 19, 2013.
• The first unit of GMR Group's 3 X 350 MW coal based power project at Kamalanga, near Dhenkanal in Odisha, has successfully commissioned Commercial Operation on April 30, 2013.
• APCC has introduced the EPSS (Expensive Power Supply Scheme) wherein DISCOMs shall procure expensive power based on RLNG from four plants (VPGL being one of them) as of now and sell to willing buyers.
Major Highlights during FY13
PLF Q4-2013 Q4-2012 FY 2013 FY 2012
PG-I GEL 4% 43% 19% 57%
PL-I GPCPL 42% 47% 36% 51%
PG-II VPGL 9% 45% 26% 59%
PC-II EMCO* 53% - 53% -
PS-I Gujarat Solar 21% 14% 19% 14%
* Unit I – 300 MW commenced operation only on 19-03-2013

7
Highways
Operational Highlights:
• Toll rates have been increased from September 1, 2012 on account of Inflation adjustment:
• Divested 74% stake in GMR Jadcherla Expressways Limited.
• Hungund - Hospet has commenced Toll collection at 2 out of the 3 Toll Plazas on 23rd November 2012 based on partial completion of the Project ahead of schedule.
• Commencement of Commercial Operations of the Hyderabad - Vijayawada Highway on 20th December 2012.
• In January 2013, the concession agreement entered into with NHAI for the Kishangarh – Udaipur – Ahmedabad (KUA) Project has been terminated. However, GMR has submitted its revised proposal to NHAI for consideration.
Asset Inflation Adjustment
HT-I GACEPL 8.95%
HT-II GJEPL 8.35%
HT-III GUEPL 8.35%
Major Highlights during FY13
Vehicle Traffic (mn) Q4-2013 Q4-2012 FY 2013 FY 2012
HT-I GACEPL 2.11 2.02 8.52 7.97
HT-II GJEPL 1.54 1.50 6.12 5.79
HT-III GUEPL 1.92 1.69 7.50 6.52
HT-IV GHVEPL* 3.74 - 3.90 -
HT-V GHHEPL** 1.15 - 1.65 -
Total 9.32 5.21 26.04 20.28
* GHVEPL - commenced operations only on 20-12-2012 ** GHHEPL – 2 out of 3 toll plazas commenced operations only on 23-11-2012

8
Energy
• Installed Capacity (Target / Achievement): (Source: CEA report)
• Electricity Generation (Target / Achievement): (Source: CEA report)
• All India Generation for the period April 2012 to March, 2013, All India Generation was 911.65 BU compared to 876.89 BU over the last year giving a growth of 3.96% and it is 98.03% of the target (Source: CEA report)
• The Plant Load Factor (PLF) for the period from April, 2012 to March, 2013 is 69.95%, 78.50%, 40.28% for Thermal, Nuclear and Gas respectively (Source: CEA report)
• Country faced a huge Power deficit during April-March 2013 of 12,159 MW during the peak hours (Source: CEA report)
• MoPNG has allowed clubbing or diversion of scarce natural gas between two or more power plants of the same company to improve output such that the end use of the diverted gas would remain the same (Source: India Infrastructure magazine)
• GAIL has been allowed by the US to ship Shale gas to India, which marks an exception to the US’s restrictive export policy. The project is on schedule and the first supply is expected by 2017-18 (Source: India Infrastructure magazine)
Cont …..
Industry Overview
17,956 20,623 2,23,343
Programme (MW) for
FY 2012-13
Achievement (MW)
upto March 2013
Installed Capacity (MW)
as on March 2013
Hydro Thermal Nuclear Import Total
MU 1,22,045 7,67,275 35,200 5,480 9,30,000
MU 1,13,262 7,60,366 32,871 4,789 9,11,288
% 93% 99% 93% 87% 98%
Achievement upto March 2013
Target upto March 2013

9
Industry Overview
• Pooled pricing of coal will become a reality only from FY14, as the stakeholders have not been able to arrive at a conclusive framework. The Ministries were unable to reach a consensus on issues such as differential pricing (difference between the imported and domestically produced coal) and how much power capacity is stranded because of fuel shortage (Source: Hindu Business Line)
• The Budget has provided a new lease of life to the wind energy sector by reintroducing generation based incentives and providing Rs 800 crore to the Ministry of New and Renewable Energy for the purpose. (Source: The New Indian Express)
• CERC has agreed to set up a committee to recommend a compensatory tariff for Adani Power Limited and TATA Power Limited. The compensatory tariff would be over and above PPA tariffs (Source: Edelweiss – Power Sector Update)
• Coal India may import as much as 20 million tonnes of the fuel in FY14 to comply with orders to increase supplies to power utilities and avoid paying penalties (Source: Financial Chronicle)
• The Ministry of Power (MoP) has extended the deadline for discoms to opt for the Scheme for Financial Restructuring of State Distribution Companies to June 30, 2013. (Source: India Infrastructure magazine)
• 10 states have come on board to avail of Centre's ambitious financial restructuring scheme for discoms. (Source: Economic Times)
• The Central Government has constituted an inter-ministerial panel to formulate a policy on PPP with Coal India Limited as one of the partners (Source: India Infrastructure magazine)
• All Hydro Power Projects coming into operation will have to pay cost of one per cent of total generation capacity to project affected families (Source: India Infrastructure magazine)
• The Union Budget 2013-14 has announced a hike in the basic custom duty on steam coal from nil to 2% and in Countervailing Duty from 1% to 2% (Source: India Infrastructure magazine)
• The MoP has launched a credit rating mechanism to assess the financial and operational performance of state discoms on an annual basis (Source: India Infrastructure magazine)

10
Industry Overview
Highways
• As per NHAI Chairman, there is not enough capacity in the system to construct 7,000-8,000 kilometer (km) of highways every year,
that too on PPP basis. The Government should set a more realistic target on road construction of about 3,000-4,000 km a year. (Source: Transreporter.com)
• Finance Minister has planned setting up of an independent regulatory authority, a move which was welcomed by highway developers. The proposed Regulatory Authority is likely to be a three-member body, with a chairman and two members (Source: India Infrastructure magazine & Transreporter.com)
• Stalled highway projects worth RS 27,000 crore could get a fresh lease of life, with the SC ruling that requisite environmental approvals may be delinked from forest clearances. (Source: The Economic Times)
• NHAI is planning to extend support to Road developers facing issues in raising finances (both Debt & Equity) for projects secured on a premium basis. (Source: India Infrastructure magazine)
• NHAI awarded just 1,100 km in FY13 vs. a target of ~9,000 km. Ordering was significantly lower than in any of the last three years (avg. 4500+ km pa) because many projects awarded in FY11-12 have been stalled. Backlog has ballooned 3x over the last 4 years to ~9,000 kms (Source: Infrastructure Sector Update – Axis Capital)
• The National Highways Builders Federation has demanded that NHAI obtain all requisite clearances and complete land acquisition before inviting bids (Source: India Infrastructure magazine)
• The MoF has accepted the MoRTH’s proposal to shorten the approval process prior to inviting bids for road projects (Source: India Infrastructure magazine)

Airports Sector

12
Delhi International Airport: Operational Performance
Traffic Q3-2013 Q4-2013 Q4-2012 FY 2013 FY 2012 Q4-Q4 Q4-Q3 Y-o-Y
Passenger (mn)
Arriving
Domestic 2.71 2.95 3.11 11.38 12.41 -5% 9% -8%
International 1.55 1.64 1.42 5.54 5.19 15% 6% 7%
Departing
Domestic 2.83 2.85 3.04 11.42 12.72 -6% 1% -10%
International 1.53 1.82 1.53 6.02 5.56 19% 19% 8%
Total
Domestic 5.54 5.79 6.14 22.80 25.13 -6% 5% -9%
International 3.07 3.46 2.95 11.57 10.75 17% 13% 8%
Total Passengers 8.61 9.25 9.10 34.37 35.88 2% 7% -4%
ATMs (Nos`000)
Domestic 53.30 53.13 59.92 220.32 240.35 -11% 0% -8%
International 21.41 20.95 18.55 80.60 76.94 13% -2% 5%
Total ATM's 74.70 74.07 78.47 300.92 317.28 -6% -1% -5%
Cargo (`000 in Tons)
Domestic 46.55 44.88 50.76 188.18 200.53 -12% -4% -6%
International 88.71 91.51 88.43 358.13 367.63 3% 3% -3%
Total Cargo 135.26 136.39 139.19 546.31 568.16 -2% 1% -4%
1
2
1 2 & Refer point 1 in slide no. 17
13
Rs. mn
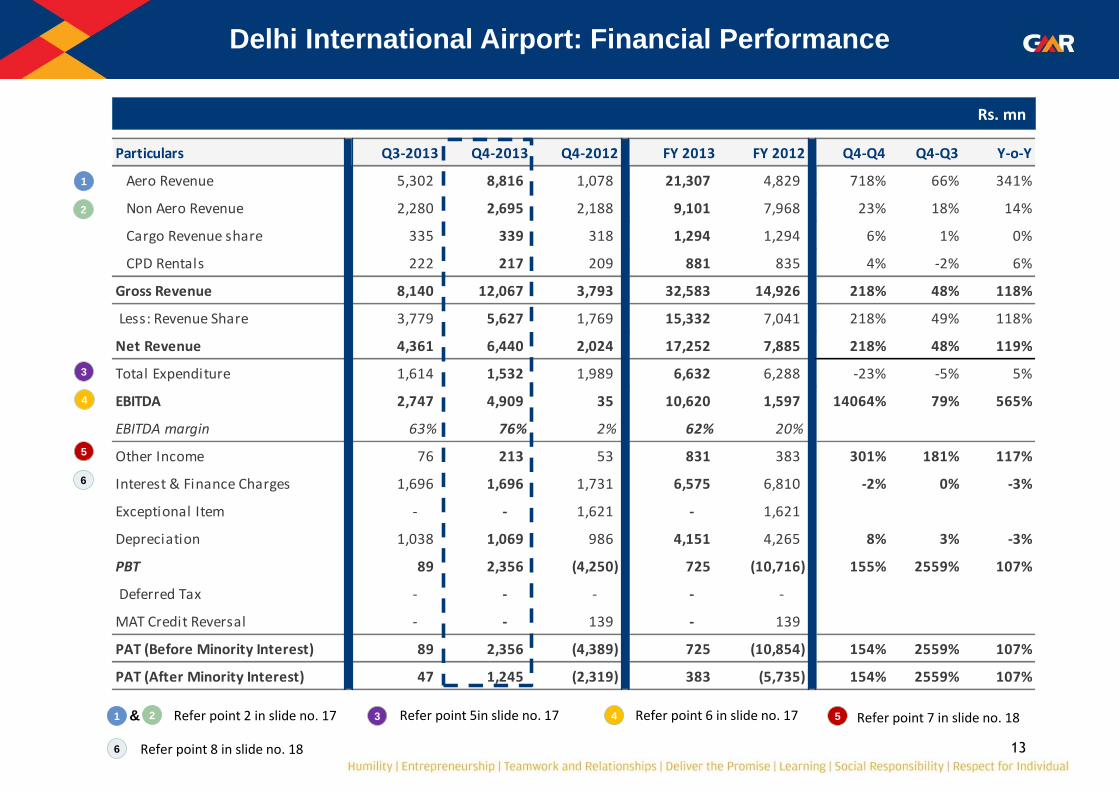
Delhi International Airport: Financial Performance
1
2
1 2 & Refer point 2 in slide no. 17
4
3 4 Refer point 5in slide no. 17
3
Particulars Q3-2013 Q4-2013 Q4-2012 FY 2013 FY 2012 Q4-Q4 Q4-Q3 Y-o-Y
Aero Revenue 5,302 8,816 1,078 21,307 4,829 718% 66% 341%
Non Aero Revenue 2,280 2,695 2,188 9,101 7,968 23% 18% 14%
Cargo Revenue share 335 339 318 1,294 1,294 6% 1% 0%
CPD Rentals 222 217 209 881 835 4% -2% 6%
Gross Revenue 8,140 12,067 3,793 32,583 14,926 218% 48% 118%
Less: Revenue Share 3,779 5,627 1,769 15,332 7,041 218% 49% 118%
Net Revenue 4,361 6,440 2,024 17,252 7,885 218% 48% 119%
Total Expenditure 1,614 1,532 1,989 6,632 6,288 -23% -5% 5%
EBITDA 2,747 4,909 35 10,620 1,597 14064% 79% 565%
EBITDA margin 63% 76% 2% 62% 20%
Other Income 76 213 53 831 383 301% 181% 117%
Interest & Finance Charges 1,696 1,696 1,731 6,575 6,810 -2% 0% -3%
Exceptional Item - - 1,621 - 1,621
Depreciation 1,038 1,069 986 4,151 4,265 8% 3% -3%
PBT 89 2,356 (4,250) 725 (10,716) 155% 2559% 107%
Deferred Tax - - - - -
MAT Credit Reversal - - 139 - 139
PAT (Before Minority Interest) 89 2,356 (4,389) 725 (10,854) 154% 2559% 107%
PAT (After Minority Interest) 47 1,245 (2,319) 383 (5,735) 154% 2559% 107%
5
5 Refer point 6 in slide no. 17
6
6
Refer point 7 in slide no. 18
Refer point 8 in slide no. 18

14
Delhi International Airport: Financial Analysis
Amt in Rs.
Non aero revenue excluding Cargo Revenue Share and CPD Rentals
1
1
Revenue retained in JVs = Total Revenue of JVs less Revenue Share paid to DIAL 2
2
Per passenger (departing & arriving) Q3-2013 Q4-2013 Q4-2012 FY 2013 FY 2012 Q4-Q4 Q4-Q3 Y-o-Y
Aero Revenue (other than UDF/PSF) 194 333 86 225 99 289% 72% 128%
UDF/ PSF 422 620 33 395 36 1787% 47% 1005%
Non Aero Revenue 265 291 241 265 222 21% 10% 19%
Total Revenue excluding CPD and Cargo
revenue share881 1,244 359 885 357 246% 41% 148%
Total Gross revenue 946 1,304 417 948 416 213% 38% 128%
Total Net revenue 507 696 223 502 220 213% 37% 128%
Opn. & Admin. Expenses 188 166 219 193 175 -24% -12% 10%
EBITDA 319 531 4 309 45 13824% 66% 594%
Per ATM
Aero Revenue 70,976 1,19,018 13,740 70,805 15,220 766% 68% 365%
Per tonne
Cargo Revenue 2,477 2,483 2,285 2,368 2,278 9% 0% 4%
Per passenger (departing & arriving)
Revenue Retained in JV’s 301 394 264 49% 31%
Refer point 6 in slide no. 17 3
3

15
Revenue Analysis for the quarter ended March 31, 2013
Delhi International Airport: Revenue Analysis
*Includes only Revenue share from JV’s ** Is a summation of space & license fee received
Growth
Revenue Share
from JV*Direct Total
per pax
(in Rs.)% of Total
Revenue Share
from JV*Direct Total
per pax
(in Rs.)% of Total
Aero revenue :
Landing & Parking - 3,032 3,032 328 34% - 769 769 85 71% 294%
UDF/PSF - 5,733 5,733 620 65% - 299 299 33 28% 1820%
Others - 51 51 6 1% - 10 10 1 1% 424%
Total Aero Revenue (A) 8,816 8,816 953 100% 1,078 1,078 119 100% 718%
Non Aero Revenue:
Fuel Farm - 308 308 33 11% - 378 378 42 17% -19%
Ground Handling 12 280 292 32 11% 11 151 162 18 7% 80%
Flight Catering - 98 98 11 4% - 92 92 10 4% 7%
Advertisement 200 5 205 22 8% 122 18 141 15 6% 46%
Retail 521 174 695 75 26% 451 144 595 65 27% 17%
Food & Beverage 36 65 101 11 4% 49 126 175 19 8% -42%
Other Services 17 238 254 27 9% 17 247 264 29 12% -4%
Total Non-Aero excluding Land & Space 786 1,167 1,953 211 72% 651 1,156 1,806 199 83% 8%
Land & Space (for hanger / office etc.) ** 112 631 742 80 28% 155 226 381 42 17% 95%
Total Non-Aero including Land & Space (B) 898 1,797 2,695 291 100% 806 1,382 2,187 241 100% 23%
Cargo (C) 294 45 339 37 0% 256 62 318 35 0% 6%
Total Revenue (A+B+C) 1,192 10,658 11,850 1,281 1,061 2,522 3,583 394 231%
Q4-Q4Particulars
Q4-2013 Q4-2012
(Rs. in mn) (Rs. in mn)
1
1
2
2
Refer point 3 in slide no. 17 &
Refer point 4 in slide no. 17
3
3
16
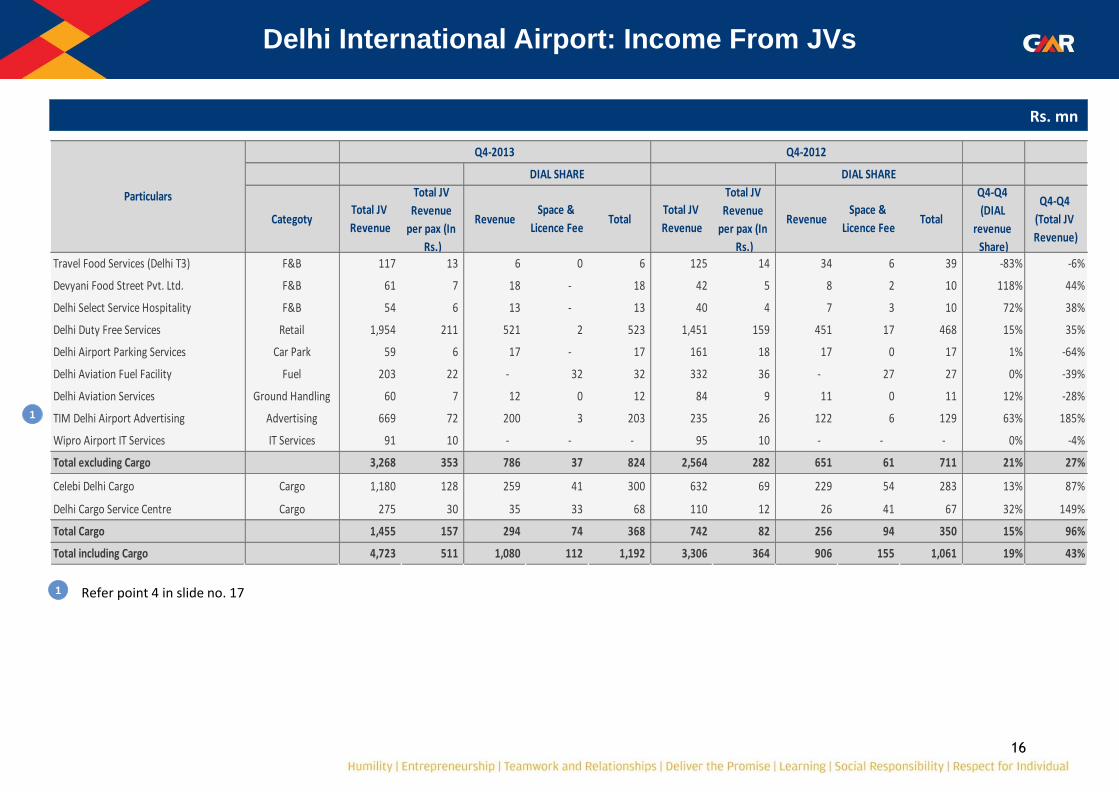
Delhi International Airport: Income From JVs
Rs. mn
CategotyTotal JV
Revenue
Total JV
Revenue
per pax (In
Rs.)
Revenue Space &
Licence FeeTotal
Total JV
Revenue
Total JV
Revenue
per pax (In
Rs.)
Revenue Space &
Licence FeeTotal
Q4-Q4
(DIAL
revenue
Share)
Q4-Q4
(Total JV
Revenue)
Travel Food Services (Delhi T3) F&B 117 13 6 0 6 125 14 34 6 39 -83% -6%
Devyani Food Street Pvt. Ltd. F&B 61 7 18 - 18 42 5 8 2 10 118% 44%
Delhi Select Service Hospitality F&B 54 6 13 - 13 40 4 7 3 10 72% 38%
Delhi Duty Free Services Retail 1,954 211 521 2 523 1,451 159 451 17 468 15% 35%
Delhi Airport Parking Services Car Park 59 6 17 - 17 161 18 17 0 17 1% -64%
Delhi Aviation Fuel Facility Fuel 203 22 - 32 32 332 36 - 27 27 0% -39%
Delhi Aviation Services Ground Handling 60 7 12 0 12 84 9 11 0 11 12% -28%
TIM Delhi Airport Advertising Advertising 669 72 200 3 203 235 26 122 6 129 63% 185%
Wipro Airport IT Services IT Services 91 10 - - - 95 10 - - - 0% -4%
Total excluding Cargo 3,268 353 786 37 824 2,564 282 651 61 711 21% 27%
Celebi Delhi Cargo Cargo 1,180 128 259 41 300 632 69 229 54 283 13% 87%
Delhi Cargo Service Centre Cargo 275 30 35 33 68 110 12 26 41 67 32% 149%
Total Cargo 1,455 157 294 74 368 742 82 256 94 350 15% 96%
Total including Cargo 4,723 511 1,080 112 1,192 3,306 364 906 155 1,061 19% 43%
Particulars
Q4-2013 Q4-2012
DIAL SHARE DIAL SHARE
1
1 Refer point 4 in slide no. 17

17
1. Y-o-Y decrease in domestic PAX, domestic ATMs is due to withdrawal of KF operations.
2. Management has decided to revert on accrual basis of accounting in case of NACIL revenues since there has been reasonable certainty of collection in line with clause 9.2 of AS-9 “Revenue Recognition”. In the current quarter an amount of Rs 4,120 mn has been recognized as revenues from NACIL: Rs. mn
3. Ground Handling, Land & space has increased in Q4FY13 as compared to the previous quarter on account of recognition of revenue on accrual basis from NACIL
4. Advertisement has increased in Q4FY13 as compared to Q4FY12 on account of additional site development.
5. Total Expenditure: a. Variation (Y-o-Y):
i. Increase on account of Repairs & Maintenance and IT related expenses. ii. Reduction on account of Employee cost and admin & operating expenses
b. Decreased as compared to Sequential Quarter: On account of optimization of expenses. c. Variation as compared to corresponding quarter:
i. Reduction in electricity and water charges due to effective utilization and recovery from NACIL. ii. Reduction in employee cost. iii. Reduction on account of timing difference – Certain expenses were booked in Q4FY12 pertaining to full year FY12.
6. EBITDA has increased in Q4FY13 as compared to sequential and corresponding quarter primarily on account of NACIL revenues.
Management Discussion & Analysis (MDA): DIAL
Receipt basis Accrual basis Total
Aero Revenue 2,140 1,460 3,600
Non Aero revenue 180 340 520
Total 2,320 1,800 4,120

18
7. Other income has increased mainly on account of Income from investment , Interest on Delayed Payment and Dividend Income.
8. Y-o-Y reduction in Interest and Finance charges - during Q2FY13, company has capitalized the foreign exchange difference of Rs.
178 mn pertaining to financial year 2011 - 12 and credited the same to the finance costs.
9. Receivables / Overdues as on 31-Mar-2013:
* Receivables include amounts from various airlines on account of credit terms extended as per normal business practice.
Management Discussion & Analysis (MDA): DIAL
Receivables* Normal Dues Overdue Receivables* Normal Dues Overdues
NACIL 2,280 313 1,968 NACIL 77 17 59
Kingfisher 14 0 14 Kingfisher - - -
Others 3,262 2,094 1,168 Others 52 34 18
Total 5,557 2,407 3,150 Total 129 51 78
Rs. mn
Aero / Non Aero Revenue (including PSF - Facilitation component) PSF (Security component)
Receivables* Normal Dues Overdues Receivables* Normal Dues Overdues
NACIL 684 26 658 NACIL 3,041 356 2,685
Kingfisher 335 - 335 Kingfisher 349 0 349
Others 114 66 48 Others 3,428 2,194 1,234
Total 1,132 92 1,041 Total 6,818 2,550 4,268
Rs. mn
ADF Total
19
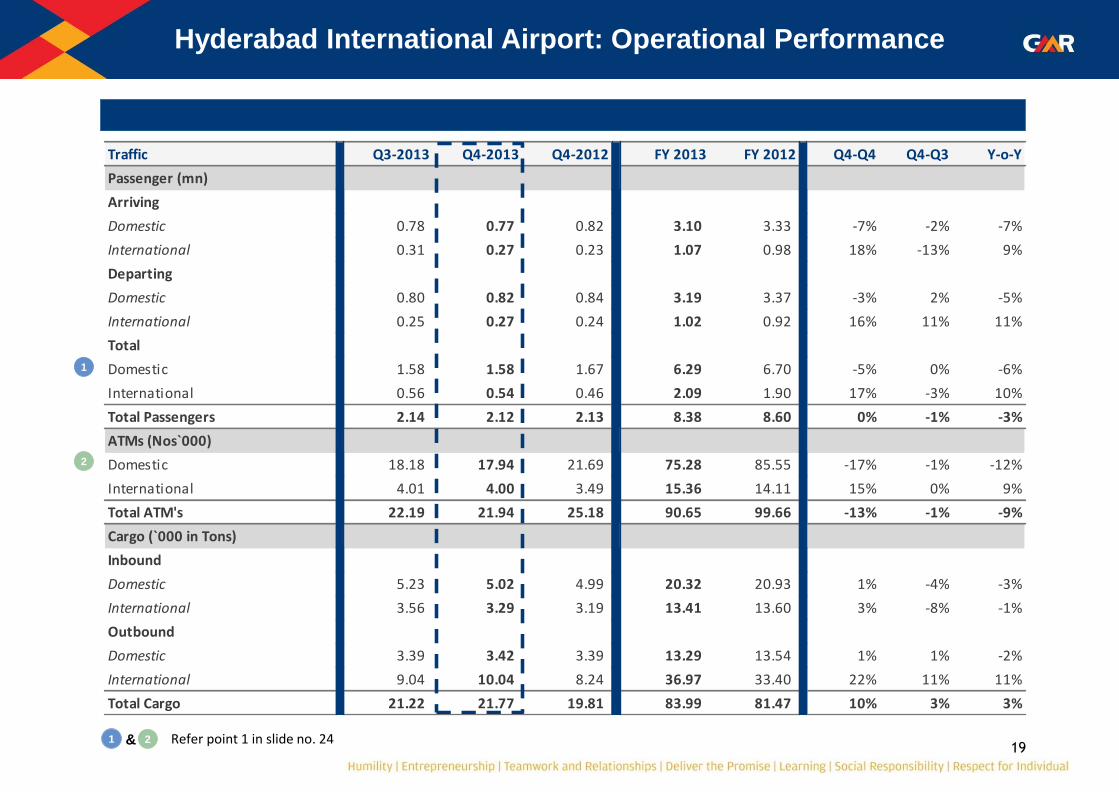
Hyderabad International Airport: Operational Performance
Traffic Q3-2013 Q4-2013 Q4-2012 FY 2013 FY 2012 Q4-Q4 Q4-Q3 Y-o-Y
Passenger (mn)
Arriving
Domestic 0.78 0.77 0.82 3.10 3.33 -7% -2% -7%
International 0.31 0.27 0.23 1.07 0.98 18% -13% 9%
Departing
Domestic 0.80 0.82 0.84 3.19 3.37 -3% 2% -5%
International 0.25 0.27 0.24 1.02 0.92 16% 11% 11%
Total
Domestic 1.58 1.58 1.67 6.29 6.70 -5% 0% -6%
International 0.56 0.54 0.46 2.09 1.90 17% -3% 10%
Total Passengers 2.14 2.12 2.13 8.38 8.60 0% -1% -3%
ATMs (Nos`000)
Domestic 18.18 17.94 21.69 75.28 85.55 -17% -1% -12%
International 4.01 4.00 3.49 15.36 14.11 15% 0% 9%
Total ATM's 22.19 21.94 25.18 90.65 99.66 -13% -1% -9%
Cargo (`000 in Tons)
Inbound
Domestic 5.23 5.02 4.99 20.32 20.93 1% -4% -3%
International 3.56 3.29 3.19 13.41 13.60 3% -8% -1%
Outbound
Domestic 3.39 3.42 3.39 13.29 13.54 1% 1% -2%
International 9.04 10.04 8.24 36.97 33.40 22% 11% 11%
Total Cargo 21.22 21.77 19.81 83.99 81.47 10% 3% 3%
2
1
1 Refer point 1 in slide no. 24 2 &

20
Hyderabad International Airport: Financial Performance
Rs. mn
1 Refer point 2 in slide no. 24 2 3
Q3-2013 Q4-2013 Q4-2012 FY 2013 FY 2012 Q4-Q4 Q4-Q3 Y-o-Y
Aero Revenue 819 1,701 816 4,233 3,503 108% 108% 21%
Non Aero Revenue 651 776 606 2,671 2,381 28% 19% 12%
Cargo Revenue Share 26 28 26 107 107 7% 6% 0%
Gross Revenue 1,496 2,505 1,448 7,011 5,991 73% 68% 17%
Less: Revenue Share 64 103 60 295 249 72% 63% 18%
Net Revenue 1,432 2,402 1,388 6,717 5,742 73% 68% 17%
Total Expenditure 554 666 633 2,196 2,168 5% 20% 1%
EBITDA 878 1,735 755 4,520 3,574 130% 98% 26%
EBITDA margin 61% 72% 54% 67% 62%
Other Income 92 79 50 357 256 56% -15% 39%
Interest & Finance Charges 516 486 527 2,018 2,177 -8% -6% -7%
Depreciation 317 316 305 1,269 1,205 3% 0% 5%
PBT 137 1,013 (27) 1,591 448 3909% 637% 255%
Current Tax - - (5) - 90
Deferred Tax 66 342 (25) 532 191
PAT (Before Minority Interest) 72 671 4 1,058 167 17673% 834% 533%
PAT (After Minority Interest) 45 423 2 667 105 17673% 834% 533%
& 4 5
6
Refer point 4 in slide no. 24 Refer point 5 in slide no. 24 Refer point 6 in slide no. 24
Refer point 7 in slide no. 24
1
2
4
3
5
6

21
Hyderabad International Airport: Financial Analysis
Amt in Rs.
1
1 Revenue retained in JVs = Total Revenue of JVs less Revenue Share paid to GHIAL
Per passenger (departing and arriving) Q3-2013 Q4-2013 Q4-2012 FY 2013 FY 2012 Q4-Q4 Q4-Q3 Y-o-Y
Aero revenue (other than UDF & PSF) 65 130 62 91 69 112% 99% 31%
UDF 289 607 291 376 306 109% 111% 23%
PSF 29 63 31 39 32 105% 116% 23%
Non-aero revenue 305 366 284 319 277 29% 20% 15%
Total Revenue excluding Cargo revenue 688 1,167 668 824 684 75% 70% 21%
Gross revenue 700 1,180 680 837 696 74% 68% 20%
Total Net revenue 671 1,131 652 802 668 74% 69% 20%
Expenses 259 314 297 262 252 6% 21% 4%
EBITDA 411 817 355 540 415 131% 99% 30%
Per departing pax
UDF 588 1,183 573 747 614 106% 101% 22%
Per ATM
Aero revenue 36,892 77,529 32,419 46,696 35,148 139% 110% 33%
Per tonne
Cargo revenue 1,239 1,277 1,314 1,274 1,316 -3% 3% -3%
Per passenger (departing & arriving)
Revenue Retained in JV’s 62 55 66 -16% 0%

22
Hyderabad International Airport: Revenue Analysis
*Includes only Revenue share from JV’s ** Is a summation of space revenue received
Revenue Analysis for the quarter ended March 31, 2013
Growth
Revenue Share
from JV*Direct Total
per pax
(in Rs.)% of total
Revenue Share
from JV*Direct Total
per pax
(in Rs.)% of total
Aero revenue
Landing & Parking charges - 277 277 130 16% - 131 131 62 16% 111%
UDF - 1,289 1,289 607 76% - 619 619 291 76% 108%
PSF - 135 135 63 8% - 66 66 31 8% 105%
Total Aero Revenue (A) 1,701 1,701 801 92% 816 816 383 100% 108%
Non Aero revenue:
Fuel Farm - 178 178 84 23% - 174 174 82 29% 2%
Ground Handling - 19 19 9 2% - 12 12 6 2% 51%
Flight Catering - 15 15 7 2% - 12 12 6 2% 18%
Retail - 209 209 98 27% - 152 152 71 25% 37%
Common Infra Charges - 111 111 53 14% - 60 60 28 10% 86%
Advertisement 58 - 58 27 7% 48 (1) 47 22 8% 23%
Misc & other Income - 37 37 18 5% - 31 31 15 5% 18%
Total Non-Aero excluding Land & Space 58 569 626 295 81% 48 441 489 230 81% 28%
Land & Space ** 14 135 150 71 19% 14 102 117 55 19% 29%
Total Non-Aero including Land & Space (B) 72 704 776 366 100% 62 543 606 284 100% 28%
Cargo (C) 28 - 28 13 100% 26 26 12 100% 7%
Total JV Revene Share (A+B+C) 100 2,405 2,505 1,180 88 1,360 1,448 680 73%
Q4-Q4Particulars
Q4-2013 Q4-2012
Rs. In mn Rs. in mn

23
Hyderabad International Airport: Income From JVs
Rs. mn
CategoryTotal JV
Revenue
Total JV
Revenue
per pax (In
Rs.)
Revenue Space Total Total JV
Revenue
Total JV
Revenue
per pax (In
Rs.)
Revenue Space Total
Q4-Q4
(GHIAL
revenue
Share)
Q4-Q4
(Total JV
Revenue)
HMACPL Cargo 145 68 28 14 42 134 63 26 14 40 7% 8%
Laqushya Media Advertisement 58 27 58 - 58 80 38 48 - 48 20% -28%
Total 202 95 86 14 100 214 100 74 14 88 16% -5%
Particulars
Q4-2013 Q4-2012
GHIAL SHARE GHIAL SHARE
24
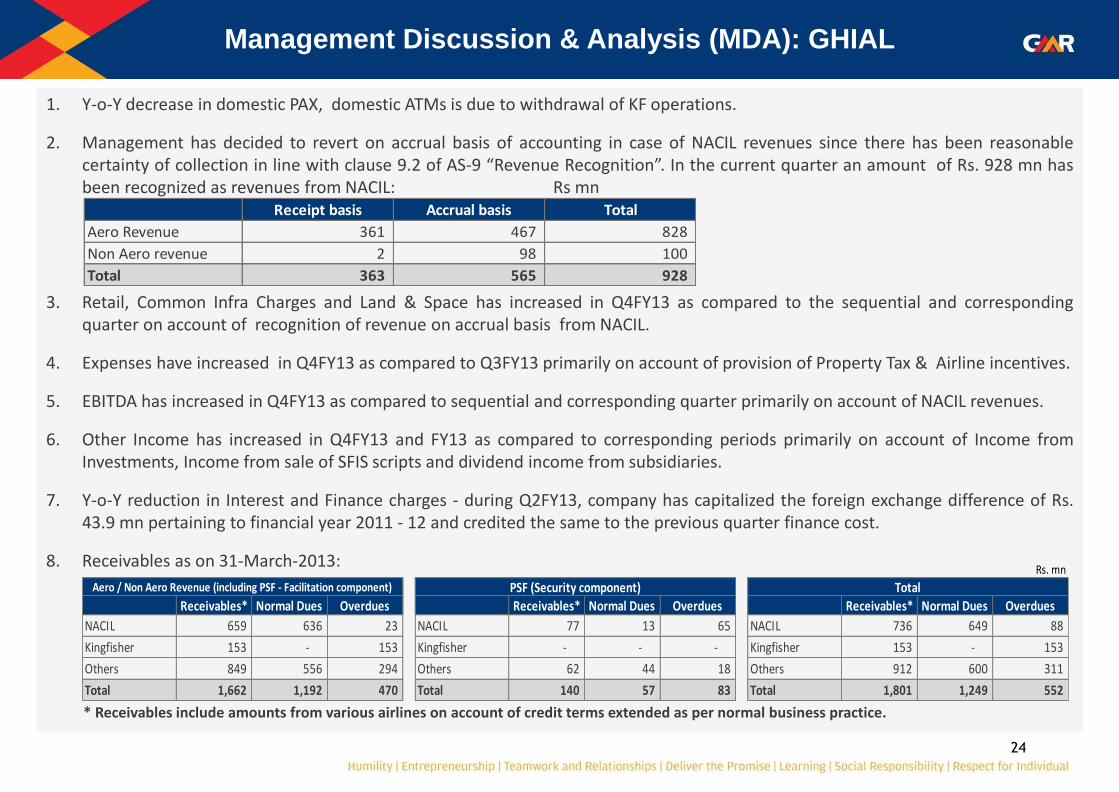
1. Y-o-Y decrease in domestic PAX, domestic ATMs is due to withdrawal of KF operations.
2. Management has decided to revert on accrual basis of accounting in case of NACIL revenues since there has been reasonable certainty of collection in line with clause 9.2 of AS-9 “Revenue Recognition”. In the current quarter an amount of Rs. 928 mn has been recognized as revenues from NACIL: Rs mn
3. Retail, Common Infra Charges and Land & Space has increased in Q4FY13 as compared to the sequential and corresponding quarter on account of recognition of revenue on accrual basis from NACIL.
4. Expenses have increased in Q4FY13 as compared to Q3FY13 primarily on account of provision of Property Tax & Airline incentives.
5. EBITDA has increased in Q4FY13 as compared to sequential and corresponding quarter primarily on account of NACIL revenues.
6. Other Income has increased in Q4FY13 and FY13 as compared to corresponding periods primarily on account of Income from Investments, Income from sale of SFIS scripts and dividend income from subsidiaries.
7. Y-o-Y reduction in Interest and Finance charges - during Q2FY13, company has capitalized the foreign exchange difference of Rs. 43.9 mn pertaining to financial year 2011 - 12 and credited the same to the previous quarter finance cost.
8. Receivables as on 31-March-2013:
* Receivables include amounts from various airlines on account of credit terms extended as per normal business practice.
Management Discussion & Analysis (MDA): GHIAL
Receipt basis Accrual basis Total
Aero Revenue 361 467 828
Non Aero revenue 2 98 100
Total 363 565 928
Rs. mn
Receivables* Normal Dues Overdues Receivables* Normal Dues Overdues Receivables* Normal Dues Overdues
NACIL 659 636 23 NACIL 77 13 65 NACIL 736 649 88
Kingfisher 153 - 153 Kingfisher - - - Kingfisher 153 - 153
Others 849 556 294 Others 62 44 18 Others 912 600 311
Total 1,662 1,192 470 Total 140 57 83 Total 1,801 1,249 552
Aero / Non Aero Revenue (including PSF - Facilitation component) PSF (Security component) Total

25
Turkey Airport (ISGIA): Operational Performance
Traffic Q3-2013 Q4-2013 Q4-2012 FY 2013 FY 2012 Q4-Q4 Q4-Q3 Y-o-Y
Passengers: (Mn)
Arriving
Domestic 1.14 1.13 1.03 4.96 4.59 10% -1% 8%
International 0.62 0.59 0.44 2.68 2.25 34% -4% 19%
Departing
Domestic 1.10 1.13 1.04 4.98 4.63 9% 3% 8%
International 0.66 0.59 0.47 2.71 2.35 26% -10% 16%
Total
Domestic 2.24 2.26 2.07 9.95 9.22 9% 1% 8%
International 1.27 1.19 0.91 5.39 4.60 30% -7% 17%
Total Passengers 3.51 3.45 2.98 15.34 13.82 16% -2% 11%
ATM: (Nos`000)
Domestic 17.78 17.15 16.09 76.51 74.09 7% -4% 3%
International 13.00 10.93 8.81 51.88 43.15 24% -16% 20%
Total ATM's 30.79 28.08 24.90 128.38 117.24 13% -9% 10%
Fuel Sales: (`000 in Tons)
Domestic 19.20 12.99 12.89 64.24 65.13 1% -32% -1%
International 33.08 15.64 25.26 114.11 137.27 -38% -53% -17%
Total Fuel 52.29 28.63 38.14 178.35 202.40 -25% -45% -12%
26
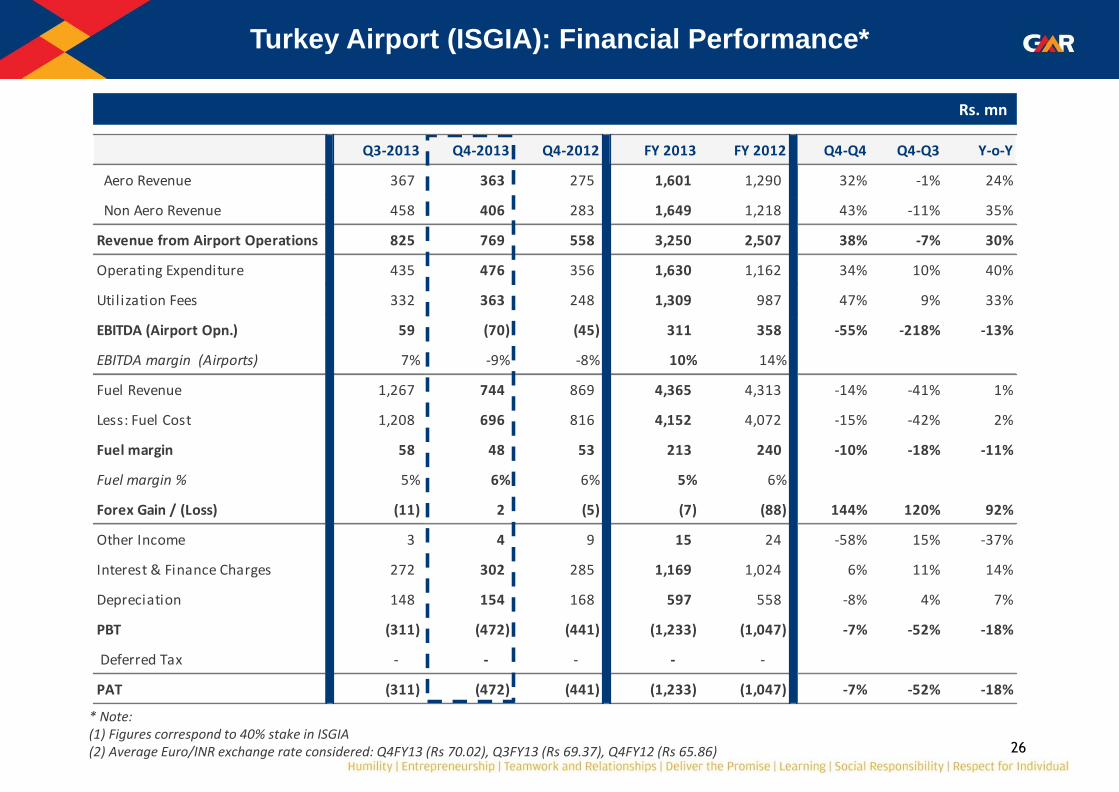
Turkey Airport (ISGIA): Financial Performance*
Rs. mn
* Note: (1) Figures correspond to 40% stake in ISGIA (2) Average Euro/INR exchange rate considered: Q4FY13 (Rs 70.02), Q3FY13 (Rs 69.37), Q4FY12 (Rs 65.86)
Q3-2013 Q4-2013 Q4-2012 FY 2013 FY 2012 Q4-Q4 Q4-Q3 Y-o-Y
Aero Revenue 367 363 275 1,601 1,290 32% -1% 24%
Non Aero Revenue 458 406 283 1,649 1,218 43% -11% 35%
Revenue from Airport Operations 825 769 558 3,250 2,507 38% -7% 30%
Operating Expenditure 435 476 356 1,630 1,162 34% 10% 40%
Utilization Fees 332 363 248 1,309 987 47% 9% 33%
EBITDA (Airport Opn.) 59 (70) (45) 311 358 -55% -218% -13%
EBITDA margin (Airports) 7% -9% -8% 10% 14%
Fuel Revenue 1,267 744 869 4,365 4,313 -14% -41% 1%
Less: Fuel Cost 1,208 696 816 4,152 4,072 -15% -42% 2%
Fuel margin 58 48 53 213 240 -10% -18% -11%
Fuel margin % 5% 6% 6% 5% 6%
Forex Gain / (Loss) (11) 2 (5) (7) (88) 144% 120% 92%
Other Income 3 4 9 15 24 -58% 15% -37%
Interest & Finance Charges 272 302 285 1,169 1,024 6% 11% 14%
Depreciation 148 154 168 597 558 -8% 4% 7%
PBT (311) (472) (441) (1,233) (1,047) -7% -52% -18%
Deferred Tax - - - - -
PAT (311) (472) (441) (1,233) (1,047) -7% -52% -18%

27
Turkey Airport (ISGIA): Financial Analysis*
* The figures mentioned above pertain to 100% of ISGIA
Amnt in Rs.
Per passenger (departing and arriving) Q3-2013 Q4-2013 Q4-2012 FY 2013 FY 2012 Q4-Q4 Q4-Q3 Y-o-Y
Aero Revenue 262 263 231 261 233 14% 1% 12%
Non-Aero Revenue 326 294 237 269 220 24% -10% 22%
Net Fuel Margin 42 35 44 35 43 -22% -17% -20%
Total Revenue 629 592 512 564 497 16% -6% 14%
Expenses & Utilization Fees 546 608 506 479 389 20% 11% 23%
EBITDA 84 (16) 7 85 108 -345% -119% -21%
Per ATM
Aero revenue 29,841 32,340 27,617 31,167 27,498 17% 8% 13%
Per Tonne
Net fuel margin 2,788 4,176 3,473 2,984 2,970 20% 50% 0%

28
* Figures correspond to 100% stake in ISGIA ** Figures correspond to 40% stake in ISGIA
Turkey Airport (ISGIA): Revenue Analysis
Revenue Analysis for the quarter ended March 31, 2013
Q4-Q4
Rs. In mn per pax % of total Rs. in mn per pax % of total
Aero Revenue:*
PSF & Others 906 263 100% 688 231 100% 32%
Non-Aero Revenue:*
Car Park 115 33 11% 82 27 12% 40%
Rentals 157 45 15% 100 34 14% 57%
Duty Free 423 123 42% 277 93 39% 53%
F&B 105 30 10% 87 29 12% 21%
Others incl. Utilities 218 63 21% 163 55 23% 34%
Total Non-Aero 1,017 295 100% 708 237 100% 44%
Total 1,923 558 1,396 468 38%
GMR Share ** 769 223 558 187 38%
Particulars Q4-2013 Q4-2012

29
Airports Sector Consolidated: Operational Performance
Note: Includes DIAL, GHIAL & ISGIA
Traffic Q3-2013 Q4-2013 Q4-2012 FY 2013 FY 2012 Q4-Q4 Q4-Q3 Y-o-Y
Passenger (mn)
Arriving
Domestic 4.63 4.84 4.96 19.44 20.33 -2% 5% -4%
International 2.47 2.50 2.09 9.29 8.43 20% 1% 10%
Departing
Domestic 4.73 4.80 4.92 19.60 20.73 -3% 1% -5%
International 2.43 2.69 2.24 9.75 8.82 20% 11% 11%
Total
Domestic 9.35 9.64 9.88 39.04 41.06 -2% 3% -5%
International 4.90 5.19 4.33 19.04 17.25 20% 6% 10%
Total Passengers 14.25 14.82 14.21 58.08 58.31 4% 4% 0%
ATMs (Nos`000)
Domestic 89.25 88.21 97.71 372.11 399.99 -10% -1% -7%
International 38.43 35.88 30.84 147.84 134.20 16% -7% 10%
Total ATM's 127.68 124.09 128.55 519.95 534.18 -3% -3% -3%
Cargo Volume: (`000 in Tons)
Domestic 55.17 53.33 60.83 221.79 239.41 -12% -3% -7%
International 101.31 104.84 101.68 408.51 420.36 3% 3% -3%
Total Cargo 156.48 158.16 162.51 630.30 659.76 -3% 1% -4%

30
Airports Sector Consolidated: Financial Performance
Note: Figures correspond to 40% stake in ISGIA
Rs. mn
Q3-2013 Q4-2013 Q4-2012 FY 2013 FY 2012 Q4-Q4 Q4-Q3 Y-o-Y
Aero Revenue 5,840 10,887 2,333 27,526 10,140 367% 86% 171%
Non Aero Revenue 6,603 3,789 4,636 20,112 16,935 -18% -43% 19%
Cargo 373 1,639 669 2,770 2,652 145% 340% 4%
CPD Rentals 250 245 209 993 835 18% -2% 19%
Fuel income 2,920 732 3,700 9,801 13,492 -80% -75% -27%
Gross Revenue 15,985 17,293 11,547 61,202 44,054 50% 8% 39%
Less: Revenue Share 4,101 5,729 1,862 16,484 8,310 208% 40% 98%
Net Revenue 11,884 11,564 9,685 44,718 35,744 19% -3% 25%
Less: Fuel cost 2,495 696 2,858 8,298 10,912 -76% -72% -24%
Operating Expenditure 4,700 3,509 4,685 16,680 15,062 -25% -25% 11%
Forex 13 (12) (28) (10) 69 58% -192% -114%
Utilization Fees 332 363 248 1,309 987 47% 9% 33%
EBITDA 4,344 7,008 1,923 18,440 8,714 264% 61% 112%
EBITDA margin 37% 61% 20% 41% 24%
Other Income 232 344 16 1,364 847 2047% 48% 61%
Interest & Finance Charges 2,686 2,711 2,750 10,586 10,652 -1% 1% -1%
Exceptional Item * - 2,026 1,621 2,026 1,621 25% 0% 25%
Depreciation 1,675 1,651 1,650 6,628 6,588 0% -1% 1%
PBT 215 963 (4,082) 564 (9,300) 124% 348% 106%
Current Tax 177 35 139 722 562 -75% -80% 29%
Deferred Tax 77 356 14 565 227 2392% 363% 149%
MAT (30) (216) 143 (321) 133 -251% -627% -342%
PAT (Before Minority Interest) (10) 787 (4,379) (402) (10,222) 118% 8103% 96%
PAT (After Minority Interest) (234) (160) (2,416) (868) (5,579) 93% 31% 84%
* Assets write-off in Male Airport
Energy Sector

32
Project (Capacity MW)
Estimated Project Cost
Debt : Equity Ratio
Project Expenditure upto
March 2013
Project Completion (%) as
on March 2013 Expected CoD Particulars
Warora (EMCO) Maharashtra
(600 MW)
Operational: 300MW
Rs. 39,480 mn
($ 790 mn) 66 : 34
Rs. 36,263 mn
($ 725 mn) 99%
Unit I of 300MW commissioned in Mar 13
Unit II of 300MW expected in Jul 13
Firm Linkage for 570 MW
Kamalanga Orissa
(1,050 MW)
Operational: 350MW
Rs. 63,070 mn
($ 1,261 mn) 59 : 41
Rs. 49,644 mn
($ 993 mn)
93%
Unit I of 300MW commissioned in Apr 13
Expected: Unit II - Jul 13 and Unit III - Oct 13
Firm linkage for 500 MW & tapering linkage for 550 MW
Allotted Rampia mine (to be developed) in JV with others; can also source via e-auction / import
# Exchange Rate : 1USD = ` 50.00
Energy sector: Partially Operational Projects

33
Project (Capacity MW)
Estimated Project Cost
Debt : Equity Ratio
Project Expenditure upto
March 2013
Project Completion (%) as
on March 2013 Expected CoD Particulars
Rajahmundry (PG III)
Andhra Pradesh (768 MW)
Rs. 40,600 mn
($ 812 mn) 75 : 25
Rs. 34,820 mn
($ 696 mn) - based on Gas availability
Chhattisgarh (PC III)
Raipur (1,370 MW)
Rs. 82,900 mn
($ 1,658 mn) 75 : 25
Rs. 61,545 mn
($ 1,231 mn)
82% Unit I - Oct 13; Unit II - Apr 14 MOU for 479.5 MW with CSPTRADCO
(Chhattisgarh)
Bajoli Holi Himachal Pradesh
(180 MW)
Rs. 22,050 mn
($ 441 mn) 63 : 37
Rs. 2,259 mn
($ 45 mn) - Dec-2017 Achieved Financial Closure
Maru (PT I)
Rajasthan (265 KM)
Rs. 2,233 mn
($ 45 mn) 80 : 20
Rs. 1,694 mn
($ 34 mn) 76% Q1FY2014
Possession of land (61 acres) completed
Transmission Service Agreement completed
EPC contract awarded to L&T
Received Transmission License
Aravali (PT II)
Rajasthan (85 KM)
Rs. 1,306 mn
($ 26 mn) 80 : 20
Rs. 948 mn
($ 19 mn)
67% Q1FY2014
Possession of land (46 acres) completed
Transmission Service Agreement completed
EPC contract awarded to L&T
Received Transmission License
# Exchange Rate : 1USD = ` 50.00
Energy sector: Projects under Construction

34
Energy Sector - Power Generation: Operational Performance
1 Refer point 1 in slide no. 45
1
2
2
3
3 Refer point 3 in slide no. 45 &
Particulars UOM Q3-2013 Q4-2013 Q4-2012 FY 2013 FY 2012
PLF Achieved % 13 4 43 19 57
Power off take MU 68 18 214 377 1,148
Particulars UOM Q3-2013 Q4-2013 Q4-2012 FY 2013 FY 2012
PLF Achieved % 32 42 47 36 51
Power off take (PPA) MU 140 180 204 629 884
Particulars UOM Q3-2013 Q4-2013 Q4-2012 FY 2013 FY 2012
PLF Achieved % 18 9 45 26 59
Power off take (PPA) MU 148 81 393 905 2,064
Particulars UOM Q3-2013 Q4-2013 Q4-2012 FY 2013 FY 2012
PLF Achieved % - 53 - 53 -
Power off take (PPA) MU - 44 - 44 -
Particulars UOM Q3-2013 Q4-2013 Q4-2012 FY 2013 FY 2012
PLF Achieved % 19 21 14 19 14
Power off take (PPA) MU 11 11 2 41 2
PG-I GEL (Barge mounted) – Andhra Pradesh – 220MW
PL-I GPCPL (Chennai) – Tamil Nadu – 200MW
PG-II VPGL (Vemagiri) – Andhra Pradesh – 388MW
PS-I Gujarat Solar - Gujarat – 25MW
PC-II EMCO - Maharashtra – 600MW
4
4 Refer point 5 in slide no. 45

35
Energy Sector – Power Generation: Financial Performance*
* Only revenue/expenses pertaining to core operations of the company have been considered
1 Refer point 4 in slide no. 45
1
UOMPG I
GMR Energy
PL I
GMR Power
PG II
Vemagiri
PC II
EMCO
PS I
Gujarat SolarTotal / Wtd Avg.
Merchant Tariff Rs./kWh 5.49 - - 2.56 -
PPA Tariff Rs./kWh - 11.83 6.44 - 15.00
Less: Rebate Rs./kWh 0.05 - 0.06 - 0.14
Average Tariff Realization (net) Rs./kWh 5.45 11.83 6.38 2.56 14.86 9.07
Fixed cost (Ops. & Admin) Rs./kWh 3.91 0.45 0.29 0.71 0.77 0.64
Variable (Fuel Cost) Rs./kWh 4.44 9.78 5.99 3.15 - 7.38
Spread (Operational EBITDA) Rs./kWh (2.91) 1.61 0.09 (1.30) 14.09 1.05
Operational EBITDA margin % -53% 14% 1% -51% 95% 12%
Capacity Cost (Interest & Depreciation) Rs./kWh 5.07 0.19 2.04 2.62 9.61 1.53
Tax Rs./kWh - 0.28 - - 0.90 0.18
Operational PAT Rs./kWh (7.98) 1.14 (1.94) (3.92) 3.59 (0.67)
FY 2013

36
Energy Sector-Coal & Energy Trading: Financial Performance*
* Only revenue/expenses pertaining to core operations of the company have been considered ** Units correspond to 100% stake in PT GEMS
UOMCL II
PT GEMs**UOM
PTD I
GETL
Units tonne (‘000) 7,690 MU 205.55
Sales Realization Rs./tonne 2,933 Rs./kWh 3.64
Less: Rebate Rs./tonne - Rs./kWh 0.00
Avg Sales Realization (Net) Rs./tonne 2,933 Rs./kWh 3.63
Fixed cost (Ops. & Admin) Rs./tonne 461 Rs./kWh 0.05
Variable Cost Rs./tonne 2,293 Rs./kWh 3.60
Spread (Operational EBITDA) Rs./tonne 180 Rs./kWh (0.02)
Operational EBITDA margin % 6.13% % -0.47%
Capacity Cost (Interest & Depreciation) Rs./tonne 95 Rs./kWh 0.00
Tax Rs./tonne 32 Rs./kWh -
Operational PAT Rs./tonne 52 Rs./kWh (0.02)
Coal
FY 2013
Energy Trading
37
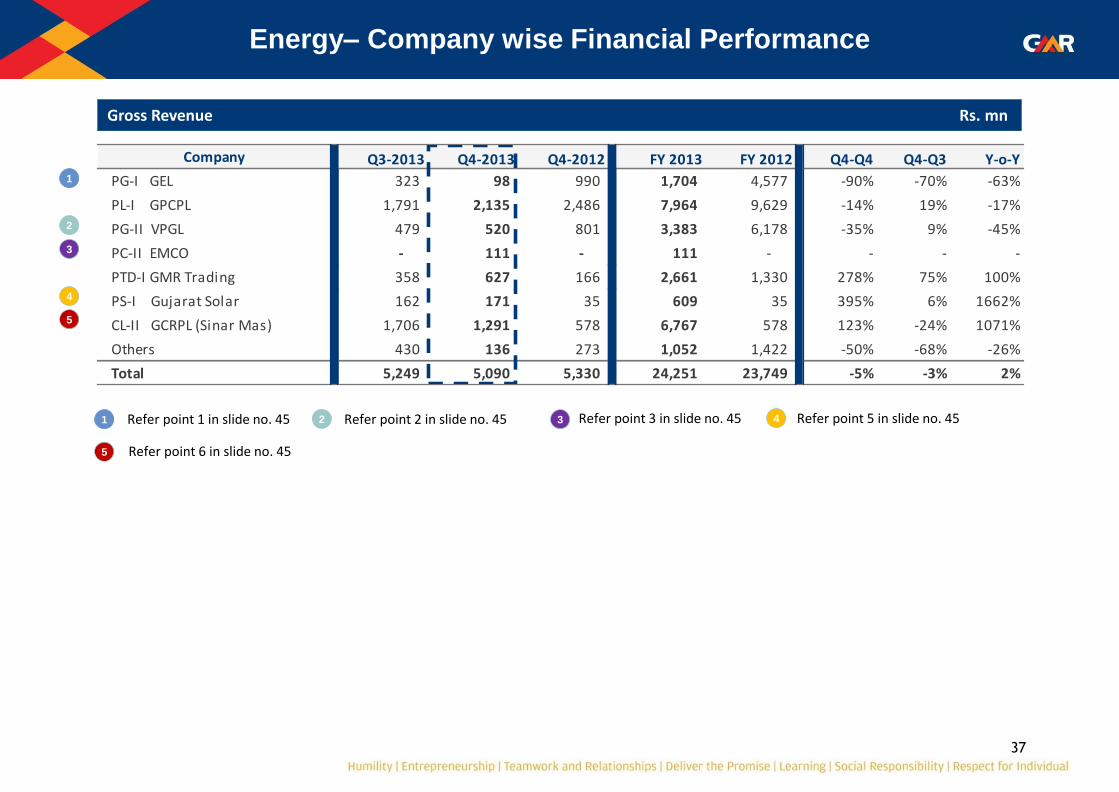
Energy– Company wise Financial Performance
Gross Revenue Rs. mn
1 Refer point 1 in slide no. 45
1
2
2 Refer point 2 in slide no. 45
3
3 Refer point 3 in slide no. 45
4
4 Refer point 5 in slide no. 45
5
5
Refer point 6 in slide no. 45
Company Q3-2013 Q4-2013 Q4-2012 FY 2013 FY 2012 Q4-Q4 Q4-Q3 Y-o-Y
PG-I GEL 323 98 990 1,704 4,577 -90% -70% -63%
PL-I GPCPL 1,791 2,135 2,486 7,964 9,629 -14% 19% -17%
PG-II VPGL 479 520 801 3,383 6,178 -35% 9% -45%
PC-II EMCO - 111 - 111 - - - -
PTD-I GMR Trading 358 627 166 2,661 1,330 278% 75% 100%
PS-I Gujarat Solar 162 171 35 609 35 395% 6% 1662%
CL-II GCRPL (Sinar Mas) 1,706 1,291 578 6,767 578 123% -24% 1071%
Others 430 136 273 1,052 1,422 -50% -68% -26%
Total 5,249 5,090 5,330 24,251 23,749 -5% -3% 2%

38
Energy– Company wise Financial Performance
Net Revenue Rs. mn
Company Q3-2013 Q4-2013 Q4-2012 FY 2013 FY 2012 Q4-Q4 Q4-Q3 Y-o-Y
PG-I GEL 318 97 970 1,676 4,499 -90% -69% -63%
PL-I GPCPL 1,791 2,135 2,487 7,964 9,629 -14% 19% -17%
PG-II VPGL 444 515 765 3,283 6,021 -33% 16% -45%
PC-II EMCO - 111 - 111 - - - -
PTD-I GMR Trading 309 577 102 2,389 1,009 466% 86% 137%
PS-I Gujarat Solar 158 169 35 603 35 390% 7% 1646%
CL-II GCRPL (Sinar Mas) 1,706 1,291 578 6,767 578 123% -24% 1071%
Others 430 136 278 1,052 1,422 -51% -68% -26%
Total 5,156 5,032 5,214 23,847 23,192 -3% -2% 3%
39
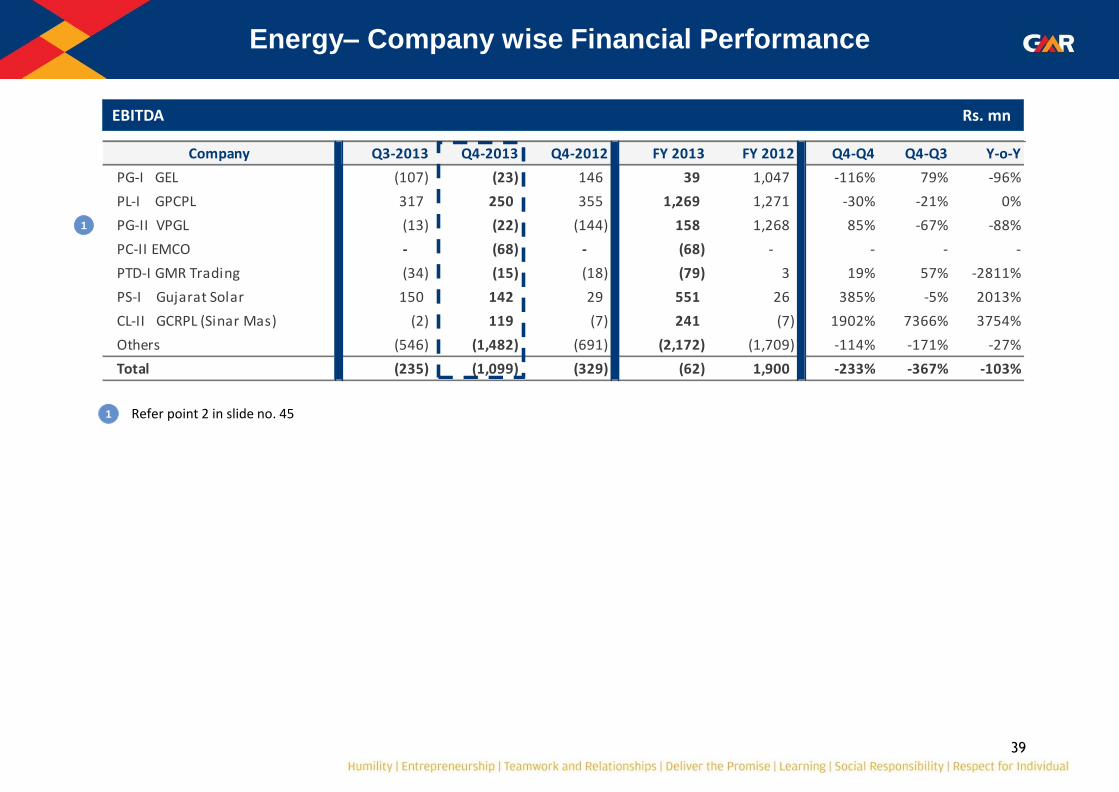
Energy– Company wise Financial Performance
EBITDA Rs. mn
1 Refer point 2 in slide no. 45
1
Company Q3-2013 Q4-2013 Q4-2012 FY 2013 FY 2012 Q4-Q4 Q4-Q3 Y-o-Y
PG-I GEL (107) (23) 146 39 1,047 -116% 79% -96%
PL-I GPCPL 317 250 355 1,269 1,271 -30% -21% 0%
PG-II VPGL (13) (22) (144) 158 1,268 85% -67% -88%
PC-II EMCO - (68) - (68) - - - -
PTD-I GMR Trading (34) (15) (18) (79) 3 19% 57% -2811%
PS-I Gujarat Solar 150 142 29 551 26 385% -5% 2013%
CL-II GCRPL (Sinar Mas) (2) 119 (7) 241 (7) 1902% 7366% 3754%
Others (546) (1,482) (691) (2,172) (1,709) -114% -171% -27%
Total (235) (1,099) (329) (62) 1,900 -233% -367% -103%

40
Energy– Company wise Financial Performance
EBITDA Margin
Company Q3-2013 Q4-2013 Q4-2012 FY 2013 FY 2012
PG-I GEL -34% -23% 15% 2% 23%
PL-I GPCPL 18% 12% 14% 16% 13%
PG-II VPGL -3% -4% -19% 5% 21%
PC-II EMCO - -61% - -61% -
PTD-I GMR Trading -11% -3% -18% -3% 0%
PS-I Gujarat Solar 95% 84% 85% 91% 75%
CL-II GCRPL (Sinar Mas) 0% 9% -1% 4% -1%
Total -5% -22% -6% 0% 8%

41
Energy– Company wise Financial Performance
Interest Rs. mn
Company Q3-2013 Q4-2013 Q4-2012 FY 2013 FY 2012 Q4-Q4 Q4-Q3 Y-o-Y
PG-I GEL 461 560 481 1,883 1,642 16% 21% 15%
PL-I GPCPL 117 105 59 337 89 77% -10% 280%
PG-II VPGL 22 25 106 103 455 -77% 10% -77%
PC-II EMCO - 73 - 73 - - - -
PTD-I GMR Trading 50 40 6 135 8 575% -21% 1699%
PS-I Gujarat Solar 64 64 18 259 18 255% -1% 1333%
CL-II GCRPL (Sinar Mas) 361 351 273 1,391 443 29% -3% 214%
Others (12) 106 (112) 0 (481) 195% 996% 100%
Total 1,065 1,323 830 4,182 2,173 59% 24% 92%

42
Energy– Company wise Financial Performance
Depreciation Rs. mn
Company Q3-2013 Q4-2013 Q4-2012 FY 2013 FY 2012 Q4-Q4 Q4-Q3 Y-o-Y
PG-I GEL 142 145 147 569 590 -1% 2% -3%
PL-I GPCPL 47 45 42 183 183 8% -3% 0%
PG-II VPGL 143 140 138 566 556 1% -2% 2%
PC-II EMCO - 41 - 41 - - - -
PTD-I GMR Trading 0 0 0 0 0 130% -57% 151%
PS-I Gujarat Solar 47 46 14 185 14 225% -2% 1207%
CL-II GCRPL (Sinar Mas) 15 147 3 209 3 4798% 907% 6856%
Others 32 (17) 57 106 156 -129% -153% -32%
Total 424 547 401 1,859 1,502 36% 29% 24%
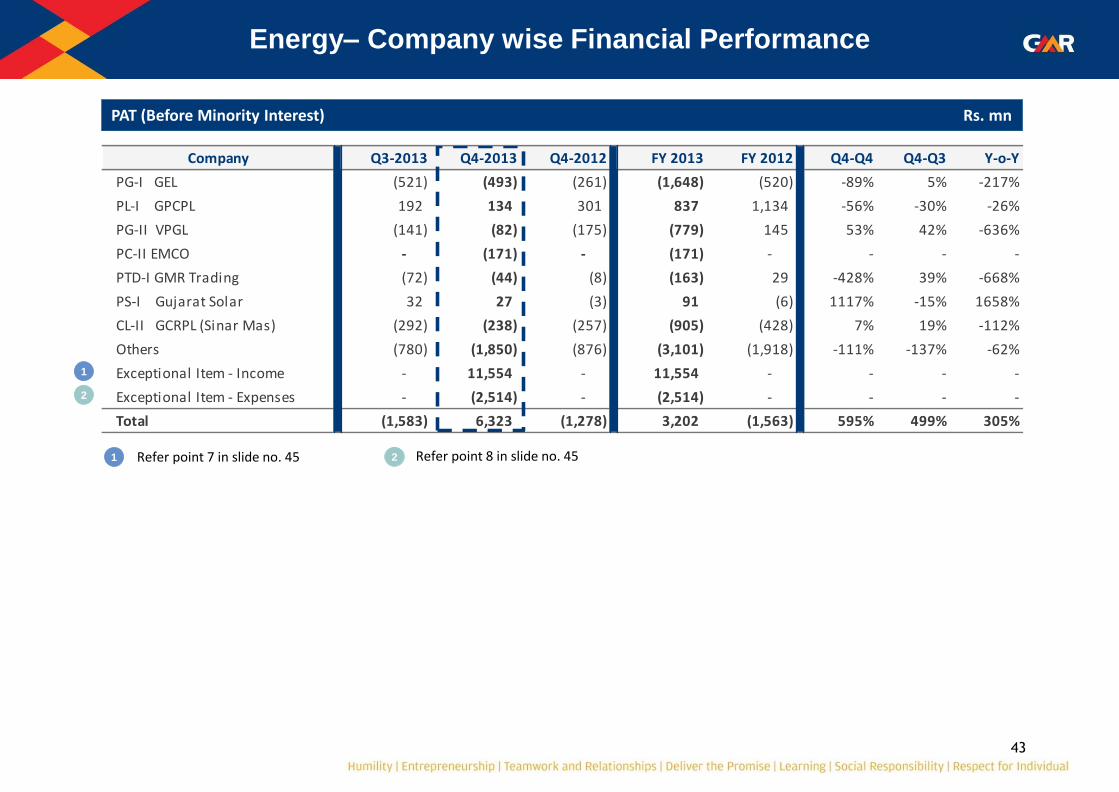
43
Energy– Company wise Financial Performance
PAT (Before Minority Interest) Rs. mn
1 Refer point 7 in slide no. 45
1
Company Q3-2013 Q4-2013 Q4-2012 FY 2013 FY 2012 Q4-Q4 Q4-Q3 Y-o-Y
PG-I GEL (521) (493) (261) (1,648) (520) -89% 5% -217%
PL-I GPCPL 192 134 301 837 1,134 -56% -30% -26%
PG-II VPGL (141) (82) (175) (779) 145 53% 42% -636%
PC-II EMCO - (171) - (171) - - - -
PTD-I GMR Trading (72) (44) (8) (163) 29 -428% 39% -668%
PS-I Gujarat Solar 32 27 (3) 91 (6) 1117% -15% 1658%
CL-II GCRPL (Sinar Mas) (292) (238) (257) (905) (428) 7% 19% -112%
Others (780) (1,850) (876) (3,101) (1,918) -111% -137% -62%
Exceptional Item - Income - 11,554 - 11,554 - - - -
Exceptional Item - Expenses - (2,514) - (2,514) - - - -
Total (1,583) 6,323 (1,278) 3,202 (1,563) 595% 499% 305%
2
2 Refer point 8 in slide no. 45

44
Energy Sector Consolidated: Financial Performance
Rs. mn
Q3-2013 Q4-2013 Q4-2012 FY 2013 FY 2012 Q4-Q4 Q4-Q3 Y-o-Y
Contracted Power Sale 2,270 2,810 3,288 11,459 15,806 -15% 24% -28%
Merchant Power Sale 323 98 990 1,704 4,577 -90% -70% -63%
Coal Revenue 2,090 1,421 849 7,797 1,993 67% -32% 291%
Power Trading and others 566 760 203 3,292 1,373 275% 34% 140%
Gross Revenue 5,249 5,090 5,330 24,251 23,749 -5% -3% 2%
Net Revenue (net of rebate) 5,156 5,032 5,214 23,847 23,192 -3% -2% 3%
Purchase of Energy 306 568 235 2,351 1,069 142% 86% 120%
Fuel - Consumption 1,929 2,464 3,336 10,204 14,344 -26% 28% -29%
Other Expenses 2,813 3,101 1,419 11,007 4,815 119% 10% 129%
Forex Loss/ (Gain) 343 (3) 553 347 1,064 -100% -101% -67%
EBITDA (235) (1,099) (329) (62) 1,900 -233% -367% -103%
EBITDA margin -5% -22% -6% 0% 8%
Other Income 344 350 180 1,196 935 94% 2% 28%
Exceptional item - Income - 11,554 - 11,554 -
Exceptional item - Expenses - 2,514 - 2,514 -
Interest & Fin Charges 1,065 1,323 830 4,182 2,173 59% 24% 92%
Depreciation 424 547 401 1,859 1,502 36% 29% 24%
PBT (1,381) 6,422 (1,380) 4,133 (840) 565% 565% 592%
Current Tax (Normal) 101 59 (28) 405 426 314% -42% -5%
Deferred Tax 100 40 (74) 527 297 154% -60% 77%
PAT (Before Minority Interest) (1,583) 6,323 (1,278) 3,202 (1,563) 595% 499% 305%
PAT (After Minority Interest) (1,487) 6,341 (1,014) 3,232 (1,589) 726% 526% 303%
1 Refer point 7 in slide no. 45
1
2
2 Refer point 8 in slide no. 45

45
1. Lower PLF is on account of non availability of gas: a) PGI GEL – As against a gas supply agreement with RIL for 28,286 MMBTU per day, company has received an average of 2,480
MMBTU per day during Jan13 and Feb13. No Gas was received in March 13 . b) PG-II VPGL – As against a gas supply agreement with RIL for 47,211 MMBTU per day, company has received an average of
5,881 MMBTU in Q4FY13. c) PG-II VPGL – for 7 days in March 2013 RLNG was used to generate 32 mn units of power.
2. PG-II VPGL: Rs. 43.4 mn income from Carbon Credit in Q3FY13 has been re-classified in Q4FY13 from Other Income to Revenue.
3. PC-II EMCO: The first unit 2 X 300 MW coal based power project at Warora, has successfully commissioned Commercial Operation on March 19, 2013.
4. PG-I GEL Merchant Tariff: • Agreement with APPCC for 90 MW supply of power till May 2013 • PG-I GEL: Sale of power to APPCC (Andhra Pradesh Power Co-ordination Committee) in Q4FY13 at Rs./kWh 5.49
5. PS-I Gujarat Solar a) Operations have started from 04-Mar-12 b) PPA with GUVNL (Gujarat Urja Vikas Nigam Ltd) @ Rs. 15/kWh for first 12 years and Rs. 5/kWh thereafter for the next 13
years
6. The financials of PT GEMs (Sinar Mas) have been proportionately consolidated (30%) with that of CL-II GCRPL with a lag of one quarter.
7. Exceptional Item – Income is on account of Profit from divestment in GMR Energy (Singapore) Pte Ltd.
8. Exceptional Item – Expenses is on account of impairment due to sale of HEG assets.
9. Others include: Project Cos., Wind Power Cos. and Overseas subsidiaries.
Management Discussion & Analysis (MDA): Energy Sector

46
11. Receivables for the Energy Segment as on 31-Mar-2013:
Management Discussion & Analysis (MDA): Energy Sector
Company Party Name Total (Rs mn)
PL-I GPCPL TNEB 6,485
PG-II VPGL APTRANSCO 110
PTD-I GETL TANGEDCO 40
BESCOM 448
APPCC 85
PC-II EMCO
Power System Operation
Corporation 25
GETL 13
Total 7,205

Highways Sector
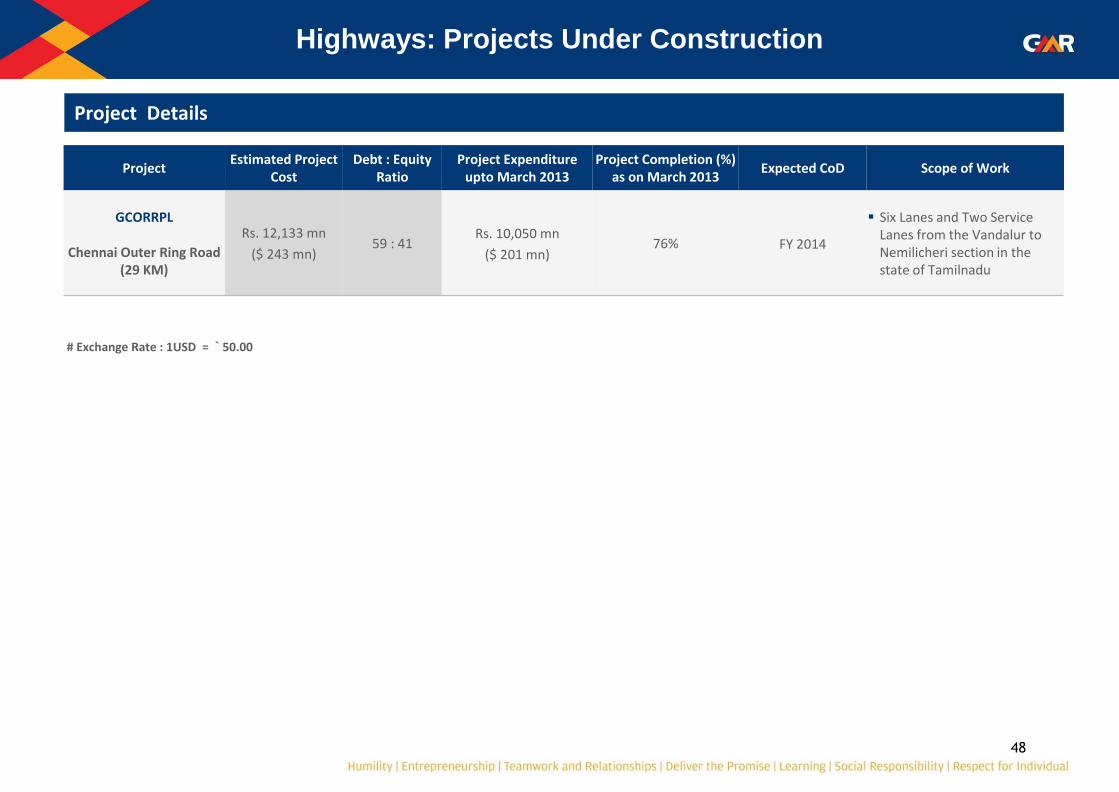
48
Highways: Projects Under Construction
Project Details
Project Estimated Project
Cost Debt : Equity
Ratio Project Expenditure
upto March 2013 Project Completion (%)
as on March 2013 Expected CoD Scope of Work
GCORRPL
Chennai Outer Ring Road (29 KM)
Rs. 12,133 mn
($ 243 mn) 59 : 41
Rs. 10,050 mn
($ 201 mn) 76% FY 2014
Six Lanes and Two Service Lanes from the Vandalur to Nemilicheri section in the state of Tamilnadu
# Exchange Rate : 1USD = ` 50.00

49
Highways: Toll Projects
Operational Asset Details – HT-I: GACEPL – 35 kms (Ambala - Chandigarh)
Operating Metrics Q3-2013 Q4-2013 Q4-2012 FY 2013 FY 2012
Lane km 140 140 140 140 140
Lane km days tolled 12,880 12,600 12,740 51,100 51,240
Total traffic (Mn) 2.20 2.11 2.02 8.52 7.97
Traffic PCU (Mn) 2.94 2.82 2.75 11.48 10.84
PCU Factor 1.34 1.33 1.36 1.35 1.36
Avg Toll (Rs. / PCU) 25.69 25.60 23.62 24.90 22.73
Avg Toll (Rs./PCU/Lane km) 0.184 0.183 0.169 0.178 0.162
Revenue (Rs. / Lkmd) 5,870 5,726 5,096 5,594 4,810
Op. cost (Rs. / Lkmd) 1,797 1,695 1,085 1,794 1,047
EBITDA (Rs. / Lkmd) 4,074 4,032 4,010 3,800 3,763
EBITDA Margin 69% 70% 79% 68% 78%
Capacity Cost (Rs. / Lkmd) 8,476 8,377 (12,115) 8,388 3,566
Performance Metrics Q4 on Q4 Q4 on Q3 FY13 vs FY12 FY12 vs FY11 FY11 vs FY10
Traffic growth 3% -4% 6% 5% 8%
Revenue growth 12% -2% 16% 13% 17%
EBITDA growth 1% -1% 1% 25% 40%
1 Refer point 2 in slide no. 63
1

50
Highways: Toll Projects
Operational Asset Details - HT-II: GJEPL – 58 kms (Jadcherla)
Operating Metrics Q3-2013 Q4-2013 Q4-2012 FY 2013 FY 2012
Lane km 232 232 232 232 232
Lane km days tolled 21,344 20,880 21,112 84,680 84,912
Total traffic (Mn) 1.55 1.54 1.50 6.12 5.79
Traffic PCU (Mn) 3.18 3.23 3.27 12.82 12.64
PCU Factor 2.05 2.10 2.18 2.10 2.18
Avg Toll (Rs. / PCU) 51.19 51.67 48.04 50.11 46.51
Avg Toll (Rs./PCU/Lane km) 0.221 0.223 0.207 0.216 0.200
Revenue (Rs. / Lkmd) 7,634 7,988 7,435 7,585 6,924
Op. cost (Rs. / Lkmd) 1,070 1,435 844 1,148 834
EBITDA (Rs. / Lkmd) 6,563 6,553 6,591 6,436 6,090
EBITDA Margin 86% 82% 89% 85% 88%
Capacity Cost (Rs. / Lkmd) 6,320 6,661 4,018 6,419 5,352
Performance Metrics Q4 on Q4 Q4 on Q3 FY13 vs FY12 FY12 vs FY11 FY11 vs FY10
Traffic growth -1% 1% 1% 5% 17%
Revenue growth 7% 5% 10% 14% 23%
EBITDA growth -1% 0% 6% 22% 30%
51
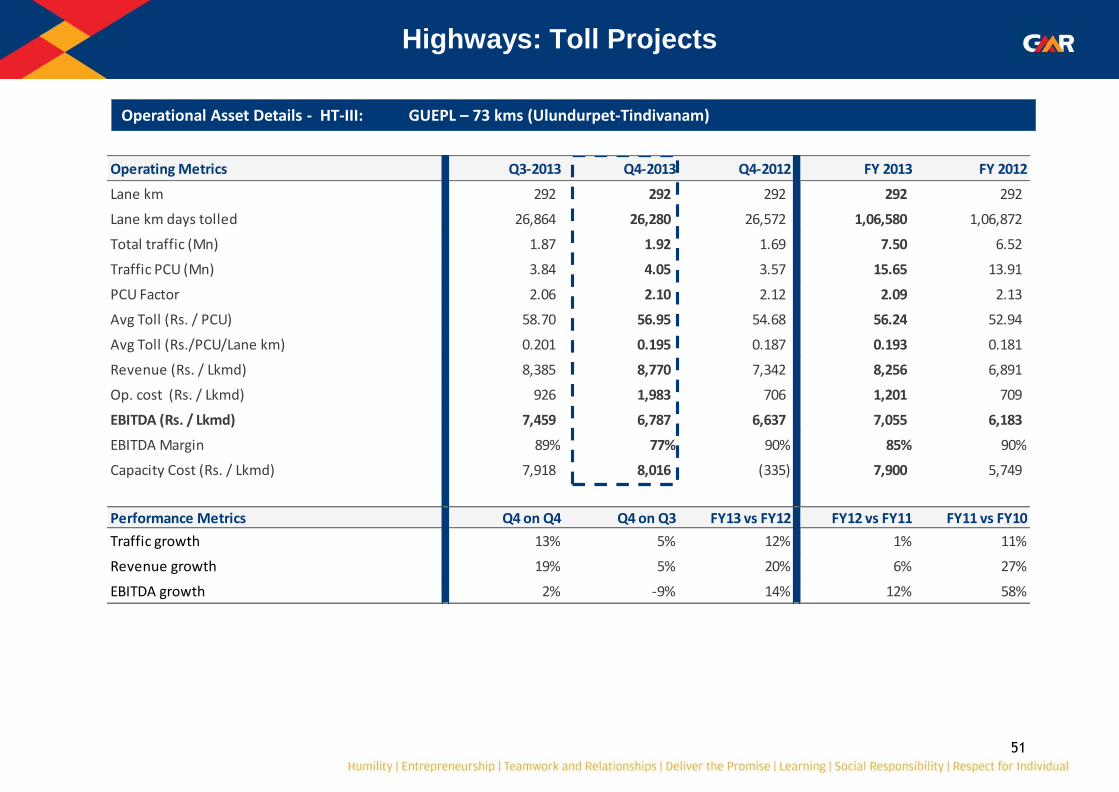
Highways: Toll Projects
Operational Asset Details - HT-III: GUEPL – 73 kms (Ulundurpet-Tindivanam)
Operating Metrics Q3-2013 Q4-2013 Q4-2012 FY 2013 FY 2012
Lane km 292 292 292 292 292
Lane km days tolled 26,864 26,280 26,572 1,06,580 1,06,872
Total traffic (Mn) 1.87 1.92 1.69 7.50 6.52
Traffic PCU (Mn) 3.84 4.05 3.57 15.65 13.91
PCU Factor 2.06 2.10 2.12 2.09 2.13
Avg Toll (Rs. / PCU) 58.70 56.95 54.68 56.24 52.94
Avg Toll (Rs./PCU/Lane km) 0.201 0.195 0.187 0.193 0.181
Revenue (Rs. / Lkmd) 8,385 8,770 7,342 8,256 6,891
Op. cost (Rs. / Lkmd) 926 1,983 706 1,201 709
EBITDA (Rs. / Lkmd) 7,459 6,787 6,637 7,055 6,183
EBITDA Margin 89% 77% 90% 85% 90%
Capacity Cost (Rs. / Lkmd) 7,918 8,016 (335) 7,900 5,749
Performance Metrics Q4 on Q4 Q4 on Q3 FY13 vs FY12 FY12 vs FY11 FY11 vs FY10
Traffic growth 13% 5% 12% 1% 11%
Revenue growth 19% 5% 20% 6% 27%
EBITDA growth 2% -9% 14% 12% 58%

52
Highways: Toll Projects
Operational Asset Details - HT-IV GHVEPL – 181 kms (Hyderabad-Vijaywada)
Note: Project commenced operation on 20th Dec 2012 (Q3FY13) hence previous periods figures are not comparable
Operating Metrics Q3-2013 Q4-2013 Q4-2012 FY 2013 FY 2012
Lane km 726 726 - 726 -
Lane km days tolled 8,712 65,340 - 74,052 -
Total traffic (Mn) 0.16 3.74 - 3.90 -
Traffic PCU (Mn) 0.37 9.14 - 9.51 -
PCU Factor 2.32 2.44 - 2.44 -
Avg Toll (Rs. / PCU) 133.62 42.29 - 45.88 -
Avg Toll (Rs./PCU/Lane km) 0.184 0.058 - 0.063 -
Gross Revenue (Rs. / Lkmd) 8,621 8,760 - 8,744
Net Revenue (Rs. / Lkmd) 5,722 5,916 - 5,893 -
Op. cost (Rs. / Lkmd) 1,317 849 - 904 -
EBITDA (Rs. / Lkmd) 4,406 5,068 - 4,990 -
EBITDA Margin 77% 86% - 85% -
Capacity Cost (Rs. / Lkmd) 7,805 8,962 - 7,908 -
Performance Metrics Q4 on Q4 Q4 on Q3 FY13 vs FY12
Traffic growth - - -
Revenue growth - - -
EBITDA growth - - -
Operational Asset Details - HT-IV GHVEPL – 181 kms (Hyderabad-Vijaywada)
53
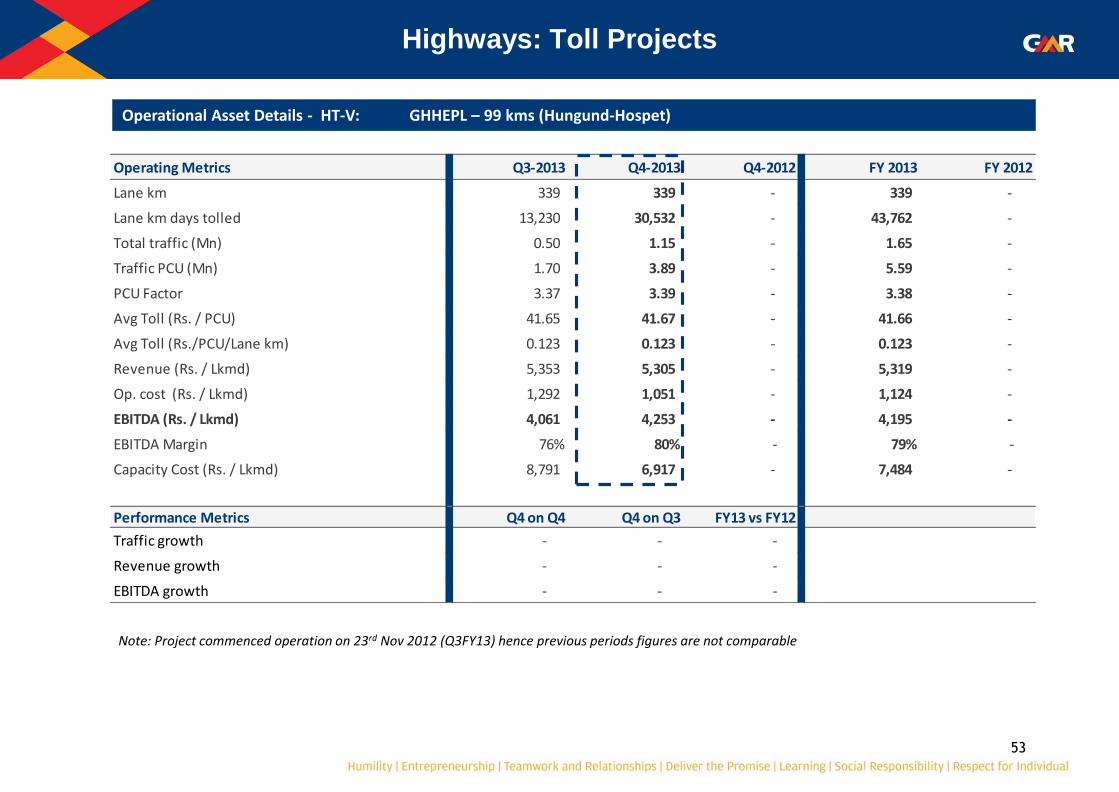
Highways: Toll Projects
Operational Asset Details - HT-V: GHHEPL – 99 kms (Hungund-Hospet)
Operating Metrics Q3-2013 Q4-2013 Q4-2012 FY 2013 FY 2012
Lane km 339 339 - 339 -
Lane km days tolled 13,230 30,532 - 43,762 -
Total traffic (Mn) 0.50 1.15 - 1.65 -
Traffic PCU (Mn) 1.70 3.89 - 5.59 -
PCU Factor 3.37 3.39 - 3.38 -
Avg Toll (Rs. / PCU) 41.65 41.67 - 41.66 -
Avg Toll (Rs./PCU/Lane km) 0.123 0.123 - 0.123 -
Revenue (Rs. / Lkmd) 5,353 5,305 - 5,319 -
Op. cost (Rs. / Lkmd) 1,292 1,051 - 1,124 -
EBITDA (Rs. / Lkmd) 4,061 4,253 - 4,195 -
EBITDA Margin 76% 80% - 79% -
Capacity Cost (Rs. / Lkmd) 8,791 6,917 - 7,484 -
Performance Metrics Q4 on Q4 Q4 on Q3 FY13 vs FY12
Traffic growth - - -
Revenue growth - - -
EBITDA growth - - -
Operational Asset Details - HT-V GHHEPL – 99 kms (Hungund-Hospet)
Note: Project commenced operation on 23rd Nov 2012 (Q3FY13) hence previous periods figures are not comparable
54
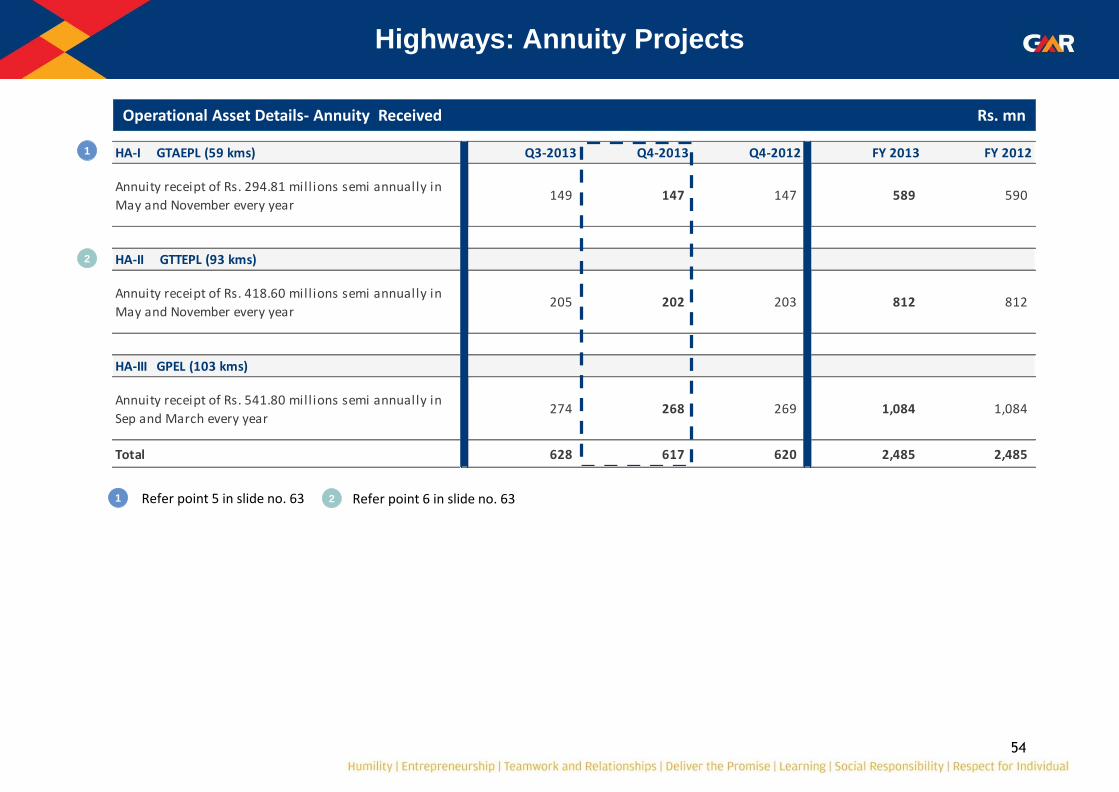
Highways: Annuity Projects
Operational Asset Details- Annuity Received Rs. mn
HA-I GTAEPL (59 kms) Q3-2013 Q4-2013 Q4-2012 FY 2013 FY 2012
Annuity receipt of Rs. 294.81 mill ions semi annually in
May and November every year149 147 147 589 590
HA-II GTTEPL (93 kms)
Annuity receipt of Rs. 418.60 mill ions semi annually in
May and November every year205 202 203 812 812
HA-III GPEL (103 kms)
Annuity receipt of Rs. 541.80 mill ions semi annually in
Sep and March every year274 268 269 1,084 1,084
Total 628 617 620 2,485 2,485
Rs. mn.
1 Refer point 5 in slide no. 63
1
Refer point 6 in slide no. 63
2
2

55
Company wise- Financial Performance
Gross Revenue Rs. mn
Company Q3-2013 Q4-2013 Q4-2012 FY 2013 FY 2012 Q4-Q4 Q4-Q3 Y-o-Y
Annuity Projects:
HA-I GTAEPL 149 147 147 589 590 -1% -1% 0%
HA-II GTTEPL 205 202 203 812 812 0% -1% 0%
HA-III GPEL 274 268 269 1,084 1,084 -1% -2% 0%
Total Annuity 628 617 620 2,485 2,485 -1% -2% 0%
Toll Projects:
HT-I GACEPL 76 72 65 286 246 11% -5% 16%
HT-II GJEPL 163 167 157 642 588 6% 2% 9%
HT-III GUEPL 225 230 195 880 737 18% 2% 19%
HT-IV GHVEPL 75 572 - 648 - - - -
HT-V GHHEPL 71 162 - 233 - - - -
Total Toll 610 1,204 417 2,688 1,571 189% 97% 71%
Others - (0)
Total Roads 1,238 1,820 1,036 5,174 4,056 76% 47% 28%

56
Company wise- Financial Performance
Net Revenue Rs. mn
Company Q3-2013 Q4-2013 Q4-2012 FY 2013 FY 2012 Q4-Q4 Q4-Q3 Y-o-Y
Annuity Projects:
HA-I GTAEPL 149 147 147 589 590 -1% -1% 0%
HA-II GTTEPL 205 202 203 812 812 0% -1% 0%
HA-III GPEL 274 268 269 1,084 1,084 -1% -2% 0%
Total Annuity 628 617 620 2,485 2,485 -1% -2% 0%
Toll Projects:
HT-I GACEPL 76 72 65 286 246 11% -5% 16%
HT-II GJEPL 163 167 157 642 588 6% 2% 9%
HT-III GUEPL 225 230 195 880 737 18% 2% 19%
HT-IV GHVEPL 50 387 - 436 - - - -
HT-V GHHEPL 71 162 - 233 - - - -
Total Toll 584 1,018 417 2,477 1,571 144% 74% 58%
Others
Total Roads 1,212 1,635 1,037 4,963 4,056 58% 35% 22%

57
Company wise- Financial Performance
EBITDA Rs. mn
Company Q3-2013 Q4-2013 Q4-2012 FY 2013 FY 2012 Q4-Q4 Q4-Q3 Y-o-Y
Annuity Projects:
HA-I GTAEPL 118 49 117 399 468 -58% -58% -15%
HA-II GTTEPL 153 7 151 464 611 -95% -95% -24%
HA-III GPEL 254 245 252 1,002 1,007 -3% -3% -1%
Total Annuity 524 302 520 1,865 2,087 -42% -42% -11%
Toll Projects:
HT-I GACEPL 52 51 51 194 199 -1% -2% -2%
HT-II GJEPL 140 137 139 545 517 -2% -2% 5%
HT-III GUEPL 201 178 176 752 661 1% -11% 14%
HT-IV GHVEPL 38 331 - 370 - - - -
HT-V GHHEPL 54 130 - 184 - - - -
Total Toll 485 827 367 2,044 1,377 126% 71% 48%
Others 9 (28) 4 (20) 27
Total Roads 1,018 1,100 891 3,888 3,491 24% 8% 11%
1 Refer point 5 in slide no. 63
1
Refer point 6 in slide no. 63
2
2
3
3 Refer point 2 in slide no. 63

58
Company wise- Financial Performance
EBITDA margin
Company Q3-2013 Q4-2013 Q4-2012 FY 2013 FY 2012
Annuity Projects:
HA-I GTAEPL 79% 34% 80% 68% 79%
HA-II GTTEPL 75% 4% 74% 57% 75%
HA-III GPEL 93% 91% 93% 92% 93%
Total Annuity 83% 49% 84% 75% 84%
Toll Projects:
HT-I GACEPL 69% 70% 79% 68% 81%
HT-II GJEPL 86% 82% 89% 85% 88%
HT-III GUEPL 89% 77% 90% 85% 90%
HT-IV GHVEPL 77% 86% 0% 85% 0%
HT-V GHHEPL 76% 80% 0% 79% 0%
Total Toll 83% 81% 88% 83% 88%
TOTAL Roads 84% 67% 86% 78% 86%
59
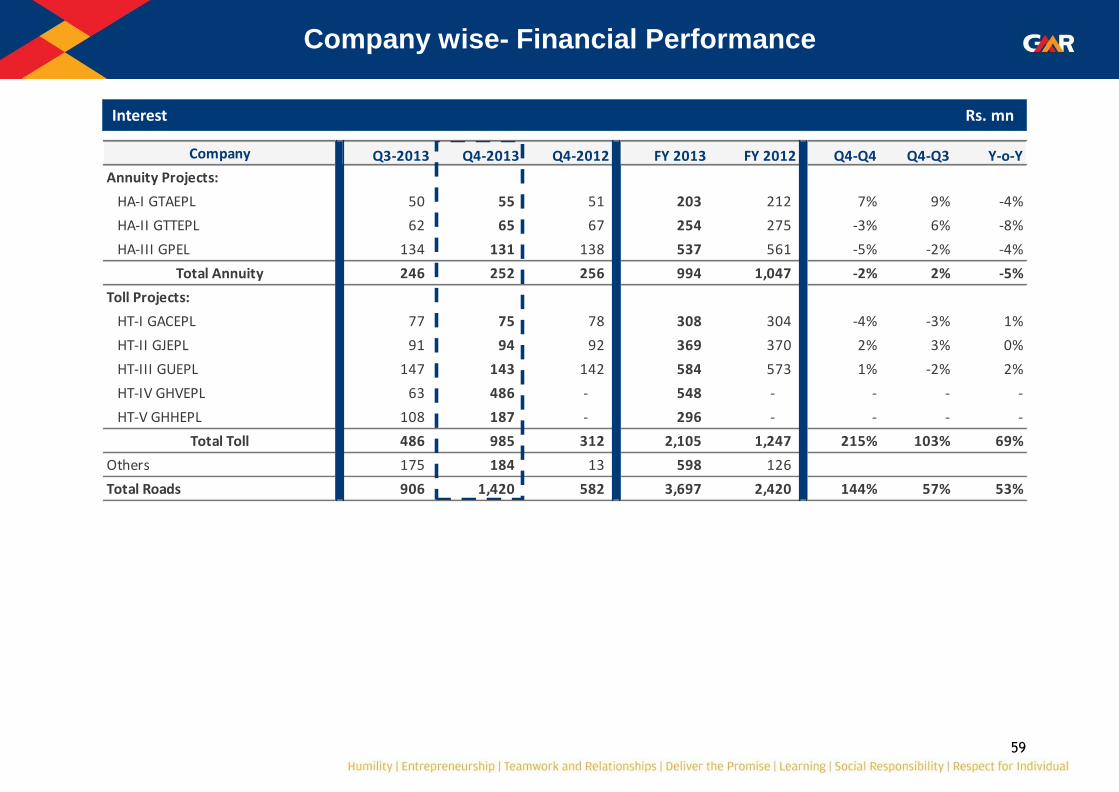
Company wise- Financial Performance
Interest Rs. mn
Company Q3-2013 Q4-2013 Q4-2012 FY 2013 FY 2012 Q4-Q4 Q4-Q3 Y-o-Y
Annuity Projects:
HA-I GTAEPL 50 55 51 203 212 7% 9% -4%
HA-II GTTEPL 62 65 67 254 275 -3% 6% -8%
HA-III GPEL 134 131 138 537 561 -5% -2% -4%
Total Annuity 246 252 256 994 1,047 -2% 2% -5%
Toll Projects:
HT-I GACEPL 77 75 78 308 304 -4% -3% 1%
HT-II GJEPL 91 94 92 369 370 2% 3% 0%
HT-III GUEPL 147 143 142 584 573 1% -2% 2%
HT-IV GHVEPL 63 486 - 548 - - - -
HT-V GHHEPL 108 187 - 296 - - - -
Total Toll 486 985 312 2,105 1,247 215% 103% 69%
Others 175 184 13 598 126
Total Roads 906 1,420 582 3,697 2,420 144% 57% 53%

60
Company wise- Financial Performance
Depreciation Rs. mn
Company Q3-2013 Q4-2013 Q4-2012 FY 2013 FY 2012 Q4-Q4 Q4-Q3 Y-o-Y
Annuity Projects:
HA-I GTAEPL 50 49 49 199 199 -1% -2% 0%
HA-II GTTEPL 64 62 63 253 253 -1% -2% 0%
HA-III GPEL 102 100 100 403 404 -1% -2% 0%
Total Annuity 216 211 213 855 856 -1% -2% 0%
Toll Projects:
HT-I GACEPL 32 30 (1) 121 (126) 2299% -5% 195%
HT-II GJEPL 44 45 69 175 85 -34% 2% 106%
HT-III GUEPL 66 67 23 258 41 187% 2% 526%
HT-IV GHVEPL 5 32 - 37 - - - -
HT-V GHHEPL 8 24 - 32 - - - -
Total Toll 155 199 91 622 (0) 120% 28% 135721%
Others -
Total Roads 371 410 303 1,478 855 35% 11% 73%

61
Company wise- Financial Performance
PAT (Before Minority Interest) Rs. mn
Company Q3-2013 Q4-2013 Q4-2012 FY 2013 FY 2012 Q4-Q4 Q4-Q3 Y-o-Y
Annuity Projects:
HA-I GTAEPL 30 (32) 30 65 107 -205% -204% -40%
HA-II GTTEPL 56 (73) 48 93 178 -252% -230% -48%
HA-III GPEL 47 47 35 180 141 33% -1% 28%
Total Annuity 133 (58) 113 337 426 -151% -143% -21%
Toll Projects:
HT-I GACEPL (56) (53) 205 (231) 17 -126% 6% -1441%
HT-II GJEPL 10 3 47 21 64 -93% -69% -67%
HT-III GUEPL (10) (30) 184 (82) 50 -116% -199% -266%
HT-IV GHVEPL (30) (185) - (215) - - - -
HT-V GHHEPL (64) (80) - (144) - - - -
Total Toll (149) (345) 436 (651) 131 -179% -131% -597%
Others (183) (206) (3) (654) (39) -13%
Total Roads (199) (609) 546 (968) 519 -212% -206% -287%

62
Highways Consolidated: Financial Performance
Rs. mn
Q3-2013 Q4-2013 Q4-2012 FY 2013 FY 2012 Q4-Q4 Q4-Q3 Y-o-Y
Annuity Revenue 628 617 619 2,485 2,485 0% -2% 0%
Toll Revenue 610 1,204 417 2,688 1,571 189% 97% 71%
Gross Revenue 1,238 1,820 1,036 5,174 4,056 76% 47% 28%
Less: Revenue Share 25 186 - 211 - 0% 636% 0%
Net Revenue 1,212 1,635 1,036 4,963 4,056 58% 35% 22%
Operating Expenses 195 534 146 1,074 565 267% 174% 90%
EBITDA 1,018 1,100 891 3,888 3,491 24% 8% 11%
EBITDA margin 84% 67% 86% 78% 86%
Other Income 111 91 103 420 444 -11% -17% -5%
Interest & Finance Charges 906 1,420 582 3,697 2,420 144% 57% 53%
Depreciation 373 409 (178) 1,478 856 329% 10% 73%
PBT (151) (637) 590 (866) 659 -208% -323% -231%
Current Tax 43 (21) 39 99 149 -154% -149% -34%
Deferred Tax 5 (7) 5 3 (9) -249% -249% 133%
PAT (Before Minority Interest) (199) (609) 546 (968) 519 -212% -206% -287%
PAT (After Minority Interest) (172) (561) 437 (954) 409 -229% -226% -333%

63
Management Discussion & Analysis (MDA): Highways Sector
1. Toll rates have increased from September 1, 2012 on account of Inflation adjustment:
2. HT-I GACEPL-The reduction in EBITDA ; Y-o-Y is primarily on account of increase in expenses of BC Rectification works, Legal & Consultancy and Other administration Expenses.
3. HT-IV GHVEPL highway has commenced operations from 20th December 2012.
4. HT-V GHHEPL has commenced partial operations (2 out of 3 Toll plazas) from 23rd November 2012. It is expected to be fully operation in FY2014
5. HA-I GTAEPL – EBITDA has reduced on account of additional MMR provision of Rs 53 mn in Q4FY13.
6. HA-II GTTEPL – EBITDA has reduced on account of additional MMR provision of Rs 123 mn in Q4FY13.
Asset Inflation Adjustment
HT-I GACEPL 8.95%
HT-II GJEPL 8.35%
HT-III GUEPL 8.35%

EPC & Others: Financial Performance
65
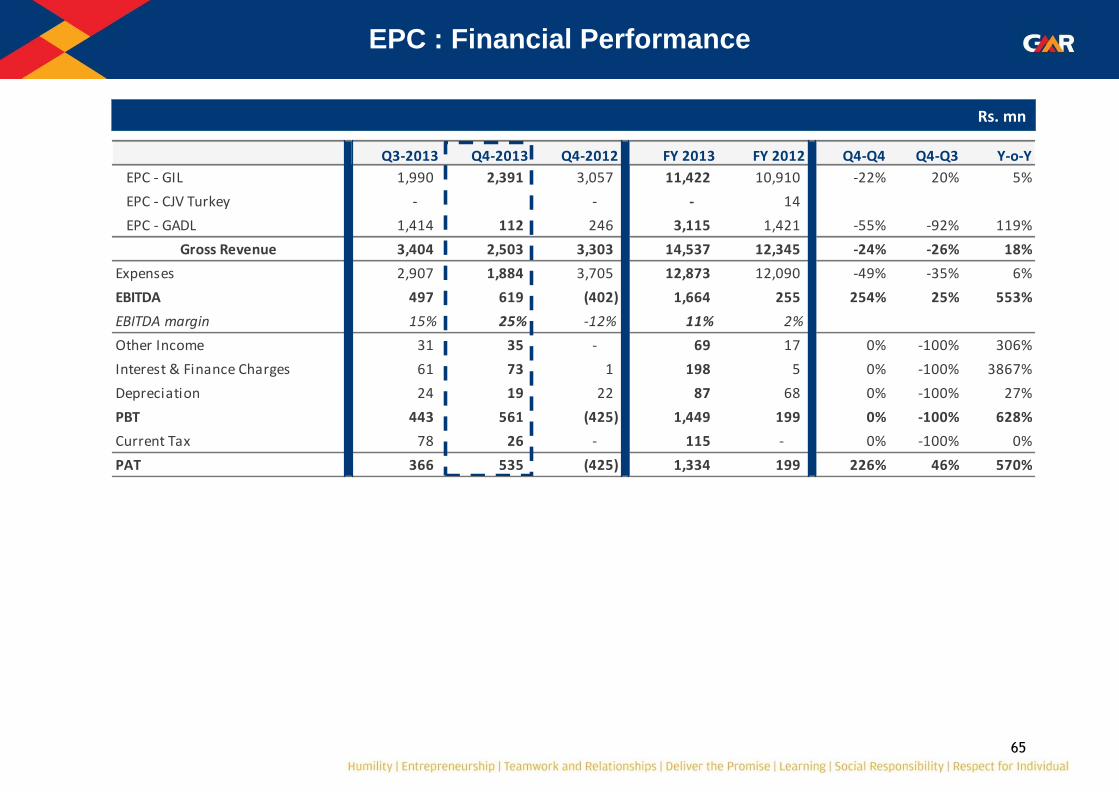
EPC : Financial Performance
Rs. mn
Q3-2013 Q4-2013 Q4-2012 FY 2013 FY 2012 Q4-Q4 Q4-Q3 Y-o-Y
EPC - GIL 1,990 2,391 3,057 11,422 10,910 -22% 20% 5%
EPC - CJV Turkey - - - 14
EPC - GADL 1,414 112 246 3,115 1,421 -55% -92% 119%
Gross Revenue 3,404 2,503 3,303 14,537 12,345 -24% -26% 18%
Expenses 2,907 1,884 3,705 12,873 12,090 -49% -35% 6%
EBITDA 497 619 (402) 1,664 255 254% 25% 553%
EBITDA margin 15% 25% -12% 11% 2%
Other Income 31 35 - 69 17 0% -100% 306%
Interest & Finance Charges 61 73 1 198 5 0% -100% 3867%
Depreciation 24 19 22 87 68 0% -100% 27%
PBT 443 561 (425) 1,449 199 0% -100% 628%
Current Tax 78 26 - 115 - 0% -100% 0%
PAT 366 535 (425) 1,334 199 226% 46% 570%

66
Others : Financial Performance*
* Others include: GIL Corporate, Hotels (Hyderabad & Turkey), Investment Cos. and Overseas Subsidiaries ** Income is on account of Profit from divestment in GMR Energy (Singapore) Pte Ltd.
Rs. mn
Q3-2013 Q4-2013 Q4-2012 FY 2013 FY 2012 Q4-Q4 Q4-Q3 Y-o-Y
Gross Revenue 1,534 1,132 1,564 5,457 5,770 -28% -26% -5%
Expenditure 540 751 986 2,564 3,045 -24% 39% -16%
Forex Loss / (Gain) (36) (30) 272 (338) (537) -111% 16% 37%
EBITDA 1,030 412 306 3,232 3,262 34% -60% -1%
EBITDA margin 67% 36% 20% 59% 57%
Other Income 110 106 114 363 303 -7% -4% 20%
Exceptional item - Income ** - 759 - 759 - 0% 0% 0%
Interest & Fin Charges 1,309 931 863 4,418 2,605 8% -29% 70%
Depreciation 107 97 105 409 407 -7% -9% 0%
PBT (276) 247 (548) (473) 553 145% 190% -185%
Current Tax (Normal) 21 338 37 603 460 817% 1484% 31%
MAT Credit (21) 22 140 (1) (170) -85% 201% 100%
Deferred Tax (68) 55 12 (142) 36 355% 181% -494%
PAT (Before Minority Interest) (208) (168) (736) (934) 228 77% 19% -510%
PAT (After Minority Interest) (215) (155) (739) (845) 275 79% 28% -407%

Consolidated Financial Performance
68
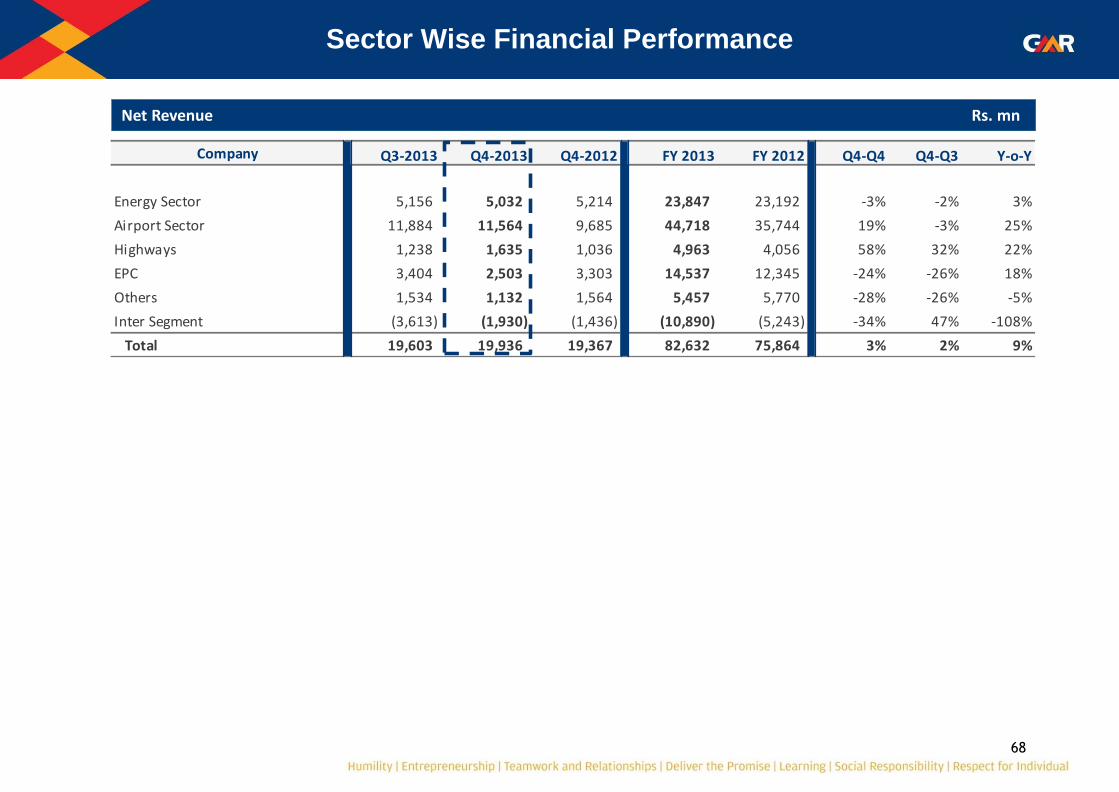
Sector Wise Financial Performance
Net Revenue Rs. mn
Company Q3-2013 Q4-2013 Q4-2012 FY 2013 FY 2012 Q4-Q4 Q4-Q3 Y-o-Y
Energy Sector 5,156 5,032 5,214 23,847 23,192 -3% -2% 3%
Airport Sector 11,884 11,564 9,685 44,718 35,744 19% -3% 25%
Highways 1,238 1,635 1,036 4,963 4,056 58% 32% 22%
EPC 3,404 2,503 3,303 14,537 12,345 -24% -26% 18%
Others 1,534 1,132 1,564 5,457 5,770 -28% -26% -5%
Inter Segment (3,613) (1,930) (1,436) (10,890) (5,243) -34% 47% -108%
Total 19,603 19,936 19,367 82,632 75,864 3% 2% 9%

69
EBITDA Rs. mn
Sector Wise Financial Performance
Company Q3-2013 Q4-2013 Q4-2012 FY 2013 FY 2012 Q4-Q4 Q4-Q3 Y-o-Y
Energy Sector (235) (1,099) (329) (62) 1,900 -233% -367% -103%
Airport Sector 4,344 7,008 1,923 18,440 8,714 264% 61% 112%
Highways 1,018 1,100 891 3,888 3,491 24% 8% 11%
EPC 497 619 (402) 1,664 255 254% 25% 553%
Others 1,030 412 306 3,232 3,262 34% -60% -1%
Inter Segment (1,091) (385) 55 (2,390) (1,027) -796% 65% -133%
Total 5,563 7,654 2,444 24,773 16,595 213% 38% 49%
70
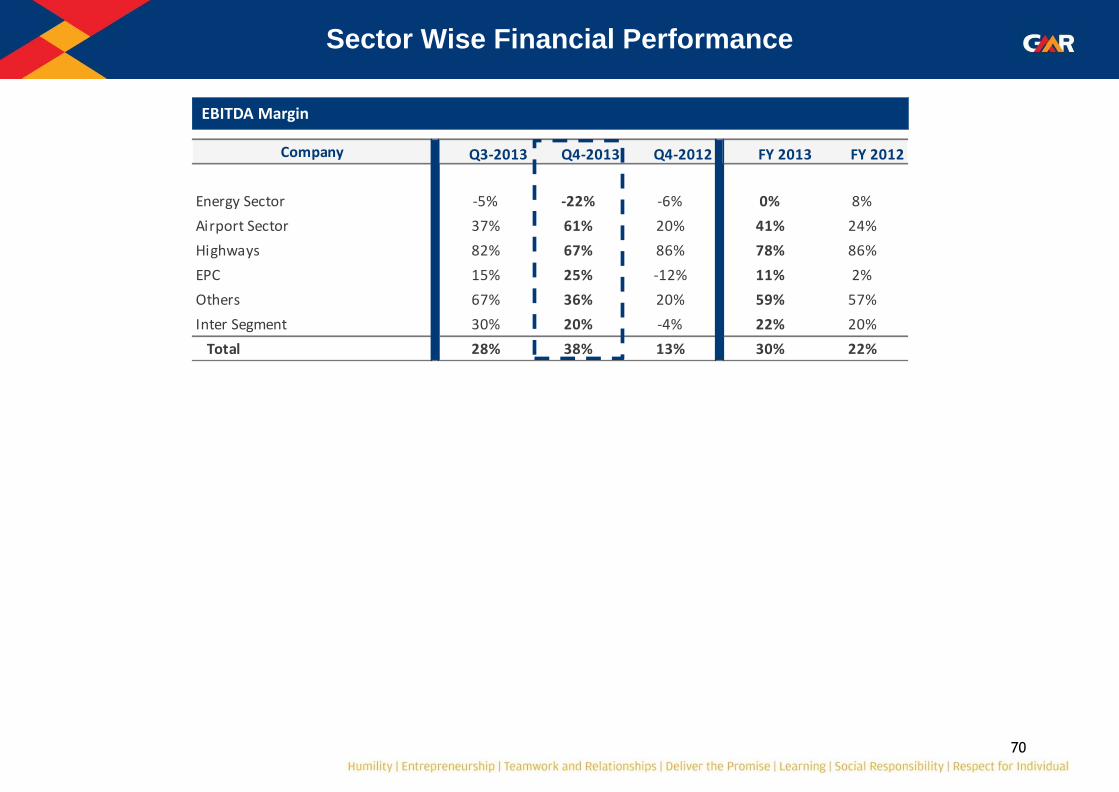
EBITDA Margin
Sector Wise Financial Performance
Company Q3-2013 Q4-2013 Q4-2012 FY 2013 FY 2012
Energy Sector -5% -22% -6% 0% 8%
Airport Sector 37% 61% 20% 41% 24%
Highways 82% 67% 86% 78% 86%
EPC 15% 25% -12% 11% 2%
Others 67% 36% 20% 59% 57%
Inter Segment 30% 20% -4% 22% 20%
Total 28% 38% 13% 30% 22%

71
PAT (After Minority Interest) Rs. mn
Sector Wise Financial Performance
Company Q3-2013 Q4-2013 Q4-2012 FY 2013 FY 2012 Q4-Q4 Q4-Q3 Y-o-Y
Energy Sector (1,487) 6,341 (1,014) 3,232 (1,589) 726% 526% 303%
Airport Sector (234) (160) (2,416) (868) (5,579) 93% 31% 84%
Highways (172) (561) 437 (954) 409 -229% -226% -333%
EPC 366 535 (425) 1,334 199 226% 46% 570%
Others (215) (155) (739) (845) 275 79% 28% -407%
Inter Segment (433) (208) 496 (1,017) 251 -142% 52% -505%
Total (2,175) 5,791 (3,662) 881 (6,033) 258% 366% 115%

72
Consolidated Profitability Statement
Rs. mn
Q3-2013 Q4-2013 Q4-2012 FY 2013 FY 2012 Q4-Q4 Q4-Q3 Y-o-Y
Airports 15,985 17,293 11,547 61,202 44,054 50% 8% 39%
Power 5,249 5,090 5,331 24,251 23,750 -5% -3% 2%
Roads 1,238 1,820 1,037 5,174 4,056 76% 47% 28%
EPC 3,404 2,503 3,303 14,537 12,346 -24% -26% 18%
Others 1,373 1,132 1,565 5,457 5,770 -28% -18% -5%
Less: Inter Segment (3,426) (1,929) (1,438) (10,890) (5,246) -34% 44% -108%
Gross Revenue 23,824 25,908 21,343 99,731 84,730 21% 9% 18%
Less: Revenue Share / Rebate in Energy 4,221 5,972 1,977 17,099 8,866 202% 42% 93%
Net Revenue 19,603 19,936 19,367 82,632 75,864 3% 2% 9%
Total Expenditure 14,041 12,281 16,923 57,859 59,268 -27% -13% -2%
EBITDA 5,563 7,654 2,444 24,773 16,595 213% 38% 49%
EBITDA margin 28% 38% 13% 30% 22%
Other Income 615 696 376 2,770 2,434 85% 13% 14%
Exceptional Item - -
a) Profit on Sale of Subsidiary (GMRE) - 12,313 - 12,313 -
b) Loss on Impairment of assets in a
Subsidiary (HEG)- (2,514) - (2,514) -
c) Asset Write-off in Subsidiary (Male) - (2,026) - (2,026) -
d) Interest on Loan against
development fee receipt- - (1,621) - (1,621)
Interest & Finance Charges 5,253 6,082 4,646 20,990 16,531 31% 16% 27%
Depreciation 2,581 2,722 1,986 10,398 9,358 37% 5% 11%
PBT (1,655) 7,319 (5,434) 3,929 (8,481) 235% 542% 146%
Tax 495 687 422 2,574 2,107 63% 39% 22%
Current Tax 433 436 183 1,944 1,598 138% 1% 22%
MAT Credit (51) (194) 282 (322) (38) -169% -280% -756%
Deferred Tax 113 445 (43) 953 551 1134% 294% 73%
PAT (Before Minority Interest) (2,150) 6,633 (5,856) 1,354 (10,588) 213% 409% 113%
Less: Minority Int. / Share of Associates 25 842 (2,195) 473 (4,555) 138% 3232% 110%
PAT (After Minority Interest) (2,175) 5,791 (3,662) 881 (6,033) 258% 366% 115%

73
Consolidated Balance Sheet
Rs. mn
Particulars 31-Mar-13 31-Mar-12
Equity and Liabilities
Shareholders’ Funds
(a) Share Capital 3,892 3,892
(b) Reserves & Surplus 68,889 71,485
72,782 75,378
Pref Shares by Subsidiaries 19,711 19,801
Minority Interest 17,200 17,917
Net Worth 1,09,693 1,13,096
Long Term Liabilities:
a) Long Term Borrowings (other than DF) 3,04,539 2,47,192
b) Deferred Tax Liability 554 377
b) Trade Payables 686 117
c) Other Long Term Liabilities 28,582 25,265
d) Long Term Provisions 1,488 1,491
e) Pass through Debts / Interest Free Loans 11,793 6,475
3,47,642 2,80,916
Current Liabilities:
a) Short-term borrowings 48,566 73,156
b) Trade Payables 14,816 12,367
c) Other Current liabilities 56,327 47,458
c) Short Term Provisions 2,531 1,822
b) Current maturities of long-term borrowings
(other than DF) 55,144 25,261
d) Pass through Debts / Interest Free Loans 3,452 8,206
1,80,835 1,68,269
Total 6,38,170 5,62,282
Particulars 31-Mar-13 31-Mar-12
Assets:
Non Current Assets:
Fixed Assets 4,33,504 3,88,492
Goodwill on Consolidation 31,631 31,745
Non-current investments 1,041 1,492
Deferred tax assets 581 1,359
Long term loans and advances 34,778 32,045
Trade receivables 1,734 1,337
Other non-current assets 20,501 11,425
Non Current Bank Balance 17,958 4,391
5,41,728 4,72,285
Current Assets:
Current investments 1,787 5,724
Inventories 2,704 2,595
Trade receivables 16,956 17,037
Cash and cash equivalents 51,348 42,561
Short-term loans and advances 8,798 9,877
Other current assets 14,848 12,203
96,442 89,997
Total 6,38,170 5,62,282

74
Key Balance Sheet Details
Rs. mn
31-Mar-13 31-Mar-12
Gross Debt 4,08,249 3,45,608
Less: Cash & Cash equivalents 71,093 52,676
Net Debt 3,37,156 2,92,932
Net Worth 1,09,693 1,13,096
Net Debt/Equity 3.07 2.59
Thank You
For further information, please visit
Website: www.gmrgroup.in or
Contact: [email protected]