do not refresh this file - gmr groupinvestor.gmrgroup.in/pdf/gmr financial overview q3fy13.pdf ·...
TRANSCRIPT
Do not refresh this file
0
GMR INFRASTRUCTURE LTD FINANCIAL / OPERATIONAL OVERVIEW
Q3 FY 2012-13
1
Presentation Flow
Glossary … 2
Major Highlights … 3
Industry Overview … 8
Airports Sector … 13
Energy Sector … 33
Highways Sector … 48
EPC & Others: Financial Performance … 64
Consolidated Financial Performance … 67

2
Glossary
PG Power Gas
PC Power Coal
PL Power LSHS
PS Power Solar
PT Power Transmission
CL Coal
HEG Homeland Energy Group
GEMs Golden Energy Mines
HMACPL Hyderabad Menzies Air Cargo
GETL GMR Energy Trading
PTD Power Trading
HT Highways Toll
HA Highways Annuity
Disclaimer: Totals in some columns / rows may not agree due to rounding off.
3
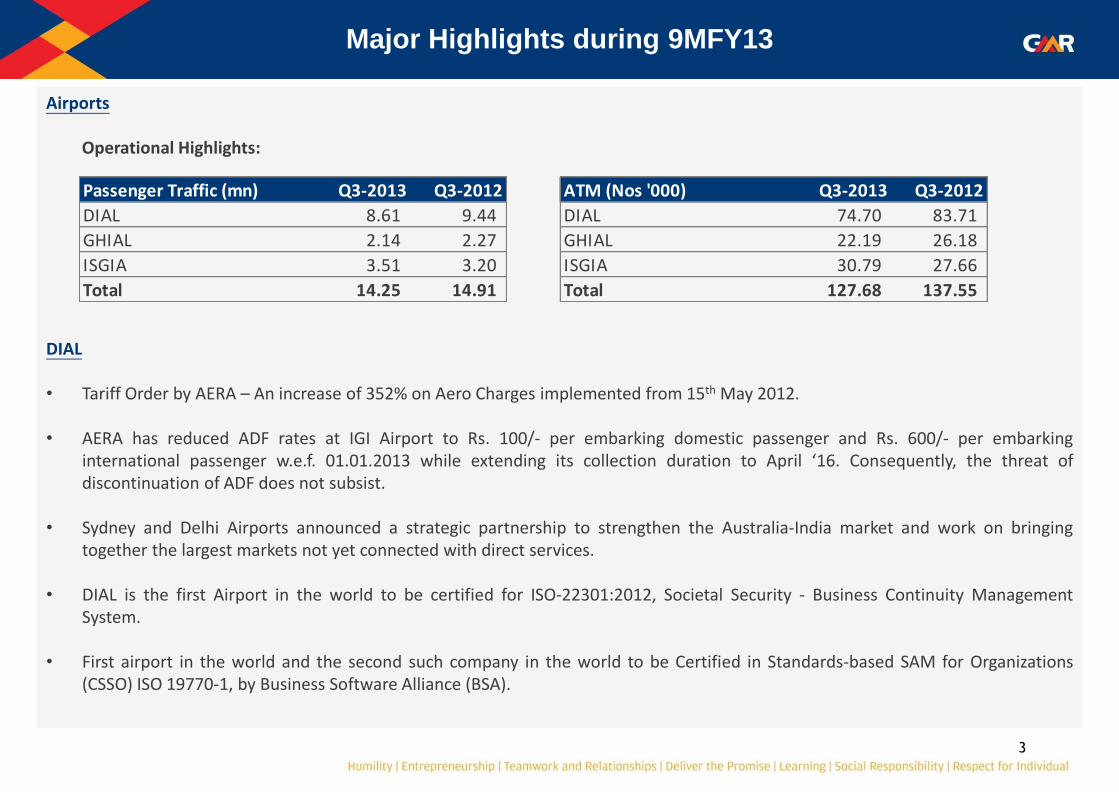
Airports
Operational Highlights: DIAL
• Tariff Order by AERA – An increase of 352% on Aero Charges implemented from 15th May 2012. • AERA has reduced ADF rates at IGI Airport to Rs. 100/- per embarking domestic passenger and Rs. 600/- per embarking
international passenger w.e.f. 01.01.2013 while extending its collection duration to April ‘16. Consequently, the threat of discontinuation of ADF does not subsist.
• Sydney and Delhi Airports announced a strategic partnership to strengthen the Australia-India market and work on bringing together the largest markets not yet connected with direct services.
• DIAL is the first Airport in the world to be certified for ISO-22301:2012, Societal Security - Business Continuity Management System.
• First airport in the world and the second such company in the world to be Certified in Standards-based SAM for Organizations (CSSO) ISO 19770-1, by Business Software Alliance (BSA).
Major Highlights during 9MFY13
Passenger Traffic (mn) Q3-2013 Q3-2012 ATM (Nos '000) Q3-2013 Q3-2012
DIAL 8.61 9.44 DIAL 74.70 83.71
GHIAL 2.14 2.27 GHIAL 22.19 26.18
ISGIA 3.51 3.20 ISGIA 30.79 27.66
Total 14.25 14.91 Total 127.68 137.55
4
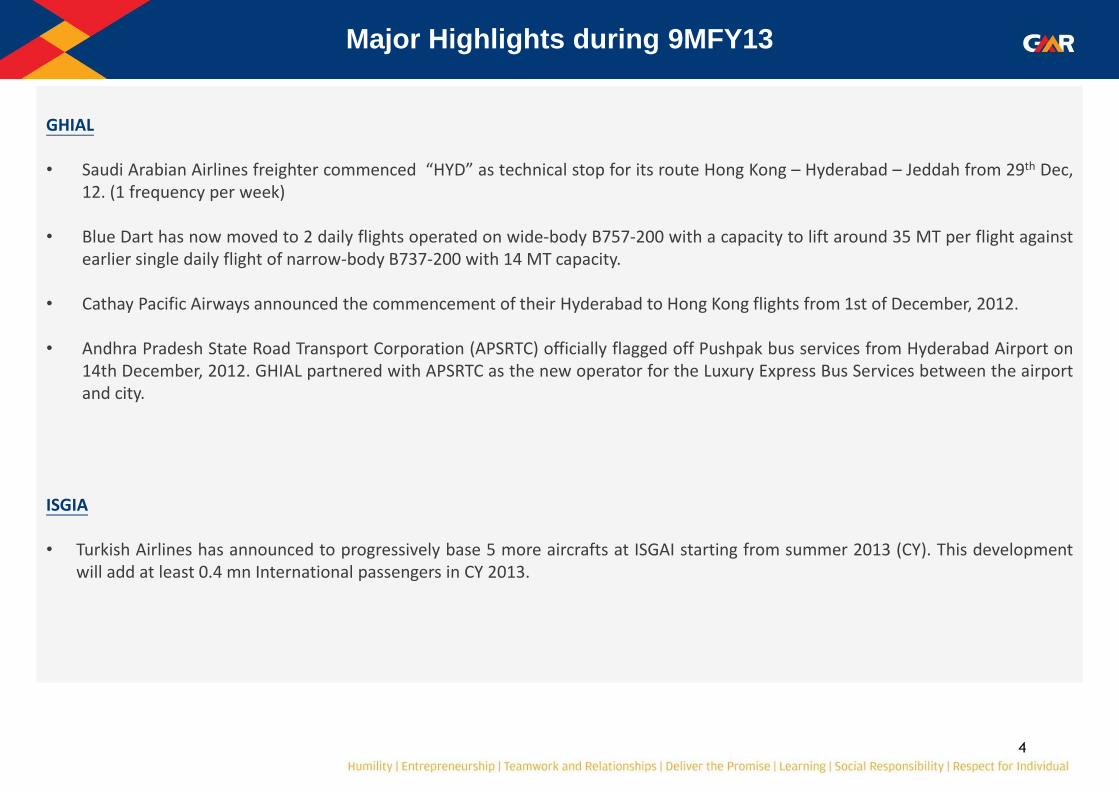
GHIAL • Saudi Arabian Airlines freighter commenced “HYD” as technical stop for its route Hong Kong – Hyderabad – Jeddah from 29th Dec,
12. (1 frequency per week)
• Blue Dart has now moved to 2 daily flights operated on wide-body B757-200 with a capacity to lift around 35 MT per flight against earlier single daily flight of narrow-body B737-200 with 14 MT capacity.
• Cathay Pacific Airways announced the commencement of their Hyderabad to Hong Kong flights from 1st of December, 2012.
• Andhra Pradesh State Road Transport Corporation (APSRTC) officially flagged off Pushpak bus services from Hyderabad Airport on 14th December, 2012. GHIAL partnered with APSRTC as the new operator for the Luxury Express Bus Services between the airport and city.
ISGIA • Turkish Airlines has announced to progressively base 5 more aircrafts at ISGAI starting from summer 2013 (CY). This development
will add at least 0.4 mn International passengers in CY 2013.
Major Highlights during 9MFY13
5
Awards & Recognition
DIAL
• CII Award for best energy efficient building and most informative presentation on energy efficiency.
• Became the 5th Asia-Pacific Airport to be Airport Carbon Accredited.
• DIAL becomes 6th Airport in World to attain ITSMS (Information Technology Service Management System) - ISO 20K Certification.
• CNBC Awaaz Travel Awards 2012 - Delhi Airport adjudged as the Best Managed Airport.
GHIAL • Adjudged as “The Best Cargo Airport & Best Cargo Terminal of the Year” by Air Cargo Association of India.
• Level 2 Accreditation awarded by ACI on Airport Carbon Emission reduction initiative.
ISGIA
• Sabiha Gokcen Airport was awarded the SUPERBRAND 2012 status during the Turkey’s Super Brands - 2012 Program in Turkey,
Istanbul.
Major Highlights during 9MFY13
6
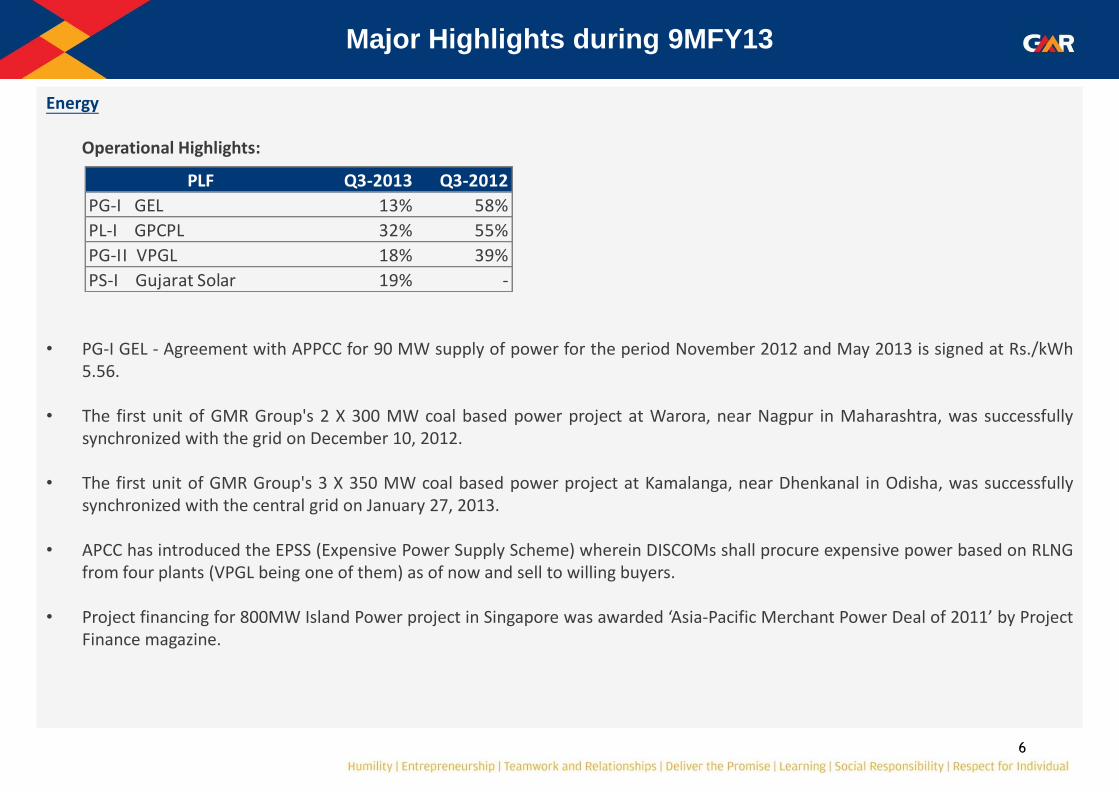
Energy Operational Highlights:
• PG-I GEL - Agreement with APPCC for 90 MW supply of power for the period November 2012 and May 2013 is signed at Rs./kWh 5.56.
• The first unit of GMR Group's 2 X 300 MW coal based power project at Warora, near Nagpur in Maharashtra, was successfully synchronized with the grid on December 10, 2012.
• The first unit of GMR Group's 3 X 350 MW coal based power project at Kamalanga, near Dhenkanal in Odisha, was successfully synchronized with the central grid on January 27, 2013.
• APCC has introduced the EPSS (Expensive Power Supply Scheme) wherein DISCOMs shall procure expensive power based on RLNG from four plants (VPGL being one of them) as of now and sell to willing buyers.
• Project financing for 800MW Island Power project in Singapore was awarded ‘Asia-Pacific Merchant Power Deal of 2011’ by Project Finance magazine.
PLF Q3-2013 Q3-2012
PG-I GEL 13% 58%
PL-I GPCPL 32% 55%
PG-II VPGL 18% 39%
PS-I Gujarat Solar 19% -
Major Highlights during 9MFY13
7
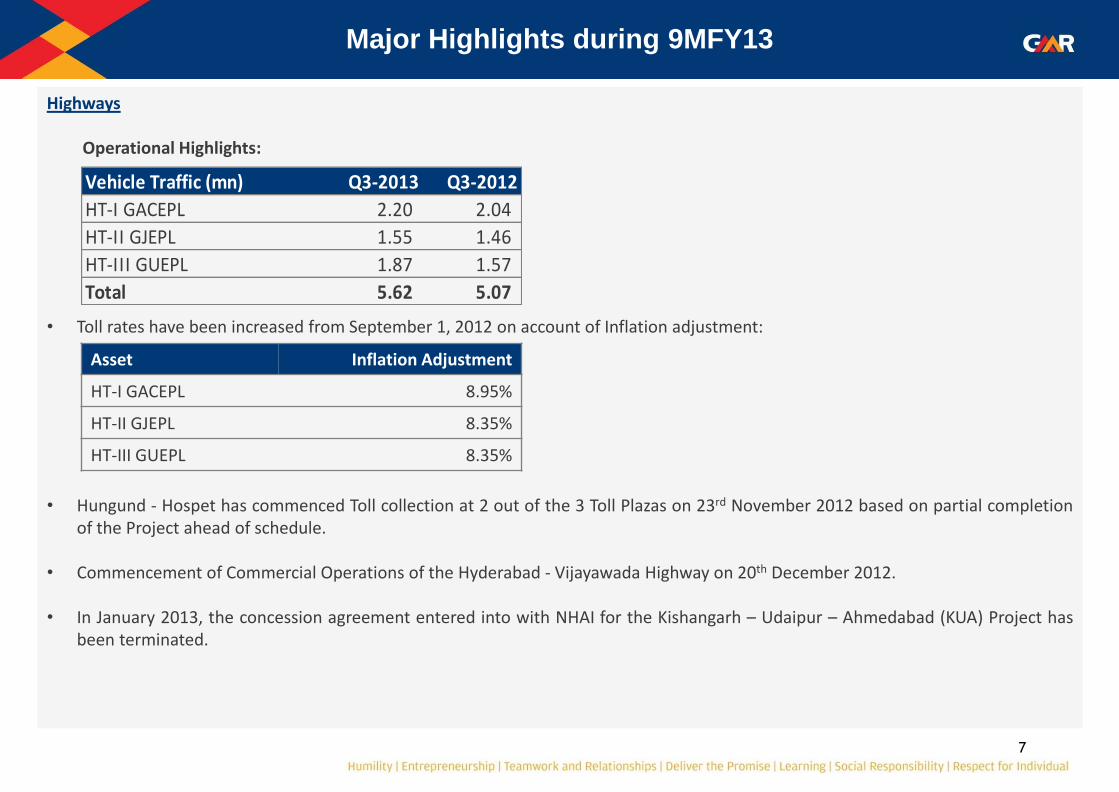
Highways
Operational Highlights:
• Toll rates have been increased from September 1, 2012 on account of Inflation adjustment:
• Hungund - Hospet has commenced Toll collection at 2 out of the 3 Toll Plazas on 23rd November 2012 based on partial completion
of the Project ahead of schedule.
• Commencement of Commercial Operations of the Hyderabad - Vijayawada Highway on 20th December 2012.
• In January 2013, the concession agreement entered into with NHAI for the Kishangarh – Udaipur – Ahmedabad (KUA) Project has been terminated.
Asset Inflation Adjustment
HT-I GACEPL 8.95%
HT-II GJEPL 8.35%
HT-III GUEPL 8.35%
Vehicle Traffic (mn) Q3-2013 Q3-2012
HT-I GACEPL 2.20 2.04
HT-II GJEPL 1.55 1.46
HT-III GUEPL 1.87 1.57
Total 5.62 5.07
Major Highlights during 9MFY13
8
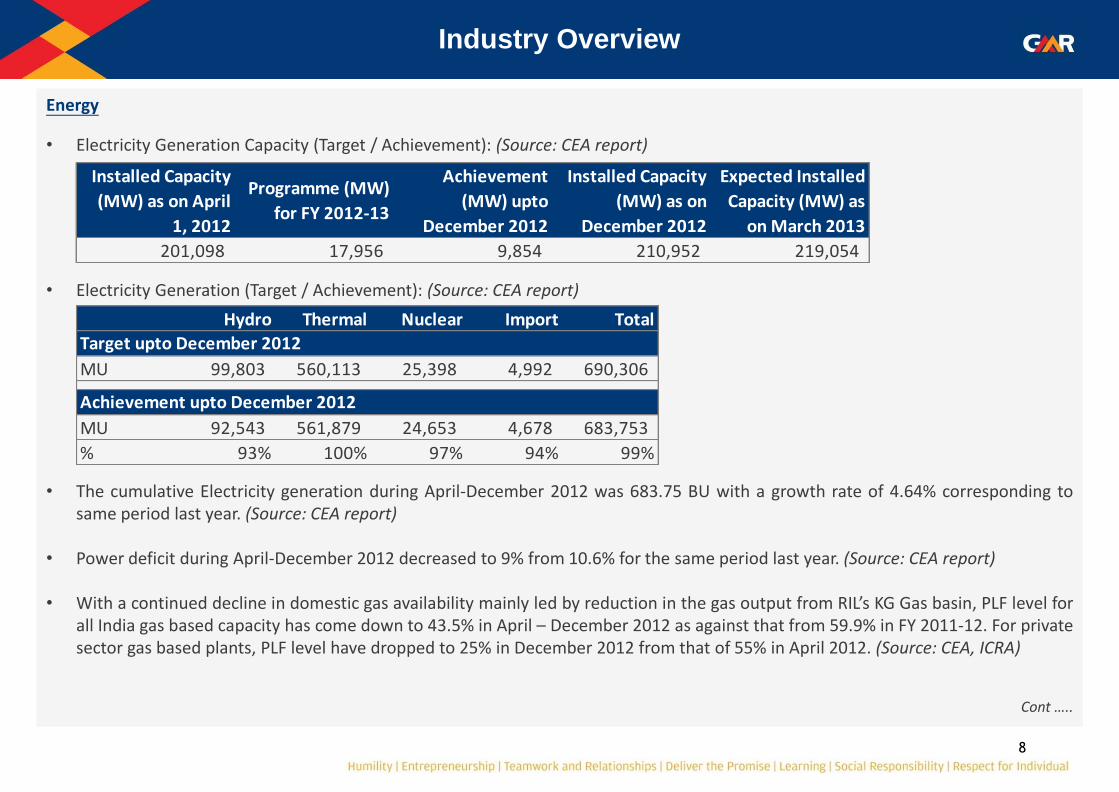
Energy
• Electricity Generation Capacity (Target / Achievement): (Source: CEA report)
• Electricity Generation (Target / Achievement): (Source: CEA report)
• The cumulative Electricity generation during April-December 2012 was 683.75 BU with a growth rate of 4.64% corresponding to
same period last year. (Source: CEA report)
• Power deficit during April-December 2012 decreased to 9% from 10.6% for the same period last year. (Source: CEA report)
• With a continued decline in domestic gas availability mainly led by reduction in the gas output from RIL’s KG Gas basin, PLF level for all India gas based capacity has come down to 43.5% in April – December 2012 as against that from 59.9% in FY 2011-12. For private sector gas based plants, PLF level have dropped to 25% in December 2012 from that of 55% in April 2012. (Source: CEA, ICRA)
Cont …..
Industry Overview
201,098 17,956 9,854 210,952 219,054
Achievement
(MW) upto
December 2012
Installed Capacity
(MW) as on
December 2012
Expected Installed
Capacity (MW) as
on March 2013
Installed Capacity
(MW) as on April
1, 2012
Programme (MW)
for FY 2012-13
Hydro Thermal Nuclear Import Total
MU 99,803 560,113 25,398 4,992 690,306
MU 92,543 561,879 24,653 4,678 683,753
% 93% 100% 97% 94% 99%
Achievement upto December 2012
Target upto December 2012
9
Industry Overview
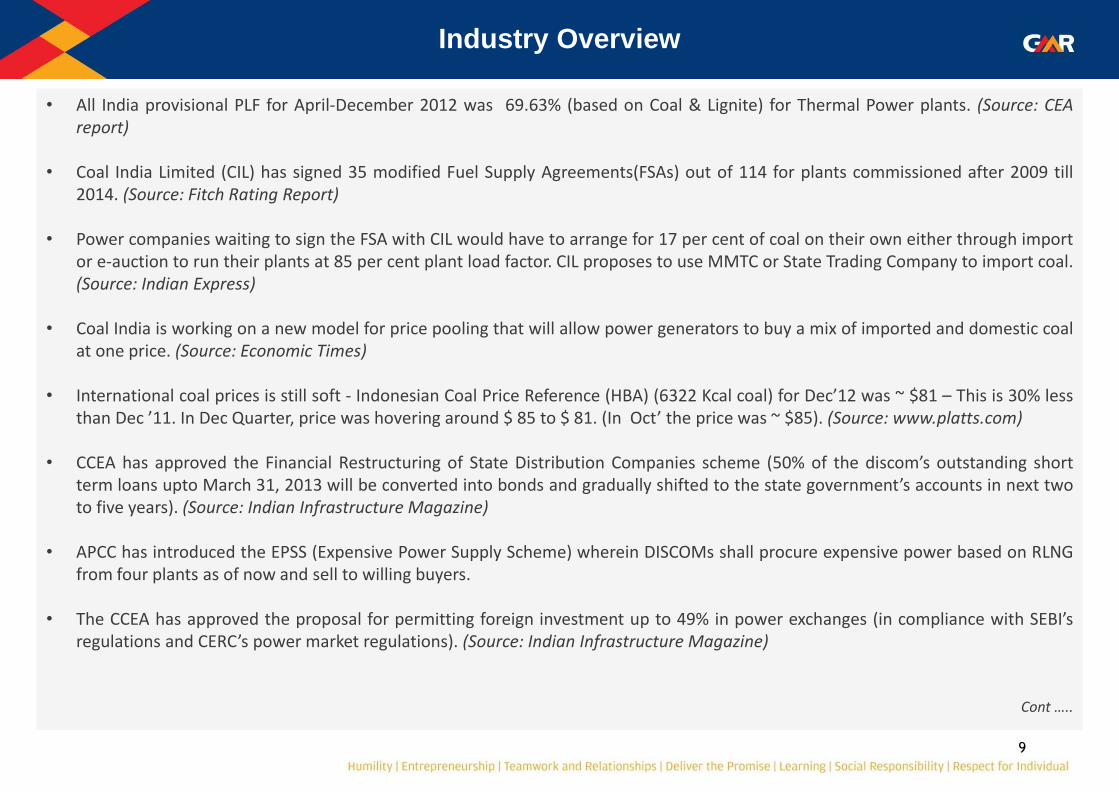
• All India provisional PLF for April-December 2012 was 69.63% (based on Coal & Lignite) for Thermal Power plants. (Source: CEA report)
• Coal India Limited (CIL) has signed 35 modified Fuel Supply Agreements(FSAs) out of 114 for plants commissioned after 2009 till
2014. (Source: Fitch Rating Report)
• Power companies waiting to sign the FSA with CIL would have to arrange for 17 per cent of coal on their own either through import or e-auction to run their plants at 85 per cent plant load factor. CIL proposes to use MMTC or State Trading Company to import coal. (Source: Indian Express)
• Coal India is working on a new model for price pooling that will allow power generators to buy a mix of imported and domestic coal at one price. (Source: Economic Times)
• International coal prices is still soft - Indonesian Coal Price Reference (HBA) (6322 Kcal coal) for Dec’12 was ~ $81 – This is 30% less than Dec ’11. In Dec Quarter, price was hovering around $ 85 to $ 81. (In Oct’ the price was ~ $85). (Source: www.platts.com)
• CCEA has approved the Financial Restructuring of State Distribution Companies scheme (50% of the discom’s outstanding short
term loans upto March 31, 2013 will be converted into bonds and gradually shifted to the state government’s accounts in next two to five years). (Source: Indian Infrastructure Magazine)
• APCC has introduced the EPSS (Expensive Power Supply Scheme) wherein DISCOMs shall procure expensive power based on RLNG from four plants as of now and sell to willing buyers.
• The CCEA has approved the proposal for permitting foreign investment up to 49% in power exchanges (in compliance with SEBI’s regulations and CERC’s power market regulations). (Source: Indian Infrastructure Magazine)
Cont …..

10
Industry Overview
• Market signal is mixed on power tariff with power companies quoting higher tariff in some states and lower than expectation in others. (Source: Fitch Rating Report)
• Rangarajan committee report has been submitted to the Government. The key recommendations of the report on gas price are: a) Gas prices to be determined prospectively based on weighted average price of gas prices in North America, Europe and Asia. It
will also take into account the short and long term LNG rates prevailing in the market. Hence for December 2012, the gas price could be US$8.1/mmbtu.
b) Gas prices to be revised every month. c) Premature to completely re-align prices with market. But the gas price may be gradually de-regulated after 5 years. (Source:
Ambit Capital)
• The Central Electricity Regulatory Commission (CERC) has admitted Adani Power’s petition to adjudicate its dispute with utilities from Gujarat and Haryana over their power purchase agreement (PPA). In its petition, Adani Power, a subsidiary of Adani Enterprises, raises several issues relating to the effect of Indonesian Regulations on its obligations to supply power at the rate discovered through the competitive bidding process and deviations in the fuel supply agreement (FSA) signed with Coal India. A similar petition has been filed by Tata Power. (Source: Business Standard)

11
Industry Overview
Highways
• After a three-month break, the government has set the ball rolling for giving out Rs 14,000-crore worth of national highway projects. All these projects are government- funded without any private funding, as it will boost the order book of construction companies. These projects would be taken up under the new Engineering, Procurement and Construction (EPC) model, put in place in August. According to roads ministry, NHAI will preside over 2,800 km of these projects, while the ministry will take care of the rest. (Source: Business Standard)
• Prime Minister has moved a proposal that will lead to classifying loans given by banks and financial institutions to road projects as secured debt. The objective is to reduce the cost of funds for the projects and also encourage banks to take larger exposures in road projects. (Source: Financial Chronicle)
• Only 4 out of 48 highway projects awarded in FY12 have achieved appointed date due on pending financial closure and environment clearance hurdles. (Source: Kotak Infrastructure Report)
• 35% of highway projects awarded in FY2011 have shown little or no progress. (Source: Kotak Infrastructure Report) • Out of an estimated target of 10,615 kms of Toll and Annuity projects amounting to Rs. 987 bn for FY13, NHAI has awarded only 923
kms till December 2012.
Month Target Length (km) Projects Awarded (km)
Apr-12 264 99
May-12 1,223 190
Jun-12 260 151
Jul-12 1,098 165
Aug-12 1,798 -
Sep-12 1,109 -
Oct-12 1,309 77
Month Total Length (km) Projects Awarded (km)
Nov-12 1,428 241 Dec-12 195 -
Jan-13 872 - Feb-13 352 - Mar-13 707 -
Grand Total 10,615 923
12
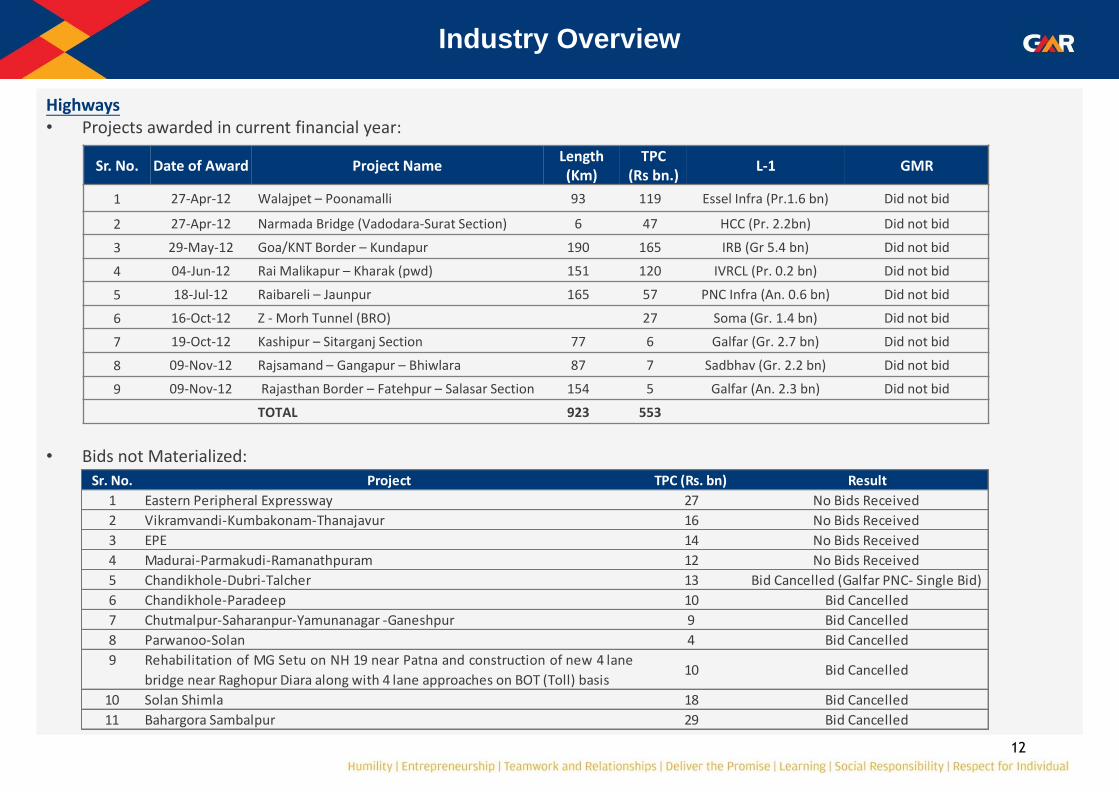
Highways • Projects awarded in current financial year:
• Bids not Materialized:
Industry Overview
Sr. No. Date of Award Project Name Length (Km)
TPC (Rs bn.)
L-1 GMR
1 27-Apr-12 Walajpet – Poonamalli 93 119 Essel Infra (Pr.1.6 bn) Did not bid
2 27-Apr-12 Narmada Bridge (Vadodara-Surat Section) 6 47 HCC (Pr. 2.2bn) Did not bid
3 29-May-12 Goa/KNT Border – Kundapur 190 165 IRB (Gr 5.4 bn) Did not bid
4 04-Jun-12 Rai Malikapur – Kharak (pwd) 151 120 IVRCL (Pr. 0.2 bn) Did not bid
5 18-Jul-12 Raibareli – Jaunpur 165 57 PNC Infra (An. 0.6 bn) Did not bid
6 16-Oct-12 Z - Morh Tunnel (BRO) 27 Soma (Gr. 1.4 bn) Did not bid
7 19-Oct-12 Kashipur – Sitarganj Section 77 6 Galfar (Gr. 2.7 bn) Did not bid
8 09-Nov-12 Rajsamand – Gangapur – Bhiwlara 87 7 Sadbhav (Gr. 2.2 bn) Did not bid
9 09-Nov-12 Rajasthan Border – Fatehpur – Salasar Section 154 5 Galfar (An. 2.3 bn) Did not bid
TOTAL 923 553
Sr. No. Project TPC (Rs. bn) Result
1 Eastern Peripheral Expressway 27 No Bids Received
2 Vikramvandi-Kumbakonam-Thanajavur 16 No Bids Received
3 EPE 14 No Bids Received
4 Madurai-Parmakudi-Ramanathpuram 12 No Bids Received
5 Chandikhole-Dubri-Talcher 13 Bid Cancelled (Galfar PNC- Single Bid)
6 Chandikhole-Paradeep 10 Bid Cancelled
7 Chutmalpur-Saharanpur-Yamunanagar -Ganeshpur 9 Bid Cancelled
8 Parwanoo-Solan 4 Bid Cancelled
9 Rehabilitation of MG Setu on NH 19 near Patna and construction of new 4 lane
bridge near Raghopur Diara along with 4 lane approaches on BOT (Toll) basis10 Bid Cancelled
10 Solan Shimla 18 Bid Cancelled
11 Bahargora Sambalpur 29 Bid Cancelled

Airports Sector
14
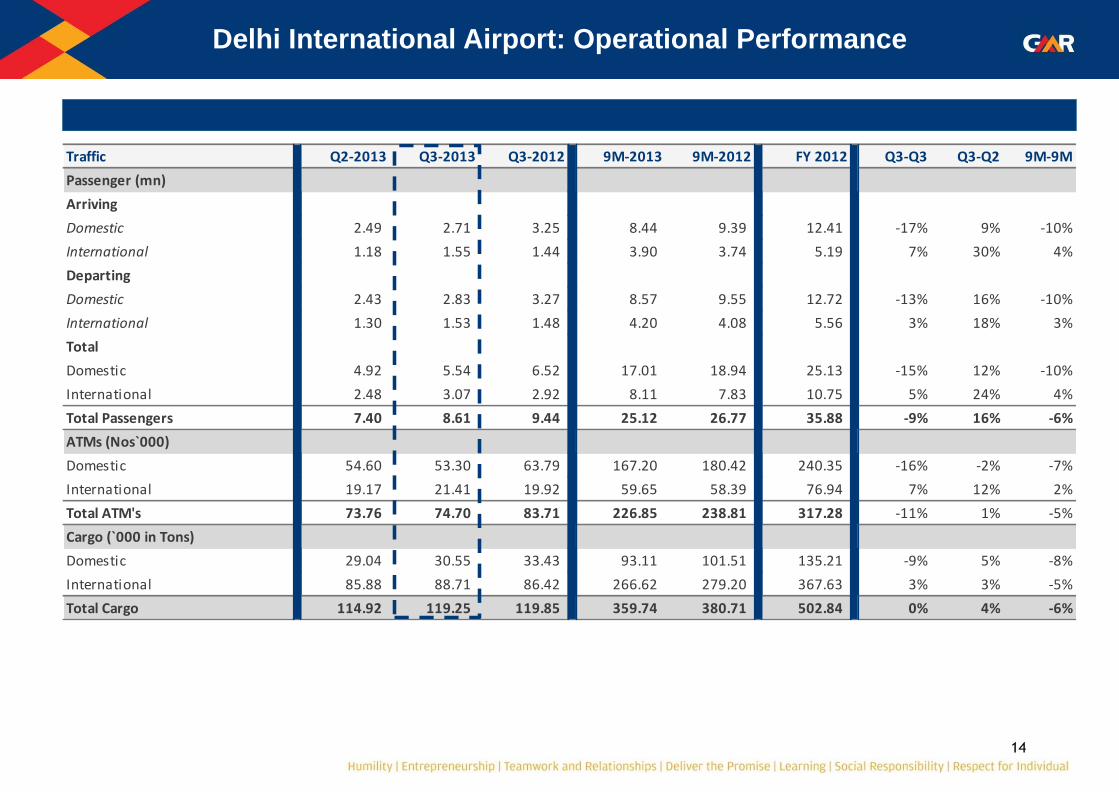
Delhi International Airport: Operational Performance
Traffic Q2-2013 Q3-2013 Q3-2012 9M-2013 9M-2012 FY 2012 Q3-Q3 Q3-Q2 9M-9M
Passenger (mn)
Arriving
Domestic 2.49 2.71 3.25 8.44 9.39 12.41 -17% 9% -10%
International 1.18 1.55 1.44 3.90 3.74 5.19 7% 30% 4%
Departing
Domestic 2.43 2.83 3.27 8.57 9.55 12.72 -13% 16% -10%
International 1.30 1.53 1.48 4.20 4.08 5.56 3% 18% 3%
Total
Domestic 4.92 5.54 6.52 17.01 18.94 25.13 -15% 12% -10%
International 2.48 3.07 2.92 8.11 7.83 10.75 5% 24% 4%
Total Passengers 7.40 8.61 9.44 25.12 26.77 35.88 -9% 16% -6%
ATMs (Nos`000)
Domestic 54.60 53.30 63.79 167.20 180.42 240.35 -16% -2% -7%
International 19.17 21.41 19.92 59.65 58.39 76.94 7% 12% 2%
Total ATM's 73.76 74.70 83.71 226.85 238.81 317.28 -11% 1% -5%
Cargo (`000 in Tons)
Domestic 29.04 30.55 33.43 93.11 101.51 135.21 -9% 5% -8%
International 85.88 88.71 86.42 266.62 279.20 367.63 3% 3% -5%
Total Cargo 114.92 119.25 119.85 359.74 380.71 502.84 0% 4% -6%
15
Rs. mn
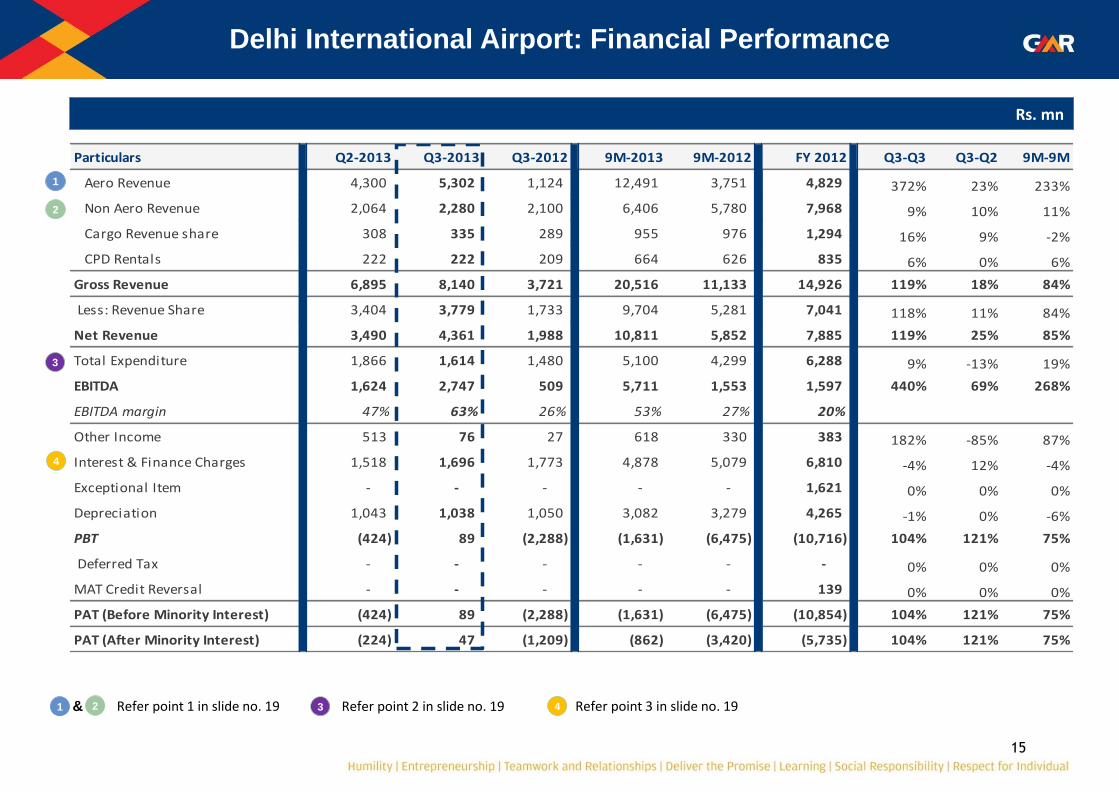
Delhi International Airport: Financial Performance
1
2
1 2 & Refer point 1 in slide no. 19
Particulars Q2-2013 Q3-2013 Q3-2012 9M-2013 9M-2012 FY 2012 Q3-Q3 Q3-Q2 9M-9M
Aero Revenue 4,300 5,302 1,124 12,491 3,751 4,829 372% 23% 233%
Non Aero Revenue 2,064 2,280 2,100 6,406 5,780 7,968 9% 10% 11%
Cargo Revenue share 308 335 289 955 976 1,294 16% 9% -2%
CPD Rentals 222 222 209 664 626 835 6% 0% 6%
Gross Revenue 6,895 8,140 3,721 20,516 11,133 14,926 119% 18% 84%
Less: Revenue Share 3,404 3,779 1,733 9,704 5,281 7,041 118% 11% 84%
Net Revenue 3,490 4,361 1,988 10,811 5,852 7,885 119% 25% 85%
Total Expenditure 1,866 1,614 1,480 5,100 4,299 6,288 9% -13% 19%
EBITDA 1,624 2,747 509 5,711 1,553 1,597 440% 69% 268%
EBITDA margin 47% 63% 26% 53% 27% 20%
Other Income 513 76 27 618 330 383 182% -85% 87%
Interest & Finance Charges 1,518 1,696 1,773 4,878 5,079 6,810 -4% 12% -4%
Exceptional Item - - - - - 1,621 0% 0% 0%
Depreciation 1,043 1,038 1,050 3,082 3,279 4,265 -1% 0% -6%
PBT (424) 89 (2,288) (1,631) (6,475) (10,716) 104% 121% 75%
Deferred Tax - - - - - - 0% 0% 0%
MAT Credit Reversal - - - - - 139 0% 0% 0%
PAT (Before Minority Interest) (424) 89 (2,288) (1,631) (6,475) (10,854) 104% 121% 75%
PAT (After Minority Interest) (224) 47 (1,209) (862) (3,420) (5,735) 104% 121% 75%
4
Refer point 2 in slide no. 19 3 4 Refer point 3 in slide no. 19
3
16
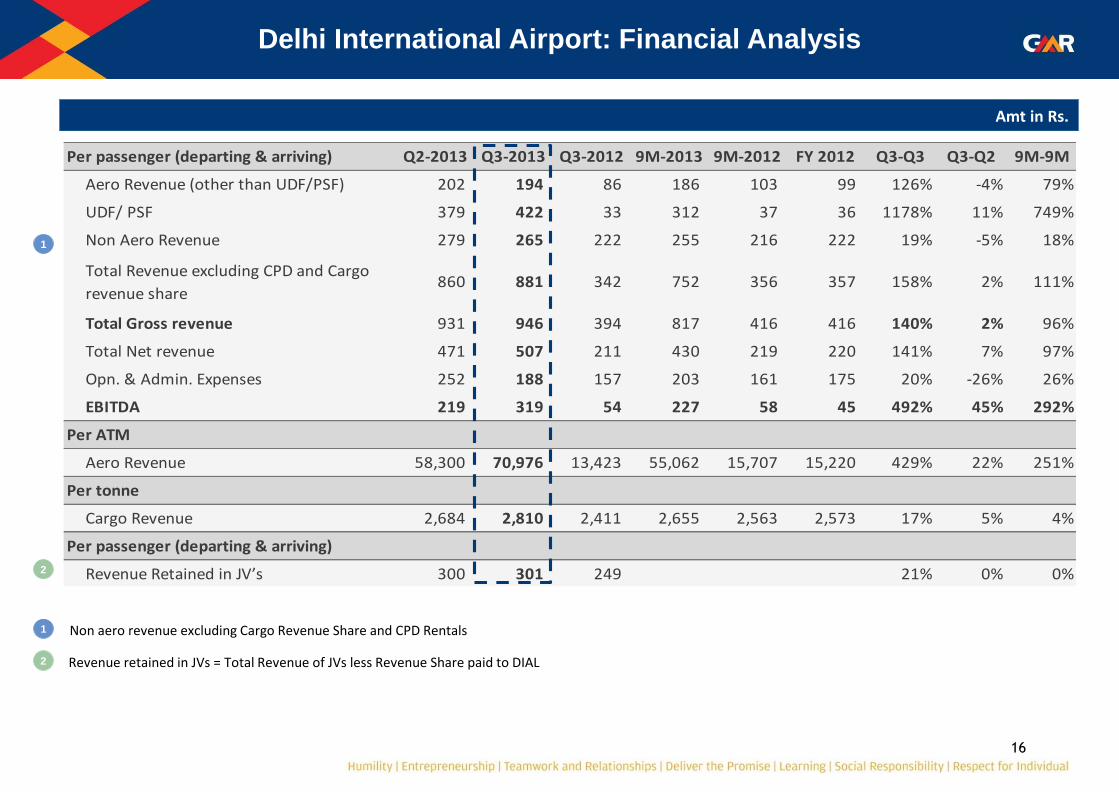
Delhi International Airport: Financial Analysis
Amt in Rs.
Non aero revenue excluding Cargo Revenue Share and CPD Rentals
1
1
Revenue retained in JVs = Total Revenue of JVs less Revenue Share paid to DIAL 2
2
Per passenger (departing & arriving) Q2-2013 Q3-2013 Q3-2012 9M-2013 9M-2012 FY 2012 Q3-Q3 Q3-Q2 9M-9M
Aero Revenue (other than UDF/PSF) 202 194 86 186 103 99 126% -4% 79%
UDF/ PSF 379 422 33 312 37 36 1178% 11% 749%
Non Aero Revenue 279 265 222 255 216 222 19% -5% 18%
Total Revenue excluding CPD and Cargo
revenue share860 881 342 752 356 357 158% 2% 111%
Total Gross revenue 931 946 394 817 416 416 140% 2% 96%
Total Net revenue 471 507 211 430 219 220 141% 7% 97%
Opn. & Admin. Expenses 252 188 157 203 161 175 20% -26% 26%
EBITDA 219 319 54 227 58 45 492% 45% 292%
Per ATM
Aero Revenue 58,300 70,976 13,423 55,062 15,707 15,220 429% 22% 251%
Per tonne
Cargo Revenue 2,684 2,810 2,411 2,655 2,563 2,573 17% 5% 4%
Per passenger (departing & arriving)
Revenue Retained in JV’s 300 301 249 21% 0% 0%
17
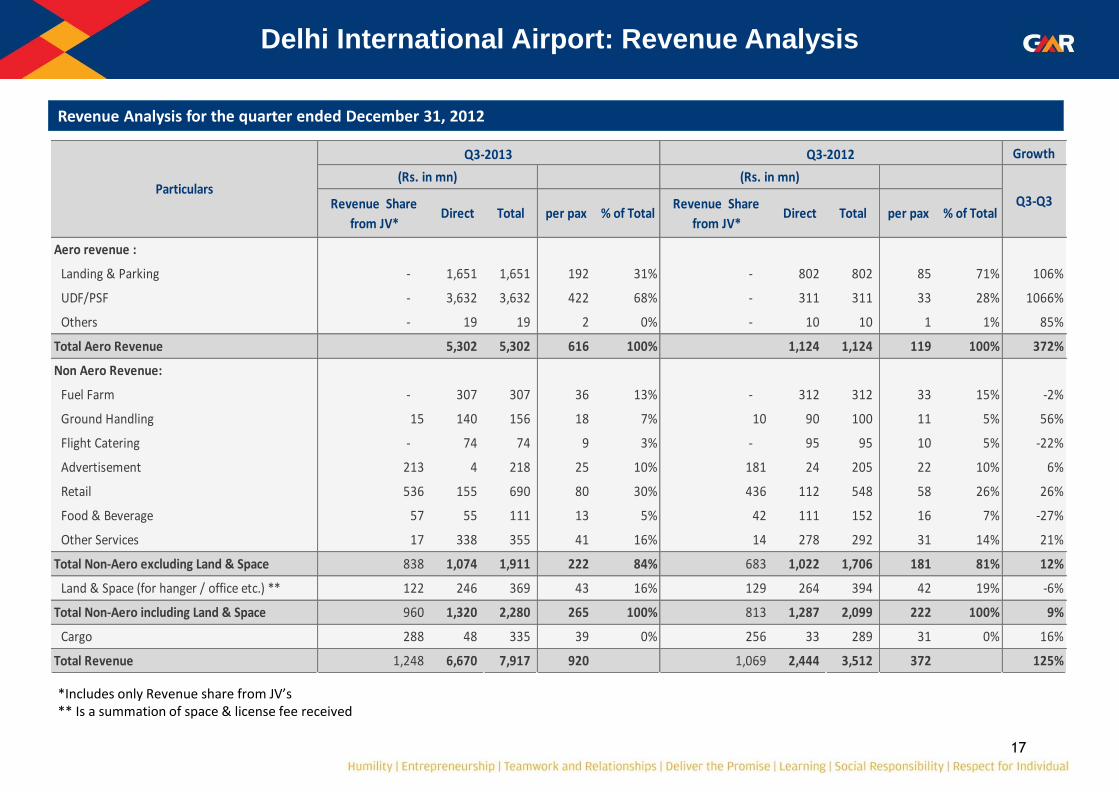
Revenue Analysis for the quarter ended December 31, 2012
Delhi International Airport: Revenue Analysis
*Includes only Revenue share from JV’s ** Is a summation of space & license fee received
Growth
Revenue Share
from JV*Direct Total per pax % of Total
Revenue Share
from JV*Direct Total per pax % of Total
Aero revenue :
Landing & Parking - 1,651 1,651 192 31% - 802 802 85 71% 106%
UDF/PSF - 3,632 3,632 422 68% - 311 311 33 28% 1066%
Others - 19 19 2 0% - 10 10 1 1% 85%
Total Aero Revenue 5,302 5,302 616 100% 1,124 1,124 119 100% 372%
Non Aero Revenue:
Fuel Farm - 307 307 36 13% - 312 312 33 15% -2%
Ground Handling 15 140 156 18 7% 10 90 100 11 5% 56%
Flight Catering - 74 74 9 3% - 95 95 10 5% -22%
Advertisement 213 4 218 25 10% 181 24 205 22 10% 6%
Retail 536 155 690 80 30% 436 112 548 58 26% 26%
Food & Beverage 57 55 111 13 5% 42 111 152 16 7% -27%
Other Services 17 338 355 41 16% 14 278 292 31 14% 21%
Total Non-Aero excluding Land & Space 838 1,074 1,911 222 84% 683 1,022 1,706 181 81% 12%
Land & Space (for hanger / office etc.) ** 122 246 369 43 16% 129 264 394 42 19% -6%
Total Non-Aero including Land & Space 960 1,320 2,280 265 100% 813 1,287 2,099 222 100% 9%
Cargo 288 48 335 39 0% 256 33 289 31 0% 16%
Total Revenue 1,248 6,670 7,917 920 1,069 2,444 3,512 372 125%
Q3-Q3Particulars
Q3-2013 Q3-2012
(Rs. in mn) (Rs. in mn)
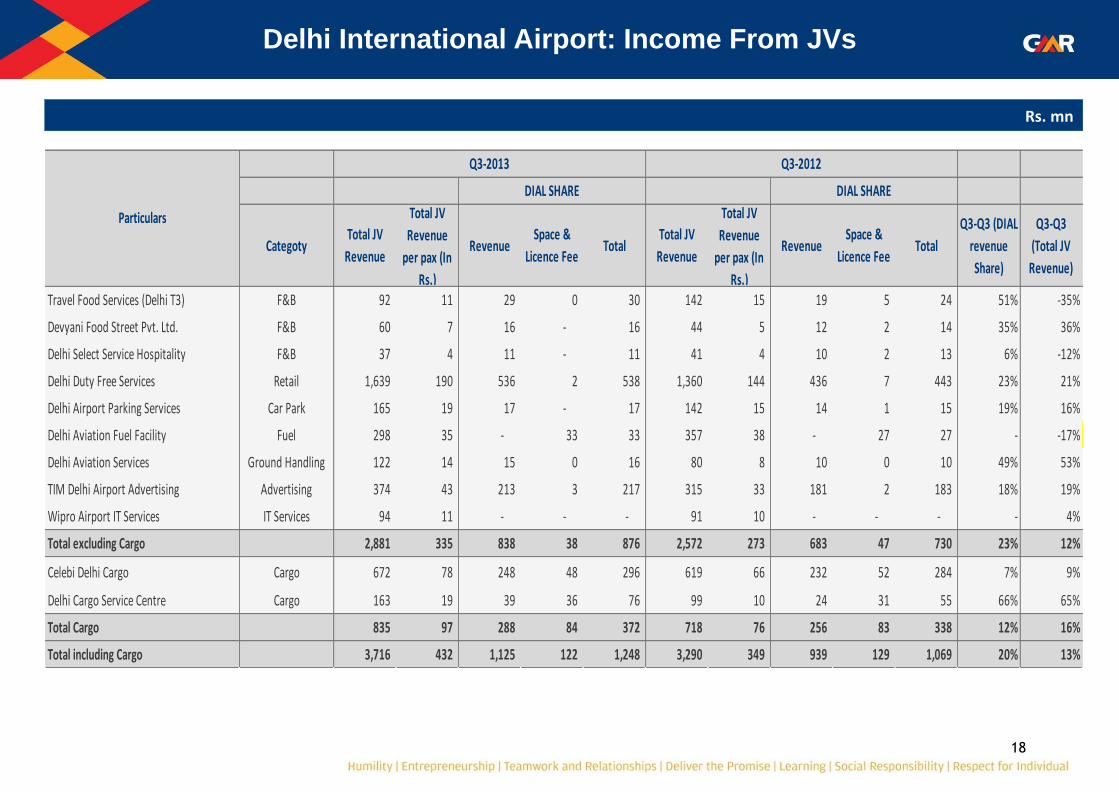
18
Delhi International Airport: Income From JVs
Rs. mn
CategotyTotal JV
Revenue
Total JV
Revenue
per pax (In
Rs.)
Revenue Space &
Licence FeeTotal
Total JV
Revenue
Total JV
Revenue
per pax (In
Rs.)
Revenue Space &
Licence FeeTotal
Q3-Q3 (DIAL
revenue
Share)
Q3-Q3
(Total JV
Revenue)
Travel Food Services (Delhi T3) F&B 92 11 29 0 30 142 15 19 5 24 51% -35%
Devyani Food Street Pvt. Ltd. F&B 60 7 16 - 16 44 5 12 2 14 35% 36%
Delhi Select Service Hospitality F&B 37 4 11 - 11 41 4 10 2 13 6% -12%
Delhi Duty Free Services Retail 1,639 190 536 2 538 1,360 144 436 7 443 23% 21%
Delhi Airport Parking Services Car Park 165 19 17 - 17 142 15 14 1 15 19% 16%
Delhi Aviation Fuel Facility Fuel 298 35 - 33 33 357 38 - 27 27 - -17%
Delhi Aviation Services Ground Handling 122 14 15 0 16 80 8 10 0 10 49% 53%
TIM Delhi Airport Advertising Advertising 374 43 213 3 217 315 33 181 2 183 18% 19%
Wipro Airport IT Services IT Services 94 11 - - - 91 10 - - - - 4%
Total excluding Cargo 2,881 335 838 38 876 2,572 273 683 47 730 23% 12%
Celebi Delhi Cargo Cargo 672 78 248 48 296 619 66 232 52 284 7% 9%
Delhi Cargo Service Centre Cargo 163 19 39 36 76 99 10 24 31 55 66% 65%
Total Cargo 835 97 288 84 372 718 76 256 83 338 12% 16%
Total including Cargo 3,716 432 1,125 122 1,248 3,290 349 939 129 1,069 20% 13%
Particulars
Q3-2013 Q3-2012
DIAL SHARE DIAL SHARE
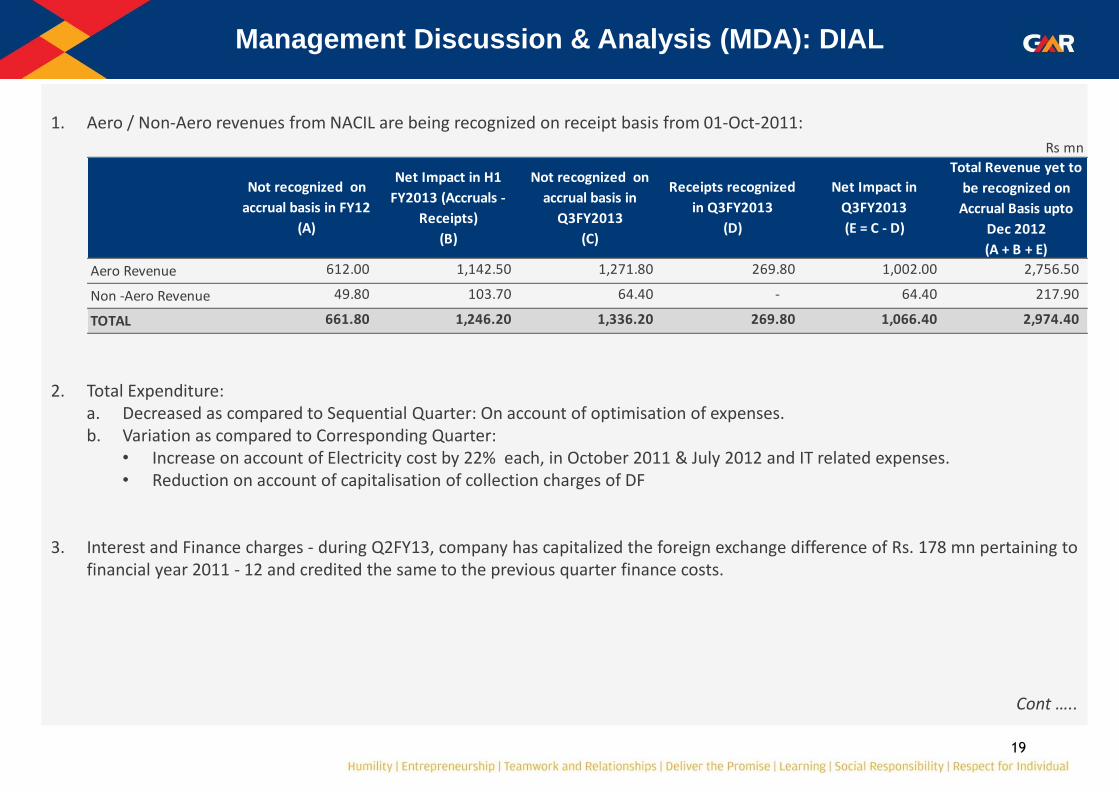
19
1. Aero / Non-Aero revenues from NACIL are being recognized on receipt basis from 01-Oct-2011:
2. Total Expenditure: a. Decreased as compared to Sequential Quarter: On account of optimisation of expenses. b. Variation as compared to Corresponding Quarter:
• Increase on account of Electricity cost by 22% each, in October 2011 & July 2012 and IT related expenses. • Reduction on account of capitalisation of collection charges of DF
3. Interest and Finance charges - during Q2FY13, company has capitalized the foreign exchange difference of Rs. 178 mn pertaining to financial year 2011 - 12 and credited the same to the previous quarter finance costs.
Cont …..
Management Discussion & Analysis (MDA): DIAL
Aero Revenue 612.00 1,142.50 1,271.80 269.80 1,002.00 2,756.50
Non -Aero Revenue 49.80 103.70 64.40 - 64.40 217.90
TOTAL 661.80 1,246.20 1,336.20 269.80 1,066.40 2,974.40
Not recognized on
accrual basis in
Q3FY2013
(C)
Rs mn
Net Impact in
Q3FY2013
(E = C - D)
Total Revenue yet to
be recognized on
Accrual Basis upto
Dec 2012
(A + B + E)
Net Impact in H1
FY2013 (Accruals -
Receipts)
(B)
Receipts recognized
in Q3FY2013
(D)
Not recognized on
accrual basis in FY12
(A)
20
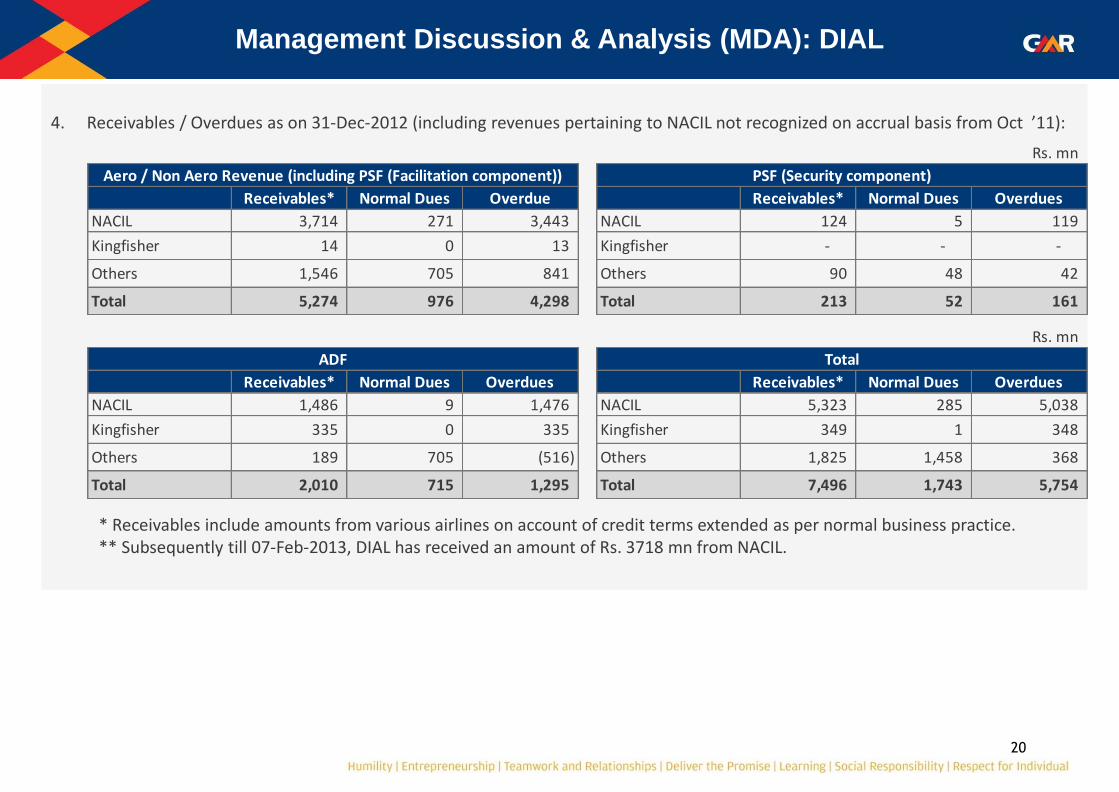
4. Receivables / Overdues as on 31-Dec-2012 (including revenues pertaining to NACIL not recognized on accrual basis from Oct ’11):
* Receivables include amounts from various airlines on account of credit terms extended as per normal business practice. ** Subsequently till 07-Feb-2013, DIAL has received an amount of Rs. 3718 mn from NACIL.
Management Discussion & Analysis (MDA): DIAL
Receivables* Normal Dues Overdue Receivables* Normal Dues Overdues
NACIL 3,714 271 3,443 NACIL 124 5 119
Kingfisher 14 0 13 Kingfisher - - -
Others 1,546 705 841 Others 90 48 42
Total 5,274 976 4,298 Total 213 52 161
Rs. mn
PSF (Security component)Aero / Non Aero Revenue (including PSF (Facilitation component))
Receivables* Normal Dues Overdues Receivables* Normal Dues Overdues
NACIL 1,486 9 1,476 NACIL 5,323 285 5,038
Kingfisher 335 0 335 Kingfisher 349 1 348
Others 189 705 (516) Others 1,825 1,458 368
Total 2,010 715 1,295 Total 7,496 1,743 5,754
Rs. mn
ADF Total
21
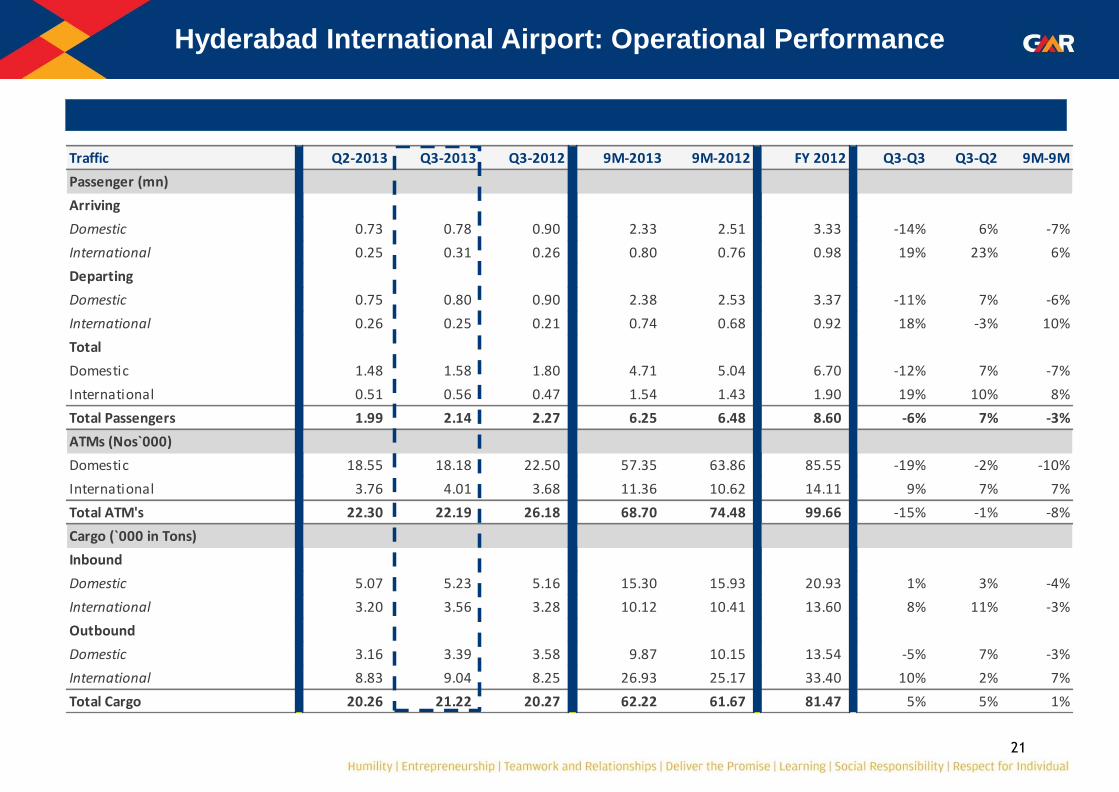
Hyderabad International Airport: Operational Performance
Traffic Q2-2013 Q3-2013 Q3-2012 9M-2013 9M-2012 FY 2012 Q3-Q3 Q3-Q2 9M-9M
Passenger (mn)
Arriving
Domestic 0.73 0.78 0.90 2.33 2.51 3.33 -14% 6% -7%
International 0.25 0.31 0.26 0.80 0.76 0.98 19% 23% 6%
Departing
Domestic 0.75 0.80 0.90 2.38 2.53 3.37 -11% 7% -6%
International 0.26 0.25 0.21 0.74 0.68 0.92 18% -3% 10%
Total
Domestic 1.48 1.58 1.80 4.71 5.04 6.70 -12% 7% -7%
International 0.51 0.56 0.47 1.54 1.43 1.90 19% 10% 8%
Total Passengers 1.99 2.14 2.27 6.25 6.48 8.60 -6% 7% -3%
ATMs (Nos`000)
Domestic 18.55 18.18 22.50 57.35 63.86 85.55 -19% -2% -10%
International 3.76 4.01 3.68 11.36 10.62 14.11 9% 7% 7%
Total ATM's 22.30 22.19 26.18 68.70 74.48 99.66 -15% -1% -8%
Cargo (`000 in Tons)
Inbound
Domestic 5.07 5.23 5.16 15.30 15.93 20.93 1% 3% -4%
International 3.20 3.56 3.28 10.12 10.41 13.60 8% 11% -3%
Outbound
Domestic 3.16 3.39 3.58 9.87 10.15 13.54 -5% 7% -3%
International 8.83 9.04 8.25 26.93 25.17 33.40 10% 2% 7%
Total Cargo 20.26 21.22 20.27 62.22 61.67 81.47 5% 5% 1%

22
Hyderabad International Airport: Financial Performance
Rs. mn
Q2-2013 Q3-2013 Q3-2012 9M-2013 9M-2012 FY 2012 Q3-Q3 Q3-Q2 9M-9M
Aero Revenue 816 819 809 2,532 2,687 3,503 1% 0% -6%
Non Aero Revenue 604 651 602 1,895 1,776 2,381 8% 8% 7%
Cargo Revenue Share 26 26 26 79 81 107 3% 3% -2%
Gross Revenue 1,445 1,496 1,437 4,506 4,543 5,991 4% 4% -1%
Less: Revenue Share 63 64 59 191 189 249 8% 0% 1%
Net Revenue 1,381 1,432 1,378 4,315 4,354 5,742 4% 4% -1%
Total Expenditure 507 554 493 1,530 1,536 2,168 12% 9% 0%
EBITDA 874 878 885 2,785 2,818 3,574 -1% 0% -1%
EBITDA margin 63% 61% 64% 65% 65% 62%
Other Income 138 92 52 278 206 256 79% -33% 35%
Interest & Finance Charges 482 516 551 1,532 1,651 2,177 -6% 7% -7%
Depreciation 326 317 299 953 899 1,205 6% -3% 6%
PBT 204 137 87 578 474 448 58% -33% 22%
Current Tax (47) - 17 - 95 90 -100% 100% -100%
Deferred Tax 42 66 37 190 216 191 78% 55% -12%
PAT (Before Minority Interest) 209 72 33 388 164 167 118% -66% 137%
PAT (After Minority Interest) 132 45 20 244 100 105 129% -66% 144%
1 Refer point 1 in slide no. 26
2
3
2 Refer point 1 & 2 in slide no. 26
4
Refer point 3 in slide no. 26 Refer point 4 in slide no. 26
1
3 4
23
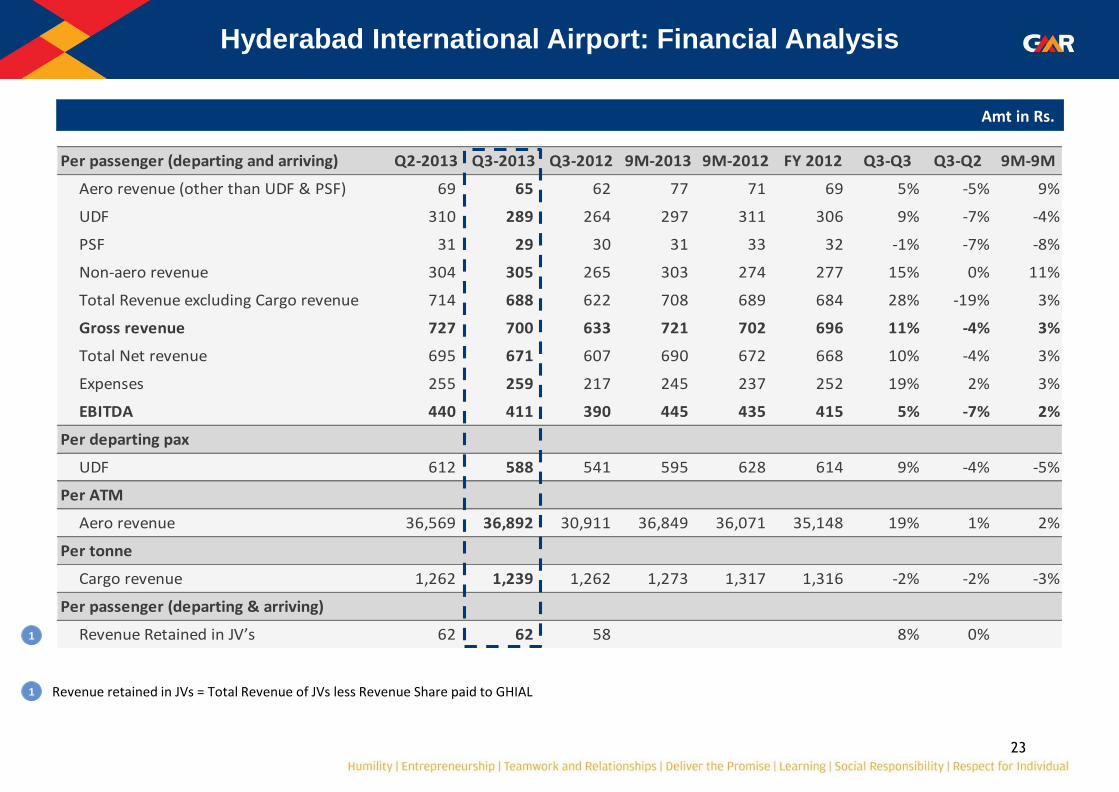
Hyderabad International Airport: Financial Analysis
Amt in Rs.
1
1 Revenue retained in JVs = Total Revenue of JVs less Revenue Share paid to GHIAL
Per passenger (departing and arriving) Q2-2013 Q3-2013 Q3-2012 9M-2013 9M-2012 FY 2012 Q3-Q3 Q3-Q2 9M-9M
Aero revenue (other than UDF & PSF) 69 65 62 77 71 69 5% -5% 9%
UDF 310 289 264 297 311 306 9% -7% -4%
PSF 31 29 30 31 33 32 -1% -7% -8%
Non-aero revenue 304 305 265 303 274 277 15% 0% 11%
Total Revenue excluding Cargo revenue 714 688 622 708 689 684 28% -19% 3%
Gross revenue 727 700 633 721 702 696 11% -4% 3%
Total Net revenue 695 671 607 690 672 668 10% -4% 3%
Expenses 255 259 217 245 237 252 19% 2% 3%
EBITDA 440 411 390 445 435 415 5% -7% 2%
Per departing pax
UDF 612 588 541 595 628 614 9% -4% -5%
Per ATM
Aero revenue 36,569 36,892 30,911 36,849 36,071 35,148 19% 1% 2%
Per tonne
Cargo revenue 1,262 1,239 1,262 1,273 1,317 1,316 -2% -2% -3%
Per passenger (departing & arriving)
Revenue Retained in JV’s 62 62 58 8% 0%

24
Hyderabad International Airport: Revenue Analysis
*Includes only Revenue share from JV’s ** Is a summation of space revenue received
Revenue Analysis for the quarter ended December 31, 2012
Growth
Revenue Share
from JV*Direct Total per pax % of total
Revenue Share
from JV*Direct Total per pax % of total
Aero revenue
Landing & Parking charges - 140 140 65 17% - 142 142 62 18% -1%
UDF - 616 616 289 75% - 600 600 264 74% 3%
PSF - 63 63 29 8% - 67 67 30 8% -7%
Total aero revenue 819 819 383 92% 809 809 356 100% 1%
Non Aero revenue:
Fuel Farm - 172 172 80 26% - 180 180 79 30% -5%
Ground Handling - 15 15 7 2% - 14 14 6 2% 4%
Flight Catering - 13 13 6 2% - 13 13 6 2% -4%
Retail - 186 186 87 29% - 115 115 51 19% 62%
Common Infra Charges - 58 58 27 9% - 60 60 26 10% -3%
Advertisement 58 - 58 27 9% 52 28 80 35 13% -28%
Misc & other Income - 38 38 18 6% - 34 34 15 6% 13%
Total Non-Aero excluding Land & Space 58 482 540 253 83% 52 445 497 219 82% 9%
Land & Space ** 14 97 111 52 17% 15 91 106 47 18% 5%
Total Non-Aero including Land & Space 72 578 651 305 100% 67 536 603 265 100% 8%
Cargo 26 - 26 12 100% 26 (0) 25 11 100% 3%
Total JV Revene Share 99 1,397 1,496 700 92 1,345 1,437 633 4%
Q3-Q3Particulars
Q3-2013 Q3-2012
Rs. In mn Rs. in mn

25
Hyderabad International Airport: Income From JVs
Rs. mn
CategoryTotal JV
Revenue
Total JV
Revenue
per pax (In
Rs.)
Revenue Space Total Total JV
Revenue
Total JV
Revenue
per pax (In
Rs.)
Revenue Space Total
Q3-Q3
(GHIAL
revenue
Share)
Q3-Q3
(Total JV
Revenue)
HMACPL Cargo 151 70 26 14 41 135 60 26 15 40 3% 11%
Laqushya Media Advertisement 66 31 58 - 58 73 32 52 0 52 12% -9%
Total 217 102 84 14 99 208 92 77 15 92 9% 4%
Particulars
Q3-2013 Q3-2012
GHIAL SHARE GHIAL SHARE
26
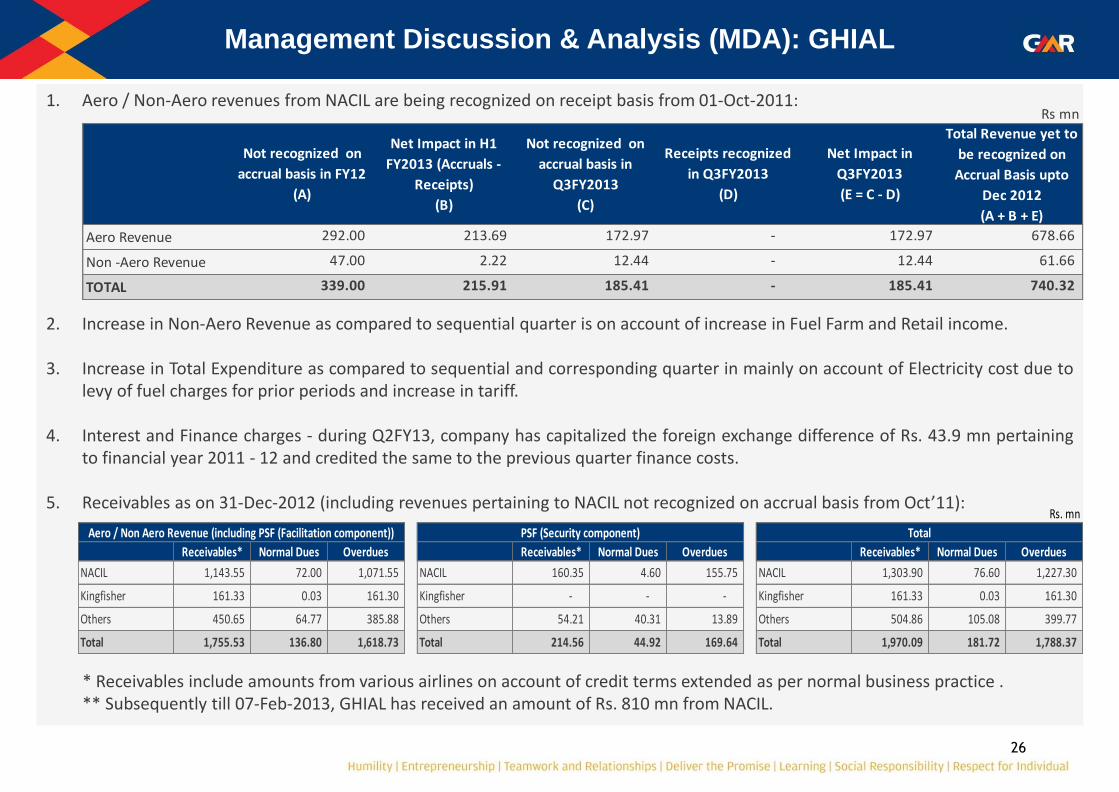
1. Aero / Non-Aero revenues from NACIL are being recognized on receipt basis from 01-Oct-2011:
2. Increase in Non-Aero Revenue as compared to sequential quarter is on account of increase in Fuel Farm and Retail income.
3. Increase in Total Expenditure as compared to sequential and corresponding quarter in mainly on account of Electricity cost due to levy of fuel charges for prior periods and increase in tariff.
4. Interest and Finance charges - during Q2FY13, company has capitalized the foreign exchange difference of Rs. 43.9 mn pertaining to financial year 2011 - 12 and credited the same to the previous quarter finance costs.
5. Receivables as on 31-Dec-2012 (including revenues pertaining to NACIL not recognized on accrual basis from Oct’11):
* Receivables include amounts from various airlines on account of credit terms extended as per normal business practice . ** Subsequently till 07-Feb-2013, GHIAL has received an amount of Rs. 810 mn from NACIL.
Management Discussion & Analysis (MDA): GHIAL
Receivables* Normal Dues Overdues Receivables* Normal Dues Overdues Receivables* Normal Dues Overdues
NACIL 1,143.55 72.00 1,071.55 NACIL 160.35 4.60 155.75 NACIL 1,303.90 76.60 1,227.30
Kingfisher 161.33 0.03 161.30 Kingfisher - - - Kingfisher 161.33 0.03 161.30
Others 450.65 64.77 385.88 Others 54.21 40.31 13.89 Others 504.86 105.08 399.77
Total 1,755.53 136.80 1,618.73 Total 214.56 44.92 169.64 Total 1,970.09 181.72 1,788.37
Aero / Non Aero Revenue (including PSF (Facilitation component)) PSF (Security component) Total
Rs. mn
Aero Revenue 292.00 213.69 172.97 - 172.97 678.66
Non -Aero Revenue 47.00 2.22 12.44 - 12.44 61.66
TOTAL 339.00 215.91 185.41 - 185.41 740.32
Rs mn
Not recognized on
accrual basis in FY12
(A)
Net Impact in H1
FY2013 (Accruals -
Receipts)
(B)
Not recognized on
accrual basis in
Q3FY2013
(C)
Receipts recognized
in Q3FY2013
(D)
Net Impact in
Q3FY2013
(E = C - D)
Total Revenue yet to
be recognized on
Accrual Basis upto
Dec 2012
(A + B + E)
27
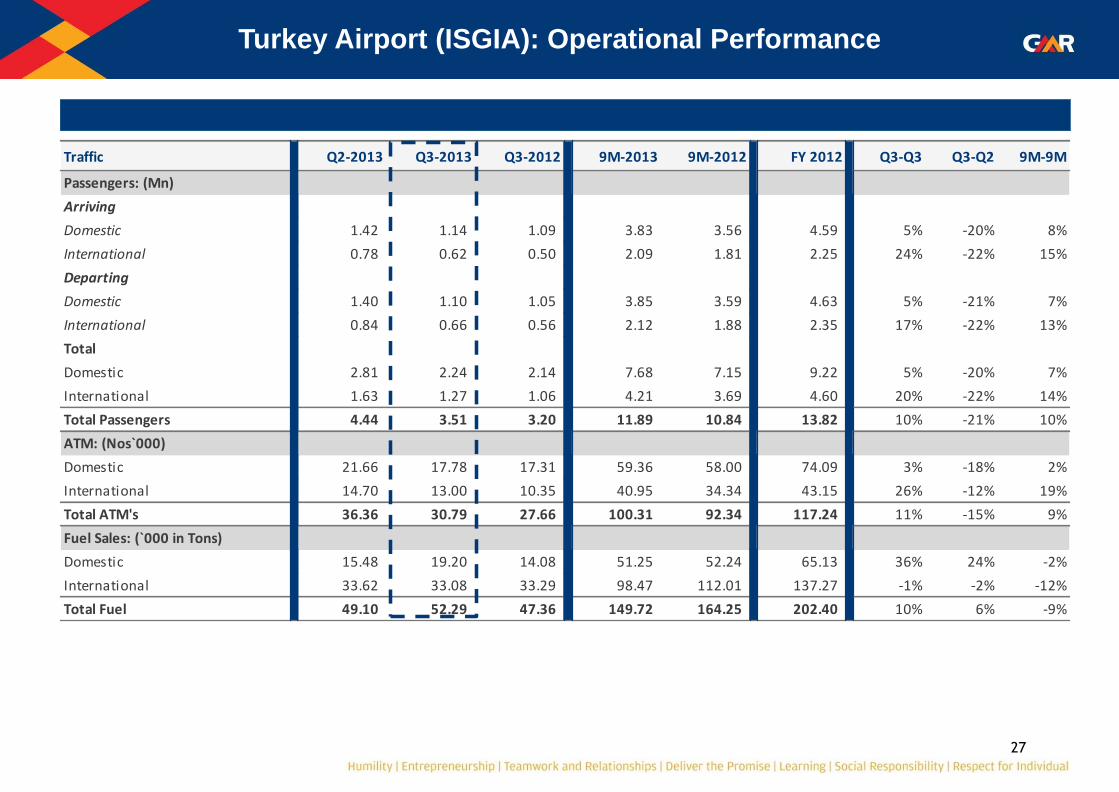
Turkey Airport (ISGIA): Operational Performance
Traffic Q2-2013 Q3-2013 Q3-2012 9M-2013 9M-2012 FY 2012 Q3-Q3 Q3-Q2 9M-9M
Passengers: (Mn)
Arriving
Domestic 1.42 1.14 1.09 3.83 3.56 4.59 5% -20% 8%
International 0.78 0.62 0.50 2.09 1.81 2.25 24% -22% 15%
Departing
Domestic 1.40 1.10 1.05 3.85 3.59 4.63 5% -21% 7%
International 0.84 0.66 0.56 2.12 1.88 2.35 17% -22% 13%
Total
Domestic 2.81 2.24 2.14 7.68 7.15 9.22 5% -20% 7%
International 1.63 1.27 1.06 4.21 3.69 4.60 20% -22% 14%
Total Passengers 4.44 3.51 3.20 11.89 10.84 13.82 10% -21% 10%
ATM: (Nos`000)
Domestic 21.66 17.78 17.31 59.36 58.00 74.09 3% -18% 2%
International 14.70 13.00 10.35 40.95 34.34 43.15 26% -12% 19%
Total ATM's 36.36 30.79 27.66 100.31 92.34 117.24 11% -15% 9%
Fuel Sales: (`000 in Tons)
Domestic 15.48 19.20 14.08 51.25 52.24 65.13 36% 24% -2%
International 33.62 33.08 33.29 98.47 112.01 137.27 -1% -2% -12%
Total Fuel 49.10 52.29 47.36 149.72 164.25 202.40 10% 6% -9%
28
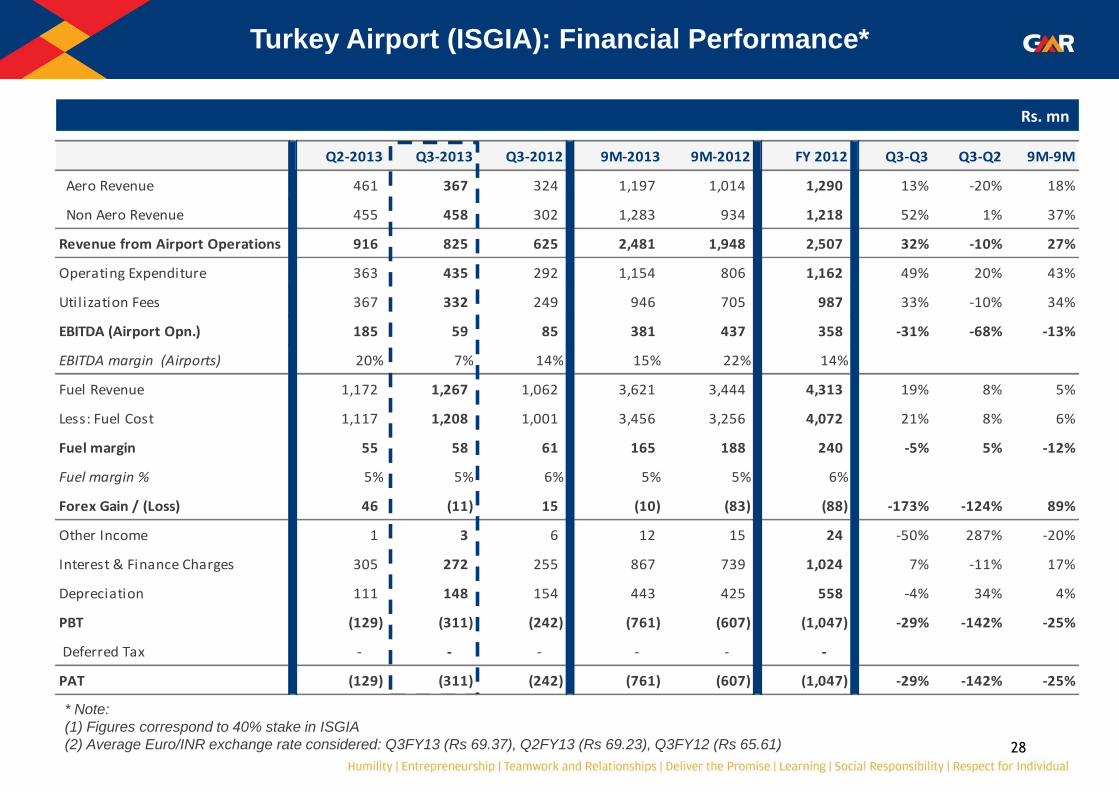
Turkey Airport (ISGIA): Financial Performance*
Rs. mn
Q2-2013 Q3-2013 Q3-2012 9M-2013 9M-2012 FY 2012 Q3-Q3 Q3-Q2 9M-9M
Aero Revenue 461 367 324 1,197 1,014 1,290 13% -20% 18%
Non Aero Revenue 455 458 302 1,283 934 1,218 52% 1% 37%
Revenue from Airport Operations 916 825 625 2,481 1,948 2,507 32% -10% 27%
Operating Expenditure 363 435 292 1,154 806 1,162 49% 20% 43%
Utilization Fees 367 332 249 946 705 987 33% -10% 34%
EBITDA (Airport Opn.) 185 59 85 381 437 358 -31% -68% -13%
EBITDA margin (Airports) 20% 7% 14% 15% 22% 14%
Fuel Revenue 1,172 1,267 1,062 3,621 3,444 4,313 19% 8% 5%
Less: Fuel Cost 1,117 1,208 1,001 3,456 3,256 4,072 21% 8% 6%
Fuel margin 55 58 61 165 188 240 -5% 5% -12%
Fuel margin % 5% 5% 6% 5% 5% 6%
Forex Gain / (Loss) 46 (11) 15 (10) (83) (88) -173% -124% 89%
Other Income 1 3 6 12 15 24 -50% 287% -20%
Interest & Finance Charges 305 272 255 867 739 1,024 7% -11% 17%
Depreciation 111 148 154 443 425 558 -4% 34% 4%
PBT (129) (311) (242) (761) (607) (1,047) -29% -142% -25%
Deferred Tax - - - - - -
PAT (129) (311) (242) (761) (607) (1,047) -29% -142% -25%
* Note:
(1) Figures correspond to 40% stake in ISGIA
(2) Average Euro/INR exchange rate considered: Q3FY13 (Rs 69.37), Q2FY13 (Rs 69.23), Q3FY12 (Rs 65.61)
29
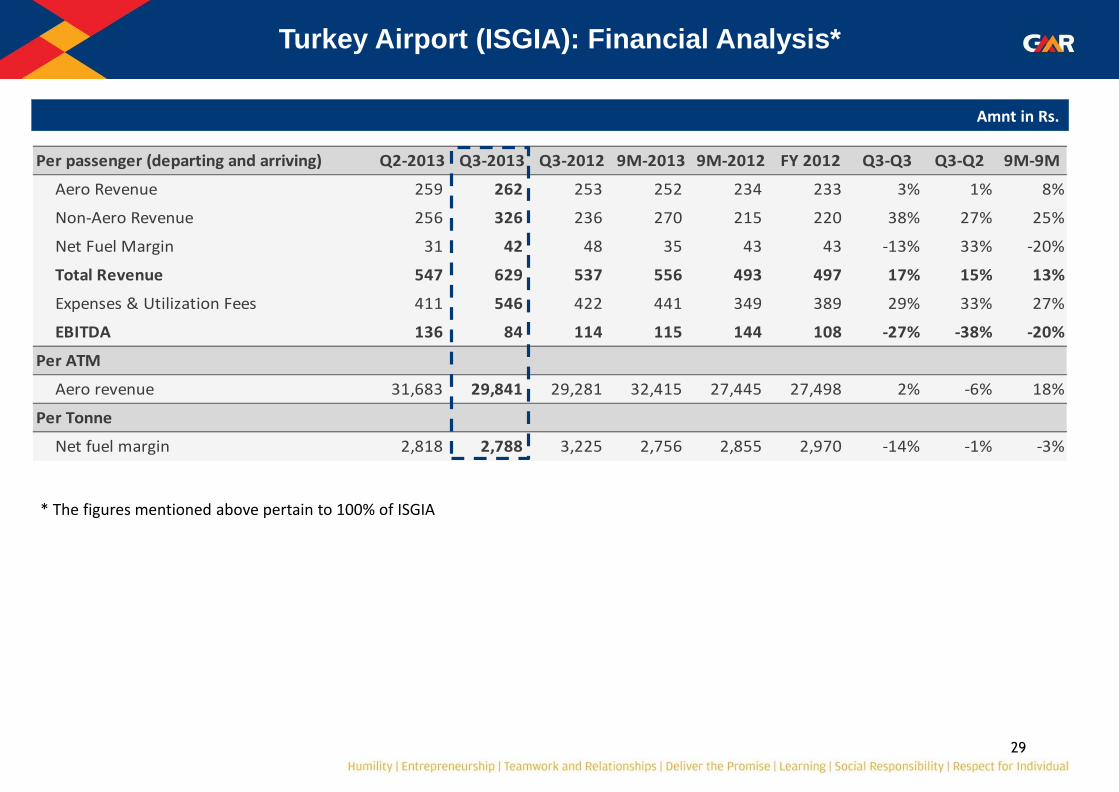
Turkey Airport (ISGIA): Financial Analysis*
* The figures mentioned above pertain to 100% of ISGIA
Amnt in Rs.
Per passenger (departing and arriving) Q2-2013 Q3-2013 Q3-2012 9M-2013 9M-2012 FY 2012 Q3-Q3 Q3-Q2 9M-9M
Aero Revenue 259 262 253 252 234 233 3% 1% 8%
Non-Aero Revenue 256 326 236 270 215 220 38% 27% 25%
Net Fuel Margin 31 42 48 35 43 43 -13% 33% -20%
Total Revenue 547 629 537 556 493 497 17% 15% 13%
Expenses & Utilization Fees 411 546 422 441 349 389 29% 33% 27%
EBITDA 136 84 114 115 144 108 -27% -38% -20%
Per ATM
Aero revenue 31,683 29,841 29,281 32,415 27,445 27,498 2% -6% 18%
Per Tonne
Net fuel margin 2,818 2,788 3,225 2,756 2,855 2,970 -14% -1% -3%

30
Q3-Q3
Rs. In mn per pax % of total Rs. in mn per pax % of total
Aero Revenue:**
PSF & Others 919 262 100% 810 253 100% 13%
Non-Aero Revenue:**
Car Park 103 29 9% 85 27 11% 21%
Rentals 172 49 15% 102 32 14% 69%
Duty Free 519 148 45% 336 105 45% 54%
F&B 103 29 9% 58 18 8% 77%
Others incl. Utilities 248 71 22% 173 54 23% 44%
Total non-aero 1,145 326 100% 754 236 100% 52%
Total 2,064 588 1,564 489 0% 32%
GMR Share * 825 235 625 196 32%
Particulars Q3-2013 Q3-2012
* Figures correspond to 40% stake in ISGIA
** Figures correspond to 100% stake in ISGIA
Turkey Airport (ISGIA): Revenue Analysis
Revenue Analysis for the quarter ended December 31, 2012
31
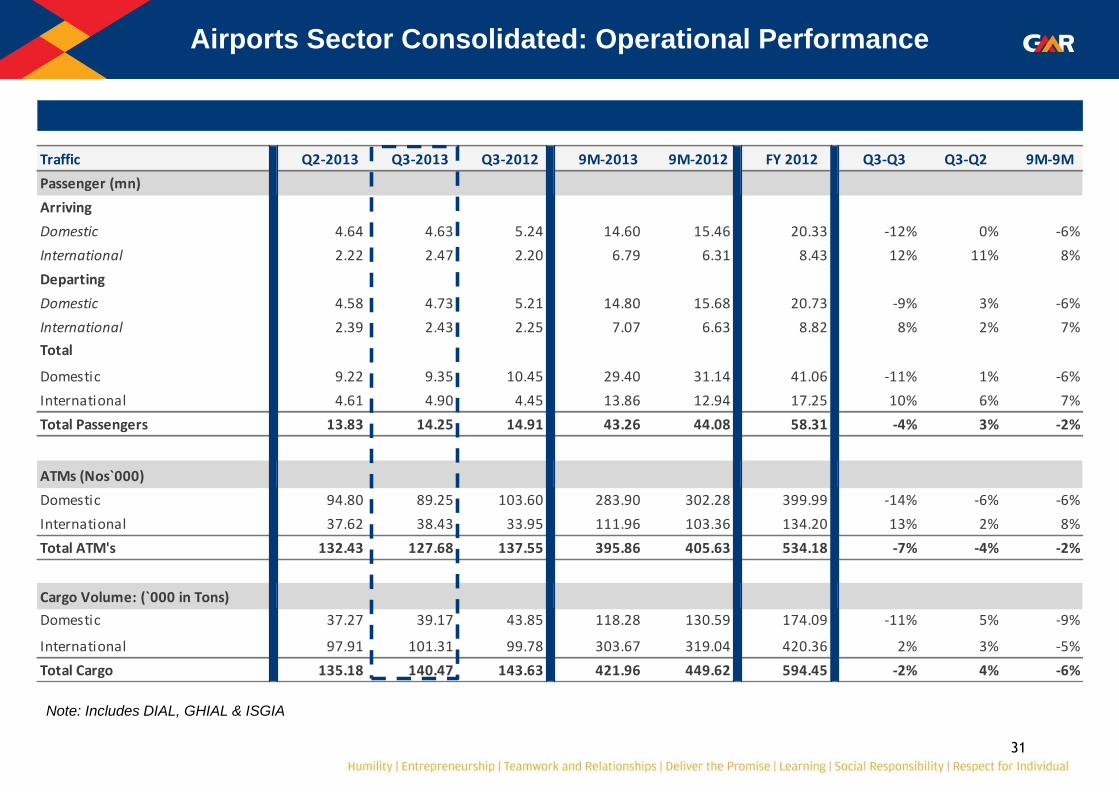
Airports Sector Consolidated: Operational Performance
Traffic Q2-2013 Q3-2013 Q3-2012 9M-2013 9M-2012 FY 2012 Q3-Q3 Q3-Q2 9M-9M
Passenger (mn)
Arriving
Domestic 4.64 4.63 5.24 14.60 15.46 20.33 -12% 0% -6%
International 2.22 2.47 2.20 6.79 6.31 8.43 12% 11% 8%
Departing
Domestic 4.58 4.73 5.21 14.80 15.68 20.73 -9% 3% -6%
International 2.39 2.43 2.25 7.07 6.63 8.82 8% 2% 7%
Total
Domestic 9.22 9.35 10.45 29.40 31.14 41.06 -11% 1% -6%
International 4.61 4.90 4.45 13.86 12.94 17.25 10% 6% 7%
Total Passengers 13.83 14.25 14.91 43.26 44.08 58.31 -4% 3% -2%
ATMs (Nos`000)
Domestic 94.80 89.25 103.60 283.90 302.28 399.99 -14% -6% -6%
International 37.62 38.43 33.95 111.96 103.36 134.20 13% 2% 8%
Total ATM's 132.43 127.68 137.55 395.86 405.63 534.18 -7% -4% -2%
Cargo Volume: (`000 in Tons)
Domestic 37.27 39.17 43.85 118.28 130.59 174.09 -11% 5% -9%
International 97.91 101.31 99.78 303.67 319.04 420.36 2% 3% -5%
Total Cargo 135.18 140.47 143.63 421.96 449.62 594.45 -2% 4% -6%
Note: Includes DIAL, GHIAL & ISGIA
32
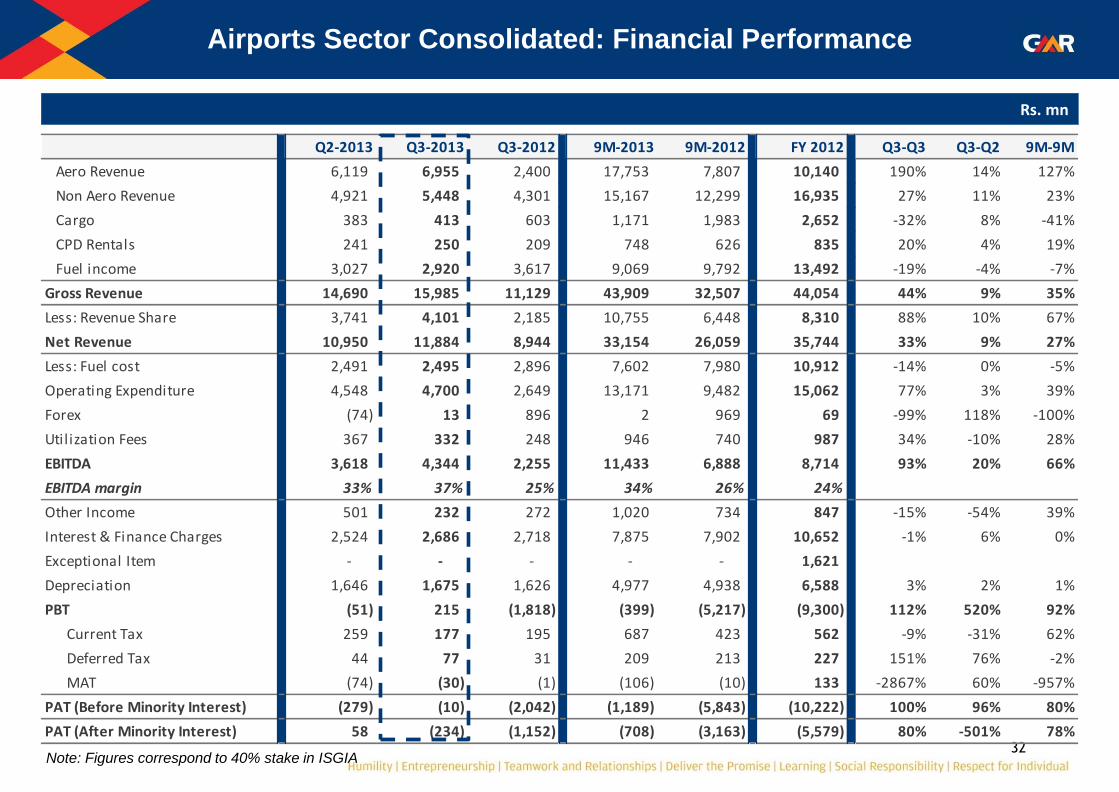
Airports Sector Consolidated: Financial Performance
Note: Figures correspond to 40% stake in ISGIA
Rs. mn
Q2-2013 Q3-2013 Q3-2012 9M-2013 9M-2012 FY 2012 Q3-Q3 Q3-Q2 9M-9M
Aero Revenue 6,119 6,955 2,400 17,753 7,807 10,140 190% 14% 127%
Non Aero Revenue 4,921 5,448 4,301 15,167 12,299 16,935 27% 11% 23%
Cargo 383 413 603 1,171 1,983 2,652 -32% 8% -41%
CPD Rentals 241 250 209 748 626 835 20% 4% 19%
Fuel income 3,027 2,920 3,617 9,069 9,792 13,492 -19% -4% -7%
Gross Revenue 14,690 15,985 11,129 43,909 32,507 44,054 44% 9% 35%
Less: Revenue Share 3,741 4,101 2,185 10,755 6,448 8,310 88% 10% 67%
Net Revenue 10,950 11,884 8,944 33,154 26,059 35,744 33% 9% 27%
Less: Fuel cost 2,491 2,495 2,896 7,602 7,980 10,912 -14% 0% -5%
Operating Expenditure 4,548 4,700 2,649 13,171 9,482 15,062 77% 3% 39%
Forex (74) 13 896 2 969 69 -99% 118% -100%
Utilization Fees 367 332 248 946 740 987 34% -10% 28%
EBITDA 3,618 4,344 2,255 11,433 6,888 8,714 93% 20% 66%
EBITDA margin 33% 37% 25% 34% 26% 24%
Other Income 501 232 272 1,020 734 847 -15% -54% 39%
Interest & Finance Charges 2,524 2,686 2,718 7,875 7,902 10,652 -1% 6% 0%
Exceptional Item - - - - - 1,621
Depreciation 1,646 1,675 1,626 4,977 4,938 6,588 3% 2% 1%
PBT (51) 215 (1,818) (399) (5,217) (9,300) 112% 520% 92%
Current Tax 259 177 195 687 423 562 -9% -31% 62%
Deferred Tax 44 77 31 209 213 227 151% 76% -2%
MAT (74) (30) (1) (106) (10) 133 -2867% 60% -957%
PAT (Before Minority Interest) (279) (10) (2,042) (1,189) (5,843) (10,222) 100% 96% 80%
PAT (After Minority Interest) 58 (234) (1,152) (708) (3,163) (5,579) 80% -501% 78%

Energy Sector
34
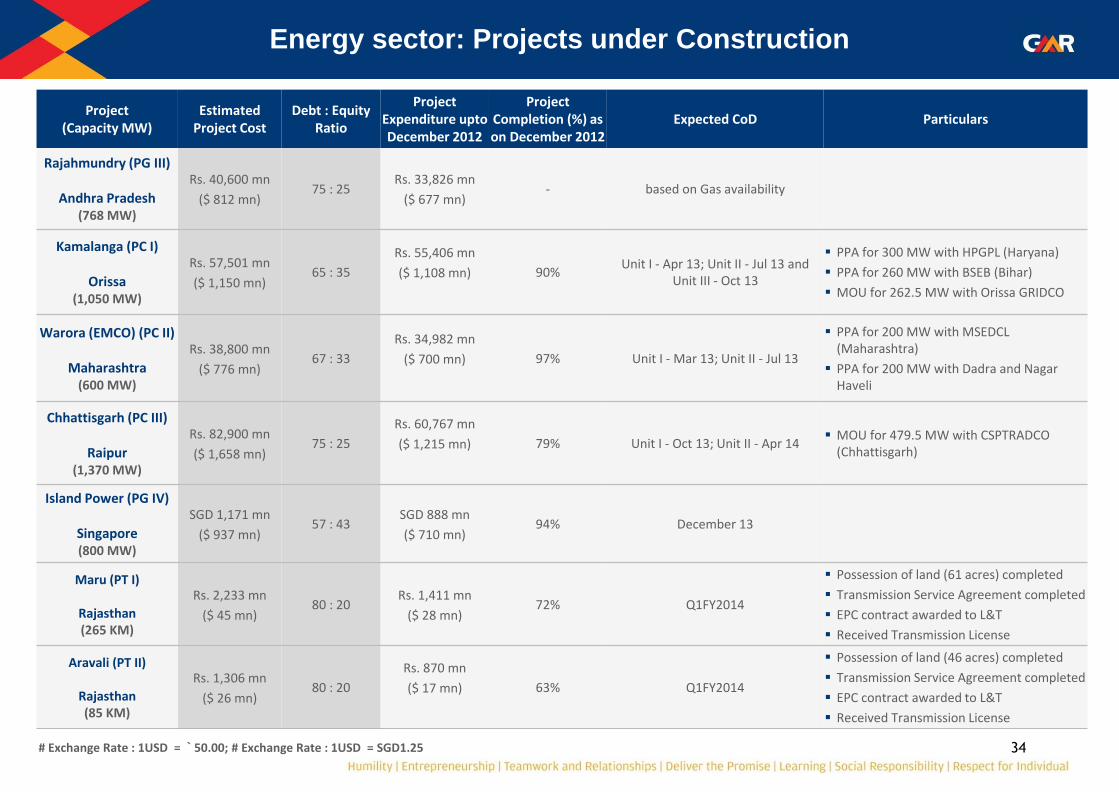
Project (Capacity MW)
Estimated Project Cost
Debt : Equity Ratio
Project Expenditure upto December 2012
Project Completion (%) as on December 2012
Expected CoD Particulars
Rajahmundry (PG III)
Andhra Pradesh (768 MW)
Rs. 40,600 mn
($ 812 mn) 75 : 25
Rs. 33,826 mn
($ 677 mn) - based on Gas availability
Kamalanga (PC I)
Orissa (1,050 MW)
Rs. 57,501 mn
($ 1,150 mn) 65 : 35
Rs. 55,406 mn
($ 1,108 mn)
90% Unit I - Apr 13; Unit II - Jul 13 and
Unit III - Oct 13
PPA for 300 MW with HPGPL (Haryana)
PPA for 260 MW with BSEB (Bihar)
MOU for 262.5 MW with Orissa GRIDCO
Warora (EMCO) (PC II)
Maharashtra (600 MW)
Rs. 38,800 mn
($ 776 mn) 67 : 33
Rs. 34,982 mn
($ 700 mn)
97% Unit I - Mar 13; Unit II - Jul 13
PPA for 200 MW with MSEDCL (Maharashtra)
PPA for 200 MW with Dadra and Nagar Haveli
Chhattisgarh (PC III)
Raipur (1,370 MW)
Rs. 82,900 mn
($ 1,658 mn) 75 : 25
Rs. 60,767 mn
($ 1,215 mn)
79% Unit I - Oct 13; Unit II - Apr 14 MOU for 479.5 MW with CSPTRADCO
(Chhattisgarh)
Island Power (PG IV)
Singapore (800 MW)
SGD 1,171 mn
($ 937 mn) 57 : 43
SGD 888 mn
($ 710 mn) 94% December 13
Maru (PT I)
Rajasthan (265 KM)
Rs. 2,233 mn
($ 45 mn) 80 : 20
Rs. 1,411 mn
($ 28 mn) 72% Q1FY2014
Possession of land (61 acres) completed
Transmission Service Agreement completed
EPC contract awarded to L&T
Received Transmission License
Aravali (PT II)
Rajasthan (85 KM)
Rs. 1,306 mn
($ 26 mn) 80 : 20
Rs. 870 mn
($ 17 mn)
63% Q1FY2014
Possession of land (46 acres) completed
Transmission Service Agreement completed
EPC contract awarded to L&T
Received Transmission License
# Exchange Rate : 1USD = ` 50.00; # Exchange Rate : 1USD = SGD1.25
Energy sector: Projects under Construction
35
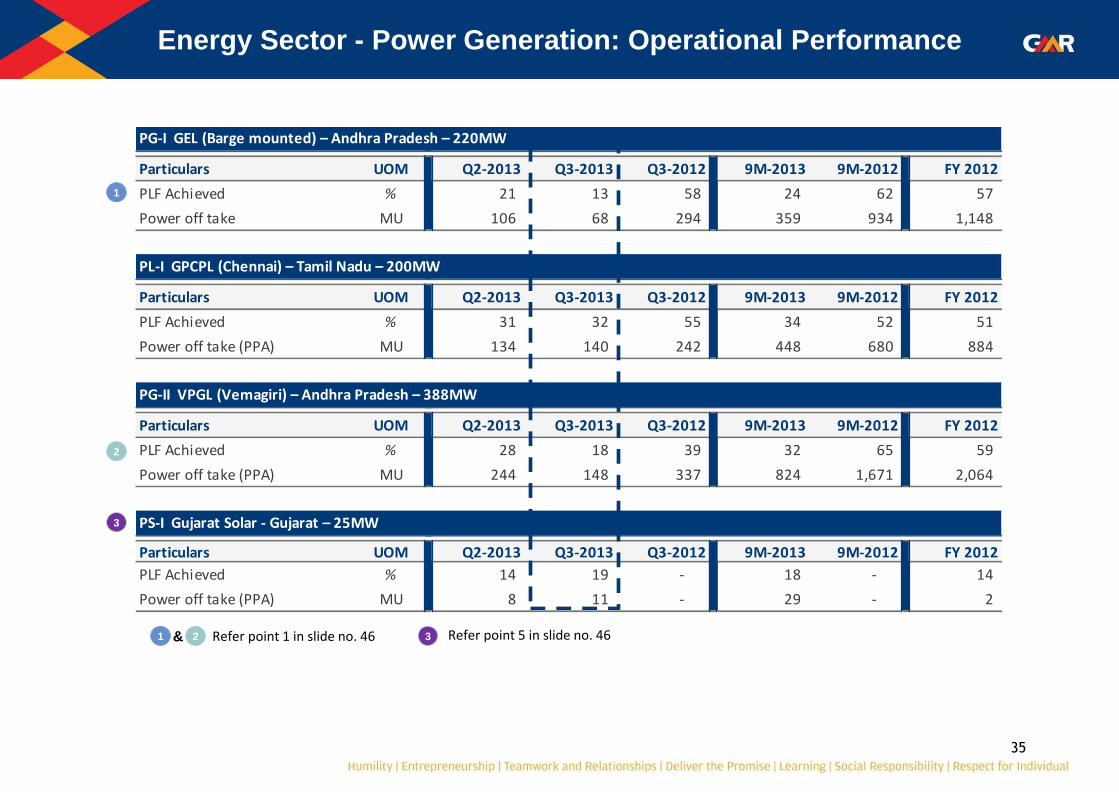
Energy Sector - Power Generation: Operational Performance
Particulars UOM Q2-2013 Q3-2013 Q3-2012 9M-2013 9M-2012 FY 2012
PLF Achieved % 21 13 58 24 62 57
Power off take MU 106 68 294 359 934 1,148
Particulars UOM Q2-2013 Q3-2013 Q3-2012 9M-2013 9M-2012 FY 2012
PLF Achieved % 31 32 55 34 52 51
Power off take (PPA) MU 134 140 242 448 680 884
Particulars UOM Q2-2013 Q3-2013 Q3-2012 9M-2013 9M-2012 FY 2012
PLF Achieved % 28 18 39 32 65 59
Power off take (PPA) MU 244 148 337 824 1,671 2,064
Particulars UOM Q2-2013 Q3-2013 Q3-2012 9M-2013 9M-2012 FY 2012
PLF Achieved % 14 19 - 18 - 14
Power off take (PPA) MU 8 11 - 29 - 2
PG-I GEL (Barge mounted) – Andhra Pradesh – 220MW
PL-I GPCPL (Chennai) – Tamil Nadu – 200MW
PG-II VPGL (Vemagiri) – Andhra Pradesh – 388MW
PS-I Gujarat Solar - Gujarat – 25MW
1 Refer point 1 in slide no. 46
1
2
2
3
3 Refer point 5 in slide no. 46 &
36
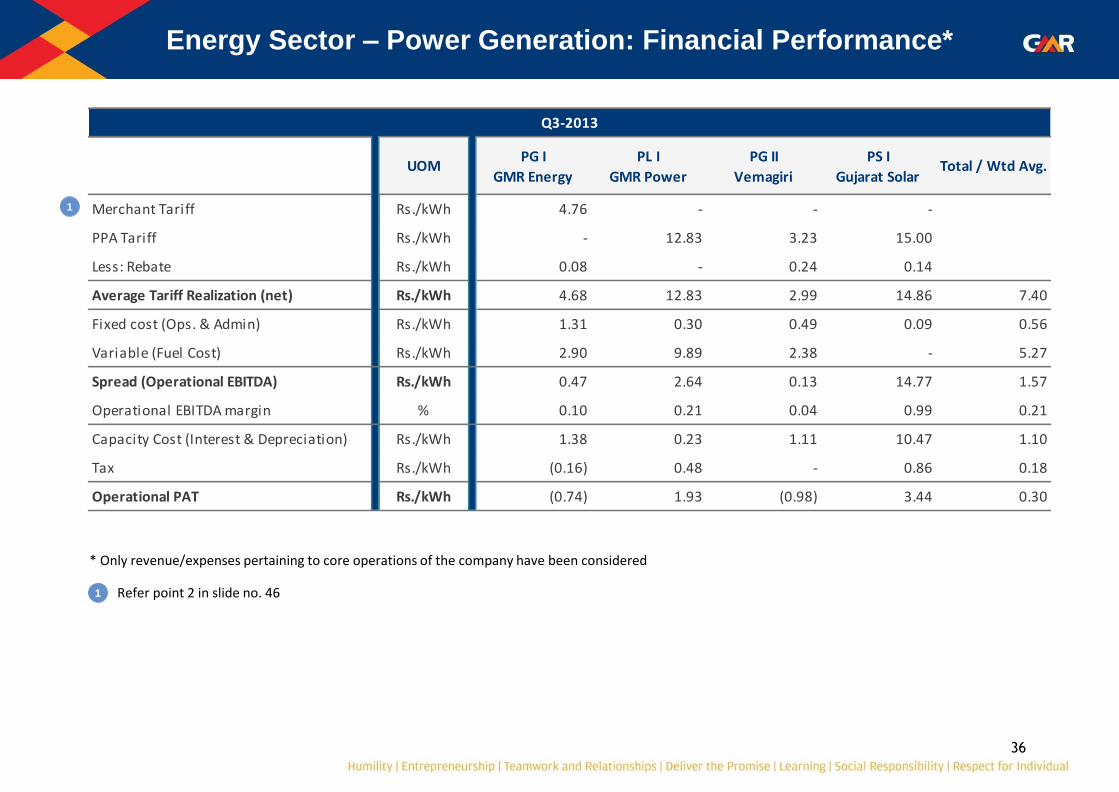
Energy Sector – Power Generation: Financial Performance*
UOMPG I
GMR Energy
PL I
GMR Power
PG II
Vemagiri
PS I
Gujarat SolarTotal / Wtd Avg.
Merchant Tariff Rs./kWh 4.76 - - -
PPA Tariff Rs./kWh - 12.83 3.23 15.00
Less: Rebate Rs./kWh 0.08 - 0.24 0.14
Average Tariff Realization (net) Rs./kWh 4.68 12.83 2.99 14.86 7.40
Fixed cost (Ops. & Admin) Rs./kWh 1.31 0.30 0.49 0.09 0.56
Variable (Fuel Cost) Rs./kWh 2.90 9.89 2.38 - 5.27
Spread (Operational EBITDA) Rs./kWh 0.47 2.64 0.13 14.77 1.57
Operational EBITDA margin % 0.10 0.21 0.04 0.99 0.21
Capacity Cost (Interest & Depreciation) Rs./kWh 1.38 0.23 1.11 10.47 1.10
Tax Rs./kWh (0.16) 0.48 - 0.86 0.18
Operational PAT Rs./kWh (0.74) 1.93 (0.98) 3.44 0.30
Q3-2013
* Only revenue/expenses pertaining to core operations of the company have been considered
1 Refer point 2 in slide no. 46
1

37
Energy Sector-Coal & Energy Trading: Financial Performance*
* Only revenue/expenses pertaining to core operations of the company have been considered ** Units correspond to 100% stake in PT GEMS
UOMCL I
HEG
CL II
PT GEMs**UOM
PTD I
GETL
Units tonne (‘000) 173 1,825 MU 139.56
Sales Realization Rs./tonne 2,221 3,115 Rs./kWh 4.55
Less: Rebate Rs./tonne - - Rs./kWh 0.04
Avg Sales Realization (Net) Rs./tonne 2,221 3,115 Rs./kWh 4.51
Fixed cost (Ops. & Admin) Rs./tonne 1,499 455 Rs./kWh 0.07
Variable Cost Rs./tonne 3,174 2,641 Rs./kWh 4.48
Spread (Operational EBITDA) Rs./tonne -2,452 20 Rs./kWh (0.04)
Operational EBITDA margin % -110.39% 0.63% % -0.98%
Capacity Cost (Interest & Depreciation) Rs./tonne 469 31 Rs./kWh 0.00
Tax Rs./tonne - - Rs./kWh -
Operational PAT Rs./tonne -2,921 -12 Rs./kWh (0.05)
Coal
Q3-2013
Energy Trading
1
1 Refer point 3 in slide no. 46
38
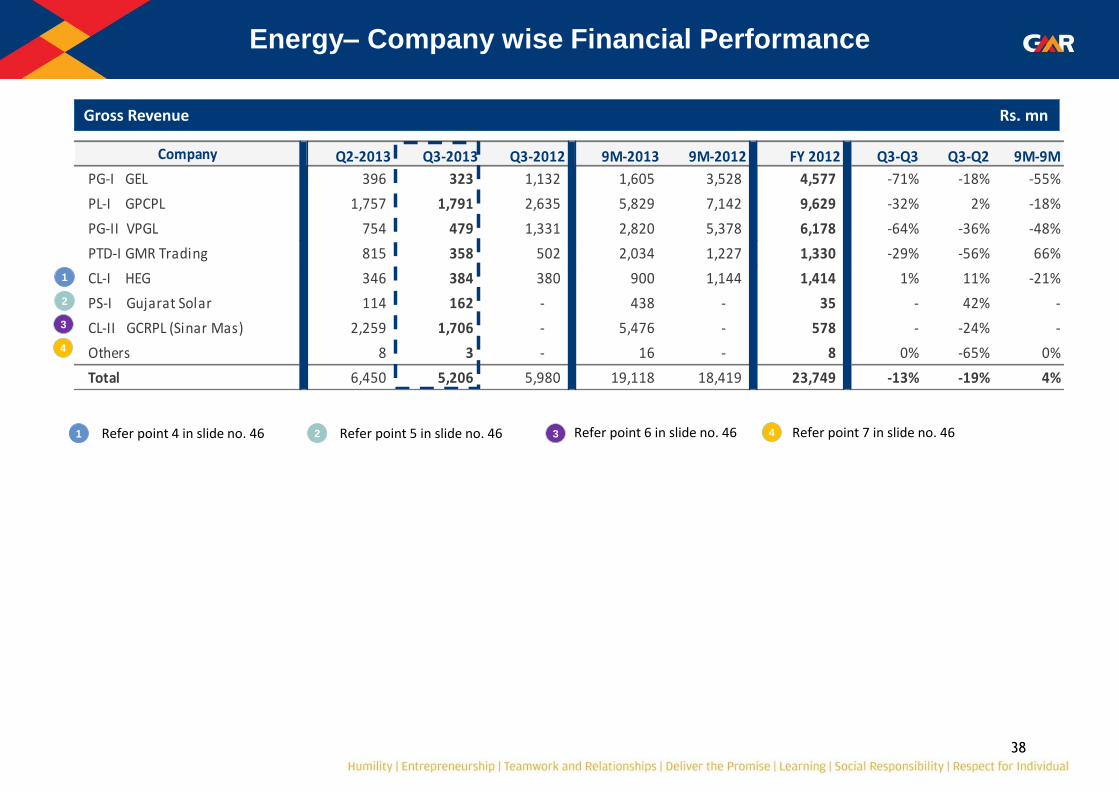
Energy– Company wise Financial Performance
Gross Revenue Rs. mn
1 Refer point 4 in slide no. 46
1
2
2 Refer point 5 in slide no. 46
3
3 Refer point 6 in slide no. 46
4
4 Refer point 7 in slide no. 46
Company Q2-2013 Q3-2013 Q3-2012 9M-2013 9M-2012 FY 2012 Q3-Q3 Q3-Q2 9M-9M
PG-I GEL 396 323 1,132 1,605 3,528 4,577 -71% -18% -55%
PL-I GPCPL 1,757 1,791 2,635 5,829 7,142 9,629 -32% 2% -18%
PG-II VPGL 754 479 1,331 2,820 5,378 6,178 -64% -36% -48%
PTD-I GMR Trading 815 358 502 2,034 1,227 1,330 -29% -56% 66%
CL-I HEG 346 384 380 900 1,144 1,414 1% 11% -21%
PS-I Gujarat Solar 114 162 - 438 - 35 - 42% -
CL-II GCRPL (Sinar Mas) 2,259 1,706 - 5,476 - 578 - -24% -
Others 8 3 - 16 - 8 0% -65% 0%
Total 6,450 5,206 5,980 19,118 18,419 23,749 -13% -19% 4%

39
Energy– Company wise Financial Performance
Net Revenue Rs. mn
Company Q2-2013 Q3-2013 Q3-2012 9M-2013 9M-2012 FY 2012 Q3-Q3 Q3-Q2 9M-9M
PG-I GEL 391 318 1,132 1,578 3,528 4,499 -72% -19% -55%
PL-I GPCPL 1,757 1,791 2,635 5,829 7,142 9,629 -32% 2% -18%
PG-II VPGL 733 444 1,301 2,725 5,256 6,021 -66% -39% -48%
PTD-I GMR Trading 739 309 416 1,812 907 1,009 -26% -58% 100%
CL-I HEG 346 384 380 900 1,144 1,414 1% 11% -21%
PS-I Gujarat Solar 114 158 - 434 - 35 - 39% -
CL-II GCRPL (Sinar Mas) 2,259 1,706 - 5,476 - 578 - -24% -
Others 8 3 - 16 - 8 0% -65% 0%
Total 6,347 5,112 5,864 18,771 17,978 23,192 -13% -19% 4%
40
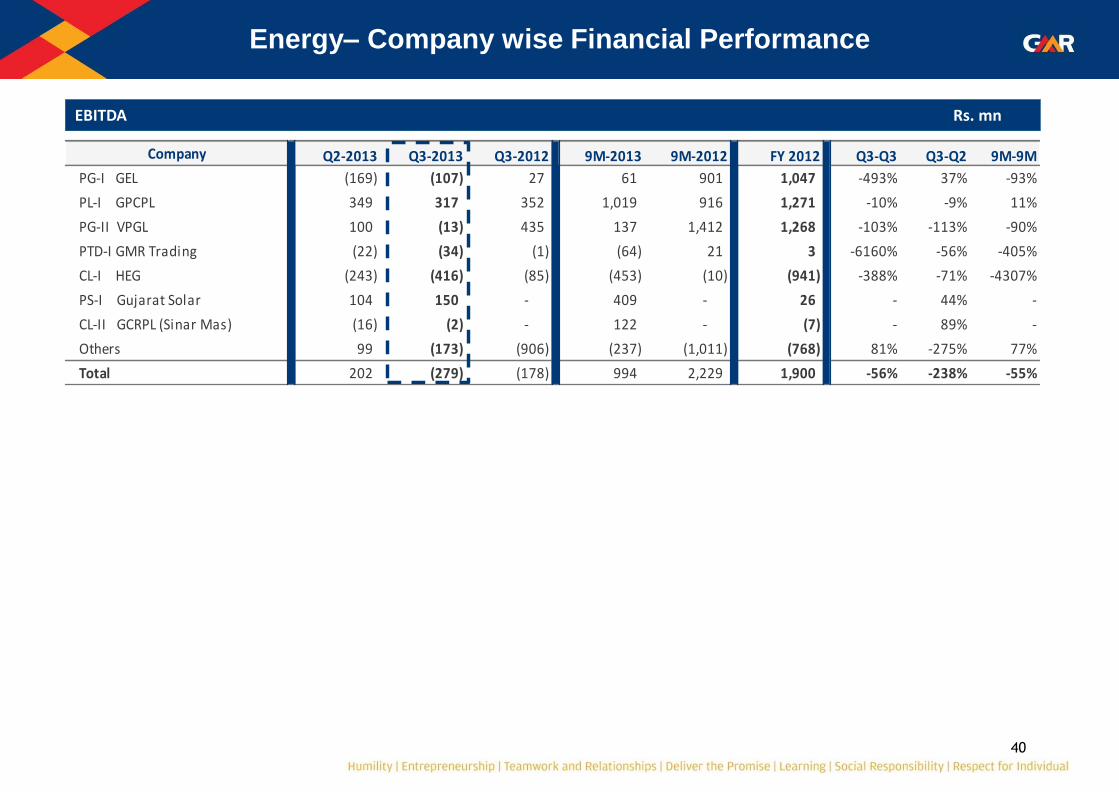
Energy– Company wise Financial Performance
EBITDA Rs. mn
Company Q2-2013 Q3-2013 Q3-2012 9M-2013 9M-2012 FY 2012 Q3-Q3 Q3-Q2 9M-9M
PG-I GEL (169) (107) 27 61 901 1,047 -493% 37% -93%
PL-I GPCPL 349 317 352 1,019 916 1,271 -10% -9% 11%
PG-II VPGL 100 (13) 435 137 1,412 1,268 -103% -113% -90%
PTD-I GMR Trading (22) (34) (1) (64) 21 3 -6160% -56% -405%
CL-I HEG (243) (416) (85) (453) (10) (941) -388% -71% -4307%
PS-I Gujarat Solar 104 150 - 409 - 26 - 44% -
CL-II GCRPL (Sinar Mas) (16) (2) - 122 - (7) - 89% -
Others 99 (173) (906) (237) (1,011) (768) 81% -275% 77%
Total 202 (279) (178) 994 2,229 1,900 -56% -238% -55%

41
Energy– Company wise Financial Performance
EBITDA Margin Rs. mn
Company Q2-2013 Q3-2013 Q3-2012 9M-2013 9M-2012 FY 2012
PG-I GEL -43% -34% 2% 4% 26% 23%
PL-I GPCPL 20% 18% 13% 17% 13% 13%
PG-II VPGL 14% -3% 33% 5% 27% 21%
PTD-I GMR Trading -3% -11% 0% -4% 2% 0%
CL-I HEG -70% -108% -22% -50% -1% -67%
PS-I Gujarat Solar 91% 95% 0% 94% 0% 75%
CL-II GCRPL (Sinar Mas) -1% 0% 0% 2% 0% -1%
Total 3% -5% -3% 5% 12% 8%
42
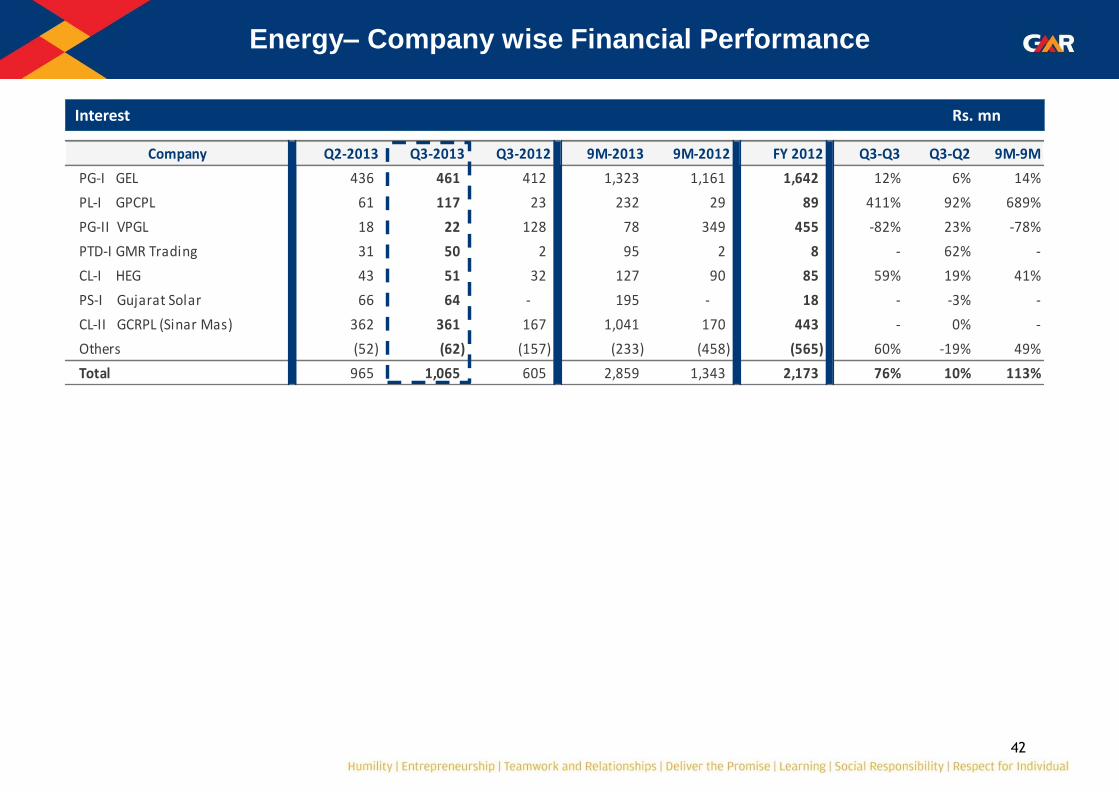
Energy– Company wise Financial Performance
Interest Rs. mn
Company Q2-2013 Q3-2013 Q3-2012 9M-2013 9M-2012 FY 2012 Q3-Q3 Q3-Q2 9M-9M
PG-I GEL 436 461 412 1,323 1,161 1,642 12% 6% 14%
PL-I GPCPL 61 117 23 232 29 89 411% 92% 689%
PG-II VPGL 18 22 128 78 349 455 -82% 23% -78%
PTD-I GMR Trading 31 50 2 95 2 8 - 62% -
CL-I HEG 43 51 32 127 90 85 59% 19% 41%
PS-I Gujarat Solar 66 64 - 195 - 18 - -3% -
CL-II GCRPL (Sinar Mas) 362 361 167 1,041 170 443 - 0% -
Others (52) (62) (157) (233) (458) (565) 60% -19% 49%
Total 965 1,065 605 2,859 1,343 2,173 76% 10% 113%
43
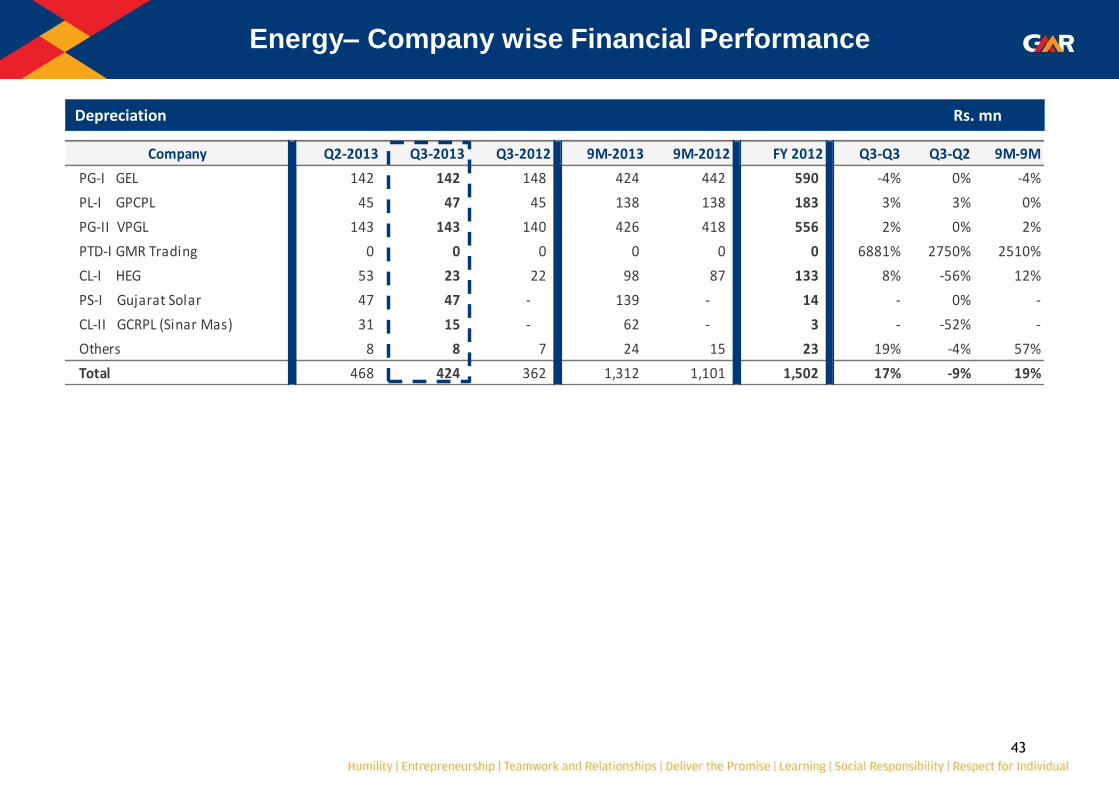
Company Q2-2013 Q3-2013 Q3-2012 9M-2013 9M-2012 FY 2012 Q3-Q3 Q3-Q2 9M-9M
PG-I GEL 142 142 148 424 442 590 -4% 0% -4%
PL-I GPCPL 45 47 45 138 138 183 3% 3% 0%
PG-II VPGL 143 143 140 426 418 556 2% 0% 2%
PTD-I GMR Trading 0 0 0 0 0 0 6881% 2750% 2510%
CL-I HEG 53 23 22 98 87 133 8% -56% 12%
PS-I Gujarat Solar 47 47 - 139 - 14 - 0% -
CL-II GCRPL (Sinar Mas) 31 15 - 62 - 3 - -52% -
Others 8 8 7 24 15 23 19% -4% 57%
Total 468 424 362 1,312 1,101 1,502 17% -9% 19%
Energy– Company wise Financial Performance
Depreciation Rs. mn
44
Energy– Company wise Financial Performance
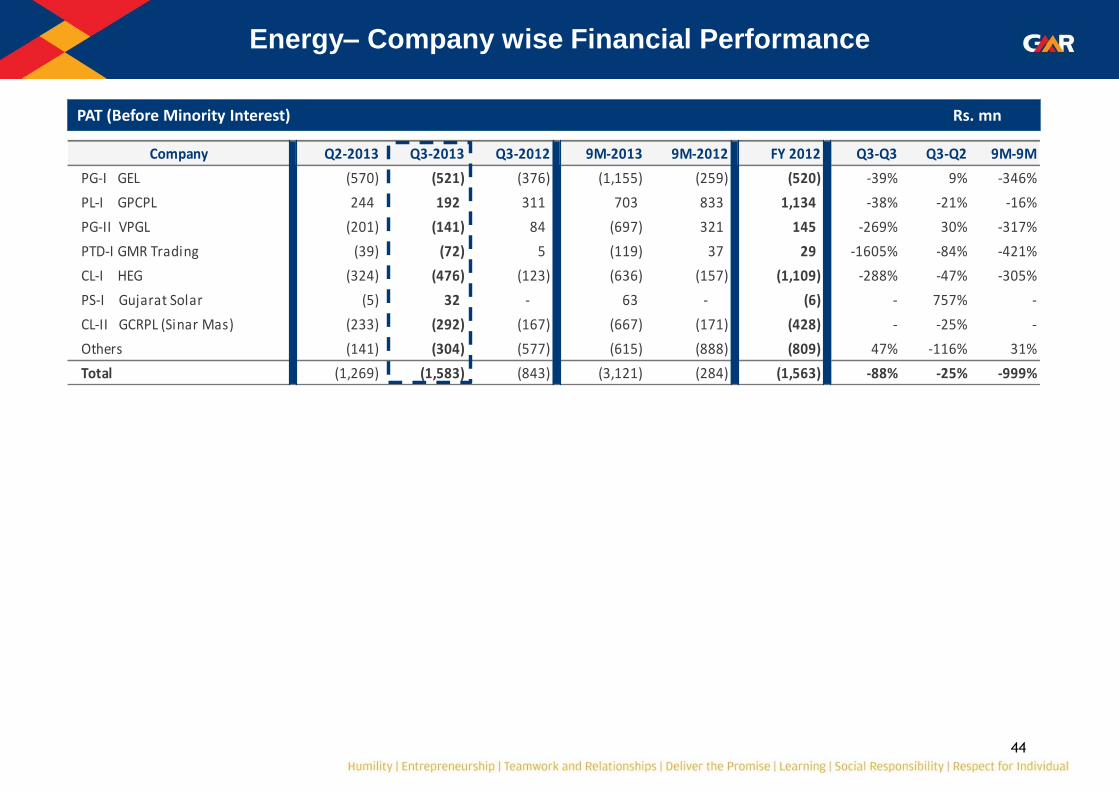
PAT (Before Minority Interest) Rs. mn
Company Q2-2013 Q3-2013 Q3-2012 9M-2013 9M-2012 FY 2012 Q3-Q3 Q3-Q2 9M-9M
PG-I GEL (570) (521) (376) (1,155) (259) (520) -39% 9% -346%
PL-I GPCPL 244 192 311 703 833 1,134 -38% -21% -16%
PG-II VPGL (201) (141) 84 (697) 321 145 -269% 30% -317%
PTD-I GMR Trading (39) (72) 5 (119) 37 29 -1605% -84% -421%
CL-I HEG (324) (476) (123) (636) (157) (1,109) -288% -47% -305%
PS-I Gujarat Solar (5) 32 - 63 - (6) - 757% -
CL-II GCRPL (Sinar Mas) (233) (292) (167) (667) (171) (428) - -25% -
Others (141) (304) (577) (615) (888) (809) 47% -116% 31%
Total (1,269) (1,583) (843) (3,121) (284) (1,563) -88% -25% -999%
45
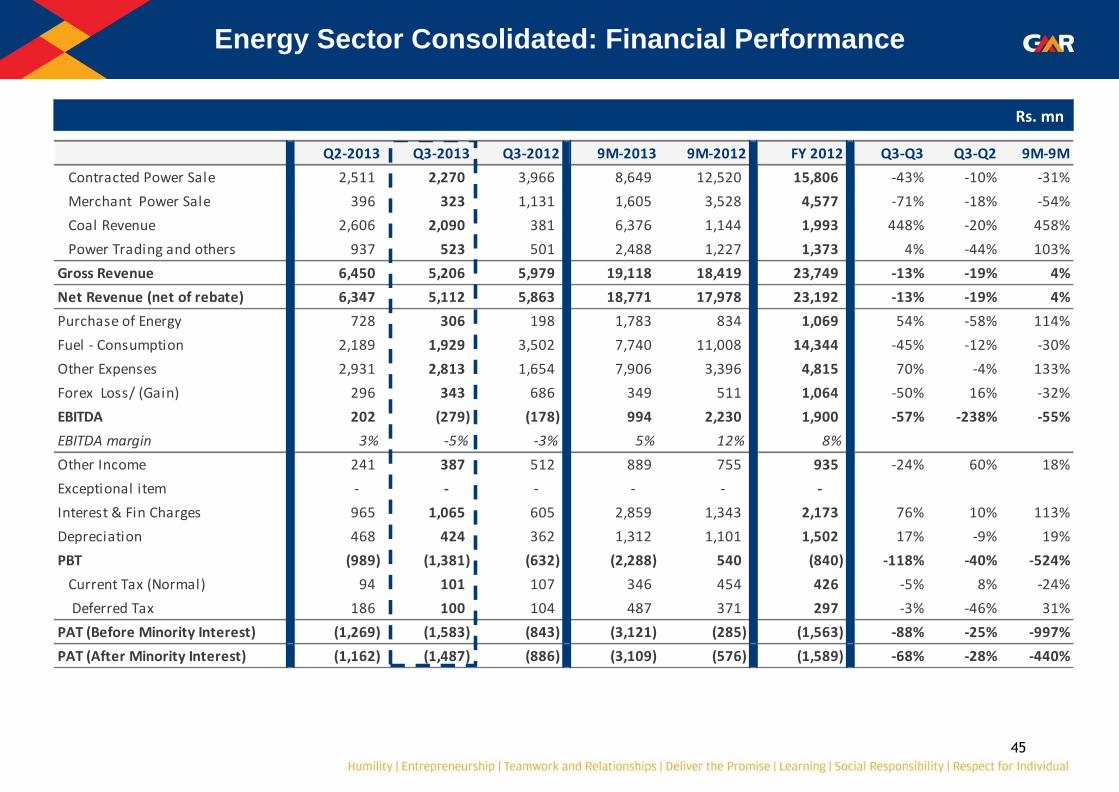
Energy Sector Consolidated: Financial Performance
Rs. mn
Q2-2013 Q3-2013 Q3-2012 9M-2013 9M-2012 FY 2012 Q3-Q3 Q3-Q2 9M-9M
Contracted Power Sale 2,511 2,270 3,966 8,649 12,520 15,806 -43% -10% -31%
Merchant Power Sale 396 323 1,131 1,605 3,528 4,577 -71% -18% -54%
Coal Revenue 2,606 2,090 381 6,376 1,144 1,993 448% -20% 458%
Power Trading and others 937 523 501 2,488 1,227 1,373 4% -44% 103%
Gross Revenue 6,450 5,206 5,979 19,118 18,419 23,749 -13% -19% 4%
Net Revenue (net of rebate) 6,347 5,112 5,863 18,771 17,978 23,192 -13% -19% 4%
Purchase of Energy 728 306 198 1,783 834 1,069 54% -58% 114%
Fuel - Consumption 2,189 1,929 3,502 7,740 11,008 14,344 -45% -12% -30%
Other Expenses 2,931 2,813 1,654 7,906 3,396 4,815 70% -4% 133%
Forex Loss/ (Gain) 296 343 686 349 511 1,064 -50% 16% -32%
EBITDA 202 (279) (178) 994 2,230 1,900 -57% -238% -55%
EBITDA margin 3% -5% -3% 5% 12% 8%
Other Income 241 387 512 889 755 935 -24% 60% 18%
Exceptional item - - - - - -
Interest & Fin Charges 965 1,065 605 2,859 1,343 2,173 76% 10% 113%
Depreciation 468 424 362 1,312 1,101 1,502 17% -9% 19%
PBT (989) (1,381) (632) (2,288) 540 (840) -118% -40% -524%
Current Tax (Normal) 94 101 107 346 454 426 -5% 8% -24%
Deferred Tax 186 100 104 487 371 297 -3% -46% 31%
PAT (Before Minority Interest) (1,269) (1,583) (843) (3,121) (285) (1,563) -88% -25% -997%
PAT (After Minority Interest) (1,162) (1,487) (886) (3,109) (576) (1,589) -68% -28% -440%

46
1. Lower PLF is on account of non availability of gas:
a) PGI GEL – As against a gas supply agreement with RIL for 28,286 MMBTU per day, we have received an average of 6030 MMBTU in Q3FY13
b) PG-II VPGL – As against a gas supply agreement with RIL for only 47,572 MMBTU per day, , we have received an average of 10141 MMBTU in Q3FY13.
2. PG-I GEL Merchant Tariff: • Agreement with APPCC for 90 MW supply of power till May 2013 • PG-I GEL: Sale of power to APPCC (Andhra Pradesh Power Co-ordination Committee) in Q3FY13 at Rs./kWh 4.76
3. CL-I HEG - The negative spread is on account of fixed cost, suspension of production and mining cost incurred which was earlier
capitalized now being charged after rollover of box cut.
4. CL-I HEG has been consolidated with a lag of one quarter.
5. PS-I Gujarat Solar a) Operations have started from 04-Mar-12 b) PPA with GUVNL (Gujarat Urja Vikas Nigam Ltd) @ Rs. 15/kWh for first 12 years and Rs. 5/kWh thereafter for the next 13
years
6. The financials of PT GEMs (Sinar Mas) have been proportionately consolidated (30%) with that of CL-II GCRPL with a lag of one quarter.
7. Others include: Project Cos., Wind Power Cos. and Overseas subsidiaries.
Management Discussion & Analysis (MDA): Energy Sector
47
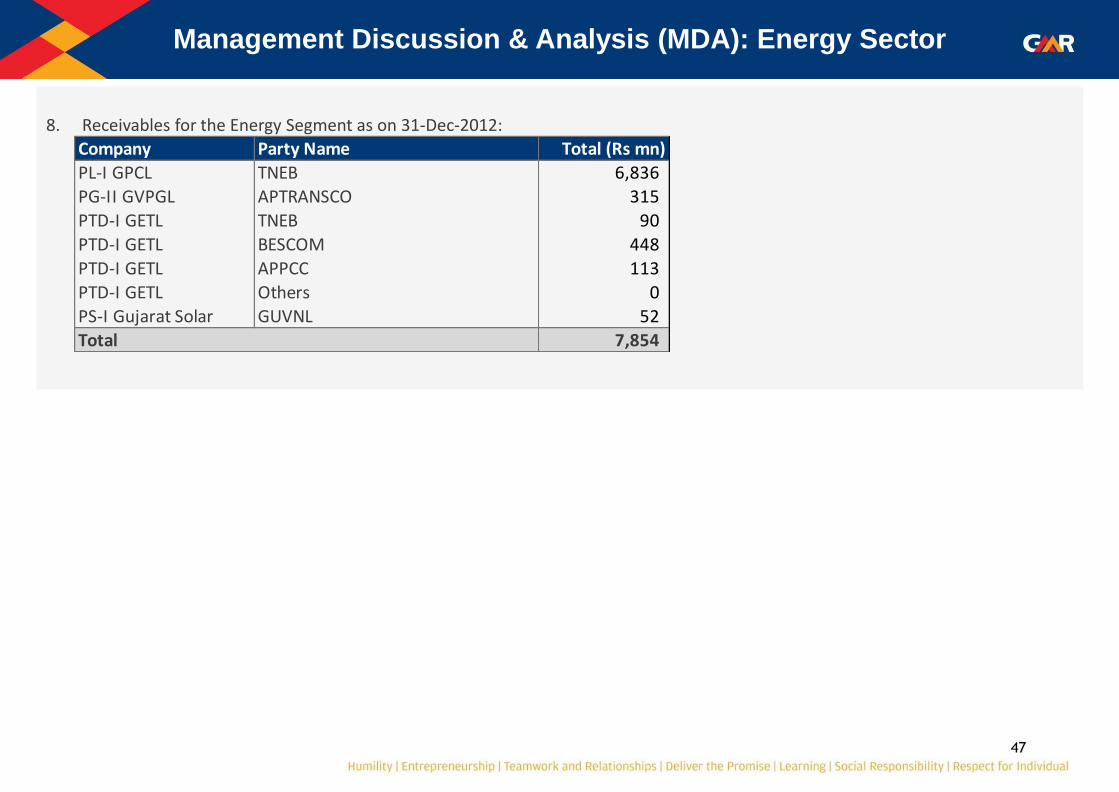
8. Receivables for the Energy Segment as on 31-Dec-2012:
Management Discussion & Analysis (MDA): Energy Sector
Company Party Name Total (Rs mn)
PL-I GPCL TNEB 6,836
PG-II GVPGL APTRANSCO 315
PTD-I GETL TNEB 90
PTD-I GETL BESCOM 448
PTD-I GETL APPCC 113
PTD-I GETL Others 0
PS-I Gujarat Solar GUVNL 52
Total 7,854
Highways Sector
49
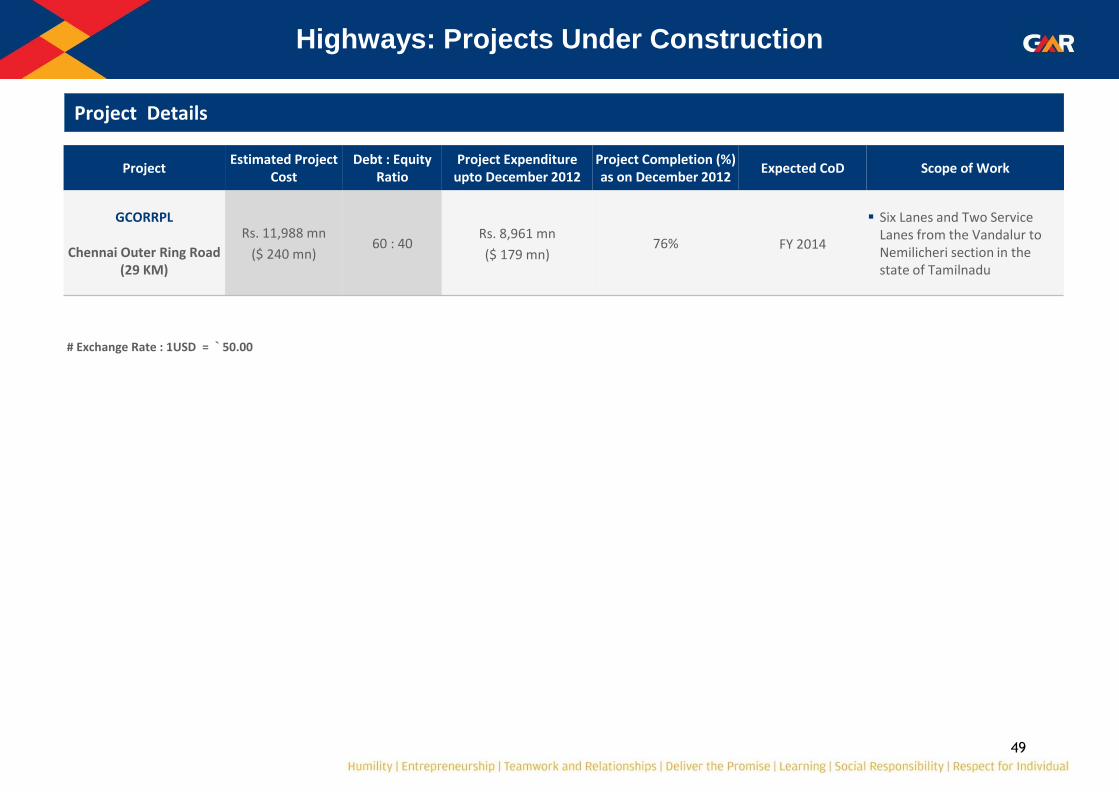
Highways: Projects Under Construction
Project Details
Project Estimated Project
Cost Debt : Equity
Ratio Project Expenditure
upto December 2012 Project Completion (%) as on December 2012
Expected CoD Scope of Work
GCORRPL
Chennai Outer Ring Road (29 KM)
Rs. 11,988 mn
($ 240 mn) 60 : 40
Rs. 8,961 mn
($ 179 mn) 76% FY 2014
Six Lanes and Two Service Lanes from the Vandalur to Nemilicheri section in the state of Tamilnadu
# Exchange Rate : 1USD = ` 50.00

50
Highways: Toll Projects
Operational Asset Details – HT-I: GACEPL – 35 kms (Ambala - Chandigarh)
Operating Metrics Q2-2013 Q3-2013 Q3-2012 9M-2013 9M-2012 FY 2012
Lane km 140 140 140 140 140 140
Lane km days tolled 12,880 12,880 12,880 38,500 38,500 51,240
Total traffic (Mn) 2.08 2.20 2.04 6.41 5.95 7.97
Traffic PCU (Mn) 2.86 2.94 2.77 8.66 8.09 10.84
PCU Factor 1.37 1.34 1.36 1.35 1.36 1.36
Avg Toll (Rs. / PCU) 24.48 25.69 23.09 24.67 22.43 22.73
Avg Toll (Rs./PCU/Lane km) 0.175 0.184 0.165 0.176 0.160 0.162
Revenue (Rs. / Lkmd) 5,435 5,870 4,962 5,551 4,716 4,810
Op. cost (Rs. / Lkmd) 1,541 1,797 799 1,827 873 1,047
EBITDA (Rs. / Lkmd) 3,894 4,074 4,163 3,724 3,843 3,763
EBITDA Margin 72% 69% 84% 67% 81% 78%
Capacity Cost (Rs. / Lkmd) 8,344 8,476 9,823 8,391 8,755 3,566
Performance Metrics Q3 on Q3 Sequential 9M on 9MFY 2012 vs FY
2011
FY 2011 vs FY
2010
Traffic growth 6% 3% 7% 5% 8%
Revenue growth 18% 8% 18% 13% 17%
EBITDA growth -2% 5% 2% 25% 40%
51
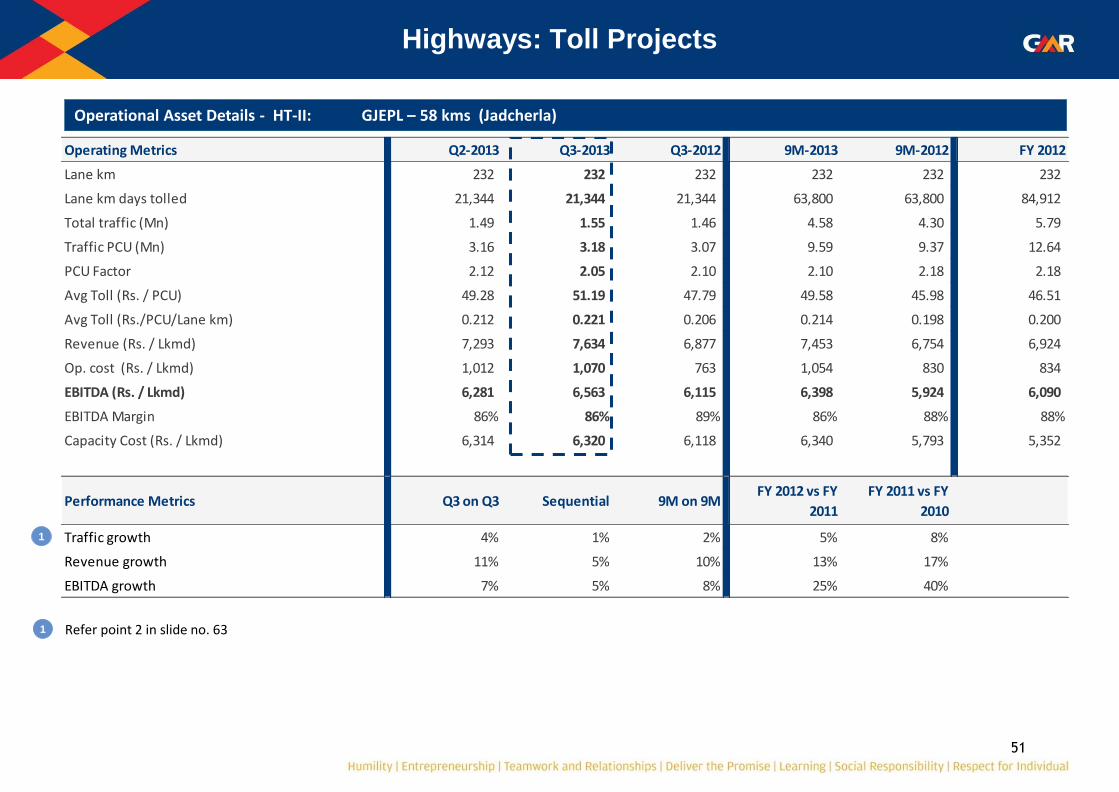
Highways: Toll Projects
Operational Asset Details - HT-II: GJEPL – 58 kms (Jadcherla)
1 Refer point 2 in slide no. 63
1
Operating Metrics Q2-2013 Q3-2013 Q3-2012 9M-2013 9M-2012 FY 2012
Lane km 232 232 232 232 232 232
Lane km days tolled 21,344 21,344 21,344 63,800 63,800 84,912
Total traffic (Mn) 1.49 1.55 1.46 4.58 4.30 5.79
Traffic PCU (Mn) 3.16 3.18 3.07 9.59 9.37 12.64
PCU Factor 2.12 2.05 2.10 2.10 2.18 2.18
Avg Toll (Rs. / PCU) 49.28 51.19 47.79 49.58 45.98 46.51
Avg Toll (Rs./PCU/Lane km) 0.212 0.221 0.206 0.214 0.198 0.200
Revenue (Rs. / Lkmd) 7,293 7,634 6,877 7,453 6,754 6,924
Op. cost (Rs. / Lkmd) 1,012 1,070 763 1,054 830 834
EBITDA (Rs. / Lkmd) 6,281 6,563 6,115 6,398 5,924 6,090
EBITDA Margin 86% 86% 89% 86% 88% 88%
Capacity Cost (Rs. / Lkmd) 6,314 6,320 6,118 6,340 5,793 5,352
Performance Metrics Q3 on Q3 Sequential 9M on 9MFY 2012 vs FY
2011
FY 2011 vs FY
2010
Traffic growth 4% 1% 2% 5% 8%
Revenue growth 11% 5% 10% 13% 17%
EBITDA growth 7% 5% 8% 25% 40%

52
Highways: Toll Projects
Operational Asset Details - HT-III: GUEPL – 73 kms (Ulundurpet-Tindivanam)
Operating Metrics Q2-2013 Q3-2013 Q3-2012 9M-2013 9M-2012 FY 2012
Lane km 292 292 292 292 292 292
Lane km days tolled 26,864 26,864 26,864 80,300 80,300 106,872
Total traffic (Mn) 1.82 1.87 1.57 5.57 4.78 6.52
Traffic PCU (Mn) 3.89 3.84 3.34 11.60 10.29 13.91
PCU Factor 2.13 2.06 2.13 2.08 2.15 2.13
Avg Toll (Rs. / PCU) 55.58 58.70 53.70 55.99 52.63 52.94
Avg Toll (Rs./PCU/Lane km) 0.190 0.201 0.184 0.192 0.180 0.181
Revenue (Rs. / Lkmd) 8,038 8,385 6,667 8,088 6,742 6,891
Op. cost (Rs. / Lkmd) 973 926 624 945 710 709
EBITDA (Rs. / Lkmd) 7,065 7,459 6,043 7,143 6,032 6,183
EBITDA Margin 88% 89% 91% 88% 89% 90%
Capacity Cost (Rs. / Lkmd) 7,834 7,918 7,881 7,862 7,763 5,749
Performance Metrics Q3 on Q3 Sequential 9M on 9MFY 2012 vs FY
2011
FY 2011 vs FY
2010
Traffic growth 15% -1% 13% 5% 8%
Revenue growth 26% 4% 20% 13% 17%
EBITDA growth 23% 6% 18% 25% 40%
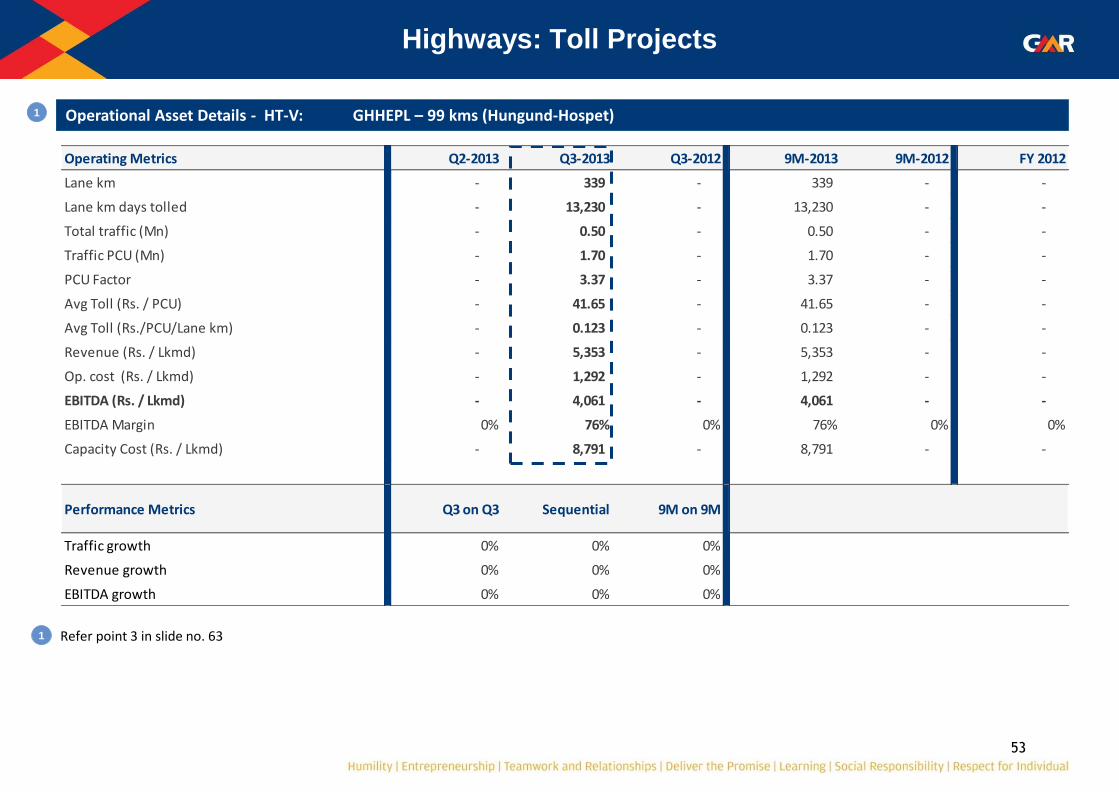
53
Operating Metrics Q2-2013 Q3-2013 Q3-2012 9M-2013 9M-2012 FY 2012
Lane km - 339 - 339 - -
Lane km days tolled - 13,230 - 13,230 - -
Total traffic (Mn) - 0.50 - 0.50 - -
Traffic PCU (Mn) - 1.70 - 1.70 - -
PCU Factor - 3.37 - 3.37 - -
Avg Toll (Rs. / PCU) - 41.65 - 41.65 - -
Avg Toll (Rs./PCU/Lane km) - 0.123 - 0.123 - -
Revenue (Rs. / Lkmd) - 5,353 - 5,353 - -
Op. cost (Rs. / Lkmd) - 1,292 - 1,292 - -
EBITDA (Rs. / Lkmd) - 4,061 - 4,061 - -
EBITDA Margin 0% 76% 0% 76% 0% 0%
Capacity Cost (Rs. / Lkmd) - 8,791 - 8,791 - -
Performance Metrics Q3 on Q3 Sequential 9M on 9M
Traffic growth 0% 0% 0%
Revenue growth 0% 0% 0%
EBITDA growth 0% 0% 0%
Operational Asset Details - HT-V GHHEPL – 99 kms (Hungund-Hospet)
Highways: Toll Projects
Operational Asset Details - HT-V: GHHEPL – 99 kms (Hungund-Hospet)
1 Refer point 3 in slide no. 63
1
54
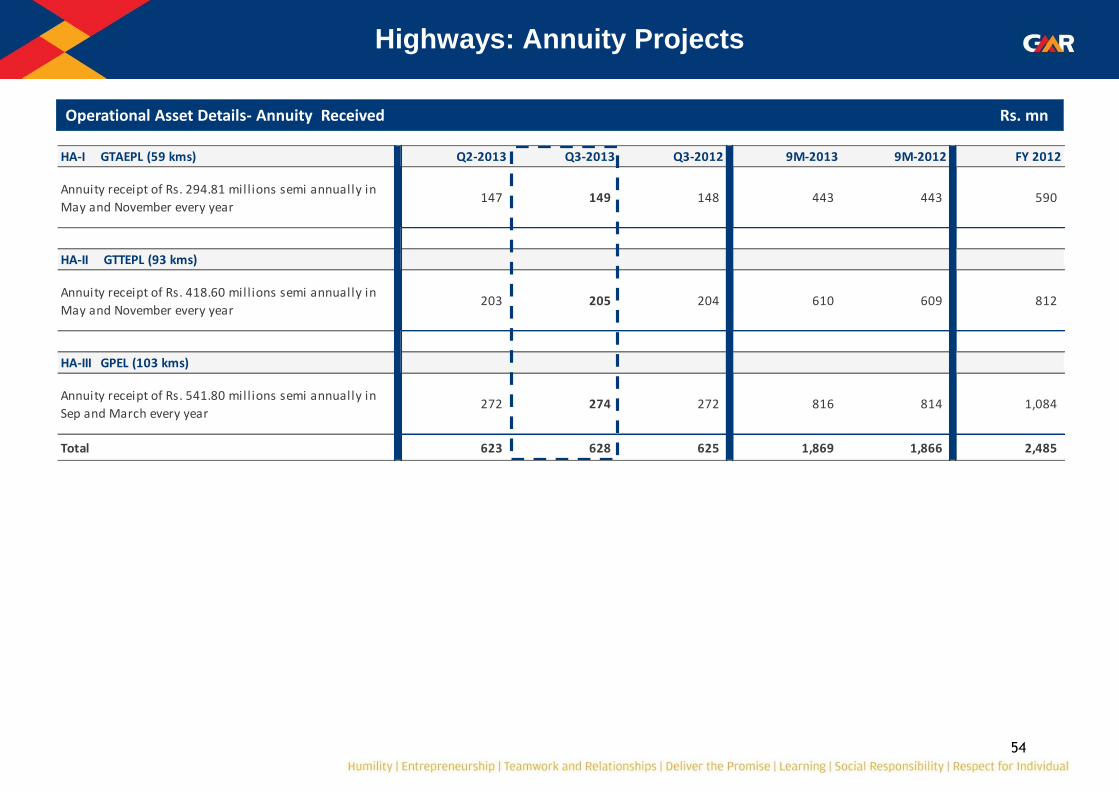
Highways: Annuity Projects
Operational Asset Details- Annuity Received Rs. mn
HA-I GTAEPL (59 kms) Q2-2013 Q3-2013 Q3-2012 9M-2013 9M-2012 FY 2012
Annuity receipt of Rs. 294.81 mill ions semi annually in
May and November every year147 149 148 443 443 590
HA-II GTTEPL (93 kms)
Annuity receipt of Rs. 418.60 mill ions semi annually in
May and November every year203 205 204 610 609 812
HA-III GPEL (103 kms)
Annuity receipt of Rs. 541.80 mill ions semi annually in
Sep and March every year272 274 272 816 814 1,084
Total 623 628 625 1,869 1,866 2,485

55
Company wise- Financial Performance
Gross Revenue Rs. mn
Company Q2-2013 Q3-2013 Q3-2012 9M-2013 9M-2012 FY 2012 Q3-Q3 Q3-Q2 9M-9M
Annuity Projects:
HA-I GTAEPL 147 149 148 443 443 590 0% 1% 0%
HA-II GTTEPL 203 205 204 610 609 812 0% 1% 0%
HA-III GPEL 272 274 272 816 814 1,084 1% 1% 0%
Total Annuity 623 628 625 1,869 1,866 2,485 0% 1% 0%
Toll Projects:
HT-I GACEPL 70 76 64 214 182 246 18% 8% 18%
HT-II GJEPL 156 163 147 475 431 588 11% 5% 10%
HT-III GUEPL 216 225 179 649 541 737 26% 4% 20%
HT-IV GHVEPL - 75 - 75 - -
HT-V GHHEPL - 71 - 71 - -
Total Toll 442 610 390 1,485 1,154 1,571 56% 38% 29%
Others
Total Roads 1,065 1,238 1,015 3,353 3,020 4,056 22% 16% 11%

56
Company wise- Financial Performance
Net Revenue Rs. mn
Company Q2-2013 Q3-2013 Q3-2012 9M-2013 9M-2012 FY 2012 Q3-Q3 Q3-Q2 9M-9M
Annuity Projects:
HA-I GTAEPL 147 149 148 443 443 590 0% 1% 0%
HA-II GTTEPL 203 205 204 610 609 812 0% 1% 0%
HA-III GPEL 272 274 272 816 814 1,084 1% 1% 0%
Total Annuity 623 628 625 1,869 1,866 2,485 0% 1% 0%
Toll Projects:
HT-I GACEPL 70 76 64 214 182 246 18% 8% 18%
HT-II GJEPL 156 163 147 475 431 588 11% 5% 10%
HT-III GUEPL 216 225 179 649 541 737 26% 4% 20%
HT-IV GHVEPL - 50 - 50 - -
HT-V GHHEPL - 71 - 71 - -
Total Toll 442 584 390 1,459 1,154 1,571 50% 32% 26%
Others
Total Roads 1,065 1,212 1,015 3,328 3,020 4,056 19% 14% 10%
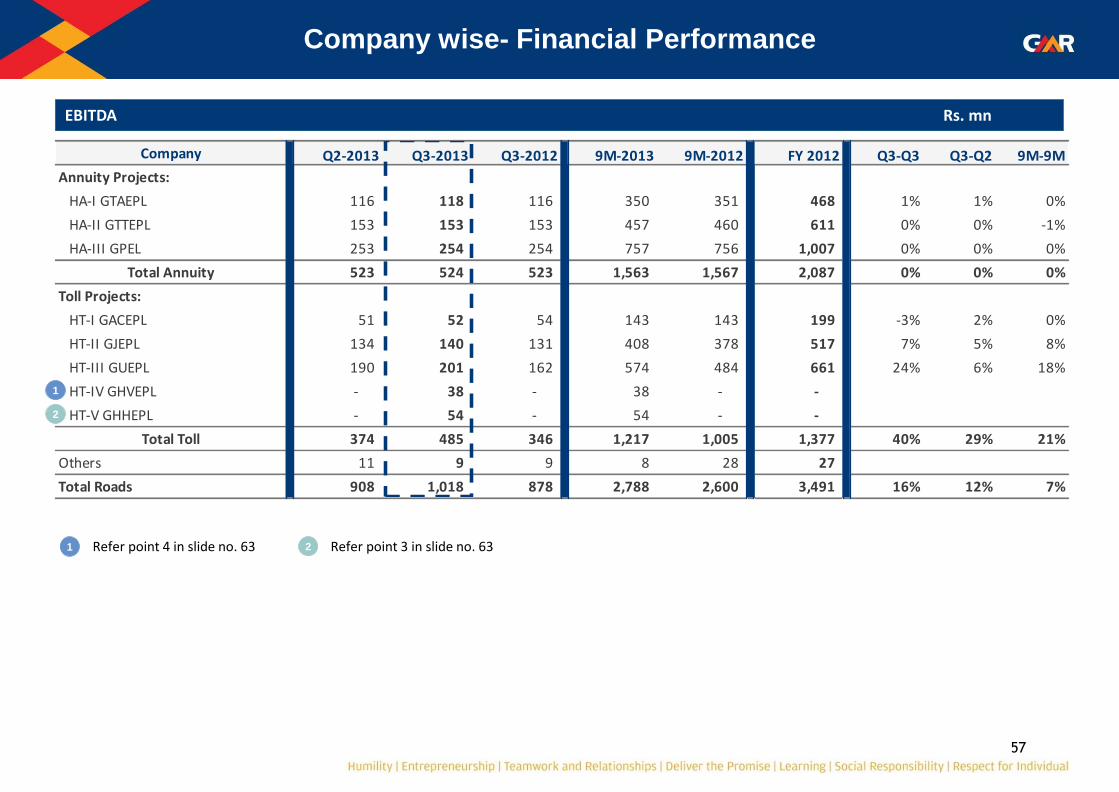
57
Company wise- Financial Performance
EBITDA Rs. mn
Company Q2-2013 Q3-2013 Q3-2012 9M-2013 9M-2012 FY 2012 Q3-Q3 Q3-Q2 9M-9M
Annuity Projects:
HA-I GTAEPL 116 118 116 350 351 468 1% 1% 0%
HA-II GTTEPL 153 153 153 457 460 611 0% 0% -1%
HA-III GPEL 253 254 254 757 756 1,007 0% 0% 0%
Total Annuity 523 524 523 1,563 1,567 2,087 0% 0% 0%
Toll Projects:
HT-I GACEPL 51 52 54 143 143 199 -3% 2% 0%
HT-II GJEPL 134 140 131 408 378 517 7% 5% 8%
HT-III GUEPL 190 201 162 574 484 661 24% 6% 18%
HT-IV GHVEPL - 38 - 38 - -
HT-V GHHEPL - 54 - 54 - -
Total Toll 374 485 346 1,217 1,005 1,377 40% 29% 21%
Others 11 9 9 8 28 27
Total Roads 908 1,018 878 2,788 2,600 3,491 16% 12% 7%
1 Refer point 4 in slide no. 63
1
2
2 Refer point 3 in slide no. 63

58
Company wise- Financial Performance
EBITDA margin
Company Q2-2013 Q3-2013 Q3-2012 9M-2013 9M-2012 FY 2012
Annuity Projects:
HA-I GTAEPL 79% 79% 79% 79% 79% 79%
HA-II GTTEPL 75% 75% 75% 75% 76% 75%
HA-III GPEL 93% 93% 93% 93% 93% 93%
Total Annuity 84% 83% 84% 84% 84% 84%
Toll Projects:
HT-I GACEPL 72% 69% 84% 67% 79% 81%
HT-II GJEPL 86% 86% 89% 86% 88% 88%
HT-III GUEPL 88% 89% 91% 88% 89% 90%
HT-IV GHVEPL - 77% - 77% - -
HT-V GHHEPL - 76% - 76% - -
Total Toll 85% 83% 89% 83% 87% 88%
TOTAL Roads 85% 84% 87% 83% 86% 86%
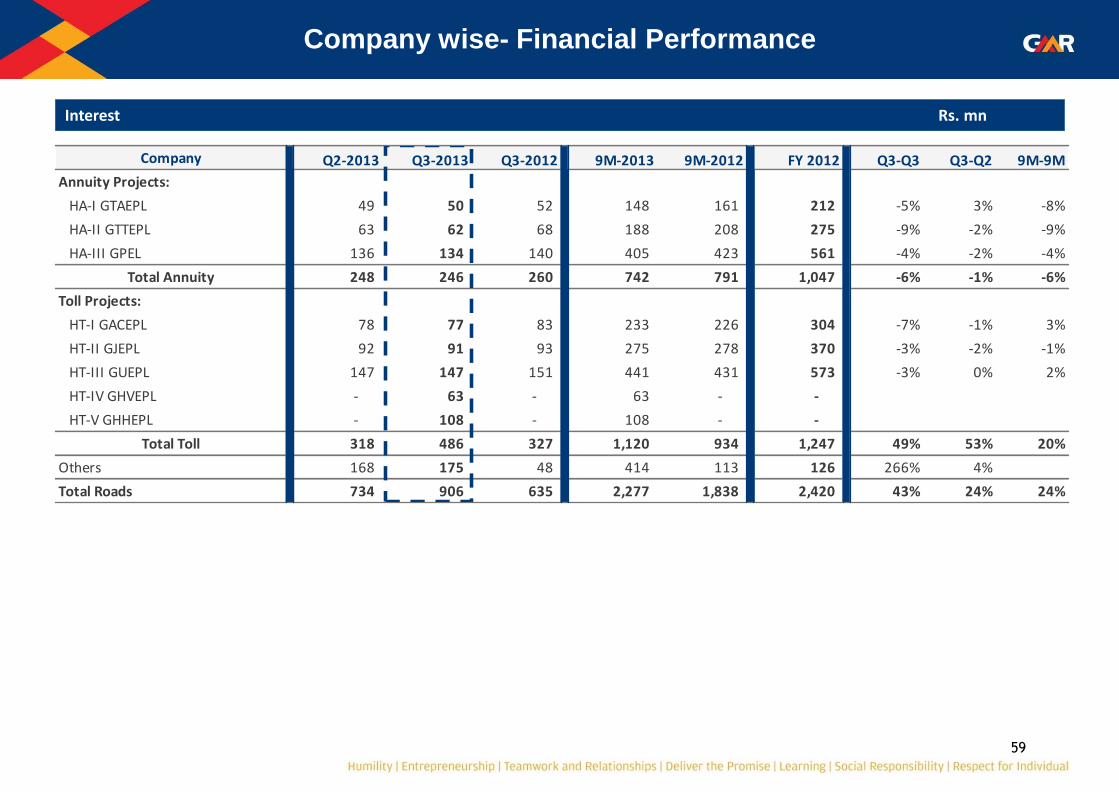
59
Company wise- Financial Performance
Interest Rs. mn
Company Q2-2013 Q3-2013 Q3-2012 9M-2013 9M-2012 FY 2012 Q3-Q3 Q3-Q2 9M-9M
Annuity Projects:
HA-I GTAEPL 49 50 52 148 161 212 -5% 3% -8%
HA-II GTTEPL 63 62 68 188 208 275 -9% -2% -9%
HA-III GPEL 136 134 140 405 423 561 -4% -2% -4%
Total Annuity 248 246 260 742 791 1,047 -6% -1% -6%
Toll Projects:
HT-I GACEPL 78 77 83 233 226 304 -7% -1% 3%
HT-II GJEPL 92 91 93 275 278 370 -3% -2% -1%
HT-III GUEPL 147 147 151 441 431 573 -3% 0% 2%
HT-IV GHVEPL - 63 - 63 - -
HT-V GHHEPL - 108 - 108 - -
Total Toll 318 486 327 1,120 934 1,247 49% 53% 20%
Others 168 175 48 414 113 126 266% 4%
Total Roads 734 906 635 2,277 1,838 2,420 43% 24% 24%
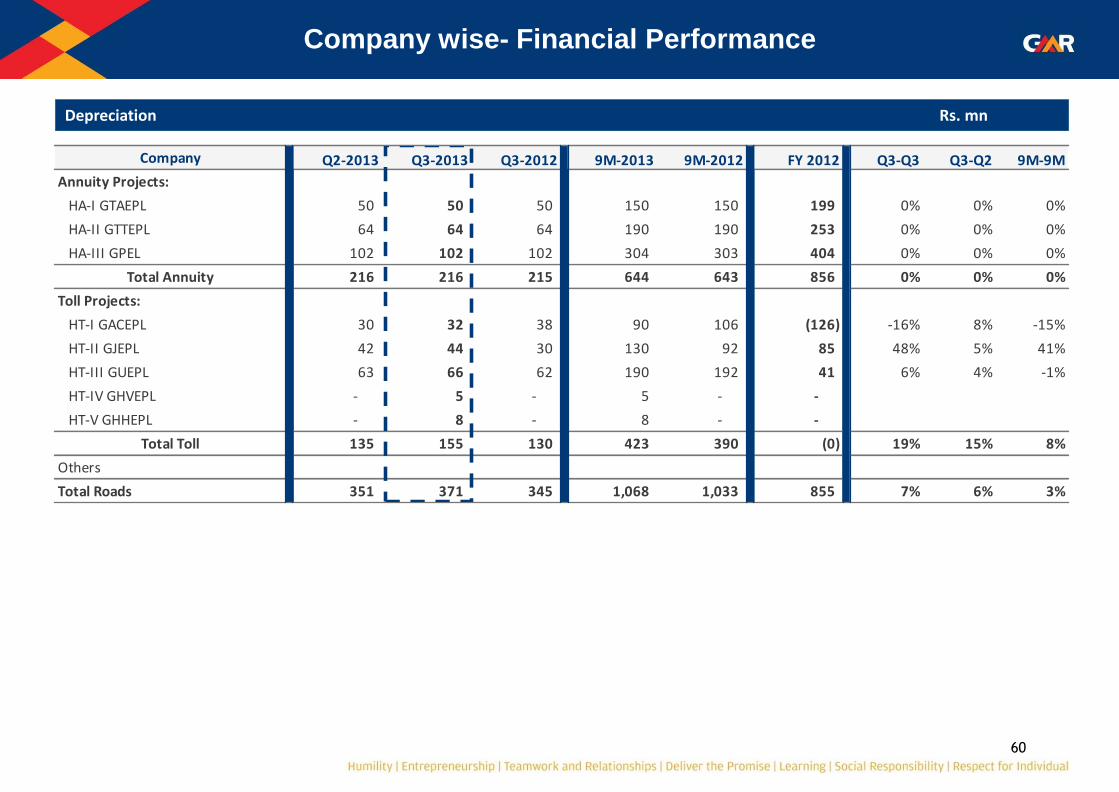
60
Company wise- Financial Performance
Depreciation Rs. mn
Company Q2-2013 Q3-2013 Q3-2012 9M-2013 9M-2012 FY 2012 Q3-Q3 Q3-Q2 9M-9M
Annuity Projects:
HA-I GTAEPL 50 50 50 150 150 199 0% 0% 0%
HA-II GTTEPL 64 64 64 190 190 253 0% 0% 0%
HA-III GPEL 102 102 102 304 303 404 0% 0% 0%
Total Annuity 216 216 215 644 643 856 0% 0% 0%
Toll Projects:
HT-I GACEPL 30 32 38 90 106 (126) -16% 8% -15%
HT-II GJEPL 42 44 30 130 92 85 48% 5% 41%
HT-III GUEPL 63 66 62 190 192 41 6% 4% -1%
HT-IV GHVEPL - 5 - 5 - -
HT-V GHHEPL - 8 - 8 - -
Total Toll 135 155 130 423 390 (0) 19% 15% 8%
Others
Total Roads 351 371 345 1,068 1,033 855 7% 6% 3%
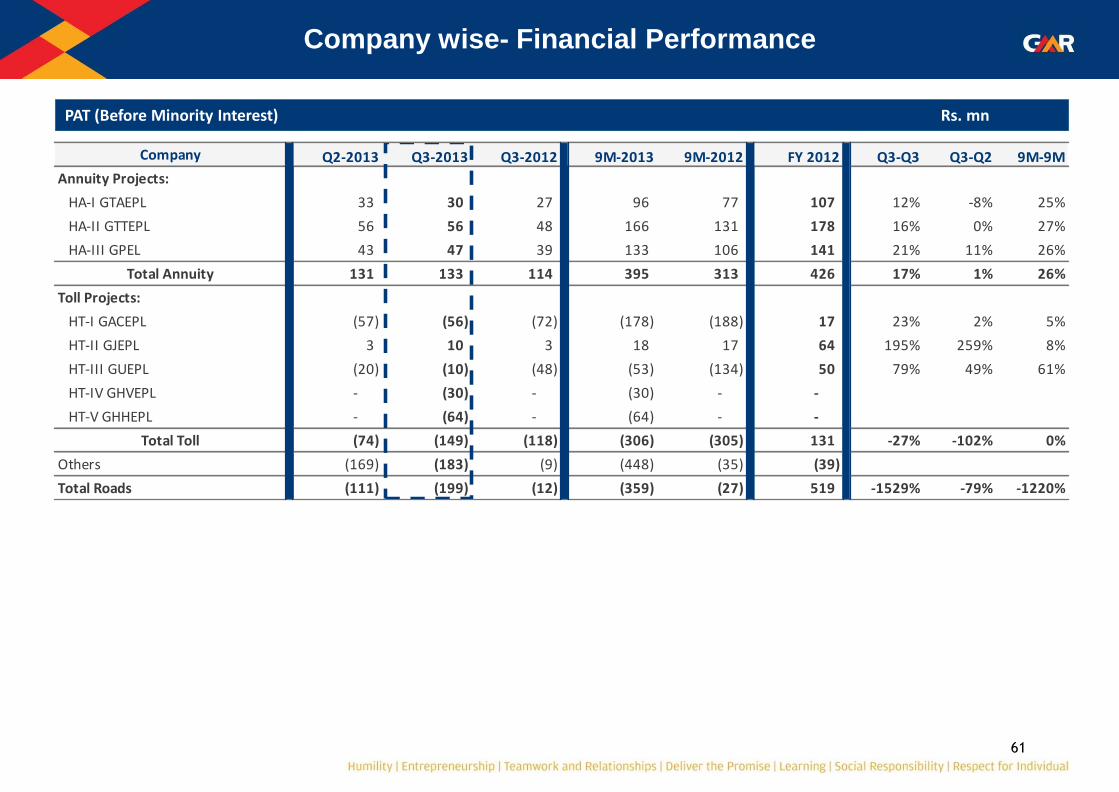
61
Company wise- Financial Performance
PAT (Before Minority Interest) Rs. mn
Company Q2-2013 Q3-2013 Q3-2012 9M-2013 9M-2012 FY 2012 Q3-Q3 Q3-Q2 9M-9M
Annuity Projects:
HA-I GTAEPL 33 30 27 96 77 107 12% -8% 25%
HA-II GTTEPL 56 56 48 166 131 178 16% 0% 27%
HA-III GPEL 43 47 39 133 106 141 21% 11% 26%
Total Annuity 131 133 114 395 313 426 17% 1% 26%
Toll Projects:
HT-I GACEPL (57) (56) (72) (178) (188) 17 23% 2% 5%
HT-II GJEPL 3 10 3 18 17 64 195% 259% 8%
HT-III GUEPL (20) (10) (48) (53) (134) 50 79% 49% 61%
HT-IV GHVEPL - (30) - (30) - -
HT-V GHHEPL - (64) - (64) - -
Total Toll (74) (149) (118) (306) (305) 131 -27% -102% 0%
Others (169) (183) (9) (448) (35) (39)
Total Roads (111) (199) (12) (359) (27) 519 -1529% -79% -1220%

62
Highways Consolidated: Financial Performance
Rs. mn
Q2-2013 Q3-2013 Q3-2012 9M-2013 9M-2012 FY 2012 Q3-Q3 Q3-Q2 9M-9M
Annuity Revenue 623 628 625 1,869 1,866 2,485 0% 1% 0%
Toll Revenue 442 610 390 1,485 1,154 1,571 57% 38% 29%
Gross Revenue 1,065 1,238 1,015 3,353 3,020 4,056 22% 16% 11%
Less: Revenue Share - 25 - 25 - - 0% 0% 0%
Net Revenue 1,065 1,212 1,015 3,328 3,020 4,056 19% 14% 10%
Operating Expenses 156 195 136 540 419 565 43% 25% 29%
EBITDA 908 1,018 878 2,788 2,600 3,491 16% 12% 7%
EBITDA margin 85% 84% 87% 84% 86% 86%
Other Income 109 111 119 329 341 444 -7% 1% -4%
Interest & Finance Charges 734 906 635 2,277 1,838 2,420 43% 24% 24%
Depreciation 351 373 346 1,069 1,034 856 8% 6% 3%
PBT (67) (151) 17 (229) 69 659 -982% -125% -431%
Current Tax 40 43 29 120 110 149 48% 8% 9%
Deferred Tax 4 5 - 10 (14) (9) 0% 21% 174%
PAT (Before Minority Interest) (111) (199) (12) (359) (27) 519 -1529% -79% -1220%
PAT (After Minority Interest) (138) (172) (42) (393) (106) 409 -308% -25% -270%
63
Management Discussion & Analysis (MDA): Highways Sector
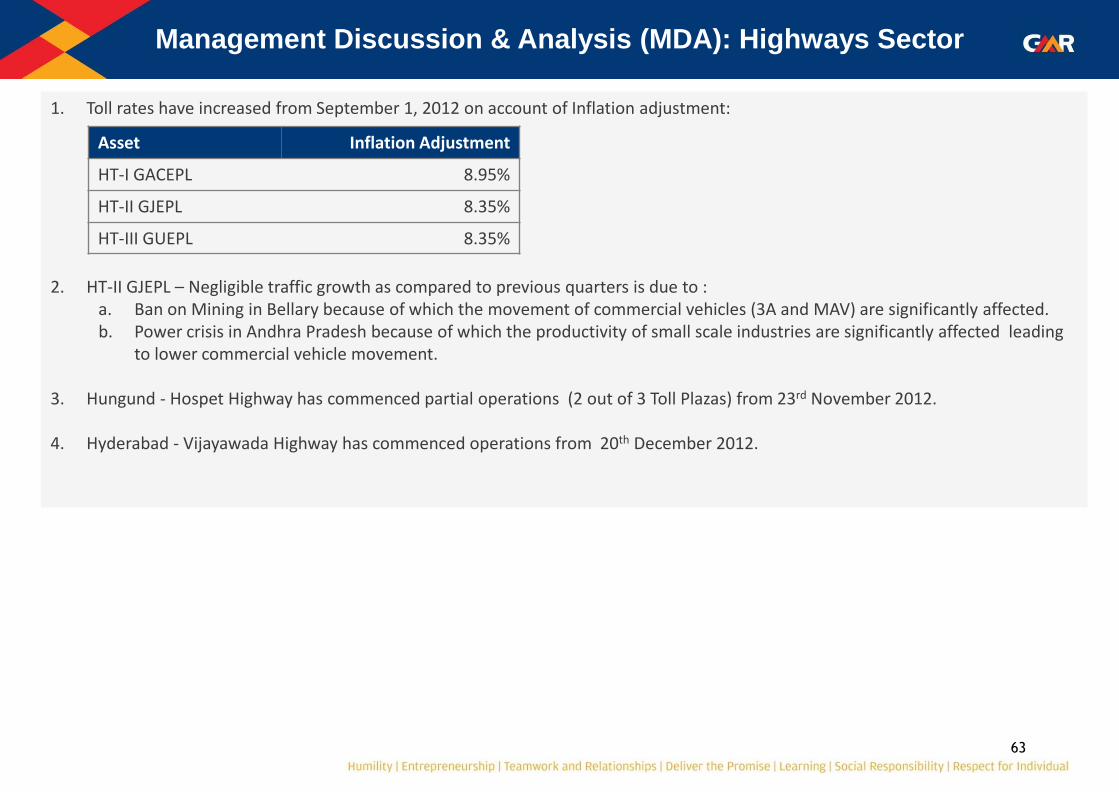
1. Toll rates have increased from September 1, 2012 on account of Inflation adjustment:
2. HT-II GJEPL – Negligible traffic growth as compared to previous quarters is due to : a. Ban on Mining in Bellary because of which the movement of commercial vehicles (3A and MAV) are significantly affected. b. Power crisis in Andhra Pradesh because of which the productivity of small scale industries are significantly affected leading
to lower commercial vehicle movement.
3. Hungund - Hospet Highway has commenced partial operations (2 out of 3 Toll Plazas) from 23rd November 2012.
4. Hyderabad - Vijayawada Highway has commenced operations from 20th December 2012.
Asset Inflation Adjustment
HT-I GACEPL 8.95%
HT-II GJEPL 8.35%
HT-III GUEPL 8.35%
EPC & Others: Financial Performance
65
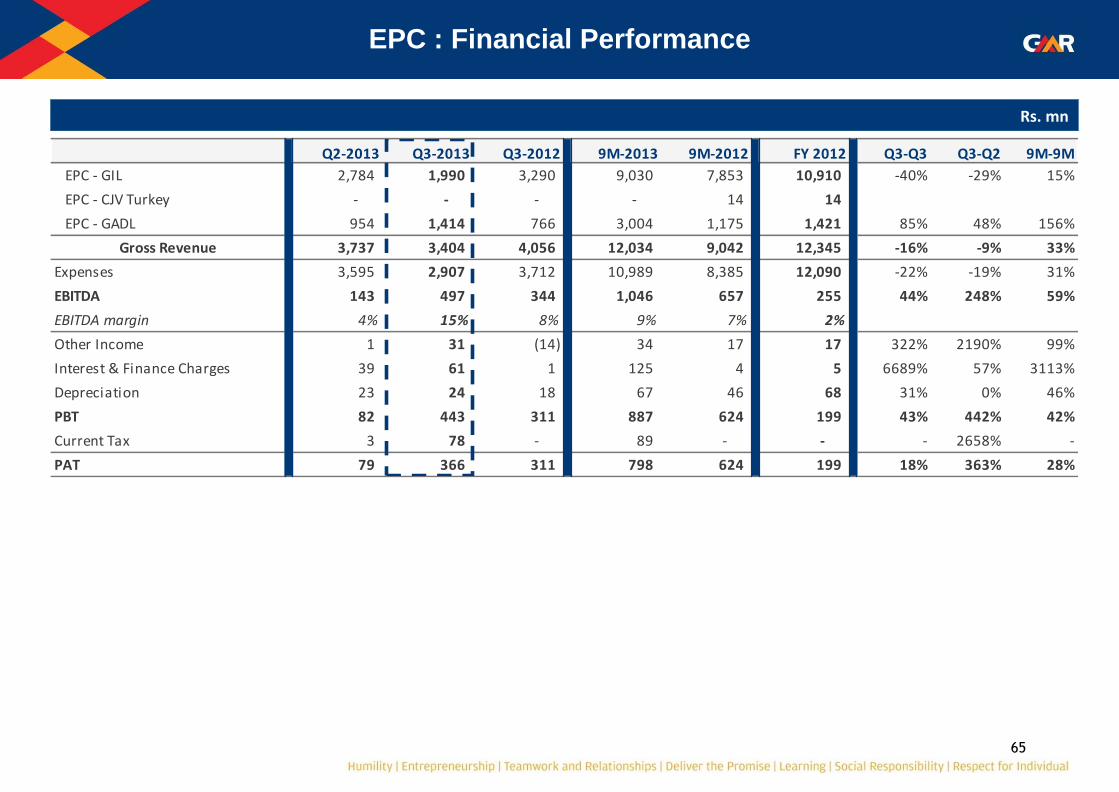
EPC : Financial Performance
Rs. mn
Q2-2013 Q3-2013 Q3-2012 9M-2013 9M-2012 FY 2012 Q3-Q3 Q3-Q2 9M-9M
EPC - GIL 2,784 1,990 3,290 9,030 7,853 10,910 -40% -29% 15%
EPC - CJV Turkey - - - - 14 14
EPC - GADL 954 1,414 766 3,004 1,175 1,421 85% 48% 156%
Gross Revenue 3,737 3,404 4,056 12,034 9,042 12,345 -16% -9% 33%
Expenses 3,595 2,907 3,712 10,989 8,385 12,090 -22% -19% 31%
EBITDA 143 497 344 1,046 657 255 44% 248% 59%
EBITDA margin 4% 15% 8% 9% 7% 2%
Other Income 1 31 (14) 34 17 17 322% 2190% 99%
Interest & Finance Charges 39 61 1 125 4 5 6689% 57% 3113%
Depreciation 23 24 18 67 46 68 31% 0% 46%
PBT 82 443 311 887 624 199 43% 442% 42%
Current Tax 3 78 - 89 - - - 2658% -
PAT 79 366 311 798 624 199 18% 363% 28%
66
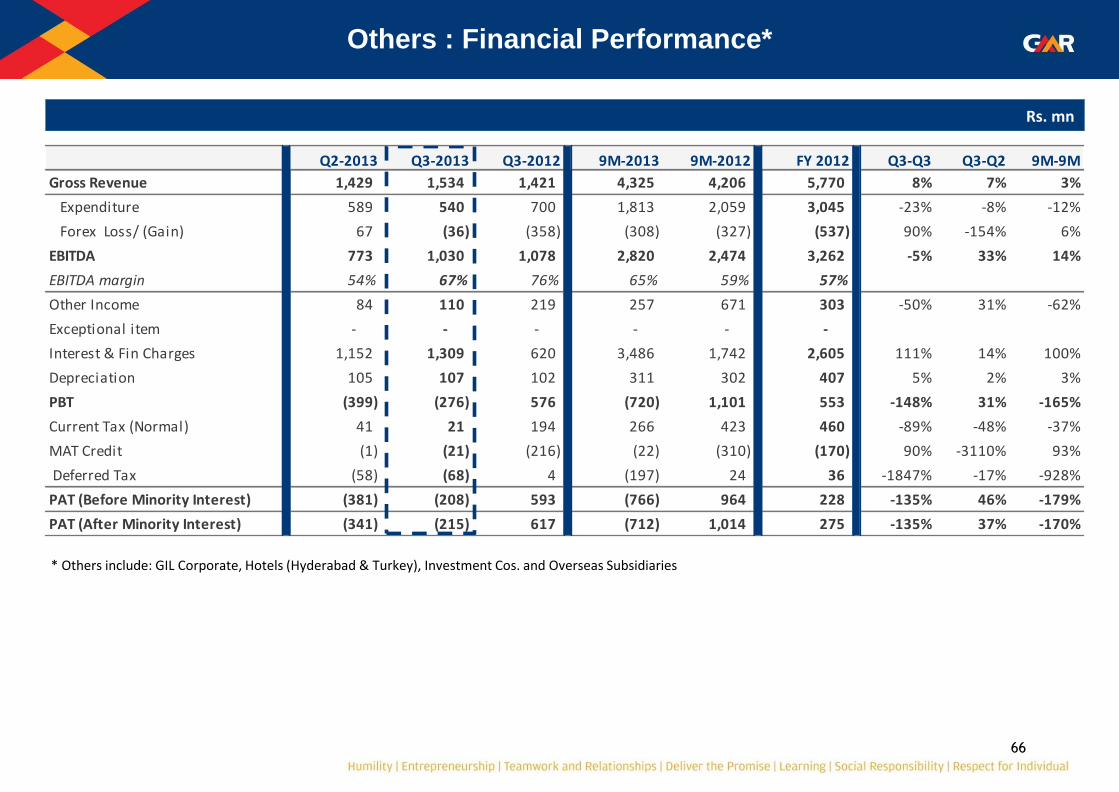
Others : Financial Performance*
* Others include: GIL Corporate, Hotels (Hyderabad & Turkey), Investment Cos. and Overseas Subsidiaries
Rs. mn
Q2-2013 Q3-2013 Q3-2012 9M-2013 9M-2012 FY 2012 Q3-Q3 Q3-Q2 9M-9M
Gross Revenue 1,429 1,534 1,421 4,325 4,206 5,770 8% 7% 3%
Expenditure 589 540 700 1,813 2,059 3,045 -23% -8% -12%
Forex Loss/ (Gain) 67 (36) (358) (308) (327) (537) 90% -154% 6%
EBITDA 773 1,030 1,078 2,820 2,474 3,262 -5% 33% 14%
EBITDA margin 54% 67% 76% 65% 59% 57%
Other Income 84 110 219 257 671 303 -50% 31% -62%
Exceptional item - - - - - -
Interest & Fin Charges 1,152 1,309 620 3,486 1,742 2,605 111% 14% 100%
Depreciation 105 107 102 311 302 407 5% 2% 3%
PBT (399) (276) 576 (720) 1,101 553 -148% 31% -165%
Current Tax (Normal) 41 21 194 266 423 460 -89% -48% -37%
MAT Credit (1) (21) (216) (22) (310) (170) 90% -3110% 93%
Deferred Tax (58) (68) 4 (197) 24 36 -1847% -17% -928%
PAT (Before Minority Interest) (381) (208) 593 (766) 964 228 -135% 46% -179%
PAT (After Minority Interest) (341) (215) 617 (712) 1,014 275 -135% 37% -170%
Consolidated Financial Performance
68
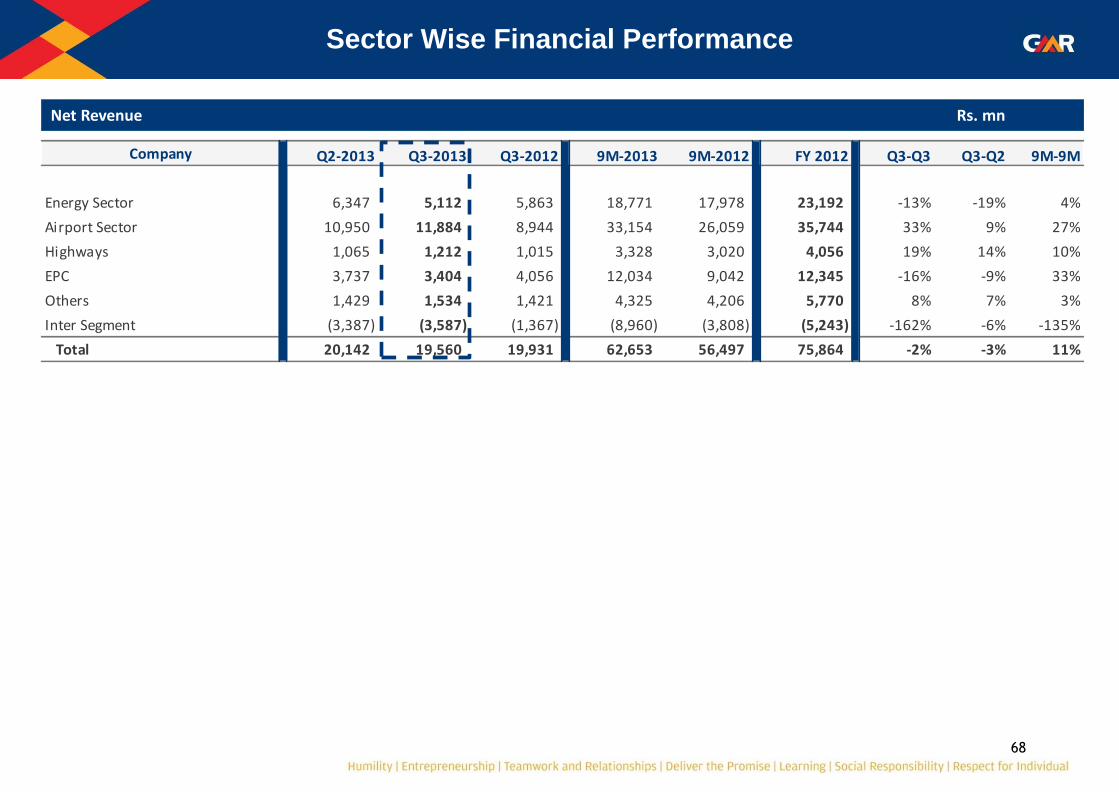
Sector Wise Financial Performance
Net Revenue Rs. mn
Company Q2-2013 Q3-2013 Q3-2012 9M-2013 9M-2012 FY 2012 Q3-Q3 Q3-Q2 9M-9M
Energy Sector 6,347 5,112 5,863 18,771 17,978 23,192 -13% -19% 4%
Airport Sector 10,950 11,884 8,944 33,154 26,059 35,744 33% 9% 27%
Highways 1,065 1,212 1,015 3,328 3,020 4,056 19% 14% 10%
EPC 3,737 3,404 4,056 12,034 9,042 12,345 -16% -9% 33%
Others 1,429 1,534 1,421 4,325 4,206 5,770 8% 7% 3%
Inter Segment (3,387) (3,587) (1,367) (8,960) (3,808) (5,243) -162% -6% -135%
Total 20,142 19,560 19,931 62,653 56,497 75,864 -2% -3% 11%
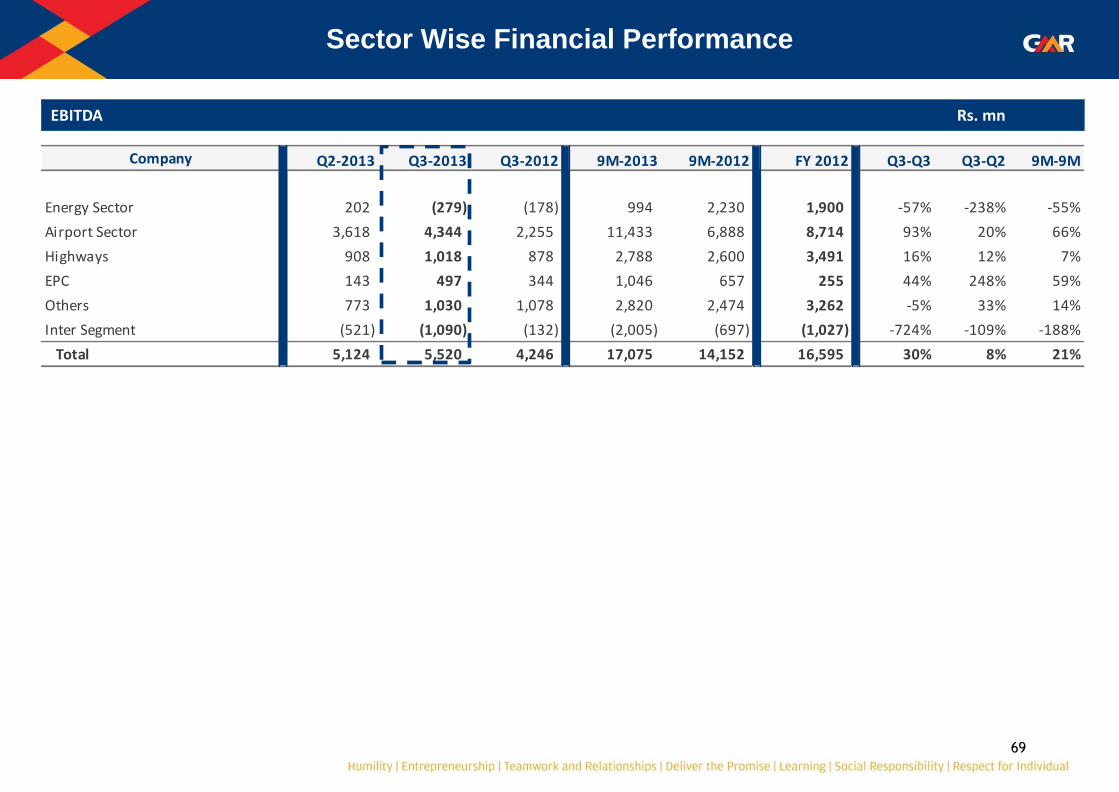
69
EBITDA Rs. mn
Company Q2-2013 Q3-2013 Q3-2012 9M-2013 9M-2012 FY 2012 Q3-Q3 Q3-Q2 9M-9M
Energy Sector 202 (279) (178) 994 2,230 1,900 -57% -238% -55%
Airport Sector 3,618 4,344 2,255 11,433 6,888 8,714 93% 20% 66%
Highways 908 1,018 878 2,788 2,600 3,491 16% 12% 7%
EPC 143 497 344 1,046 657 255 44% 248% 59%
Others 773 1,030 1,078 2,820 2,474 3,262 -5% 33% 14%
Inter Segment (521) (1,090) (132) (2,005) (697) (1,027) -724% -109% -188%
Total 5,124 5,520 4,246 17,075 14,152 16,595 30% 8% 21%
Sector Wise Financial Performance
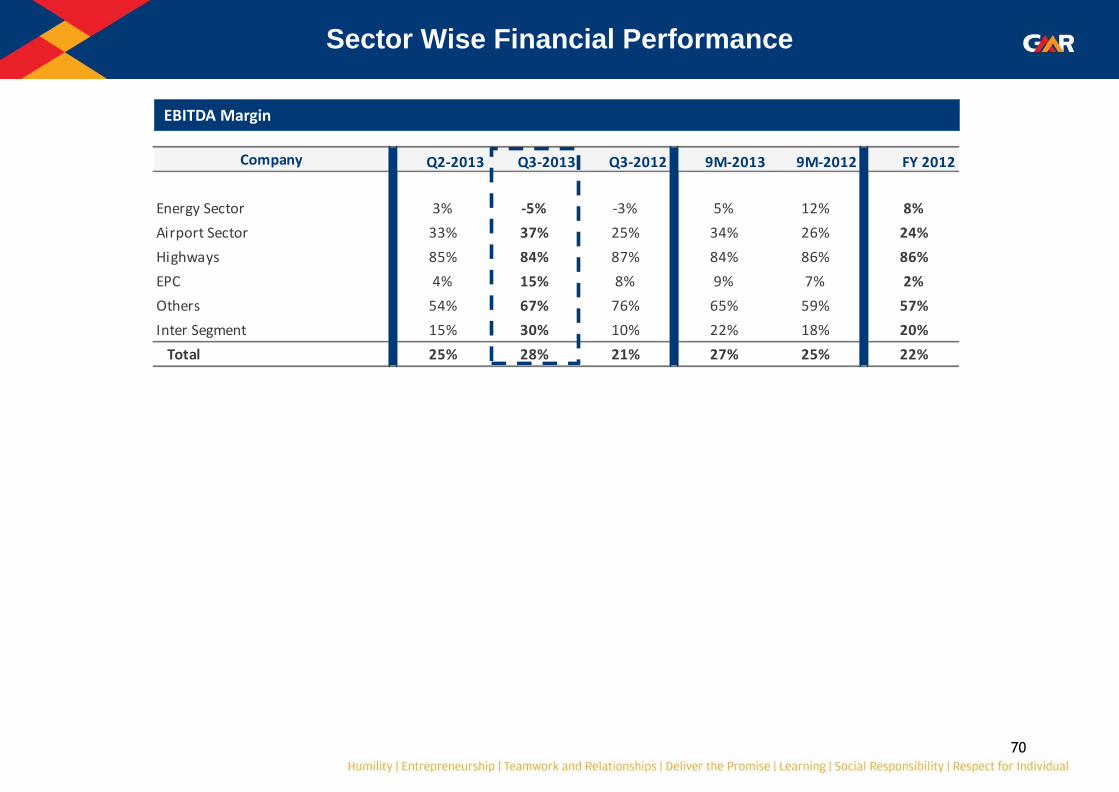
70
EBITDA Margin
Company Q2-2013 Q3-2013 Q3-2012 9M-2013 9M-2012 FY 2012
Energy Sector 3% -5% -3% 5% 12% 8%
Airport Sector 33% 37% 25% 34% 26% 24%
Highways 85% 84% 87% 84% 86% 86%
EPC 4% 15% 8% 9% 7% 2%
Others 54% 67% 76% 65% 59% 57%
Inter Segment 15% 30% 10% 22% 18% 20%
Total 25% 28% 21% 27% 25% 22%
Sector Wise Financial Performance
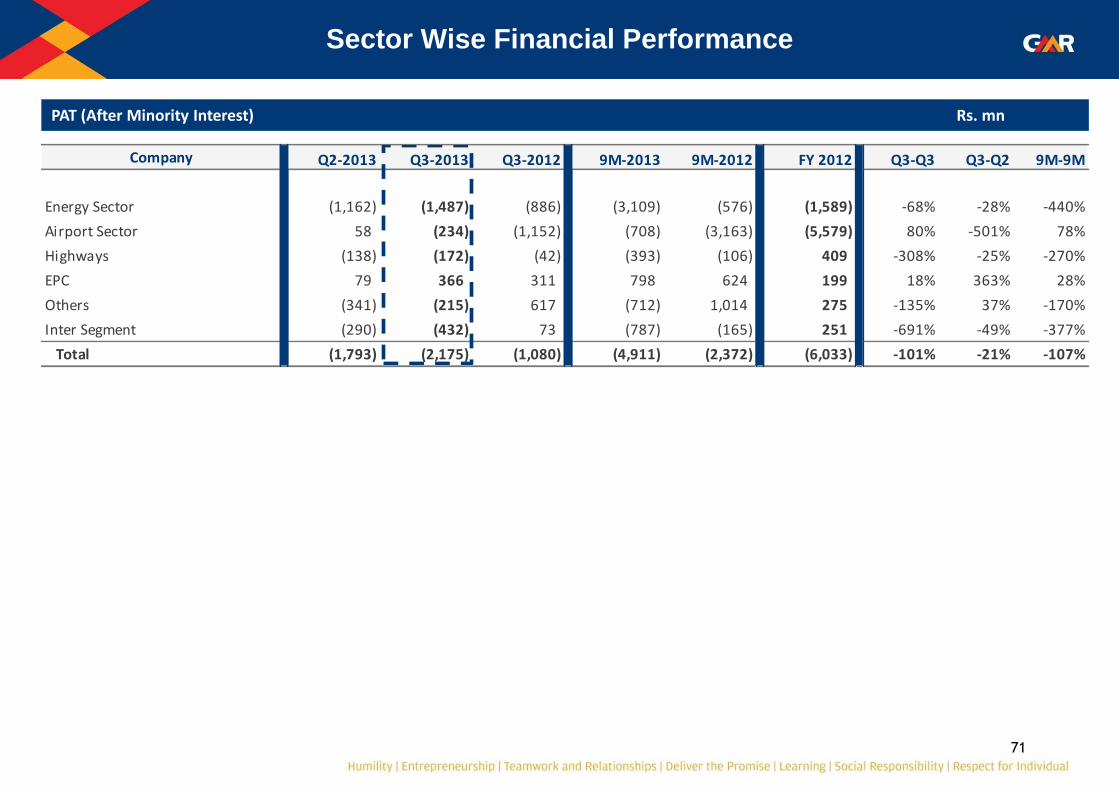
71
Company Q2-2013 Q3-2013 Q3-2012 9M-2013 9M-2012 FY 2012 Q3-Q3 Q3-Q2 9M-9M
Energy Sector (1,162) (1,487) (886) (3,109) (576) (1,589) -68% -28% -440%
Airport Sector 58 (234) (1,152) (708) (3,163) (5,579) 80% -501% 78%
Highways (138) (172) (42) (393) (106) 409 -308% -25% -270%
EPC 79 366 311 798 624 199 18% 363% 28%
Others (341) (215) 617 (712) 1,014 275 -135% 37% -170%
Inter Segment (290) (432) 73 (787) (165) 251 -691% -49% -377%
Total (1,793) (2,175) (1,080) (4,911) (2,372) (6,033) -101% -21% -107%
PAT (After Minority Interest) Rs. mn
Sector Wise Financial Performance

72
Consolidated Profitability Statement
Rs. mn
Q2-2013 Q3-2013 Q3-2012 9M-2013 9M-2012 FY 2012 Q3-Q3 Q3-Q2 9M-9M
Airports 14,691 15,985 11,130 43,909 32,507 44,054 44% 9% 35%
Power 6,450 5,206 5,980 19,118 18,420 23,750 -13% -19% 4%
Roads 1,065 1,238 1,015 3,353 3,020 4,056 22% 16% 11%
EPC 3,737 3,404 4,056 12,034 9,042 12,346 -16% -9% 33%
Others 1,429 1,534 1,420 4,325 4,206 5,770 8% 7% 3%
Less: Inter Segment (3,387) (3,587) (1,367) (8,960) (3,807) (5,246) -163% -6% -135%
Gross Revenue 23,985 23,780 22,234 73,780 63,387 84,730 7% -1% 16%
Less: Revenue Share / Rebate in
Energy3,843 4,220 2,303 11,127 6,890 8,866 83% 10% 61%
Net Revenue 20,142 19,560 19,931 62,653 56,497 75,864 -2% -3% 11%
Total Expenditure 15,018 14,041 15,684 45,577 42,345 59,268 -10% -7% 8%
EBITDA 5,124 5,520 4,246 17,075 14,152 16,595 30% 8% 21%
EBITDA margin 25% 28% 21% 27% 25% 22%
Other Income 806 659 952 2,118 2,058 2,434 -31% -18% 3%
Exceptional Item - - - - - (1,621)
Interest & Finance Charges 4,852 5,253 4,239 14,909 11,885 16,531 24% 8% 25%
Depreciation 2,565 2,581 2,431 7,676 7,372 9,358 6% 1% 4%
PBT (1,487) (1,655) (1,472) (3,391) (3,047) (8,481) -12% -11% -11%
Tax 543 495 445 1,888 1,685 2,107 11% -9% 12%
Current Tax 441 433 523 1,508 1,410 1,598 -17% -2% 7%
MAT Credit (75) (51) (221) (128) (319) (38) 77% 32% 60%
Deferred Tax 177 113 143 508 594 551 -21% -36% -14%
PAT (Before Minority Interest) (2,030) (2,149) (1,917) (5,279) (4,732) (10,588) -12% -6% -12%
Less: Minority Int. / Share of
Associates (237) 25 (837) (369) (2,361) (4,555) 103% 111% 84%
PAT (After Minority Interest) (1,793) (2,175) (1,080) (4,911) (2,372) (6,033) -101% -21% -107%
73
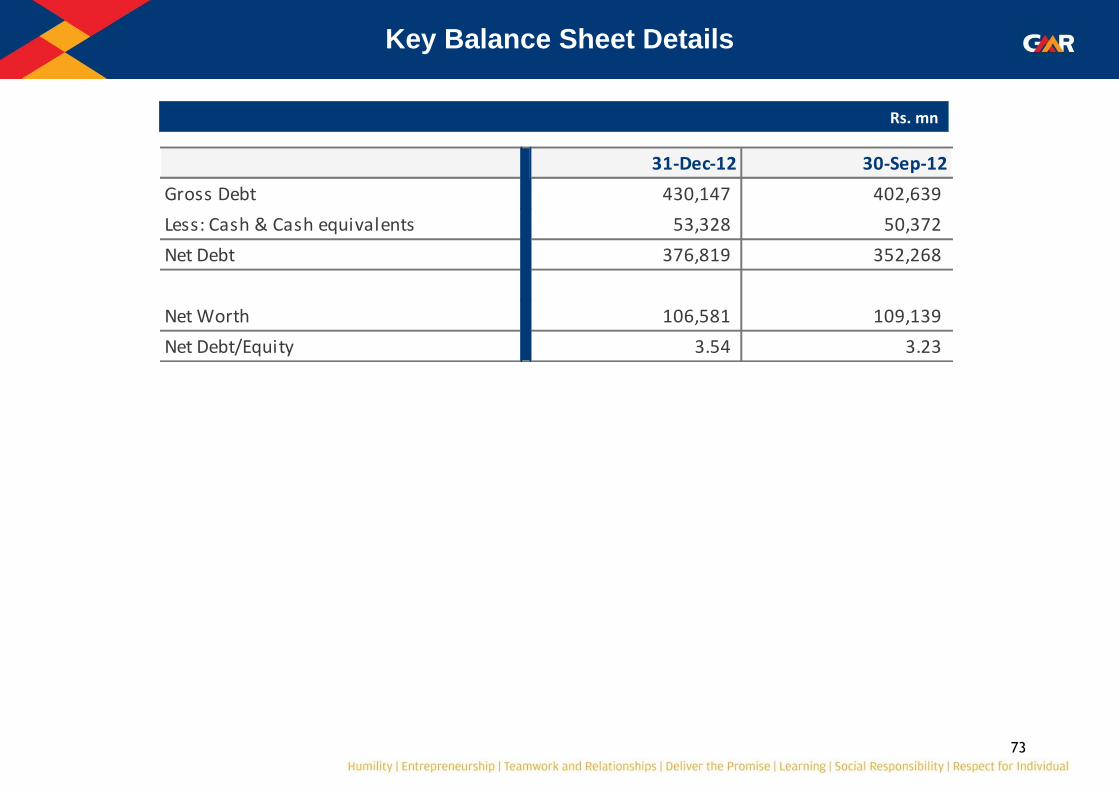
31-Dec-12 30-Sep-12
Gross Debt 430,147 402,639
Less: Cash & Cash equivalents 53,328 50,372
Net Debt 376,819 352,268
Net Worth 106,581 109,139
Net Debt/Equity 3.54 3.23
Key Balance Sheet Details
Rs. mn
Thank You
For further information, please visit
Website: www.gmrgroup.in or
Contact: [email protected]