do medical marijuana laws increase hard drug use?
TRANSCRIPT

1
Do Medical Marijuana Laws Increase Hard Drug Use?
Yu-Wei Luke Chu
Department of Economics
Michigan State University
May 27, 2013
Abstract
Medical marijuana laws generate significant policy debates regarding drug policy. In particular, if
marijuana is a complement or a gateway drug to hard drugs, these laws would increase not only
the usage of marijuana but hard drugs such as cocaine and heroin. In this paper, I empirically study
the relationships between marijuana and cocaine or heroin by analyzing data on drug possession
arrests and treatment admissions. I find that medical marijuana laws increase marijuana usage by
10–20%. However, there is no evidence that cocaine and heroin usage increases after the passage
of medical marijuana laws. In fact, the estimates on cocaine and heroin arrests or treatments are
uniformly negative. From the arrest data, the estimates indicate a 0–20% decrease in possession
arrests for cocaine and heroin combined. From the treatment data, the estimates show a 20%
decrease in heroin treatments while no significant effect on cocaine treatments. These results
suggest that marijuana could be a substitute for heroin.
JEL Classification: I10 I18 H75 K42
Keywords: cocaine, heroin, illegal drug use, marijuana, medical marijuana laws
2
“I believe that marijuana is a gateway drug.” John McCain, U.S. Senator, meeting at Milton, New
Hampshire, August 11, 2007
“I believe marijuana should be illegal in our country. It is the pathway to drug usage by our
society, which is a great scourge—which is one of the great causes of crime in our cities.” Mitt
Romney, JD, former Governor of Massachusetts, speaking to students at St. Anselm Institute of
Politics in Manchester, New Hampshire, Oct. 4, 2007
1. Introduction
The notion that marijuana is a gateway drug, or more generally a complement to hard drugs,
is an important but controversial justification for marijuana prohibition and has had a strong
influence on U.S. drug policy. The literature on the gateway hypothesis in past decades is huge
however, the causal link is still not well established. A key difficulty in identifying the causal effect
of marijuana on hard drug use is to find a mechanism that generates arguably exogenous variations
in marijuana consumption. Ethical and legal constraints prevent running controlled experiments
on illegal drugs using human subjects, but even the evidence from animal experiments is not
conclusive (Ellgren et al., 2006; Solinas et al., 2004). Therefore, the original proposer of gateway
hypothesis, Denise B. Kandel, concludes that, without a clear neurological mechanism, the
evidence is at best mixed (Kandel, 2003).
Medical marijuana legislation represents a major change in U.S. policy towards marijuana
in recent years. As of March 2013, 18 states and the District of Columbia had passed laws that
allow individuals with designated symptoms to use marijuana for medical purposes. Although the
direct effects of these medical laws are limited to legal patients, it is a popular belief that
legalization has increased illegal marijuana use among non-patients as well (Leger, 2012;
O'Connor, 2011). Not only might the associated stigma diminish, but people may perceive lower
health and legal risks of smoking marijuana. Some evidence also suggests that the leaking of
medical marijuana from legal patients or dispensaries may be common (Salomonsen-Sautel et al.,
2012; Thurstone et al., 2011). In fact, lobby groups behind these laws such as the National
Organization for the Reform of Marijuana Laws (NORML) consider such legislation to be the first
step towards full legalization, and two medical marijuana states, Colorado and Washington,
successfully passed referenda to legalize marijuana for recreational use in November 2012.
3
The potential effects of legalization on marijuana and hard drug use are not only policy
relevant, but they can provide evidence on the relationship between marijuana and other substances.
Some empirical evidence suggests that marijuana consumption has increased after medical
marijuana legalization. For example, Anderson et al. (2012b) find that the prices of high-quality
marijuana are decreasing over time. Chu (2012) shows that these medical marijuana laws are
associated with an increase in marijuana possession arrests and treatment referrals. The notion that
marijuana is a gateway drug leads many people to be concerned that the use of hard drugs, such as
cocaine and heroin, will consequently increase. In fact, it is one of the major reasons for federal
agencies like the Drug Enforcement Administration (DEA) and the Office of National Drug
Control Policy (ONDCP) firmly opposing such medical marijuana laws and to continue listing
marijuana as a Schedule I drug (Drug Enforcement Administration, 2011).
To examine whether medical marijuana laws––and the associated increase in marijuana
use––affect cocaine and heroin usage, I study drug possession arrests from the Uniform Crime
Reports (UCR). As the arrest data do not distinguish cocaine and heroin, and they could be
potentially biased by changes in law enforcement, I also study treatment admissions that are not
referred by the criminal justice system from the Treatment Episode Data Set (TEDS). Although
these datasets do not follow individuals over time, these data have many advantages. First, by
focusing on drug arrestees and treatment patients rather than the general population, these data
provide much more observation of hard drug users. Based on the National Survey on Drug Use
and Health (NSDUH), the past month’s prevalence rates in the U.S. are only around 1–2% for
cocaine and 0.2% for heroin. The low prevalence rates suggest that the sample sizes at the state
level in most representative datasets are probably not large enough to have statistical powers. For
instance, even for the largest survey, the NSDUH, the sample sizes in most states are only 900
people (600 for adults). In contrast, the UCR arrest data are available even at the city level, and
the TEDS data contain 1.5 to 2 million substance admissions each year in which cocaine and heroin
account for 40% of the admissions. In addition, these data are objective measures and they do not
suffer from the self-reporting bias that is common in survey data (Golub et al., 2005; Harrison and
Hughes, 1997). This is a particular concern in the current context. These medical marijuana laws
are expected to change the perception of marijuana. Indeed, Miller and Kuhns (2011) find that
arrestees report marijuana usage more honestly after the passage of medical marijuana laws. If

4
these laws also reduced the stigma on other illicit drugs, there could be a spurious relationship
between marijuana and cocaine or heroin due to people changing their reporting behaviors.
I estimate reduced-form models for the effects of these laws, controlling for city and year
fixed effects as well as city-specific time trends. Assuming that unobservables related to arrests or
treatments do not deviate from a city or a state’s trend when states enact medical marijuana laws,
this approach will uncover the causal effects of these laws. To preview the results, I find strong
evidence supporting the popular belief that marijuana use has increased after the passage of
medical marijuana laws. However, in contrast to what the gateway theory predicts, I do not find
any evidence that cocaine and heroin arrests or treatments have increased. In fact, all of the
estimates show negative signs, suggesting that medical marijuana laws could have a negative effect
on hard drug use. Specifically, the results from the UCR arrest data indicate that, on average,
medical marijuana laws are associated with about a 15–25% increase in marijuana possession
arrests among adult males. The estimates on possession arrests for cocaine and heroin combined
are uniformly negative, while the magnitudes fluctuate from close to zero to a 10–25% decrease,
depending on model specifications. From the TEDS treatment admission data, I also find a similar
increase in marijuana treatment admissions of roughly 10%. On the other hand, I find a 15–20%
decrease in heroin treatment admissions, and no significant effect on cocaine treatment admissions.
This research is important for several reasons. First, this paper employs a new policy tool—
medical marijuana laws—for detecting the effects of marijuana on hard drug use. Most of the
previous studies either use instrumental variables such as marijuana penalty and state excise taxes
on beer, or they model individual heterogeneity econometrically. All of these approaches have
clear limitations in the context of drug consumption. Second, the causal effects of medical
marijuana laws on marijuana and hard drug usage are at the core of the current policy debate. In
addition, as treatment patients are heavy users who are associated with negative health and social
outcomes, understanding the causal effects among this population is particularly relevant to the
design of policy. Finally, the results indicate some direct costs incurred by these medical marijuana
laws, such as the increase in marijuana treatments, while they also suggest that some unintended
positive externalities may exist. Future cost and benefit analysis may utilize these findings to
obtain more precise estimates for the impacts of these medical marijuana laws.

5
The paper proceeds as follows: Section 2 briefly describes the medical marijuana laws and
Section 3 reviews the relevant literature. I discuss the data and results from the UCR arrests in
Section 4, and those from the TEDS treatment admissions in Section 5. Section 6 concludes.
2. Medical Marijuana Laws
An overview for state medical marijuana laws is in Table A of the Appendix. Medical
marijuana laws permit patients with legally designated diseases and syndromes to use marijuana
as a treatment. The designated symptoms are often as follows: AIDS, anorexia, arthritis, cachexia,
cancer, chronic pain, glaucoma, migraines, persistent muscle spasms, severe nausea, seizures, and
sclerosis. Some laws, such as the one in California, however, allow use for “any other illness for
which marijuana provides relief” (Cohen, 2010). Patients can legally possess marijuana up to a
fixed amount. In many states, they can cultivate marijuana on their own. These laws also allow
“caregivers” (most of whom are patients as well) to grow and provide marijuana to patients on a
not-for-profit basis. In most states, it is mandatory to register and renew the registration every year
to be a qualified medical marijuana patient or caregiver.1
In principle, these medical marijuana laws only provide legal protection for patients and
caregivers, and do not change the legal status of non-medical use of marijuana. However, there is
a huge grey area and the legal boundary is blurred by these loosely worded laws (Cohen, 2010). It
is probably done intentionally by the legalization lobbyists behind these laws, such as the NORML,
who consider such legislation the first step towards full legalization. A significant example of the
inherent grey legal area in these laws is marijuana dispensary. As most state medical marijuana
laws do not directly authorize marijuana dispensaries, they only exist under the name of caregiver
or patient cooperative, but how prevalent they are largely depends on the attitude of the local
government. For example, San Diego County has very a restrictive policy towards dispensaries
and its law enforcement organizations actively cooperate with the DEA; even the only county-
licensed dispensary was forced to close in 2012 (Anderson, 2012). In contrast, there are more
marijuana dispensaries than Starbucks coffee shops or CVS pharmacies in Los Angeles and San
Francisco (Coté et al., 2008). Yet local attitude and law enforcement could change from time to
1 California created a registration program in 2004 but registration is voluntary. Colorado allows patients who do not
join the registry to use the "affirmative defense of medical necessity" if they are arrested on marijuana charges. Maine
passed an amendment in November 2009 that created a registration program and required mandatory registration
starting January 1, 2011. Washington does not have a registration program.
6
time. For instance, Los Angeles ordered the closure of over 70% of the 638 dispensaries then
operating in the city in June 2010.
Some ambiguities for low-level marijuana possession offense also exist. For example,
California only requires patients possessing a "written or oral recommendation" from their
physician, even without the recommendation to be documented. In general, there has been a
softening in public attitude toward marijuana in medical marijuana states, and the federal agencies
complain that the cooperative relations between federal and local law enforcement are
deteriorating (GAO, 2002). For instance, cities like Denver or Seattle passed referenda to either
legalize marijuana or make marijuana possession offenses the lowest enforcement priority. On the
other hand, direct impacts on enforcement towards low-level possession offenses appear to be
small due to a small number of legal patients. Except for California, the number of legal patients
and marijuana dispensaries remained relatively small prior to 2009 (ProCon.org, 2012). 2 To
alleviate the tension between the federal and state governments, in 2009, the Obama administration
stated that the federal agencies will no longer seek to arrest medical marijuana users and suppliers
so long as they conform to state laws. Since then, the number of registered patients and dispensaries
increased significantly (Caplan, 2012; Mikos, 2011; Sekhon, 2009). Although this statement
appeared to largely resolve the legal dispute between state and federal governments, the Obama
administration’s medical marijuana policy began to reverse in 2011, and there have been several
cases of DEA raids on medical marijuana dispensaries that conform to state laws (Dickinson, 2012).
3. Literature Review
An extensive literature on the relationship between marijuana and hard drugs has yielded
many hypotheses but little consensus. I do not attempt to provide a comprehensive survey of the
literature but rather to focus on some more recent studies that adopt different methodologies.
A straightforward question for economists is whether marijuana is a substitute or a
complement to other hard drugs. For example, Saffer and Chaloupka (1999) and Grossman and
Chaloupka (1998) estimate demand functions for marijuana and cocaine, and they find that cocaine
price is negatively correlated with marijuana use and the status of marijuana decriminalization is
positively associated with cocaine use, suggesting that they are complements. On the other hand,
2 Although there is no official number of patients for states without registration, based on the large number of
dispensaries, it is believed that California has many more patients than other medical marijuana states.
7
recent studies based on laboratory control experiments show a more complex pattern, even though
external validity could be a concern due to the small sample sizes. The relationships between drugs
seem to depend on different types of drug users. Jofre-Bonet and Petry (2008) find that marijuana
is a complement to heroin for heroin addicts but a substitute for heroin for cocaine addicts. Petry
(2001) finds that marijuana consumption is independent from cocaine for alcoholics, while Petry
and Bickel (1998) find marijuana is a substitute for heroin for opioid-dependent patients.
Based on the classical framework from Becker and Murphy (1988), the gateway hypothesis
is a special case of intertemporal complementarity between marijuana and hard drugs. Popularized
by Kandel’s (1975) influential paper published in Science, the gateway hypothesis is based on one
of the most robust empirical observations: most hard drug users have started with less dangerous
drugs and there seems to be a “staircase” stepping from marijuana (or legal substances like alcohol)
to cocaine and heroin. A gateway effect might be indeed causal through physiological or
psychological demand for stronger drug-induced pleasures and experiences for which Becker and
Murphy (1988) call consumption capital (of addictive drugs). In addition, a gateway effect could
come from social interactions like gaining access to hard drugs due to participation in the illegal
drug market (MacCoun, 1998).3
The incapability of running control experiments makes it extremely difficult to empirically
establish the causality due to unobserved heterogeneity. DeSimone (1998) uses marijuana
penalties, beer taxes, and the presence of alcoholic parents as instrumental variables, and finds
strong evidence for marijuana being a gateway drug for cocaine. Fergusson et al. (2006a) also find
strong evidence using longitudinal data and controlling for individual fixed effects (see also
comments from Kandel et al. (2006), Maccoun (2006) and Fergusson et al. (2006b). Due to the
difficulty of finding a valid instrument, some studies try to econometrically model unobserved
heterogeneity. These studies generally find that unobserved heterogeneity is an important factor,
but whether marijuana is a gateway drug remains unclear. For example, Pudney (2003) does not
find a gateway effect after accounting for unobserved heterogeneity, while some other studies find
marijuana is a gateway drug for cocaine (Bretteville-Jensen et al., 2008; Melberg et al., 2010; van
Ours, 2003). Another strand of studies from epidemiology utilizes data on twins and finds a
3 Note that if a gateway effect is working through social interactions, then legalization of soft drugs and separating
their markets from hard drugs would be a better policy. This is actually the rationale behind the policy in the
Netherlands that allows legal sale of marijuana in “coffee-shops.”

8
positive relationship between early marijuana use and the use of other illicit drugs (Agrawal et al.,
2004; Lynskey et al., 2006; Lynskey et al., 2003). However, as in the critiques made by Bound
and Solon (1999), one potential problem in these twin studies is that the causes for observably
identical twins to make different choices are unlikely to be exogenous. Since even evidence from
animal experiments is not conclusive (Ellgren et al., 2006; Solinas et al., 2004), Kandel (2003)
concludes that the existing evidence for the gateway effect is at best mixed due to the lack of a
clear neurological mechanism.
4. Results from the UCR Arrest Data
4.1. UCR data
The data on drug possession arrests are from the FBI's Uniform Crime Reports (UCR) for the
years 1992 through 2008. Although variation in drug arrests is subject to law enforcement, arrest
data remain the single most widely available indicator of illegal drug use within and across
jurisdictions in the United States. Studies from criminology show that drug arrests are generally
valid measures for illicit drug activities, especially for cocaine and heroin. (Moffatt et al., 2012;
Rosenfeld and Decker, 1999; Warner and Coomer, 2003). The UCR arrest data provide monthly
information on arrest counts by age, gender, and race in each crime category along with agency
populations (estimated from the Census) for state and local police agencies. Note that each arrest
count does not necessarily represent a single individual since a person may be arrested multiple
times. So, conceptually, the measure reflects changes in both the intensive and extensive margins.4
There are four categories in drug possession arrests, including one category for marijuana and one
for powder cocaine, crack cocaine, heroin, and other opium derivatives together.5 In this section,
I denote the latter category by "cocaine" arrest for brevity as cocaine is the most popular drug
among these drugs. As the crack epidemic ended around the early-to-mid 1990s (Drug
Enforcement Administration, 1991; Fryer et al., 2010), and to be consistent with the starting point
in the TEDS data, I use data on possession arrests from the years 1992 through 2008.6
4 We can model arrests as follows: 𝐴 = ∑ 𝑃𝑖 ∗ 𝑁
𝑖=1 𝐹𝑖, where 𝐹𝑖 is individual i’s transaction or use frequency, N is the
number of users, and 𝑃𝑖 is the probability of being arrested per transaction or use for an individual i. Suppose 𝑃𝑖 = 𝑃
and take logarithm, then log(A) = log(P) + log(�̅�) + log(N), where �̅� is the average of 𝐹𝑖 . Therefore, arrests reflect
effects on both the extensive and intensive margins. 5 The other two subcategories are "truly addicting synthetic narcotics" and "other dangerous non-narcotic drugs" (most
of this category are methamphetamines). 6 Although data through 2010 became available recently, looking at the period prior to 2009 has an advantage in that
the number of legal patients was relatively small, and the federal policy was fairly uniform prior to the Obama
9
I use yearly aggregated arrest data provided by the Inter-university Consortium for Political
and Social Research (ICPSR), as the FBI also reviews and checks the data using annual arrest
totals (Akiyama and Propheter, 2005). Since participation in the UCR program is generally
voluntary, many agencies do not report in every month or every year; even when an agency reports,
it may not report data in all categories. One problem is that it is not possible to distinguish a true
zero from missing data. Empirically, however, most missing data is from agencies with small
populations and those that do not report for a whole year (Lynch and Jarvis, 2008). In this paper,
I focus on police agencies located in cities of more than 50,000 residents because the FBI regularly
checks and communicates with these agencies to ensure data quality (Akiyama and Propheter,
2005). Since population is generally increasing over time, I include earlier observations of the
above cities to make the panel more balanced if their populations are no less than 25,000. Similar
to Carpenter (2007), and as is common in the criminology literature, I focus on adult male arrests,
and use city-years only if a city reports arrests for marijuana or cocaine possession for at least six
months in that year.7 (I include city-year observations that report only in December since some
agencies may report annually.) The sample covers nine medical marijuana states that passed laws
before July 2008, including Alaska, California, Colorado, Hawaii, Maine, Montana, Nevada, New
Mexico, Oregon, Rhode Island, and Washington; Vermont is also not in the sample because no
city from Vermont in the UCR has a population greater than 50,000. (Michigan passed its law in
November 2008 and is coded as a non-medical marijuana state).
Similar to Carpenter (2007) and Fryer et al. (2010), I create arrest ratios of marijuana or
cocaine possession arrests to all offense arrests among adult males. Although arrest rate is
straightforward and commonly used, the measure of arrest ratios can partially account for
unobserved changes in local law enforcement and measurement errors in arrest rates from
estimated populations. In addition, as the resources of law enforcement are mostly limited, the
arrest ratios can capture fluctuations in arrests due to changes in total resources available.
administration. In addition, severe economic recession may affect drug use, and theoretically the direction is
ambiguous (Bretteville-Jensen, 2011). As of December 2012, most states that passed laws after 2008 have not yet
accepted patient applications. (Only Arizona began to accept patient applications since April 2011). 7 I only consider males both to be consistent with the existing literature and because males are much more likely to be
in the criminal justice system than are females. For example, the possession arrest rates for adult males in my sample
are four to seven times that for adult females. Cocaine and heroin uses among juveniles are relatively low. In addition,
the juvenile justice system is very different from the adult system in areas such as its procedures, incentives, and
sanctions (Carpenter, 2007; Levitt, 1998; Terry-McElrath et al., 2009).
10
Table 1 lists the means and standard deviations of the arrest ratios of marijuana and cocaine
possession among adult males (age 18 and above). The upper panel is for marijuana and the lower
panel is for cocaine. In both panels, the first rows are for all states, the second rows are for states
without effective medical marijuana laws before July 2008, and the third rows are for states with
effective medical marijuana laws before July 2008, excluding California and Colorado. In the
upper panel, the marijuana arrest ratio is lower in medical marijuana states than in non-medical
marijuana states. Because marijuana prevalence rates are higher in medical marijuana states from
survey data such as the NSDUH, the lower arrest ratio suggests that the level of law enforcement
towards marijuana is probably lower in these states. Medical marijuana states excluding California
and Colorado also show lower cocaine arrests. However, even though cocaine usage rates in
medical marijuana states tend to be higher from the NSDUH, it is not clear to what extent the lower
arrest ratios are attributed to law enforcement. As the past-month cocaine use rate is only around
2%, the state-level estimates from the NSDUH may not be precise enough for comparisons. Note
that marijuana arrest ratios are only roughly 1.5 times higher than cocaine arrests, while the
prevalence rates of marijuana are five to seven times higher than those of cocaine. It suggests those
marijuana arrestees may be quite different from general marijuana users in the survey data. As the
marijuana arrests are highly correlated with marijuana treatments, with correlation coefficients
around 0.3–0.5, many of the marijuana arrestees are probably also heavy users who make regular
transactions and therefore are subjected to higher arrest risks.
The descriptive statistics of California and Colorado are separated in the last two rows. As
most dispensaries were located in California and Colorado prior to 2009, and the penalty in these
two states for low-level possession was the lowest in the U.S. with only $100 max fine (Pacula et
al., 2010), the legalization effects and potential reactions of law enforcement could be different
from other medical marijuana states. In fact, California has the highest drug possession arrest ratios
among all states, but its marijuana arrest ratios are some of the lowest, suggesting that enforcement
in California is probably very lenient towards marijuana but focuses on other hard drugs. The
situation might be similar in Colorado. In fact, Colorado attorney general, John W. Suthers, even
said about the medical marijuana law in Colorado, “In Colorado it’s not clear what state law is”
(Johnson, 2009). Since California has many more observations than any other states, and Colorado
has the second largest observations among the medical marijuana states, I will study these two
states separately to see if there are any heterogeneous effects.
11
Do marijuana and cocaine possession arrests represent underlying drug use? Graphical
evidence at the national level suggests that they do. Figure 1 plots the yearly averages of the ratio
of marijuana and cocaine possession arrests to all offense arrests along with marijuana or cocaine
prices per gram. The marijuana prices are from the 2012 National Drug Control Strategy Data
Supplement, and the cocaine prices are the median prices in each year from the DEA's System to
Retrieve Information from Drug Evidence (STRIDE).8 In both figures, the prices move in the
opposite direction to the arrests, which is consistent with a supply curve moving along a downward
sloping demand curve.
4.2. Results
My primary empirical strategy involves estimating city- and year-specific drug possession
arrests as a function of whether the state has an effective medical marijuana law in place in that
year. I begin by estimating the following model by OLS:
(1) Yist = β Lawst + City fixed effectsi + Year fixed effectst + City time trendsit + εist ,
where Yist is the logarithm of marijuana or cocaine arrest ratios among adult males for city i in state
s and year t. Lawst is a dummy variable indicating whether a state s had a medical marijuana law
during year t.9 In addition to city and year fixed effects, I include city-specific time trends to
capture the time-varying unobservables like law enforcement within a city. As there are many
small values, especially for cocaine arrests, I also estimate the same specification by a fixed effect
Poisson model to check the robustness of functional form. Because city-specific time trends and
fixed effects already account for any smooth-trending variables, and there are missing data in some
control variables, I do not include control variables in the main specification. Throughout this
paper, the estimated standard errors are clustered at the state level and therefore are robust to serial
correlation, within-state spatial correlation, and heteroskedasticity.
8 The cocaine prices are calculated by the author. The average cocaine prices that exclude some extreme values are
similar to median prices. See Horowitz (2001) and Arkes et al. (2008) for discussions on the STRIDE data. 9 There is normally a time lag between passing a referendum and it becoming an effective law (see Table A). There
were examples that the referendum was delayed (ex: Nevada) or even vetoed (ex: Arizona in 1996) by the state
government. Throughout this paper, the coding of Lawst is based on the effective date. For the first year, Lawst equals
1 if the law is effective before July 1st, and equals 0 otherwise.
12
Table 2 shows the estimates for medical marijuana laws on marijuana arrests among adult
males. The first two columns, Column (1) and (2), show the estimates of β based on Equation (1).
The estimates are positive and highly significant. If we interpret the log points as a percentage
change, medical marijuana laws, on average, result in a 14.2–14.5% increase in the ratio of
marijuana to all arrests among adult males. As California and Colorado account for more than 80%
of observations in medical marijuana states, it is a concern that the positive estimates in Columns
(1) and (2) are entirely driven by the effects of medical marijuana laws in these two states. So I
separately estimate the effects of California and Colorado laws by including CA Law and CO Law,
two interaction terms of Lawst and dummies for California and Colorado. These results are
presented in Columns (3) and (4). The estimates for CA Law and CO Law are actually negative,
and the estimates of Lawst are significantly larger than estimates in Column (1) and (2). Specifically,
based on the specification with quadratic city time trends, conditional on California and Colorado,
medical marijuana laws, on average, result in a 26.3% increase in the ratio of marijuana arrests to
all arrests, among adult males. To check robustness, Columns (5) and (6) shows the estimates of
marijuana and cocaine arrests when a set of city- and state-level control variables are included.10
Since these results are nearly identical, it suggests that fixed effects and city-specific time trends
have accounted for most of the variations from these controls. In the last two columns, (7) and (8),
to check whether the results are sensitive to functional forms, I estimate the effects of medical
marijuana laws by a fixed-effect Poisson model. The results are similar and they are not sensitive
to different functional forms.
In Table 3, I estimate the legalization effects on cocaine arrests; all columns are based on
the same specifications as those in Table 2. Somewhat surprisingly, all of the estimates of β are
negative for cocaine arrests in Table 3. It does not support the gateway hypothesis or the notion
that marijuana and cocaine or heroin are complements. In Columns (1) and (2), based on the full
sample that includes California and Colorado, the estimated effects of laws on cocaine arrests are
negative, small, and insignificant, suggesting no effect of these medical marijuana laws on cocaine
arrests. In Columns (3) and (4), the estimated legalization effects are more negative when
10 The city-level control is the logarithm of city police officer rates per city residents (from the UCR). The state-level
controls include black male rates, unemployment rates, per capita local and state expenditures on police protection (in
logarithm), per capita local and state expenditures on health and hospital expenditures (in logarithm), and state 0.08
blood alcohol content laws. The sample sizes are smaller because 2001 and 2003 data on government expenditures
were not developed by the Census Bureau due to sample redesign.
13
California and Colorado are excluded, but the estimated standard errors are also larger. If we take
the face value of these estimates, conditional on these two states, medical marijuana laws are
associated with a 12.3−13.5% decrease in the ratios of cocaine arrests to all arrests. The next two
columns, (5) and (6), shows quantitatively similar estimates when the city and state level control
variables are included. In the last two columns, (7) and (8), the estimates from fixed-effect Poisson
models are still negative while the magnitudes are even larger.
From Table 2, the estimates indicate that the legalization effects on marijuana arrests in
California are positive but smaller than in other medical marijuana states. For example, based on
Column (4), the estimates indicate a 13.1% (0.263–0.132) increase in the marijuana arrest ratio.
However, as the estimates for CA Law are generally not significant, the legalization effects in
California on marijuana are not statistically different from other medical marijuana states. The
legalization effects on cocaine arrests show a similar pattern. The estimates for California are
smaller (in absolute terms) but insignificantly different from other medical marijuana states. From
Table 3, the estimates indicate a 6.0–4.7% decrease in cocaine arrests after California passed its
medical marijuana law. In Figure 2, the upper graph shows the yearly averages of marijuana and
cocaine ratios in California. Marijuana arrests were steadily increasing over time until 2000 and
then slightly decreased until 2004. Although there was no significant change in marijuana arrests
around the time (1996) in which California passed its medical marijuana law, marijuana arrests
did show a significant increase beginning in 2005, which is consistent with the time that many
dispensaries began to exist in California. On the other hand, consistent with the small estimated
effects, cocaine arrests are roughly stable overtime, although they also show a slightly decrease
after 2005.
In contrast, in Colorado, the legalization effects are negative on marijuana arrests and
positive on cocaine arrests, and they are significantly different from other medical marijuana states.
For example, based on Column (4) in Table 2 and Table 3, the estimates indicate an 11.1% decrease
in marijuana arrest ratios and a 33.9% increase in cocaine arrest ratios. Although I cannot rule out
that marijuana use decreased and cocaine use increased in Colorado, as the comment from the
Colorado attorney general suggests (page 10), the negative (positive) estimates in marijuana
(cocaine) arrests could be driven by some unobservables such as changes in law enforcement. To
see the change in marijuana and cocaine arrests overtime, in Figure 2, I plot the yearly averages of
marijuana and cocaine arrest ratios in Colorado. We can see that the ratios of marijuana arrests to
14
all arrests temporarily dropped around the 2001, in which Colorado enacted its medical marijuana
laws. Nevertheless, marijuana arrests indeed increased again after 2002. Interestingly, cocaine
arrest ratios in Colorado do move opposite to marijuana arrest ratios.
Figure 3 presents graphical evidence on the effects of medical marijuana laws on cocaine
arrests. The upper graph is based on the restricted sample without California and Colorado. The
graph shows the averages of cocaine arrest ratios before and after the medical marijuana laws
became effective, where the X-axis measures the year relative to the state’s law change, with 0
denoting the first year of passing the law, 1 denoting the following year, and so on. To create a
synthetic control group, I compute the average arrest ratios in non-medical marijuana states for
each year, and then take a weighted average of these yearly averages, in which the weights come
from the relative composition of each year in the treatment group (medical marijuana states). For
example, for “Year 0” in the upper figure, 55% of observations in the treatment group are from
Alaska, Oregon, and Washington, which passed the laws in 1998 (coded as 1999), so the weight
put on the average of year 1999 in the control group is 0.55. In other words, in “Year 0,” 55% of
the observations in the control group are selected from year 1999. In the upper graph, the arrest
ratios in both the control and treatment groups are fairly flat before legalization; after the passage
of medical marijuana laws, the arrest ratios seem to be decreasing over time in medical marijuana
states (without California and Colorado), while they are roughly stable in other states. For
completeness, in the lower graph of Table 2, I also create the same graph for the full sample
including California and Colorado. However, as the treatment group is mostly driven by California,
the graph looks almost identical to Figure 2 and it does not show any significant effect on cocaine
arrests.
To further investigate the dynamic responses of cocaine arrests to the adoption of medical
marijuana laws, in Table 4, I replace Lawst by a set of dummy variables, Years 0–1 through Years
6–7, which indicate each two-year interval after the medical marijuana laws were enacted, and a
dummy, Years 8+, for the eighth year and above. To capture potential endogeneity, I also include
a dummy, Years (neg. 1–2), which indicates a two-year interval before passing laws. If drug users
need some time to progress from the gateway drug, marijuana, to cocaine or heroin, estimating the
dynamics could allow me to detect such lagged positive effects. In the first two columns, the
estimates are from the full sample, and they indicate that these laws have negative effects on
cocaine arrests that are generally decreasing over time; the estimate for Years (neg. 1–2) is small
15
and insignificant, suggesting policy endogeneity is not a particular concern. In the latter two
columns, the estimates become quite noisy when California and Colorado are excluded, but they
are qualitatively similar to the estimates in the first two columns. Overall, the estimates in Table 4
are consistent with Figure 3, and there is no evidence supporting a gateway hypothesis that
marijuana use will increase future hard drug use.
In Table 5, I check the robustness of the main results from Tables 2 and 3 based on different
constructions of samples. The upper panel is for marijuana arrests and the lower panel is for
cocaine arrests. For comparison across different samples, in Table 5, I estimate a fixed-effect
Poisson model with quadratic time trends for both the samples with or without California and
Colorado. In the first two columns, (1) and (2), I use all city-year observations regardless of the
number of reporting months. The results are similar to the estimates from the last two columns in
Table 2 and Table 3 but slightly noisier. One major drawback of the UCR arrest is the inability to
distinguish true zeros from missing data. In all previous tables, I treat any city-year observations
with zero adult male arrests as missing data. To test the robustness, in Columns (3) and (4), I treat
marijuana or cocaine possession arrests from cities that report any drug possession arrests but zero
marijuana or cocaine possession arrests as true zeros. There are many zeros, especially for cocaine
arrests. (I use all city-years regardless of the number of reporting months.) The estimates are not
sensitive to how to treat missing data and they are quantitatively similar to those in Columns (1)
and (2) or those in Tables 2 and 3. As previously mentioned, since Lawst varies only at the state
level while each observation is a city-year, states with small populations receive little weight. As
shown in Tables 2 and 3, the estimates are generally different when California and Colorado are
excluded. To ensure that the results are not driven solely by larger states, in the last two columns,
(5) and (6), I average marijuana or cocaine arrest ratios to the state level, so each state receives
equal weight regardless of the number of city-years (based on the samples from Table 2 and 3).
For the full sample, as expected, the estimates based on the state averages are larger (in absolute
terms). However, for the restricted sample, the estimates from state-level averages are
quantitatively similar to those in Table 2 and Table 3, suggesting that the estimated effects are
relatively homogenous when California and Colorado are excluded. In summary, I find a quite
robust estimated effect of 10–20% increase in marijuana arrests. Although the estimate magnitudes
for cocaine arrests cover a wide range, I do not find any evidence supporting the notion that
marijuana is a gateway drug or a complement to cocaine/heroin.
16
One major disadvantage of the arrest data is that the estimates could be driven by
unobserved changes in law enforcement. To address this concern, although indirectly, I examine
the effects of medical marijuana laws separately for blacks and whites. If there is a considerable
racial difference in the estimated effects, this would be a “smoking gun” that the negative estimates
for cocaine arrests are caused by actions of law enforcement. It is well documented that African
Americans are much more likely to be arrested for drug possession. Even though hard drug usage
rates, especially for crack cocaine, tend to be higher among African Americans, a nontrivial
proportion of the racial difference in arrest risk can be attributed to law enforcement (Beckett et
al., 2006; Dannerbeck et al., 2006; Donohue III and Steven D. Levitt, 2001; Gross and Barnes,
2002; Hernández-Murillo and Knowles, 2004; Parker and Maggard, 2005). In addition to potential
racial profiling, for example, African Americans often engage in risky purchasing behaviors such
as making transactions in open places, or they tend to live in disadvantaged neighborhoods that
attract more police attention and therefore increase their likelihood of arrest (Beckett et al., 2005;
Ramchand et al., 2006). Therefore, cocaine arrests among African Americans are expected to be
more sensitive to changes in police behaviors.
To account for the fact that non-drug offense rates and arrest risks are also higher among
African Americans, I create all arrest ratios for cocaine separately for adult blacks and whites.
(Other racial categories in the UCR are Asians and Native Alaskans or American Indians.) Table
6 shows the summary statistics of these ratios. Similar to Table 1, medical marijuana states that
exclude California and Colorado show lower cocaine arrest ratios than other states for both blacks
and whites. In line with findings from other studies, Table 6 shows that the proportion of cocaine
arrestees is higher among blacks even conditional on race (except for California). Note that,
however, the difference in racial differences between medical marijuana states and non-medical
marijuana states is very small [(3.28 − 2.41) − (2.53 − 1.72) = -0.06%]. So, at least for cocaine
possession offenses, the law enforcement in medical marijuana states do not discriminate more or
less against African Americans than other states.
Table 7 presents the estimated effects of medical marijuana laws on the cocaine arrest ratio
for blacks and whites. Because around 10% of black ratios are zeros, I estimate a fixed-effect
Poisson model with quadratic time trends based on both the samples with or without California
and Colorado. Because African Americans are more subjected to the strength of law enforcement,
we would expect a racial difference in the response of cocaine arrests if police behaviors were the
17
major driving force. However, in both the restricted sample and the full sample, the estimates do
not exhibit significant racial differences and they are similar to the results in Table 3. The estimates
from the restricted sample are larger but much noisier (insignificant) than the full sample.
Specifically, these estimates indicate a 6.5−14.1% decrease in white arrest ratios, and a 7.5−13.4%
decrease in black arrest ratios. The similar magnitudes of estimates among blacks and whites
suggest that changes in enforcement are unlikely to be the major reason for the decline in cocaine
arrests.
Based on the UCR data, although marijuana arrests have increased after the passage of
medical marijuana laws, there is no evidence that cocaine and heroin arrests have increased.
Nevertheless, in addition to potential bias from law enforcement, another disadvantage of the UCR
arrest data is that it does not separate cocaine and heroin. Cocaine is a stimulant and its neurological
effects are fundamentally different from depressants like heroin. Although marijuana is hard to
classify, many of its neurological effects are more similar to depressants (Abood and Martin, 1992;
Domino, 1971). For instance, both marijuana and heroin can relieve pain. Stimulants and
depressants are often complements; for example, heroin can reduce the depression that ensues after
the "high" from cocaine and help with sleeping. In fact, anecdotal evidence suggests that cocaine
dealers are often also heroin dealers. If there is really a substitution with marijuana, as those
negative estimates indicate, it is more likely between marijuana and heroin rather than between
marijuana and cocaine. In the next section, to further evaluate the impacts of medical marijuana
laws separately on cocaine and heroin, I employ data on substance treatment referrals from
rehabilitation facilities that are not referred by the criminal justice system.
5. Results from the TEDS data
5.1. TEDS data
The treatment data is from the Substance Abuse and Mental Health Services Administration’s
(SAMHSA) Treatment Episode Data Set (TEDS) for the years 1992 through 2008. The TEDS
collects admission data from all substance-abuse treatment facilities that receive public funding in
each state. Some states collect data on all patients in facilities, while other states only collect data
on publicly funded patients. Similar to the UCR, each admission does not uniquely identify an
individual. For each admission, the data report at most three substance abuse problems of the
patient, his/her demographics, such as gender and age, and the sources of referral. About 40% of
18
treatment admissions are referred by the criminal justice system, 30% are referred by patients
themselves or other individuals, and around 20% are referred by health care providers and alcohol
or drug abuse care providers.11 I exclude criminal justice referrals in order to obtain estimates that
are not directly affected by potential changes in law enforcement.
In the TEDS, the total number of admissions greatly fluctuates in some state-years, which
might be due to changes in available funding or reporting practice. For example, the total number
of treatments reported was only about half of its previous levels in Alaska and Washington since
1999. To account for the fluctuations in total admissions and capacity constraints of rehabilitation
facilities, as commonly used by the SAMHSA, I create ratios of cocaine or heroin treatments to
all substance treatments for each state as measures. Because each admission lists at most three
drugs, I define marijuana-/cocaine-/heroin-related treatment admissions as such if they are
identified as the primary, secondary, or tertiary abuse problem; and marijuana-/cocaine-/heroin-
primary treatment admissions as such if they are recorded only as the primary abuse substance. As
juvenile hard drug treatments are rare, and to be consistent with the UCR arrests, I only use adult
(above age 18) treatment admissions. On the other hand, since criminal justice referrals are not
included and therefore the potential gender differences in arrest risks are not a particular concern.
I use both male and female admissions to keep more observations; the results from only male
admissions in this section are nearly identical. The sample includes all medical marijuana states
that passed laws before July 2008; except for Alaska, for which data are missing for many years,
they have data in every year.12
The summary statistics of marijuana, cocaine, and heroin treatment ratios are in Table 8.13
The related treatment ratios are in the upper panel, and the primary treatment ratios are in the lower
panel. Consistent with its popularity, 29.9% of treatment patients report a marijuana abuse problem;
but its low addictiveness makes marijuana account for only 7.8% of all primary abuse problems.
On the other hand, consistent with its strong addictiveness, although only 14.1% of treatments are
heroin-related, it accounts for 11.8% of primary abuse problems. Cocaine is kind of in between; it
accounts for 16.3% of primary problems, and 32.7% of treatments are cocaine-related. As
11 The remaining 10% are referred by community or religious organizations, and self-help groups such as Alcoholics
Anonymous. 12 Alaska does not report referral sources for the years 1998–2003, and it does not report any data for the years 2004–
2007. 13 The sample size is only 810 for heroin treatments because Tennessee does not report any heroin treatment for years
after 1997.
19
treatments for hard drugs are disproportionally present, clearly, treatment patients in the TEDS
data are heavy users and they are different from general drug users. Although not shown in the
table, the alcohol-related (-primary) treatment ratio is about 70% (50%). The marijuana treatment
ratios in states with and without medical marijuana laws are similar. For cocaine treatments,
although these treatments do not include criminal justice referrals and therefore they are not
directly affected by law enforcement, the cocaine treatment ratios in medical marijuana states are
still much lower than non-medical marijuana states as in the UCR data. It suggests that, at least for
the subpopulation at risk, the cocaine use rates may actually be lower in medical marijuana states.
Heroin treatment ratios are similar in medical marijuana states and other states. California has an
extremely high proportion of heroin treatments. Colorado has a very low percentage of drug
treatments; in fact, 80% of Colorado primary treatments are alcohol treatments.
5.2. Results
To evaluate the effects of medical marijuana laws on drug treatments, I estimate a model
that is similar to the one in the UCR analysis:
(2) Yst = β Lawst + CA Law + CO Law + State fixed effectss + Year fixed effectst
+ State time trendsst + ɛst ,
where Yst is the marijuana, cocaine, or heroin treatment ratios (or their logarithms) in state s and
year t. I estimate Equation (2) by OLS or a fixed-effect Poisson model. As in the previous analysis,
I focus on the specifications without controls to keep a larger sample size, and the estimated
standard errors are clustered at the state level.
Table 9 shows the estimated effects on marijuana treatment ratios. The estimates from log-
linear models are in the left panel, and the estimates from a fixed-effect Poisson model are in the
right panel. In the first columns in each panel, I exclude the interaction terms, CA Law and CO
Law, and estimate the legalization effects based on all states. Consistent with marijuana arrests in
the UCR, the estimated effects of medical marijuana laws are positive. The estimates suggest a
6.9–9.1% increase in marijuana, but they are quite noisy in marijuana-primary treatments. In the
latter two columns in each panel, conditional on California and Colorado, the estimates for Lawst
are positive and highly significant for marijuana-related treatments. Although the estimates are

20
still noisier in primary treatments, in terms of percentage change, the magnitudes are very similar
to those in marijuana-related treatments. Specifically, conditional on California and Colorado,
medical marijuana laws are associated with a 9.1–11.9% increase in marijuana-related treatment
ratios or an 11.2–13.0% increase in the marijuana-primary treatment ratio.
Although the treatments do not include criminal justice referrals, the estimates of CA Law
and CO Law are qualitatively similar to those from the UCR marijuana arrest. The legalization
effect in California seems to be smaller than in other medical marijuana states, although it is a little
sensitive to time trend specification and not always significantly different. However, estimates for
Colorado are always negative and significantly different from the estimates for Lawst. Although I
cannot rule out that marijuana use has actually decreased in Colorado, it could be that people are
less likely to seek treatments due to a lower perceived risk or treatment facilities giving the priority
to other substance patients.14
Table 10 and Table 11 present the effects of medical marijuana laws on cocaine and heroin
treatment ratios, respectively. In both Table 10 and Table 11, the estimates are quantitatively
similar with or without California and Colorado. In Table 10, the estimates on cocaine treatments
are negative but very small and never significant. In contrast, in Table 11, the estimates on heroin
treatments are negative and quite large in absolute terms. After the passage of medical marijuana
laws, on average, the heroin-related treatments decreased by 15.2–18.4%, and the heroin-primary
treatments decreased by 19–25.9%. These estimates are quite noisy, especially in log-linear models.
As indicated by the large standard deviations in Table 8, the heroin treatment ratios are somewhat
dispersed with many tiny values, and therefore a linear model may fit the data poorly. Unlike in
the UCR arrests, Colorado often shows negative effects on both cocaine and heroin treatments,
while California sometimes shows positive effects on these treatments. However, the interpretation
of the estimates for CA Law and CO Law should be treated with caution as the estimated standard
errors are probably biased in these estimates. It is because the estimates for CA Law and CO Law
are identified based on only one state while the estimated standard errors are clustered at the state
level.
14 The extremely large negative estimates for Colorado are partially due to a large increase in alcohol treatments after
2001. The number of alcohol treatments in Colorado was almost doubled from 2001 to 2002. However, the estimated
legalization effects on marijuana treatments in Colorado still show a 10% decrease even when alcohol treatments are
excluded.

21
As in the previous analysis in the UCR arrests, the results in Table 10 and 11 support neither
the gateway hypothesis nor the complementarity between marijuana and cocaine or heroin. In fact,
there could be a decline in heroin usage while there is no change in cocaine usage. To see it
graphically, Figures 4 and 5, constructed in the same way as Figure 3, illustrate the changes in
cocaine- (Figure 4) and heroin- (Figure 5) primary treatment ratios before and after the passage of
laws for both the samples with or without California and Colorado. (The graphs based on related
treatments are nearly identical.) Note that the scales are different between Figure 4 and Figure 5.
For cocaine, in both the states with and without medical marijuana laws, the treatment ratios
indicate the same pattern of smoothly decreasing over time, suggesting no effect of legalization on
cocaine treatments. For heroin, the treatment ratios were gradually increasing before the passage
of laws in both medical marijuana states and other states. In contrast, after the passage of laws, the
treatment ratios have shown a decrease in medical marijuana states while they keep increasing
slightly in other states.
Multidrug abuse is common among cocaine and heroin treatment patients. In my sample,
30% of cocaine-primary treatment patients report marijuana abuse, and 40% of heroin-primary
treatment patients report cocaine abuse. Moreover, the relationship is not symmetric: only 17% of
marijuana-primary treatment patients report cocaine abuse, and 5% of cocaine-primary treatment
patients report heroin abuse. This observational fact that patients who use harder drugs are more
likely to use softer drugs (but not vice versa) is a major basis for the gateway hypothesis. Although
the estimates in previous tables indicate that, on average, marijuana could be a substitute to heroin
but has no direct relationship with cocaine, there could be heterogeneous effects of these laws. As
some experimental studies suggest, the substitution and complementarity between drugs may vary
by different types of drug users (Chalmers et al., 2010; Jofre-Bonet and Petry, 2008; Petry, 2001;
Petry and Bickel, 1998). To investigate potential heterogeneous legalization effects, I focus on the
two most common combinations in the TEDS: cocaine-primary with marijuana and heroin-primary
with cocaine. Cocaine-primary with marijuana treatments are the subset of cocaine-primary
treatments in which marijuana are either secondary or tertiary abuse problems. Heroin-primary
with cocaine treatments are defined in the same way. In addition, I also utilize the information on
the routes of drug use to create "speedball" treatment ratios, a subset of heroin-primary with
cocaine treatments, in which heroin injection is the primary problem and cocaine injection is the
secondary or tertiary problem. (The number of treatments for which cocaine injection is the
22
primary problem and heroin injection is secondary/tertiary problems is very small). The direct
injection of cocaine and heroin together is the strongest and most dangerous way to combine them,
called "speedball" or alternatively known as "powerballing," and it has caused many celebrity
deaths, including the deaths of John Belushi and River Phoenix along with many others. One
potential concern about previous results from Table 11 is that they might be driven by treatment
facilities' unobserved reactions to medical marijuana laws rather than real changes in underlying
drug use. For instance, rehabilitation facilities might give priority to marijuana addicts, and
therefore indirectly reduce the enrollment of heroin patients due to capacity constraints. The results
on "speedball" treatments can partially address this concern as "speedball" is one of the hardest
drugs and its treatment admissions are less likely to be affected by these unobservable factors.
The summary statistics of these treatment ratios are presented in Table 12. For brevity, I
focus on the restricted sample without California and Colorado; the observations are smaller in
non-medical marijuana states due to missing data in non-primary drugs or routes of use. Table 13
shows the estimated effects on treatment ratios of these drug combinations. The estimates on
cocaine-primary with marijuana treatments are actually positive. Although the estimated standard
errors are large, and only the estimates from the fixed-effect Poisson model with linear time trends
is significant, in terms of percentage changes, the estimates from the log specification are similar
to those in marijuana treatments in Table 9. They indicate roughly a 10% increase in treatments in
which cocaine is the primary abuse problem and marijuana is the secondary abuse problem. The
positive effect of laws on this set of cocaine users implies that the gateway hypothesis may indeed
exist for some particular types of drug users. One might be worried that the estimates on marijuana
treatments in Table 9 are driven by these cocaine-primary users, so the increase in marijuana is
actually a byproduct of the increase in cocaine-primary with marijuana treatments. However, the
results in marijuana treatments are nearly the same even if I exclude admissions that report any
cocaine use (not reported). For heroin-primary treatment patients who also report cocaine abuse,
the estimated effects of the laws are negative and often significant, with a similar magnitude of
decrease by around 20% as in Table 10. Therefore, the decline in heroin treatment patients is
similar regardless whether they use cocaine together or not. For "speedball" treatments, although
the estimates are somewhat sensitive to model specifications and quite noisy due to the small
number of "speedball" treatments, in terms of percentage changes, they indicate a decrease of about
15 –30%. As the estimates for “speedball” treatments are similar to those for heroin treatments,
23
they provide further evidence that the decline in heroin treatments is indeed caused by medical
marijuana laws.
6. Discussion of Results and Conclusion
In this paper, I use data on drug possession arrests and treatment admissions, and estimate
reduced-form models for the effects of medical marijuana laws on marijuana, cocaine, and heroin
usage. My results indicate a 10−20% increase in marijuana arrests and treatments after the passage
of medical marijuana laws. Although it is a widely accepted belief that marijuana is a complement
or even a gateway drug to hard drugs, I do not find strong evidence supporting such relationships
between marijuana and cocaine or heroin. In contrast, the possession arrests of cocaine and heroin
do not appear to significantly change or even decrease after legalization. In addition, there is no
racial difference in the estimated effects, suggesting that the estimates are not driven by changes
in police behaviors. To address the potential bias from law enforcement and to examine the effects
separately for cocaine and heroin, I use treatment admissions that are unrelated to criminal justice
from the TEDS data. I also find a similar magnitude of about 20% decrease in heroin treatment
admissions, but no significant change in cocaine treatment admissions. Although these findings
are fairly unexpected, they are consistent with some qualitative studies that report medical
marijuana patients substituting alcohol and other illegal drugs for marijuana (Harris et al., 2000;
Reiman, 2007, 2009). Interestingly, Anderson et al. (2012a) actually find a large reduction in
cocaine use among teenagers, even though they do not find any increase in marijuana use.
A 10–20% change in marijuana and heroin use represents a large legalization effect. As
this study is one of the first to assess the effects of medical marijuana laws on hard drug usage, it
is difficult to compare the specific outcomes with the results from the existing literature. However,
the magnitude is not implausibly large in comparison to other policy effects on substance use found
in existing studies. For example, Conlin et al. (2005) find that legal changes in the availability of
alcohol have a substitution effect on arrests of marijuana and hard drugs with an order of magnitude
of 10–30%. Conceptually, since arrests and treatment admissions do not represent individuals but
frequencies, they capture changes in both the intensive and extensive margins. Because hard drugs
like heroin are highly addictive, and the substitution effect seems to exist even among people using
one of the hardest drugs, "speedball," it is unlikely for these drug users to just stop using these
drugs. Therefore, a significant part of the substitute effects is probably on the intensive margin.
24
For instance, some anecdotal evidence suggests that marijuana can help to ease the craving for
heroin.
Since arrests and treatments tend to reflect heavy drug use, these results might not be
simply applied to the general drug users; there is no doubt that treatment patients are different from
casual marijuana users. As Chu (2012) points out, the differences underlying drug users could be
one reason that some studies based on national representative samples tend to find little or no
effects of these medical marijuana laws on marijuana use. On the other hand, for hard drugs,
especially for heroin, such distinctions may be less important as heroin users are generally heavy
users. For policy evaluations, however, these estimates are still relevant to the design of policy
because the major concern of these laws is whether heavy marijuana use will cause hard drug use.
Results in this study suggest that, on average, marijuana could be a substitute for heroin,
and it does not have a strong relationship with cocaine. However, as this paper focuses on drug
usage at the aggregated level, it may ignore potential heterogeneous effects on different types of
individuals, especially multidrug users. In fact, I intentionally avoid using terms like "elasticity of
substitution" to interpret my reduced-form results. For example, the estimated effects are positive
on patients who use cocaine with marijuana but negative on patients who use cocaine with heroin.
As suggested by some experimental studies, the relationships between substances may depend on
different types of users, and it is possible that the gateway effect is indeed causal for some
particular types of drug users. To further evaluate the impacts of medical marijuana laws and to
conduct a more complete cost-benefit analysis, future research has to pay more attention to these
potential heterogeneous effects. Due to constraints such as sample sizes from currently available
datasets, qualitative studies with detail and extensive descriptions of drug use behaviors may be
equally important as quantitative studies.
25
References:
Abood, M. E., Martin, B. R., 1992. Neurobiology of marijuana abuse. Trends in Pharmacological
Sciences 13 (0), 201-206.
Agrawal, A., Neale, M. C., Prescott, C. A., Kendler, K. S., 2004. Cannabis and other illicit drugs:
Comorbid use and abuse/dependence in males and females. Behavior Genetics 34 (3), 217-
228.
Akiyama, Y., Propheter, S. K., 2005. Methods of data quality control: For uniform crime
reporting programs. Federal Bureau of Investigation, Criminal Justice Information Services
Division.
Anderson, D. M., Hansen, B., Rees, D. I., 2012a. Medical marijuana laws and teen marijuana
use. IZA Discussion Paper No. 6592.
Anderson, D. M., Hansen, B., Rees, D. I., 2012b. Medical marijuana laws, traffic fatalities, and
alcohol consumption. Journal of Law and Economics Forthcoming.
Anderson, E., 2012. "Mother earth" medical marijuana clinic prepares to close. KPBS Public
Broadcasting. San Diego, CA.
Arkes, J., Pacula, R. L., Paddock, S. M., Caulkins, J. P., Reuter, P., 2008. Why the dea stride
data are still useful for understanding drug markets. NBER Working Papers
14224.
Becker, G. S., Murphy, K. M., 1988. A theory of rational addiction. The Journal of Political
Economy 96 (4), 675-700.
Beckett, K., Nyrop, K., Pfingst, L., 2006. Race, drugs, and policing: Understanding disparities in
drug delivery arrests. Criminology 44 (1), 105-137.
Beckett, K., Nyrop, K., Pfingst, L., Bowen, M., 2005. Drug use, drug possession arrests, and the
question of race: Lessons from seattle. Social Problems 52 (3), 419-441.
Bound, J., Solon, G., 1999. Double trouble: On the value of twins-based estimation of the return
to schooling. Economics of Education Review 18 (2), 169-182.
26
Bretteville-Jensen, A. L., 2011. Illegal drug use and the economic recession—what can we learn
from the existing research? The International journal on drug policy 22 (5), 353-359.
Bretteville-Jensen, A. L., Melberg, H. O., Jones, A. M., 2008. Sequential patterns of drug use
initiation - can we believe in the gateway theory? The B.E. Journal of Economic Analysis &
Policy 8 (2), (Contributions), Article 1.
Caplan, G., 2012. Medical marijuana: A study of unintended consequences. McGeorge Law
Review 43, 127-146.
Carpenter, C., 2007. Heavy alcohol use and crime: Evidence from underage drunk‐driving laws.
Journal of Law and Economics 50 (3), 539-557.
Chalmers, J., Bradford, D., Jones, C., 2010. The effect of methamphetamine and heroin price on
polydrug use: A behavioural economics analysis in sydney, australia. International Journal of
Drug Policy 21 (5), 381-389.
Chu, Y.-W., 2012. Medical marijuana laws and illegal marijuana use. SSRN
http://ssrn.com/abstract=2164778.
Cohen, P. J., 2010. Medical marijuana 2010: It's time to fix the regulatory vacuum. The Journal
of Law, Medicine & Ethics 38 (3), 654-666.
Conlin, M., Dickert‐Conlin, S., Pepper, J., 2005. The effect of alcohol prohibition on illicit‐drug‐related crimes. Journal of Law and Economics 48 (1), 215-234.
Coté, J., Allday, E., Buchanan, W., Lagos, M., 2008. Feds say s.F. Has more pot clubs than
starbucks, but it might not add up. San Francisco Chronicle.
Dannerbeck, A., Harris, G., Sundet, P., Lloyd, K., 2006. Understanding and responding to racial
differences in drug court outcomes. Journal of Ethnicity in Substance Abuse 5 (2), 1-22.
DeSimone, J., 1998. Is marijuana a gateway drug? Eastern Economic Journal 24 (2), 149-164.
Dickinson, T., 2012. Obama's war on pot. Rolling Stone.
27
Domino, E. F., 1971. Neuropsychopharmacologic studies of marijuana: Some synthetic and
natural thc derivatives in animals and man. Annals of the New York Academy of Sciences
191 (1), 166-191.
Donohue III, John J., Steven D. Levitt. 2001. The impact of race on policing and arrests. Journal
of Law and Economics 44 (2), 367-394.
Drug Enforcement Administration, D. 1991. D.E.A history book 1875–1990 1991
www.usdoj.gov/dea/pubs/history/1985-1990.html
Drug Enforcement Administration, D., 2011. The d.E.A. Position on marijuana.
Ellgren, M., Spano, S. M., Hurd, Y. L., 2006. Adolescent cannabis exposure alters opiate intake
and opioid limbic neuronal populations in adult rats. Neuropsychopharmacology 32 (3), 607-
615.
Fergusson, D. M., Boden, J. M., Horwood, L. J., 2006a. Cannabis use and other illicit drug use:
Testing the cannabis gateway hypothesis. Addiction 101 (4), 556-569.
Fergusson, D. M., Boden, J. M., Horwood, L. J., 2006b. Testing the cannabis gateway
hypothesis: Replies to hall, kandel et al. And maccoun (2006). Addiction 101 (4), 474-476.
Fryer, R., Heaton, P., Levitt, S., Murphy, K., 2010. Measuring crack cocaine and its impact.
Economic Inquiry forthcoming
GAO, G. A. O., 2002. Marijuana: Early experiences with four states' laws that allow use for
medical purposes. Washington, DC.
Golub, A., Liberty, H. J., Johnson, B. D., 2005. Inaccuracies in self-reports and urinalysis tests:
Impacts on monitoring marijuana use trends among arrestees. Journal of Drug Issues 35 (4),
941-966.
Gross, S. R., Barnes, K. Y., 2002. Road work: Racial profiling and drug interdiction on the
highway. Michigan Law Review 101 (3), 651-754.
Grossman, M., Chaloupka, F. J., 1998. The demand for cocaine by young adults: A rational
addiction approach. Journal of Health Economics 17 (4), 427-474.

28
Harris, D., Jones, R. T., Shank, R., Nath, R., Fernandez, E., Goldstein, K., Mendelson, J., 2000.
Self-reported marijuana effects and characteristics of 100 san francisco medical marijuana
club members. Journal of Addictive Diseases 19 (3), 89-103.
Harrison, L., Hughes, A., 1997. The validity of self-reported drug use: Improving the accuracy of
survey estimates. National Institute on Drug Abuse.
Hernández-Murillo, R., Knowles, J., 2004. Racial profiling or racist policing? Bounds tests in
aggregate data. International Economic Review 45 (3), 959-989.
Horowitz, J. L., 2001. Should the dea's stride data be used for economic analyses of markets for
illegal drugs? Journal of the American Statistical Association 96 (456), 1254-1262.
Jofre-Bonet, M., Petry, N. M., 2008. Trading apples for oranges?: Results of an experiment on
the effects of heroin and cocaine price changes on addicts’ polydrug use. Journal of
Economic Behavior & Organization 66 (2), 281-311.
Johnson, K., 2009. States pressed into new role on medical marijuana. The New York Times.
Kandel, D., 1975. Stages in adolescent involvement in drug use. Science 190 (4217), 912-914.
Kandel, D. B., 2003. Does marijuana use cause the use of other drugs? JAMA: The Journal of
the American Medical Association 289 (4), 482-483.
Kandel, D. B., Yamaguchi, K., Klein, L. C., 2006. Testing the gateway hypothesis. Addiction
101 (4), 470-472.
Leger, D. L., 2012. Survey: 1 in 15 high school seniors smoking pot. USA TODAY.
Levitt, Steven D., 1998. Juvenile crime and punishment. The Journal of Political Economy 106
(6), 1156-1185.
Lynch, J. P., Jarvis, J. P., 2008. Missing data and imputation in the uniform crime reports and the
effects on national estimates. Journal of Contemporary Criminal Justice 24 (1), 69-85.
Lynskey, M., Vink, J., Boomsma, D., 2006. Early onset cannabis use and progression to other
drug use in a sample of dutch twins. Behavior Genetics 36 (2), 195-200.
29
Lynskey, M. T., Heath, A. C., Bucholz, K. K., Slutske, W. S., Madden, P. A. F., Nelson, E. C.,
Statham, D. J., Martin, N. G., 2003. Escalation of drug use in early-onset cannabis users vs
co-twin controls. JAMA: The Journal of the American Medical Association 289 (4), 427-
433.
MacCoun, R., 1998. In what sense (if any) is marijuana a gateway drug. The FAS Drug Policy
Analysis Bulletin (4).
Maccoun, R. J., 2006. Competing accounts of the gateway effect: The field thins, but still no
clear winner. Addiction 101 (4), 473-474.
Melberg, H., Jones, A., Bretteville-Jensen, A., 2010. Is cannabis a gateway to hard drugs?
Empirical Economics 38 (3), 583-603.
Mikos, R. A., 2011. A critical appraisal of the department of justice's new approach to medical
marijuana. . Stanford Law & Policy Review 22 (2), 633-670.
Moffatt, S., Wan, W.-Y., Weatherburn, D., 2012. Are drug arrests a valid measure of drug use?
A time series analysis. Policing: An International Journal of Police Strategies & Management
35 (3), 458 - 467.
O'Connor, A., 2011. Marijuana use growing among teenagers. The New York Times.
Pacula, R. L., Kilmery, B., Grossmanz, M., Chaloupka, F. J., 2010. Risks and prices: The role of
user sanctions in marijuana markets. The B.E. Journal of Economic Analysis & Policy 10 (1),
1-36.
Parker, K. F., Maggard, S. R., 2005. Structural theories and race-specific drug arrests: What
structural factors account for the rise in race-specific drug arrests over time? Crime &
Delinquency 51 (4), 521-547.
Petry, N. M., 2001. A behavioral economic analysis of polydrug abuse in alcoholics:
Asymmetrical substitution of alcohol and cocaine. Drug and Alcohol Dependence 62 (1), 31-
39.
Petry, N. M., Bickel, W. K., 1998. Polydrug abuse in heroin addicts: A behavioral economic
analysis. Addiction 93 (3), 321-335.
30
ProCon.org. 2012. How many people in the us use medical marijuana? 2012
http://medicalmarijuana.procon.org/view.answers.php?questionID=001199
Pudney, S., 2003. The road to ruin? Sequences of initiation to drugs and crime in britain. The
Economic Journal 113 (486), C182-C198.
Ramchand, R., Pacula, R. L., Iguchi, M. Y., 2006. Racial differences in marijuana-users’ risk of
arrest in the united states. Drug and Alcohol Dependence 84 (3), 264-272.
Reiman, A., 2007. Medical cannabis patients: Patient profiles and health care utilization patterns.
Complementary Health Practice Review 12 (1), 31-50.
Reiman, A., 2009. Cannabis as a substitute for alcohol and other drugs. Harm Reduction Journal
6 (1), 35.
Rosenfeld, R., Decker, S. H., 1999. Are arrest statistics a valid measure of illicit drug use? The
relationship between criminal justice and public health indicators of cocaine, heroin, and
marijuana use. Justice Quarterly 16 (3), 685-699.
Saffer, H., Chaloupka, F., 1999. The demand for illicit drugs. Economic Inquiry 37 (3), 401-411.
Salomonsen-Sautel, S., Sakai, J. T., Thurstone, C., Corley, R., Hopfer, C., 2012. Medical
marijuana use among adolescents in substance abuse treatment. Journal of the American
Academy of Child and Adolescent Psychiatry 51 (7), 694-702.
Sekhon, V., 2009. Highly uncertain times: An analysis of the executive branch's decision to not
investigate or prosecute individuals in compliance with state medical marijuana laws.
Hastings Constitutional Law Quarterly 37 (3), 553-564.
Solinas, M., Panlilio, L. V., Goldberg, S. R., 2004. Exposure to [delta]-9-tetrahydrocannabinol
(thc) increases subsequent heroin taking but not heroin's reinforcing efficacy: A self-
administration study in rats. Neuropsychopharmacology 29 (7), 1301-1311.
Terry-McElrath, Y. M., Chriqui, J. F., Bates, H., McBride, D. C., 2009. Do state policies matter
in prosecutor-reported juvenile marijuana case disposition? Crime & Delinquency.
31
Thurstone, C., Lieberman, S. A., Schmiege, S. J., 2011. Medical marijuana diversion and
associated problems in adolescent substance treatment. Drug and Alcohol Dependence 118
(2–3), 489-492.
van Ours, J. C., 2003. Is cannabis a stepping-stone for cocaine? Journal of Health Economics 22,
539-554.
Warner, B. D., Coomer, B. W., 2003. Neighborhood drug arrest rates: Are they a meaningful
indicator of drug activity? A research note. Journal of Research in Crime and Delinquency 40
(2), 123-138.
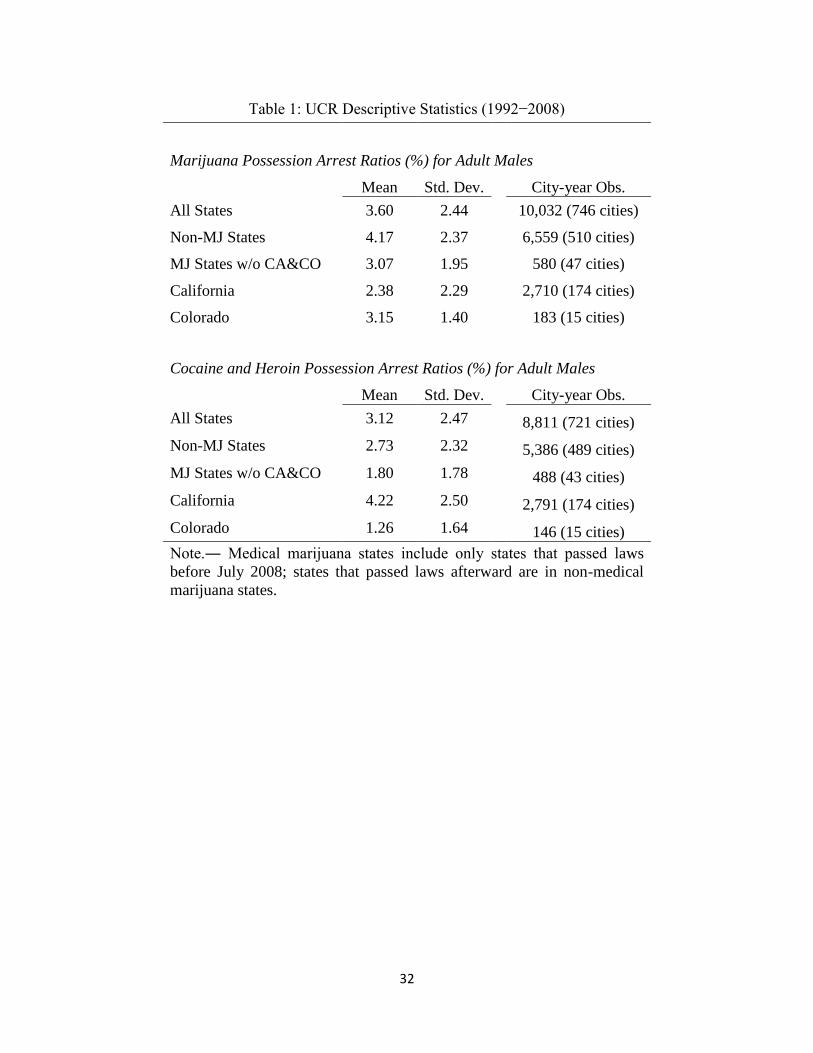
32
Table 1: UCR Descriptive Statistics (1992−2008)
Marijuana Possession Arrest Ratios (%) for Adult Males
Mean Std. Dev.
City-year Obs.
All States 3.60 2.44 10,032 (746 cities)
Non-MJ States 4.17 2.37 6,559 (510 cities)
MJ States w/o CA&CO 3.07 1.95 580 (47 cities)
California 2.38 2.29 2,710 (174 cities)
Colorado 3.15 1.40 183 (15 cities)
Cocaine and Heroin Possession Arrest Ratios (%) for Adult Males
Mean Std. Dev.
City-year Obs.
All States 3.12 2.47 8,811 (721 cities)
Non-MJ States 2.73 2.32 5,386 (489 cities)
MJ States w/o CA&CO 1.80 1.78 488 (43 cities)
California 4.22 2.50 2,791 (174 cities)
Colorado 1.26 1.64 146 (15 cities)
Note.― Medical marijuana states include only states that passed laws
before July 2008; states that passed laws afterward are in non-medical
marijuana states.
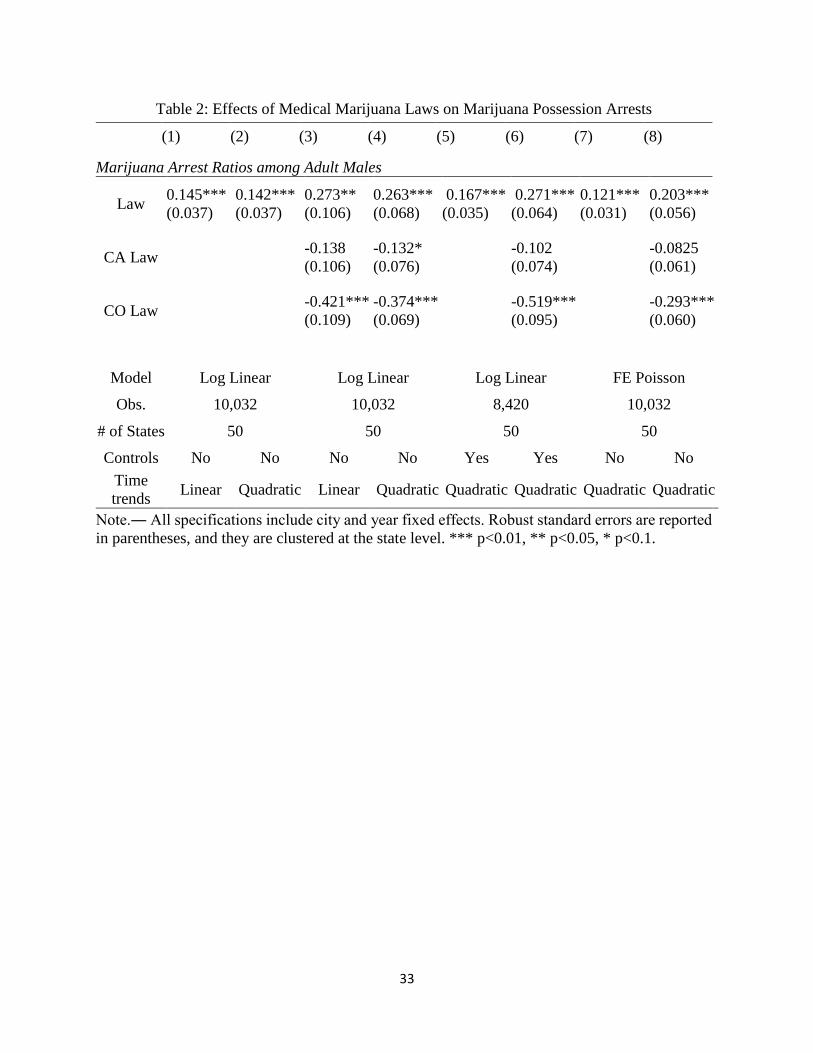
33
Table 2: Effects of Medical Marijuana Laws on Marijuana Possession Arrests
(1) (2) (3) (4) (5) (6) (7) (8)
Marijuana Arrest Ratios among Adult Males
Law 0.145*** 0.142*** 0.273** 0.263*** 0.167*** 0.271*** 0.121*** 0.203***
(0.037) (0.037) (0.106) (0.068) (0.035) (0.064) (0.031) (0.056)
CA Law -0.138 -0.132* -0.102 -0.0825
(0.106) (0.076) (0.074) (0.061)
CO Law -0.421*** -0.374*** -0.519*** -0.293***
(0.109) (0.069) (0.095) (0.060)
Model Log Linear Log Linear Log Linear FE Poisson
Obs. 10,032 10,032 8,420 10,032
# of States 50 50 50 50
Controls No No No No Yes Yes No No
Time
trends Linear Quadratic Linear Quadratic Quadratic Quadratic Quadratic Quadratic
Note.― All specifications include city and year fixed effects. Robust standard errors are reported
in parentheses, and they are clustered at the state level. *** p<0.01, ** p<0.05, * p<0.1.
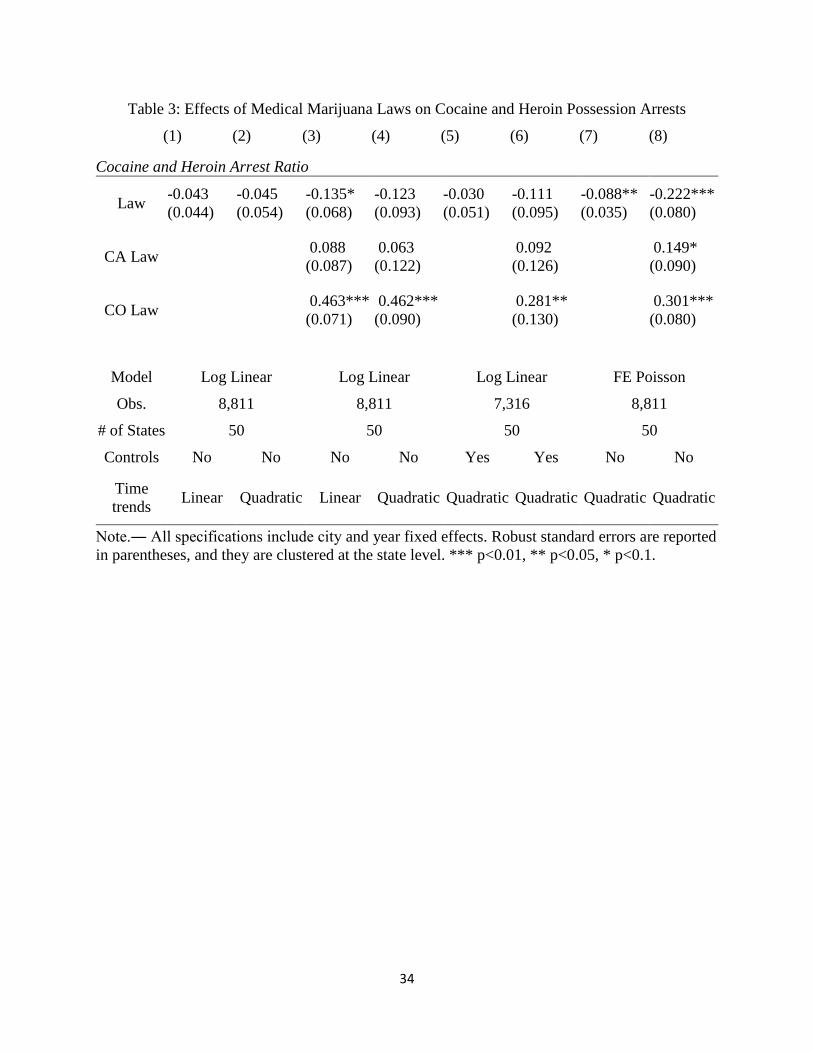
34
Table 3: Effects of Medical Marijuana Laws on Cocaine and Heroin Possession Arrests
(1) (2) (3) (4) (5) (6) (7) (8)
Cocaine and Heroin Arrest Ratio
Law -0.043 -0.045 -0.135* -0.123 -0.030 -0.111 -0.088** -0.222***
(0.044) (0.054) (0.068) (0.093) (0.051) (0.095) (0.035) (0.080)
CA Law 0.088 0.063 0.092 0.149*
(0.087) (0.122) (0.126) (0.090)
CO Law 0.463*** 0.462*** 0.281** 0.301***
(0.071) (0.090) (0.130) (0.080)
Model Log Linear Log Linear Log Linear FE Poisson
Obs. 8,811 8,811 7,316 8,811
# of States 50 50 50 50
Controls No No No No Yes Yes No No
Time
trends Linear Quadratic Linear Quadratic Quadratic Quadratic Quadratic Quadratic
Note.― All specifications include city and year fixed effects. Robust standard errors are reported
in parentheses, and they are clustered at the state level. *** p<0.01, ** p<0.05, * p<0.1.

35
Table 4: Dynamic Responses of Cocaine and Heroin Arrests to
Legalization
Years -0.016
-0.099
(neg. 1–2) (0.074) (0.068)
Years -0.076 -0.096 -0.086 -0.192
0–1 (0.049) (0.123) (0.073) (0.129)
Years -0.067 -0.092 -0.098 -0.233
2–3 (0.053) (0.145) (0.100) (0.146)
Years -0.146** -0.176 -0.256 -0.421**
4–5 (0.071) (0.172) (0.170) (0.160)
Years -0.171** -0.203 -0.120 -0.314
6–7 (0.079) (0.185) (0.283) (0.232)
Years -0.222** -0.255 0.174 -0.052
8+ (0.096) (0.197) (0.408) (0.333)
Obs. 8,811 5,874
Note.― All specifications include city and year fixed effects and city
quadratic time trends. Robust standard errors are reported in parentheses,
and they are clustered at the state level. *** p<0.01, ** p<0.05, * p<0.1.
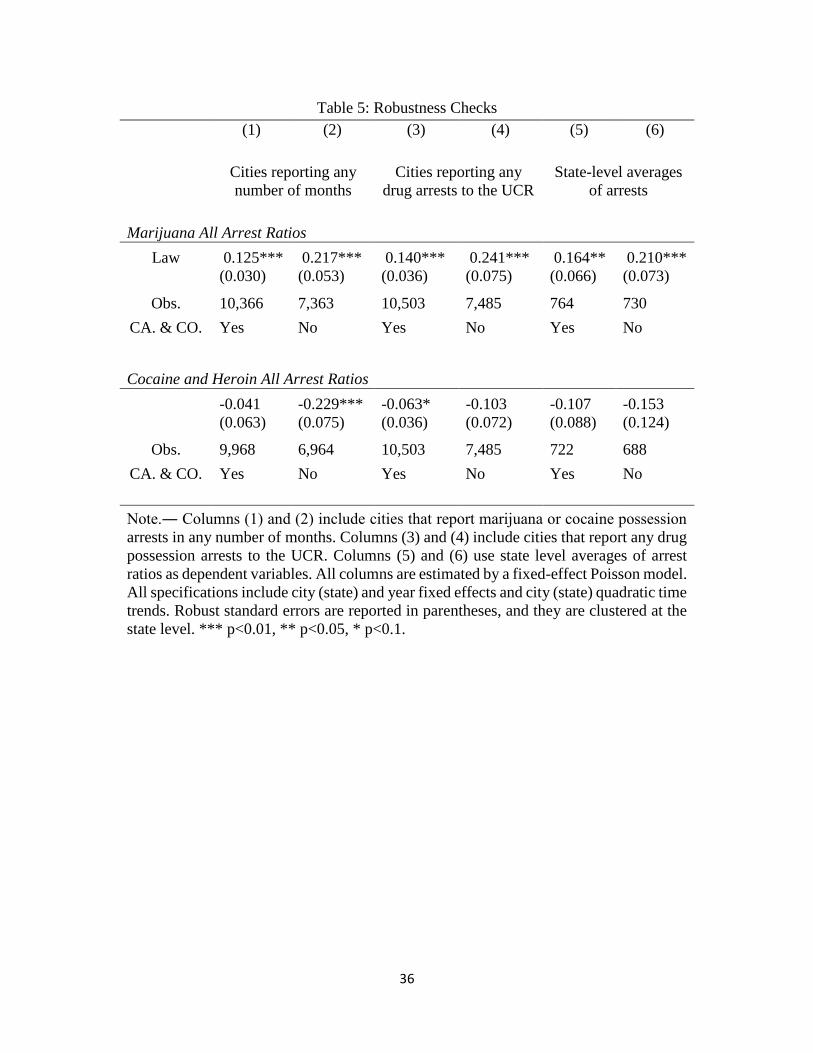
36
Table 5: Robustness Checks
(1) (2) (3) (4) (5) (6)
Cities reporting any
number of months
Cities reporting any
drug arrests to the UCR
State-level averages
of arrests
Marijuana All Arrest Ratios
Law 0.125*** 0.217*** 0.140*** 0.241*** 0.164** 0.210***
(0.030) (0.053) (0.036) (0.075) (0.066) (0.073)
Obs. 10,366 7,363 10,503 7,485 764 730
CA. & CO. Yes No Yes No Yes No
Cocaine and Heroin All Arrest Ratios
-0.041 -0.229*** -0.063* -0.103 -0.107 -0.153
(0.063) (0.075) (0.036) (0.072) (0.088) (0.124)
Obs. 9,968 6,964 10,503 7,485 722 688
CA. & CO. Yes No Yes No Yes No
Note.― Columns (1) and (2) include cities that report marijuana or cocaine possession
arrests in any number of months. Columns (3) and (4) include cities that report any drug
possession arrests to the UCR. Columns (5) and (6) use state level averages of arrest
ratios as dependent variables. All columns are estimated by a fixed-effect Poisson model.
All specifications include city (state) and year fixed effects and city (state) quadratic time
trends. Robust standard errors are reported in parentheses, and they are clustered at the
state level. *** p<0.01, ** p<0.05, * p<0.1.
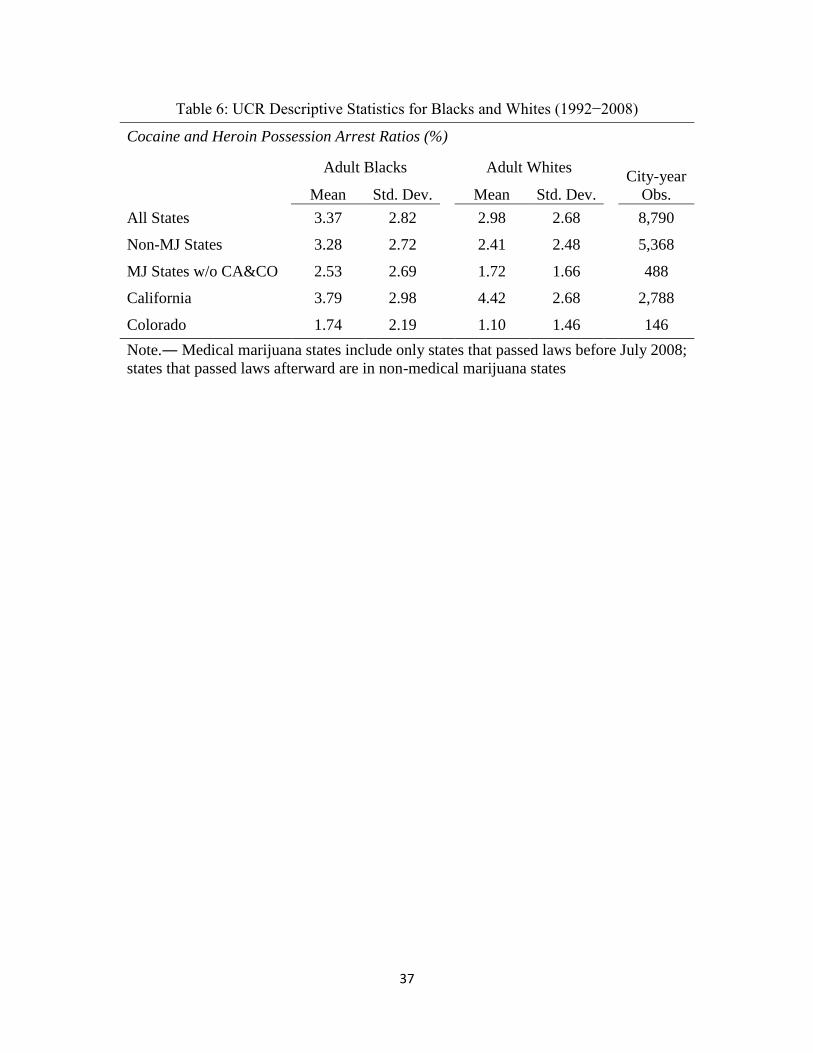
37
Table 6: UCR Descriptive Statistics for Blacks and Whites (1992−2008)
Cocaine and Heroin Possession Arrest Ratios (%)
Adult Blacks Adult Whites City-year
Obs. Mean Std. Dev. Mean Std. Dev.
All States 3.37 2.82 2.98 2.68 8,790
Non-MJ States 3.28 2.72 2.41 2.48 5,368
MJ States w/o CA&CO 2.53 2.69 1.72 1.66 488
California 3.79 2.98 4.42 2.68 2,788
Colorado 1.74 2.19 1.10 1.46 146
Note.― Medical marijuana states include only states that passed laws before July 2008;
states that passed laws afterward are in non-medical marijuana states

38
Table 7: Effects on Cocaine and Heroin Arrests among Blacks and Whites
Cocaine and Heroin All Arrest Ratios among Blacks
Law -0.081** -0.094** -0.148 -0.188***
(0.033) (0.041) (0.100) (0.072)
Cocaine and Heroin All Arrest Ratios among Whites
Law -0.130*** -0.083*** -0.158 -0.182*
(0.039) (0.032) (0.098) (0.105)
CA. & CO. Yes Yes No No
Time Trends Linear Quadratic Linear Quadratic
Note.― All specifications include city and year fixed effects. Robust standard
errors are reported in parentheses, and they are clustered at the state level. ***
p<0.01, ** p<0.05, * p<0.1.
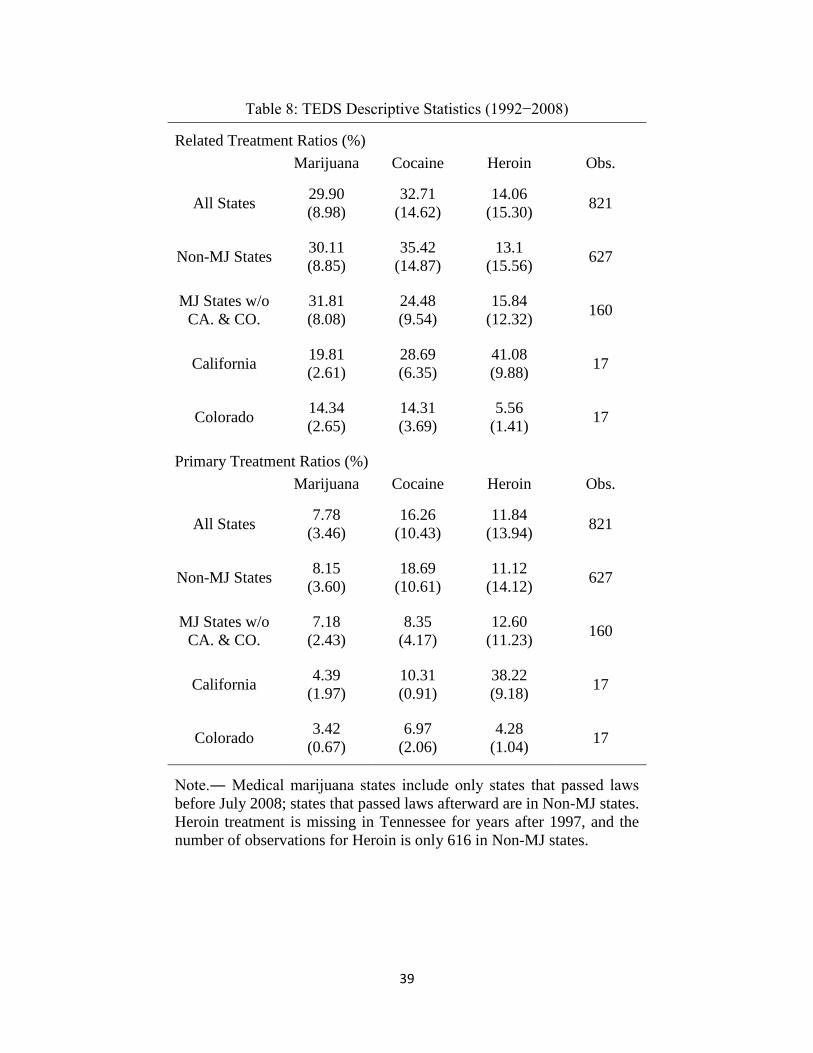
39
Table 8: TEDS Descriptive Statistics (1992−2008)
Related Treatment Ratios (%)
Marijuana Cocaine Heroin Obs.
All States 29.90 32.71 14.06
821 (8.98) (14.62) (15.30)
Non-MJ States 30.11 35.42 13.1
627 (8.85) (14.87) (15.56)
MJ States w/o
CA. & CO.
31.81 24.48 15.84 160
(8.08) (9.54) (12.32)
California 19.81 28.69 41.08
17 (2.61) (6.35) (9.88)
Colorado 14.34 14.31 5.56
17 (2.65) (3.69) (1.41)
Primary Treatment Ratios (%)
Marijuana Cocaine Heroin Obs.
All States 7.78 16.26 11.84
821 (3.46) (10.43) (13.94)
Non-MJ States 8.15 18.69 11.12
627 (3.60) (10.61) (14.12)
MJ States w/o
CA. & CO.
7.18 8.35 12.60 160
(2.43) (4.17) (11.23)
California 4.39 10.31 38.22
17 (1.97) (0.91) (9.18)
Colorado 3.42 6.97 4.28
17 (0.67) (2.06) (1.04)
Note.― Medical marijuana states include only states that passed laws
before July 2008; states that passed laws afterward are in Non-MJ states.
Heroin treatment is missing in Tennessee for years after 1997, and the
number of observations for Heroin is only 616 in Non-MJ states.
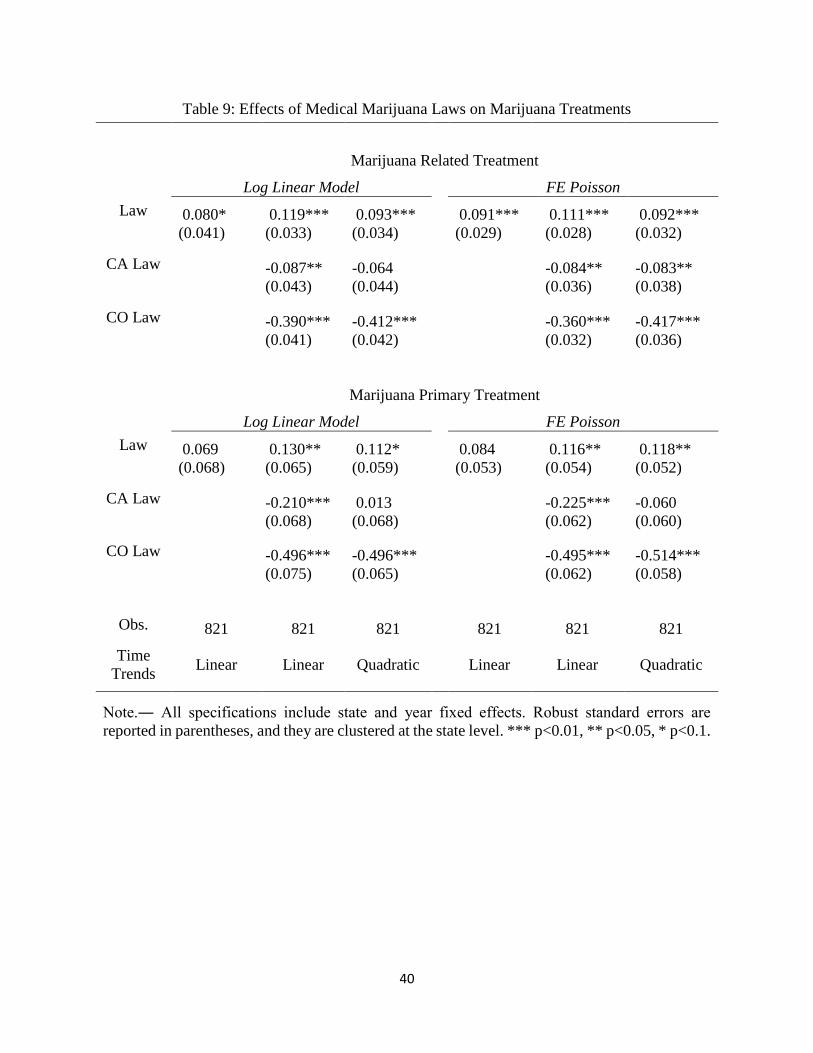
40
Table 9: Effects of Medical Marijuana Laws on Marijuana Treatments
Marijuana Related Treatment
Log Linear Model FE Poisson
Law 0.080* 0.119*** 0.093*** 0.091*** 0.111*** 0.092***
(0.041) (0.033) (0.034) (0.029) (0.028) (0.032)
CA Law -0.087** -0.064 -0.084** -0.083**
(0.043) (0.044) (0.036) (0.038)
CO Law -0.390*** -0.412*** -0.360*** -0.417***
(0.041) (0.042) (0.032) (0.036)
Marijuana Primary Treatment
Log Linear Model FE Poisson
Law 0.069 0.130** 0.112* 0.084 0.116** 0.118**
(0.068) (0.065) (0.059) (0.053) (0.054) (0.052)
CA Law -0.210*** 0.013 -0.225*** -0.060
(0.068) (0.068) (0.062) (0.060)
CO Law -0.496*** -0.496*** -0.495*** -0.514***
(0.075) (0.065) (0.062) (0.058)
Obs. 821 821 821
821 821 821
Time
Trends Linear Linear Quadratic
Linear Linear Quadratic
Note.― All specifications include state and year fixed effects. Robust standard errors are
reported in parentheses, and they are clustered at the state level. *** p<0.01, ** p<0.05, * p<0.1.
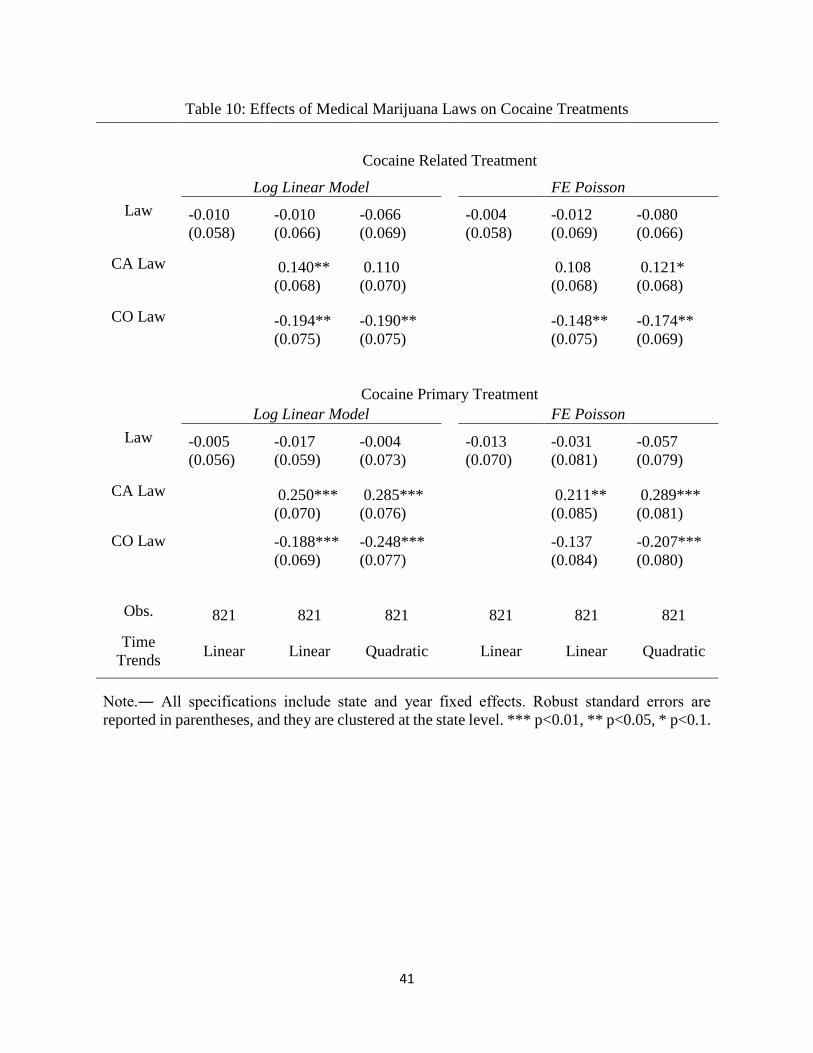
41
Table 10: Effects of Medical Marijuana Laws on Cocaine Treatments
Cocaine Related Treatment
Log Linear Model FE Poisson
Law -0.010 -0.010 -0.066 -0.004 -0.012 -0.080
(0.058) (0.066) (0.069) (0.058) (0.069) (0.066)
CA Law 0.140** 0.110 0.108 0.121*
(0.068) (0.070) (0.068) (0.068)
CO Law -0.194** -0.190** -0.148** -0.174**
(0.075) (0.075) (0.075) (0.069)
Cocaine Primary Treatment
Log Linear Model FE Poisson
Law -0.005 -0.017 -0.004 -0.013 -0.031 -0.057
(0.056) (0.059) (0.073) (0.070) (0.081) (0.079)
CA Law 0.250*** 0.285*** 0.211** 0.289***
(0.070) (0.076) (0.085) (0.081)
CO Law -0.188*** -0.248*** -0.137 -0.207***
(0.069) (0.077) (0.084) (0.080)
Obs. 821 821 821
821 821 821
Time
Trends Linear Linear Quadratic
Linear Linear Quadratic
Note.― All specifications include state and year fixed effects. Robust standard errors are
reported in parentheses, and they are clustered at the state level. *** p<0.01, ** p<0.05, * p<0.1.
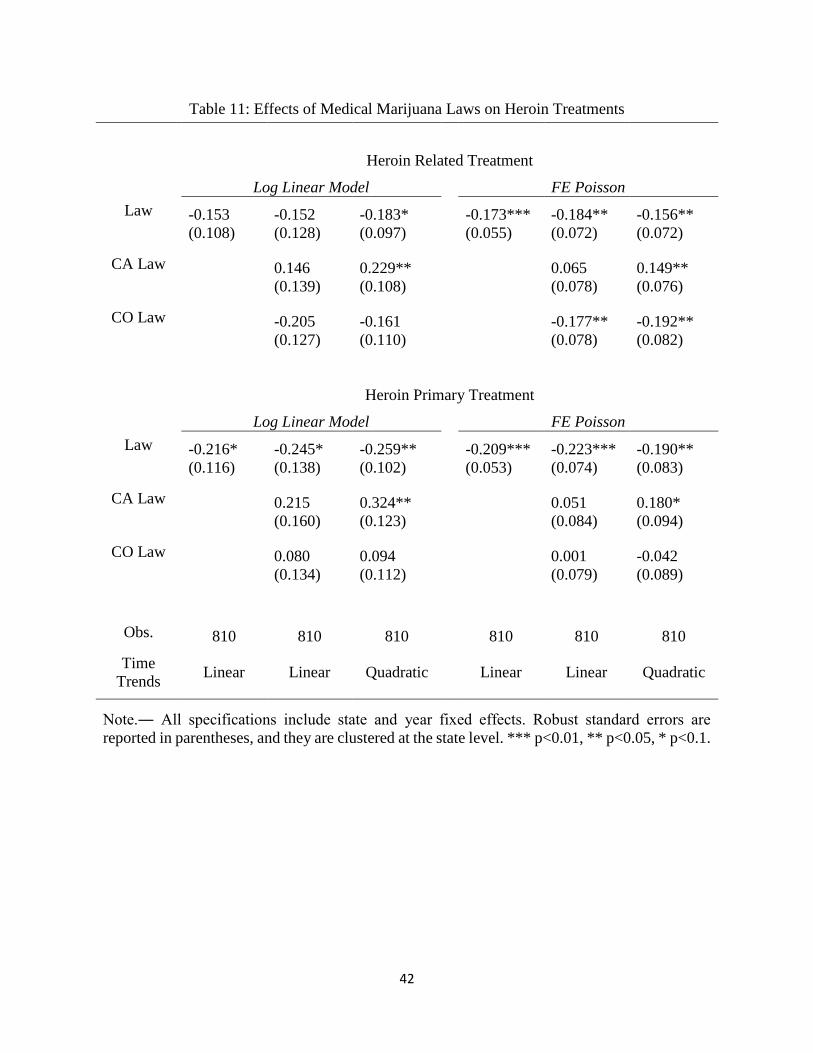
42
Table 11: Effects of Medical Marijuana Laws on Heroin Treatments
Heroin Related Treatment
Log Linear Model FE Poisson
Law -0.153 -0.152 -0.183* -0.173*** -0.184** -0.156**
(0.108) (0.128) (0.097) (0.055) (0.072) (0.072)
CA Law 0.146 0.229**
0.065 0.149**
(0.139) (0.108) (0.078) (0.076)
CO Law -0.205 -0.161
-0.177** -0.192**
(0.127) (0.110) (0.078) (0.082)
Heroin Primary Treatment
Log Linear Model FE Poisson
Law -0.216* -0.245* -0.259** -0.209*** -0.223*** -0.190**
(0.116) (0.138) (0.102) (0.053) (0.074) (0.083)
CA Law 0.215 0.324**
0.051 0.180*
(0.160) (0.123) (0.084) (0.094)
CO Law 0.080 0.094
0.001 -0.042
(0.134) (0.112) (0.079) (0.089)
Obs. 810 810 810
810 810 810
Time
Trends Linear Linear Quadratic
Linear Linear Quadratic
Note.― All specifications include state and year fixed effects. Robust standard errors are
reported in parentheses, and they are clustered at the state level. *** p<0.01, ** p<0.05, * p<0.1.
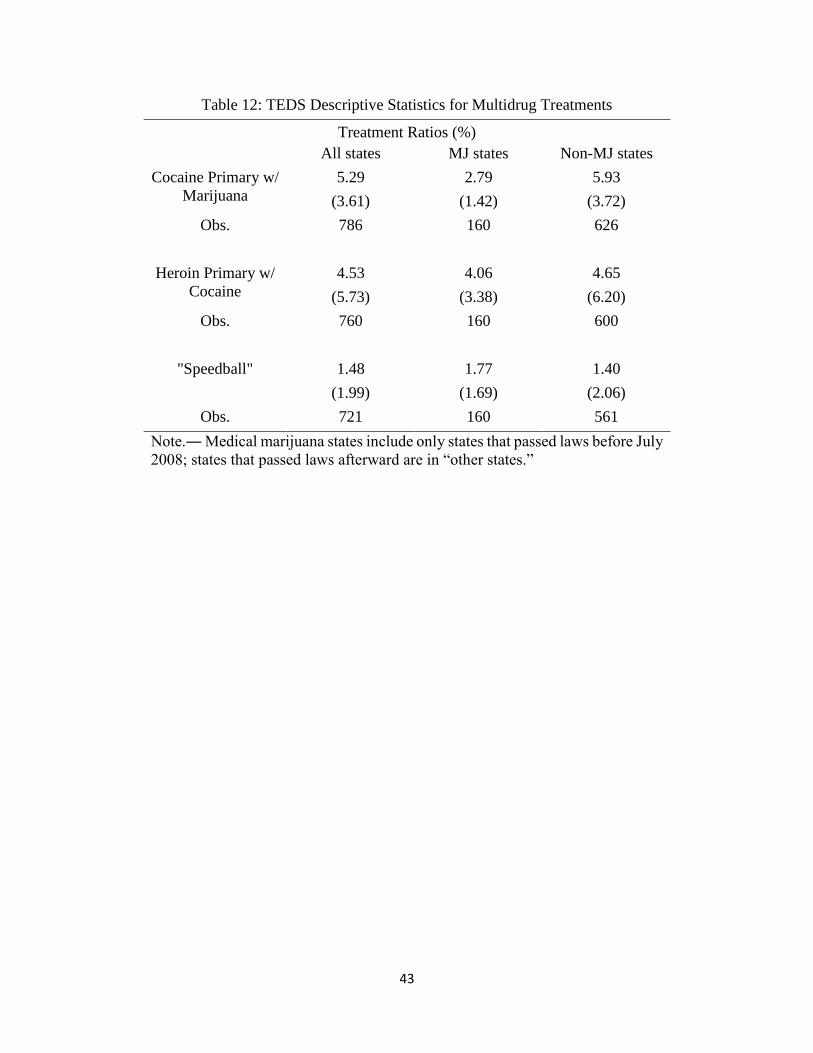
43
Table 12: TEDS Descriptive Statistics for Multidrug Treatments
Treatment Ratios (%)
All states MJ states Non-MJ states
Cocaine Primary w/
Marijuana
5.29 2.79 5.93
(3.61) (1.42) (3.72)
Obs. 786 160 626
Heroin Primary w/
Cocaine
4.53 4.06 4.65
(5.73) (3.38) (6.20)
Obs. 760 160 600
"Speedball" 1.48 1.77 1.40
(1.99) (1.69) (2.06)
Obs. 721 160 561
Note.― Medical marijuana states include only states that passed laws before July
2008; states that passed laws afterward are in “other states.”
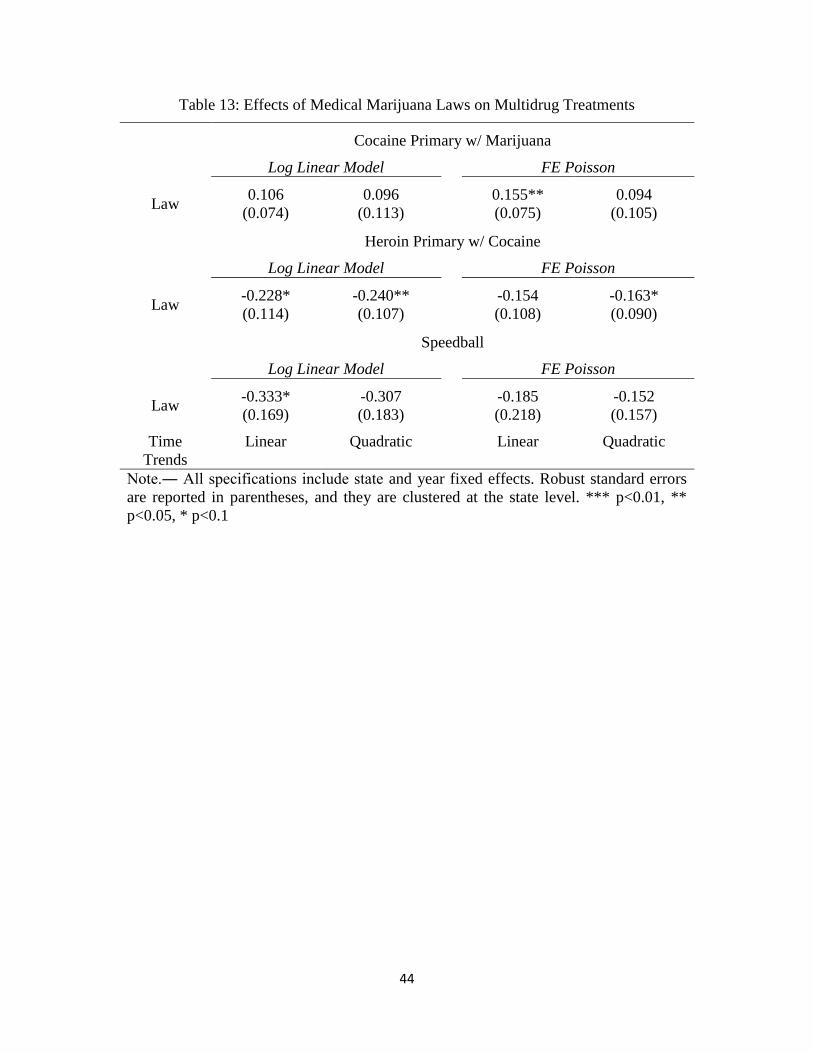
44
Table 13: Effects of Medical Marijuana Laws on Multidrug Treatments
Cocaine Primary w/ Marijuana
Log Linear Model FE Poisson
Law 0.106 0.096 0.155** 0.094
(0.074) (0.113) (0.075) (0.105)
Heroin Primary w/ Cocaine
Log Linear Model FE Poisson
Law -0.228* -0.240** -0.154 -0.163*
(0.114) (0.107) (0.108) (0.090)
Speedball
Log Linear Model FE Poisson
Law -0.333* -0.307 -0.185 -0.152
(0.169) (0.183) (0.218) (0.157)
Time
Trends
Linear Quadratic Linear Quadratic
Note.― All specifications include state and year fixed effects. Robust standard errors
are reported in parentheses, and they are clustered at the state level. *** p<0.01, **
p<0.05, * p<0.1

45
Figure 1: Arrests and Prices of Marijuana and Cocaine, 1992–2008 (Normalized)

46
Figure 2: Arrest Ratios of Marijuana and Cocaine in California and Colorado

47
Figure 3: Cocaine Arrest Ratios Before and After the Passage of Laws
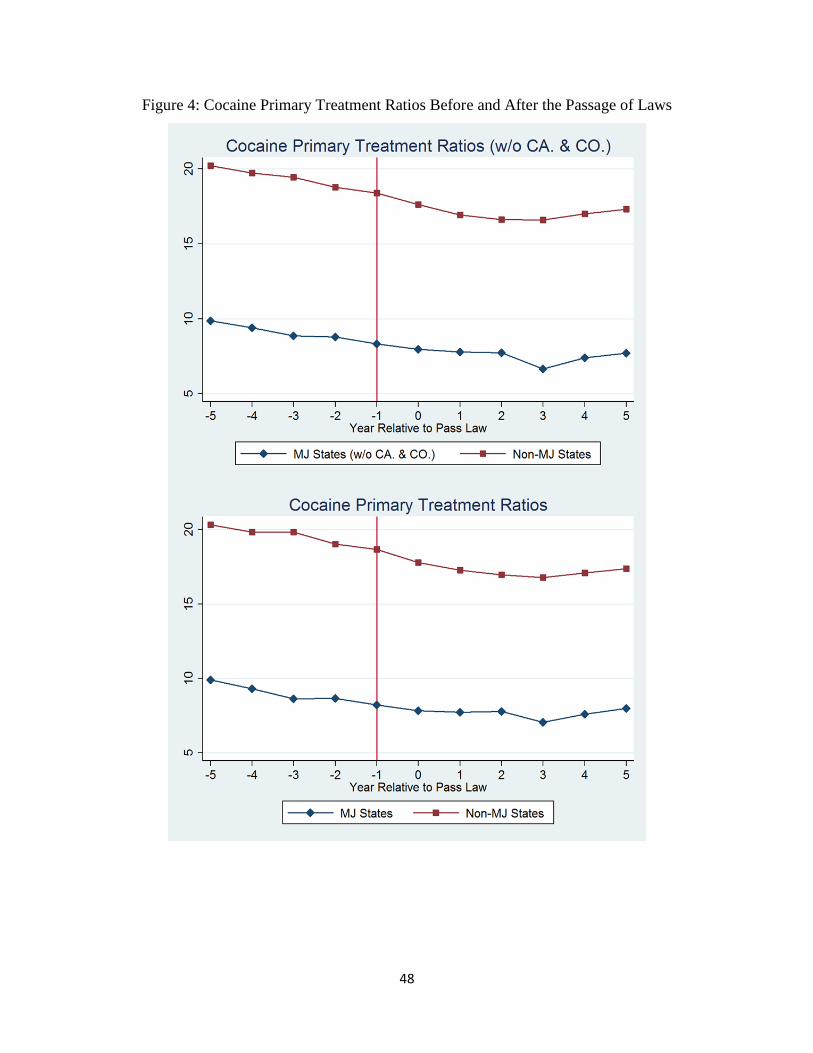
48
Figure 4: Cocaine Primary Treatment Ratios Before and After the Passage of Laws

49
Figure 5: Heroin Primary Treatment Ratios Before and After the Passage of Laws

50
Appendix Table A: State Medical Marijuana Lawsi
State Pass/Effective date Pass rate Registration Possession Limit
Alaska Nov. 3, 1998
/Mar. 4, 1999
58%
( Ballot Measure 8) Yes
1 oz/ 6 plants
(3 mature,
3 immature)
Arizona Nov. 2, 2010 50.13%
(Proposition 203) Yes 2.5 oz/ 12 plants
California Nov. 5, 1996
/Nov. 6, 1996
56%
(Proposition 215)
Yes
(Voluntary since
Jan. 1, 2004)
8 oz/
6 mature or
12 immature
Colorado Nov. 7, 2000
/Jun. 1, 2001
54%
(Ballot Amendment 20) Yes
2 oz/ 6 plants
(3 mature,
3 immature)
Connecticut May 31, 2012
96-51 House; 21-13
Senate
(HB 5389)
Yes Not specified yet
D.C May 21, 2010
/Jul. 27, 2010
13-0 vote
(Amendment Act B18-
622)
Yes 2 oz/ Not
specified yet
Delaware May 13, 2011
/Jul. 1, 2011
27-14 House; 17-4
Senate
(Senate Bill 17)
Yes 6 oz
Hawaii Jun. 14, 2000
/Dec. 28, 2000
32-18 House; 13-12
Senate
(Senate Bill 862)
Yes
3 oz/ 7 plants
(3 mature,
4 immature)
Maine Nov. 2, 1999
/Dec. 22, 1999
61%
(Ballot Question 2)
Yes
(Mandatory after
Dec. 31, 2010)
2.5 oz/ 6 plants
Massachusetts Nov. 6,2012
/Jan. 1, 2013
63%
(Ballot Question 3) Yes Not specified yet
Michigan Nov. 4, 2008
/Dec. 4, 2008
63%
(Proposal 1) Yes 2.5 oz/ 12 plants
Montana Nov. 2, 2004 62%
(Initiative 148) Yes
1 oz/4 plants
(mature)
Nevada Nov. 7, 2000
/Oct. 1, 2001
65%
(Ballot Question 9) Yes
1 oz/ 7 plants
(3 mature,
4 immature)
i For legal documents and detail, please see “18 Legal Medical Marijuana States and D.C.” on the ProCon.org website.
(Accessed March 12, 2013 from http://medicalmarijuana.procon.org/view.resource.php?resourceID=000881.)
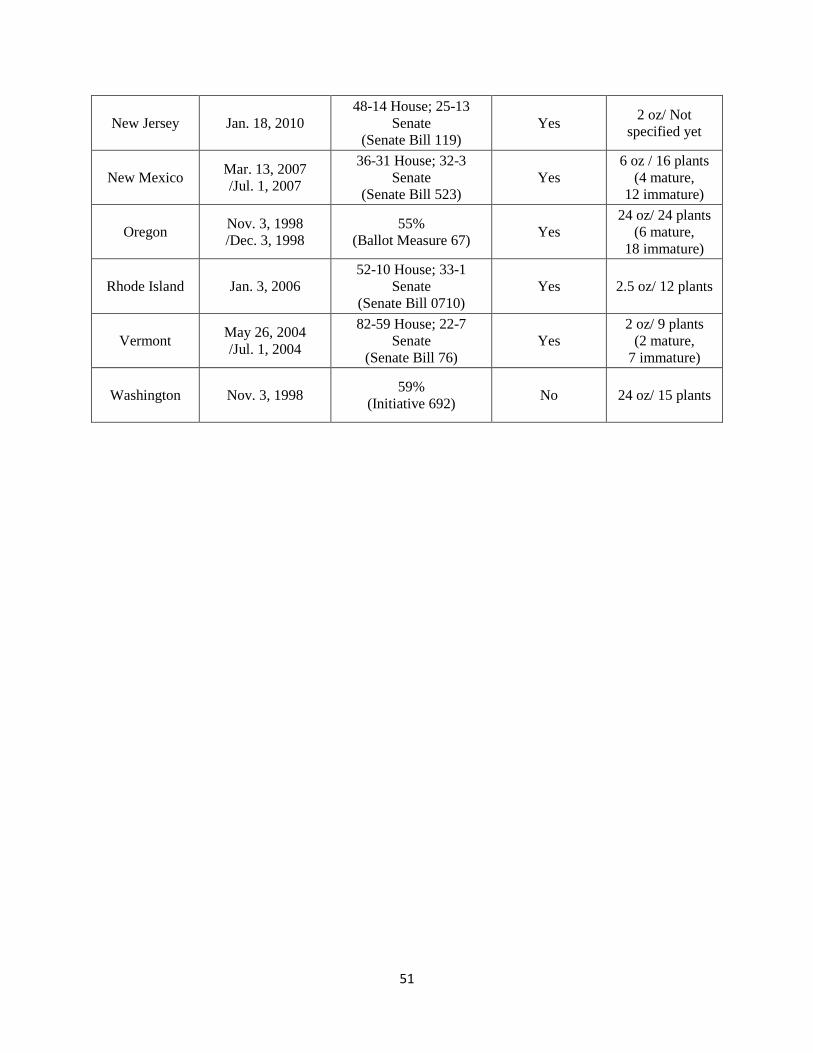
51
New Jersey Jan. 18, 2010
48-14 House; 25-13
Senate
(Senate Bill 119)
Yes 2 oz/ Not
specified yet
New Mexico Mar. 13, 2007
/Jul. 1, 2007
36-31 House; 32-3
Senate
(Senate Bill 523)
Yes
6 oz / 16 plants
(4 mature,
12 immature)
Oregon Nov. 3, 1998
/Dec. 3, 1998
55%
(Ballot Measure 67) Yes
24 oz/ 24 plants
(6 mature,
18 immature)
Rhode Island Jan. 3, 2006
52-10 House; 33-1
Senate
(Senate Bill 0710)
Yes 2.5 oz/ 12 plants
Vermont May 26, 2004
/Jul. 1, 2004
82-59 House; 22-7
Senate
(Senate Bill 76)
Yes
2 oz/ 9 plants
(2 mature,
7 immature)
Washington Nov. 3, 1998 59%
(Initiative 692) No 24 oz/ 15 plants