medical marijuana laws and youth marijuana usage...medical marijuana laws and teen marijuana use d....
TRANSCRIPT
Medical Marijuana Laws and Teen Marijuana Use
D. Mark Anderson
Montanta State University
Benjamin Hansen
University of Oregon
Daniel I. Rees
University of Colorado Denver
Institute for the Study of Labor (IZA)
September 2012
Abstract
While at least a dozen state legislatures in the United States are considering bills to allow the
consumption of marijuana for medicinal purposes, the federal government has recently
intensified its efforts to close medical marijuana dispensaries. Federal officials contend that the
legalization of medical marijuana encourages teenagers to use marijuana and have targeted
dispensaries operating within 1,000 feet of schools, parks and playgrounds. Using data from the
national and state Youth Risk Behavior Surveys, the National Longitudinal Survey of Youth
1997 and the Treatment Episode Data Set, we estimate the relationship between medical
marijuana laws and marijuana use. Our results are not consistent with the hypothesis that
legalization leads to increased use of marijuana by teenagers.
JEL Codes: K4, I1, D8
Key Words: Marijuana, Youth Risky Behavior, Medical Marijuana Laws
Corresponding Author. Email: [email protected]. Phone: 406-366-0921.
1
These last couple years, the amount of attention that’s been given to medical marijuana has been huge. And when
I've done focus groups with high school students in states where medical marijuana is legal, they say “Well, if it’s
called medicine and it’s given to patients by caregivers, then that’s really the wrong message for us as high school
students.”
--R. Gil Kerlikowske, Director of the Office of National Drug Control Policy
1. INTRODUCTION
Tobacco and alcohol use by American high school students has been declining since the
mid-1990s. Marijuana use followed a similar trend until the mid-2000s, when, according to data
from Monitoring the Future, there was a 3 to 4 percentage-point increase in the percentage of
high school students who reported having smoked marijuana in the past 30 days accompanied by
a similarly-sized decrease in the percentage of 10th
and 12th
graders who view regular marijuana
use as risky (Johnston et al. 2011). Federal officials, including the Director of the Office of
National Drug Control Policy (also known as the “Drug Czar”), have attributed these
developments to the legalization of medical marijuana, noting that the medical marijuana
industry has grown dramatically since the mid-2000s.
In an effort to combat youth marijuana use, John Walsh, the U.S. Attorney for Colorado,
recently sent letters to medical marijuana dispensaries located within 1,000 feet of schools asking
them to relocate or close. Walsh cited figures from the Colorado Department of Education
showing that drug-related school suspensions, expulsions and law enforcement referrals
increased dramatically from 2008 through 2011 (Ingold 2012), and he was quoted as saying that
many school districts in Colorado “have seen a dramatic increase in student abuse of marijuana,
with resulting student suspensions and discipline” (McCrimmon and Jones 2012). Melinda
Haag, the U.S. Attorney for the Northern California district, has targeted dispensaries located
within 1,000 feet of schools, parks and playgrounds, arguing that marijuana serves as a gateway
2
drug and that, because “brains are not fully developed until your mid 20s”, youth are particularly
susceptible to its effects (Brooks 2012). Local law enforcement authorities have also argued that
there is a connection between the legalization of medical marijuana and the use of marijuana by
teenagers. For instance, Tim O’Connell, the Deputy Police Chief in Billings, Montana, was
quoted by Uken (2012) as saying, “We are definitely seeing an increase in the schools, and it’s
definitely related to bad legislation…We can thank the passage of legalizing marijuana.”
There is, in fact, evidence that adolescents and young adults who use marijuana are more
likely to use other substances such as alcohol and cocaine (Saffer and Chaloupka 1999;
DeSimone and Farrelly 2003; Williams et al. 2004; Yörük and Yörük 2011), as well as evidence
that they are more likely to suffer from mental health problems (Fergusson et al. 2003; van Ours
and Williams 2011), partake in risky sexual behaviors (Rashad and Kaestner 2004), and do
poorly in school (Yamada et al. 1996; Roebuck et al. 2003; van Ours and Williams 2009).
However, only two previous studies have examined the relationship between medical marijuana
laws (hereafter MMLs) and marijuana use among minors.1 Drawing on data from the National
Survey on Drug Use and Health (NSDUH) for the years 2002 through 2007, Wall et al. (2011)
found that rates of marijuana use among 12- through 17-year-olds were higher in states that had
legalized medical marijuana than in states that had not, but noted that “in the years prior to MML
passage, there was already a higher prevalence of use and lower perceptions of risk” in states that
1 Several studies have examined the relationship between MMLs and marijuana consumption without focusing on
minors. Khatapoush and Hallfors (2004) used data on 16- though 25-year-olds living in California and 10 other
states. They found no evidence that marijuana consumption went up after California legalized medical marijuana in
1996. Using data for the period 1995–2002 from Denver, Los Angeles, Portland, San Diego and San Jose, Gorman
and Huber Jr. (2007) found little evidence that marijuana consumption increased among adult arrestees as a result of
the legalization of medical marijuana. Cerdá et al. (2012) examined the cross-sectional relationship between MMLs
and marijuana use among adults 18 years of age and above. Other studies have examined the relationship between
the decriminalization of marijuana and marijuana use (Thies and Register 1993; Saffer and Chaloupka 1999;
Damrongplasit et al. 2010; Williams 2004). See also Van het Loo et al. (2002) who discussed the decriminalization
of drug use in Portugal, and Adda et al. (2011) who analyzed the relationship between the depenalization of
cannabis possession and crime in London.
3
had legalized medical marijuana (p. 714). Drawing on NSDUH data for the years 2002 through
2009, Harper et al. (2012) found that legalization was associated with a small reduction in the
rate of marijuana use among 12- through 17-year-olds.
The current study examines the relationship between MMLs and marijuana consumption
among high school students using data from the national and state Youth Risky Behavior
Surveys (YRBS) for the years 1993 through 2011. These data cover a period when 16 states,
including Alaska, California, Maine, Oregon and Washington, legalized medical marijuana.2
The NSDUH did not provide information on substance use at the state level prior to 1999. As a
consequence, neither Wall et al. (2011) nor Harper et al. (2012) had information on substance
use among 12- through 17-year-olds in these states before legalization occurred.
Another advantage to using the YRBS data is that they contain information on the
behavior and characteristics of individuals, allowing us to examine the relationship between
MMLs and marijuana use by age and gender. With two exceptions (Khatapoush and Hallfors
2004; Cerdá et al. 2012), previous studies in this area have relied on aggregate data, despite the
fact that the choice to smoke marijuana is made at the individual level. Finally, the YRBS data
contain information on marijuana use and drug availability at school, and the use of other
substances such as alcohol and cocaine. These outcomes are of special interest given the current
efforts in California and Colorado to close dispensaries operating near schools and because
Melinda Haag, the U.S. Attorney for the Northern California district, has explicitly argued that
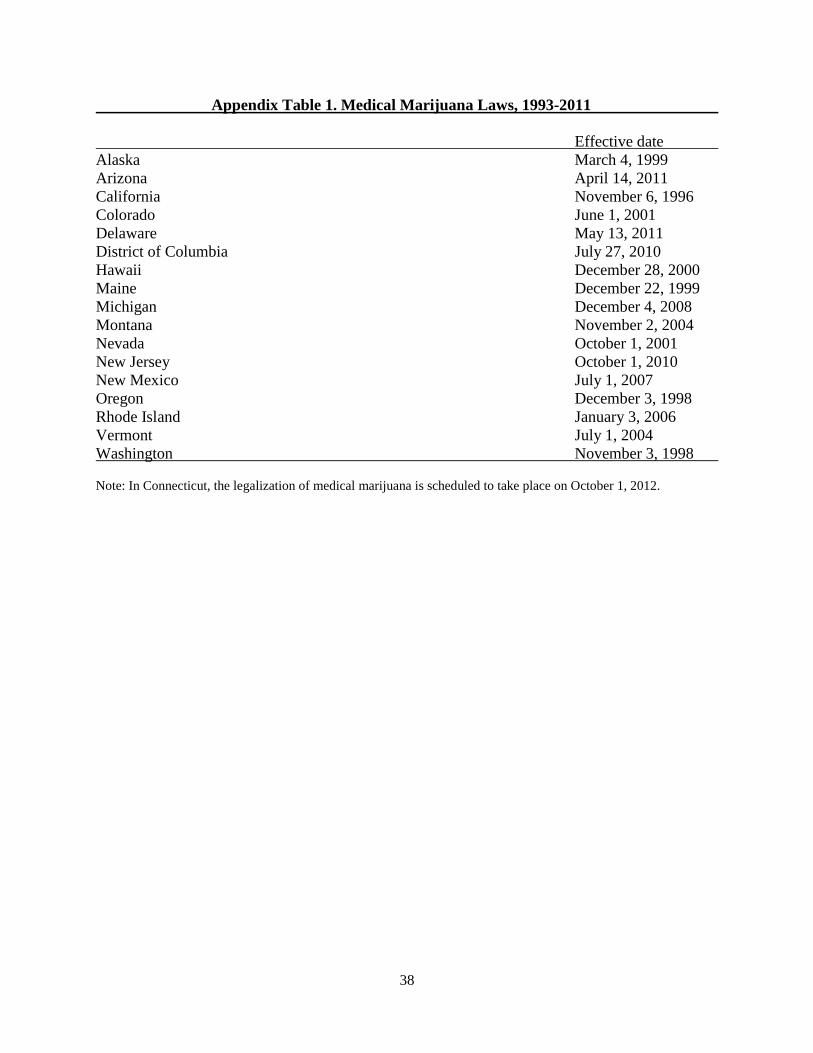
2 Appendix Table 1 provides a list of states that have legalized medical marijuana during the period 1993 through
2011. A number of states legalized medical marijuana prior to 1999, including California, Oregon and Washington.
The District of Columbia legalized medical marijuana on July 27, 2010. Although the New Jersey medical
marijuana law came into effect on October 1, 2010, implementation has been delayed (Brittain 2012). Coding New
Jersey as a non-medical marijuana state in 2011 has no appreciable impact on the results presented below.
4
marijuana is a gateway drug.3 Our results suggest that the legalization of medical marijuana was
not accompanied by increases in the use of marijuana (or other substances such as alcohol and
cocaine) among high school students. Specifically, estimates from our preferred specification
are small, negative and statistically indistinguishable from zero. Using the 95 percent confidence
interval around these estimates suggests that the impact of legalizing medical marijuana on the
probability of marijuana use in the past 30 days is no larger than 0.8 percentage points.
In addition to analyzing data from the YRBS, we conduct two complementary analyses.
The first uses data from the National Longitudinal Survey of Youth 1997 (NLSY97). The
behavior of NLSY97 respondents can be observed over time, allowing for the estimation of
models that control for unobserved heterogeneity at the individual level. The second uses data
from the Treatment Episode Data Set (TEDS), which contains information from drug treatment
providers on patients who reported using marijuana before being admitted. These analyses
provide further evidence that youth marijuana consumption did not increase with the legalization
of medical marijuana.
2. BACKGROUND
In 1996, California became the first state to legalize medical marijuana. Since then, 16
additional states and the District of Columbia have legalized medical marijuana, and more than a
dozen state legislatures are currently considering medical marijuana bills (Klofas and Letteney
2012). In addition to removing criminal penalties for using, possessing and cultivating medical
marijuana, medical marijuana laws provide immunity from prosecution to physicians who
recommend medical marijuana to their patients.
3 Using data on British youths, Pudney (2003) found little evidence of substantial gateway effects for “soft” drugs
such as cannabis. Using data on young people from Amsterdam, van Ours (2003) showed that the correlation
between cannabis and cocaine use was, in large part, attributable to unobserved personal characteristics.
5
While the therapeutic properties of marijuana are the subject of debate (Gilman 2005;
Cohen 2009), the client base of doctors who recommend medical marijuana has expanded to
include adolescents with conditions such as autism, insomnia, obsessive compulsive disorder,
and attention deficit hyperactivity disorder (Browstein 2009; Ellison 2009; Joseph et al. 2010).4
Advocates of recommending medical marijuana for these conditions maintain that it is safer than
alternative medicines such as methylphenidate (also known as “Ritalin”), the stimulant most
often prescribed to treat attention deficit hyperactivity disorder (Lucido 2004; Ellison 2009), and
zolpidem tartrate (also known as “Ambien”), a medication prescribed to treat insomnia
(Chaboya-Hembree 2012).
Patients under the age of 18 must have the permission of a parent or legal caregiver in
order to use medical marijuana, and must be accompanied by a parent or legal caregiver when
visiting a dispensary (Ellison 2009). Moreover, there is evidence from registry data that only a
small percentage of medical marijuana patients are minors. For instance, only 0.08 percent of
medical marijuana patients are under the age of 18 in Arizona; in Montana, 0.13 percent of
patients are under the age of 18.5 However, because it is prohibitively expensive for the
government to ensure that all marijuana ostensibly grown for the medicinal market ends up in the
hands of registered patients, diversion to the recreational market almost certainly occurs, and
ambiguity surrounding the source of supply creates legitimacy for illegal suppliers and decreases
the risk of selling marijuana to recreational users (Pacula et al. 2010). 6
These supply-side
4 Medical marijuana has also been used to treat adolescents suffering from chronic pain. Belkin (2009) described
the case of a 9-year-old autistic boy who used medical marijuana to treat constant pain. 5 Arizona and Montana are the only MML states that publicly record the age distribution of registered patients.
6 It has been estimated that thousands of pounds of surplus medical marijuana are diverted to the illegal market in
Colorado (Wirfs-Brock et al. 2010). Thurstone et al. (2011) interviewed 80 adolescents (15 through 19 years of
age) undergoing outpatient substance abuse treatment in Denver. Thirty-nine of the 80 reported having obtained
marijuana from someone with a medical marijuana license. Florio (2011) described the story of four eighth-graders
in Montana who received marijuana-laced cookies from a medical marijuana cardholder.
6
factors could, in theory, lead to lower prices in the illegal market and increase youth
consumption.
On the demand side, researchers, policymakers and law enforcement officials contend
that legalization reduces the stigma associated with the use of marijuana (Roan 2011; Suthers
2012; Uken 2012) and encourages young people to underestimate the health risks associated with
marijuana use (O’Connor 2011; Roan 2011). In addition, legalization could increase demand by
providing more opportunities for young people to interact with legitimate users (Pacula et al.
2010). Not surprisingly, past research has shown that attitudes and perceptions with regard to
the harmfulness of marijuana are strongly correlated with use (Bachman et al. 1998; Pacula et al.
2001).
Our empirical analysis is reduced-form, based on the approach taken by previous
researchers interested in the determinants of marijuana use. For instance, Farrelly et al. (1999)
examined the reduced-form relationship between more stringent anti-marijuana policies and
marijuana use, while Thies and Register (1993), Saffer and Chaloupka (1999) and Williams
(2004) examined the impact of decriminalization. In a similar vein, Pacula (1998), Farrelly et al.
(2001), and Williams et al. (2004) examined the impact of alcohol and cigarette policies on
marijuana use.
These studies provide some evidence that marijuana use is sensitive to changes in policy.
For example, Farrelly et al. (1999) found that stricter enforcement of marijuana laws by police
and higher fines for marijuana possession decreased use among adults. However, Farrelly et al.
(1999) found that these policies had little impact on marijuana use among those under the age of
21. Using data from the United States, Thies and Register (1993) found that decriminalization
did not lead to increased use of marijuana, while Saffer and Chaloupka (1999) found that
7
decriminalization increased the probability of having smoked marijuana in the past 30 days.
Using Australian data, Williams (2004) found that decriminalization increased marijuana use
among males over the age of 25, but had no effect on marijuana use by females or by younger
males. Finally, Farrelly et al. (2001) found that cigarette taxes were negatively related to
marijuana use, while Williams et al. (2004) found that cigarette prices were essentially unrelated
to marijuana use.
3. THE DATA
The primary data for this study come from the national and state YRBS. They are at the
individual (micro) level and cover the period 1993 through 2011.7 The national YRBS is
conducted biennially by the Centers for Disease Control and Prevention (CDC) and is a
nationally representative sample of U.S. high school students. Federal agencies rely upon the
national YRBS to track trends in adolescent behavior including eating and exercise habits,
violence, sexuality, and substance use. Previous studies such as Merrill et al. (1999) and Abdel-
Ghany and Wang (2003) have used these data to examine determinants of youth marijuana use.
The state surveys are coordinated by the CDC and are administered by state education and health
agencies. Like the national YRBS, the state YRBS is school-based and contains multiple items
designed to elicit information on risky behaviors. To our knowledge, no previous study has used
state YRBS data to examine the determinants of youth marijuana use.
Our analysis draws on both of these data sources in order to ensure that identification is
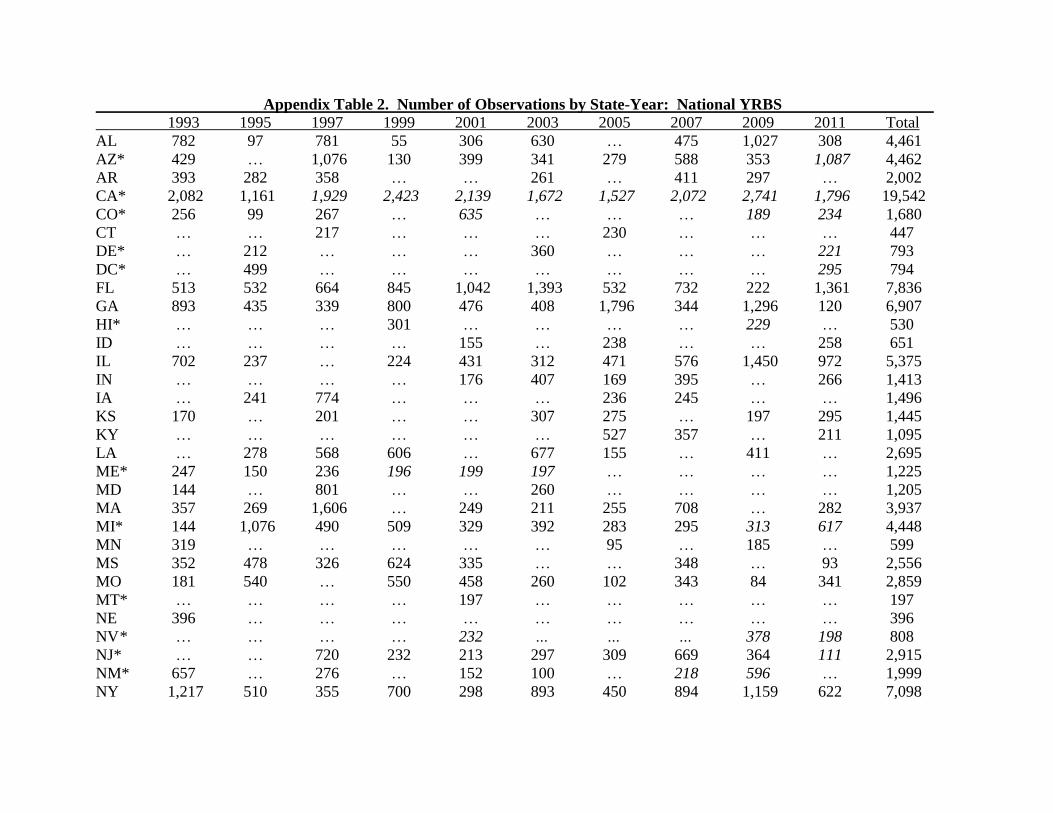
based on as many MML changes as possible. Although intended to be nationally representative,
not all 50 states are represented in any given wave of the national YRBS. In fact, between 1993
7The national YRBS was first conducted in 1991. However, because the 1991 wave is based on only a handful of
schools, we chose to omit it from the analysis.
8
and 2011, only 6 states contributed data to the national YRBS every year (California, Florida,
Georgia, Michigan, New York, and Texas), and 11 states contributed data to the national YRBS
before and after the legalization of medical marijuana (Arizona, California, Colorado, Delaware,
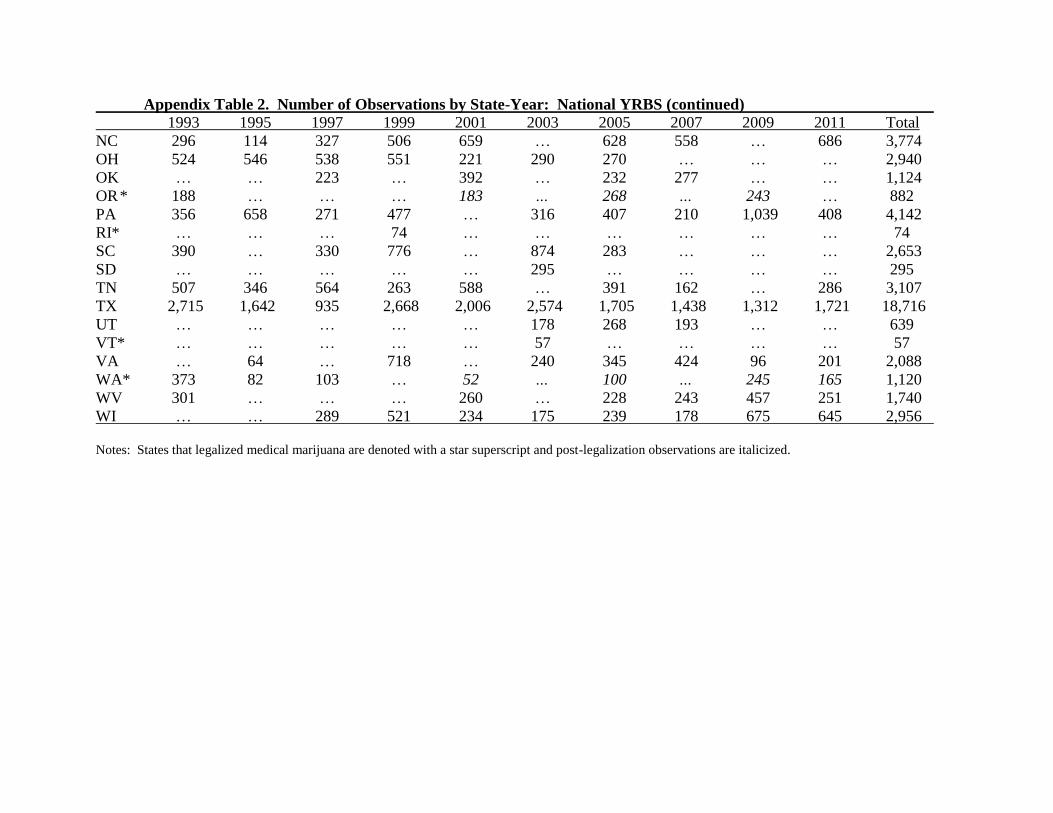
Hawaii, Maine, Michigan, New Jersey, New Mexico, Oregon, and Washington). Appendix
Table 2 shows the number of observations by year and state in the national YRBS. States that
legalized medical marijuana are denoted with a star superscript and post-legalization
observations are italicized.8
With a few exceptions, most states conducted their own version of the YRBS sometime
between 1993 and 2011, and at least 15 administered the YRBS in any given year during this
period.9 However, only 24 states have given the CDC permission to release their data, while 20
states require that requests to use their data be made directly. We have obtained data from 11 of
these 20 states, bringing our total to 35, 11 of which conducted surveys before and after the
legalization of medical marijuana (Alaska, Arizona, Delaware, Maine, Michigan, Montana,
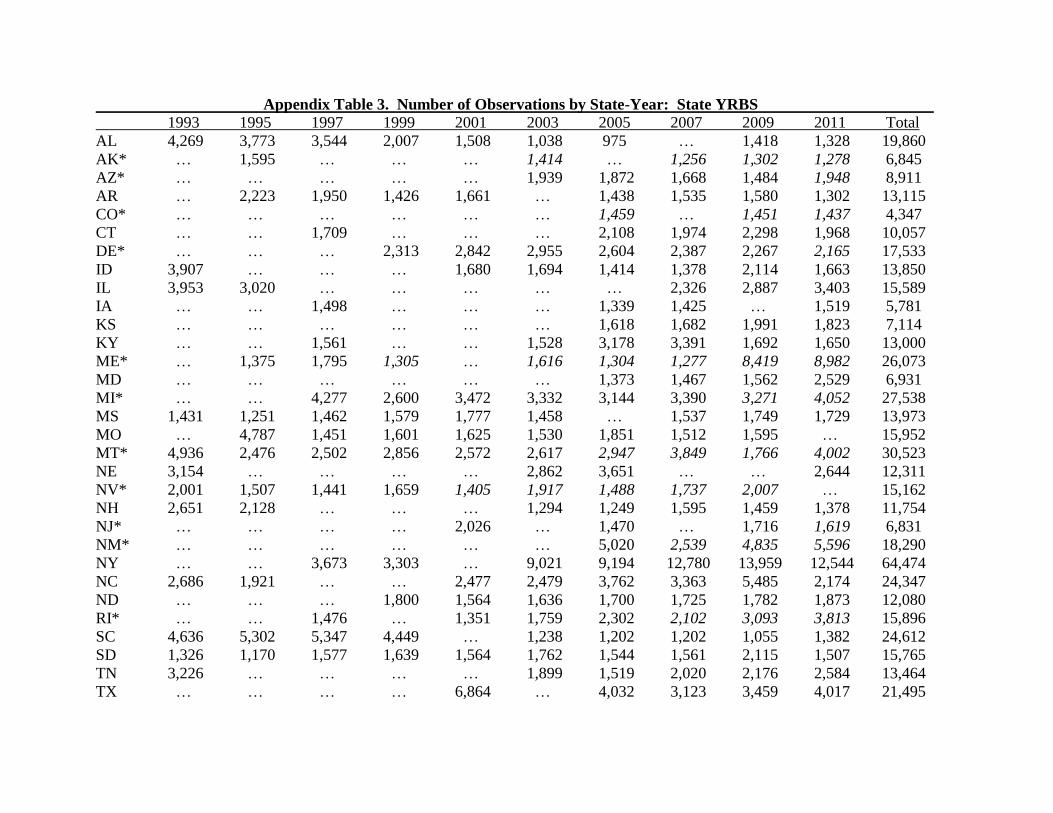
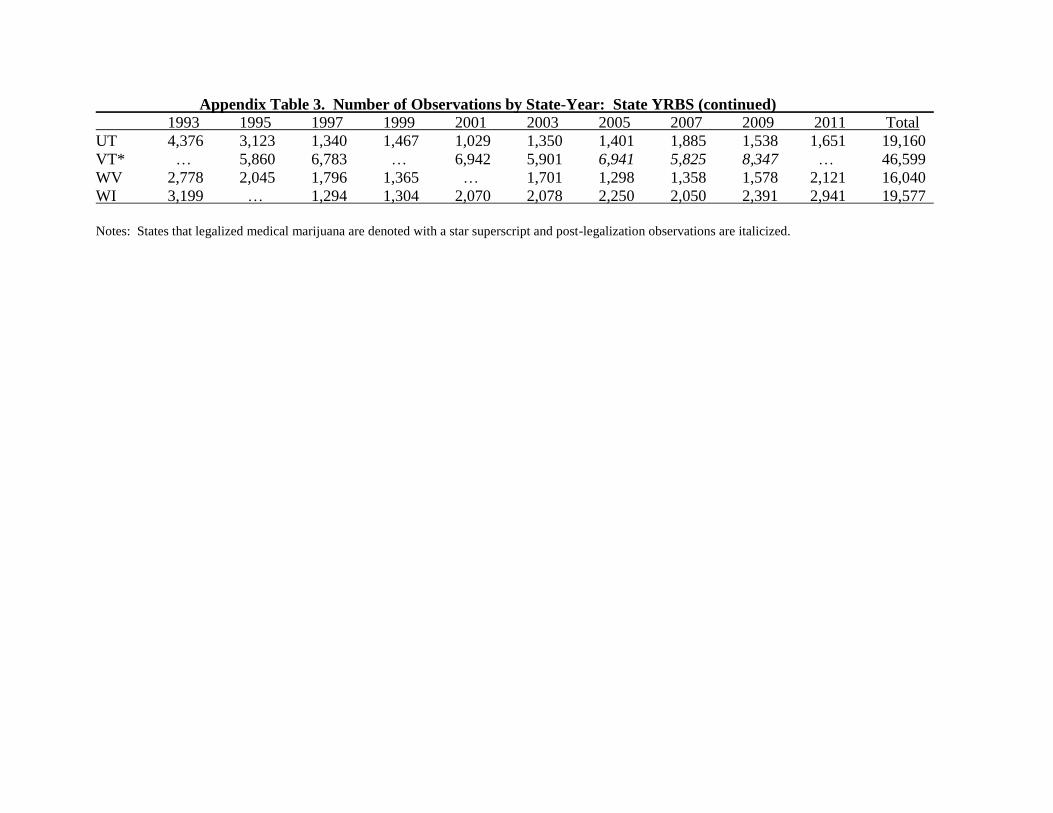
Nevada, New Jersey, New Mexico, Rhode Island, and Vermont). Appendix Table 3 shows the
number of observations each state contributed to the state YRBS analysis. Again, states that
legalized medical marijuana are denoted with a star superscript and post-legalization
observations are italicized.
When combined, the national and state YRBS data cover the District of Columbia and 49
states; sixteen of these states contributed data before and after the legalization of medical
8 In the regression analyses, the fraction of the year that the law was in effect was used when a state legalized
medical marijuana during a survey year. We experimented with assigning 0 to these years; we also experimented
with assigning 1 to these years. The results, which are available upon request, were similar to those reported below.
9 The following CDC webpage provides a detailed history of the state YRBS:
http://www.cdc.gov/healthyyouth/yrbs/history-states.htm.
9
marijuana.10
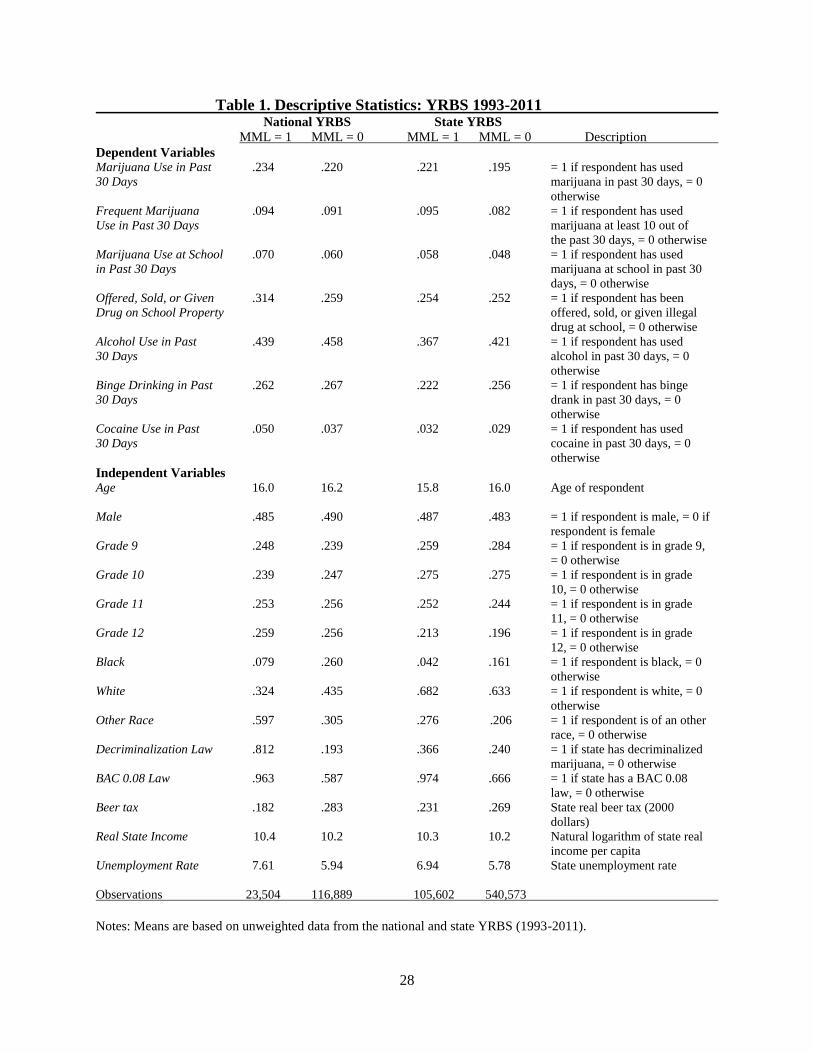
Table 1 provides descriptive statistics for the national and state YRBS samples by
whether medical marijuana was legal at the time of the interview. According to the national
YRBS data, 22 percent of high school students used marijuana at least once in the past 30 days,
and 9 percent used marijuana at least 10 times during the past 30 days (our definition of frequent
use). In the state YRBS data, 21 percent of respondents used marijuana in the past 30 days and 8
percent were frequent users.
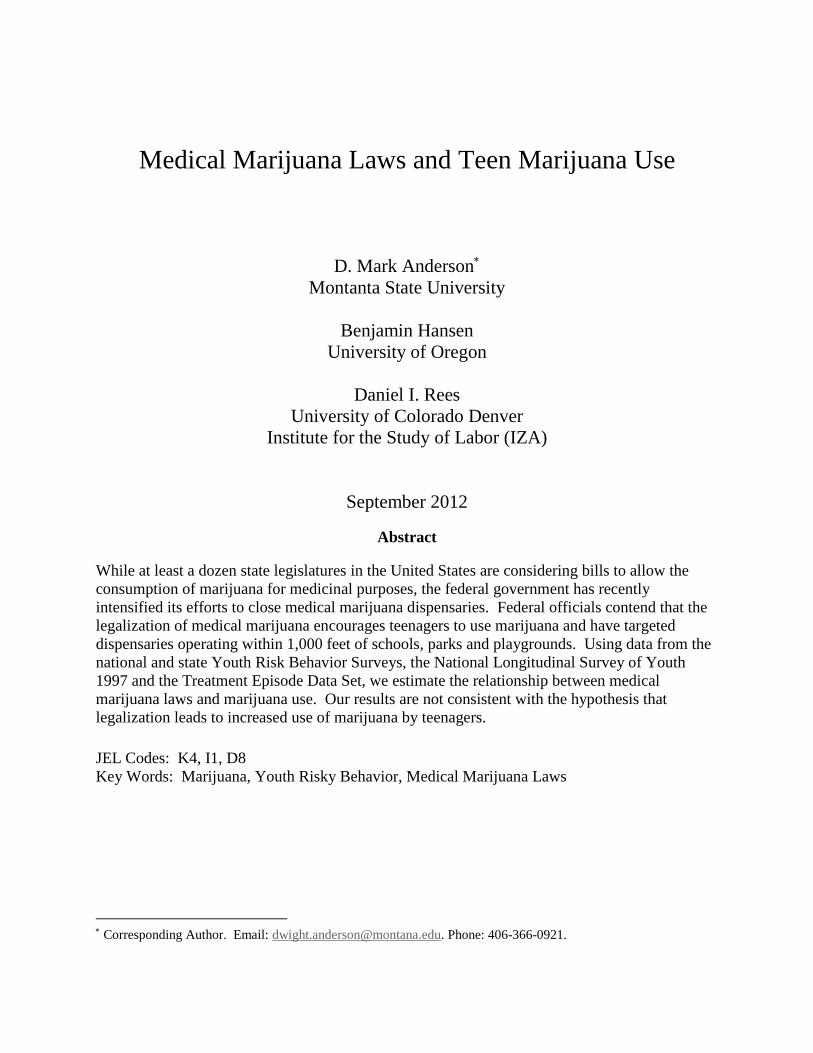
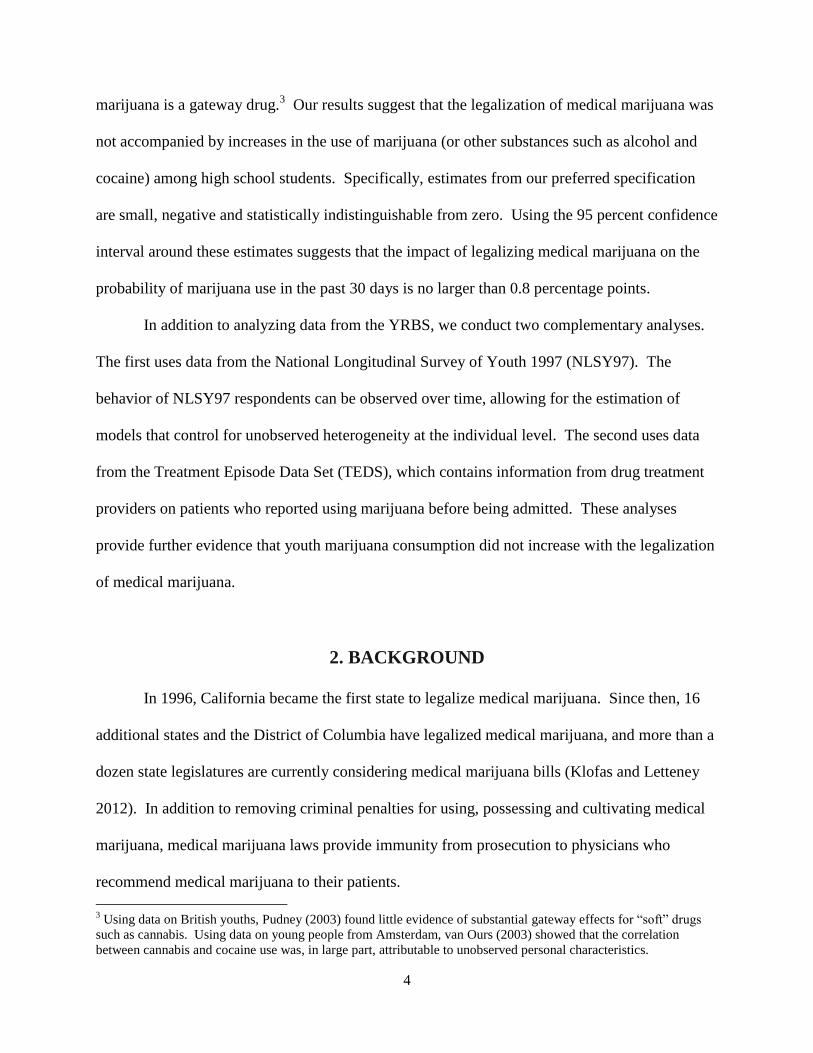
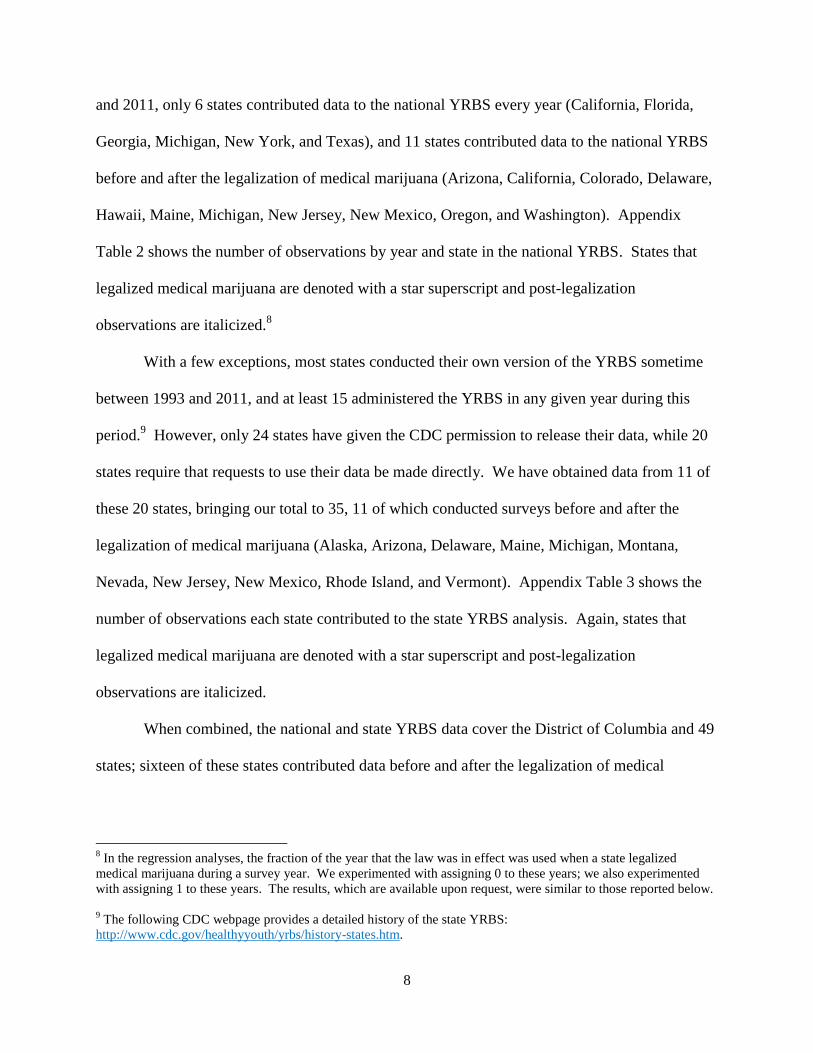
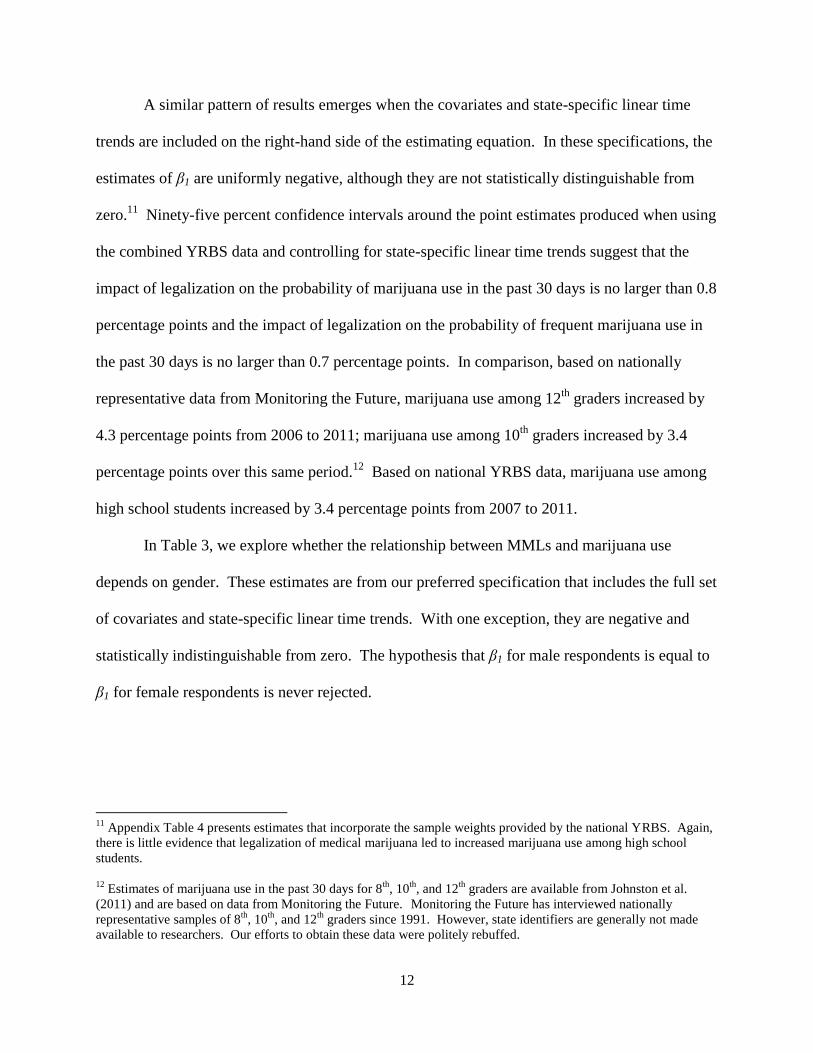
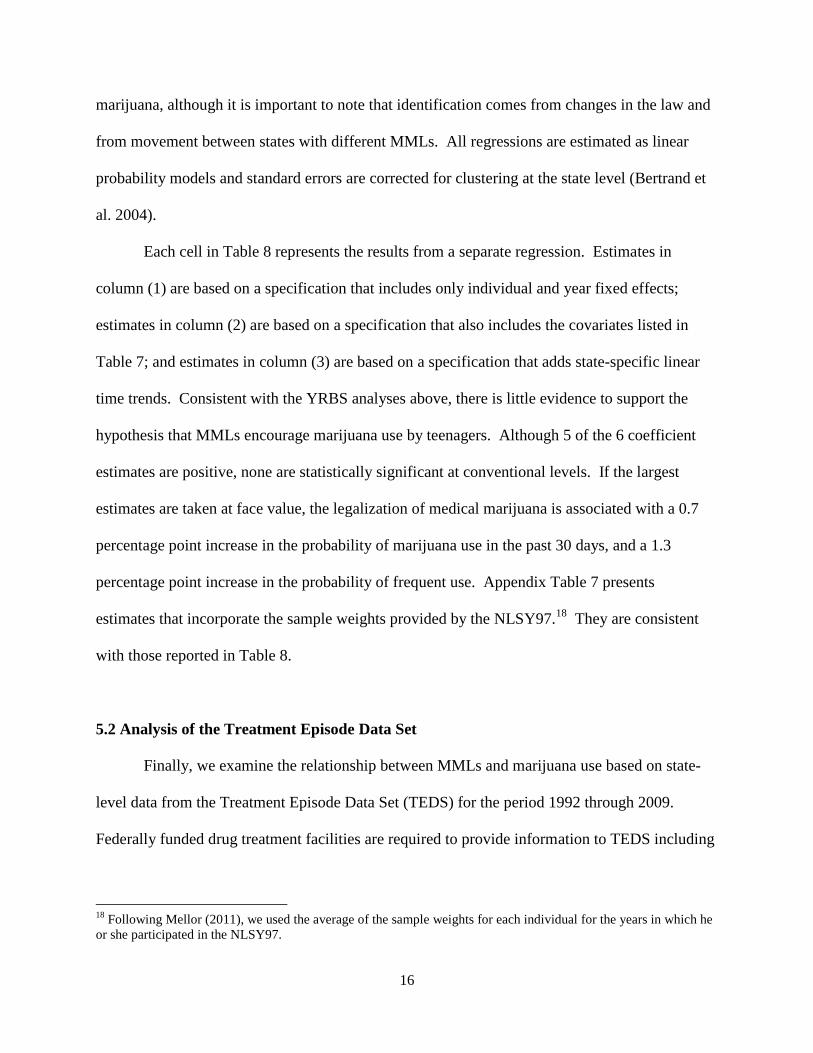
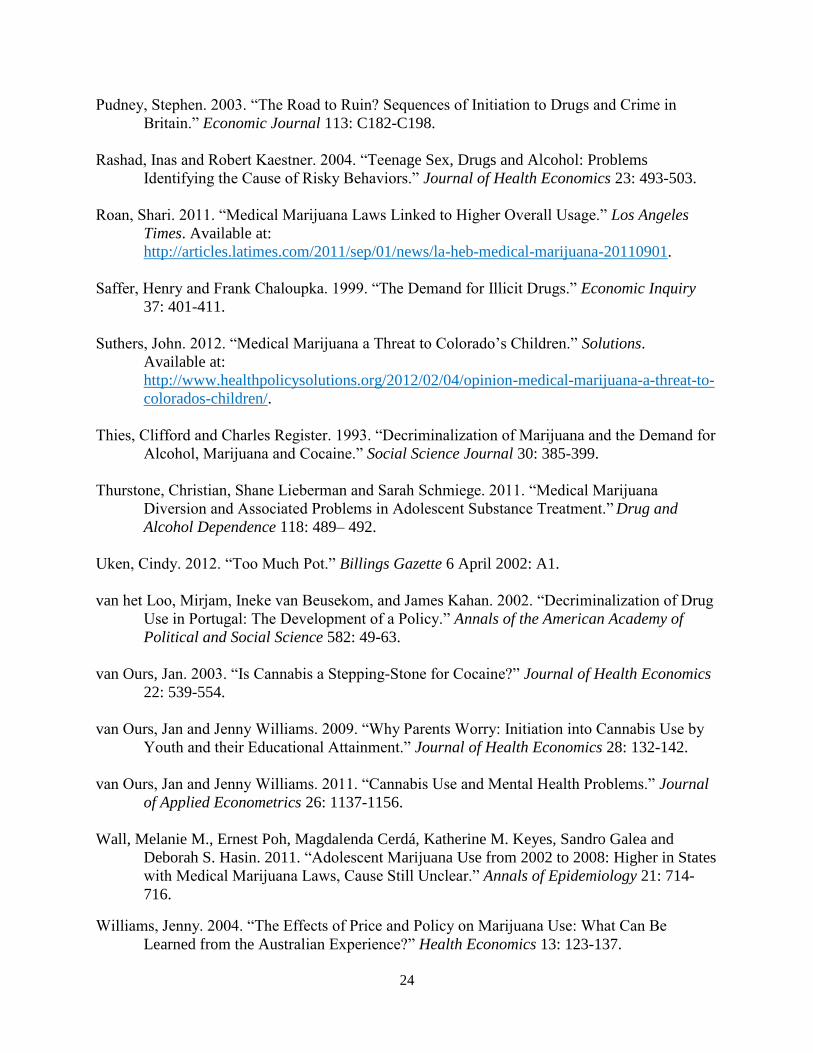
Figure 1 presents trends in marijuana use based on weighted national YRBS data. It
shows a steady decline in marijuana use among high school students from the late 1990s through
2007. From 2007 to 2011, the percentage of high school students who used marijuana in the past
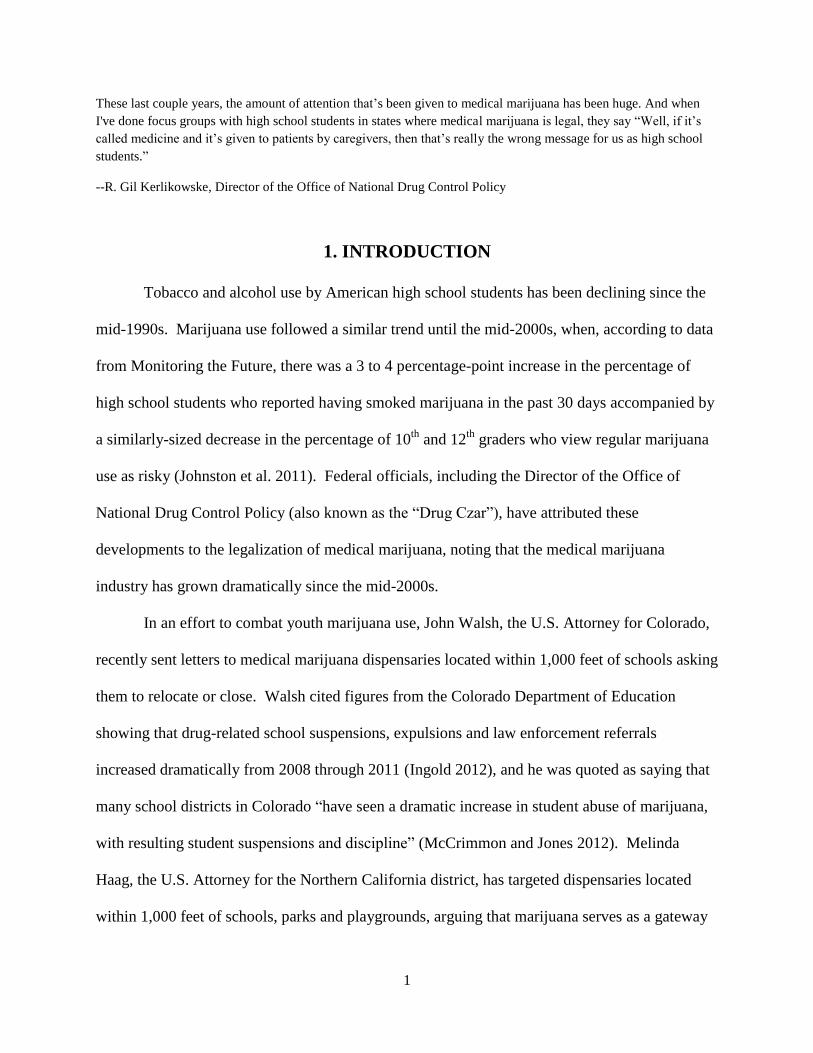
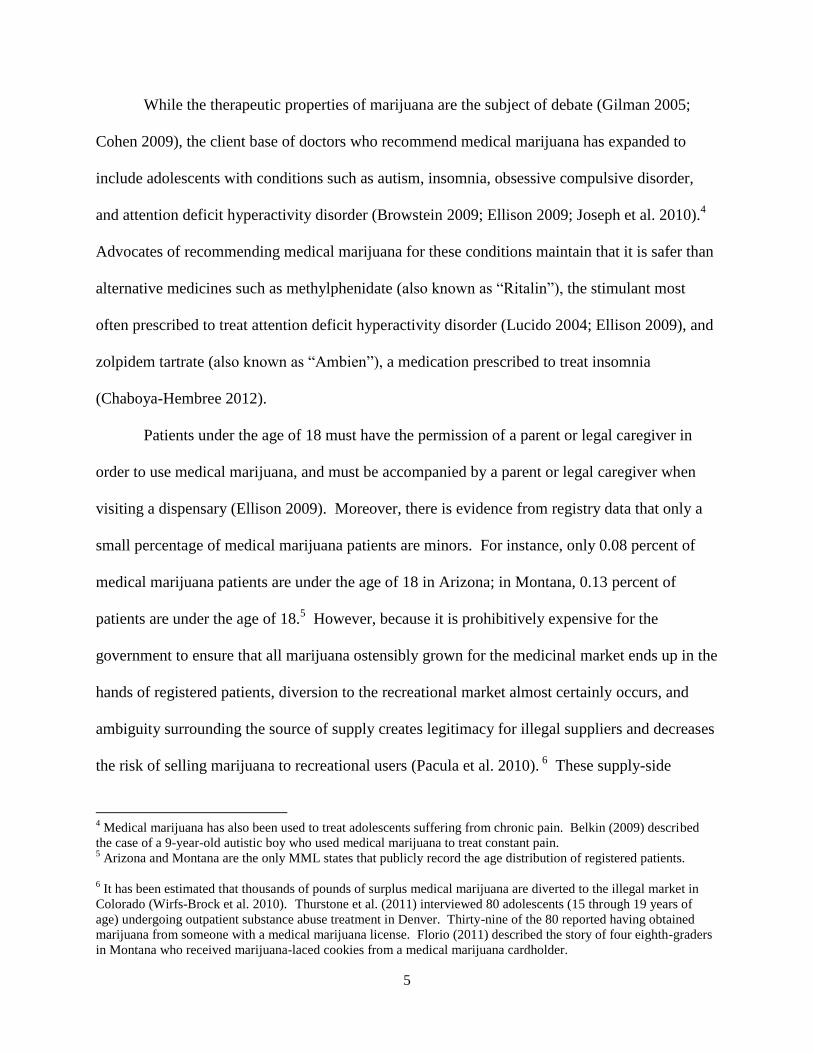
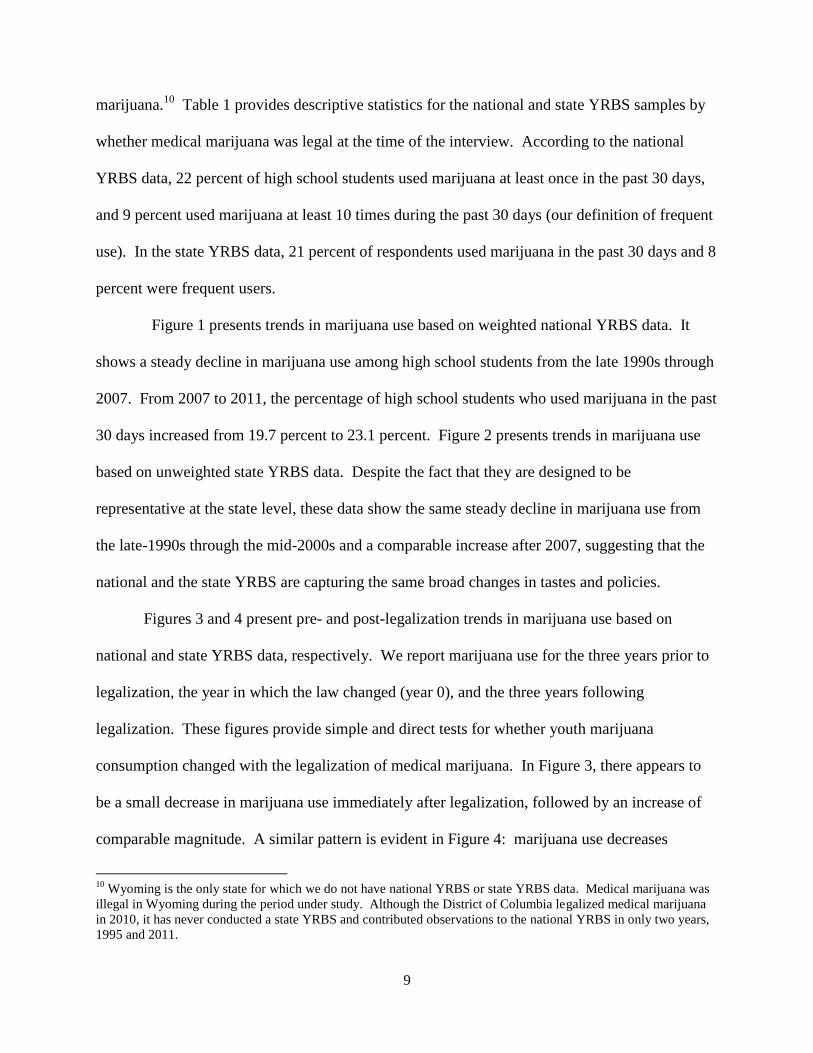
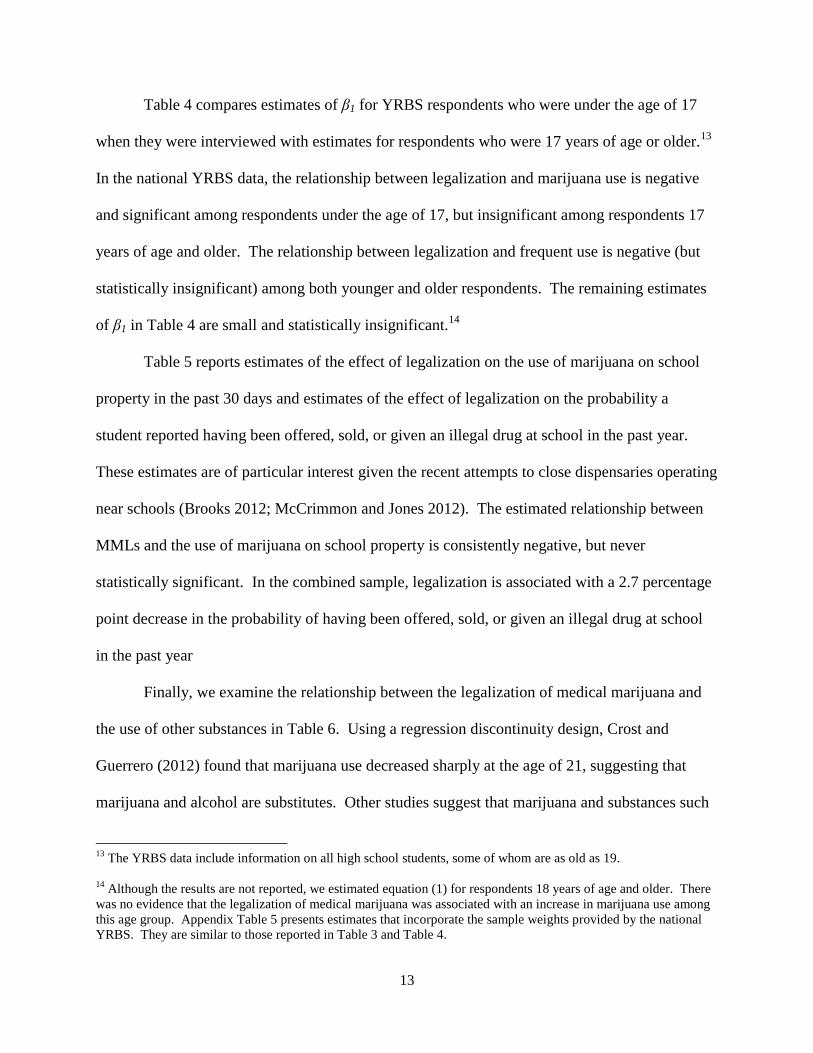
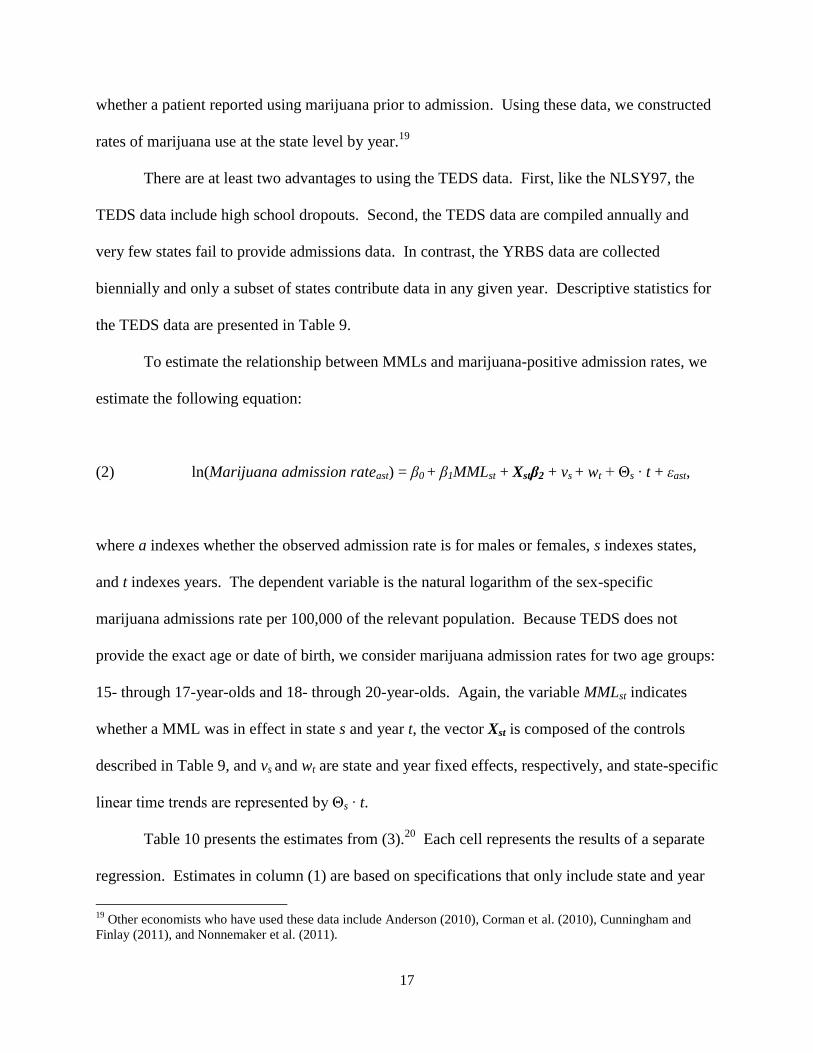
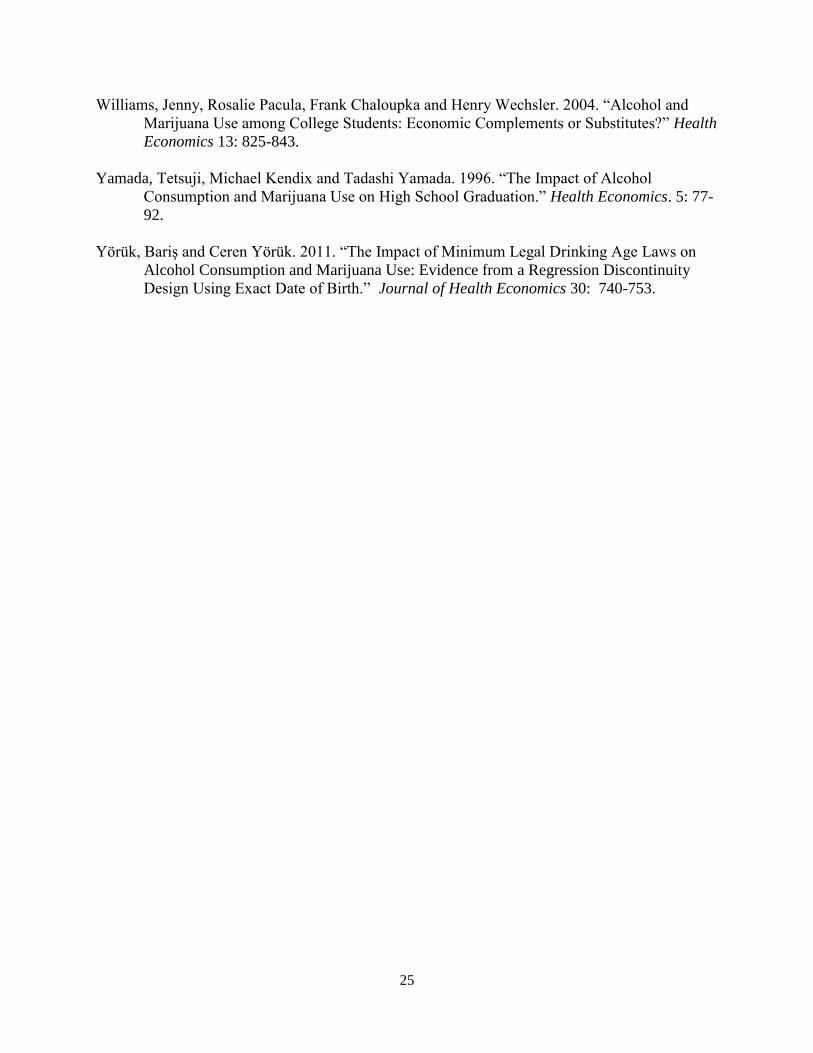
30 days increased from 19.7 percent to 23.1 percent. Figure 2 presents trends in marijuana use
based on unweighted state YRBS data. Despite the fact that they are designed to be
representative at the state level, these data show the same steady decline in marijuana use from
the late-1990s through the mid-2000s and a comparable increase after 2007, suggesting that the
national and the state YRBS are capturing the same broad changes in tastes and policies.
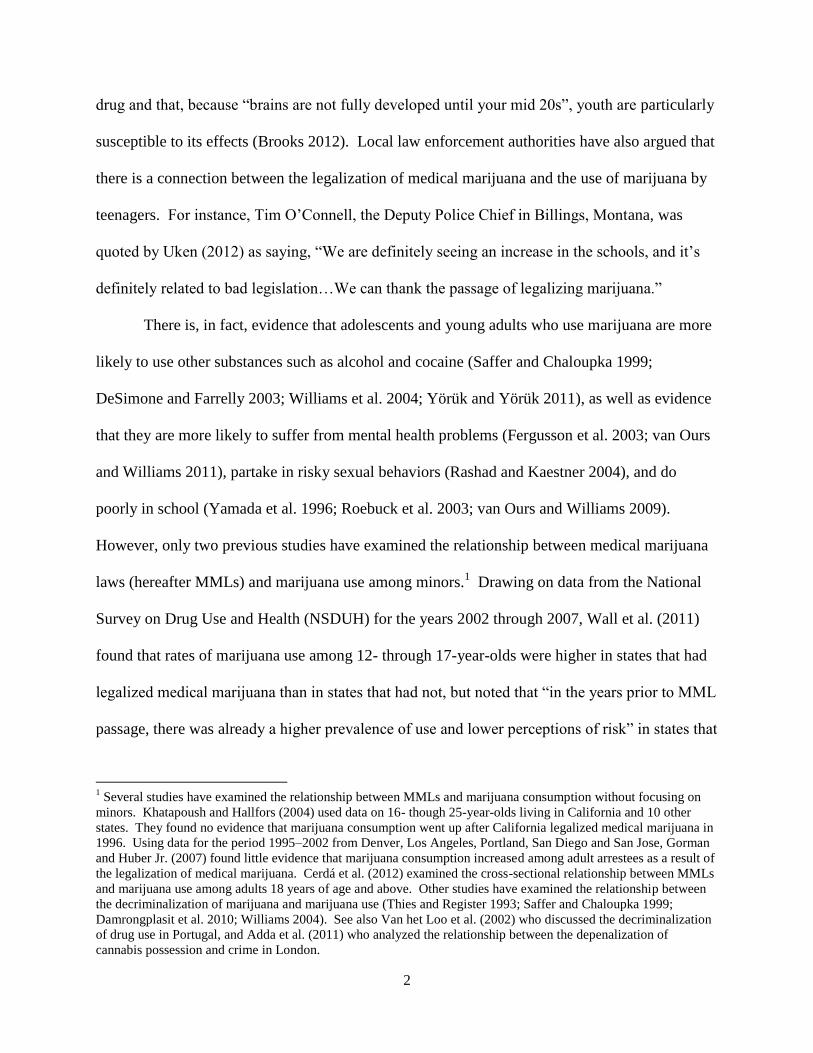
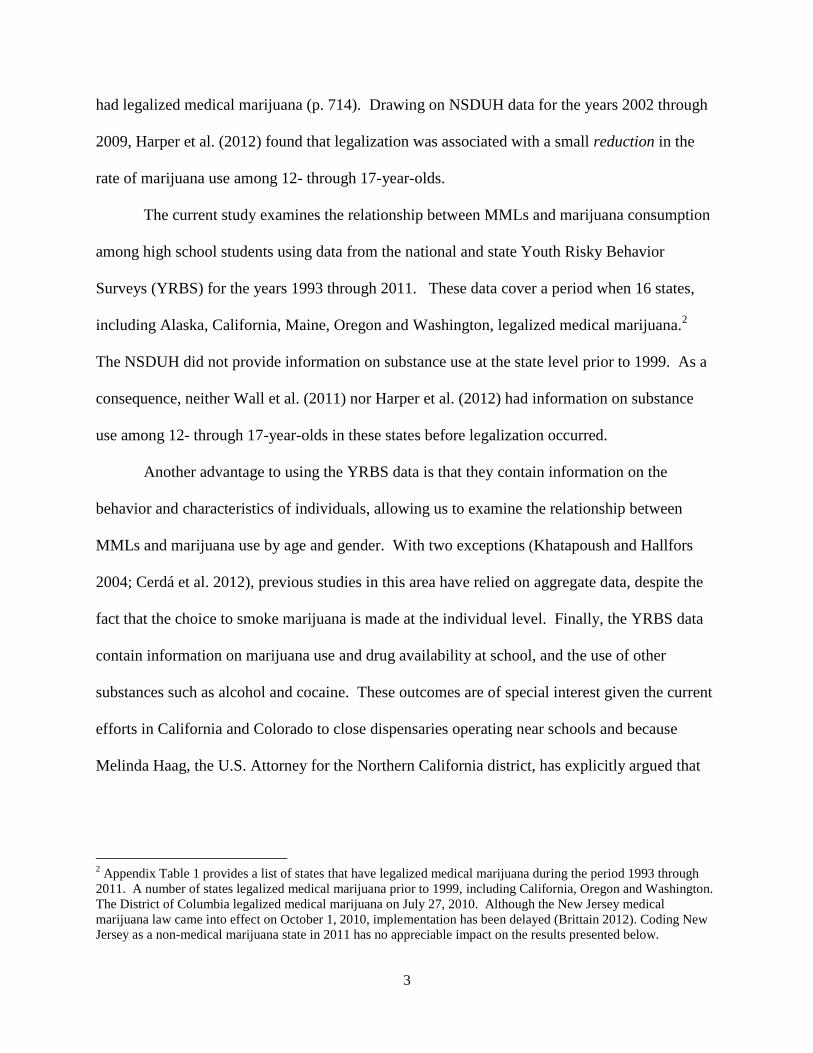
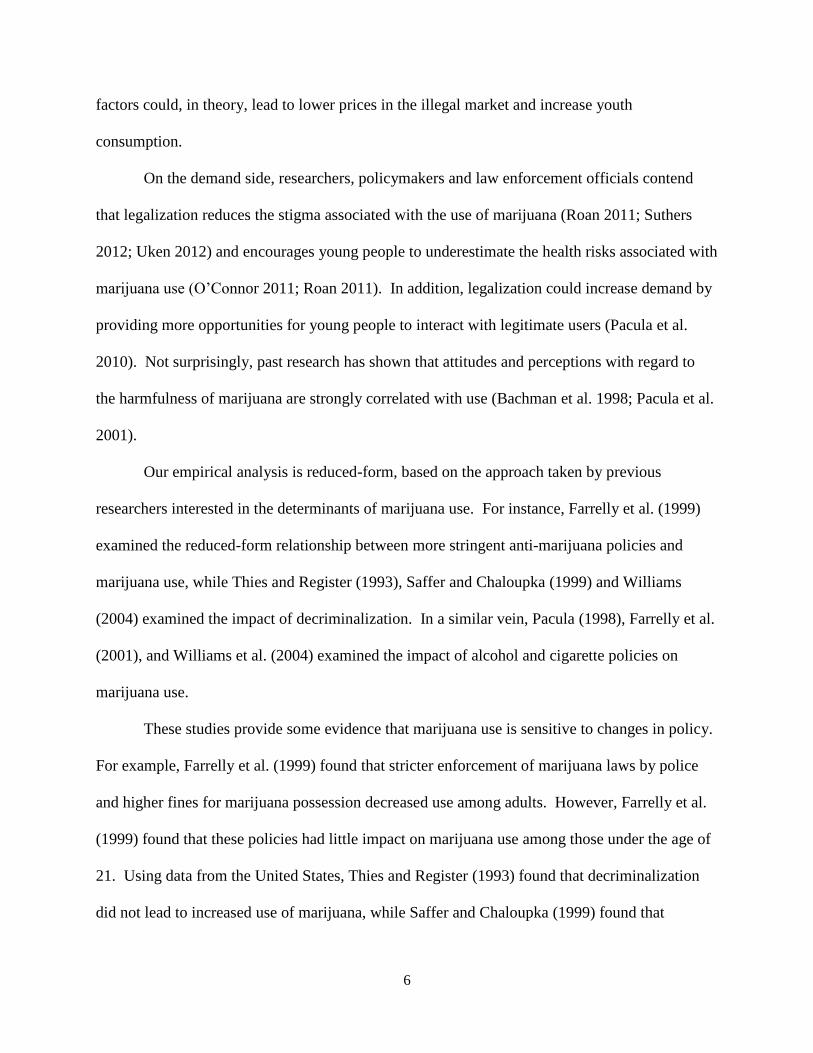
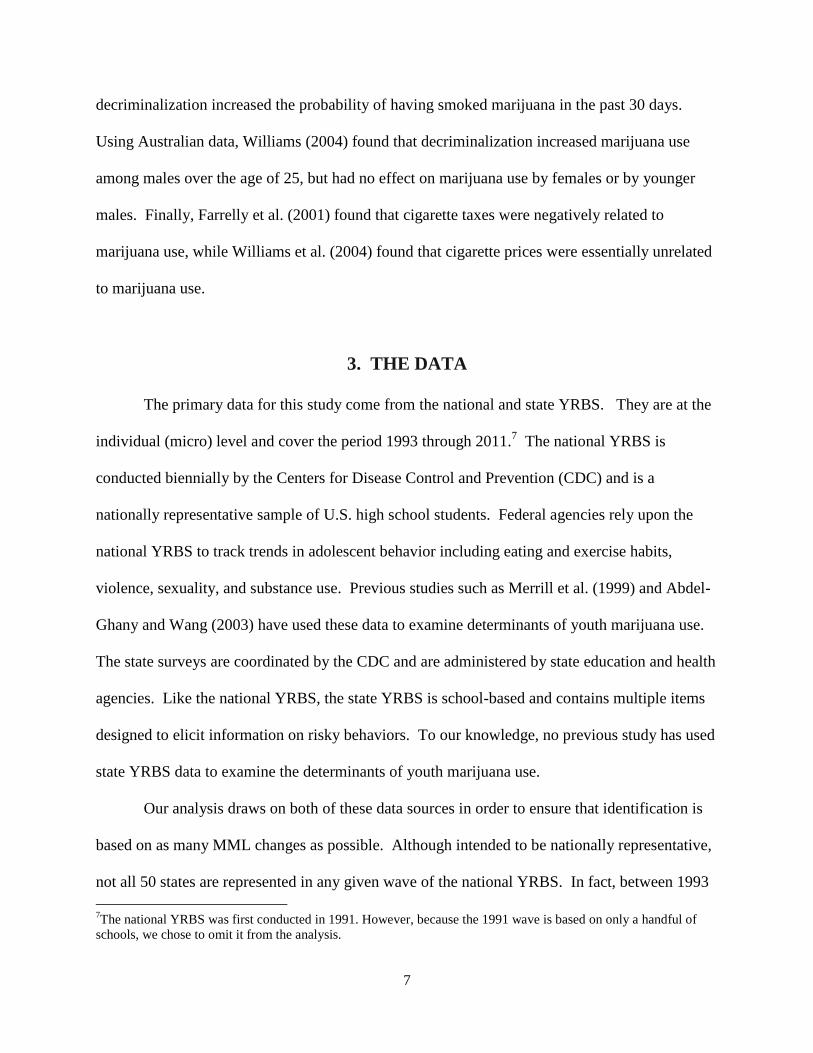
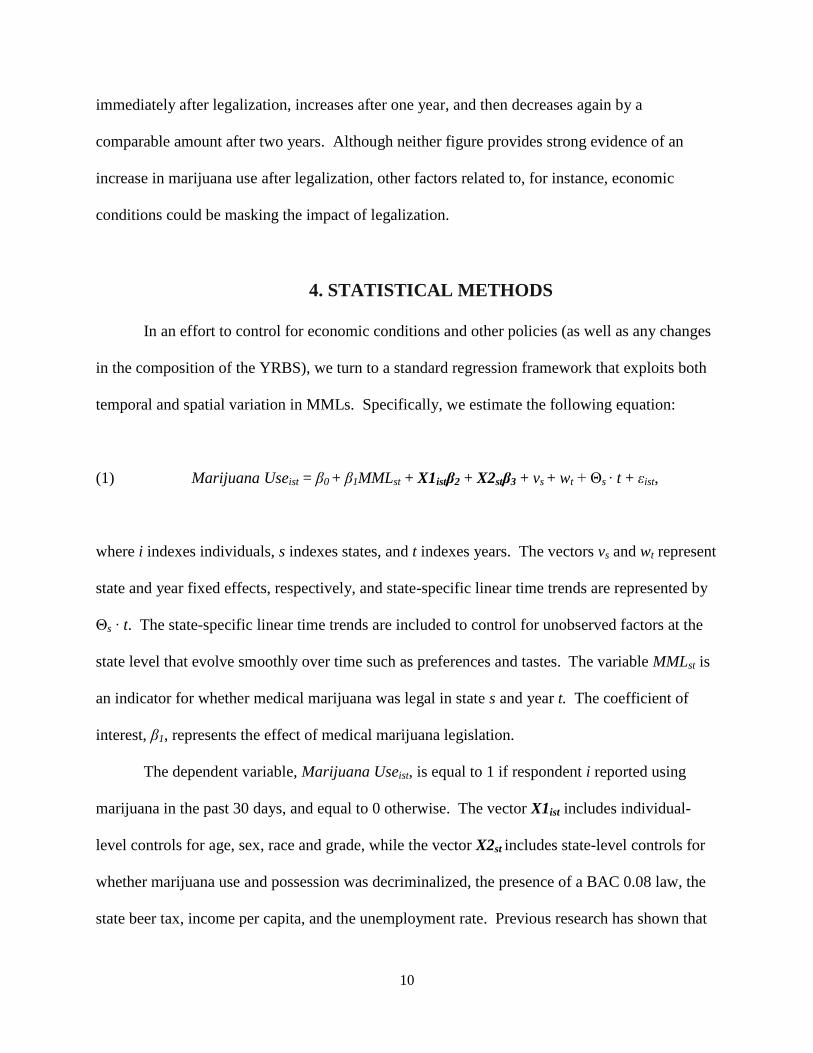
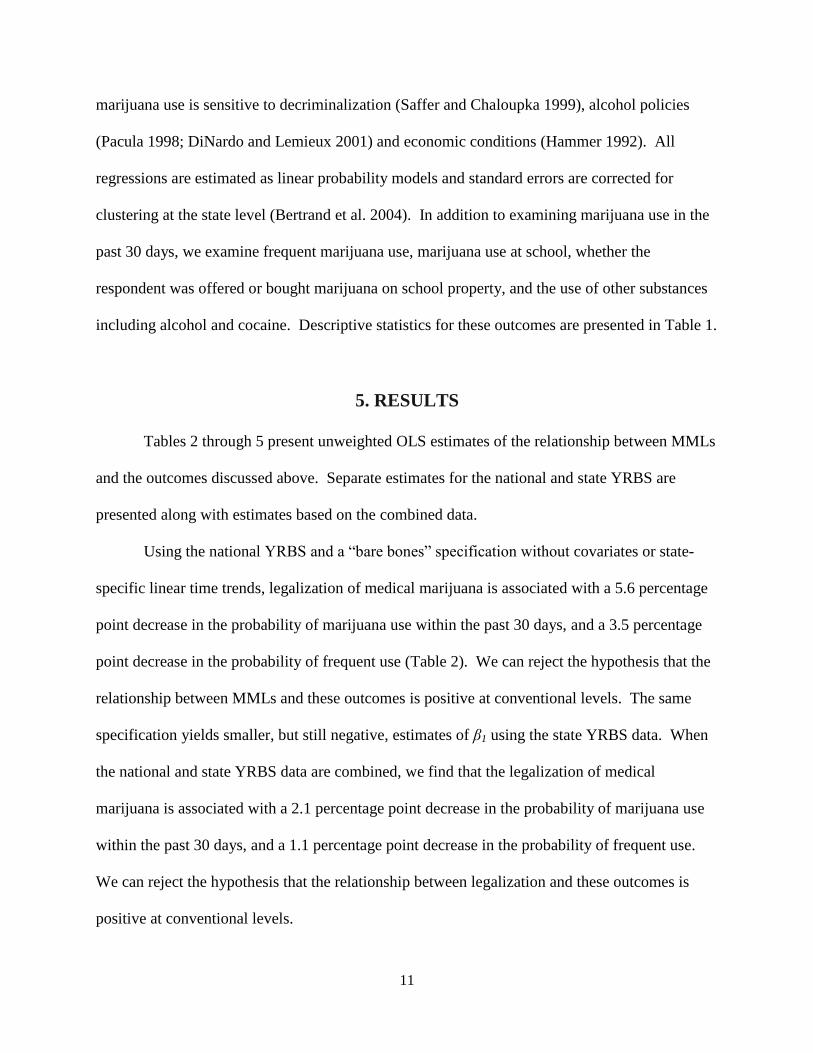
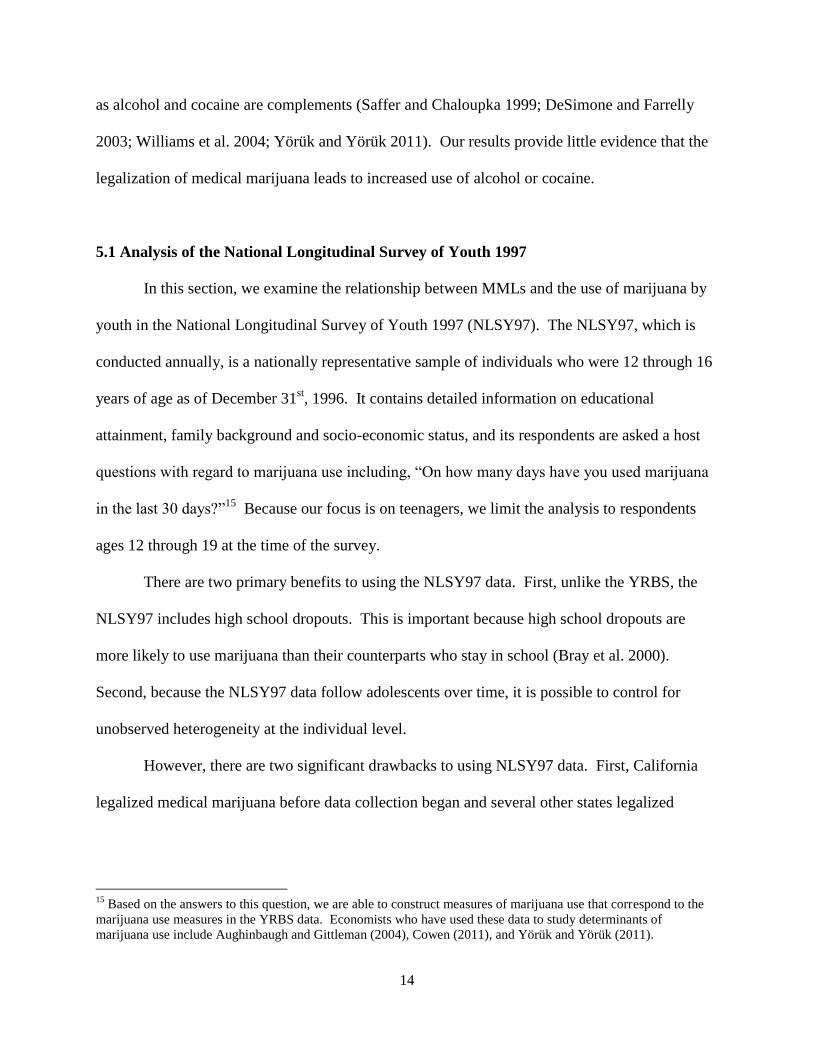
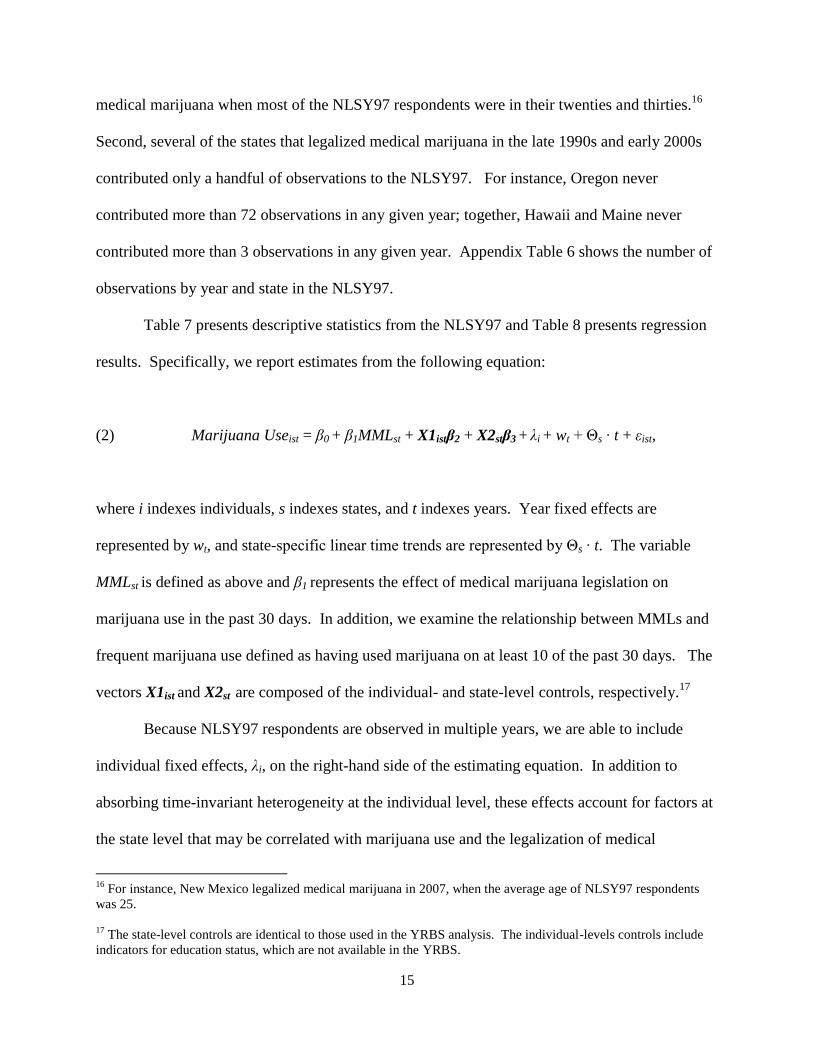
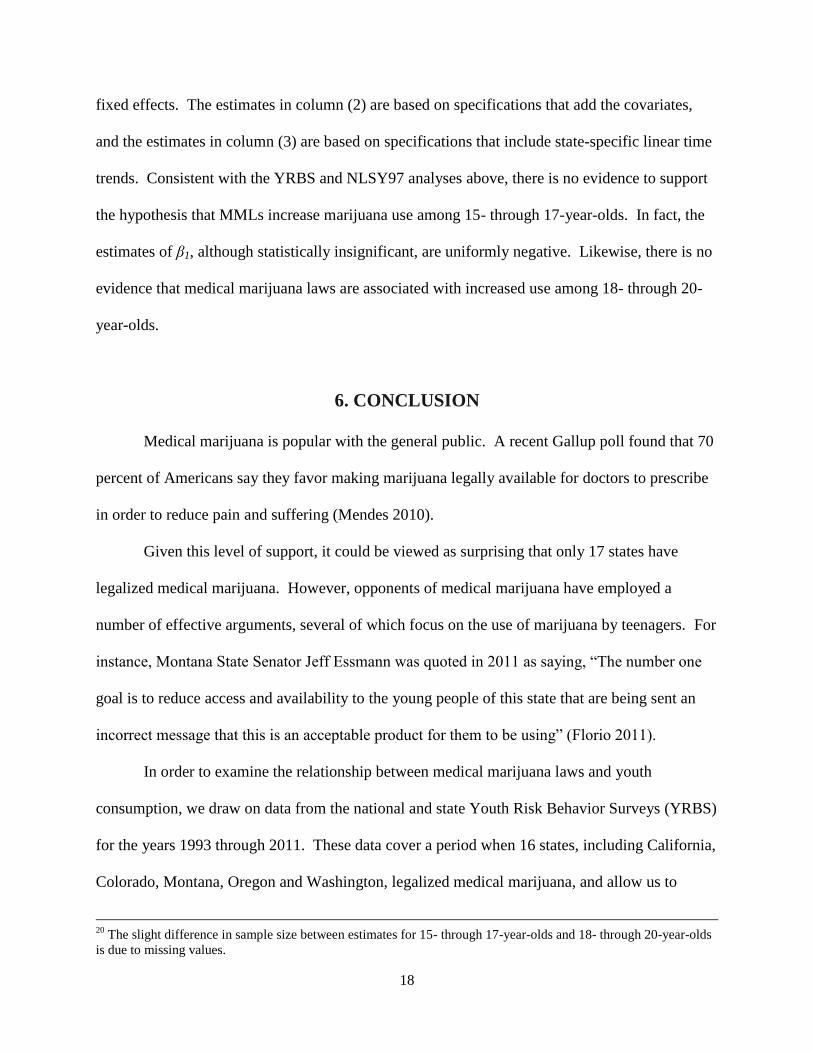
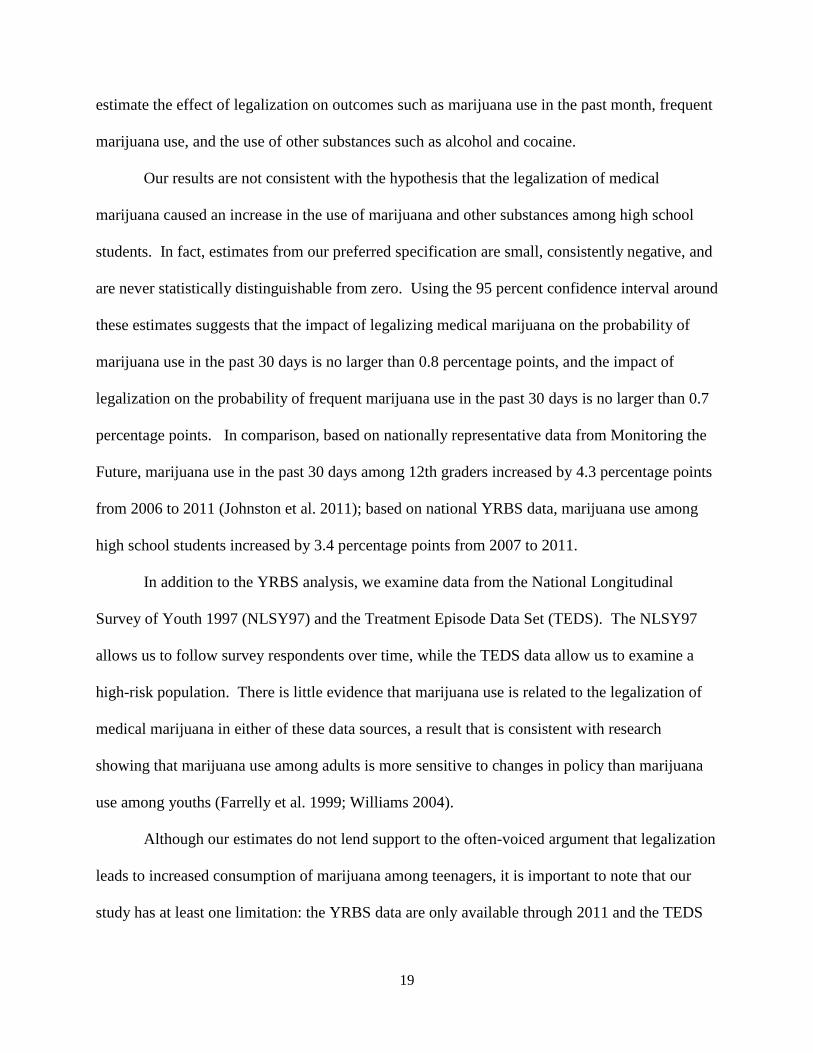
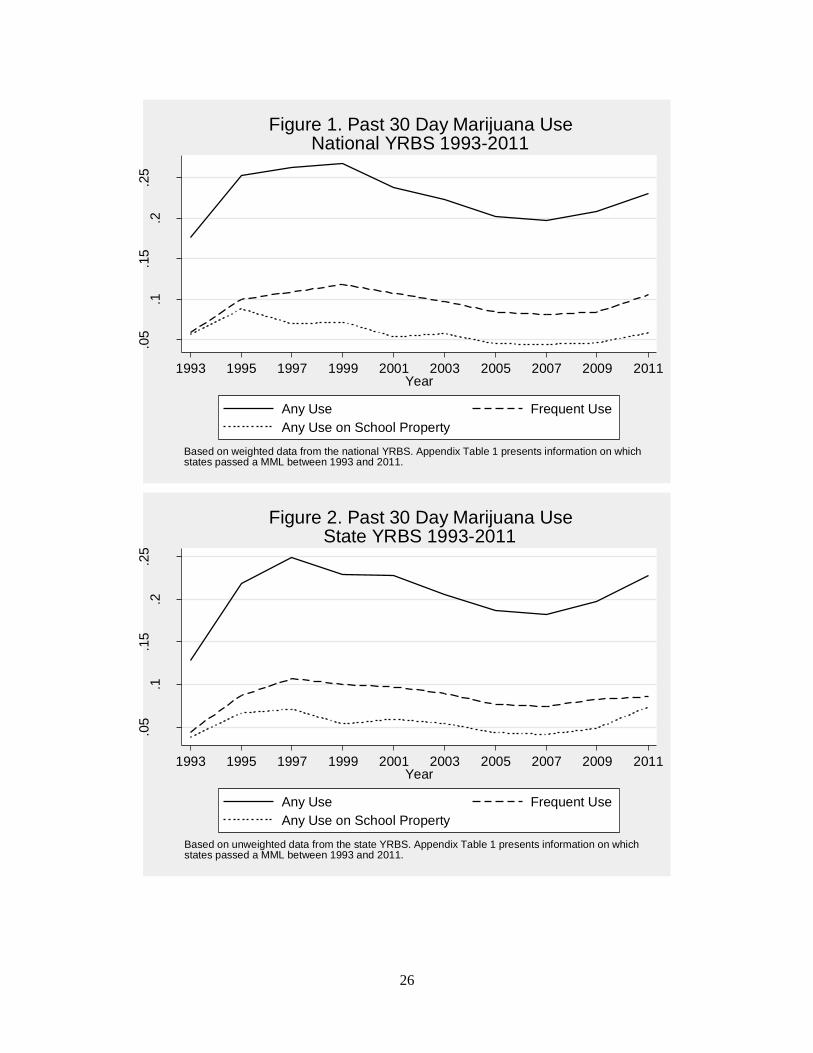
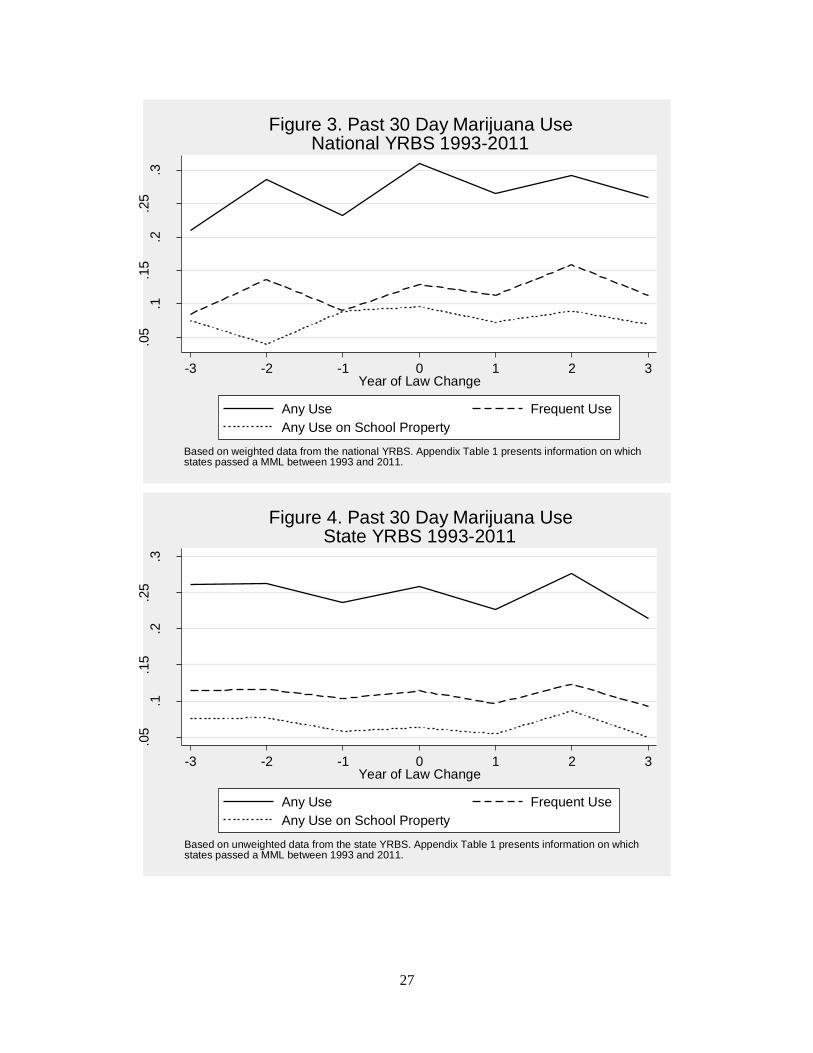
Figures 3 and 4 present pre- and post-legalization trends in marijuana use based on
national and state YRBS data, respectively. We report marijuana use for the three years prior to
legalization, the year in which the law changed (year 0), and the three years following
legalization. These figures provide simple and direct tests for whether youth marijuana
consumption changed with the legalization of medical marijuana. In Figure 3, there appears to
be a small decrease in marijuana use immediately after legalization, followed by an increase of
comparable magnitude. A similar pattern is evident in Figure 4: marijuana use decreases
10
Wyoming is the only state for which we do not have national YRBS or state YRBS data. Medical marijuana was
illegal in Wyoming during the period under study. Although the District of Columbia legalized medical marijuana
in 2010, it has never conducted a state YRBS and contributed observations to the national YRBS in only two years,
1995 and 2011.
10
immediately after legalization, increases after one year, and then decreases again by a
comparable amount after two years. Although neither figure provides strong evidence of an
increase in marijuana use after legalization, other factors related to, for instance, economic
conditions could be masking the impact of legalization.
4. STATISTICAL METHODS
In an effort to control for economic conditions and other policies (as well as any changes
in the composition of the YRBS), we turn to a standard regression framework that exploits both
temporal and spatial variation in MMLs. Specifically, we estimate the following equation:
(1) Marijuana Useist = β0 + β1MMLst + X1istβ2 + X2stβ3 + vs + wt + Θs ∙ t + εist,
where i indexes individuals, s indexes states, and t indexes years. The vectors vs and wt represent
state and year fixed effects, respectively, and state-specific linear time trends are represented by
Θs ∙ t. The state-specific linear time trends are included to control for unobserved factors at the
state level that evolve smoothly over time such as preferences and tastes. The variable MMLst is
an indicator for whether medical marijuana was legal in state s and year t. The coefficient of
interest, β1, represents the effect of medical marijuana legislation.
The dependent variable, Marijuana Useist, is equal to 1 if respondent i reported using
marijuana in the past 30 days, and equal to 0 otherwise. The vector X1ist includes individual-
level controls for age, sex, race and grade, while the vector X2st includes state-level controls for
whether marijuana use and possession was decriminalized, the presence of a BAC 0.08 law, the
state beer tax, income per capita, and the unemployment rate. Previous research has shown that
11
marijuana use is sensitive to decriminalization (Saffer and Chaloupka 1999), alcohol policies
(Pacula 1998; DiNardo and Lemieux 2001) and economic conditions (Hammer 1992). All
regressions are estimated as linear probability models and standard errors are corrected for
clustering at the state level (Bertrand et al. 2004). In addition to examining marijuana use in the
past 30 days, we examine frequent marijuana use, marijuana use at school, whether the
respondent was offered or bought marijuana on school property, and the use of other substances
including alcohol and cocaine. Descriptive statistics for these outcomes are presented in Table 1.
5. RESULTS
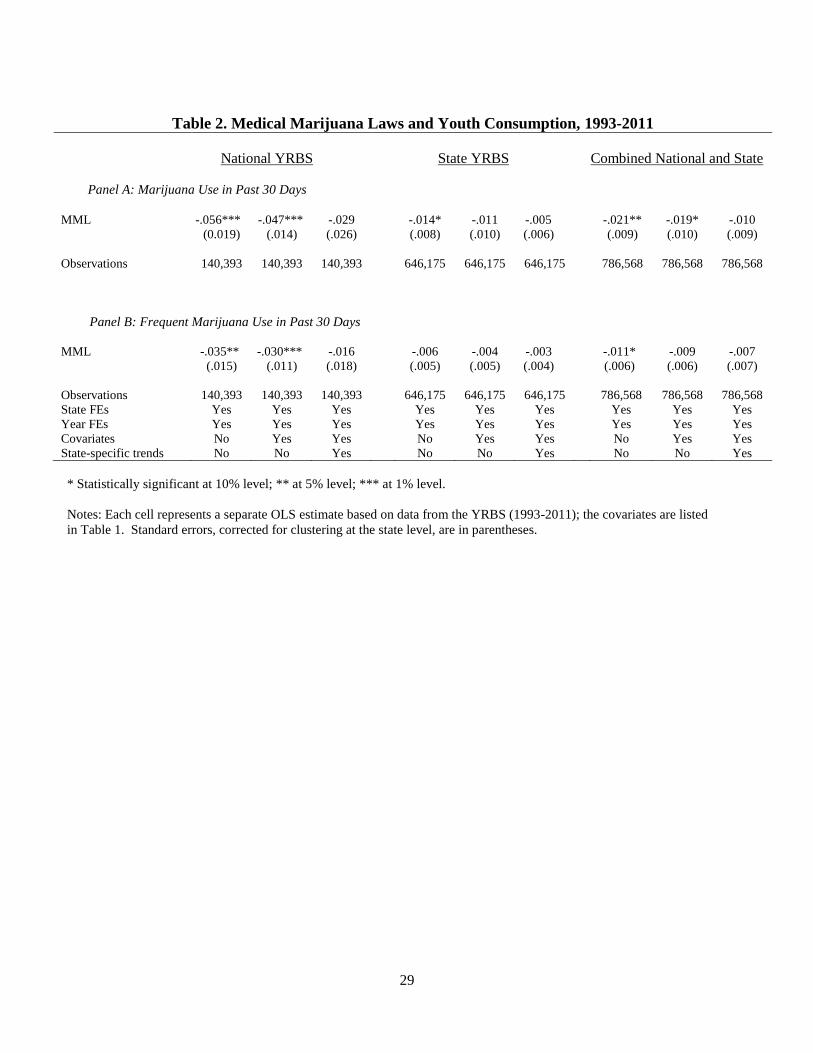
Tables 2 through 5 present unweighted OLS estimates of the relationship between MMLs
and the outcomes discussed above. Separate estimates for the national and state YRBS are
presented along with estimates based on the combined data.
Using the national YRBS and a “bare bones” specification without covariates or state-
specific linear time trends, legalization of medical marijuana is associated with a 5.6 percentage
point decrease in the probability of marijuana use within the past 30 days, and a 3.5 percentage
point decrease in the probability of frequent use (Table 2). We can reject the hypothesis that the
relationship between MMLs and these outcomes is positive at conventional levels. The same
specification yields smaller, but still negative, estimates of β1 using the state YRBS data. When
the national and state YRBS data are combined, we find that the legalization of medical
marijuana is associated with a 2.1 percentage point decrease in the probability of marijuana use
within the past 30 days, and a 1.1 percentage point decrease in the probability of frequent use.
We can reject the hypothesis that the relationship between legalization and these outcomes is
positive at conventional levels.
12
A similar pattern of results emerges when the covariates and state-specific linear time
trends are included on the right-hand side of the estimating equation. In these specifications, the
estimates of β1 are uniformly negative, although they are not statistically distinguishable from
zero.11
Ninety-five percent confidence intervals around the point estimates produced when using
the combined YRBS data and controlling for state-specific linear time trends suggest that the
impact of legalization on the probability of marijuana use in the past 30 days is no larger than 0.8
percentage points and the impact of legalization on the probability of frequent marijuana use in
the past 30 days is no larger than 0.7 percentage points. In comparison, based on nationally
representative data from Monitoring the Future, marijuana use among 12th
graders increased by
4.3 percentage points from 2006 to 2011; marijuana use among 10th
graders increased by 3.4
percentage points over this same period.12
Based on national YRBS data, marijuana use among
high school students increased by 3.4 percentage points from 2007 to 2011.
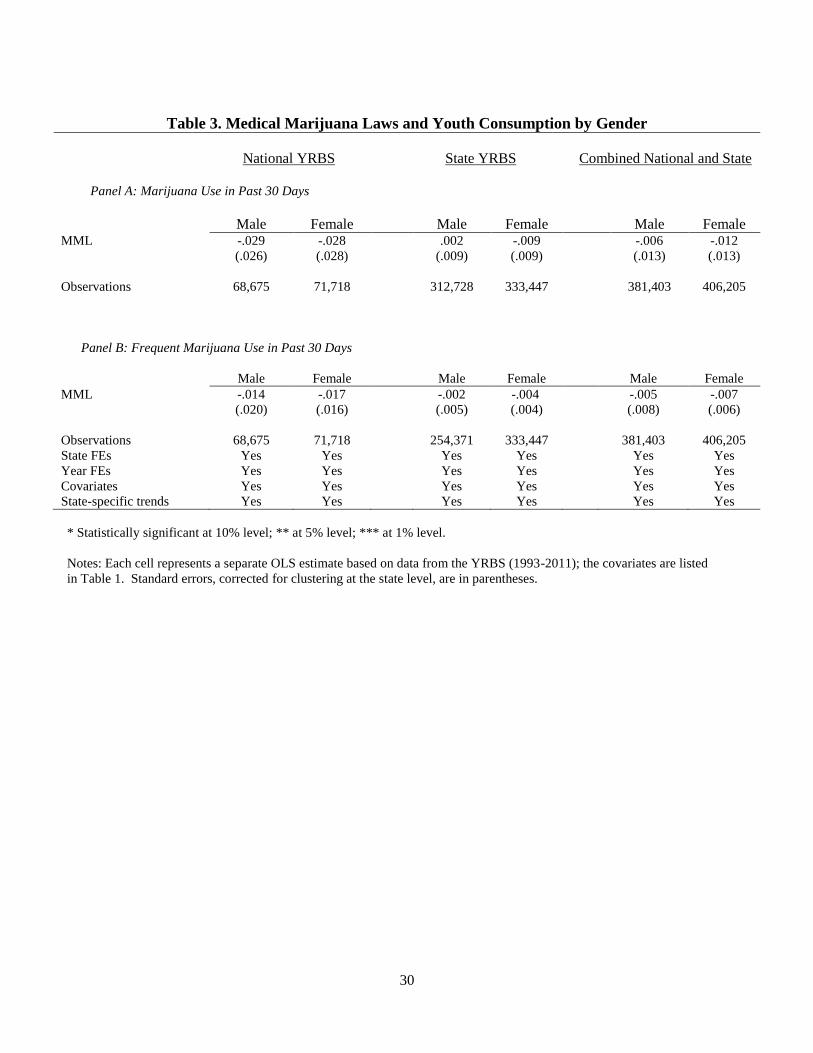
In Table 3, we explore whether the relationship between MMLs and marijuana use
depends on gender. These estimates are from our preferred specification that includes the full set
of covariates and state-specific linear time trends. With one exception, they are negative and
statistically indistinguishable from zero. The hypothesis that β1 for male respondents is equal to
β1 for female respondents is never rejected.
11
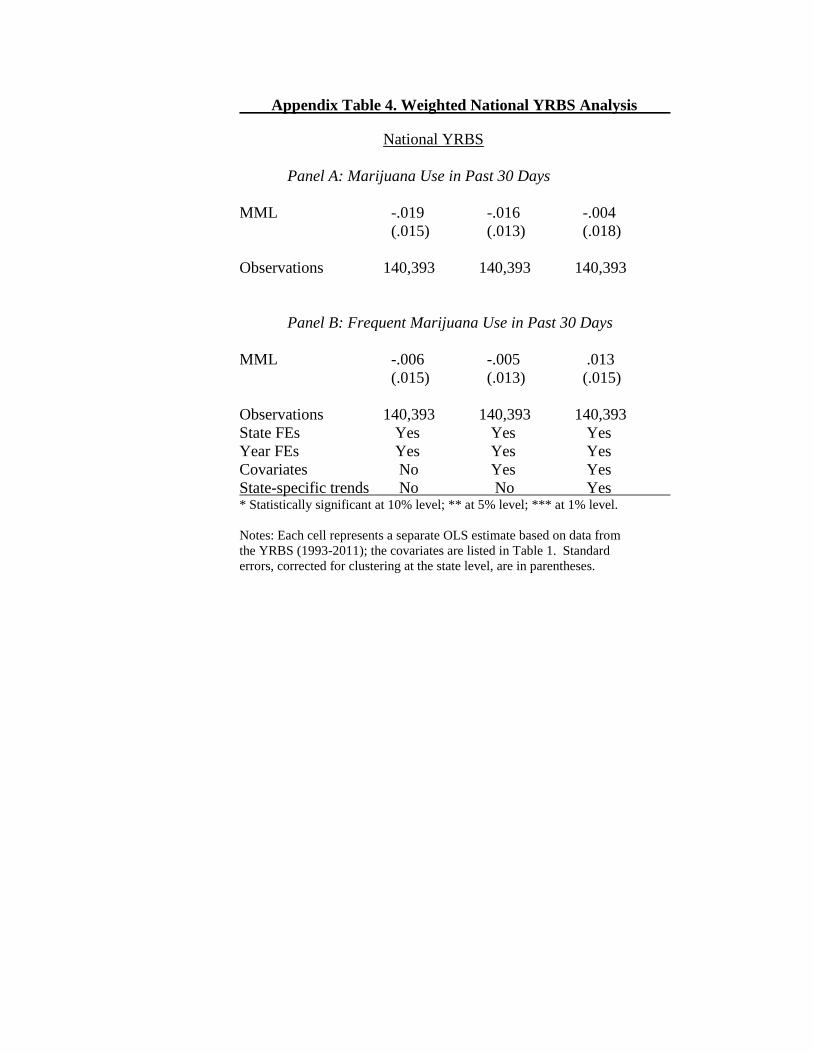
Appendix Table 4 presents estimates that incorporate the sample weights provided by the national YRBS. Again,
there is little evidence that legalization of medical marijuana led to increased marijuana use among high school
students.
12
Estimates of marijuana use in the past 30 days for 8th
, 10th
, and 12th
graders are available from Johnston et al.
(2011) and are based on data from Monitoring the Future. Monitoring the Future has interviewed nationally
representative samples of 8th
, 10th
, and 12th
graders since 1991. However, state identifiers are generally not made
available to researchers. Our efforts to obtain these data were politely rebuffed.
13
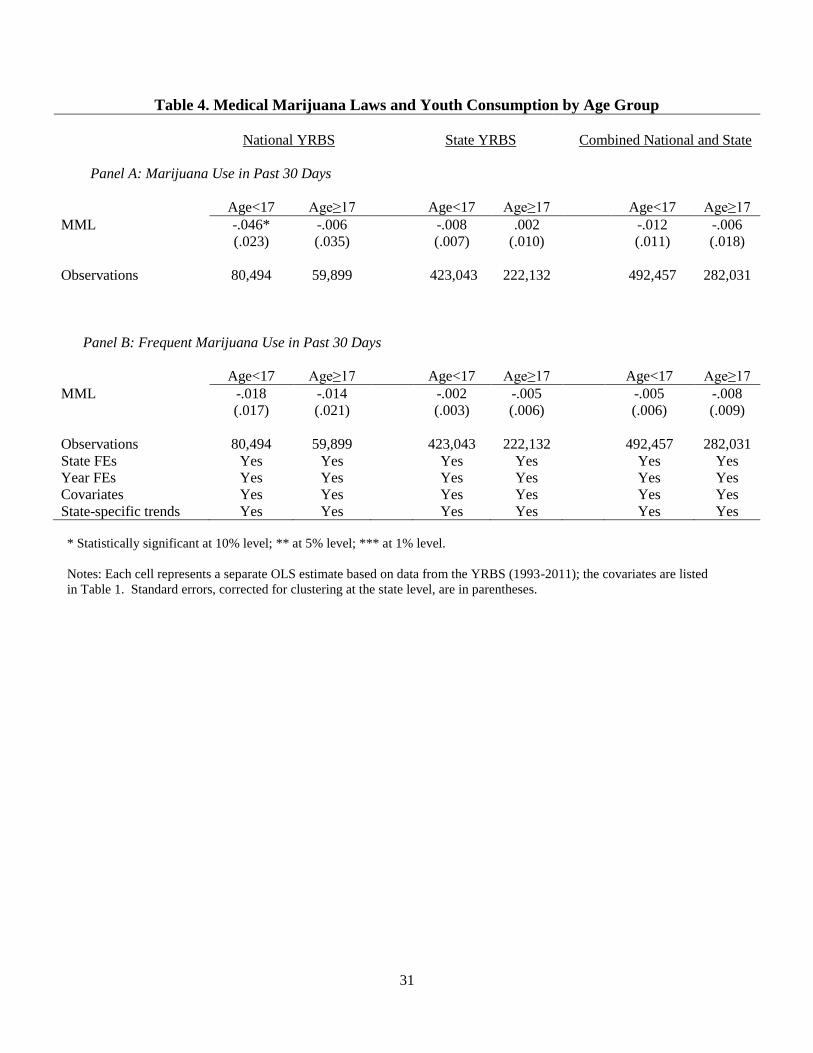
Table 4 compares estimates of β1 for YRBS respondents who were under the age of 17
when they were interviewed with estimates for respondents who were 17 years of age or older.13
In the national YRBS data, the relationship between legalization and marijuana use is negative
and significant among respondents under the age of 17, but insignificant among respondents 17
years of age and older. The relationship between legalization and frequent use is negative (but
statistically insignificant) among both younger and older respondents. The remaining estimates
of β1 in Table 4 are small and statistically insignificant.14
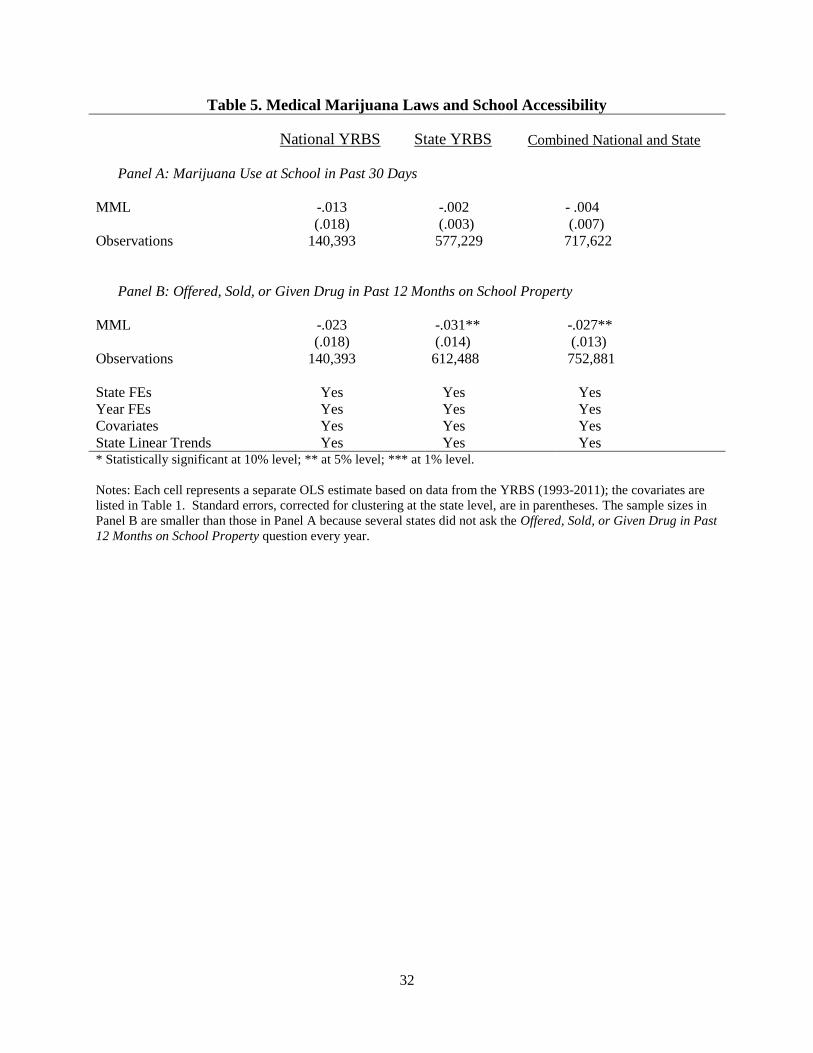
Table 5 reports estimates of the effect of legalization on the use of marijuana on school
property in the past 30 days and estimates of the effect of legalization on the probability a
student reported having been offered, sold, or given an illegal drug at school in the past year.
These estimates are of particular interest given the recent attempts to close dispensaries operating
near schools (Brooks 2012; McCrimmon and Jones 2012). The estimated relationship between
MMLs and the use of marijuana on school property is consistently negative, but never
statistically significant. In the combined sample, legalization is associated with a 2.7 percentage
point decrease in the probability of having been offered, sold, or given an illegal drug at school
in the past year
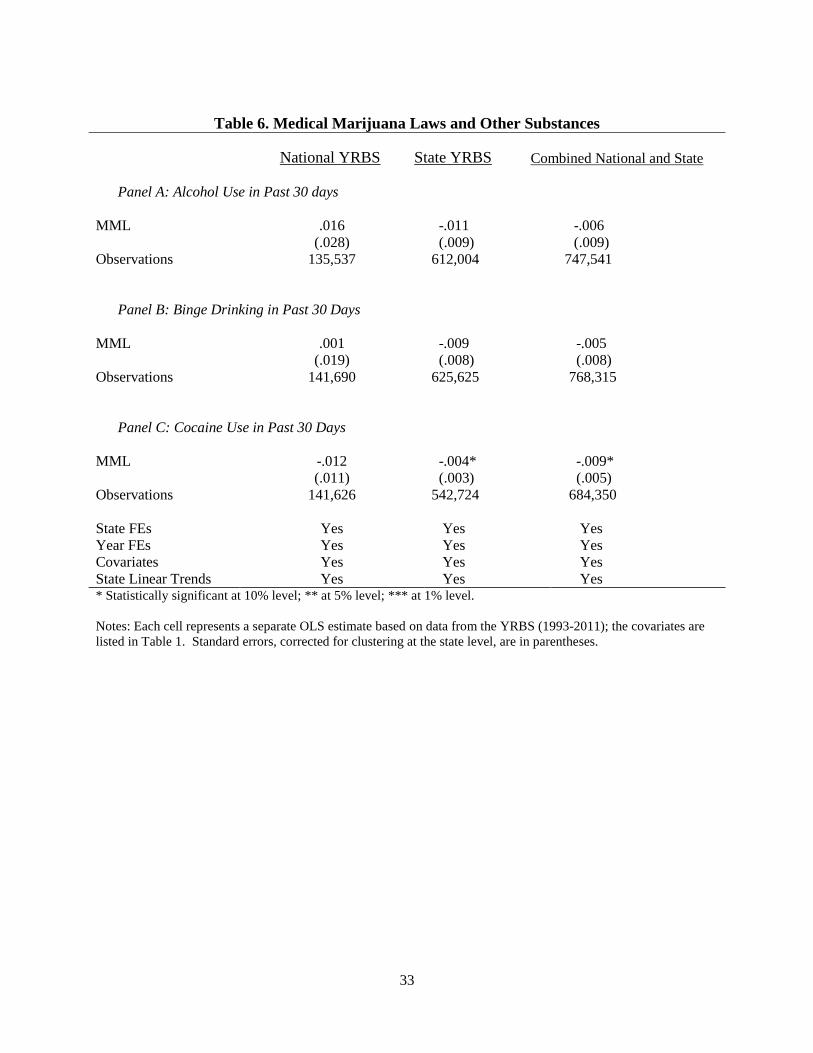
Finally, we examine the relationship between the legalization of medical marijuana and
the use of other substances in Table 6. Using a regression discontinuity design, Crost and
Guerrero (2012) found that marijuana use decreased sharply at the age of 21, suggesting that
marijuana and alcohol are substitutes. Other studies suggest that marijuana and substances such
13
The YRBS data include information on all high school students, some of whom are as old as 19.
14
Although the results are not reported, we estimated equation (1) for respondents 18 years of age and older. There
was no evidence that the legalization of medical marijuana was associated with an increase in marijuana use among
this age group. Appendix Table 5 presents estimates that incorporate the sample weights provided by the national
YRBS. They are similar to those reported in Table 3 and Table 4.
14
as alcohol and cocaine are complements (Saffer and Chaloupka 1999; DeSimone and Farrelly
2003; Williams et al. 2004; Yörük and Yörük 2011). Our results provide little evidence that the
legalization of medical marijuana leads to increased use of alcohol or cocaine.
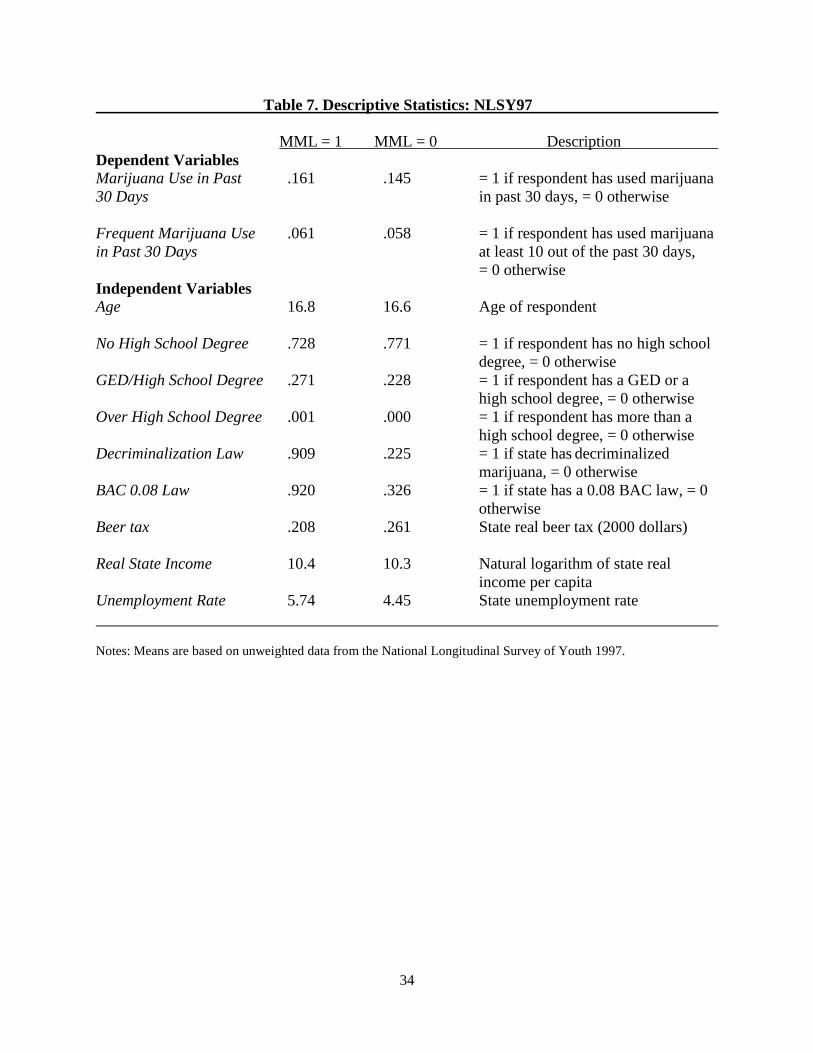
5.1 Analysis of the National Longitudinal Survey of Youth 1997
In this section, we examine the relationship between MMLs and the use of marijuana by
youth in the National Longitudinal Survey of Youth 1997 (NLSY97). The NLSY97, which is
conducted annually, is a nationally representative sample of individuals who were 12 through 16
years of age as of December 31st, 1996. It contains detailed information on educational
attainment, family background and socio-economic status, and its respondents are asked a host
questions with regard to marijuana use including, “On how many days have you used marijuana
in the last 30 days?”15
Because our focus is on teenagers, we limit the analysis to respondents
ages 12 through 19 at the time of the survey.
There are two primary benefits to using the NLSY97 data. First, unlike the YRBS, the
NLSY97 includes high school dropouts. This is important because high school dropouts are
more likely to use marijuana than their counterparts who stay in school (Bray et al. 2000).
Second, because the NLSY97 data follow adolescents over time, it is possible to control for
unobserved heterogeneity at the individual level.
However, there are two significant drawbacks to using NLSY97 data. First, California
legalized medical marijuana before data collection began and several other states legalized
15
Based on the answers to this question, we are able to construct measures of marijuana use that correspond to the
marijuana use measures in the YRBS data. Economists who have used these data to study determinants of
marijuana use include Aughinbaugh and Gittleman (2004), Cowen (2011), and Yörük and Yörük (2011).
15
medical marijuana when most of the NLSY97 respondents were in their twenties and thirties.16
Second, several of the states that legalized medical marijuana in the late 1990s and early 2000s
contributed only a handful of observations to the NLSY97. For instance, Oregon never
contributed more than 72 observations in any given year; together, Hawaii and Maine never
contributed more than 3 observations in any given year. Appendix Table 6 shows the number of
observations by year and state in the NLSY97.
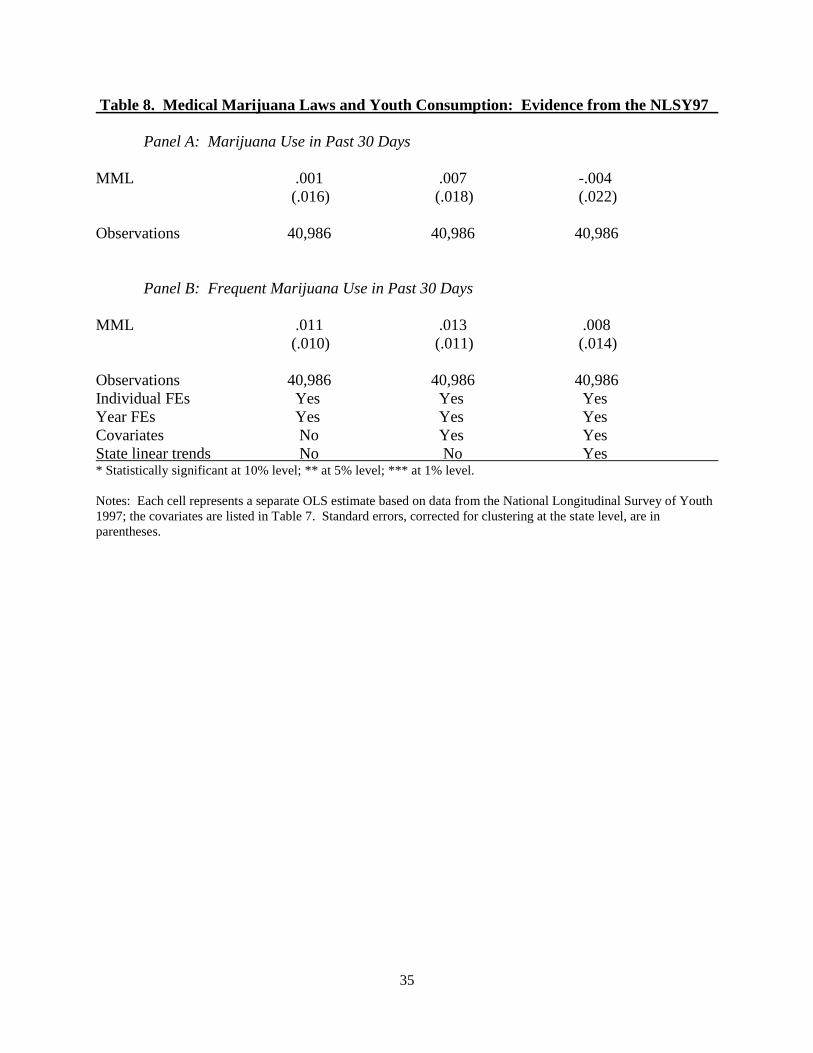
Table 7 presents descriptive statistics from the NLSY97 and Table 8 presents regression
results. Specifically, we report estimates from the following equation:
(2) Marijuana Useist = β0 + β1MMLst + X1istβ2 + X2stβ3 + λi + wt + Θs ∙ t + εist,
where i indexes individuals, s indexes states, and t indexes years. Year fixed effects are
represented by wt, and state-specific linear time trends are represented by Θs ∙ t. The variable
MMLst is defined as above and β1 represents the effect of medical marijuana legislation on
marijuana use in the past 30 days. In addition, we examine the relationship between MMLs and
frequent marijuana use defined as having used marijuana on at least 10 of the past 30 days. The
vectors X1ist and X2st are composed of the individual- and state-level controls, respectively.17
Because NLSY97 respondents are observed in multiple years, we are able to include
individual fixed effects, λi, on the right-hand side of the estimating equation. In addition to
absorbing time-invariant heterogeneity at the individual level, these effects account for factors at
the state level that may be correlated with marijuana use and the legalization of medical
16
For instance, New Mexico legalized medical marijuana in 2007, when the average age of NLSY97 respondents
was 25.
17
The state-level controls are identical to those used in the YRBS analysis. The individual-levels controls include
indicators for education status, which are not available in the YRBS.
16
marijuana, although it is important to note that identification comes from changes in the law and
from movement between states with different MMLs. All regressions are estimated as linear
probability models and standard errors are corrected for clustering at the state level (Bertrand et
al. 2004).
Each cell in Table 8 represents the results from a separate regression. Estimates in
column (1) are based on a specification that includes only individual and year fixed effects;
estimates in column (2) are based on a specification that also includes the covariates listed in
Table 7; and estimates in column (3) are based on a specification that adds state-specific linear
time trends. Consistent with the YRBS analyses above, there is little evidence to support the
hypothesis that MMLs encourage marijuana use by teenagers. Although 5 of the 6 coefficient
estimates are positive, none are statistically significant at conventional levels. If the largest
estimates are taken at face value, the legalization of medical marijuana is associated with a 0.7
percentage point increase in the probability of marijuana use in the past 30 days, and a 1.3
percentage point increase in the probability of frequent use. Appendix Table 7 presents
estimates that incorporate the sample weights provided by the NLSY97.18
They are consistent
with those reported in Table 8.
5.2 Analysis of the Treatment Episode Data Set
Finally, we examine the relationship between MMLs and marijuana use based on state-
level data from the Treatment Episode Data Set (TEDS) for the period 1992 through 2009.
Federally funded drug treatment facilities are required to provide information to TEDS including
18
Following Mellor (2011), we used the average of the sample weights for each individual for the years in which he
or she participated in the NLSY97.
17
whether a patient reported using marijuana prior to admission. Using these data, we constructed
rates of marijuana use at the state level by year.19
There are at least two advantages to using the TEDS data. First, like the NLSY97, the
TEDS data include high school dropouts. Second, the TEDS data are compiled annually and
very few states fail to provide admissions data. In contrast, the YRBS data are collected
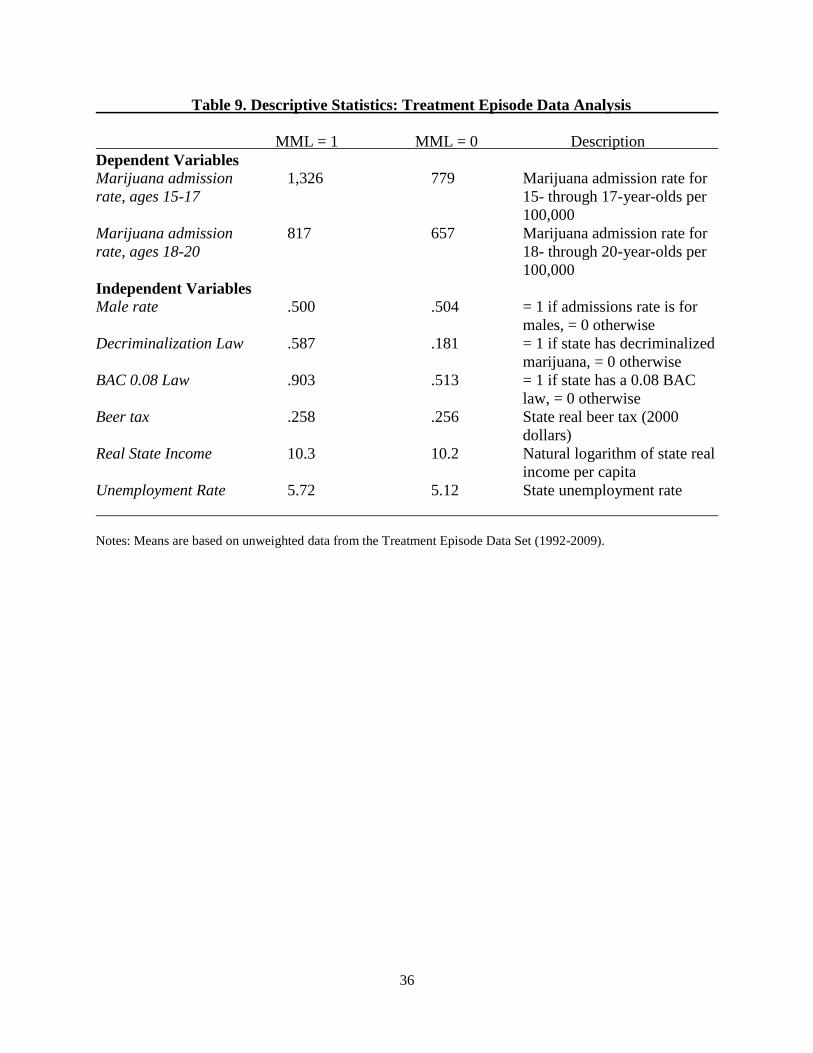
biennially and only a subset of states contribute data in any given year. Descriptive statistics for
the TEDS data are presented in Table 9.
To estimate the relationship between MMLs and marijuana-positive admission rates, we
estimate the following equation:
(2) ln(Marijuana admission rateast) = β0 + β1MMLst + Xstβ2 + vs + wt + Θs ∙ t + εast,
where a indexes whether the observed admission rate is for males or females, s indexes states,
and t indexes years. The dependent variable is the natural logarithm of the sex-specific
marijuana admissions rate per 100,000 of the relevant population. Because TEDS does not
provide the exact age or date of birth, we consider marijuana admission rates for two age groups:
15- through 17-year-olds and 18- through 20-year-olds. Again, the variable MMLst indicates
whether a MML was in effect in state s and year t, the vector Xst is composed of the controls
described in Table 9, and vs and wt are state and year fixed effects, respectively, and state-specific
linear time trends are represented by Θs ∙ t.
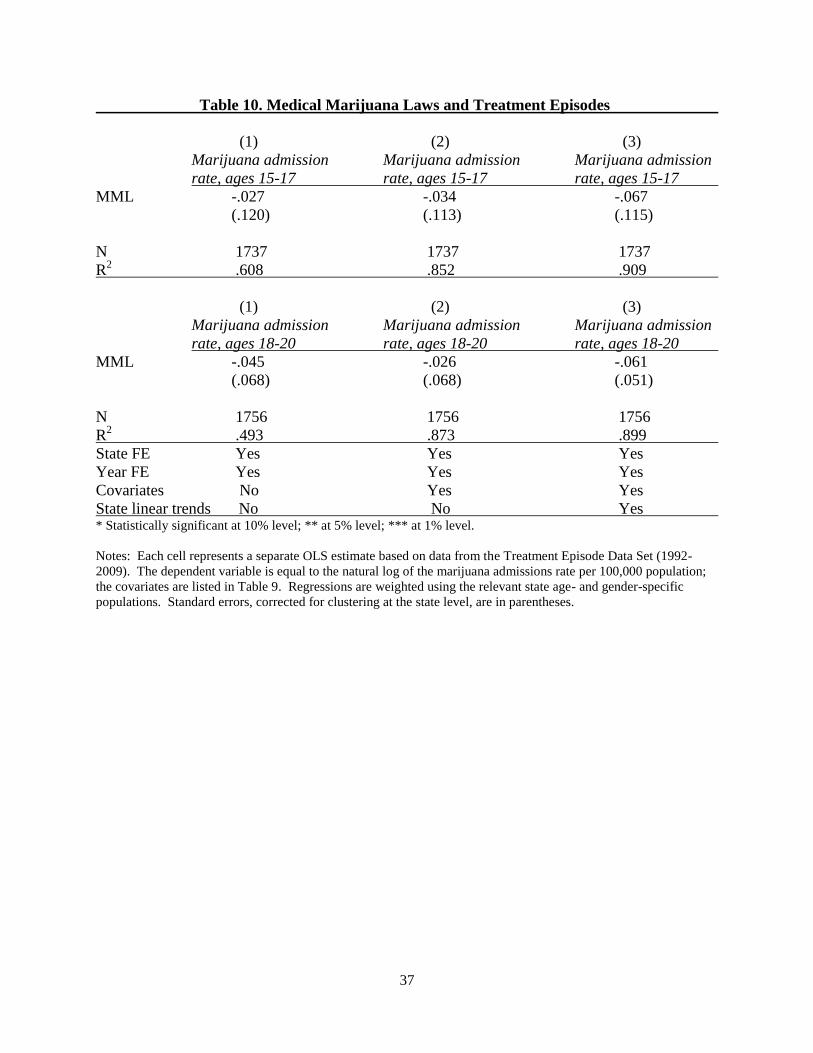
Table 10 presents the estimates from (3).20
Each cell represents the results of a separate
regression. Estimates in column (1) are based on specifications that only include state and year
19
Other economists who have used these data include Anderson (2010), Corman et al. (2010), Cunningham and
Finlay (2011), and Nonnemaker et al. (2011).
18
fixed effects. The estimates in column (2) are based on specifications that add the covariates,
and the estimates in column (3) are based on specifications that include state-specific linear time
trends. Consistent with the YRBS and NLSY97 analyses above, there is no evidence to support
the hypothesis that MMLs increase marijuana use among 15- through 17-year-olds. In fact, the
estimates of β1, although statistically insignificant, are uniformly negative. Likewise, there is no
evidence that medical marijuana laws are associated with increased use among 18- through 20-
year-olds.
6. CONCLUSION
Medical marijuana is popular with the general public. A recent Gallup poll found that 70
percent of Americans say they favor making marijuana legally available for doctors to prescribe
in order to reduce pain and suffering (Mendes 2010).
Given this level of support, it could be viewed as surprising that only 17 states have
legalized medical marijuana. However, opponents of medical marijuana have employed a
number of effective arguments, several of which focus on the use of marijuana by teenagers. For
instance, Montana State Senator Jeff Essmann was quoted in 2011 as saying, “The number one
goal is to reduce access and availability to the young people of this state that are being sent an
incorrect message that this is an acceptable product for them to be using” (Florio 2011).
In order to examine the relationship between medical marijuana laws and youth
consumption, we draw on data from the national and state Youth Risk Behavior Surveys (YRBS)
for the years 1993 through 2011. These data cover a period when 16 states, including California,
Colorado, Montana, Oregon and Washington, legalized medical marijuana, and allow us to
20
The slight difference in sample size between estimates for 15- through 17-year-olds and 18- through 20-year-olds
is due to missing values.
19
estimate the effect of legalization on outcomes such as marijuana use in the past month, frequent
marijuana use, and the use of other substances such as alcohol and cocaine.
Our results are not consistent with the hypothesis that the legalization of medical
marijuana caused an increase in the use of marijuana and other substances among high school
students. In fact, estimates from our preferred specification are small, consistently negative, and
are never statistically distinguishable from zero. Using the 95 percent confidence interval around
these estimates suggests that the impact of legalizing medical marijuana on the probability of
marijuana use in the past 30 days is no larger than 0.8 percentage points, and the impact of
legalization on the probability of frequent marijuana use in the past 30 days is no larger than 0.7
percentage points. In comparison, based on nationally representative data from Monitoring the
Future, marijuana use in the past 30 days among 12th graders increased by 4.3 percentage points
from 2006 to 2011 (Johnston et al. 2011); based on national YRBS data, marijuana use among
high school students increased by 3.4 percentage points from 2007 to 2011.
In addition to the YRBS analysis, we examine data from the National Longitudinal
Survey of Youth 1997 (NLSY97) and the Treatment Episode Data Set (TEDS). The NLSY97
allows us to follow survey respondents over time, while the TEDS data allow us to examine a
high-risk population. There is little evidence that marijuana use is related to the legalization of
medical marijuana in either of these data sources, a result that is consistent with research
showing that marijuana use among adults is more sensitive to changes in policy than marijuana
use among youths (Farrelly et al. 1999; Williams 2004).
Although our estimates do not lend support to the often-voiced argument that legalization
leads to increased consumption of marijuana among teenagers, it is important to note that our
study has at least one limitation: the YRBS data are only available through 2011 and the TEDS
20
data are only available through 2009. In the past year, several states have seen dramatic changes
to the market for medical marijuana. For instance, as a result of Drug Enforcement Agency
raids, the number of providers in Montana has plummeted. As future waves of the YRBS are
released, researchers will be in a position to update our estimates and explore whether these
changes have affected the behavior of teenagers.
REFERENCES
Abdel-Ghany, Mohamed and Min Qi Wang. “Contemporaneous and Intertemporal Relationship
Between the Consumption of Licit and Illicit Substances by Youth.” Journal of Family
and Economic Issues 24: 281-289.
Adda, Jérôme, Brendon McConnell and Imran Rasul. 2011. “Crime and the Depenalization of
Cannabis Possession: Evidence from a Policing Experiment.” Working Paper, University
College of London.
Anderson, D. Mark. 2010. “Does Information Matter? The Effect of the Meth Project on Meth
Use among Youths.” Journal of Health Economics 29: 732-742.
Anderson, D. Mark, Daniel I. Rees and Benjamin Hansen. 2011. “Medical Marijuana Laws,
Traffic Fatalities, and Alcohol Consumption.” IZA Working Paper No. 6112.
Aughinbaugh, Alison and Maury Gittleman. 2004. “Maternal Employment and Adolescent
Risky Behavior.” Journal of Health Economics 23: 815-838.
Bachman, Jerald, Lloyd Johnston and Patrick O’Malley. 1998. “Explaining Recent Increases in
Students’ Marijuana Use: Impacts of Perceived Risks and Disapproval, 1976 through
1996.” American Journal of Public Health 88: 887-892.
Bray, Jeremy, Gary Zarkin, Chris Ringwalt and Junfeng Qi. 2000. “The Relationship between
Marijuana Initiation and Dropping Out of High School.” Health Economics 9: 9-18.
Belkin, Lisa. 2009. “Medical Marijuana for Children.” New York Times. Available at:
http://parenting.blogs.nytimes.com/2009/10/20/medical-marijuana-for-children/.
Bertrand, Marianne, Esther Duflo and Sendhil Mullainathan. 2004. “How Much Should We
Trust Differences-in-Differences Estimates?” Quarterly Journal of Economics 119: 249-
276.
Brittain, Amy. 2012. “Medical Marijuana Boss: Gov. Christie's Pot Program Delay is Sabotage.”
21
The Star Ledger, March 23. Available at:
http://www.nj.com/news/index.ssf/2012/03/medicial_marijuana_boss_gov_ch.html.
Brooks, Jon. 2012. “Interview with U.S. Attorney Haag on Pot Operations: ‘If it’s close to
children, that’s a line we’re going to draw.’” KQED News. Available at:
http://blogs.kqed.org/newsfix/2012/03/15/interview-w-us-attorney-haag-on-pot-
operations-if-its-close-to-children-thats-a-line-were-going-to-draw/.
Brownstein, Joseph. 2009. “Mother Gives Son Marijuana to Treat His Autism.” ABC News.
Available at:
http://abcnews.go.com/GMA/AutismNews/mother-son-marijuana-treat-
autism/story?id=9153881#.T3pC69WrH0U.
Centers for Disease Control and Prevention. 2004. “Methodology of the Youth Risk Behavior
Surveillance System.” Morbidity and Mortality Weekly Report 53: 1-14.
Cerdá, Magdalenda, Melanie Wall, Katherine Keyes, Sandro Galea and Deborah Hasin. 2012.
“Medical Marijuana Laws in 50 States: Investigating the Relationship between State
Legalization of Medical Marijuana and Marijuana Use, Abuse and Dependence.” Drug
and Alcohol Dependence 120: 22-27.
Chaboya-Hembree, Jan. 2012. “Medical Marijuana and Insomnia.” Available at:
http://medicalmarijuana.com/medical-uses/condition.cfm?conID=44.
Chaloupka, Frank and Adit Laixuthai. 1997. “Do Youths Substitute Alcohol and Marijuana?
Some Econometric Evidence.” Eastern Economic Journal 23: 253-275.
Cohen, Peter. 2009. “Medical Marijuana: The Conflict Between Scientific Evidence and Political
Ideology.” Utah Law Review 1: 35-104.
Corman, Hope, Dhaval Dave, Nancy Reichman and Dhiman Das. 2010. “Effects of Welfare
Reform on Illicit Drug Use of Adult Women.” NBER Working Paper No. 16072.
Cowen, Benjamin. 2011. “Forward-thinking Teens: The Effects of College Costs on Adolescent
Risky Behavior.” Economics of Education Review 30: 813-825.
Crost, Benjamin and Santiago Guerrero. 2012. “The Effect of Alcohol Availability on Marijuana
Use: Evidence from the Minimum Legal Drinking Age.” Journal of Health Economics
31: 112-121.
Cunningham, Scott and Keith Finlay. 2011. “Parental Substance Abuse and Foster Care:
Evidence from Two Methamphetamine Supply Shocks?” Working Paper, Baylor
University.
Damrongplasit, Kannika, Cheng Hsiao and Xueyan Zhao. 2010. “Decriminalization of Marijuana
Smoking Prevalence: Evidence from Australia.” Journal of Business & Economic
22
Statistics 28: 344-356.
DeSimone, Jeff and Matthew Farrelly. 2003. “Price and Enforcement Effects on Cocaine and
Marijuana Demand.” Economic Inquiry 41: 98-115.
DiNardo, John and Thomas Lemieux. 2001. “Alcohol, Marijuana, and American Youth: The
Unintended Consequences of Government Regulation.” Journal of Health Economics 20:
991-1010.
Ellison, Katherine. 2009. “Medical Marijuana: No Longer Just for Adults.” New York Times.
Available at:
http://www.nytimes.com/2009/11/22/health/22sfmedical.html.
Farrelly, Matthew, Jeremy Bray, Gary Zarkin, Brett Wendling and Rosalie Pacula. 1999. “The
Effects of Prices and Policies on the Demand for Marijuana: Evidence from the National
Household Surveys on Drug Abuse.” NBER Working Paper No. 6940.
Farrelly, Matthew, Jeremy Bray, Gary Zarkin and Brett Wendling. 2001. “The Joint Demand for
Cigarettes and Marijuana: Evidence from the National Household Surveys on Drug
Abuse.” Journal of Health Economics 20: 51-68.
Fergusson, D.M., L.J. Horwood and N.R. Swain-Campbell. 2003. “Cannabis Dependence and
Psychotic Symptoms in Young People.” Psychological Medicine 33: 15-21.
Florio, Gwen. 2011. “Kids’ Use of Medical Marijuana Stirs Debate Over Future in Montana.”
Missoulian. Available at:
http://missoulian.com/news/local/article_fe14a69c-5833-11e0-9593-001cc4c002e0.html.
Gilman, Victoria. 2005. “The Marijuana Debate: Healing Herb or Dangerous Drug?” National
Geographic News. Available at:
http://news.nationalgeographic.com/news/2005/06/0621_050621_marijuana.html.
Gorman, Dennis M. and J. Charles Huber Jr. 2007. “Do Medical Cannabis Laws Encourage
Medical Cannabis Use? International Journal of Drug Policy 18: 160-167.
Hammer, Torlid. 1992. “Unemployment and Use of Drug and Alcohol among Young People: A
Longitudinal Study in the General Population.” British Journal of Addiction 87: 1571-
1581.
Harper, Sam, Erin Strumpf and Jay Kaufman. 2012. “Do Medical Marijuana Laws Increase
Marijuana Use? Replication Study and Extension.” Annals of Epidemiology 22: 207-212.
Ingold, John. 2012. “U.S. Attorney John Walsh Justifies Federal Crackdown on Medical-
Marijuana Shops.” Denver Post. Available at:
http://www.denverpost.com/news/marijuana/ci_19780414.
23
Joseph, Jennifer and Astrid Rodrigues. 2010. “Marijuana From Mom: Mother Says Drug Helps
Son Cope with Severe OCD.” ABC News. Available at:
http://abcnews.go.com/2020/MindMoodNews/marijuana-alternative-treatment-children-
ocd-autism/story?id=11227283#.T3pCiNWrH0V.
Johnston, Lloyd, Patrick O’Malley, Jerald Bachman and John Schulenberg. 2011. “Monitoring
the Future: National Results on Adolescent Drug Use. Overview of Key Findings, 2011.”
Institute for Social Research, University of Michigan. Available at:
http://www.monitoringthefuture.org/pubs/monographs/mtf-overview2011.pdf.
Khatapoush, Shereen and Denise Hallfors. 2004. “‘Sending the Wrong Message’: Did Medical
Marijuana Legalization in California Change Attitudes about and Use of Marijuana?”
Journal of Drug Issues 34: 751-770.
Klofas, John and Kyle Letteney. 2012. “The Social and Legal Effects of Medical Marijuana:
State Legislation and Rules.” Working Paper, Center for Public Safety Initiatives,
Rochester Institute of Technology.
Lucido, Frank. 2004. “Implementation of the Compassionate use Act in a Family Medicine
Practice: Seven Years Clinical Experience.” Available at:
http://www.medboardwatch.com.
McCrimmon, Katie and Rebecca Jones. 2012. “Feds Warn Marijuana Shops Close to Schools.”
Education News Colorado. Available at:
http://www.ednewscolorado.org/2012/01/13/31121-feds-warn-medical-marijuana-
facilities-near-schools.
Merrill, Jeffrey, Herbert Kleber, Michael Shwartz, Hong Liu and Susan Lewis. 1999.
“Cigarettes, Alcohol, Marijuana, Other Risk Behaviors, and American Youth.” Drug and
Alcohol Dependence 56: 205-212.
Nonnemaker, James, Mark Engelen and Daniel Shive. 2011. “Are Methamphetamine Precursor
Control Laws Effective Tools to Fight the Methamphetamine Epidemic?” Health
Economics 20: 519-531.
O’Connor, Anahad. 2011. “Marijuana Use Growing Among Teenagers.” New York Times.
Available at:
http://well.blogs.nytimes.com/2011/12/14/marijuana-growing-in-popularity-among-
teenagers/.
Pacula, Rosalie. 1998. “Does Increasing the Beer Tax Reduce Marijuana Consumption?” Journal
of Health Economics 17: 557-585.
Pacula, Rosalie, Michael Grossman, Frank Chaloupka, Patrick O’Malley, Lloyd Johnston and
Matthew Farrelly. 2001. “Marijuana and Youth.” In Jonathan Gruber, ed., Risky Behavior
among Youths: An Economic Analysis. Chicago, IL: University of Chicago Press.
24
Pudney, Stephen. 2003. “The Road to Ruin? Sequences of Initiation to Drugs and Crime in
Britain.” Economic Journal 113: C182-C198.
Rashad, Inas and Robert Kaestner. 2004. “Teenage Sex, Drugs and Alcohol: Problems
Identifying the Cause of Risky Behaviors.” Journal of Health Economics 23: 493-503.
Roan, Shari. 2011. “Medical Marijuana Laws Linked to Higher Overall Usage.” Los Angeles
Times. Available at:
http://articles.latimes.com/2011/sep/01/news/la-heb-medical-marijuana-20110901.
Saffer, Henry and Frank Chaloupka. 1999. “The Demand for Illicit Drugs.” Economic Inquiry
37: 401-411.
Suthers, John. 2012. “Medical Marijuana a Threat to Colorado’s Children.” Solutions.
Available at:
http://www.healthpolicysolutions.org/2012/02/04/opinion-medical-marijuana-a-threat-to-
colorados-children/.
Thies, Clifford and Charles Register. 1993. “Decriminalization of Marijuana and the Demand for
Alcohol, Marijuana and Cocaine.” Social Science Journal 30: 385-399.
Thurstone, Christian, Shane Lieberman and Sarah Schmiege. 2011. “Medical Marijuana
Diversion and Associated Problems in Adolescent Substance Treatment.” Drug and
Alcohol Dependence 118: 489– 492.
Uken, Cindy. 2012. “Too Much Pot.” Billings Gazette 6 April 2002: A1.
van het Loo, Mirjam, Ineke van Beusekom, and James Kahan. 2002. “Decriminalization of Drug
Use in Portugal: The Development of a Policy.” Annals of the American Academy of
Political and Social Science 582: 49-63.
van Ours, Jan. 2003. “Is Cannabis a Stepping-Stone for Cocaine?” Journal of Health Economics
22: 539-554.
van Ours, Jan and Jenny Williams. 2009. “Why Parents Worry: Initiation into Cannabis Use by
Youth and their Educational Attainment.” Journal of Health Economics 28: 132-142.
van Ours, Jan and Jenny Williams. 2011. “Cannabis Use and Mental Health Problems.” Journal
of Applied Econometrics 26: 1137-1156.
Wall, Melanie M., Ernest Poh, Magdalenda Cerdá, Katherine M. Keyes, Sandro Galea and
Deborah S. Hasin. 2011. “Adolescent Marijuana Use from 2002 to 2008: Higher in States
with Medical Marijuana Laws, Cause Still Unclear.” Annals of Epidemiology 21: 714-
716.
Williams, Jenny. 2004. “The Effects of Price and Policy on Marijuana Use: What Can Be
Learned from the Australian Experience?” Health Economics 13: 123-137.
25
Williams, Jenny, Rosalie Pacula, Frank Chaloupka and Henry Wechsler. 2004. “Alcohol and
Marijuana Use among College Students: Economic Complements or Substitutes?” Health
Economics 13: 825-843.
Yamada, Tetsuji, Michael Kendix and Tadashi Yamada. 1996. “The Impact of Alcohol
Consumption and Marijuana Use on High School Graduation.” Health Economics. 5: 77-
92.
Yörük, Bariş and Ceren Yörük. 2011. “The Impact of Minimum Legal Drinking Age Laws on
Alcohol Consumption and Marijuana Use: Evidence from a Regression Discontinuity
Design Using Exact Date of Birth.” Journal of Health Economics 30: 740-753.
26
.05
.1.1
5.2
.25
1993 1995 1997 1999 2001 2003 2005 2007 2009 2011Year
Any Use Frequent Use
Any Use on School Property
Based on weighted data from the national YRBS. Appendix Table 1 presents information on whichstates passed a MML between 1993 and 2011.
Figure 1. Past 30 Day Marijuana UseNational YRBS 1993-2011.0
5.1
.15
.2.2
5
1993 1995 1997 1999 2001 2003 2005 2007 2009 2011Year
Any Use Frequent Use
Any Use on School Property
Based on unweighted data from the state YRBS. Appendix Table 1 presents information on whichstates passed a MML between 1993 and 2011.
Figure 2. Past 30 Day Marijuana UseState YRBS 1993-2011
27
.05
.1.1
5.2
.25
.3
-3 -2 -1 0 1 2 3Year of Law Change
Any Use Frequent Use
Any Use on School Property
Based on weighted data from the national YRBS. Appendix Table 1 presents information on whichstates passed a MML between 1993 and 2011.
Figure 3. Past 30 Day Marijuana UseNational YRBS 1993-2011
.05
.1.1
5.2
.25
.3
-3 -2 -1 0 1 2 3Year of Law Change
Any Use Frequent Use
Any Use on School Property
Based on unweighted data from the state YRBS. Appendix Table 1 presents information on whichstates passed a MML between 1993 and 2011.
Figure 4. Past 30 Day Marijuana UseState YRBS 1993-2011
28
Table 1. Descriptive Statistics: YRBS 1993-2011 National YRBS State YRBS
MML = 1 MML = 0 MML = 1 MML = 0 Description
Dependent Variables Marijuana Use in Past .234 .220 .221 .195 = 1 if respondent has used
30 Days marijuana in past 30 days, = 0
otherwise
Frequent Marijuana .094 .091 .095 .082 = 1 if respondent has used
Use in Past 30 Days marijuana at least 10 out of
the past 30 days, = 0 otherwise
Marijuana Use at School .070 .060 .058 .048 = 1 if respondent has used
in Past 30 Days marijuana at school in past 30
days, = 0 otherwise
Offered, Sold, or Given .314 .259 .254 .252 = 1 if respondent has been
Drug on School Property offered, sold, or given illegal
drug at school, = 0 otherwise
Alcohol Use in Past .439 .458 .367 .421 = 1 if respondent has used
30 Days alcohol in past 30 days, = 0
otherwise
Binge Drinking in Past .262 .267 .222 .256 = 1 if respondent has binge
30 Days drank in past 30 days, = 0
otherwise
Cocaine Use in Past .050 .037 .032 .029 = 1 if respondent has used
30 Days cocaine in past 30 days, = 0
otherwise
Independent Variables Age 16.0 16.2 15.8 16.0 Age of respondent
Male .485 .490 .487 .483 = 1 if respondent is male, = 0 if
respondent is female
Grade 9 .248 .239 .259 .284 = 1 if respondent is in grade 9,
= 0 otherwise
Grade 10 .239 .247 .275 .275 = 1 if respondent is in grade
10, = 0 otherwise
Grade 11 .253 .256 .252 .244 = 1 if respondent is in grade
11, = 0 otherwise
Grade 12 .259 .256 .213 .196 = 1 if respondent is in grade
12, = 0 otherwise
Black .079 .260 .042 .161 = 1 if respondent is black, = 0
otherwise
White .324 .435 .682 .633 = 1 if respondent is white, = 0
otherwise
Other Race .597 .305 .276 .206 = 1 if respondent is of an other
race, = 0 otherwise
Decriminalization Law .812 .193 .366 .240 = 1 if state has decriminalized
marijuana, = 0 otherwise
BAC 0.08 Law .963 .587 .974 .666 = 1 if state has a BAC 0.08
law, = 0 otherwise
Beer tax .182 .283 .231 .269 State real beer tax (2000
dollars)
Real State Income 10.4 10.2 10.3 10.2 Natural logarithm of state real
income per capita
Unemployment Rate 7.61 5.94 6.94 5.78 State unemployment rate
Observations 23,504 116,889 105,602 540,573
Notes: Means are based on unweighted data from the national and state YRBS (1993-2011).
29
Table 2. Medical Marijuana Laws and Youth Consumption, 1993-2011
National YRBS
State YRBS
Combined National and State
Panel A: Marijuana Use in Past 30 Days
MML -.056*** -.047*** -.029 -.014* -.011 -.005 -.021** -.019* -.010
(0.019) (.014) (.026) (.008) (.010) (.006) (.009) (.010) (.009)
Observations
140,393 140,393 140,393 646,175 646,175 646,175 786,568 786,568 786,568
Panel B: Frequent Marijuana Use in Past 30 Days
MML -.035** -.030*** -.016 -.006 -.004 -.003 -.011* -.009 -.007
(.015) (.011) (.018) (.005) (.005) (.004) (.006) (.006) (.007)
Observations 140,393 140,393 140,393 646,175 646,175 646,175 786,568 786,568 786,568
State FEs Yes Yes Yes Yes Yes Yes Yes Yes Yes
Year FEs Yes Yes Yes Yes Yes Yes Yes Yes Yes
Covariates No Yes Yes No Yes Yes No Yes Yes
State-specific trends No No Yes No No Yes No No Yes
* Statistically significant at 10% level; ** at 5% level; *** at 1% level.
Notes: Each cell represents a separate OLS estimate based on data from the YRBS (1993-2011); the covariates are listed
in Table 1. Standard errors, corrected for clustering at the state level, are in parentheses.
30
Table 3. Medical Marijuana Laws and Youth Consumption by Gender
National YRBS
State YRBS
Combined National and State
Panel A: Marijuana Use in Past 30 Days
Male Female Male Female Male Female MML -.029 -.028 .002 -.009 -.006 -.012
(.026) (.028) (.009) (.009) (.013) (.013)
Observations
68,675 71,718 312,728 333,447 381,403 406,205
Panel B: Frequent Marijuana Use in Past 30 Days
Male Female Male Female Male Female
MML -.014 -.017 -.002 -.004 -.005 -.007
(.020) (.016) (.005) (.004) (.008) (.006)
Observations 68,675 71,718 254,371 333,447 381,403 406,205
State FEs Yes Yes Yes Yes Yes Yes
Year FEs Yes Yes Yes Yes Yes Yes
Covariates Yes Yes Yes Yes Yes Yes
State-specific trends Yes Yes Yes Yes Yes Yes
* Statistically significant at 10% level; ** at 5% level; *** at 1% level.
Notes: Each cell represents a separate OLS estimate based on data from the YRBS (1993-2011); the covariates are listed
in Table 1. Standard errors, corrected for clustering at the state level, are in parentheses.
31
Table 4. Medical Marijuana Laws and Youth Consumption by Age Group
National YRBS
State YRBS
Combined National and State
Panel A: Marijuana Use in Past 30 Days
Age<17 Age≥17 Age<17 Age≥17 Age<17 Age≥17
MML -.046* -.006 -.008 .002 -.012 -.006
(.023) (.035) (.007) (.010) (.011) (.018)
Observations
80,494 59,899 423,043 222,132 492,457 282,031
Panel B: Frequent Marijuana Use in Past 30 Days
Age<17 Age≥17 Age<17 Age≥17 Age<17 Age≥17
MML -.018 -.014 -.002 -.005 -.005 -.008
(.017) (.021) (.003) (.006) (.006) (.009)
Observations 80,494 59,899 423,043 222,132 492,457 282,031
State FEs Yes Yes Yes Yes Yes Yes
Year FEs Yes Yes Yes Yes Yes Yes
Covariates Yes Yes Yes Yes Yes Yes
State-specific trends Yes Yes Yes Yes Yes Yes
* Statistically significant at 10% level; ** at 5% level; *** at 1% level.
Notes: Each cell represents a separate OLS estimate based on data from the YRBS (1993-2011); the covariates are listed
in Table 1. Standard errors, corrected for clustering at the state level, are in parentheses.
32
Table 5. Medical Marijuana Laws and School Accessibility
National YRBS
State YRBS
Combined National and State
Panel A: Marijuana Use at School in Past 30 Days
MML
-.013
-.002
- .004
(.018) (.003) (.007)
Observations 140,393 577,229 717,622
Panel B: Offered, Sold, or Given Drug in Past 12 Months on School Property
MML
-.023
-.031**
-.027**
(.018) (.014) (.013)
Observations
140,393 612,488 752,881
State FEs Yes Yes Yes
Year FEs Yes Yes Yes
Covariates Yes Yes Yes
State Linear Trends Yes Yes Yes * Statistically significant at 10% level; ** at 5% level; *** at 1% level.
Notes: Each cell represents a separate OLS estimate based on data from the YRBS (1993-2011); the covariates are
listed in Table 1. Standard errors, corrected for clustering at the state level, are in parentheses. The sample sizes in
Panel B are smaller than those in Panel A because several states did not ask the Offered, Sold, or Given Drug in Past
12 Months on School Property question every year.
33
Table 6. Medical Marijuana Laws and Other Substances
National YRBS
State YRBS
Combined National and State
Panel A: Alcohol Use in Past 30 days
MML
.016
-.011
-.006
(.028) (.009) (.009)
Observations 135,537 612,004 747,541
Panel B: Binge Drinking in Past 30 Days
MML
.001
-.009
-.005
(.019) (.008) (.008)
Observations
141,690 625,625 768,315
Panel C: Cocaine Use in Past 30 Days
MML
-.012
-.004*
-.009*
(.011) (.003) (.005)
Observations
141,626 542,724 684,350
State FEs Yes Yes Yes
Year FEs Yes Yes Yes
Covariates Yes Yes Yes
State Linear Trends Yes Yes Yes * Statistically significant at 10% level; ** at 5% level; *** at 1% level.
Notes: Each cell represents a separate OLS estimate based on data from the YRBS (1993-2011); the covariates are
listed in Table 1. Standard errors, corrected for clustering at the state level, are in parentheses.
34
Table 7. Descriptive Statistics: NLSY97
MML = 1 MML = 0 Description
Dependent Variables
Marijuana Use in Past .161 .145 = 1 if respondent has used marijuana
30 Days in past 30 days, = 0 otherwise
Frequent Marijuana Use .061 .058 = 1 if respondent has used marijuana
in Past 30 Days at least 10 out of the past 30 days,
= 0 otherwise
Independent Variables
Age 16.8 16.6 Age of respondent
No High School Degree .728 .771 = 1 if respondent has no high school
degree, = 0 otherwise
GED/High School Degree .271 .228 = 1 if respondent has a GED or a
high school degree, = 0 otherwise
Over High School Degree .001 .000 = 1 if respondent has more than a
high school degree, = 0 otherwise
Decriminalization Law .909 .225 = 1 if state has decriminalized
marijuana, = 0 otherwise
BAC 0.08 Law .920 .326 = 1 if state has a 0.08 BAC law, = 0
otherwise
Beer tax .208 .261 State real beer tax (2000 dollars)
Real State Income 10.4 10.3 Natural logarithm of state real
income per capita
Unemployment Rate 5.74 4.45 State unemployment rate
Notes: Means are based on unweighted data from the National Longitudinal Survey of Youth 1997.
35
Table 8. Medical Marijuana Laws and Youth Consumption: Evidence from the NLSY97
Panel A: Marijuana Use in Past 30 Days
MML .001 .007 -.004
(.016) (.018) (.022)
Observations 40,986 40,986 40,986
Panel B: Frequent Marijuana Use in Past 30 Days
MML .011 .013 .008
(.010) (.011) (.014)
Observations 40,986 40,986 40,986
Individual FEs Yes Yes Yes
Year FEs Yes Yes Yes
Covariates No Yes Yes
State linear trends No No Yes * Statistically significant at 10% level; ** at 5% level; *** at 1% level.
Notes: Each cell represents a separate OLS estimate based on data from the National Longitudinal Survey of Youth
1997; the covariates are listed in Table 7. Standard errors, corrected for clustering at the state level, are in
parentheses.
36
Table 9. Descriptive Statistics: Treatment Episode Data Analysis
MML = 1 MML = 0 Description
Dependent Variables
Marijuana admission 1,326 779 Marijuana admission rate for
rate, ages 15-17 15- through 17-year-olds per
100,000
Marijuana admission 817 657 Marijuana admission rate for
rate, ages 18-20 18- through 20-year-olds per
100,000
Independent Variables
Male rate .500 .504 = 1 if admissions rate is for
males, = 0 otherwise
Decriminalization Law .587 .181 = 1 if state has decriminalized
marijuana, = 0 otherwise
BAC 0.08 Law .903 .513 = 1 if state has a 0.08 BAC
law, = 0 otherwise
Beer tax .258 .256 State real beer tax (2000
dollars)
Real State Income 10.3 10.2 Natural logarithm of state real
income per capita
Unemployment Rate 5.72 5.12 State unemployment rate
Notes: Means are based on unweighted data from the Treatment Episode Data Set (1992-2009).
37
Table 10. Medical Marijuana Laws and Treatment Episodes
(1) (2) (3)
Marijuana admission Marijuana admission Marijuana admission
rate, ages 15-17 rate, ages 15-17 rate, ages 15-17
MML -.027 -.034 -.067
(.120) (.113) (.115)
N 1737 1737 1737
R2 .608 .852 .909
(1) (2) (3)
Marijuana admission Marijuana admission Marijuana admission
rate, ages 18-20 rate, ages 18-20 rate, ages 18-20
MML -.045 -.026 -.061
(.068) (.068) (.051)
N 1756 1756 1756
R2 .493 .873 .899
State FE Yes Yes Yes
Year FE Yes Yes Yes
Covariates No Yes Yes
State linear trends No No Yes * Statistically significant at 10% level; ** at 5% level; *** at 1% level.
Notes: Each cell represents a separate OLS estimate based on data from the Treatment Episode Data Set (1992-
2009). The dependent variable is equal to the natural log of the marijuana admissions rate per 100,000 population;
the covariates are listed in Table 9. Regressions are weighted using the relevant state age- and gender-specific
populations. Standard errors, corrected for clustering at the state level, are in parentheses. state-level, are in parentheses.
38
Appendix Table 1. Medical Marijuana Laws, 1993-2011
Effective date
Alaska March 4, 1999
Arizona April 14, 2011
California November 6, 1996
Colorado June 1, 2001
Delaware May 13, 2011
District of Columbia July 27, 2010
Hawaii December 28, 2000
Maine December 22, 1999
Michigan December 4, 2008
Montana November 2, 2004
Nevada October 1, 2001
New Jersey October 1, 2010
New Mexico July 1, 2007
Oregon December 3, 1998
Rhode Island January 3, 2006
Vermont July 1, 2004
Washington November 3, 1998
Note: In Connecticut, the legalization of medical marijuana is scheduled to take place on October 1, 2012.
Appendix Table 2. Number of Observations by State-Year: National YRBS
1993 1995 1997 1999 2001 2003 2005 2007 2009 2011 Total
AL 782 97 781 55 306 630 … 475 1,027 308 4,461
AZ* 429 … 1,076 130 399 341 279 588 353 1,087 4,462
AR 393 282 358 … … 261 … 411 297 … 2,002
CA* 2,082 1,161 1,929 2,423 2,139 1,672 1,527 2,072 2,741 1,796 19,542
CO* 256 99 267 … 635 … … … 189 234 1,680
CT … … 217 … … … 230 … … … 447
DE* … 212 … … … 360 … … … 221 793
DC* … 499 … … … … … … … 295 794
FL 513 532 664 845 1,042 1,393 532 732 222 1,361 7,836
GA 893 435 339 800 476 408 1,796 344 1,296 120 6,907
HI* … … … 301 … … … … 229 … 530
ID … … … … 155 … 238 … … 258 651
IL 702 237 … 224 431 312 471 576 1,450 972 5,375
IN … … … … 176 407 169 395 … 266 1,413
IA … 241 774 … … … 236 245 … … 1,496
KS 170 … 201 … … 307 275 … 197 295 1,445
KY … … … … … … 527 357 … 211 1,095
LA … 278 568 606 … 677 155 … 411 … 2,695
ME* 247 150 236 196 199 197 … … … … 1,225
MD 144 … 801 … … 260 … … … … 1,205
MA 357 269 1,606 … 249 211 255 708 … 282 3,937
MI* 144 1,076 490 509 329 392 283 295 313 617 4,448
MN 319 … … … … … 95 … 185 … 599
MS 352 478 326 624 335 … … 348 … 93 2,556
MO 181 540 … 550 458 260 102 343 84 341 2,859
MT* … … … … 197 … … … … … 197
NE 396 … … … … … … … … … 396
NV * … … … … 232 … … … 378 198 808
NJ* … … 720 232 213 297 309 669 364 111 2,915
NM* 657 … 276 … 152 100 … 218 596 … 1,999
NY 1,217 510 355 700 298 893 450 894 1,159 622 7,098
Appendix Table 2. Number of Observations by State-Year: National YRBS (continued)
1993 1995 1997 1999 2001 2003 2005 2007 2009 2011 Total
NC 296 114 327 506 659 … 628 558 … 686 3,774
OH 524 546 538 551 221 290 270 … … … 2,940
OK … … 223 … 392 … 232 277 … … 1,124
OR * 188 … … … 183 … 268 … 243 … 882
PA 356 658 271 477 … 316 407 210 1,039 408 4,142
RI* … … … 74 … … … … … … 74
SC 390 … 330 776 … 874 283 … … … 2,653
SD … … … … … 295 … … … … 295
TN 507 346 564 263 588 … 391 162 … 286 3,107
TX 2,715 1,642 935 2,668 2,006 2,574 1,705 1,438 1,312 1,721 18,716
UT … … … … … 178 268 193 … … 639
VT* … … … … … 57 … … … … 57
VA … 64 … 718 … 240 345 424 96 201 2,088
WA* 373 82 103 … 52 … 100 … 245 165 1,120
WV 301 … … … 260 … 228 243 457 251 1,740
WI … … 289 521 234 175 239 178 675 645 2,956 Notes: States that legalized medical marijuana are denoted with a star superscript and post-legalization observations are italicized.
Appendix Table 3. Number of Observations by State-Year: State YRBS
1993 1995 1997 1999 2001 2003 2005 2007 2009 2011 Total
AL 4,269 3,773 3,544 2,007 1,508 1,038 975 … 1,418 1,328 19,860
AK* … 1,595 … … … 1,414 … 1,256 1,302 1,278 6,845
AZ* … … … … … 1,939 1,872 1,668 1,484 1,948 8,911
AR … 2,223 1,950 1,426 1,661 … 1,438 1,535 1,580 1,302 13,115
CO* … … … … … … 1,459 … 1,451 1,437 4,347
CT … … 1,709 … … … 2,108 1,974 2,298 1,968 10,057
DE* … … … 2,313 2,842 2,955 2,604 2,387 2,267 2,165 17,533
ID 3,907 … … … 1,680 1,694 1,414 1,378 2,114 1,663 13,850
IL 3,953 3,020 … … … … … 2,326 2,887 3,403 15,589
IA … … 1,498 … … … 1,339 1,425 … 1,519 5,781
KS … … … … … … 1,618 1,682 1,991 1,823 7,114
KY … … 1,561 … … 1,528 3,178 3,391 1,692 1,650 13,000
ME* … 1,375 1,795 1,305 … 1,616 1,304 1,277 8,419 8,982 26,073
MD … … … … … … 1,373 1,467 1,562 2,529 6,931
MI* … … 4,277 2,600 3,472 3,332 3,144 3,390 3,271 4,052 27,538
MS 1,431 1,251 1,462 1,579 1,777 1,458 … 1,537 1,749 1,729 13,973
MO … 4,787 1,451 1,601 1,625 1,530 1,851 1,512 1,595 … 15,952
MT* 4,936 2,476 2,502 2,856 2,572 2,617 2,947 3,849 1,766 4,002 30,523
NE 3,154 … … … … 2,862 3,651 … … 2,644 12,311
NV* 2,001 1,507 1,441 1,659 1,405 1,917 1,488 1,737 2,007 … 15,162
NH 2,651 2,128 … … … 1,294 1,249 1,595 1,459 1,378 11,754
NJ* … … … … 2,026 … 1,470 … 1,716 1,619 6,831
NM* … … … … … … 5,020 2,539 4,835 5,596 18,290
NY … … 3,673 3,303 … 9,021 9,194 12,780 13,959 12,544 64,474
NC 2,686 1,921 … … 2,477 2,479 3,762 3,363 5,485 2,174 24,347
ND … … … 1,800 1,564 1,636 1,700 1,725 1,782 1,873 12,080
RI* … … 1,476 … 1,351 1,759 2,302 2,102 3,093 3,813 15,896
SC 4,636 5,302 5,347 4,449 … 1,238 1,202 1,202 1,055 1,382 24,612
SD 1,326 1,170 1,577 1,639 1,564 1,762 1,544 1,561 2,115 1,507 15,765
TN 3,226 … … … … 1,899 1,519 2,020 2,176 2,584 13,464
TX … … … … 6,864 … 4,032 3,123 3,459 4,017 21,495
Appendix Table 3. Number of Observations by State-Year: State YRBS (continued)
1993 1995 1997 1999 2001 2003 2005 2007 2009 2011 Total
UT 4,376 3,123 1,340 1,467 1,029 1,350 1,401 1,885 1,538 1,651 19,160
VT* … 5,860 6,783 … 6,942 5,901 6,941 5,825 8,347 … 46,599
WV 2,778 2,045 1,796 1,365 … 1,701 1,298 1,358 1,578 2,121 16,040
WI 3,199 … 1,294 1,304 2,070 2,078 2,250 2,050 2,391 2,941 19,577
Notes: States that legalized medical marijuana are denoted with a star superscript and post-legalization observations are italicized.
Appendix Table 4. Weighted National YRBS Analysis
National YRBS
Panel A: Marijuana Use in Past 30 Days
MML -.019 -.016 -.004
(.015) (.013) (.018)
Observations 140,393 140,393 140,393
Panel B: Frequent Marijuana Use in Past 30 Days
MML -.006 -.005 .013
(.015) (.013) (.015)
Observations 140,393 140,393 140,393
State FEs Yes Yes Yes
Year FEs Yes Yes Yes
Covariates No Yes Yes
State-specific trends No No Yes * Statistically significant at 10% level; ** at 5% level; *** at 1% level.
Notes: Each cell represents a separate OLS estimate based on data from
the YRBS (1993-2011); the covariates are listed in Table 1. Standard
errors, corrected for clustering at the state level, are in parentheses.
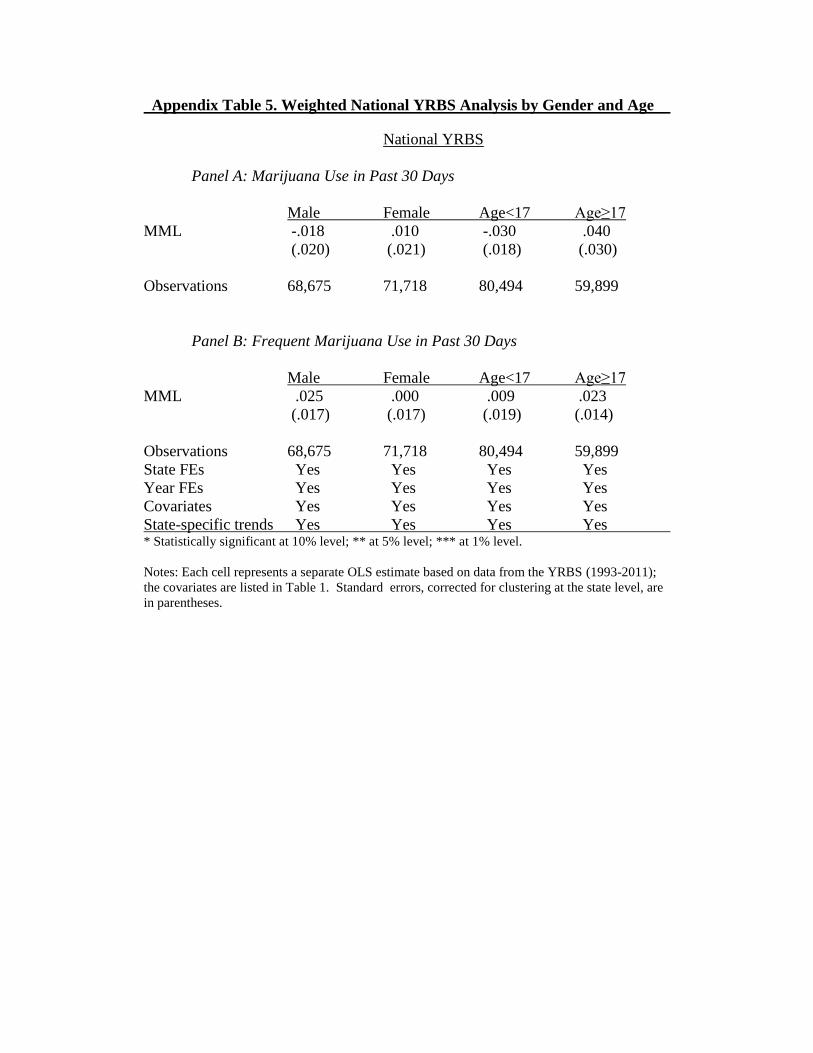
Appendix Table 5. Weighted National YRBS Analysis by Gender and Age
National YRBS
Panel A: Marijuana Use in Past 30 Days
Male Female Age<17 Age≥17
MML -.018 .010 -.030 .040
(.020) (.021) (.018) (.030)
Observations 68,675 71,718 80,494 59,899
Panel B: Frequent Marijuana Use in Past 30 Days
Male Female Age<17 Age≥17
MML .025 .000 .009 .023
(.017) (.017) (.019) (.014)
Observations 68,675 71,718 80,494 59,899
State FEs Yes Yes Yes Yes
Year FEs Yes Yes Yes Yes
Covariates Yes Yes Yes Yes
State-specific trends Yes Yes Yes Yes * Statistically significant at 10% level; ** at 5% level; *** at 1% level.
Notes: Each cell represents a separate OLS estimate based on data from the YRBS (1993-2011);
the covariates are listed in Table 1. Standard errors, corrected for clustering at the state level, are
in parentheses.
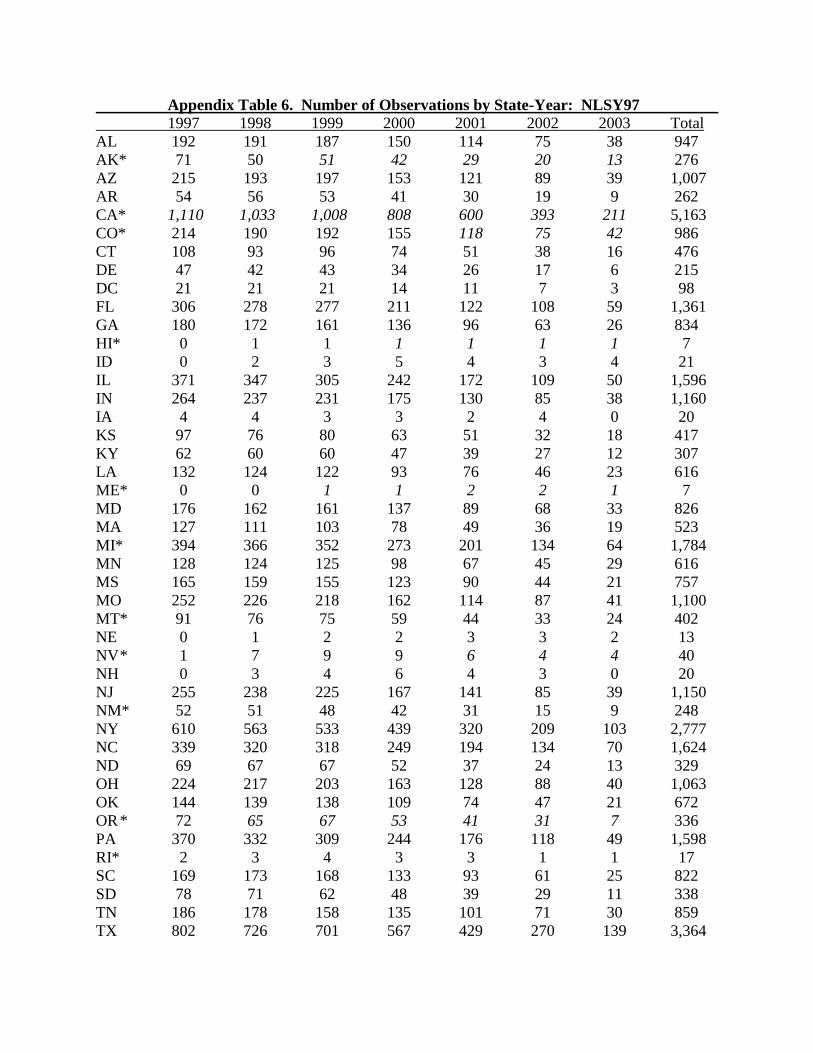
Appendix Table 6. Number of Observations by State-Year: NLSY97
1997 1998 1999 2000 2001 2002 2003 Total
AL 192 191 187 150 114 75 38 947
AK* 71 50 51 42 29 20 13 276
AZ 215 193 197 153 121 89 39 1,007
AR 54 56 53 41 30 19 9 262
CA* 1,110 1,033 1,008 808 600 393 211 5,163
CO* 214 190 192 155 118 75 42 986
CT 108 93 96 74 51 38 16 476
DE 47 42 43 34 26 17 6 215
DC 21 21 21 14 11 7 3 98
FL 306 278 277 211 122 108 59 1,361
GA 180 172 161 136 96 63 26 834
HI* 0 1 1 1 1 1 1 7
ID 0 2 3 5 4 3 4 21
IL 371 347 305 242 172 109 50 1,596
IN 264 237 231 175 130 85 38 1,160
IA 4 4 3 3 2 4 0 20
KS 97 76 80 63 51 32 18 417
KY 62 60 60 47 39 27 12 307
LA 132 124 122 93 76 46 23 616
ME* 0 0 1 1 2 2 1 7
MD 176 162 161 137 89 68 33 826
MA 127 111 103 78 49 36 19 523
MI* 394 366 352 273 201 134 64 1,784
MN 128 124 125 98 67 45 29 616
MS 165 159 155 123 90 44 21 757
MO 252 226 218 162 114 87 41 1,100
MT* 91 76 75 59 44 33 24 402
NE 0 1 2 2 3 3 2 13
NV * 1 7 9 9 6 4 4 40
NH 0 3 4 6 4 3 0 20
NJ 255 238 225 167 141 85 39 1,150
NM* 52 51 48 42 31 15 9 248
NY 610 563 533 439 320 209 103 2,777
NC 339 320 318 249 194 134 70 1,624
ND 69 67 67 52 37 24 13 329
OH 224 217 203 163 128 88 40 1,063
OK 144 139 138 109 74 47 21 672
OR * 72 65 67 53 41 31 7 336
PA 370 332 309 244 176 118 49 1,598
RI* 2 3 4 3 3 1 1 17
SC 169 173 168 133 93 61 25 822
SD 78 71 62 48 39 29 11 338
TN 186 178 158 135 101 71 30 859
TX 802 726 701 567 429 270 139 3,364
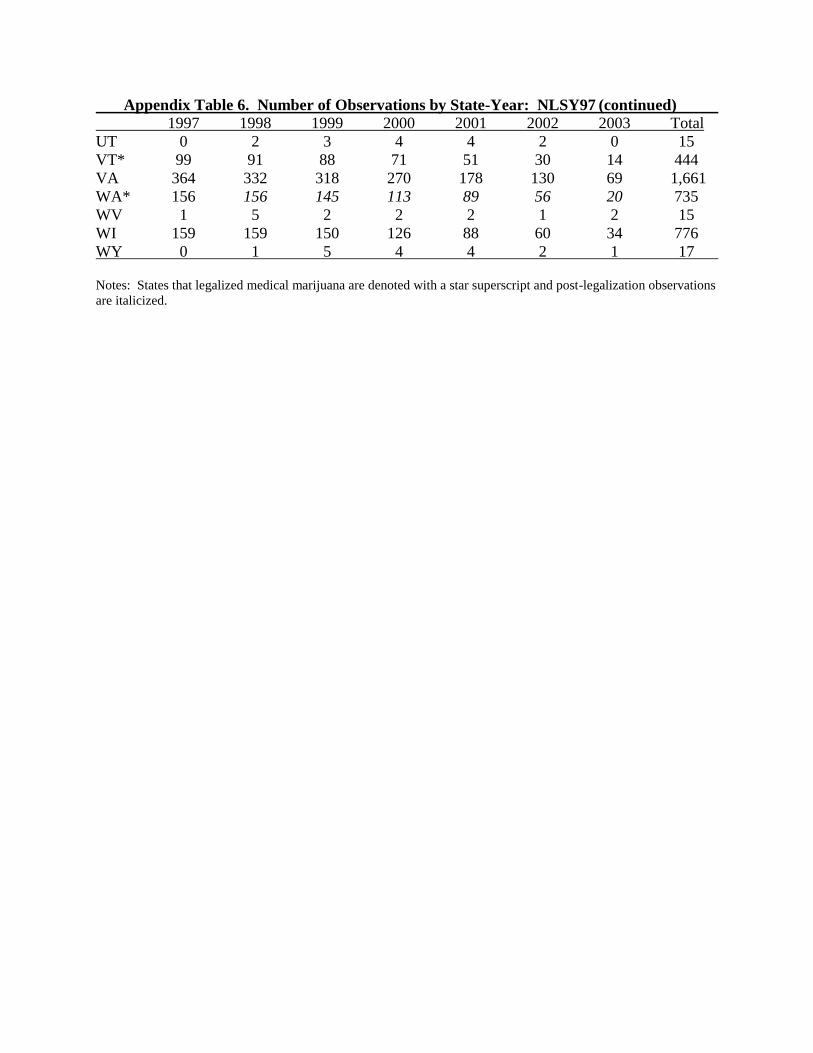
Appendix Table 6. Number of Observations by State-Year: NLSY97 (continued)
1997 1998 1999 2000 2001 2002 2003 Total
UT 0 2 3 4 4 2 0 15
VT* 99 91 88 71 51 30 14 444
VA 364 332 318 270 178 130 69 1,661
WA* 156 156 145 113 89 56 20 735
WV 1 5 2 2 2 1 2 15
WI 159 159 150 126 88 60 34 776
WY 0 1 5 4 4 2 1 17 Notes: States that legalized medical marijuana are denoted with a star superscript and post-legalization observations
are italicized.

Appendix Table 7. Weighted NLSY97 Analysis
Panel A: Marijuana Use in Past 30 Days
MML -.003 .003 -.010
(.013) (.014) (.022)
Observations 40,986 40,986 40,986
Panel B: Frequent Marijuana Use in Past 30 Days
MML .011 .015 .009
(.011) (.011) (.016)
Observations 40,986 40,986 40,986
Individual FEs Yes Yes Yes
Year FEs Yes Yes Yes
Covariates No Yes Yes
State linear trends No No Yes * Statistically significant at 10% level; ** at 5% level; *** at 1% level.
Notes: Each cell represents a separate OLS estimate based on data from the National Longitudinal Survey of Youth
1997; the covariates are listed in Table 7. Standard errors, corrected for clustering at the state level, are in
parentheses.