dmitry semenov max planck institute for astronomy · pdf filemax planck institute for...
TRANSCRIPT
Dust in protoplanetary disks
Dmitry SemenovMax Planck Institute for Astronomy
Heidelberg, Germany
http://www.alma.inaf.it/attachments/article/118/Lecture12-Semenov.pdf
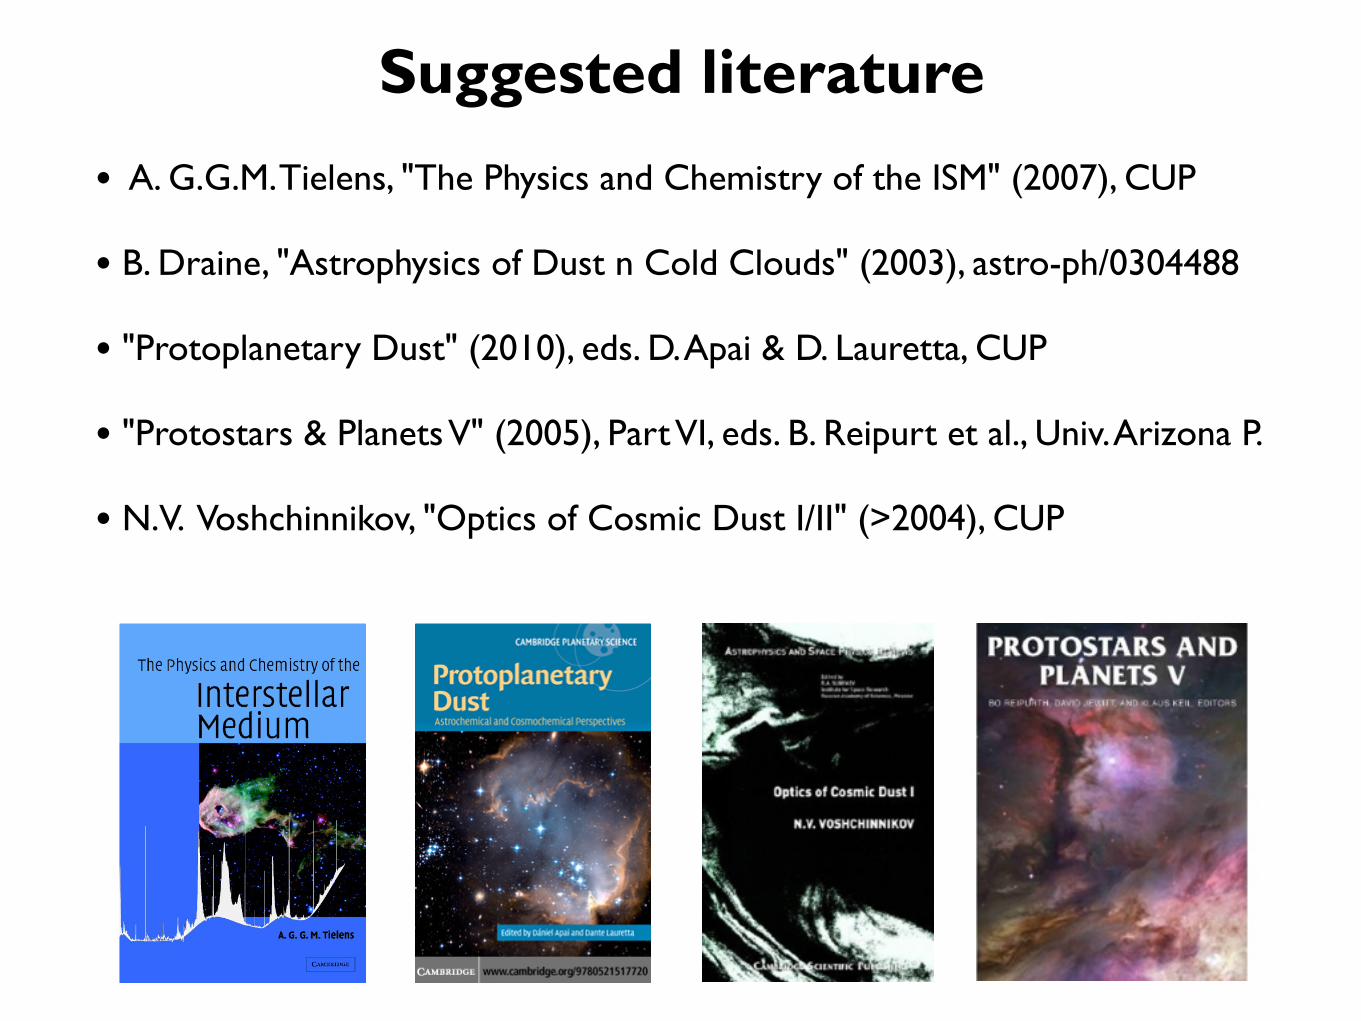
Suggested literature
• A. G.G.M. Tielens, "The Physics and Chemistry of the ISM" (2007), CUP
• B. Draine, "Astrophysics of Dust n Cold Clouds" (2003), astro-ph/0304488
• "Protoplanetary Dust" (2010), eds. D. Apai & D. Lauretta, CUP
• "Protostars & Planets V" (2005), Part VI, eds. B. Reipurt et al., Univ. Arizona P.
• N.V. Voshchinnikov, "Optics of Cosmic Dust I/II" (>2004), CUP

Outline
• The role of dust
• Light interaction with grains
• Structure & evolution of protoplanetary disks (PPDs)
• Evolution of dust in PPDs
• Observations of dust in PPDs
• ALMA observations

The role of dust in star-formation
• Dust: ~25Å–1cm
• Widespread, 1% by mass (ISM)
• Opaqueness of matter
• Heating & cooling
• Sink of heavy elements (>Na)
• Provides surface for catalytic reactions & adsorption
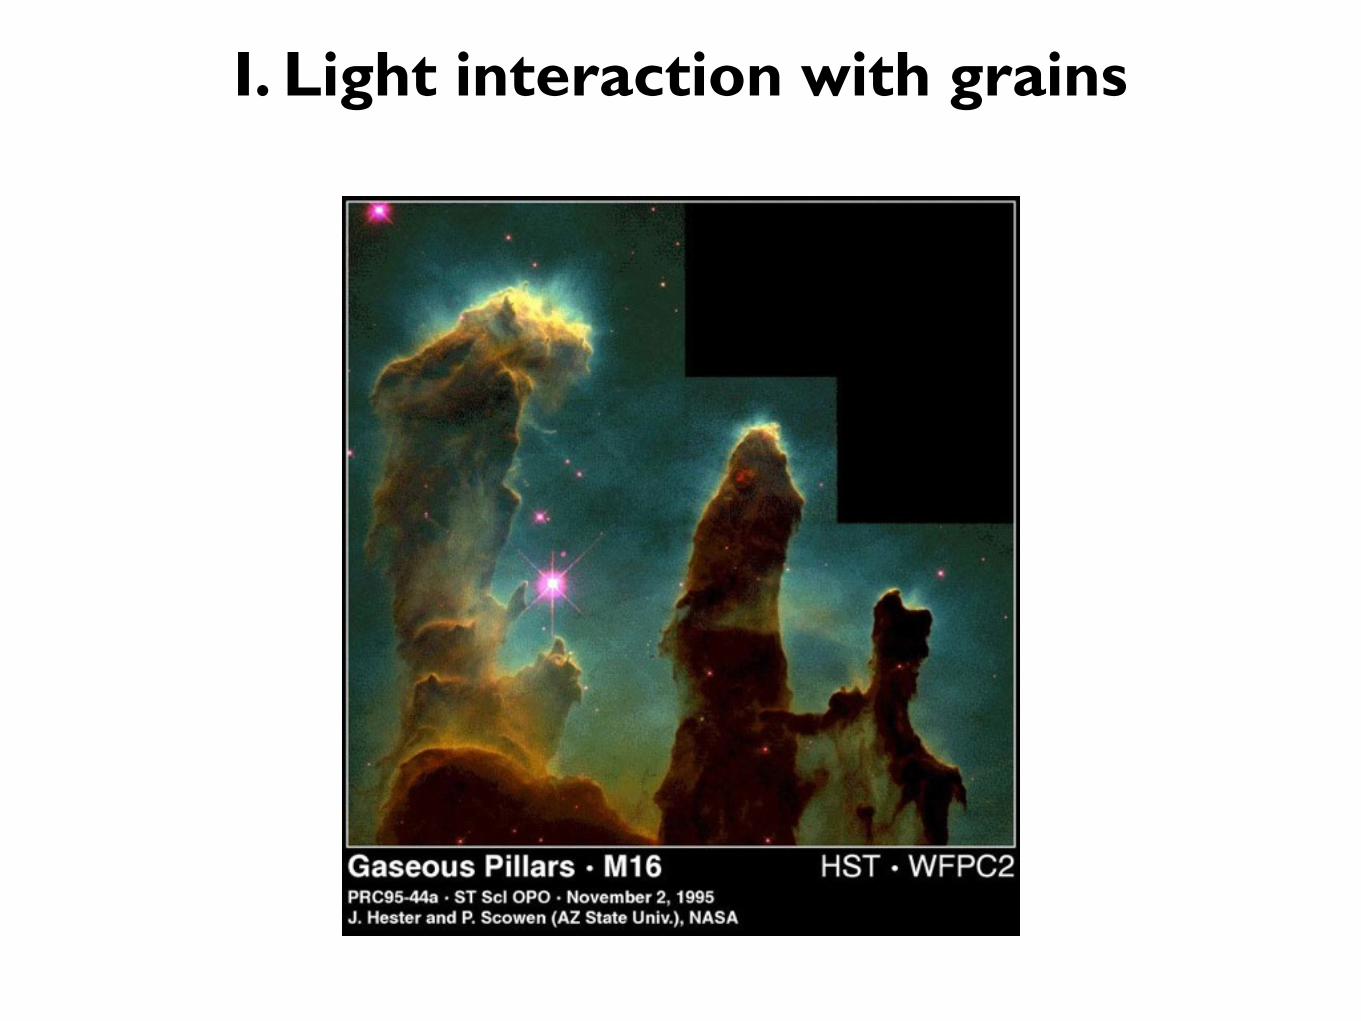
I. Light interaction with grains

• Extinction = absorption + scattering:
• Cross-section for grain of radius "a":
• Size parameter for a wavelength "λ":
• Complex refractive index:
• Single-scattering albedo:
• Phase function: p(θ)
• Polarization: full Stokes vector (I,Q, U, V)
• Different theories for various combinations of x and m
• Measured refractive indices are needed
Basics definitions
x =2πa
λ
Qext = Qabs + Qsca
Cext = πa2Qext
m = n− ik
ω = 1−Qsca/Qext

• Small dielectric grains (Rayleigh limit):
Distinct regimes of light scattering
Qabs ∝ a,Qsca ∝ a4, p(θ) = 3/4(1 + cos2 θ)
• Huge grains (geometric optics): x→∞, 2x|m− 1|→∞
x→ 0, |mx|→ 0
Qext = 2,
4kx 1 : Qabs = 2,
4kx 1 : Qabs ∼ a
forward scattering
• Intermediate case: need exact theory- Mie theory for homogeneous spheres (Mie 1908)- Multilayered spheres (Voshchinnikov et al. 2004)- Infinite/finite cylinders (Bohren & Huffman 1983)- Spheroidal particles (Asano 1979)- Discrete Dipole Approximation for arbitrary 3D particles (Purcell & Pennypacker 1973)
2.2. THE MODEL 9
Figure 2.1. In the left panel a typical ballistic particle-cluster aggregate (BPCA) is shown. The ballisticcluster-cluster aggregate (BCCA) is presented in the middle panel. An “onion-like” (multishell) sphericalparticle is schematically depicted in the top right panel, whereas a “composite” (many-many layered) sphereis shown in the bottom right panel.
2.2.1.2 Grain structure and topology
In many studies of the dust properties in protoplanetary discs, the grains are still assumed to be spheri-cal particles (e.g., Natta et al., 2001). However, it becomes evident from theoretical investigations andlaboratory experiments that the dust agglomeration is an efficient process in dense and relatively coldenvironments, like protostellar cores or protoplanetary discs (e.g., Blum et al., 2002; Kempf et al.,1999; Kesselman, 1980; Nuth and Berg, 1994; Ossenkopf and Henning, 1994; Wurm and Blum,1998, 2000). Agglomeration leads to the formation of irregular particles consisting of hundreds orthousands of tiny subgrains. Usually, dust aggregates of two extreme kinds are considered, dependingon the coagulation process, namely, BPCA (ballistic particle-cluster aggregation) and BCCA (ballisticcluster-cluster aggregation). The laboratory and theoretical studies reveal that the BPCA aggregatesare sphere-like particles with a fractal dimension of about 3. They have a compact “core” and a morerarefied “mantle”. The BCCA process results in the formation of filamentary grains with complicatedstructure. They have fractal dimension of roughly 1.5–2 (Stognienko et al., 1995). Examples for thesetwo kinds of aggregates are shown in Fig. 2.1.
During the evolution of parent objects, chemical and physical processes can further modify theproperties of dust grains. For instance, accretion of volatile materials on dust surfaces and theirsubsequent chemical processing are efficient in outer regions of protoplanetary discs and in protostel-lar clouds (e.g., Brown et al., 1988; Greenberg, 1967; Hartquist and Williams, 1990; Hasegawa andHerbst, 1993; van Dishoeck and Blake, 1995; Willacy et al., 1994). This results in a well-defined“core-mantle” or, more probably, an “onion-like” grain structure (see Fig. 2.1, top right panel). In ac-cretion discs, dust can be further transported by the accretion flow toward hotter regions, where theirvolatile mantle materials evaporate, and sputtering, annealing, and combustion processes may changeeven stronger the properties of the grains (e.g., Bauer et al., 1997; Finocchi et al., 1997; Gail, 2001,2002). Therefore, the real astronomical grains should have a complicated structure and topology.
Unfortunately, modern computational methods and facilities allow only the consideration of some-what simplified (but still reasonable) types of dust grains. I focus on the following particle types:
1. Homogeneous and composite aggregates;
2. Homogeneous, composite, and porous composite spherical particles;
3. Multishell and porous multishell spherical particles.
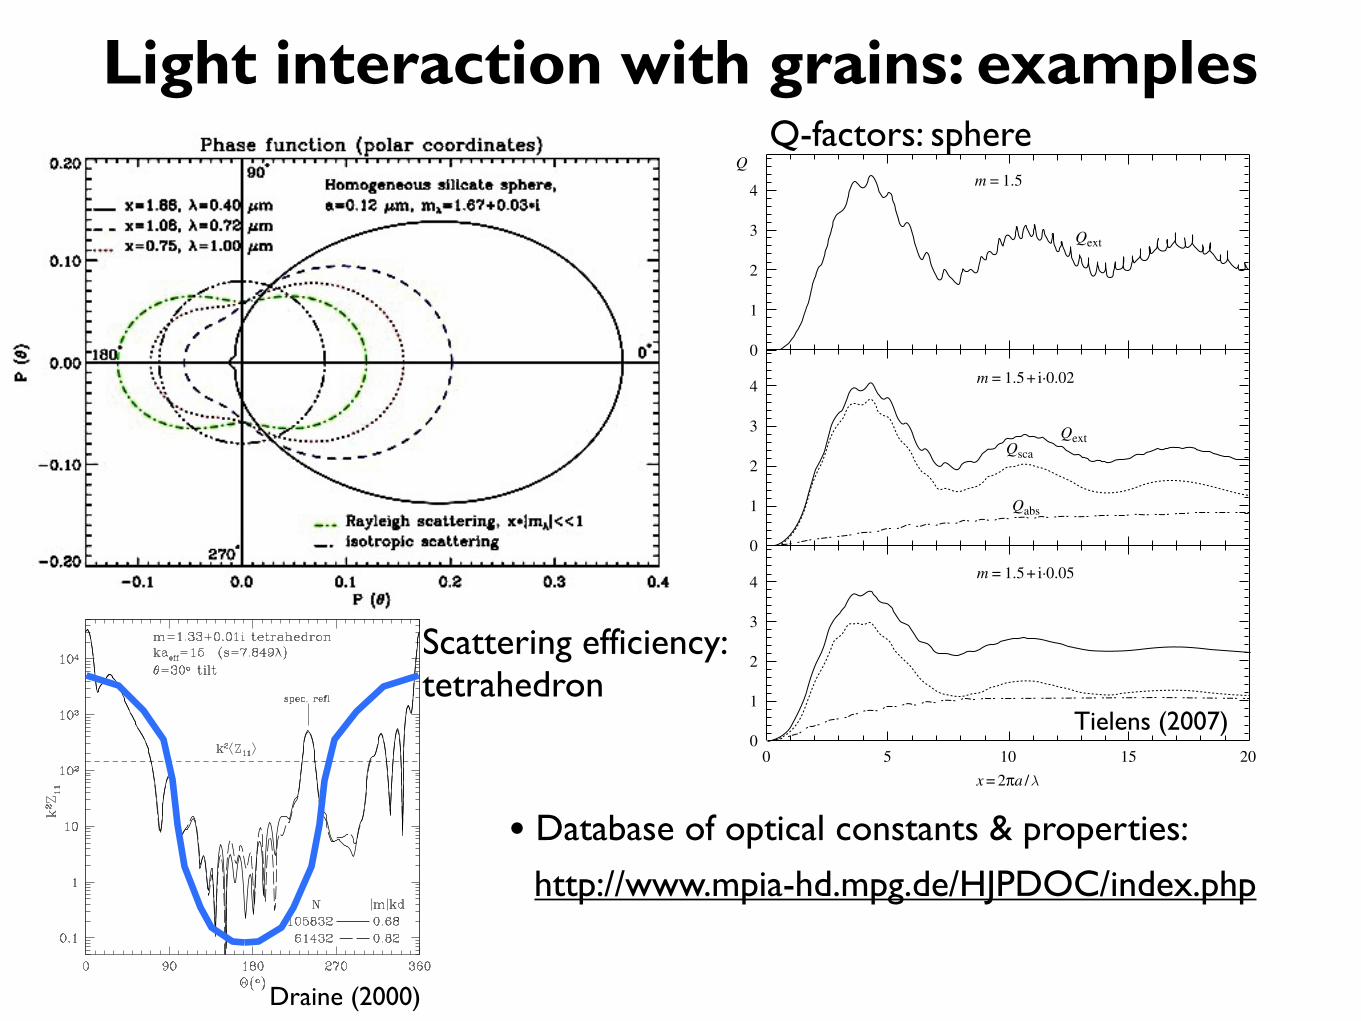
Light interaction with grains: examples
Tielens (2007)
22 B. T. Draine
Fig. 14. S11 = k2dCsca/d! for scattering of unpolarized light bya tetrahedron,for scattering directions in the x-y plane (see Fig. 13), as a function of scatteringangle ". The tetrahedron has refractive index m = 1.33+0.01i, has edges of lengths = 7.849#, where # is the wavelength of the incident light in vacuo, and is orientedwith an angle $ = 30! between kin and a1. The peak at " = 240! correspondsto the direction of specular reflection for geometric optics. Results are shown fora tetrahedron represented by N = 61432 and N = 105832 dipoles. The scatteredintensities are in excellent agreement in all directions where the scattering is at allstrong. The dashed line shows k2!Z11" = Csca/4%. Taken from Draine (2000).
lattice of such polarizable points would have the same dispersion relation asthe material of dielectric function ! (Draine & Goodman 1993). With FFTtechniques employed to speed the calculation, it is now feasible to calculatescattering and absorption by targets represented by more than 100,000 po-larizable dipoles on a workstation with 256 MB of RAM. There are greate!ciencies if the dipoles are situated on a cubic lattice, so DDSCAT requiresthat this be the case.
The DDA can be applied to inhomogeneous targets and targets with com-plex geometries. As an example of the type of problem which can be solved,in Fig. 13 we show a discrete-dipole array of 61432 dipoles intended to ap-proximate a tetrahedral target. In Fig. 14 we show the calculated scattered
Draine (2000)
http://www.mpia-hd.mpg.de/HJPDOC/index.php• Database of optical constants & properties:
5.2 Physical processes 121
Q
00 10 20
1
2
3
4
0
1
2
3
4
0
1
2
3
4
5 15x = 2!a /!
m = 1.5+ i·0.05
m = 1.5
m = 1.5+ i·0.02
Qext
QextQsca
Qabs
Figure 5.1 The extinction and scattering efficiency calculated using Mie theoryfor spherical grains plotted as a function of the size parameter, x = 2!a/".The adopted optical constants are indicated in the panels. Figure adapted fromH.C. van der Hulst, 1981, Light Scattering by Small Particles, (New York:Dover).
scattering and the absorption efficiency both approach unity and the extinctionefficiency goes to 2. This result in the geometric optics limit may seem, at firstsight, somewhat paradoxical. However, all the light falling within the geometriccross section of the grain is either absorbed or scattered. Moreover, the beam oflight is also diffracted (scattered at small angles) at the edges of the grain. Thisdiffraction also removes exactly an amount of light given by the geometric crosssection. Of course, for objects which are near, this diffraction loss is imperceptiblebut at “interstellar” distances this light is lost from the beam.Sometimes, results such as presented in Fig. 5.1 are used to infer the wave-
length dependence of the extinction and scattering efficiency. However, generally,the optical constants are not constant with wavelength. Only for truly dielectric
Q-factors: sphere
Scattering efficiency:tetrahedron

Light interaction with grains: opacities
Semenov (2005)
• Extinction per unit mass of gas (cm2/g):
• Disks are optically thick: λ ≲ 100 μm
• Dust mass in PPDs at distance D with flux Sv:
• Grain sizes, topology, porosities
• Conducting materials (Fe, FeS, graphite)
MILLIMETER OBSERVATIONS OF CIRCUMSTELLAR DISKS AROUND SUN-LIKE STARS.V.Roccatagliata, ([email protected]), Th. Henning, S.Wolf,MaxPlanck Institut fur Astronomie (MPIA), Konigstuhl 17,Heidelberg,J.M. Carpenter, California Institute of Technology, Department of Astronomy, Pasadena, J. Rodmann, ESA.
We present the results of a sensitive 1.2 mm continuumsurvey of a sample of 3 primordial and 33 debris disks aroundsolar-type stars carried out to determine the evolution of debrisdust mass as a function of time.
These systems were detected with the Spitzer Space Tele-scope during an infrared spectrophotometric survey of solar-type stars spanning ages from 3 Myr to 3 Gyr (The Forma-tion and Evolution of Planetary Systems, FEPS, Spitzer SpaceTelescope legacy program - P.I.M.Meyer). Sources older than!100 Myr are debris disk systems, while the younger systemsmay represent either the remnants of primordial accretion disksand/or the early stages of the formation of a debris disk. Theinfrared excess in the spectral energy distribution detected withSpitzer indicates the presence of circumstellar dust. Modelsof this excess provide an estimation of the dust mass and outerradius of the disk with an uncertainty of orders of magnitude.Our IRAM observations are crucial to constrain disk modelsmeasuring, or placing stringent limits, on the mass of dustcontained in small grains. Since the millimeter emission fromthe disk is optically thin, we can derive the disk dust massesfrom the observed millimeter fluxes, S! :
Mdust =S!D2
k!B!(Tdust)(1)
where k! = k0(!/!0)" is the mass absorption coefficient, "
parameterizes the frequency dependence of k! , S! is the ob-served flux, D is the distance to the source, Tdust is the dusttemperature, B!(Tdust) is the Planck function. We assumedk0 = 1 cm2/g at 1.2mm, " = 1 and Tdust=40 K.Wehavedetected5 sources: ScoPMS52and [PZ99] J161411.0-230536 (primordial disks), HD 8907, HD 104860 and HD 377(debris disks). The 1.2 mm fluxes measured and the massesderived from Eq.1 are compiled in Table 1.For the sample sources with millimeter fluxes not detected atthe 3# level, we compute a dust mass upper limits. In Fig. 1we present the derived dust masses and the upper limits as a
function of their age. We represent as well the results fromCarpenter et al. (2005), in order to compare the two studies.Due to the higher sensitivity of the IRAMbolometer comparedto SEST (Swedish-ESO Submillimeter Telescope) and OVRO(Owens Valley Radio Observatory), we could detect disks withdust masses of about one order of magnitude less compared toour previous attempt (Carpenter et al. 2005).We find that there is a steady decline of the disk mass as thesystem ages which suggests a significant evolution of the diskmaterial. This can be interpreted as a decrease in the mass ofthe small dust grain particles detectable by our survey and/orchanges in the dust opacities. This observational result is alsopredicted by theretical models. Dominik & Decin (2003) ana-lyze the decrease of the amount of dust with time as a functionof the physical mechanism responsible for dust removal. Indense systems (M>10!8M") collisions are the main driversof dust removal, while in less dense environments the dom-inant process is the Poynting-Robertson drag. In both casestheoretical models predict a continuous variation of the dustmass with time with a power-law dependence. In the colli-sional regime the dust mass decrease with t!1 while a power-law Mdust " t!2 is characteristic for the Poynting-Robertsonregime (Fig.1). Our observations support the first hypothesis,i.e. that collisions are the main mechanism for dust removalin debris disks.
Table 1: 1.2 mm fluxes and the dust masses derived from Eq.1.Source Flux Mass
(mJy) (M")ScoPMS52 5.9 ± 1.4 5.45 · 10!6
[PZ99] J161411.0-230536 3.5 ± 1.2 3.89 · 10!6
HD 8907 3.2 ± 1.0 2.15 · 10!7
HD 104860 4.4 ± 1.2 5.73 · 10!7
HD 377 4.0 ± 1.1 3.59 · 10!7
2.2. THE MODEL 13
1 100 10000!, µm
10-4
10-2
100
102
"!, c
m2 /g
IPS model,T<120 K
1 10 100 1000 10000!, µm
10-4
10-2
100
102" !
, cm
2 /g
IPS model,T>700 K
1 10 100 1000 10000!, µm
10-4
10-2
100
102
" !, c
m2 /g
IRS model,T<120 K
1 10 100 1000 10000!, µm
10-4
10-2
100
102
" !, c
m2 /g
IRS model,T>700 K
Max Max
MaxMax
(I) (I)
(V)(V)
10 100 1000T, K
0.01
0.1
1
10
! R, c
m2 /g
5-layered spherescomposite aggregatescomposite sphereshomogeneous aggregateshomogeneous spheresporous 5-layered spheresporous composite spheres
Rosseland mean opacity:IPS model
10 100 1000T, K
0.01
0.1
1
10
! R, c
m2 /g
5-layered spherescomposite aggregatescomposite sphereshomogeneous aggregateshomogeneous spheresporous 5-layered spheresporous composite spheres
Rosseland mean opacity:IRS model
(V)
(I) (I)
(V)
Figure 2.2. The monochromatic (upper two rows) and Rosseland mean (bottom row) dust opacities calculated
for the temperature range T ∈ [10, 1 500] K (C/O= 0.43) in the case of IPS (left panels) and IRS (right panels)
silicate dust model. The following dust particles are indicated: multishell spheres – solid line, composite
aggregates – triangles, composite spheres – circles, homogeneous aggregates – dashed line, homogeneous
spheres – dot-dashed line, porous multishell grains – dotted line, and porous composite spheres – pluses. The
shorthand Max denotes the peak wavelength of the Planck function for a considered temperature range. The
(I) and (V) mark the first (T <∼ 120 K) and fifth (T >∼ 700 K) temperature ranges (see Table 2.2).
2.2.3 Opacity table
To assemble the entire opacity table, I take into account either only dust opacities for low temper-
atures, T <∼ 1 500 K, or only gas opacities for higher temperatures. As has been shown by many
ISM-like dustDust emissivity slope β:
• ~2 for small ISM dust
• >0.5 for large grains
Guilloteau et al.: Dual frequency mm imaging of proto-planetary disks
(1) (2) (3) (4) (5) (6) (7) (8)Source Major Minor PA 1.3 mm Flux 2.7 mm Flux ! !100
(!!) (!!) (") mJy mJyBPTau (*) 0.50± 0.01 0.34± 0.01 10.± 2. 58.2± 1.3 4.2± 0.2 2.73± 0.07 2.39± 0.06CI Tau 0.74± 0.01 0.47± 0.01 14.± 1. 125.3± 6.2 19.0± 0.8 2.58± 0.13 1.72± 0.06CQTau (*) 0.86± 0.04 0.63± 0.04 31.± 8. 162.4± 2.6 13.3± 0.5 2.60± 0.06 2.60± 0.05CYTau 0.55± 0.01 0.47± 0.01 -15.± 4. 111.1± 2.9 23.4± 0.7 2.13± 0.08 1.86± 0.05DGTau 0.56± 0.01 0.46± 0.01 -1.± 3. 389.9± 4.6 59.5± 0.9 2.57± 0.04 2.48± 0.03DLTau 0.71± 0.01 0.56± 0.01 29.± 2. 204.4± 1.9 27.3± 1.0 2.75± 0.06 1.86± 0.04DMTau 0.50± 0.01 0.45± 0.01 -36.± 9. 108.5± 2.4 15.6± 0.4 2.65± 0.07 1.78± 0.05DQTau (*) 0.24± 0.01 0.17± 0.01 -24.± 6. 83.1± 2.8 9.6± 0.8 2.24± 0.12 1.69± 0.10FTTau 0.43± 0.01 0.40± 0.01 -59.± 8. 72.5± 3.9 18.8± 0.8 1.85± 0.13 1.65± 0.04GMAur 1.05± 0.05 0.57± 0.05 57.± 4. 175.8± 5.3 23.7± 0.8 2.74± 0.09 2.74± 0.06LkCa 15 1.20± 0.04 0.91± 0.04 65.± 6. 109.6± 2.0 17.4± 0.6 2.52± 0.07 2.49± 0.05MWC480 0.67± 0.01 0.55± 0.01 22.± 3. 289.3± 2.5 35.8± 0.5 2.86± 0.03 2.76± 0.02MWC758 1.00± 0.09 0.82± 0.10 -12.± 22. 54.8± 2.0 7.3± 1.4 2.76± 0.31 2.77± 0.30UZTauE 0.75± 0.01 0.45± 0.01 -89.± 2. 149.9± 1.4 22.9± 0.6 2.57± 0.05 2.58± 0.04UZTauW 0.40± 0.04 0.33± 0.03 -35.± 24. 34.3± 1.3 6.4± 0.6 2.30± 0.18 2.29± 0.14HLTau 0.87± 0.01 0.64± 0.01 -45.± 2. 818.8± 10.8 94.1± 0.9 2.96± 0.03 2.90± 0.02HH30 1.43± 0.02 0.22± 0.03 -55.± 0. 19.8± 0.8 3.8± 0.2 2.26± 0.13 2.31± 0.12DGTau b 0.69± 0.03 0.34± 0.02 26.± 2. 531.4± 0.0 83.6± 12.4 2.53± 0.20 2.02± 0.09TTau 0.48± 0.05 0.34± 0.06 4.± 17. 199.7± 6.2 48.8± 1.0 1.93± 0.07 1.97± 0.05Haro 6-10N 0.24± 0.11 0.09± 0.06 53.± 18. 43.8± 3.1 10.5± 0.7 1.95± 0.19 1.96± 0.14Haro 6-10 S 0.37± 0.05 0.11± 0.07 -2.± 8. 46.7± 3.2 9.1± 0.7 2.24± 0.20 2.12± 0.14Haro 6-13 0.52± 0.03 0.36± 0.04 -1.± 10. 113.5± 4.0 31.3± 1.0 1.76± 0.09 1.76± 0.07Haro 6-33 0.57± 0.11 0.45± 0.07 31.± 28. 34.2± 3.1 8.0± 1.0 1.99± 0.30 1.65± 0.24Table 3. Apparent sizes and orientations derived from a Gaussian fit (Col 2-4) to the 1.3 mm data in the uv plane for baselineslonger than 100 m. Total flux at 1.3 and 2.7 mm (or 3.4 mm for stars with (*) in Col 1) (Col 5-6), and apparent spectral index ! (Col7) are derived from Gaussian fit to all visibilities. !100 (Col 8) is the apparent spectral index for baselines longer than 100 m.
The disks are thus vertically isothermal. To allow a homoge-neous comparison, we used T100 = T (100 AU) = 15 K andq = 0.4, except when those parameters can be constrained by theobservations. The validity and impact of this assumption will bediscussed in Sec.4.1.
Similar analyses have been used by Kitamura et al. (2002)and Andrews & Williams (2007) for their 2mm and 0.8mmdata respectively. Most previous studies (Kitamura et al. 2002;Andrews & Williams 2007; Isella et al. 2009) used the thin diskapproximation to compute visibilities. Here, because our sam-ple includes highly inclined objects, we assume that the disksare flared, with a scale height varying as a power law of theradius h(r) = H100(r/100AU)#h. For all but the two highly in-clined objects (HH30 and DGTau-b), we used H100 = 16 AUand h = #1.25. These values agree with those derived usingthe gas temperature determined from CO observations wheneveravailable, and the stellar mass, either from kinematic determina-tion (Simon et al. 2000) or standard evolutionary tracks. The re-sults are, however, completely independent of the assumed scaleheight, which justifies a posteriori the thin disk approximationused by previous authors. However, for the two highly inclinedobjects, H100 and the exponent h had to be used as adjustableparameters.
The inner radius Rint is also not significant in general, ex-cept for a few special sources that display inner cavities, suchas GMAur, HH30 and LkCa 15 (see Sec.4.4.2). We fixed it to 1AU, but in general, any value lower than about 3-4 AU would notchange the results. For Model 2, we used for Rout the outer radiusderived from CO observations when available. If not, we set itto 500 AU. These outer radii are large enough to have negligibleinfluence on the results.
Each model has thus a priori five free intrinsic parameters:two for temperature T0 and q, three for the surface density !0, por ", and Rout or Rc, plus the inclination, orientation and position.
The dust opacity as a function of wavelength and radius com-pletes the description. In a first step, we assume it to be indepen-dent of radius and described by the following prescription
#($) = #230($/230GHz)%m , (12)
with #230 = 2 cm2g#1 (per gram of dust). This introduces oneadditional parameter, the mean dust emissivity index %m. This issimilar to the Beckwith et al. (1990) results, but using a di"er-ent pivot frequency to avoid further dependence of the deriveddisk mass on %. The dust model used by Andrews & Williams(2007) and Andrews et al. (2009) also results in %m = 1, butwith a slightly di"erent absorption coe#cient #230 = 2.2 cm2g#1.Finally, we also assume that the gas-to-dust ratio is constant andequal to 100. In a second step, we shall relax the assumption ofconstant #($) as a function of radius r, see Sec.4.5.
Appendix A (available on-line only) illustrates some of thepossible degeneracy between the various models, in particularbetween constant dust properties with an optically thick innerregion, and variable dust properties.
3.3. Fitting method
For the inclination and orientation, we used the accurate deter-mination from the CO kinematics when possible. Values derivedfrom optical observations (scattered light images, or optical jets)or molecular jets were used for some sources for which the diskkinematics is not known. Independent fits of these parametersfrom the dust emission were also performed to check the con-sistency of the results: see Table 4 and references therein. Westress, however, that the uncertainties on the disk inclination andorientation do not significantly a"ect the derived radial structure.
At each observed frequency, the radiative transfer equationis solved by a simple ray-tracing algorithm, and model imagesare generated. Great care has been taken to avoid numerical pre-
7
κ(ν) ∝ πa2Qext(ν, a)Ngr(a)md
mg
2.2. THE MODEL 13
1 100 10000!, µm
10-4
10-2
100
102
"!, c
m2 /g
IPS model,T<120 K
1 10 100 1000 10000!, µm
10-4
10-2
100
102
" !, c
m2 /g
IPS model,T>700 K
1 10 100 1000 10000!, µm
10-4
10-2
100
102
" !, c
m2 /g
IRS model,T<120 K
1 10 100 1000 10000!, µm
10-4
10-2
100
102
" !, c
m2 /g
IRS model,T>700 K
Max Max
MaxMax
(I) (I)
(V)(V)
10 100 1000T, K
0.01
0.1
1
10
! R, c
m2 /g
5-layered spherescomposite aggregatescomposite sphereshomogeneous aggregateshomogeneous spheresporous 5-layered spheresporous composite spheres
Rosseland mean opacity:IPS model
10 100 1000T, K
0.01
0.1
1
10
! R, c
m2 /g
5-layered spherescomposite aggregatescomposite sphereshomogeneous aggregateshomogeneous spheresporous 5-layered spheresporous composite spheres
Rosseland mean opacity:IRS model
(V)
(I) (I)
(V)
Figure 2.2. The monochromatic (upper two rows) and Rosseland mean (bottom row) dust opacities calculated
for the temperature range T ∈ [10, 1 500] K (C/O= 0.43) in the case of IPS (left panels) and IRS (right panels)
silicate dust model. The following dust particles are indicated: multishell spheres – solid line, composite
aggregates – triangles, composite spheres – circles, homogeneous aggregates – dashed line, homogeneous
spheres – dot-dashed line, porous multishell grains – dotted line, and porous composite spheres – pluses. The
shorthand Max denotes the peak wavelength of the Planck function for a considered temperature range. The
(I) and (V) mark the first (T <∼ 120 K) and fifth (T >∼ 700 K) temperature ranges (see Table 2.2).
2.2.3 Opacity table
To assemble the entire opacity table, I take into account either only dust opacities for low temper-
atures, T <∼ 1 500 K, or only gas opacities for higher temperatures. As has been shown by many
I. Light interaction with grains: Summary
• Opacities
• Thermal balance
• Dust emissivity slope varies at >100μm
• Sizes, topology, porosity, conducting materials
• Tools & databases of optical constants & properties
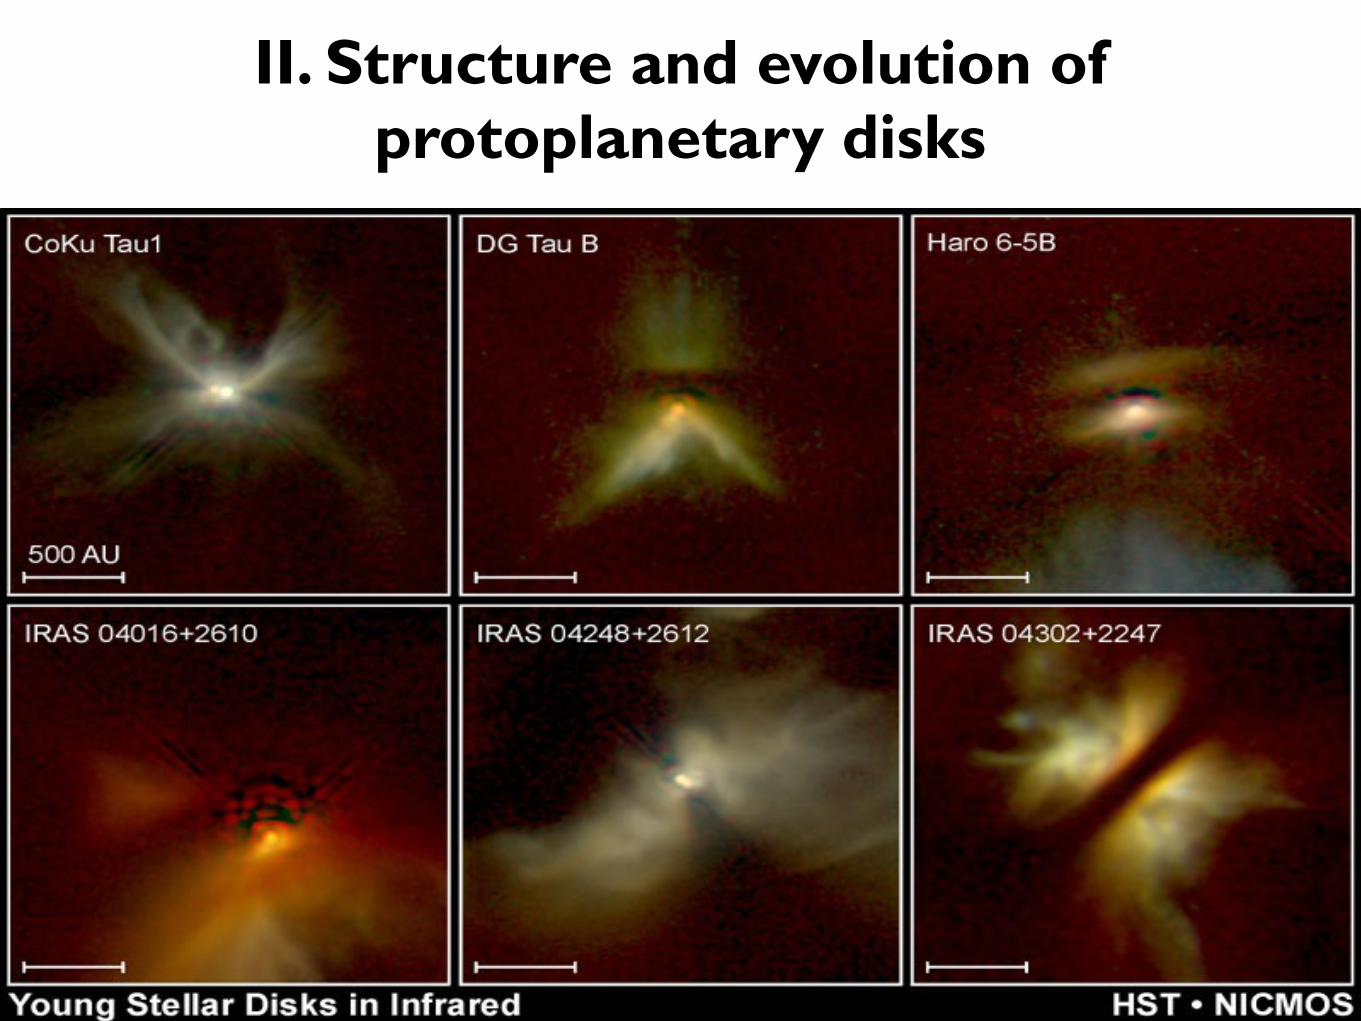
II. Structure and evolution of protoplanetary disks
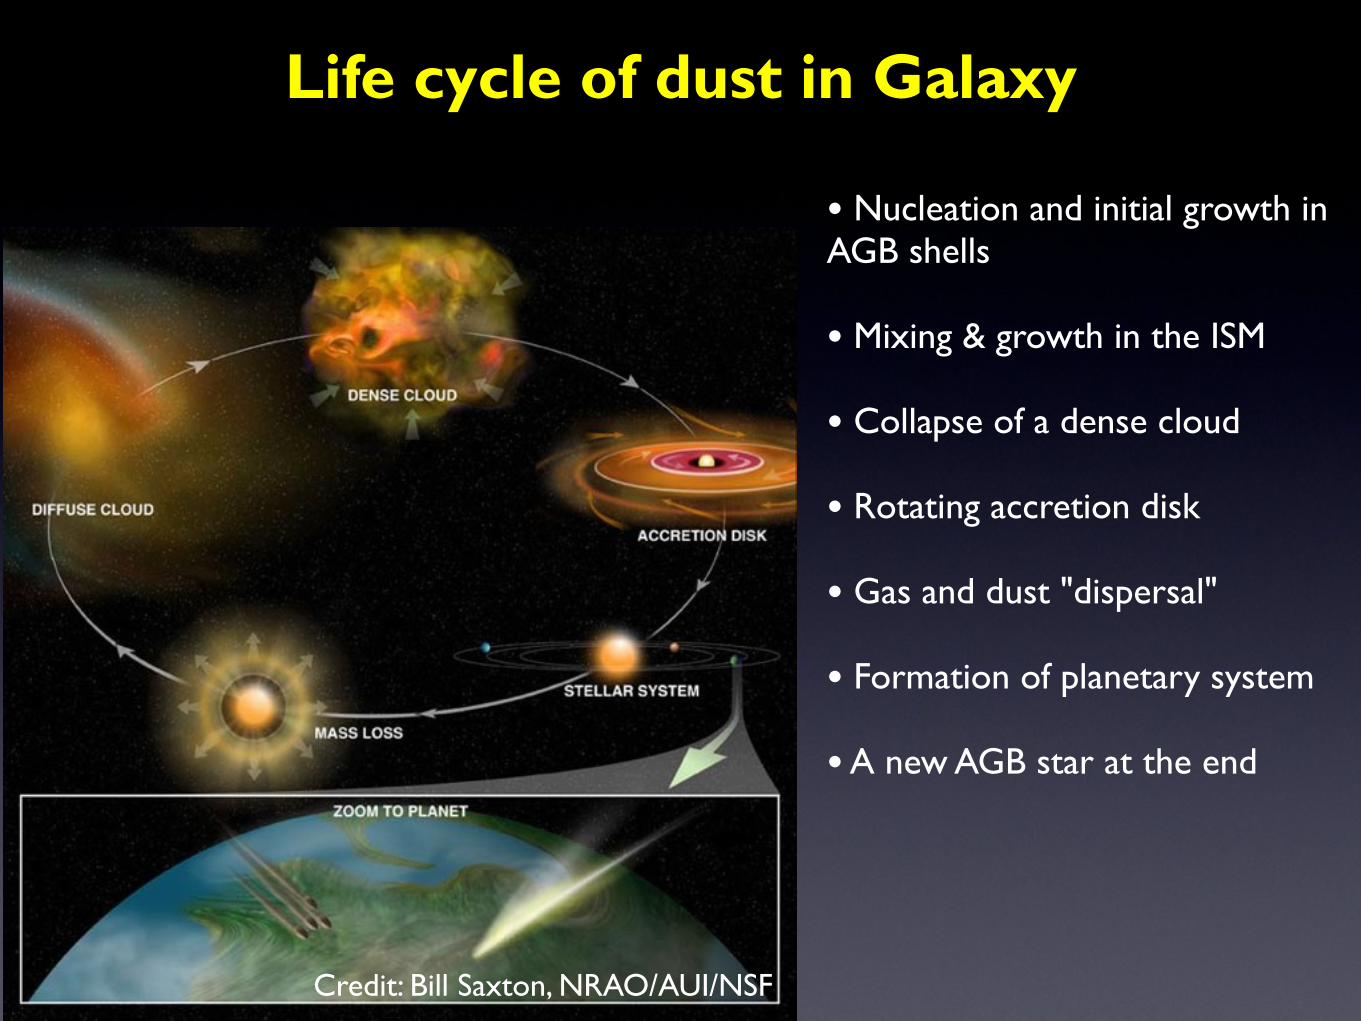
Life cycle of dust in Galaxy
Credit: Bill Saxton, NRAO/AUI/NSF
• Nucleation and initial growth in AGB shells
• Mixing & growth in the ISM
• Collapse of a dense cloud
• Rotating accretion disk
• Gas and dust "dispersal"
• Formation of planetary system
• A new AGB star at the end
• Conservation & redistribution of angular momentum
• Gas viscosity
• Gravity
• Equation of state
• Initial mass
• Initial angular speed of a cloud
• Characteristics: Rdisk, Mdisk, Tdust, Tgas, surface density, accretion rate, ...
Disk structure & evolution

• Equation of state:
• Hydrostatic equilibrium:
• Assuming isothermal structure in z-direction:
• Density profile:
• Disk pressure scale height:
• H ~0–5
H =√
2csΩ−1K
Disk vertical structure
dPdz = ρΩ2
Kz
P = c2sρ
ρ = ρ0 exp(− z2
H2)
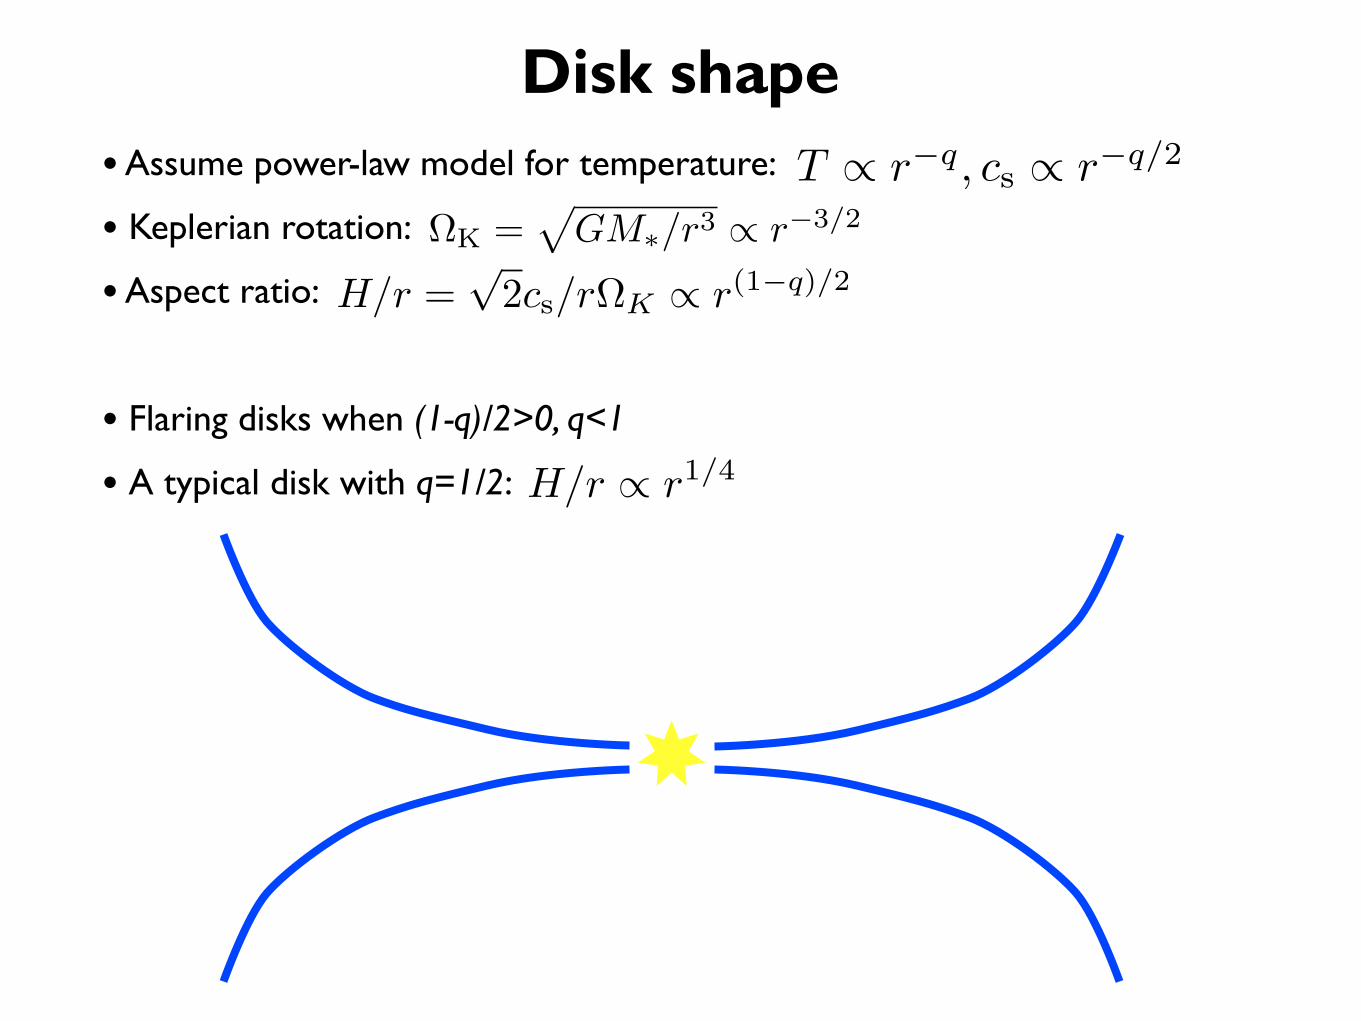
• Assume power-law model for temperature:
• Keplerian rotation:
• Aspect ratio:
• Flaring disks when (1-q)/2>0, q<1
• A typical disk with q=1/2:
Disk shapeT ∝ r−q, cs ∝ r−q/2
ΩK =
GM∗/r3 ∝ r−3/2
H/r =√
2cs/rΩK ∝ r(1−q)/2
H/r ∝ r1/4
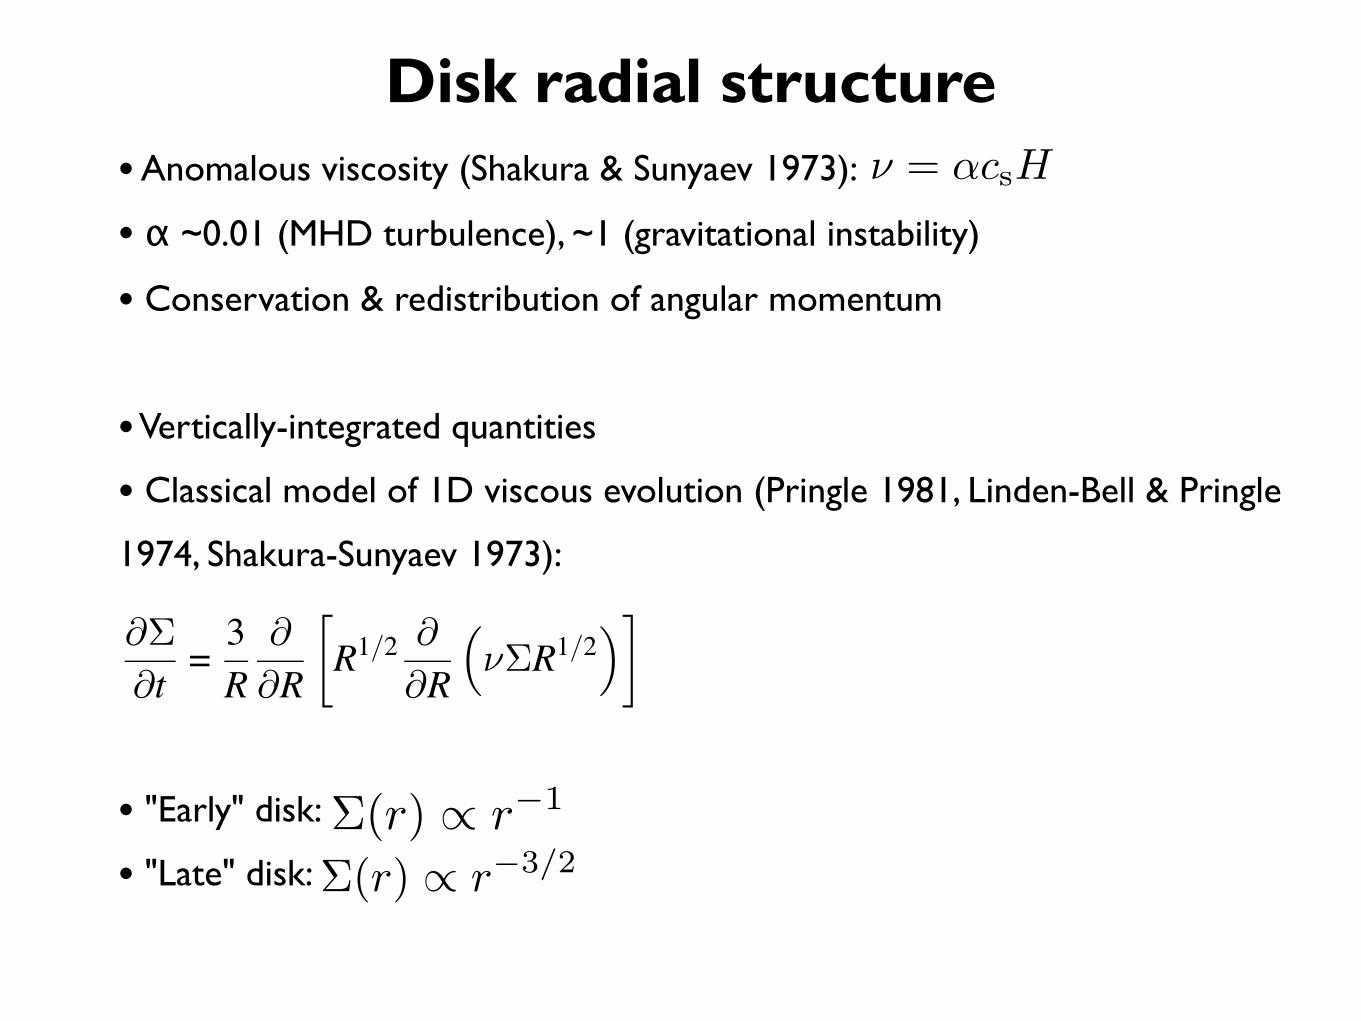
• Anomalous viscosity (Shakura & Sunyaev 1973):
• α ~0.01 (MHD turbulence), ~1 (gravitational instability)
• Conservation & redistribution of angular momentum
• Vertically-integrated quantities
• Classical model of 1D viscous evolution (Pringle 1981, Linden-Bell & Pringle
1974, Shakura-Sunyaev 1973):
• "Early" disk:
• "Late" disk:
Disk radial structureν = αcsH
RECEIVED 2005 NOVEMBER 30; ACCEPTED 2006 FEBRUARY 1; PUBLISHED 2006 FEBRUARY 20Preprint typeset using LATEX style emulateapj v. 04/21/05
THE STELLAR MASS-ACCRETION RATE RELATION IN T TAURI STARS AND BROWN DWARFSRICHARD D. ALEXANDER1 AND PHILIP J. ARMITAGE1,2
Received 2005 November 30; accepted 2006 February 1; published 2006 February 20
ABSTRACTRecent observations show a strong correlation between stellar mass and accretion rate in young stellar and
sub-stellar objects, with the scaling Macc !M2! holding over more than four orders of magnitude in accretion
rate. We explore the consequences of this correlation in the context of disk evolution models. We note thatsuch a correlation is not expected to arise from variations in disk angular momentum transport efficiency withstellar mass, and suggest that it may reflect a systematic trend in disk initial conditions. In this case we find thatbrown dwarf disks initially have rather larger radii than those around more massive objects. By consideringdisk evolution, and invoking a simple parametrization for a shut-off in accretion at the end of the disk lifetime,we show that such models predict that the scatter in the stellar mass-accretion rate relationship should increasewith increasing stellar mass, in rough agreement with current observations.Subject headings:Accretion, accretion disks — stars: pre-main sequence — stars: low-mass, brown dwarfs —
planetary systems: protoplanetary disks
1. INTRODUCTIONIt is well established that young stars of around solar mass,
such as T Tauri stars (henceforth TTs), are surrounded bydisks. Reprocessing of stellar radiation by these disks causesexcess emission above the stellar photosphere in the infrared,and the accretion of material on to the stellar surface pro-duces both line emission and excess blue continuum emis-sion. This permits an observational measurement of the in-stantaneous stellar accretion rate for large samples of TTs (e.gGullbring et al. 1998). More recently, it has become clear thatyoung brown dwarfs (henceforth BDs) also posses circumstel-lar disks, with observations detecting infrared excesses (e.g.Natta & Testi 2001; Jayawardhana et al. 2003b), accretion sig-natures (e.g. Jayawardhana, Mohanty & Basri 2003a; Natta etal. 2004; Mohanty, Jayawardhana& Basri 2005) and millime-ter continuum emission (e.g. Klein et al. 2003).If BD formation is merely a scaled-down version of star for-
mation, one might guess that the disk mass and stellar accre-tion rate Macc should scale roughly proportional to the (sub-)stellar mass M!. In fact, the accretion rate on to the “stel-lar” surface shows a striking correlation with the square ofthe stellar mass (Muzerolle et al. 2003; Natta et al. 2004; Cal-vet et al. 2004; Muzerolle et al. 2005; Mohanty et al. 2005).The correlation shows a large scatter, but holds overmore than2 orders of magnitude in mass and 4 orders of magnitude inaccretion rate. We expect a large scatter, as disk accretionrates decrease as disks evolve (e.g. Hartmann et al. 1998), butthe physical origin of the Macc !M2
! relationship is not clear.Here we suggest that the most conservative interpretation isthat the correlation reflects the initial conditions establishedwhen the disk formed, followed by subsequent viscous evolu-tion of the disk. We explore the observational consequencesof this model.
2. MODEL
1 JILA, 440 UCB, University of Colorado, Boulder, CO 80309-04402 Department of Astrophysical and Planetary Sciences, University of Col-
orado, Boulder, CO 80309-0391Electronic address: [email protected]
The equation for the surface density evolution, !(R,t), of aviscous accretion disk is
!!
!t= 3R
!
!R
!
R1/2!
!R
"
"!R1/2#
$
, (1)
where R is cylindrical radius, t is time, and "(R,t) is the kine-matic viscosity of the disk (Pringle 1981). If the viscosityis independent of time and can be expressed as a power-lawfunction of radius " ! R! , then Equation 1 permits exact an-alytic solutions. Here we consider the similarity solution ofHartmann et al. (1998), after Lynden-Bell & Pringle (1974).In this case the solution for the surface density of the evolvingdisk is
!(R,t) = Md(0)(2!#)2$R20r!
%!(5/2!!)2!! exp
%
!r2!!
%
&
, (2)
whereMd(0) is the initial disk mass. The dimensionless radiusr = R/R0, where R0 is a scale radius which sets the initial disksize. The dimensionless time % = t/t" + 1, where the viscousscaling time t" is given by
t" =R20
3(2!#)2"0. (3)
Here "0 is the value of the viscosity at radiusR0. The accretionrate on to the star is therefore
Macc =Md(0)2(2!#)t"
%!(5/2!!)2!! . (4)
We suggest that the time evolution implied by this equa-tion is responsible for some of the observed scatter in themass-accretion rate distribution, and assume that the observedMacc ! M2
! relationship holds for the initial accretion rates.Observations of BD disks have shown that the disk-to-starmass ratio is comparable to that found for TTs (Klein et al.2003), so we assume that the initial disk mass scales linearlywith the stellar mass. In order to reproduce the observed cor-relation, that Macc !M2
!, we therefore require that the
t" !1M!
. (5)
For TTs, the viscous time-scale t" is typically " 104–105yr(e.g. Hartmann et al. 1998), and therefore we expect that theviscous scaling time for BDs be of order 106yr.
Σ(r) ∝ r−1
Σ(r) ∝ r−3/2
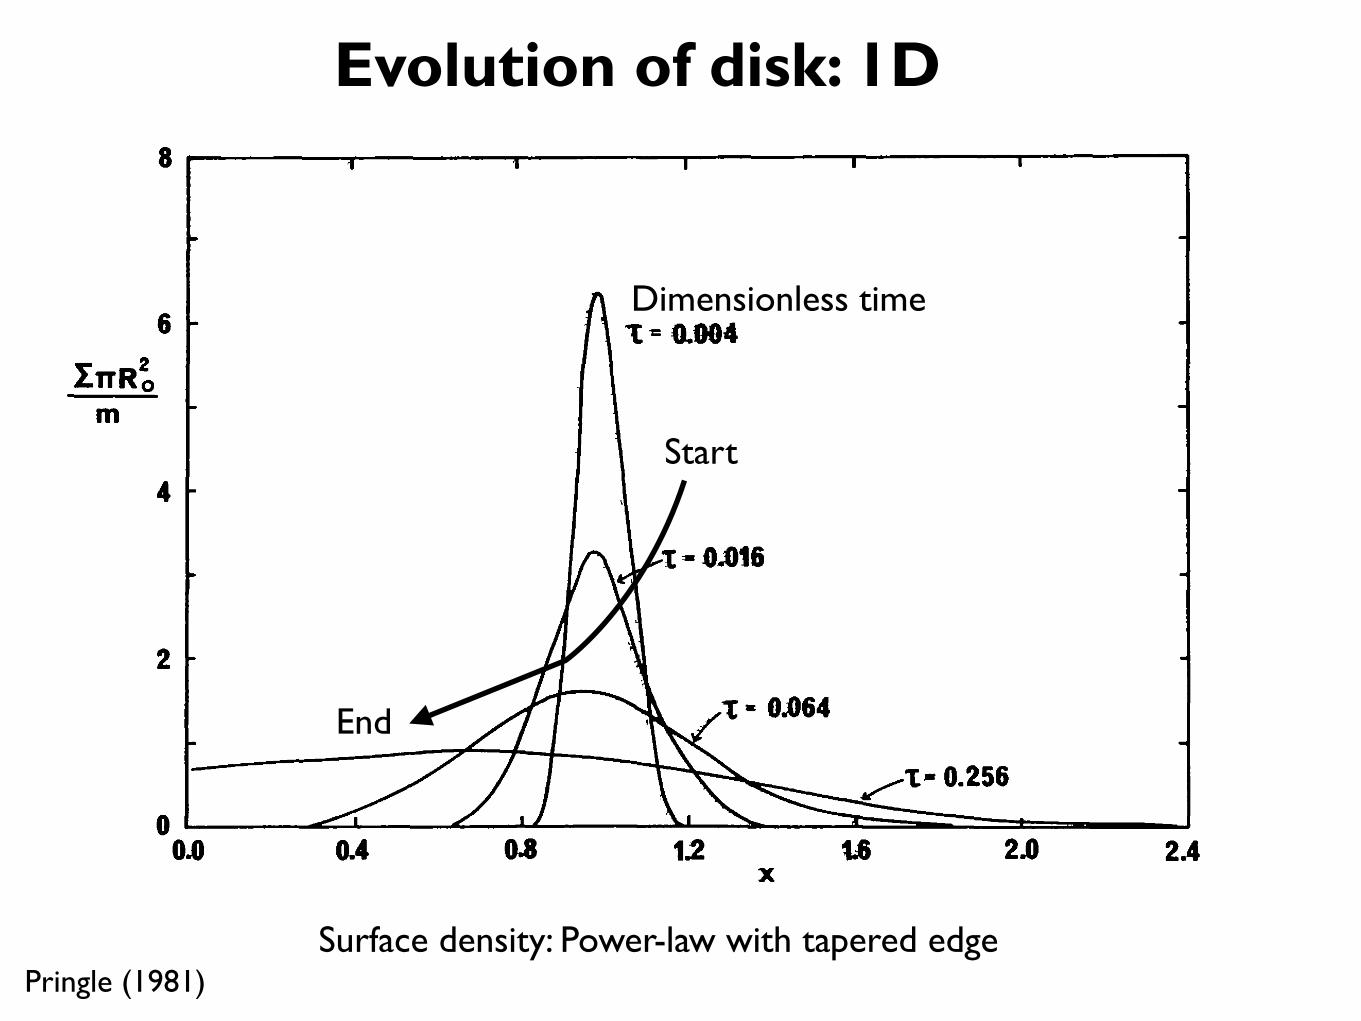
Pringle (1981)
1981ARA&A..19..137P
Dimensionless time
Start
End
Surface density: Power-law with tapered edge
Evolution of disk: 1D
Evolution of disk: 2DThe origins of protoplanetary dust and the formation of accretion disks 55
Age: 131081 yr
–14.0
–14.0
–14.0 –14.0
–14.0
–12.0
–14.0
–14.0 –14.0
–14.0
–13.0–12.0
–14.
0
–14.0
30
20
10
0
–10
z [A
U]
x [AU]–40 –20 0 20 40
x [AU]–40 –20 0 20 40
x [AU]–40 –20 0 20 40
1 km/s 2 km/s
2 km/s 3 km/s
–20
–30
Age: 131276 yr
z [A
U]
x [AU]–40 –20 0 20 40
x [AU]–40 –20 0 20 40
x [AU]–40 –20 0 20 40
Age: 131610 yr30
20
10
0
–10
z [A
U]
–20
–30
Age: 132592 yrz
[AU
]
3 km/s 3 km/s
Age: 132606 yr30
20
10
0
–10
z [A
U]
–20
–30
Age: 132640 yr
z [A
U]
30
20
10
0
–10
–20
–30
30
20
10
0
–10
–20
–30
30
20
10
0
–10
–20
–30
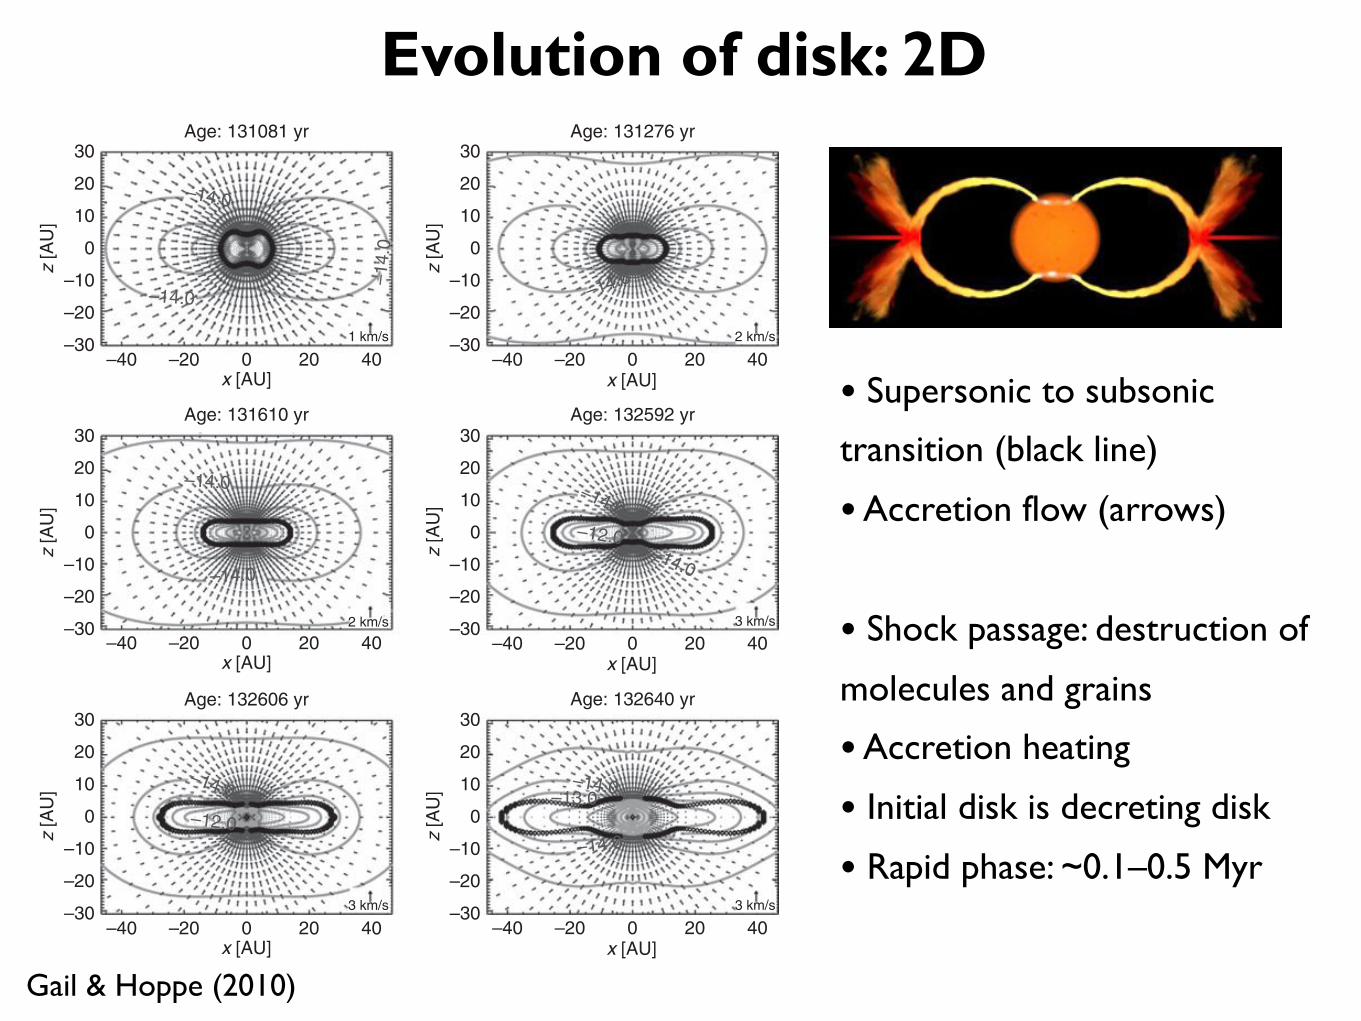
Figure 2.10 Cylindrically symmetric hydrodynamical model of accretion flow withrotation during the early collapse phase, showing the inflow of matter in the merid-ional plane and the build-up of a flat rotating disk structure after about 1.05 free-falltimes. Arrows indicate matter flow direction and velocity, gray lines indicate cutsof isodensity surfaces with meridional plane. Dark crosses outline locations ofsupersonic to subsonic transition of inflow velocity; this corresponds to the posi-tion of the accretion shock. Matter falling along the polar axis and within theequatorial plane arrive within 1600 yr almost simultaneously, which results in analmost instantaneous formation of an extended initial accretion disk [new modelcalculation following the methods in Tscharnuter (1987), figure kindly contributedby W. M. Tscharnuter].
from the symmetry axis, i.e. having significant angular momentum, misses the starand falls onto the gas disk. Fig. 2.10 shows the initial stages of the build-up of a starand the associated gas-disk, as it is found from two-dimensional cylindrically sym-metric hydrodynamic model calculations (Tscharnuter 1987). Model calculations
Gail & Hoppe (2010)
• Supersonic to subsonic
transition (black line)
• Accretion flow (arrows)
• Shock passage: destruction of
molecules and grains
• Accretion heating
• Initial disk is decreting disk
• Rapid phase: ~0.1–0.5 Myr
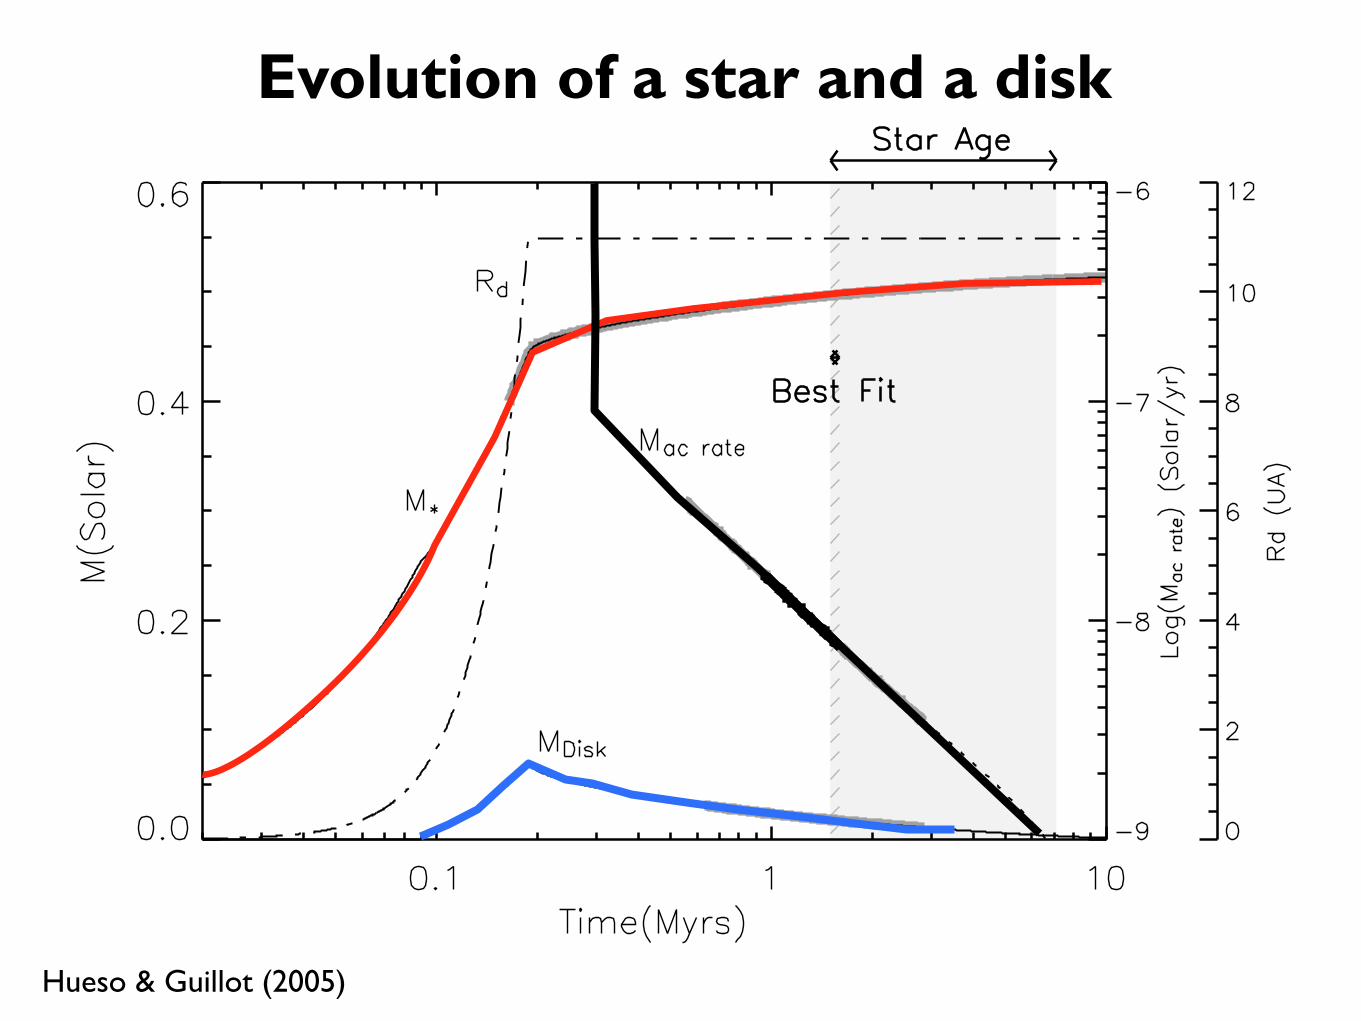
Hueso & Guillot (2005)
Evolution of a star and a disk
714 R. Hueso and T. Guillot: Protoplanetary disks evolution: DM Tau and GM Aur
Table 4. Model parameters for examples 1 and 2.
Parameters Example 1 Example 2 Units
(fixed)
! 0.01 0.025 –
"cd 2.3 ! 10"14 2.6 ! 10"13 (s"1)
Tcd 14 17 (K)
M0 0.05 0.05 (M#)
Mcd 0.515 0.585 (M#)
(derived)
Log10(Jcd) 52.3 53.4 (g cm2 s"1)
Log10( jcd) 19.3 20.3 (cm2 s"1)
Rc 11 830 (AU)
Accretion time 0.18 0.15 (Myr)
Fig. 5. Example 1. Evolution of star mass M$ and disk mass Mdisk as afunction of time with masses in solar units (corresponding axis to theleft) for the model parameters of Table 4. The accretion rate onto thecentral star is shown as a dotted line (corresponding axis: first to theright). The evolution of the centrifugal radius Rc (see Eq. (5)) is shownas a dash-dotted line (corresponding axis: far-right). Gray curves andthe hashed region indicate time sequences when selected observationalconstraints are verified (see text).
extended, flared, and its thermal structure is determined solelyby stellar irradiation and a di!use heat source of Tcd.
In Example 1, the disk is always stable to gravitational per-turbations (Q > 1) and the disk mass is never a large fractionof the star mass. This model evolves smoothly with values ofthe initial parameters in good agreement with expected valuesin the Taurus Aurigae region. The question then is: does thismodel satisfy the observational requirements for DM Tau? Andin that case, what other values of the set of parameters represen-tative perhaps of very di!erent initial conditions or turbulencein the disk, would also agree with the observations?
Figure 5 shows thick grey lines superimposed on each plot-ted quantity. Each one shows the range of time for which thatquantity agrees with the available observations. For MDisk, thegrey line represents the period of time when the " surface den-sity satisfies the observational error bars discussed in Sect. 2.This period is easily identified in Fig. 6. The accretion rate is re-produced either within large error bars (thick grey line), or with
Fig. 6. Example 1. Surface density versus orbital distance at di!erenttimes for the model parameters of Table 4. Dotted lines correspond tothe early formation of the disk. The collapse of the molecular cloudends after 0.18 Myr. The dashed line at 10 Myr corresponds to theend of the simulation. The error bars represent the " values at 100 AUand in the outer radius that are used as observational constraints forDM Tau. The gray area shows the ensemble of models fitting thoseconstraints. The dark-shaded region shows the " distribution at thetime-lapse when all observational constraints are satisfied (see text).
Fig. 7. Example 1. Same as Fig. 6, but for the midplane temperatureas a function of orbital distance.
small error bars (thick black line) (see Sect. 2). The uncertaintyover the star age for DM Tau is marked as a light-grey box.Figure 5 hence shows that the model is a good fit to the datafrom 1.5 to 2.8 Myr (surface densities and star age), from 1.5to 2.6 Myr (M with its large error) or from 1.5 to 1.6 Myr (smallerror bars on M). The latter is shown as a dashed region.
This model hence does fulfill the “strict” observational con-straints (set 3) and also the reasonable additions (sets 4and 5). This example shows how DM Tau’s 800 AU diskcan be formed by viscous di!usion of an initially much smallerdisk, with a centrifugal radius Rc = 11 AU.
Let us now examine our second example. Here the disk isassumed to form in 0.15 Myr with a maximum centrifugal ra-dius of 800 AU. Most of the disk material falls so far from thecentral star that the disk gets more massive than the central starat the end of the collapse (Figs. 8 and 9). Yet, the disk di!usesoutwards and gets accreted into the central star. For a certainperiod of time (4"5.4 Myr) it also satisfies all the observationalconstraints we have considered.
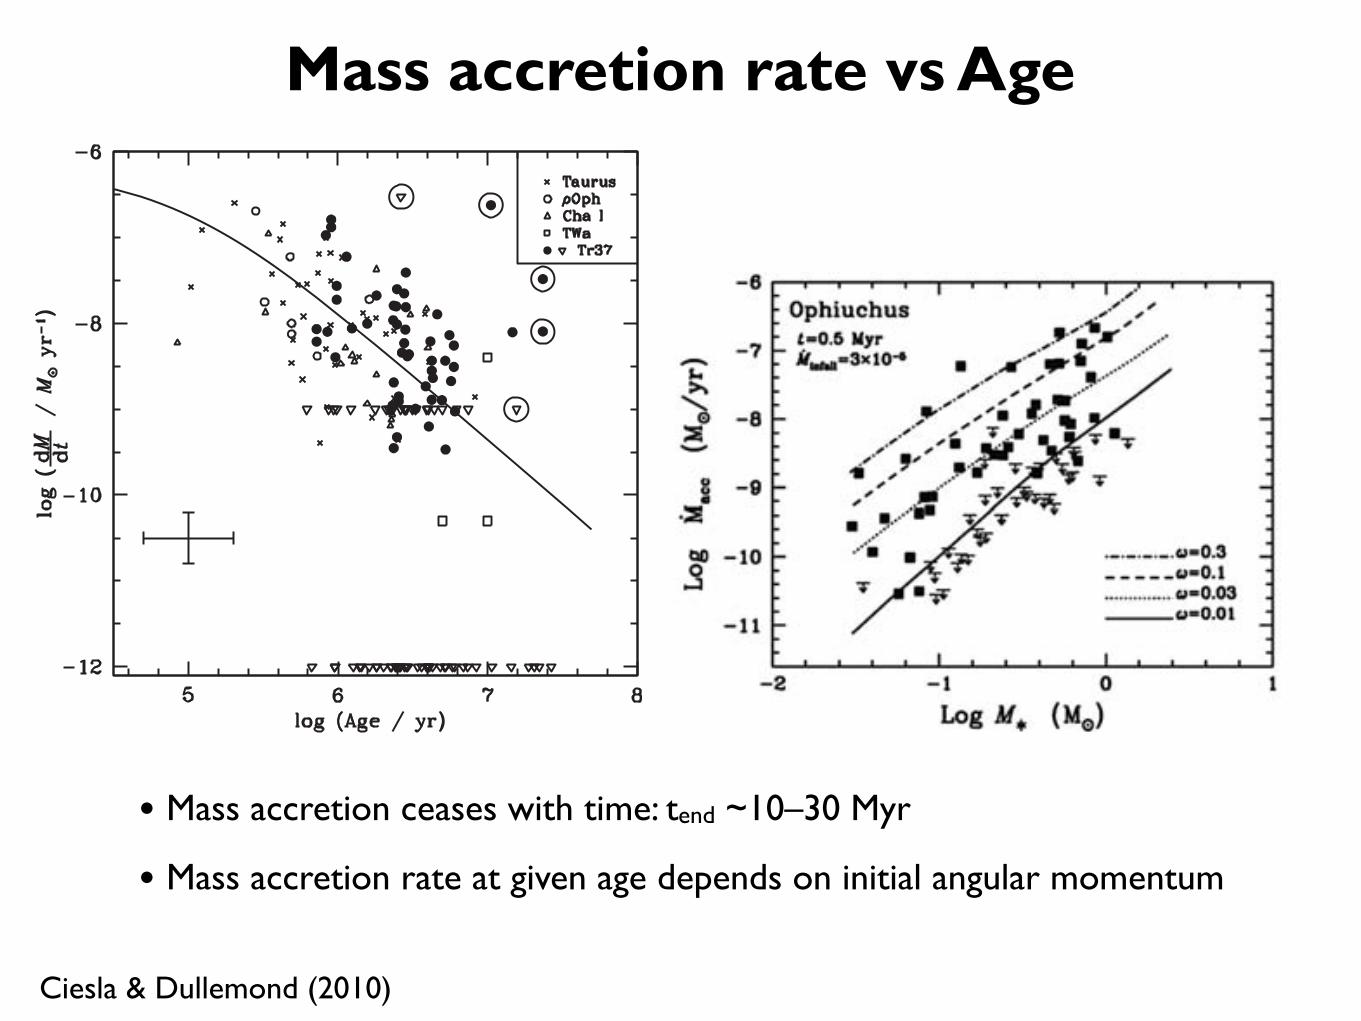
Mass accretion rate vs Age
Ciesla & Dullemond (2010)
Evolution of protoplanetary disk structures 79
Figure 3.3 Left: measured accretion rate as a function of age (Sicilia-Aguilar et al.2006). The line is the prediction of a single Lynden–Bell & Pringle model as afunction of time. Right: measured accretion rates as a function of stellar mass fora cluster of a given age, in this case in Ophiucus. The lines are model predictionsfor a given initial dimensionless rotation rate of the parent molecular cloud corefrom which these stars were formed. From Dullemond et al. (2006b).
much closer to the star, and thereby thermally processed (Dullemond et al. 2006a).It is, however, not clear if the disk can spread appreciably against the ram pres-sure from the infalling matter. This is something that remains to be investigatedand is not treated in simplified models. Whether true or not, one can make pre-dictions for the measured accretion rate as a function of the stellar mass of thestar, which can be compared against observations (Dullemond et al. 2006b). Thisis shown in the right panel of Fig. 3.3. Also here the general trend is reproduced,and while encouraging, the spread is so large that no definitive conclusion canbe drawn.
While the M ! t"3/2 is a relatively fast decline of the accretion rate, it is still notconsistent with the observed fact that very old clusters with ages over 10 Myr hardlyshow any accreting sources, nor sources with infrared excess emission indicating thepresence of disks. Something must destroy the disk faster than the normal viscousaccretion process. It is believed that this is the process of photoevaporation. Theextreme ultraviolet (EUV) radiation of the central star ionizes a very thin layer ofgas at the surface of the disk. This gas has a temperature of about 104 K, meaningthat beyond about 1 AU this hot gas can flow off the disk and away from the systemthrough a Parker-wind-like flow (Hollenbach et al. 1994; Liffman 2003). Since theillumination of the disk by EUV is diluted further out in the disk by scattering, thephotoevaporation process is maximally efficient just at about 1 AU, drilling a holein the disk (Alexander et al. 2006).
• Mass accretion ceases with time: tend ~10–30 Myr
• Mass accretion rate at given age depends on initial angular momentum

Detailed disk models• 1+1/2D passive models (D'Alessio et al. 1998, Dullemond & Dominik 2004):
• Radiation of a central star
• Radiative transfer:
• plane-parallel/2D,
• frequency-averaged (grey),
• frequency-dependent
• Heating & cooling of gas
• Hydrostatic equilibrium
• 3D MHD models (e.g., Flock et al. 2011):
• ~10–100 orbital periods
• Isothermal or simple power-law for T
• Local disk patches
• Realistic turbulence

τross=1
no PAHswith PAHs
τross=1
Kamp et al. 2005; Jonkheid et al. 2004; Nomura & Millar 2005; Woitke et al. 2009
T Tauri
Herbig Ae
Tgas = Tdust
Passive steady-state disk: 2D
with PAHs
Flaring disks, Tgas>Tdust in atmosphere
No. 1, 2004 SPIRAL STRUCTURE IN DISK AROUND AB AUR L55
Fig. 3.—Same as Fig. 1, but the image is deprojected with an assumedinclination of 30! to show the “face-on” view of the AB Aur disk. Some ofthe major features are identified.
significantly affect the derivation of the geometry of the NIRdisk, because the fitting applied to inner and outer regions gaveconsistent results. It should be noted, however, that any intrinsicbrightness distribution asymmetry that makes the northwesternpart darker, as may be the current case caused by an anisotropicscattering phase function, does affect the inclination. The in-clination of 30! should be taken as an upper limit in such acase.The derived inclination agrees well with the recent NIR in-
terferometric measurements for the inner ( AU) diskr ! 0.5(Eisner et al. 2003; Millan-Gabet, Schloerb, & Traub 2001)and with the constraint (less than 45!) obtained by the opticalimaging with the HST/Space Telescope Imaging Spectrograph(STIS; Grady et al. 1999). It is, however, significantly smallerthan 76! estimated from the 13CO observations by Mannings& Sargent (1997). The position angle of the major axis is alsodifferent from that of the millimeter measurement (P.A. p 79!)by 20!. Lower spatial resolutions of millimeter observationsmay have caused such discrepancies, and higher resolution im-agings of the thermal emission are necessary for obtainingmoreprecise constraints on the disk geometry. On the other hand,the STIS optical image (Grady et al. 1999) lacks a distinguish-able axis, not showing any clear ellipticity. Because the imageshows a nebulosity much more extended and more circularlydistributed than the NIR image, the optical flux may be dom-inated by scattering from the region with a large-scale heightespecially at large radii. The STIS wedge occults the regionexactly along the derived major axis, which also makes it dif-ficult to identify a distinguishable axis in the image.
3.2. The Spiral Structure
TheH-band image in Figure 1 shows a remarkable spiral patternat AU. The spiral pattern coincides with the spiralr p 200–450band structure seen in the optical image takenwith theHST (Gradyet al. 1999). The new image has, however, revealed the entirespiral pattern located in the inner part (200 AU 300 AU).! r !In addition, it clearly shows the spirals with a high contrastbecause the scattered light from the surrounding envelope isnegligible; the spiral pattern is associated with the circumstellardisk but not with the envelope. This is indeed the first case inwhich a spiral pattern, not a ring or a circular gap, has beendetected in the NIR around a young star, although it was de-tected in the optical image of HD 100546 (Grady et al. 2001)as well as AB Aur.The southeastern part is brighter, which suggests that this
part is the near side of the disk if we assume that forwardscattering is dominated as is the case of Mie scattering. Theobserved winding direction of the spiral pattern projected onthe disk is S-wise, not Z-wise. These results, combined withthe velocity field of the disk in which the northeastern part isblueshifted and the southwestern part is redshifted (Mannings& Sargent 1997), mean that the arms are trailing.Figure 3 shows a deprojected image of Figure 1 with some
of the features identified. We can see inner and outer spiralarms especially at the eastern half of the disk where the pres-ence of a dark lane makes the double-arm structure evident.The inner arm located at AU running from the east tor ! 230northeast is the brightest. The outer arm running from the southto northeast is traced at AU with a branch and a knottyr ! 330structure. On the western side of the disk, a fainter arm is seenat AU, and another outer arm at AU in ther ! 260 r ! 440southwest is largely open to the south.
4. DISCUSSION
What is the mechanism to excite and maintain the spiralstructure in the disk of AB Aur, a single star with the age of4 Myr? Theoretical calculations show that a forming planet lo-cated in a disk opens a gap (Takeuchi, Miyama, & Lin 1996)that is often associated with a spiral structure extending inwardand outward into the disk from the planet (e.g., Bate et al. 2003).If the dark lane at AU is a gap where an unseen com-r ! 300panion is located, its mass must be less than 10MJ, which isestimated from the evolutionary tracks given by Burrows et al.(1997) and Allard et al. (2001) in order to be consistent withthe detection limit of mag in the interarm region. TheH ! 16.5main structure that we may observe in a disk, however, wouldbe a circular gap but not a spiral structure such as the one revealedin this study if there is an unseen companion, because matter iscleared away in the gap while the spiral pattern is merely thedensity fluctuation of matter. It is therefore not probable that thespiral structure is produced by an unseen companion.On the other hand, the gravitational instability may excite
the spiral structure without any gap in a disk. According totheoretical studies (e.g., Nelson et al. 1998), spiral structure isproduced and sustained if a circumstellar disk has the minimumQ-value of 1.5 2.0, where is Toomre’s! Q ! Q p c Q/(pGS)S
Q parameter with , Q, and S being the sound speed, angularcSvelocity, and surface density, respectively. Because Q is min-imized at the outer edge of a disk for the standard model(D’Alessio et al. 1998), we evaluate Q at the outermost armradius AU in order to see if the gravitational instabilityr p 450occurs. Taking the disk mass of 0.02 (Mannings & SargentM,
1997; Henning et al. 1998) and the radial dependence of surfacedensity as , as observed for several T Tauri disks!0.5S " r(Kitamura et al. 2002), with km s!1 ( K;c p 0.23 T p 15S
Miroshnichenko et al. 1999) and the assumed Kepler rotation,we obtain at AU. If we take a larger diskQ ! 17 r p 450mass of 0.15 , as derived if we use the opacity in PollackM,
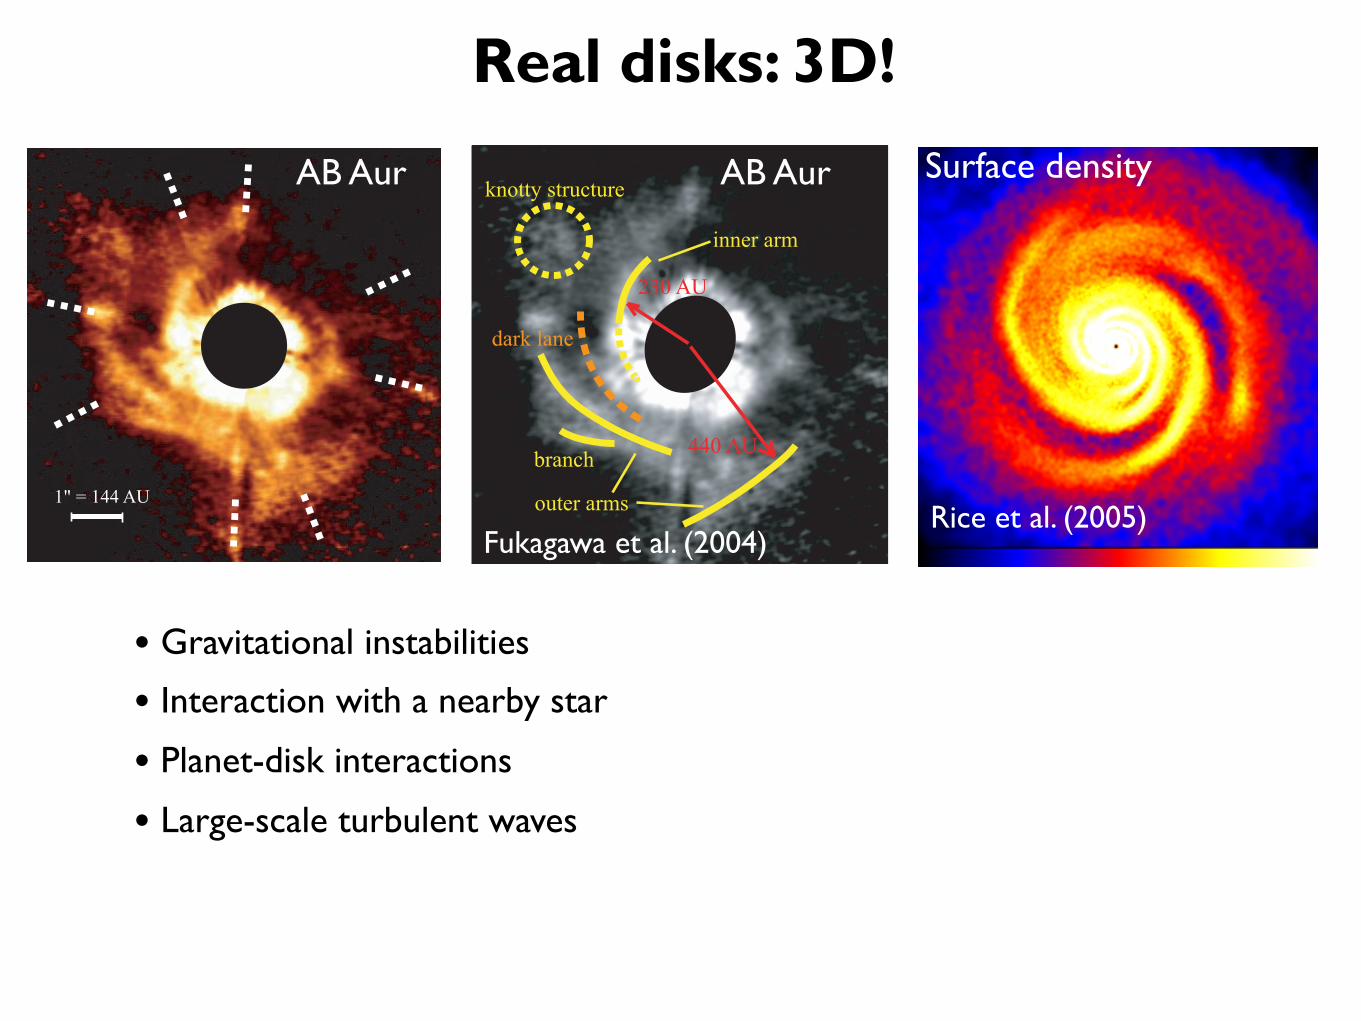
Fukagawa et al. (2004)
Real disks: 3D!L54 FUKAGAWA ET AL. Vol. 605
Fig. 1.—H-band image of the circumstellar structure around AB Aur aftera reference PSF was subtracted. The surface brightness is multiplied by thedistance squared from the center for display so that the fainter outskirts canbe viewed with a high contrast. Boxcar smoothing is applied with pixels.5# 5Directions of the spider patterns are indicated by dashed lines. The inner areaof 1!.7 diameter ( AU; filled circle) is photometrically unusable and isr ! 120masked. The field of view is . North is up, and east is to the left.!! !!8 # 8
Fig. 2.—Azimuthally averaged radial profile of the surface brightness ( filledcircles) after the assumed inclination of was corrected. Error barsi p 30!show the dispersion of brightness over the azimuth of 360! and radial widthof 10 AU (0!.07). The dashed line indicates a power-law fit with an index of!3.0 to the brightness over the radial range between 120 and 580 AU.
vations. The signal-to-noise ratio of the reference star PSF wasgreater than 3 at , as was similar to that of the AB Aur!!r ! 6data. FS 111 was observed immediately before AB Aur andwas used as a photometric calibrator (Hawarden et al. 2001).The sky was clear, and the natural seeing size was 0!.5. Thespatial resolution achieved with the AO system (Takami et al.2004) was 0!.10 (FWHM), which was measured with the Lyotstop in the optical path toward an unmasked star in the framesof SAO 57754.At the second observing run on January 11, the seeing size
and eventually the resolution with AO were a little worse andvariable, although the sky was clear. Hence we used 62 framesthat had resolutions similar to those obtained in the first run.The total exposure time was 6.2 minutes for the 62 frames,each taken by co-adding six exposures of 1 s. SAO 57393 wasobserved immediately before and after AB Aur as a PSF ref-erence, with the total exposure time of 9.0 minutes.The obtained frames were calibrated in the standard manner
using IRAF: dark subtraction, flat-fielding with sky-flats, bad-pixel substitution, and sky subtraction. A reference star PSF wasmade by combining frames for either SAO 57754 or SAO 57393depending on the observing date. We subtracted the referencestar PSF from the image of AB Aur in order to detect faintstructure buried in its halo. After shifting, rotating, and scalingthe PSF so that its peak position, spider pattern, and halo bright-ness match those of each object frame, we made PSF-subtractedframes and combined them to produce the final image (see Itohet al. 2002). We applied this subtraction method separately tothe data obtained on January 8 and 11, confirming that the imagestaken on both nights were consistent with each other even if thereference stars and seeing conditions were different.
3. RESULTS
3.1. Scattered Light from the Disk
Figure 1 is the resultant H-band image after the PSF subtrac-tion. We detected an extended emission seen from the edge ofthe occulting mask ( AU) out to the radius of 580 AUr " 60(p 4!.0), where the brightness drops to the detection limit of0.3 mJy arcsec!2. Figure 2 shows an azimuthally averagedradial brightness profile of the image deprojected with the as-sumed inclination of 30! and major-axis position angle of 58!(see below), showing that the surface brightness decreases as
with the radius r from 120 to 580 AU. The power-law!3.0"0.1rdependence revealed in this study is steeper than that of !2rfor the optical nebulosity (Grady et al. 1999). The steeper slopein the NIR suggests that the detected light originates mainlyfrom the disk itself without being significantly contaminatedby the scattering emission in the envelope, which shows ashallower slope (Grady et al. 1999). This is also justified bythe fact that the NIR scattering emission has a size similar tothat of the 13CO disk (Mannings & Sargent 1997).We integrated the scattered light over the radial range of
120 AU 580 AU and calculated the ratio of the scattered# r #to total fluxes as , adopting the!2F /F p (1.2" 0.2)# 10disk totaltotal flux mag of AB Aur (Hillenbrand 1992). TheH p 5.1H-band flux ratio is comparable to those of mea-!2(2–4)# 10sured over similar, or even inner, radial ranges of optically thickdisks around other young stars with similar ages (HD 100546,Augereau et al. 2001; TW Hya, Weinberger et al. 2002; GMAur, Schneider et al. 2003). The large scattered light flux isqualitatively accounted for if the disk around AB Aur is flaredto receive sufficient light from the central star and a large amountof dust particles contributing to the scattering at 1.6 mm arepresent at the disk surface (e.g., Whitney & Hartmann 1992).This is consistent with a flared disk geometry suggested bymodel fitting to the mid- and far-infrared spectral energy dis-tribution (SED) of AB Aur (Dominik et al. 2003).Assuming that the emission comes from a tilted disk with a
circularly symmetric brightness distribution and applying anellipse isophoto fitting at the radii between and 1!.8,r p 1!.4we derived the inclination and position angle of the major axisas and P.A. p , respectively. The pres-i p 30! " 5! 58! " 5!ence of spiral arms (see § 3.2) in this radial range does not
AB Aur AB Aur 3D MHD
Schneider et al. (1999, 2009)
HR 4796• Gravitational instabilities
• Interaction with a nearby star
• Planet-disk interactions
• Large-scale turbulent waves
Rice et al. (2005)
Surface density

Photoevaporation of disks
Gorti et al. (2009)
• UV/X-ray radiation from the star: 1–10 AU
• Superheated atmosphere gas flows away
• T Tauri star: Mevap ~10-9–10-8 MSun/year
• Clearing of inner regions
Hubble WFPC 2

II. Structure and evolution of PPDs: Summary
• Outcome of cloud collapse: ~ 0.1–0.5 Myr
• Anomalous viscosity (turbulence)
• Macc ceases with time
• Macc depends on initial angular momentum
• "Early" disks: accretion heating
• "Late" disks: passively reprocess L*
• 3D structure
• Σ(r, t) can depart from a power law
• Photoevaporation
III. Dust evolution in PPDs

Dust evolution in disks: ~1–10 Myr
Williams & Cieza (2011)
60 Williams & Cieza
Figure 6: The evolution of a typical disk. The gas distribution is shown in blueand the dust in brown. (a) Early in its evolution, the disk loses mass throughaccretion onto the star and FUV photoevaporation of the outer disk. (b) At thesame time, grains grow into larger bodies that settle to the mid-plane of the disk.(c) As the disk mass and accretion rate decrease, EUV-induced photoevaporationbecomes important, the outer disk is no longer able to resupply the inner disk withmaterial, and the inner disk drains on a viscous timescale (! 105 yr). An innerhole is formed, accretion onto the star ceases, and the disk quickly dissipates fromthe inside out. (d) Once the remaining gas photoevaporates, the small grains areremoved by radiation pressure and Poynting-Robertson drag. Only large grains,planetesimals, and/or planets are left This debris disk is very low mass and isnot always detectable.
Mdisk ~ 1% of Mstar
Mdisk ~ a few MEarth
ISM dust Pebbles
Rocks
Protoplanets
(pre-transitional)
(transitional)

• <10 cm/s collisions due to Brownian motion
• Sticking
• >1μm–1cm grains sediment
• Rain drops-like growth regime
• Fragmentation (V>10–100m/s)
• Erosion
• Turbulence returns small grains upward
• Inward drift
• Mostly proved by experiments
Dust evolution in a nutshell
Weidenschilling et al. (1993), Blum (2010)
!"#$ %&'($) *+ ,&'$'-./+0$/&1 !*#2# 3456
!"#$ % 78/9-.0# ': ./;'&/$'&1 <'..*#*'+ 08-0&*90+$# ;0$(00+ !"::1 SiO2 /==&0=/$0#> ()*<) &0?#".$0@ *+ #$*<2*+= A!"#B> ;'"+<*+= A$%&&'(B> /+@ :&/=90+$/$*'+ A)"!!"$BC D)0 <'..*#*'+ E0.'<*$*0#(0&0 5C55F m s!1 A*!%+,%-.B> 5C3G m s!1 A)"/-+%-.B> /+@ 6C3m s!1 A012.$(-!2!%"-B> &0#-0<$*E0.1CH.. 08-0&*90+$# (0&0 -0&:'&90@ "+@0& 9*<&'=&/E*$1 <'+@*$*'+#C I'& <./&*$1> $)0 <'..*@*+= @"#$ /=?=&0=/$0# *+ $)0 #$*<2*+= /+@ ;'"+<*+= </#0 /&0 9/&20@ ;1 /+ xC D)0 $*90 *+$0&E/. ;0$(00+ $)0 "&#$"E0 *9/=0# *+ $)0 #$*<2*+= </#0 *# 6F 9#> $)0 ./#$ $)&00 *9/=0# )/E0 $*90 *+$0&E/.# ': J65 9# ;0$(00+$)09 $' -&'E0 $)0 @"&/;*.*$1 ': $)0 /@)0#*'+K $)0 $*90 *+$0&E/. ;0$(00+ $)0 *9/=0# *+ $)0 ;'"+<*+=</#0 *# 3F 9#K $)0 $*90 *+$0&E/. ;0$(00+ $)0 "&#$ $(' *9/=0# /+@ $)0 ./#$ $(' *9/=0# *+ $)0 </#0 '::&/=90+$/$*'+ *# 3 9#> &0#-0<$*E0.1C
% & '() *+,-.&//0(/&-( 12334,42' 52*(3
D' ;0 /;.0 $' -&0@*<$ $)0 $09-'&/. 0E'."$*'+ ': -&'$'-./+0$/&1 @"#$ /==&0=/$0#> / -)1#*</. 9'@0.
': $)0 <'..*#*'+ ;0)/E*'& ': /&;*$&/&1 @"#$1 ;'@*0# *# 9/+@/$'&1C H# (0 )/E0 #00+ /;'E0> / :".. "E0?
@*90+#*'+/. $&0/$90+$ ': $)0 -/&/90$0& #-/<0 A9/##> 9/## &/$*'> $(' -'&'#*$*0# /+@ <'..*#*'+ E0.'<*$1
': $)0 @"#$ /==&0=/$0#B *#> )'(0E0&> +'$ 10$ -'##*;.0 ;0</"#0 $)0 <'E0&/=0 ': $)0 9/## &/$*' /+@
0+./&=090+$ -/&/90$0& *# :/& :&'9 ;0*+= <'9-.0$0C D)"#> (0 @0<*@0@ $' $&0/$ $)0#0 $(' -/&/90$0&#
*+ / ;*+/&1 (/1 *+ '"& 9'@0. A%L"$$.0& 0$ /.C 4535BC M0 @0#<&*;0 @"#$ /==&0=/$0# 0*$)0& /# N-'&'"#O A-B
'& /# N<'9-/<$O A<BC M*$)'"$ ;0$$0& 2+'(.0@=0> (0 #0$ $)0 $)&0#)'.@ ;0$(00+ $)0 $(' &0=*90# /$ /+
0+./&=090+$ -/&/90$0& ': ! = 2.5 A/ -'&'#*$1 ': G5PB> *C0C /.. /==&0=/$0# (*$) ! > 2.5 /&0 N-'&'"#O
/+@ $)'#0 (*$) ! < 2.5 /&0 <'+#*@0&0@ N<'9-/<$CO Q+ / #*9*./& (/1> $)0 9/## &/$*' ': $)0 <'..*@*+=
/==&0=/$0 -/*& *# -/&/90$0&*R0@S :'& 9/## &/$*'# ;0$(00+ $)0 9'&0 /+@ .0## 9/##*E0 @"#$ /==&0=/$0
r < 100> (0 <'+#*@0& ;'$) /==&0=/$0# $' ;0 ': 0T"/. #*R0K :'& r > 100> (0 $&0/$ $)0 <'..*#*'+ /#
/+ *9-/<$ ': / -&'U0<$*.0 '+$' /+ *+"+*$0.1 ./&=0 $/&=0$ /==&0=/$0C V+@0& $)0 /##"9-$*'+ ': #*9*./&
-'&'#*$1 ': $)0 $(' <'..*@*+= @"#$ /==&0=/$0#> $)0 $)&0#)'.@ 9/## &/$*' ': r = 100 <'&&0#-'+@#
$' / #*R0 &/$*' ': FCGC M*$) $)*# #*9-.*"</$*'+> $)0 :'..'(*+= 0*=)$ <'..*#*'+ $1-0# /&0 -'##*;.0 /+@
/&0 *+@0-0+@0+$.1 $&0/$0@ *+ '"& <'..*#*'+ 9'@0.S N-->O N-,>O N-<>O N-W>O N<->O N<,>O N<<>O /+@ N<WCO
X0&0> $(' #9/.. .0$$0&# <)/&/<$0&*R0 / <'..*#*'+ (*$) r < 100> ()0&0/# / <'9;*+/$*'+ ': / #9/.. /+@
/ </-*$/. .0$$0& @0-*<$# / -&'U0<$*.0?$/&=0$ <'..*#*'+C ,.0/#0 200- *+ 9*+@ $)/$ $)0 N-<O <'9;*+/$*'+
@*::0&# :&'9 N<-O *+ #"<) / (/1 $)/$ *+ N-<O $)0 A#.*=)$.1B .0##?9/##*E0 ': $)0 $(' <'..*@*+= /==&0=/$0#
*# -'&'"#> ()0&0/# *+ $)0 N<-O </#0 *$ *# <'9-/<$C
Sticking
Fragmentation
Bouncing

How to pass a 1m-barrier?
Evolution of protoplanetary disk structures 83
cause them to lose energy and angular momentum to the gas, causing the parti-cles to drift inwards with time. Smaller particles, whose stopping times are muchless than an orbital period, instead orbit at approximately the same velocity asthe gas. Because they do not feel the pressure gradient that the gas does, thisresults in an imbalance between their centrifugal force and the central force ofgravity from the star. These solids also drift inwards as a result. It should benoted that if the pressure gradient locally switches sign, as a result of a clumpforming in a marginally unstable disk, the gas in part of that region may orbitmore rapidly than Keplerian, producing a tailwind on the dust particles andcausing them to migrate outwards for a period of time (Haghighipour & Boss2003). Again, this would only be a local effect, and would likely be accom-panied by increases in the magnitude of the negative pressure gradient on theopposite side of the clump, which would result in more rapid inward drift ofsolids.
Figure 3.5 shows the radial drift velocities for spherical particles of differentsizes for a region of the disk in which the differential velocity between the gasand the solids is 70 m s!1. The dependence of the drift velocity on particle sizeis due to the drag force being proportional to the effective cross-section ("a2) ofthe particle, while the motions in response depend on the mass ("a3). Typically, itis the bodies with sizes between tens of centimeters to approximately a meter thatexperience the largest inward drift velocities (see Weidenschilling 1977a; Cuzzi &Weidenschilling 2006; and Chapter 10).
Figure 3.5 Plotted are the inward drift velocities of particles of different sizesin a disk where the velocity differential between the gas and a Keplerian orbit is70 m s!1. The kink at "10 cm is due to the change in the gas-drag law as theparticles exceed the mean free path of the gas.
Inward driftvelocities
Ciesla & Dullemond (2010)
• Big grains ⇒ 100% Keplerian rotation
• Radial pressure gradient ⇒ gas orbits at
99% Keplerian velocity
• Head wind: inward drift
• 1m particle: ~104 years from 100 AU
• Vertical settling: ~1 Myr @ 1 AU for 1μm
• Vertical stirring: ~104 years @ 100 AU
• Coagulation: ~0.1–2 Myr Possible mechanisms:• Gravitational instabilities• Aerodynamic collection of eroded debris• Restructuring of fluffy aggregates• Rapid grain growth in pressure bumps

A plausible growth mechanism >1m
Brauer et al. (2008), Johansen et al. (2011)
• Corotating patch in midplane
•Weak MHD turbulence
• Density fluctuations
• ~1m-sized "bricks" concentrate in pressure bumps
• Self-gravitation bounds clumps >10 orbital periods
• Local gravitational instabilities
• Mass concentrations ~10-4 MEarth

III. Dust evolution in PPDs: Summary
• Dust growth ~0.1–2 Myr
• Coagulation, sedimentation, fragmentation, stirring, inward drift
• Inward drift: ~103–104 years for 1m-particles @ 100 AU
• 1m-barrier for growth
• Self-gravitation & growth in pressure maxima

IV. Dust in protoplanetary disks and the early Solar nebula
Guilloteau et al.: Dual frequency mm imaging of proto-planetary disks
Fig. 1. High angular resolution image of the continuum emission from the sources observed in the survey at 1.3 mm (230 GHz).The contours are relative to the peak intensity, in steps of 10 %. Coordinates are o!sets in arcseconds from the reference positionsgiven in Table 24
Observational techniques
• IR features
• Spectral Energy Distribution (SED)
• Emission at mm–cm wavelengths
• Resolved IR-mm images
• Surveys of PPDs of various ages
• Composition of meteorites
• Composition of cometary/IDP grains
• Isotopic dating
• Condensation sequence
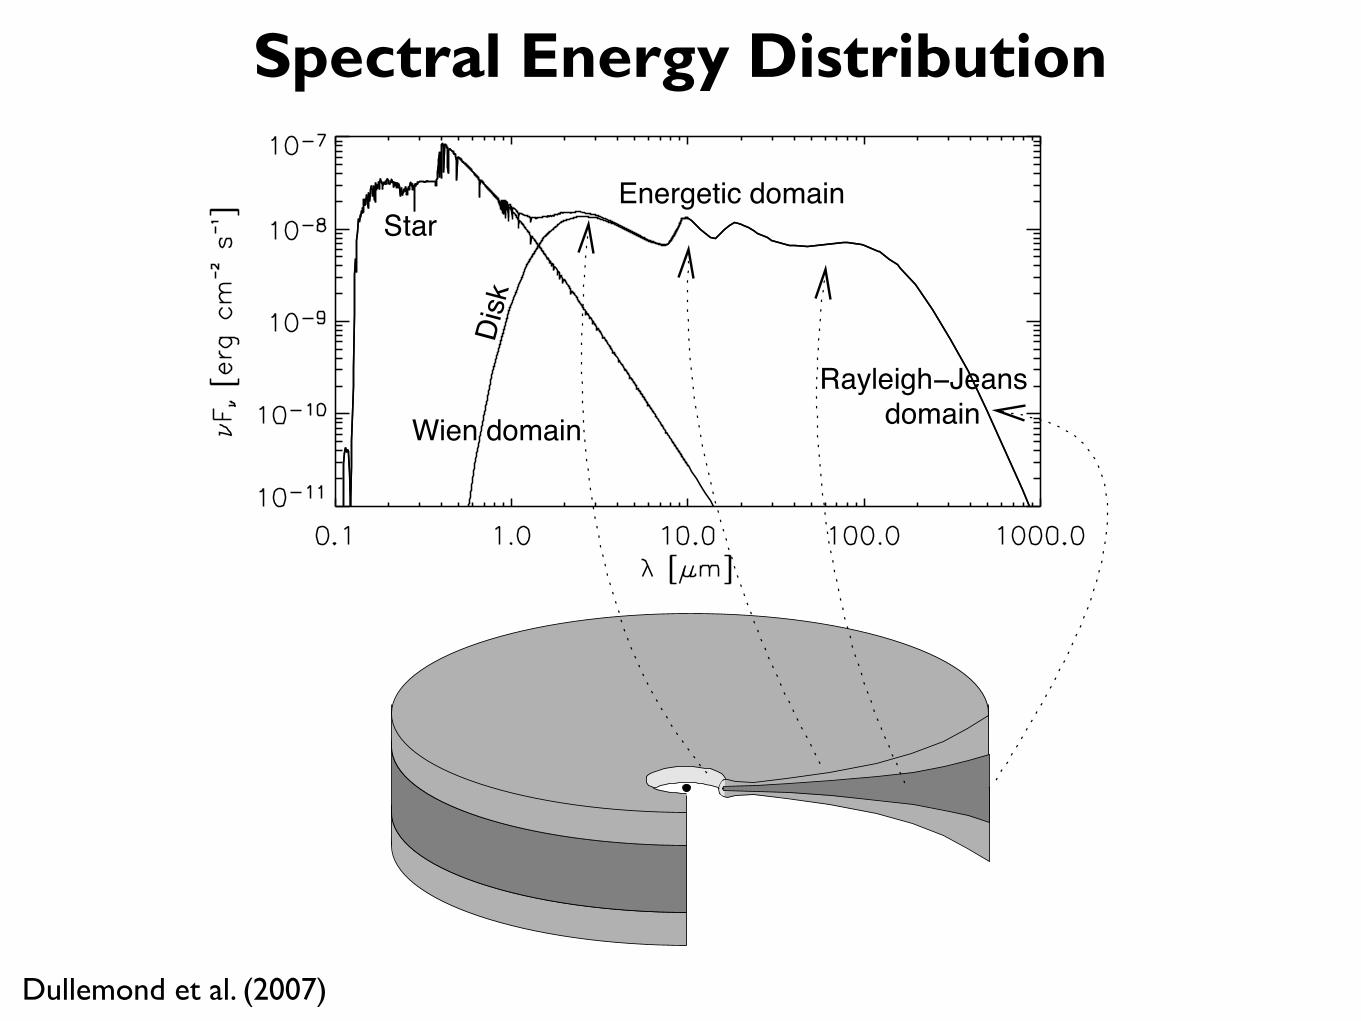
Spectral Energy Distribution
domain
Disk
StarEnergetic domain
Rayleigh−JeansWien domain
Fig. 2.— Build-up of the SED of a flaring protoplanetarydisk and the origin of various components: the near-infraredbump comes from the inner rim, the infrared dust featuresfrom the warm surface layer, and the underlying continuumfrom the deeper (cooler) disk regions. Typically the near-and mid-infrared emission comes from small radii, whilethe far-infrared comes from the outer disk regions. The(sub-)millimeter emission mostly comes from the midplaneof the outer disk. Scattering is not included here.
Fig. 2). Themain portion of the energy is emitted in a wave-length range depending on the minimum and maximumtemperature of the dust in the disk. We call this the “ener-getic domain” of the SED, which typically ranges from 1.5µm to about 100 µm. At shorter wavelength the SED turnsover into the “Wien domain”. At longer wavelengths theSED turns over into the ”Rayleigh-Jeans domain”, a steep,nearly powerlaw profile with a slope depending on grainproperties and disk optical depth (see chapter by Natta etal.). Differences in disk geometry are mainly reflected inthe energetic domain of the SED, while the submm and mmfluxes probe the disk mass.
3.2. A first confrontation with observationsIt is quite challenging to solve the entire disk structure ac-cording to the above principles. Early disk models weretherefore often based on strong simplifications. An exam-ple of such a model is a perfectly flat disk being irradiatedby the star due to the star’s non-negligible size (Adams andShu, 1986; Friedjung, 1985). The stellar radiation impingesonto the flat disk under an irradiation angle ! ! 0.4r!/r(with r! the stellar radius). Neglecting viscous dissipation,the effective temperature of the disk is set by a balance be-tween the irradiated flux (1/2)!L!/4"r2 (with L! the stel-lar luminosity) and blackbody cooling #T 4
e! , which yieldsTe! " r"3/4. The energetic domain of its SED thereforehas a slope of $F! " $s with s = 4/3 = 1.33, which
follows from the fact that any disk with Te! " r"q hasan SED slope of s = (4q # 2)/q. This steep slope arisesbecause most of the stellar radiation is absorbed and re-emitted at small radii where the disk is hot. This producesstrong emission at short wavelength. The long wavelengthflux is weak because only little stellar radiation is absorbedat large radii. Observations of CTTSs, however, show SEDslopes typically in the range s = 0.6 to 1 (Kenyon and Hart-mann, 1995), i.e. much less steep. The SEDs of HerbigAe/Be stars show a similar picture, but with a somewhatlarger spread in s, though it must be kept in mind that thedetermination of the slope of a bumpy SED like in Fig. 2 issomewhat subjective. Meeus et al. (2001, henceforth M01)divide the SEDs of Herbig Ae/Be stars into two groups:those with strong far-infrared flux (called ‘group I’, hav-ing slope s ! #1 ... 0.2) and those with weak far-infraredflux (called ‘group II’, having slope s ! 0.2 ... 1). Allbut the most extreme group II sources have a slope that isclearly inconsistent with that of a flat disk. Note, at thispoint, that the Meeus ‘group I’ and ‘group II’ are unrelatedto the Lada ‘class I’ and ‘class II’ classification (bothMeeusgroup I and II are members of Lada class II).A number of authors have employed another model to in-
terpret their observations of protoplanetary disks: that of asteady accretion disk heated by viscous dissipation (Rucin-ski et al., 1985; Bertout et al., 1988; Hillenbrand et al.,1992). These models are based on the model by Shakuraand Sunyaev (1973). A detailed vertical structure model ofsuch a disk was presented by Bell et al. (1997). The lumi-nosity of such disks, including the magnetospheric accre-tion column, is Laccr = GM!M/r!. For r $ rin theeffective temperature of such disks is given by #T 4
e! =3M!2
K/8" (with # the Stefan-Boltzmann constant), yield-ing an SED slope of s = 4/3, like for passive flat disks(Lynden-Bell, 1969; see solid lines of Fig. 6). Thereforethese models are not very succesful either, except for mod-eling very active disks like FU Orionis (FUor) outbursts(see Bell and Lin, 1994).
3.3. Flaring disk geometryIt was recognized by Kenyon and Hartmann (1987) that anatural explanation for the strong far-infrared flux (i.e. shal-low SED slope) of most sources is a flaring (“bowl-shaped”)geometry of the disk’s surface, as depicted in Fig. 2. Theflaring geometry allows the disk to capture a significant por-tion of the stellar radiation at large radii where the disk iscool, thereby boosting the mid- to far-infrared emission.The flaring geometry adds an extra term to the irradiation
angle: ! ! 0.4 r!/r + rd(Hs/r)/dr (Chiang and Goldre-ich, 1997, henceforth CG97), whereHs is the height abovethe midplane where the disk becomes optically thick to theimpinging stellar radiation. In the same way as for the flatdisks the thermal balance determines the Te! of the disk, butthis now depends strongly on the shape of the disk: Hs(r).The pressure scale heightHp, on the other hand, depends onthe midplane temperature Tc byHp =
!
kTcr3/µmpGM!
4
Dullemond et al. (2007)
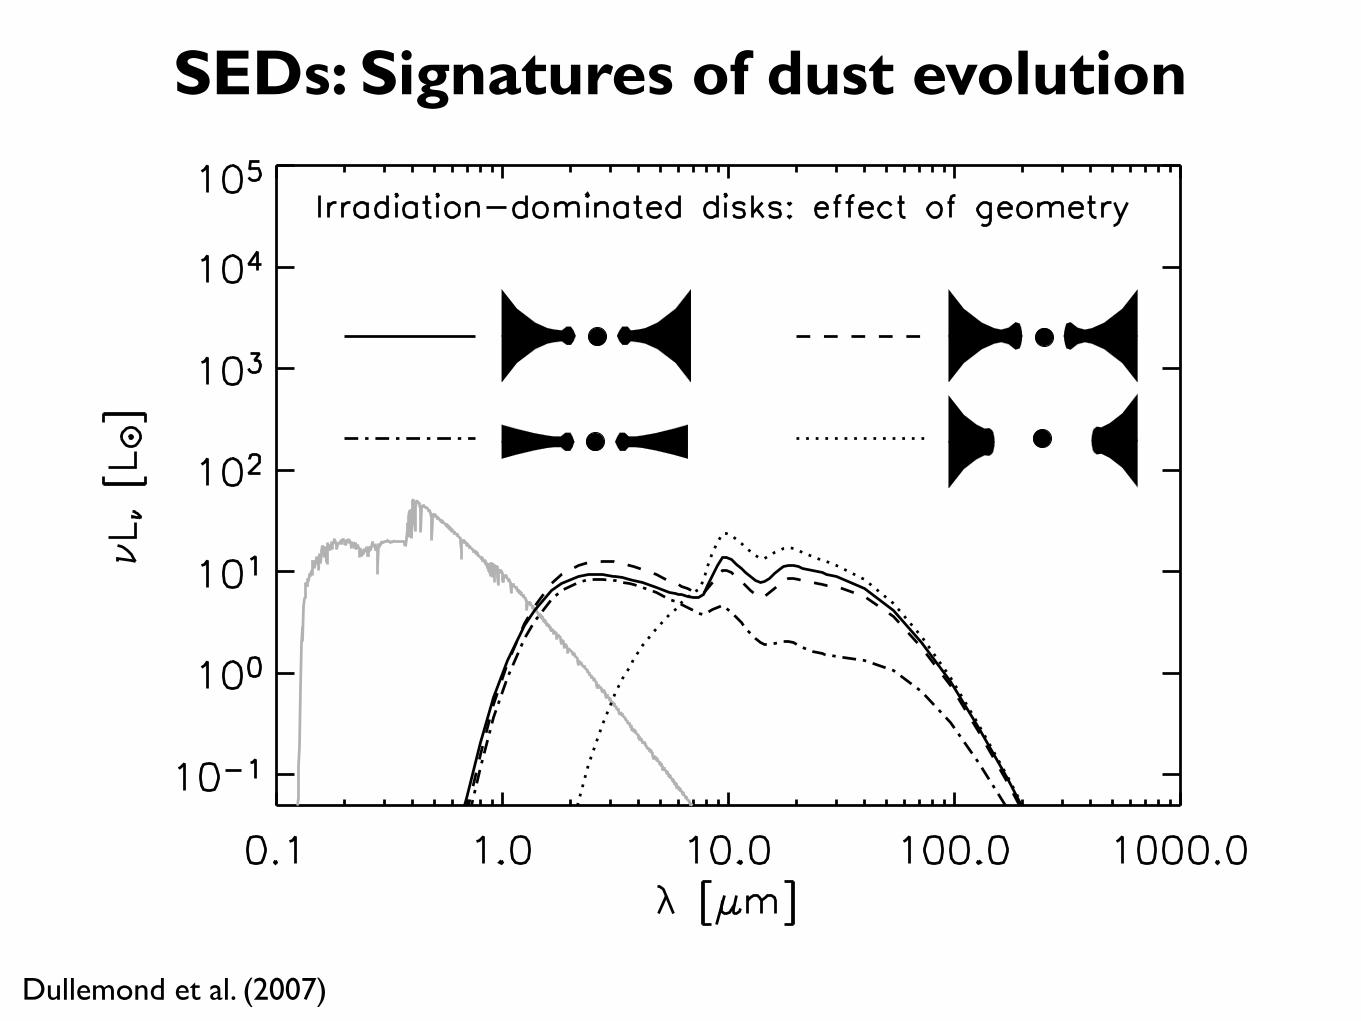
SEDs: Signatures of dust evolution
Dullemond et al. (2007)
Fig. 5.— Overall SED shape for non-accreting disks withstellar irradiation, computed using the 2-D radiative trans-fer tools from Dullemond & Dominik (2004a). The stellarspectrum is added in grey-scale. Scattered light is not in-cluded in these SEDs. Solid line is normal flaring disk withinner dust rim; dashed line is when the rim is made higher;dot-dashed line is when the flaring is reduced (or when thedisk becomes ‘self-shadowed’); dotted line is when the in-ner rim is at 10! larger radius.
star is ignored. In reality, both the accretional heating andthe irradiation by the central star must be included in themodels simultaneously.
3.7. 2-D radiative transfer in disk modelsThe models described so far are all based on an approxi-mate 1+1D (or two-layer) irradiation-angle description. Inreality the structure of these disks is 2-D, if axisymmetrycan be assumed, and 3-D if it cannot. Over the last 10 yearsmany multi-dimensional dust continuum radiative transferprograms and algorithms were developed for this purpose(e.g., Whitney et al., 1992; Lucy et al., 1999; Wolf et al.,1999; Bjorkman and Wood, 2001; Nicolinni et al., 2003;Steinacker et al., 2003). Most applications of these codesassume a given density distribution and compute spectraand images. There is a vast literature on such applicationswhich we will not review here (see chapter by Watson etal.). But there is a trend to include the self-consistent ver-tical density structure into the models by iterating betweenradiative transfer and the vertical pressure balance equation(Nomura, 2002; Dullemond, 2002, henceforth D02; Dulle-mond and Dominik, 2004a, henceforth DD04a; Walker etal., 2004). The main improvements of 2-D/3-Dmodels over1+1D models is their ability to account for radial radiativeenergy diffusion in the disk, for cooling of the outer disk inradial direction, for the complex 3-D structure of the dustinner rim, and in general for more realistic model images.In addition to this, 2-D/3-D models allow for a ‘new’
class of disk geometries to be investigated. The 1+1D mod-els can, because of their reliance on an irradiation angle!, only model disk geometries that are either flat or flared.
Fig. 6.— Overall SED shape for accreting disks with-out stellar irradiation for two accretion rates. A sim-ple Shakura-Sunyaev model is used here with grey opac-ities. Solid line: pure Shakura-Sunyaev model (star notincluded); dotted line: model with disk-self-irradiation in-cluded; dashed line: model with disk-self-irradiation andirradiation by the magnetospheric accretion column on thestar included.
In principle, however, there might be circumstances underwhich, roughly speaking, the surface of the outer disk re-gions lies within the shadow of the inner disk regions (al-though the concept of ‘shadow’ must be used with carehere). These shadowed regions are cooler than they wouldbe if the disk was flaring, but the 2-D/3-D nature of radia-tive transfer prevents them from becoming entirely cold andflat. For Herbig Ae/Be stars the origin of the shadow mightbe the puffed-up inner rim (D02, DD04a), while for T Tauristars it might be the entire inner flaring disk region out tosome radius (DD04b).Although the concept of ‘self-shadowing’ is still un-
der debate, it might be linked to various observable fea-tures of protoplanetary disks. For instance, DD04a showedthat self-shadowed disks produce SEDs consistent withMeeus group II sources, while flaring disks generally pro-duce group I type SEDs, unless the disk outer radius isvery small. It might also underly the observed correla-tion between SED shape and sub-millimeter slope (Acke etal. 2004). Moreover, self-shadowed disks, when spatiallyresolved in scattered light, would be much dimmer than flar-ing disks.
4. GAS TEMPERATURE AND LINE SPECTRA
Although the dust in disks is generally more easily ob-served, there is an obvious interest in direct observationsof the gas. It dominates the mass, sets the structure and im-pacts dust dynamics and settling in these disks. Moreover, itis important to estimate how long disks remain gas-rich, andwhether this is consistent with the formation time scale ofgas giant planets (Hubickyj et al., 2004). Unfortunately, gaslines such as CO rotational, H2 rotational and atomic fine
7
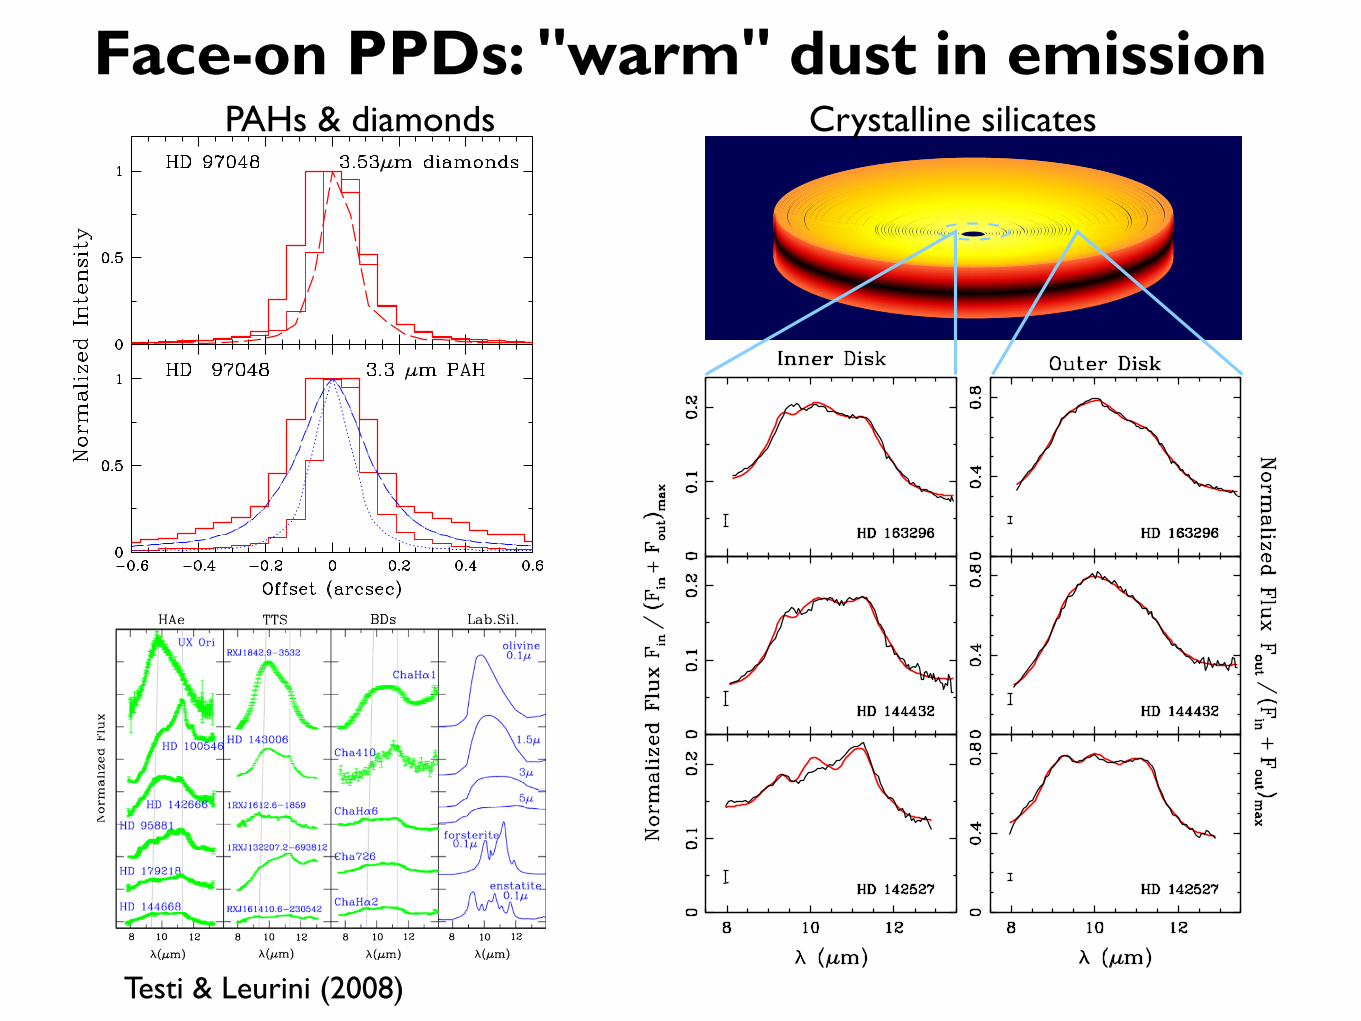
Face-on PPDs: "warm" dust in emission
Testi & Leurini (2008)
with atmosphere is the natural explanation for the emission ob-served in this feature in a large variety of circumstellar disks(Chiang and Goldreich, 1997). In recent years with high qualitymid-infrared spectra becoming available first with ISO and morerecently with Spitzer, it has been possible to attempt to understandthe diversity of the profiles observed in various regions.
As reviewed in Natta et al. (2007), the modeling of silicate pro-files in disks as well as comparison with laboratory measurements
can give indications on the degree of ‘‘crystallinity” and on the sizeof the emitting particles (see Fig. 2).
The observed systems show a range of properties with grainssimilar to those present in the diffuse interstellar medium to grains
Fig. 1. NAOS/CONICA VLT observations of the 3.6 lm ‘‘diamonds” and 3.3 lm PAHfeatures and the adjacent continuum in the HD 97048 intermediate-mass system(Habart et al., 2004, 2006). The upper panel shows the intensity profile of thecontinuum subtracted diamond feature as a thick line histogram, the adjacent co-ntinuum profile as a thin histogram and the profile of an unresolved star as dashedline, the diamond emission is clearly resolved. In the bottom panel the PAH andcontinuum profiles are compared with disk model computations for the PAH line(dot-dashed) and the continuum (dotted). At the distance of this object, the hori-zontal scale correspond to ±100 AU from the star.
Fig. 2. Compilation of observations of silicates profiles in HAebe, TTS and BD systems and in the laboratory (adapted from and references therein Natta et al., 2007).
Fig. 3. VLTI/MIDI observations of the silicate profile in the three HAeBe systemsHD163296, HD144432, and HD142527. In the top panel a flared disk is sketched, inthe bottom panels the MIDI observations of the inner disks are compared with theemission from the outer disk derived by subtracting the interferometric spectrumfrom single telescope spectra (adapted from van Boekel et al., 2004).
L. Testi, S. Leurini /New Astronomy Reviews 52 (2008) 105–116 107
Crystalline silicatesPAHs & diamonds
with atmosphere is the natural explanation for the emission ob-served in this feature in a large variety of circumstellar disks(Chiang and Goldreich, 1997). In recent years with high qualitymid-infrared spectra becoming available first with ISO and morerecently with Spitzer, it has been possible to attempt to understandthe diversity of the profiles observed in various regions.
As reviewed in Natta et al. (2007), the modeling of silicate pro-files in disks as well as comparison with laboratory measurements
can give indications on the degree of ‘‘crystallinity” and on the sizeof the emitting particles (see Fig. 2).
The observed systems show a range of properties with grainssimilar to those present in the diffuse interstellar medium to grains
Fig. 1. NAOS/CONICA VLT observations of the 3.6 lm ‘‘diamonds” and 3.3 lm PAHfeatures and the adjacent continuum in the HD 97048 intermediate-mass system(Habart et al., 2004, 2006). The upper panel shows the intensity profile of thecontinuum subtracted diamond feature as a thick line histogram, the adjacent co-ntinuum profile as a thin histogram and the profile of an unresolved star as dashedline, the diamond emission is clearly resolved. In the bottom panel the PAH andcontinuum profiles are compared with disk model computations for the PAH line(dot-dashed) and the continuum (dotted). At the distance of this object, the hori-zontal scale correspond to ±100 AU from the star.
Fig. 2. Compilation of observations of silicates profiles in HAebe, TTS and BD systems and in the laboratory (adapted from and references therein Natta et al., 2007).
Fig. 3. VLTI/MIDI observations of the silicate profile in the three HAeBe systemsHD163296, HD144432, and HD142527. In the top panel a flared disk is sketched, inthe bottom panels the MIDI observations of the inner disks are compared with theemission from the outer disk derived by subtracting the interferometric spectrumfrom single telescope spectra (adapted from van Boekel et al., 2004).
L. Testi, S. Leurini /New Astronomy Reviews 52 (2008) 105–116 107
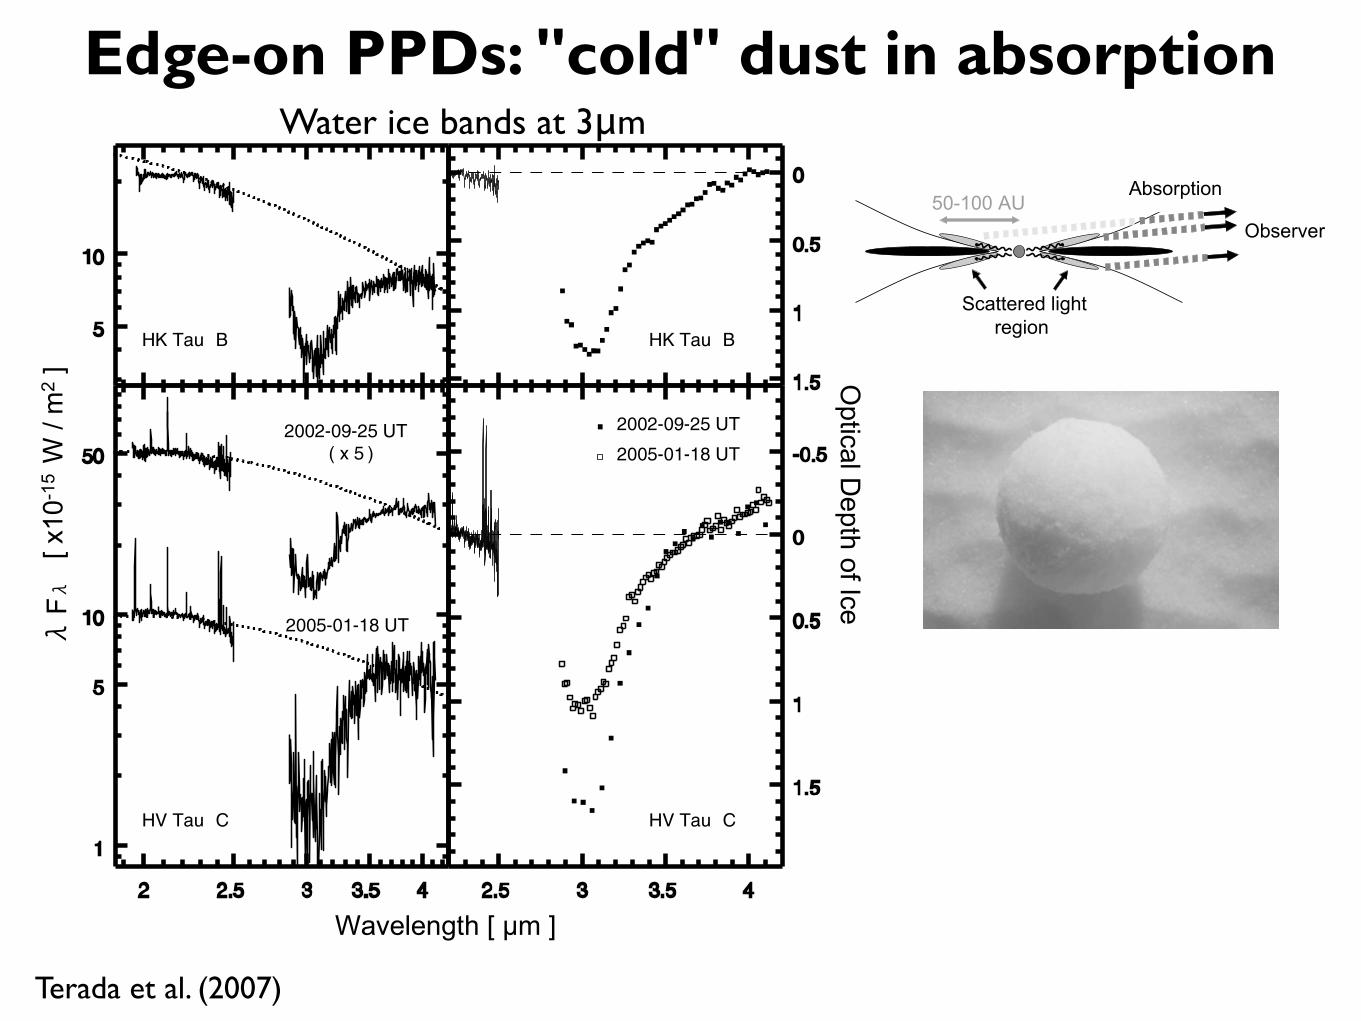
Edge-on PPDs: "cold" dust in absorption
Terada et al. (2007)
Water ice bands at 3μm
absorptions of theA0 starswere removedwith amethod developedbyVacca et al. (2003). The wavelength calibration was performedusing the telluric absorption lines in the spectrum.
3. RESULTS
Figure 1 shows adaptive optics images of HK Tau B on UT2002 September 24 and HV Tau C on UT 2002 September 25 atH,K, and L0. HKTauB andHVTauC exhibited scattered light inan edge-on disk, and two components of the scattered light fromHVTauC are clearly resolved in all the bands. The FWHM imagesizes of both objects are found to be 0.1300 at H, 0.1000 at K, and
0.1200 at L0 after wavefront correctionwith the adaptive optics sys-tem. Only the L0 images reached the diffraction limit.
Aperture photometry was performed on HK Tau B and HVTau C with a radius of 1.000 and 1.200, respectively. The photo-metric results are shown inTable 2.While our results forHVTauCshow no significant time variation at the two epochs at K and L0,both objects exhibit variability of up to 1 mag in all the bandscompared to previous photometry (Koresko 1998; Woitas &Leinert 1998;Monin&Bouvier 2000;White &Ghez 2001). Thepossible causes of the variability are magnetic activity on the stel-lar surface, variablemass accretion rate onto the central star, bright-ness change of scattered light due to geometry change of thematerials, and extinction change toward the scattered light source.Thewidth of the dark lane of HVTauCwas estimated to be 0.26900
at H, 0.25800 at K, and 0.24600 at L0 as measured by the distancebetween the peak of the two components of the scattered light fromHV Tau C. The width is wider at the shorter wavelengths as ex-pected by the greater extinction at the shorter wavelengths.
We present 1.93–4.13 !m spectra of HK Tau B and HV Tau Cin the left panel of Figure 2. The spectra is scaled to the photo-metric points atK and L0. All of the spectra show a deepwater iceabsorption at 3 !m. In addition, many emission and absorptionlines can be seen in the spectra of HV Tau C. Since HV Tau C is
TABLE 2
Magnitudes of HK Tau B and HV Tau C
Object
Date
(UT) H K L0
HK Tau B .................... 2002 Sep 24 12.25 11.54 11.02
HV Tau C .................... 2002 Sep 25 13.19 12.32 11.37
2005 Jan 18 . . . 12.31 11.40
Note.—The typical 1 " uncertainties are 0.02, 0.02, and 0.1 mag for H, K,and L0, respectively.
Fig. 2.—Left: The 1.9–4.2!mspectra of HKTauB andHVTauC.A deepwater ice absorption at 3!m is seen in these spectra. The dotted lines indicate the continua of thespectra. The optical depth of the water ice absorption is shown in the right panel. In HV Tau C, the prominent H2 emission lines can be seen at 1.9–2.5, 3.004, and 3.235 !m.
WATER ICE IN PROTOPLANETARY DISKS 305No. 1, 2007
well known to have a strong outflow activity (Magazzu &Martin1994), the most prominent emission lines are due to molecularhydrogen lines excited by the jet. The study of these lines with0.100 spatial resolution will be discussed in the second paper(H. Terada et al. 2007, in preparation).
The right panel of Figure 2 gives the optical depth of the 3 !mwater ice absorption for HK Tau B and HV Tau C. The contin-uum for the spectrum was estimated by fitting the photometricpoints at H, K, and L0 with parameters of a single-temperatureblackbody (T ) and visual extinction (AV ). The fitting results forHK Tau B were T ! 2500 K and AV ! 0 to obtain the 3 !moptical depth of 1.32. This AV does not have any physical mean-ing; its value was determined only to get a good fit to the contin-uum. The center of the optical depth profile is at 3.055 !m.
The optical depths of the water ice absorption in two epochsfor HV Tau C were found to be 1.65 for the first epoch (2002September 25) and 1.09 for the second epoch (2005 January 18)by assuming a continuum with T ! 2200 K and AV ! 3:5. Thecenter wavelength of the optical depth was estimated to be3.017 !m in the first epoch and 3.026 !m in the second epoch.
4. DISCUSSION
4.1. Origin of Ice Absorption
Stapelfeldt et al. (1998, 2003) showed that the scattered lightfrom the central star originated within a radius of 105 AU fromHK Tau B and 50 AU from HV Tau C with a scale height of 3.8and 6.5 AU, respectively, at a distance of 50 AU from the star.Thus, it is likely that the material responsible for the ice absorp-tion is outside the scattered light region, as shown schematicallyin Figure 3.
D’Hendecourt&Allamandola (1986) foundN (H2O)! "H2O!# /2:0 ; 10"16# $, where !# is the FWHM of the feature in cm"1.For HK Tau B and HV Tau C in the first and second epochs, wefind!# ! 502, 509, and 494 cm"1, respectively. Although it wasdifficult to estimate the FWHM width of the water ice absorp-tion due to a lack of sufficient data points at the shorter wave-length, we assumed it to be twice as wide as the width betweenthe center (3.02–3.06 !m) and the half-maximum point at thelonger wavelength (3.25–3.29 !m). The column densities ofH2O for HK Tau B and HV Tau C in the first and second epochswere found to be 3:31 ; 1018, 4:20 ; 1018, and 2:69 ; 1018 cm"2.Teixeira & Emerson (1999) found that N (H2O) ! (AV " 2:1) ;1017 cm"2, from which the visual extinction AV is derived to be
35.2 mag for HK Tau B, and 44.1 mag in the first epoch and29.0 mag in the second epoch for HV Tau C.Although Whittet et al. (1988) found a shallow water ice ab-
sorption with an optical depth of only 0.20 toward the primarystar HK Tau A, it is much smaller than the optical depth of 1.32for HK Tau B. The visual extinction (AV ) of 1.91 for the primarysystem HV Tau A, HV Tau B of HV Tau C (Woitas & Leinert1998) is too small to produce any water ice absorption. Thus, as-suming a distance of 140 pc, the detected water ice is localizedwithin a region of 340AU(2.400) fromHKTauBand560AU (4.000)from HV Tau C. This excludes the possibility of water ice ab-sorption by the foreground cloud.The NH corresponding to AV can be estimated using the rela-
tionship of NH ! 1:59 ; 1021# $ ; AV cm"2 obtained in the $Opiuchus dark cloud (Imanishi et al. 2001). The results ofNH forHK Tau B and HVTau C in the first and second epochs are 5:60 ;1022, 7:01 ; 1022, and 4:61 ; 1022 cm"2. If we assume a spherical
Fig. 3.—Schematic view of geometry for the water ice absorption. The scattered light regions are represented by the gray elliptical areas. The midplane of the flareddisk is represented by the black elliptical areas. Since the midplane disk is optically thick in the 3 !m band, we can observe only the scattered light through the regionsabove and below the midplane disk.
Fig. 4.—Comparison of the water ice optical depth. The solid line shows theoptical depth of the water ice for Elias 3-16 (Smith et al. 1989), which is knownto be a field star behind the Taurus molecular cloud.
TERADA ET AL.306 Vol. 667
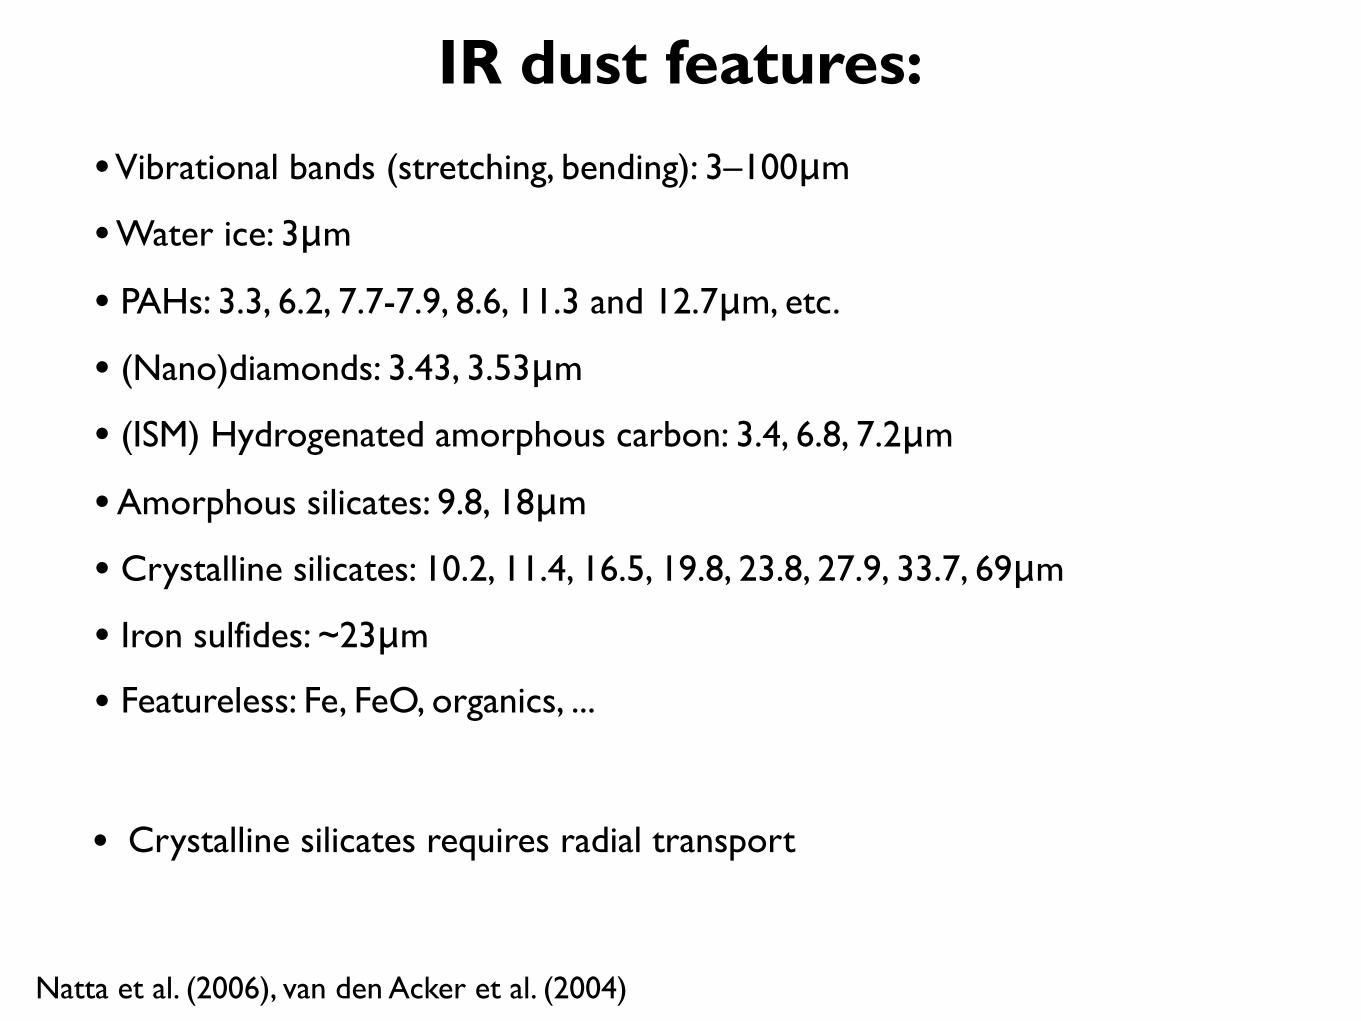
IR dust features:• Vibrational bands (stretching, bending): 3–100μm
• Water ice: 3μm
• PAHs: 3.3, 6.2, 7.7-7.9, 8.6, 11.3 and 12.7μm, etc.
• (Nano)diamonds: 3.43, 3.53μm
• (ISM) Hydrogenated amorphous carbon: 3.4, 6.8, 7.2μm
• Amorphous silicates: 9.8, 18μm
• Crystalline silicates: 10.2, 11.4, 16.5, 19.8, 23.8, 27.9, 33.7, 69μm
• Iron sulfides: ~23μm
• Featureless: Fe, FeO, organics, ...
• Crystalline silicates requires radial transport
Natta et al. (2006), van den Acker et al. (2004)
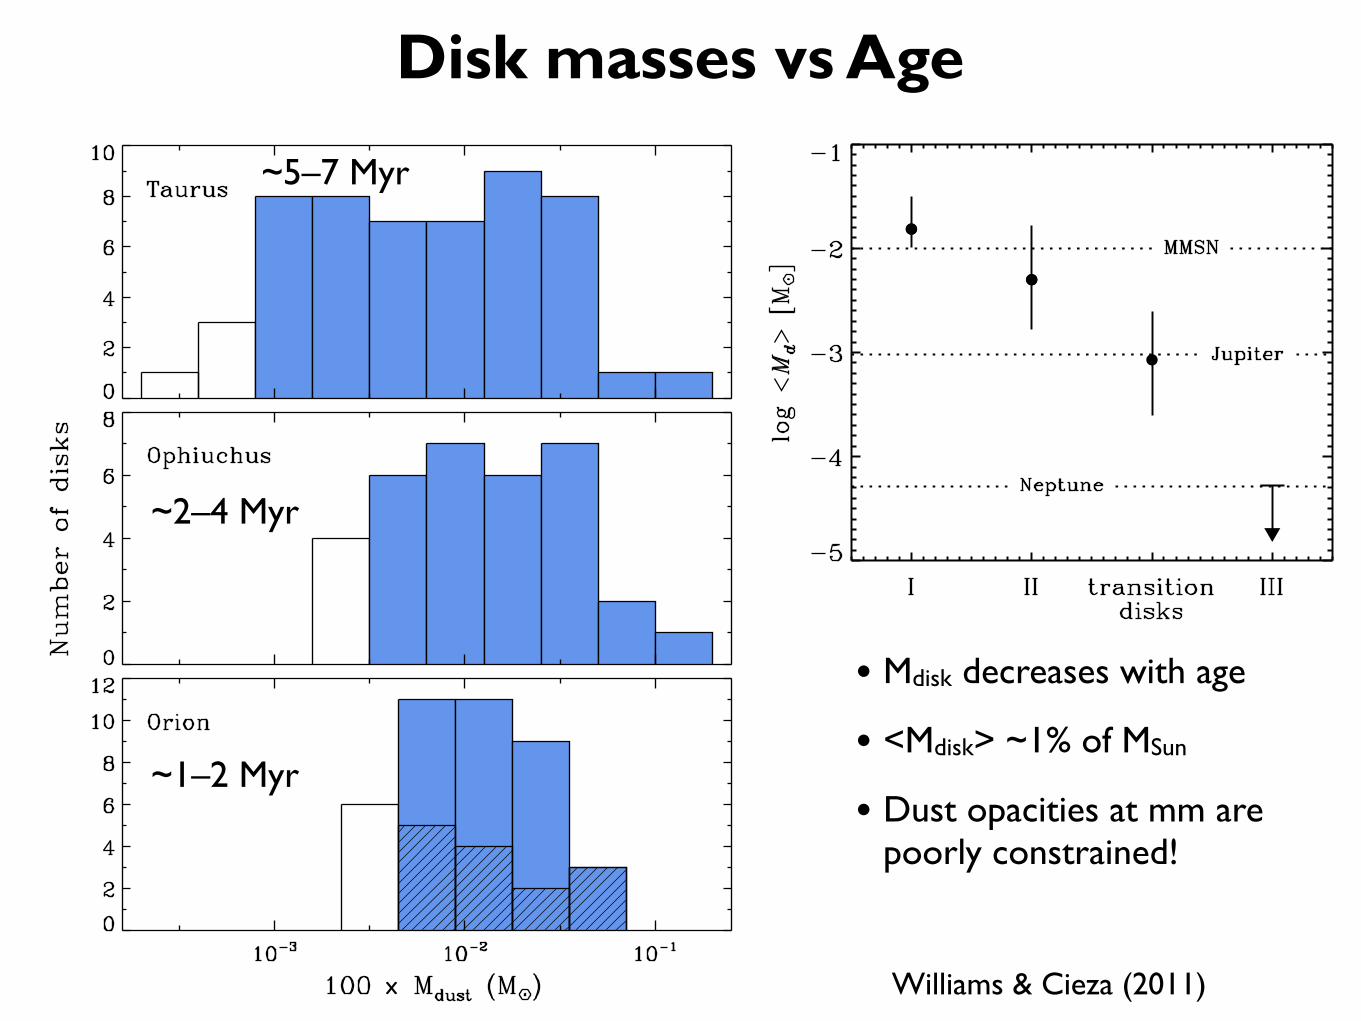
Disk masses vs AgeProtoplanetary Disks 55
Figure 1: The distribution of protoplanetary (Class II) disk masses in Tau-rus, Ophiuchus, and Orion. The dust masses are derived from millimeter fluxesand extrapolated to a total mass assuming a maximum grain size of 1mm,characteristic temperature of 20K, and an interstellar gas-to-dust ratio of 100(Andrews & Williams 2005, 2007a, Mann & Williams 2010). The filled bars showthe range where the millimeter measurements are complete for each region. Thehashed bars in the Orion histogram show the disks with projected distances 0.3 pcbeyond the O6 star, !1OriC, in the Trapezium Cluster.
Williams & Cieza (2011)
Protoplanetary Disks 61
Figure 7: Evolution of the disk masses across the empirical sequence definedby the slope of the infrared SED. The circles show the median disk mass, asmeasured at sub-millimeter wavelengths for a sample of 300 YSOs in Taurusand Ophiuchus. Error bars show the distribution quartiles. Transition disks aredefined here as those YSOs that lack infrared excesses for wavelengths less than25µm, but have detectable sub-millimeter emission. With this definition, noClass III YSO was detected and the stringent limit to their median mass comesfrom stacking the non-detections together (Andrews & Williams 2007a).
• Mdisk decreases with age
• <Mdisk> ~1% of MSun
• Dust opacities at mm are poorly constrained!
~5–7 Myr
~2–4 Myr
~1–2 Myr
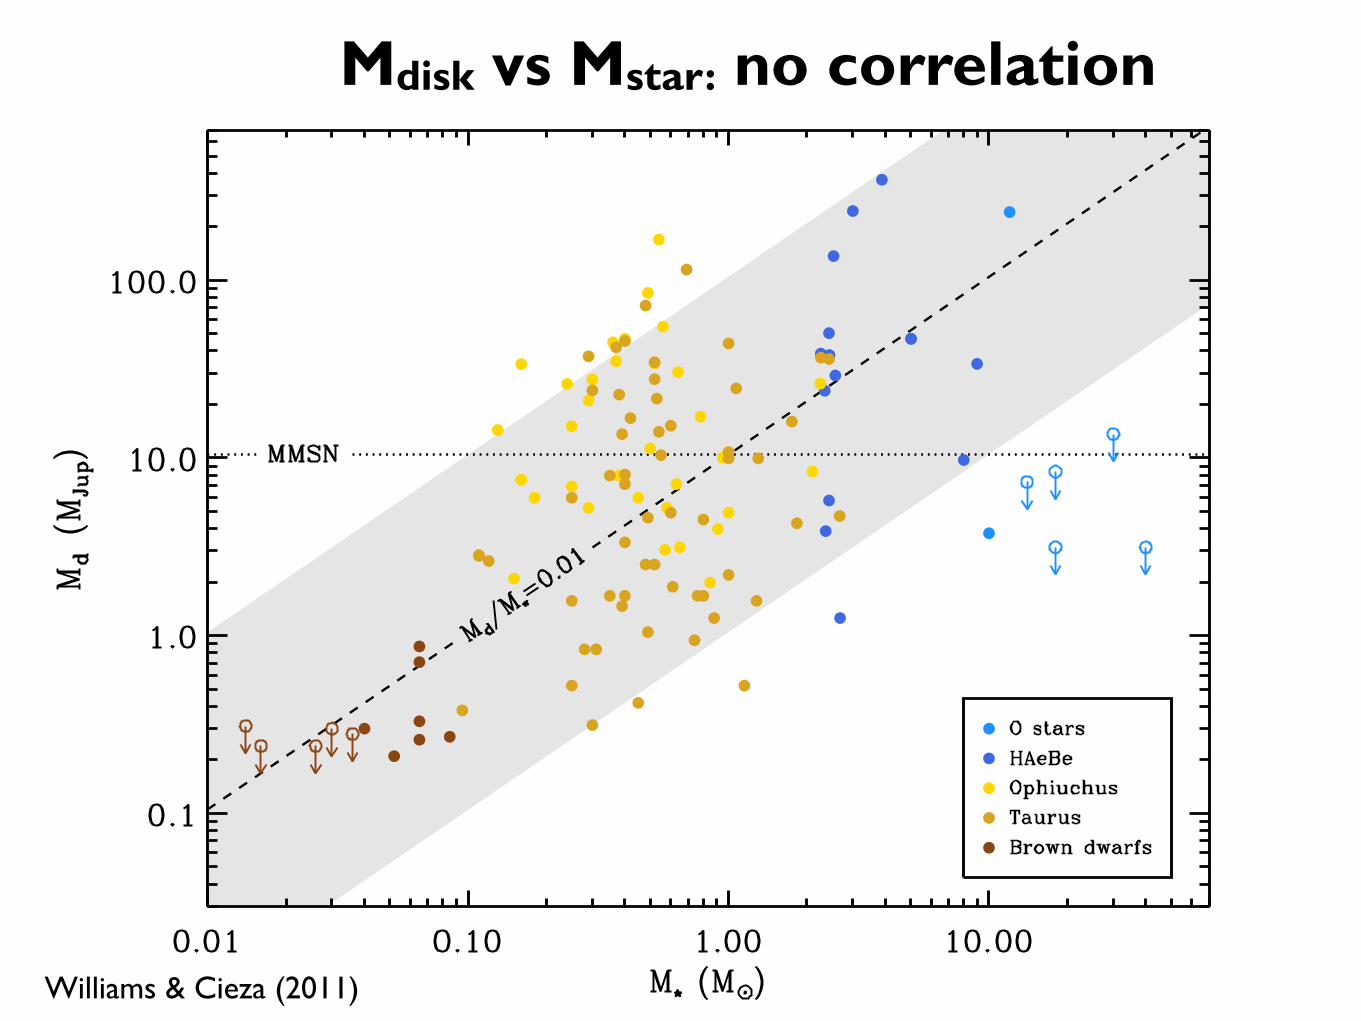
Mdisk vs Mstar: no correlation
Williams & Cieza (2011)
Protoplanetary Disks 59
Figure 5: The variation of protoplanetary disk mass with the mass of the centralstar. Upper limits are only shown at the extremes of the stellar mass range whereno disks have been detected. The dashed diagonal lines delineates where the massratio is 1%, and is close to the median of the detections. Almost all the disksaround stars with masses M! = 0.04 ! 10M" lie within the grey shaded area,±1 dex, about the median. The exception are O stars where no disks are detectedat (sub-)millimeter wavelengths, indicating either very short disk lifetimes or adi!erent star formation scenario.

Large grains in inner PPDs
• Silicate band' profiles: up to ~3μm grains
• IR SEDs: small dust gaps
• ~10% of 1–3 Myr disks
• Increase with age
• Resolved inner dust holes
• Gas is still around, accretion still goes on
Protoplanetary Disks 65
Figure 11: Montage of (sub-)millimeter images of protoplanetary disks withresolved inner holes. Each panel is 400AU on a side, and the images are shownstretched over 99% of the range from minimum to maximum. The gray ellipseat the lower left of each panel shows the synthesized beam size, and ranges from0.!!
15 to 0.!!
8. The orbits of the giant planets and Pluto in the Solar Systemare shown in the lower right panel for scale. The data are from a variety ofpublished studies with the SMA, Plateau de Bure, and CARMA interferometers(Andrews et al. 2010b, Brown et al. 2009, Guilloteau et al. 2008, Hughes et al.2009a, Isella, Carpenter & Sargent 2009, Pietu et al. 2006) as well as not yetpublished results.
Williams & Cieza (2011)

Large grains in outer PPDs
Testi et al. (2003), Natta et al. (2004), Rodmann et al. (2005), Guilloteau et al. (2011)
• Dust emissivity β: 0–2
• No correlation with stellar properties
• No correlation with age
• No correlation with dust in inner disk
• Optically thick emission?
• Free-free emission
Guilloteau et al.: Dual frequency mm imaging of proto-planetary disks
Table 14. Disk masses with variable dust properties
Source Mc (10!3 M") Mv (10!3 M") RatioCI Tau 43 ± 4 51 ± 5 1.18± 0.18CY Tau 18 ± 1 46 ± 2 2.52± 0.09DG Tau 36 ± 5 42 ± 6 1.18± 0.27DG Tau-b 151 ± 59 179 ± 60 1.19± 0.73DL Tau 51 ± 1 60 ± 1 1.18± 0.04DM Tau 32 ± 8 192 ± 49 6.07± 0.52UZ Tau 24 ± 1 32 ± 2 1.33± 0.14
Mc is the disk mass for Model 2 (tapered edge) for !(1.3mm) =2 cm2.g!1, while Mv is for !(1.3mm) as in Fig.9. A gas-to-dust ratioof 100 was assumed. Ratio = Mc/Mv.
Fig. 12. Surface densities of observed sources. Thick lines arefor sources in which a variation of " and thus ! with radiuswas derived. Thin lines are for sources for which we assumed!(1.3mm = 2 cm2.g!1. The gray line is the MMSN, while theyellow area indicates the Solar Nebula from Desch (2007).
grains), Ricci et al. (2009) derive dust opacities on the order of3!20 cm2.g!1 instead of 0.4!2 cm2.g!1 from Isella et al. (2009).The overall dependencies of ! and " upon the grain size distri-bution display the same characteristic behavior. Note, however,that it is possible to obtain " values above 2, provided the grainsize distribution as a relatively steep cuto! near a+ = #/2$, i.e.about 0.5 mm for # = 3 mm, because the emissivity of a grainsize a has a pronounced maximum at wavelengths # 2$a (seee.g. Natta et al. 2004), before dropping as 1/a at longer wave-lengths. In the following, we scale down the surface densities ofsources analyzed with radial dust opacity gradients by a factor3, to avoid a di!erent bias in the comparison with sources forwhich this analysis was not possible.
Figure 12 displays the resulting surface densities (ofgas+dust) for the sources in the sample. Uncertainties wereomitted for clarity in this figure, but can be recovered from theFigs.G.1-G.22. We note that the younger sources have highersurface densities in the inner 50 AU than other objects. Theyare also more centrally peaked, on average. This picture is qual-itatively similar to the predictions from viscous disk evolution.Figure 12 also displays the profiles derived for the Solar Nebula,the MMSN (Hayashi 1981, gray line) and the solution pro-posed by Desch (2007), which accounts for the early planet mi-gration as proposed by the Nice model (Tsiganis et al. 2005;Gomes et al. 2005) (yellow range). The solution proposed byDesch (2007) (see Appendix E, available online only) for theSolar Nebula is a steady-state solution, which allows for su"-
Fig. 13. Characteristic radius Rc (in AU) as a function of esti-mated stellar ages (in Log10 of 106 years).
Fig. 14. Initial disk radii (AU).
cient time (fewMyr) for the giant planets to reach isolation mass.In comparing with our results, it is important to realize that ourobservations constrain essentially the slope and surface densitybetween 50 to 150 AU, while the other regions are obtained byextrapolation of the analytically prescribed shape. In our sample,only the youngest objects have su"ciently high surface densitiesto be compatible with the MMSN.
5.3. Towards an evolutionary model ?
5.3.1. Viscous evolution of the gas disk
Figure 13 displays the characteristic radius Rc as a function ofestimated stellar ages. The figure apparently suggests an in-crease of Rc with age. Performing a Spearman rank-order cor-relation test indicates a correlation coe"cient of 0.60, and asmall probability of random distribution (0.7 % only). This cor-relation study does not include the error bars on age and Rc,however. Furthermore, the correlation coe"cient is heavily in-fluenced by the two youngest objects, DGTau and HLTau andthe two oldest ones, GMAur and DMTau, all sources for whichthe power law model gives a better fit than the softened-edgemodel. Nevertheless, taken at face value, our data seem to con-firm the trend suggested by Isella et al. (2009), which they haveinterpreted as evidence for the viscous evolution of disks.
20

Grain evolution in the Solar NebulaPlanet formation and protoplanetary dust 5
Figure 1.2 Components of chondritic meteorites: fluffy CAI (upper left), compactCAI (upper right), chondrule (lower left), and matrix (lower right).
100µm before they fragmented on the collection surface. The IDPs include samplesof both asteroids and comets. Micrometeorites are much more massive than typicalIDPs. They can be collected in vast numbers, and include particles near the massflux peak at 200µm size that dominates the bulk of cosmic matter accreted byEarth. Micrometeorites exhibit a diversity of compositions and structures, with themajority being dominated by fine-grained anhydrous minerals. Stardust sampleswere collected in the coma of comet Wild 2 by high-velocity aerogel capture andreturned to Earth for detailed analysis.
From a mineralogy viewpoint, IDPs are aggregates of mostly sub-micron-sizedcrystalline silicates (olivine and pyroxene), amorphous silicates, sulfides, and minorrefractory minerals, held together by an organic-rich, carbonaceous matrix. Largefractions, 30–60 wt%, of these IDPs are amorphous silicates, known as glass with
32 H.-P. Gail and P. Hoppe
Figure 2.1 An IDP composed of very small <0.2 µm subunits. The IDPs show thefluffy structure of particles that is expected for dust agglomerates in protoplanetaryaccretion disks. The IDPs are suspected to be composed partly from particles ofinterstellar origin. A small fraction of the subunits can be identified as presolardust grains. (Courtesy of NASA, http://stardust.jpl.nasa.gov/science/sci2.html.)
Sometimes, dust models have been considered that contain coated particles, e.g.silicate grains with a mantle of carbonaceous material. Such models can probablybe excluded (Zubko et al. 2004); the best fits to observations are obtained for baregrains.
A potential source of information on the nature and composition of interstellardust grains comes from IDPs, which are collected in the Earth’s stratosphere (e.g.Bradley 2003; Alexander et al. 2007). The IDPs with bulk compositions in the rangeof chondritic meteorites can be divided into two broad categories, compact hydrousparticles and porous anhydrous particles. The latter are aggregates of submicro-meter building blocks (see Fig. 2.1). They represent a disequilibrium assemblageof minerals and amorphous silicates and it has long been suspected that some ofthem are dust particles released during the flyby of comets at the Sun. If true, thesegrains are particles from the formation time of the Solar System that have survivedfor 4.6 Gyr inside extremely cold (approximately 20 K) cometary bodies. Althoughmodified in several important ways (Stern 2003, see also Section 2.3.4), these aresome of the most pristine bodies known. Since some material of the protoplane-tary disk in the region of comet formation is interstellar material from the parentmolecular cloud (see Section 2.3.4), cometary IDPs should contain interstellar dustgrains. In particular, one of the components forming IDPs is the so-called GEMS(glass with embedded metals and sulfides), a glassy material with inclusions of iron
Apai & Lauretta (2010)
IDP (NASA)The origins of protoplanetary dust and the formation of accretion disks 33
Figure 2.2 A GEMS particle found in an IDP, consisting of a glassy matrix withsilicate-like composition and embedded nanometer-sized inclusions of iron metaland iron sulfide (dark patches). Some of them are possibly interstellar silicate dustgrains. (From NASA http://stardust.jpl.nasa.gov/science/sci2.html.)
metal and iron sulfide (see Fig. 2.2). Such GEMS particles have been consideredto be true interstellar silicate dust grains (Bradley 2003), which may have formedby accreting thoroughly mixed refractory elements from the interstellar gas phasethat is isotopically normal. However, more recent investigations show that mostGEMS grains with solar O-isotopic compositions have chemical compositions thatappear to be incompatible with inferred compositions of interstellar dust. The ori-gins of GEMS with solar O-isotopic composition are still a matter of debate andcurrently it is not possible to draw definite conclusions. There are, however, a fewGEMS particles with O-isotopic anomalies (Messenger et al. 2003). These grainsare undoubtedly stardust grains (see Section 2.2).
2.1.2 Cycle of matter from stars to the ISM to the Solar System
The visible matter of galaxies is concentrated in mainly three components: stars,interstellar matter, and stellar remnants. Since the early days of galaxy formationthere is a vivid exchange of matter between the stellar component and the interstellarmatter. Stars are formed in local concentrations of the ISM, the molecular clouds;they live for a certain period of time while burning their nuclear fuels; and they die
• by massive mass loss by a stellar wind in the case of low- and intermediate-mass stars(initial masses M0 < 8 M!), leaving a white dwarf remnant,
• or by collapse of the core region of a massive star to a neutron star (8 M! !M0 ! 40 M!),associated with an ejection of most of their mass at that instant in a SN event,
• or by collapse to a black hole (M0 " 40 M!) without mass ejection,• or by detonation of white dwarfs as supernovae of Type Ia, caused by mass transfer in
certain binary systems.
High-T condensates insilicates
Heterogeneous textures: chondrules & CAIs in matrix
Fractal shapes of IDPs
Gail & Hoppe (2010)

Grain evolution in the Solar Nebula• Most primitive are chondritic meteorites: matrix + chondrules + CAIs
• No signs of alteration & metamorphism (Т<50 K)
• Calcium-Aluminum-rich Inclusions (CAIs), 4.571 Gyr:
• 0.1mm–1cm: mixture of highest-T condensates
• Multiple high-T events
• Chondrules (molten droplets): ~0–2 Myr after CAIs
• Single melting-condensation event
• Peak temperatures: >1800K
• Initial cooling: ~hours (till ~1000K)
• Chondrule densities: >10-5 cm-3
• Formation in "clumps": >1000 km
Courtesy of S. Desch
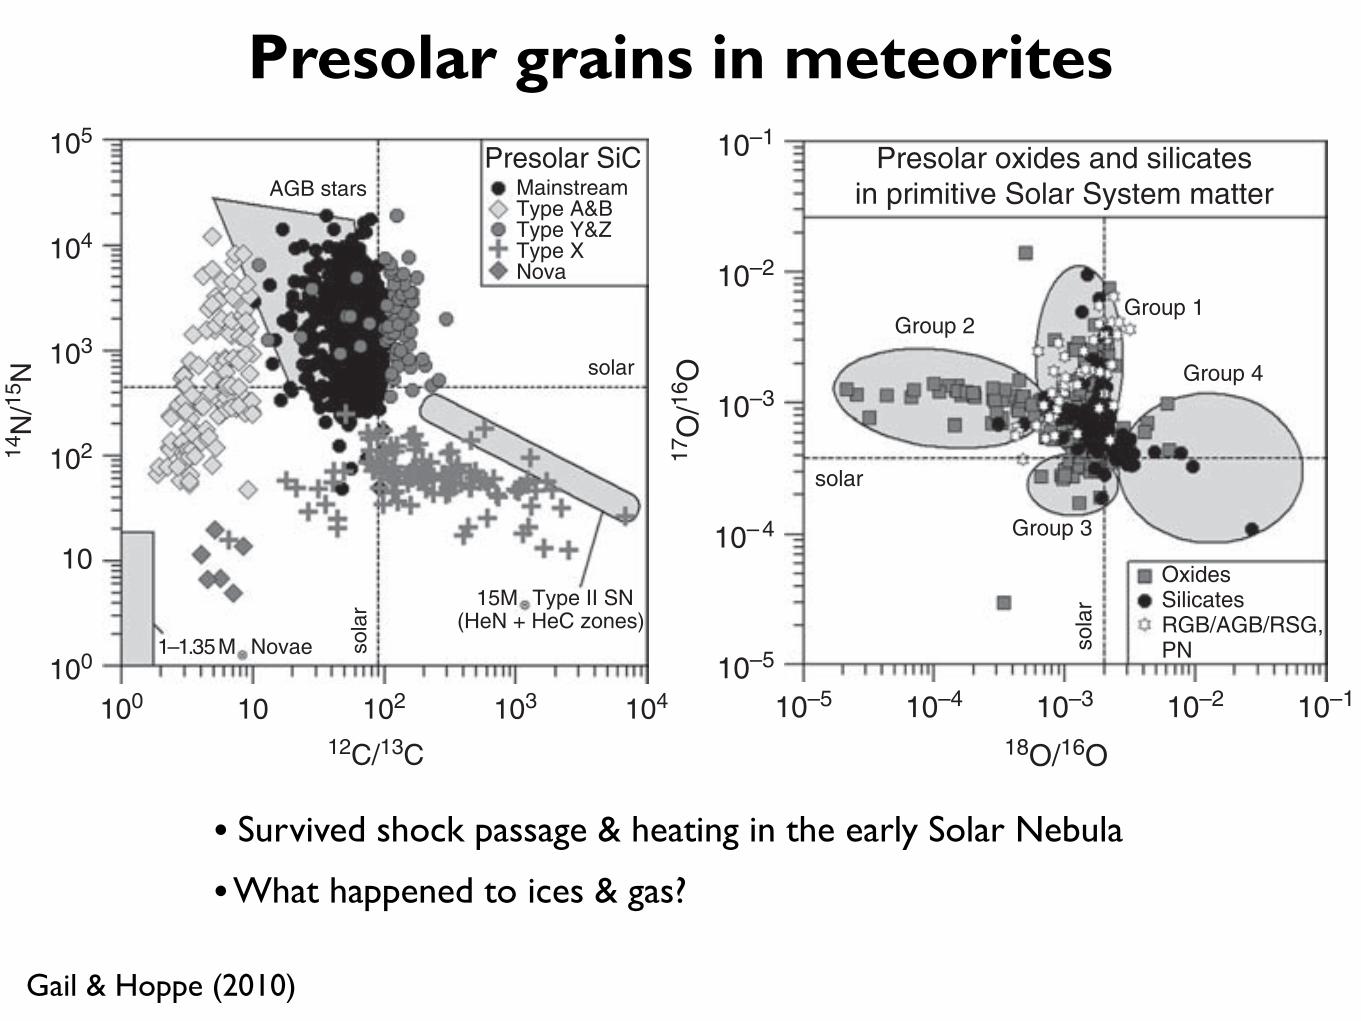
Presolar grains in meteorites
Gail & Hoppe (2010)
The origins of protoplanetary dust and the formation of accretion disks 45
105
104
103
102
10
Mainstream
solar
Type A&BType Y&ZType XNova
Novae sola
r
1–1.35 M
AGB stars
15M Type II SN(HeN + HeC zones)
100
100 102 103 1041012C/13C
14N
/15N
Presolar SiC
Figure 2.6 Carbon- and nitrogen-isotopic compositions of presolar SiC grains.Predictions from stellar models are shown for comparison. Solar metallicity AGBstar models: Nollett et al. (2003), Type II SN: Rauscher et al. (2002), novae: Joséet al. (2004). For data sources see Lodders & Amari (2005); Zinner (2007). Notethat for the solar 14N/15N ratio the value inferred for Jupiter’s atmosphere is shown.
grains show enrichments in the neutron-rich isotopes 29Si and 30Si of up to 20%and in an Si-three-isotope representation they plot along a characteristic correlationline (!29Si = 1.37!!30Si " 20; !iSi = [(iSi/28Si)Grain/(
iSi/28Si)#"1]!1000),the “SiC mainstream line.” For historical reasons, it is also interesting to note thatthere are clear hints for the initial presence of 99Tc (half-life 210 000 yr; Savinaet al. 2004), an isotope, whose observation in the spectra of AGB stars has providedthe first direct evidence that the chemical elements are produced in the interior ofstars (Merrill 1952). The isotopic patterns of the intermediate-mass and heavy ele-ments (e.g. Kr, Sr, Zr, Mo, Ru, Xe, Ba, Nd, Sm, and Dy) show the characteristicimprints of s-process nucleosynthesis (slow neutron-capture reactions). The Y andZ grains (several percent of SiC) differ from mainstream grains in that they plotto the 30Si-rich side of the SiC mainstream line. While the C-isotopic ratios of theType-Z grains are not different from those of mainstream grains, the Y grains have12C/13C ratios of higher than 100, which is outside the range of mainstream grains.Carbon-rich AGB stars are the most likely stellar sources for the mainstream, Y,and Z grains (for a detailed discussion of stellar sources see Section 2.2.4). TheA and B grains (several percent of SiC) are generally treated as a single popu-lation. They have 12C/13C ratios of <10 and many of them exhibit enrichmentsin 15N relative to solar. Their Si-isotopic signature is essentially the same as thatof mainstream grains. The origin of the A and B grains is still not understood.
48 H.-P. Gail and P. Hoppe
Presolar oxides and silicatesin primitive Solar System matter
10–1
10–2
Group 2Group 1
Group 3
Group 4
OxidesSilicatesRGB/AGB/RSG,PN
solar
sola
r
10–3
10– 4
10–510–5
10–4 10–3
18O/16O
17O
/16O
10–2 10–1
Figure 2.8 Oxygen-isotopic compositions of presolar oxide and silicate grains.Data for RGB/AGB stars, red supergiants (RSG), and planetary nebulae (PN) areshown for comparison. The gray ellipses indicate the four isotope groups definedfor presolar O-rich dust. For data sources see Lodders & Amari (2005) and Zinner(2007).
to strong enrichments in 18O and both 17O enrichments and depletions. Group 4grains are likely to originate from Type II supernovae (see Section 2.2.4). There is nosystematic difference between refractory oxides and silicates except for the fact thatthe Group 2 grains appear to be less abundant among the presolar silicates. However,this may be an experimental bias because presolar silicates are identified in situ andmeasured isotope ratios may be diluted by contributions from surrounding matrixmaterial, resulting in less extreme isotopic ratios. Two of the known oxide grainsare outside this classification scheme, one with strong enrichment in 16O and onewith very high 17O/16O and moderate depletion in 18O.
Many (but not all) grains carry radiogenic 26Mg from the decay of radioac-tive 26Al. Inferred 26Al/27Al ratios are generally highest in Group 2 grains inwhich ratios of larger than 0.1 can be reached. A few hibonite grains carryradiogenic 41K from the decay of radioactive 41Ca. Silicon-isotopic composi-tions of presolar silicate grains from Groups 1 and 2 are similar to those of SiCmainstream grains. The extremely 17O-rich Group 1 grains, however, are com-parably rich in 30Si. The Si-isotopic signatures of the Group 4 silicate grainsare distinct from those of the other grains. Most grains show lower than solar30Si/28Si and 29Si/28Si ratios. This is qualitatively the signature of the super-nova SiC X grains, pointing to a close relationship between these presolar grainpopulations.
• Survived shock passage & heating in the early Solar Nebula
• What happened to ices & gas?
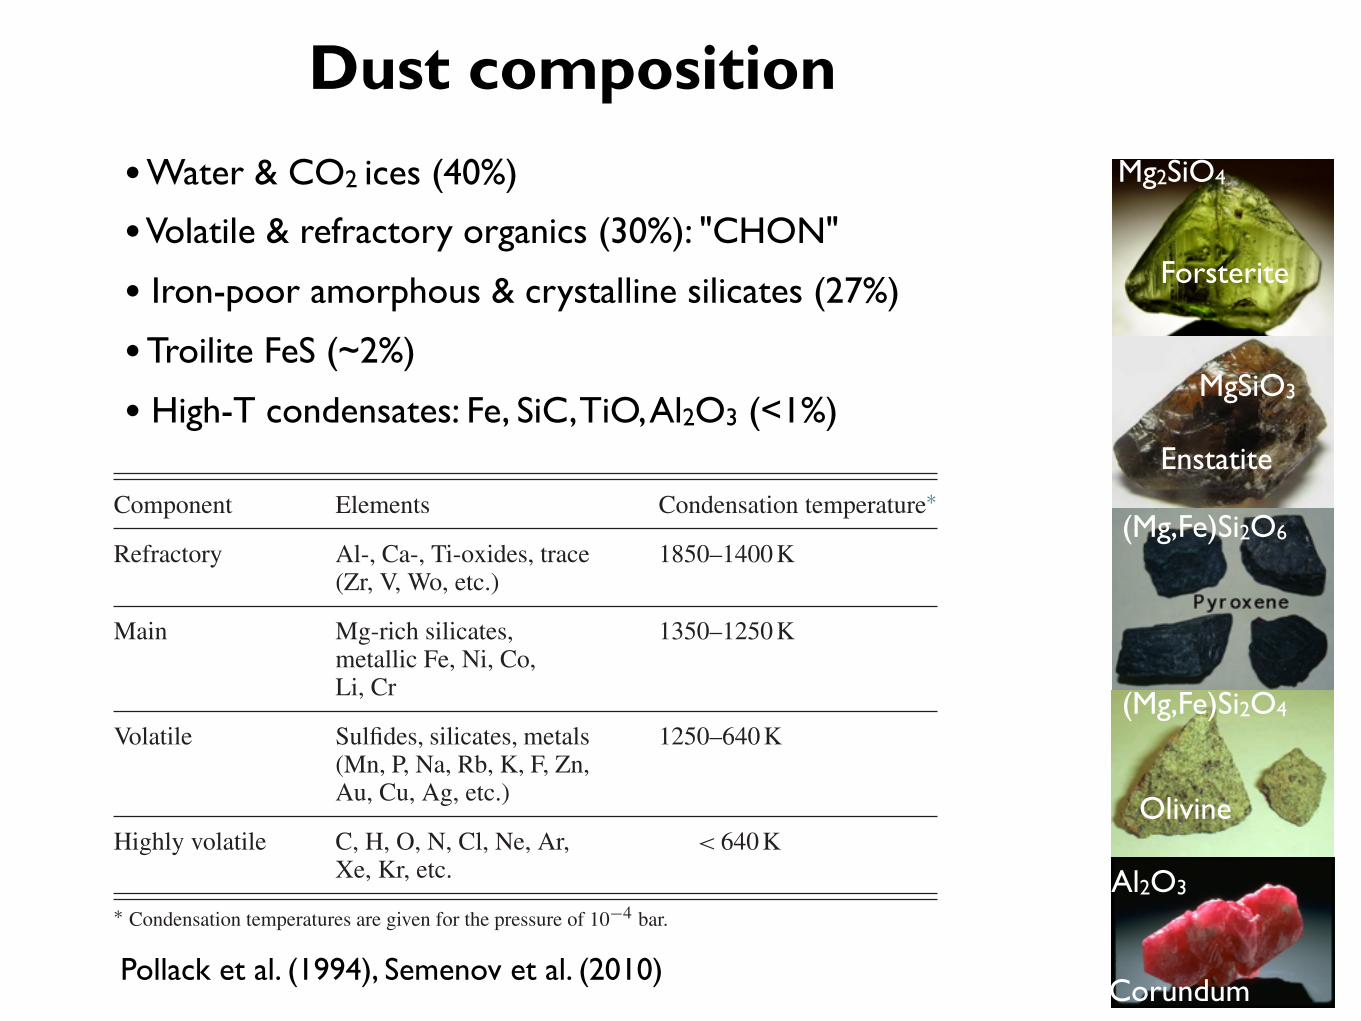
Dust composition• Water & CO2 ices (40%)
• Volatile & refractory organics (30%): "CHON"
• Iron-poor amorphous & crystalline silicates (27%)
• Troilite FeS (~2%)
• High-T condensates: Fe, SiC, TiO, Al2O3 (<1%)Chemical and isotopic evolution of the solar nebula and protoplanetary disks 113
Table 4.3 Condensation sequence for the early solar nebula
Component Elements Condensation temperature!
Refractory Al-, Ca-, Ti-oxides, trace(Zr, V, Wo, etc.)
1850–1400 K
Main Mg-rich silicates,metallic Fe, Ni, Co,Li, Cr
1350–1250 K
Volatile Sulfides, silicates, metals(Mn, P, Na, Rb, K, F, Zn,Au, Cu, Ag, etc.)
1250–640 K
Highly volatile C, H, O, N, Cl, Ne, Ar,Xe, Kr, etc.
< 640 K
! Condensation temperatures are given for the pressure of 10"4 bar.
sulfur is condensed in the form of troilite (FeS). At even lower temperatures otherelements (C, H, O, N) locked in various molecules “condense” (or accrete) fromthe gas phase, e.g. water (T #100 K), ammonia (T #70 K), CO (T #20 K), etc.Note, that volatile and highly volatile elements are depleted in almost all materialsof the inner Solar System (see Chapter 10), so these differ chemically from the bulkcomposition retained in the outer disk regions, where comets have formed.
4.4 Oxygen isotopes
Oxygen is the third most abundant element in the Solar System. Oxygen possessesthree stable isotopes, 16,17,18O, with concentrations that are different between dis-tinct families of meteoritic minerals. The simultaneous presence in both gaseous andsolid phases renders oxygen isotopes as important tracers of physical and chem-ical processes in the solar nebula (Clayton 2007). Isotopic partitioning dependson the zero-point energy difference and involves chemical kinetics and thermo-dynamic equilibrium, properties which vary widely from molecule to molecule.These changes, by convention, are measured through the so-called !-notation (inpermil):
!17,18O =!"17,18O/16O
#sample /
"17,18O/16O#
std " 1$
$ 1000 (4.2)
where subscripts “sample” and “std” represent sample and reference material,respectively. For oxygen isotopes, the reference material is the Vienna StandardMean Ocean Water (VSMOW). As has been shown for equilibrium as well as for
Pollack et al. (1994), Semenov et al. (2010)
Mg2SiO4
MgSiO3
(Mg,Fe)Si2O4
Al2O3
(Mg,Fe)Si2O6
Forsterite
Enstatite
Olivine
Corundum
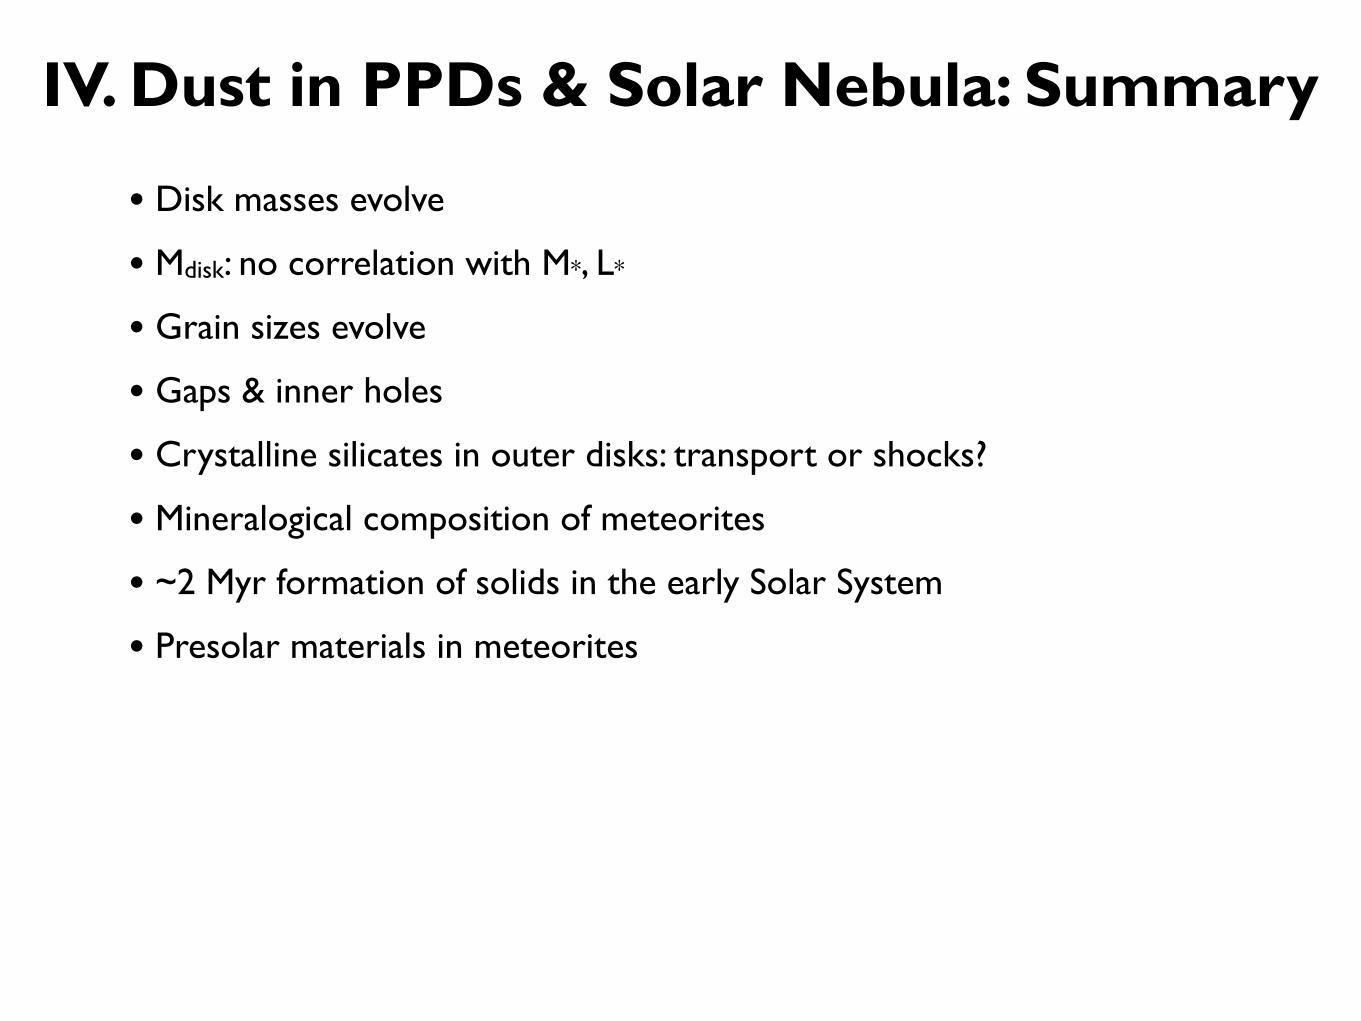
IV. Dust in PPDs & Solar Nebula: Summary
• Disk masses evolve
• Mdisk: no correlation with M*, L*
• Grain sizes evolve
• Gaps & inner holes
• Crystalline silicates in outer disks: transport or shocks?
• Mineralogical composition of meteorites
• ~2 Myr formation of solids in the early Solar System
• Presolar materials in meteorites
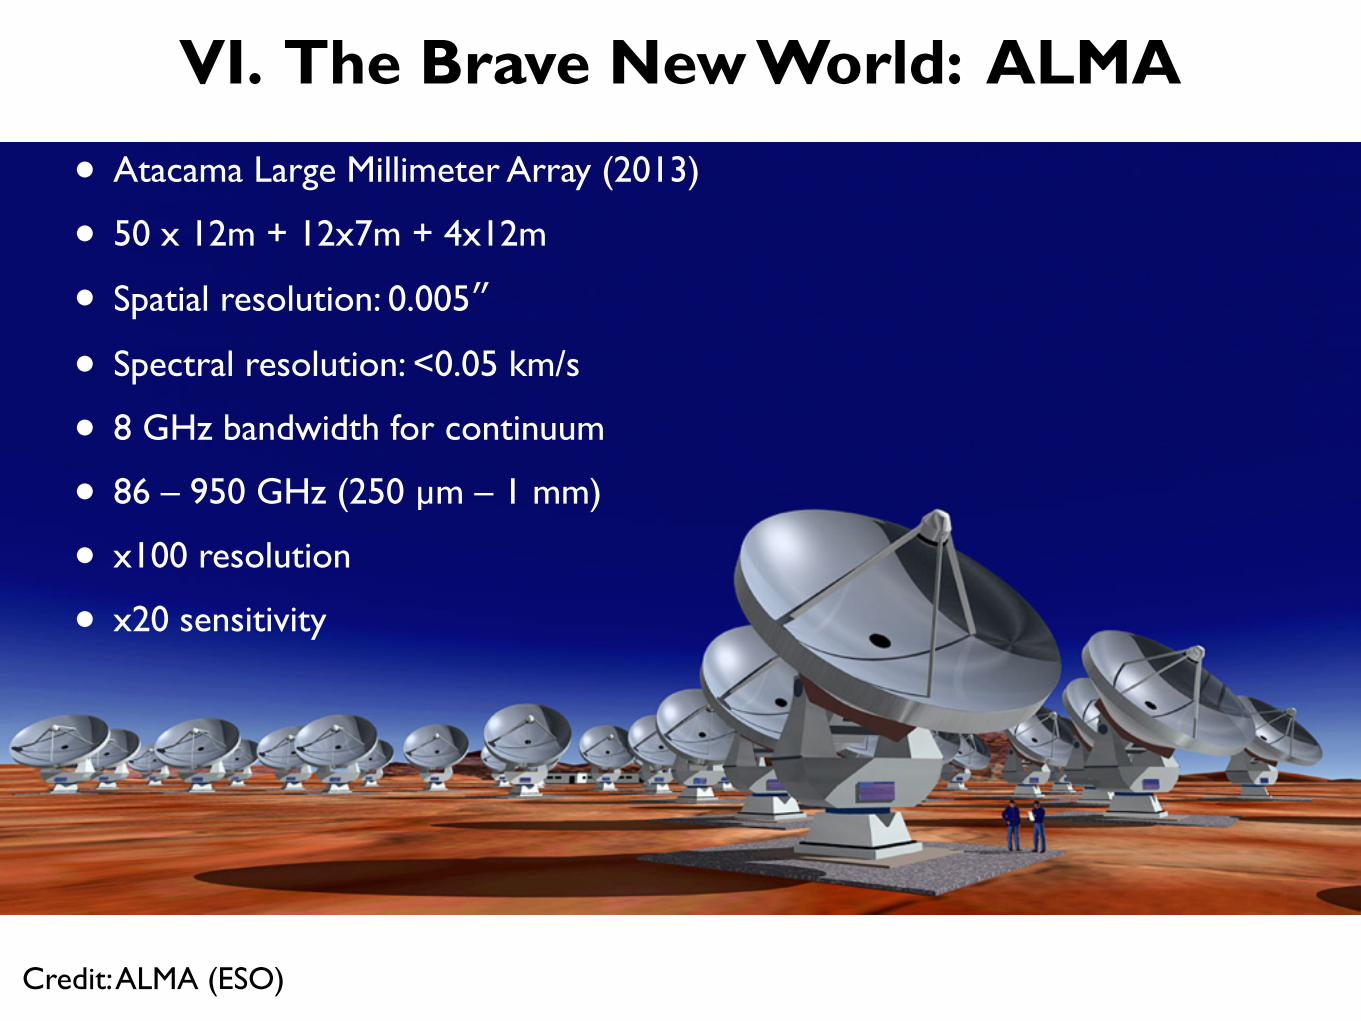
VI. The Brave New World: ALMA
Credit: ALMA (ESO)
• Atacama Large Millimeter Array (2013)
• 50 x 12m + 12x7m + 4x12m
• Spatial resolution: 0.005″
• Spectral resolution: <0.05 km/s
• 8 GHz bandwidth for continuum
• 86 – 950 GHz (250 µm – 1 mm)
• x100 resolution
• x20 sensitivity
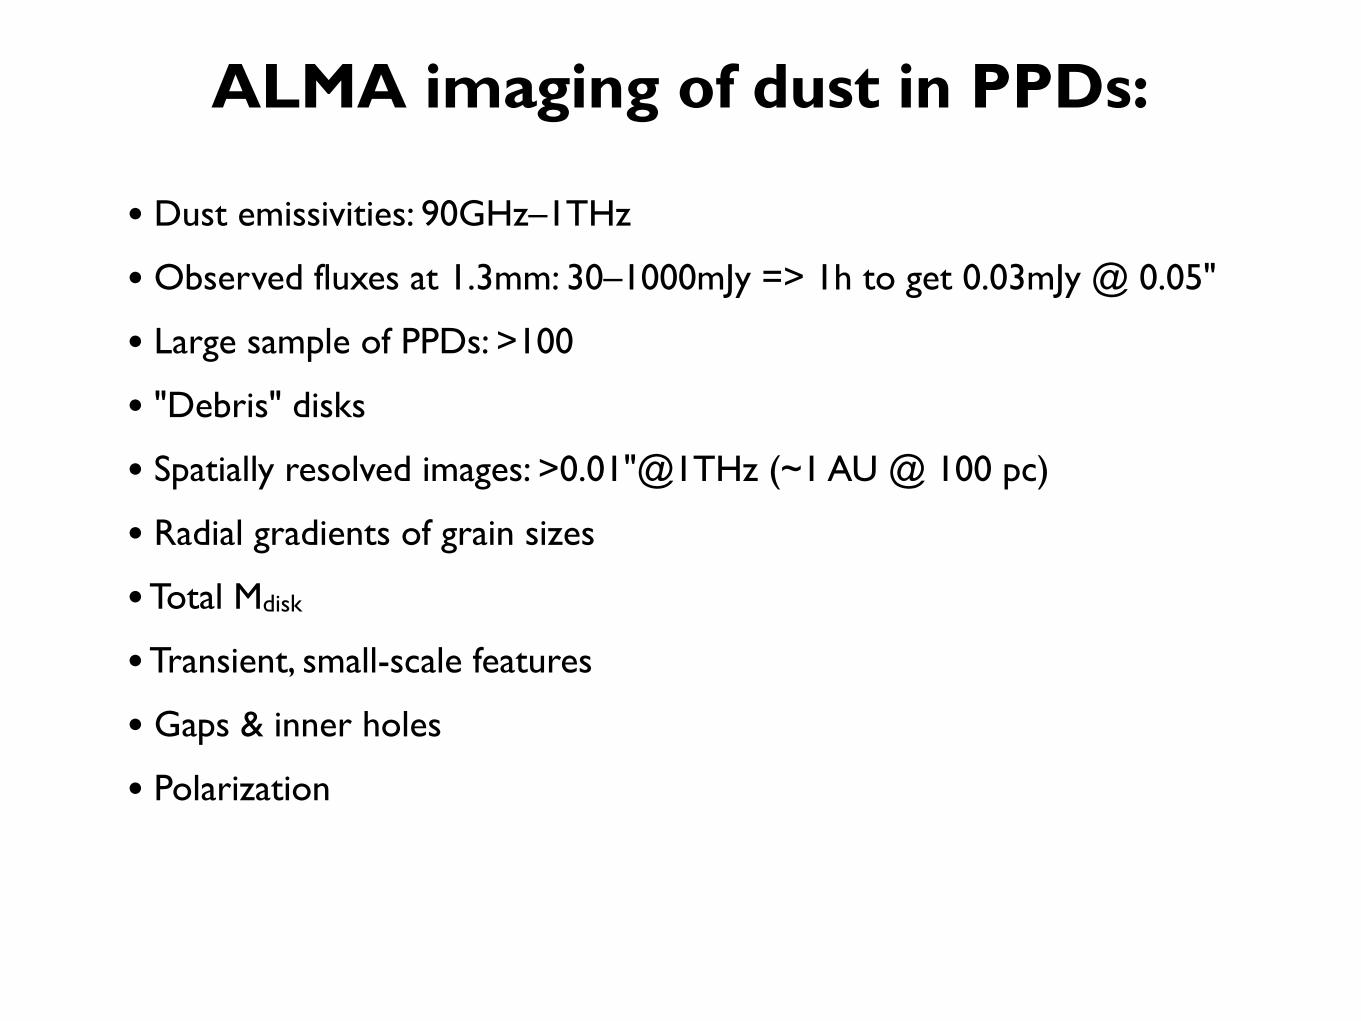
ALMA imaging of dust in PPDs:
• Dust emissivities: 90GHz–1THz
• Observed fluxes at 1.3mm: 30–1000mJy => 1h to get 0.03mJy @ 0.05"
• Large sample of PPDs: >100
• "Debris" disks
• Spatially resolved images: >0.01"@1THz (~1 AU @ 100 pc)
• Radial gradients of grain sizes
• Total Mdisk
• Transient, small-scale features
• Gaps & inner holes
• Polarization
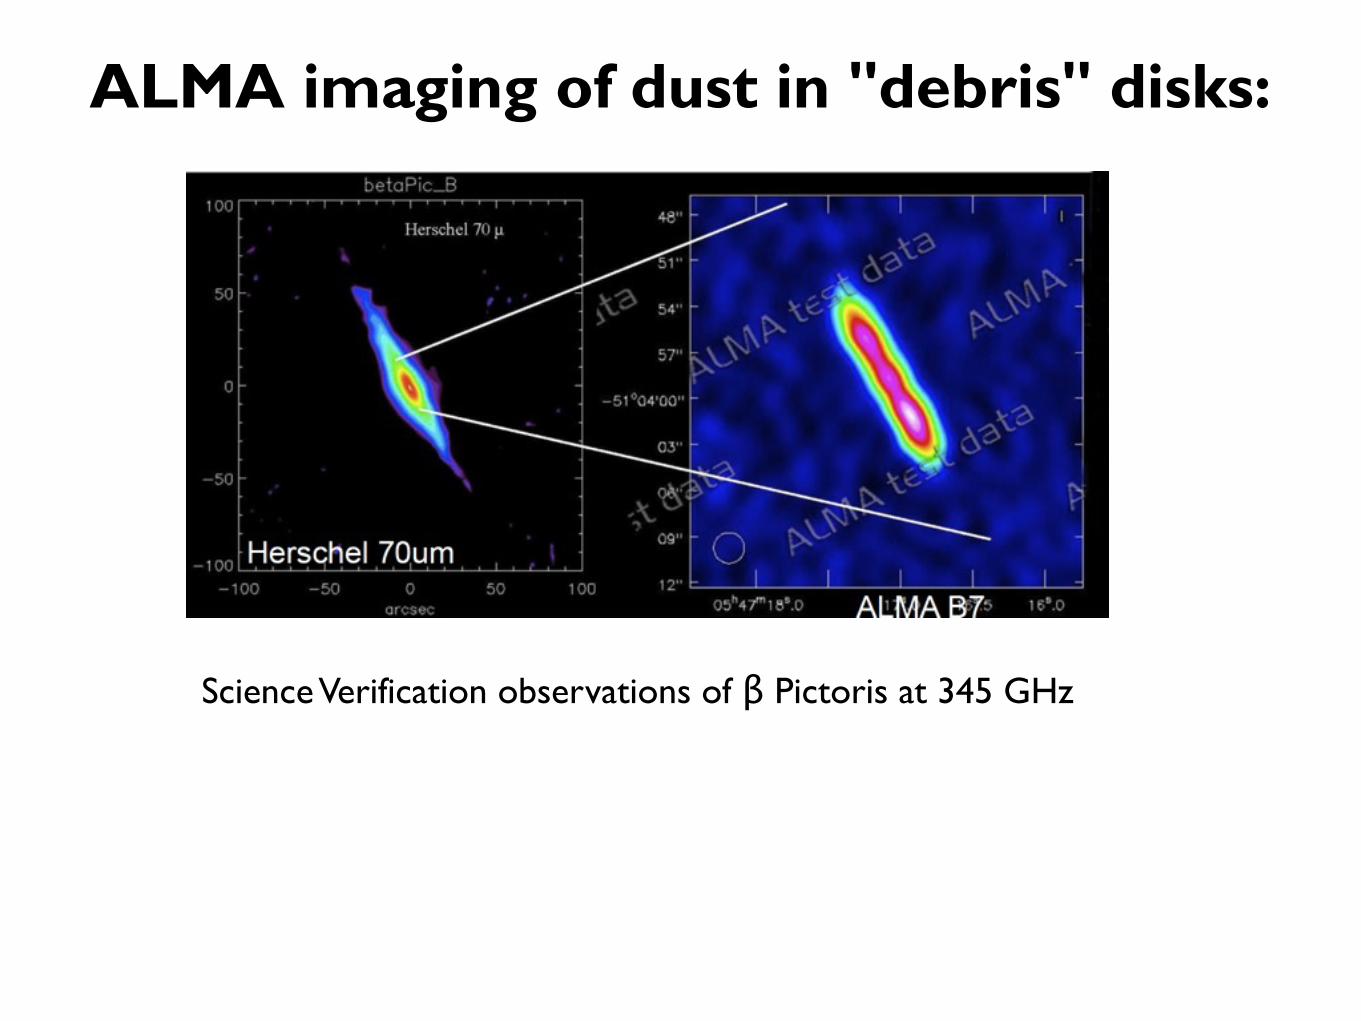
ALMA imaging of dust in "debris" disks:
Wolf et al. (2002)Wyatt (2004)
Science Verification observations of β Pictoris at 345 GHz
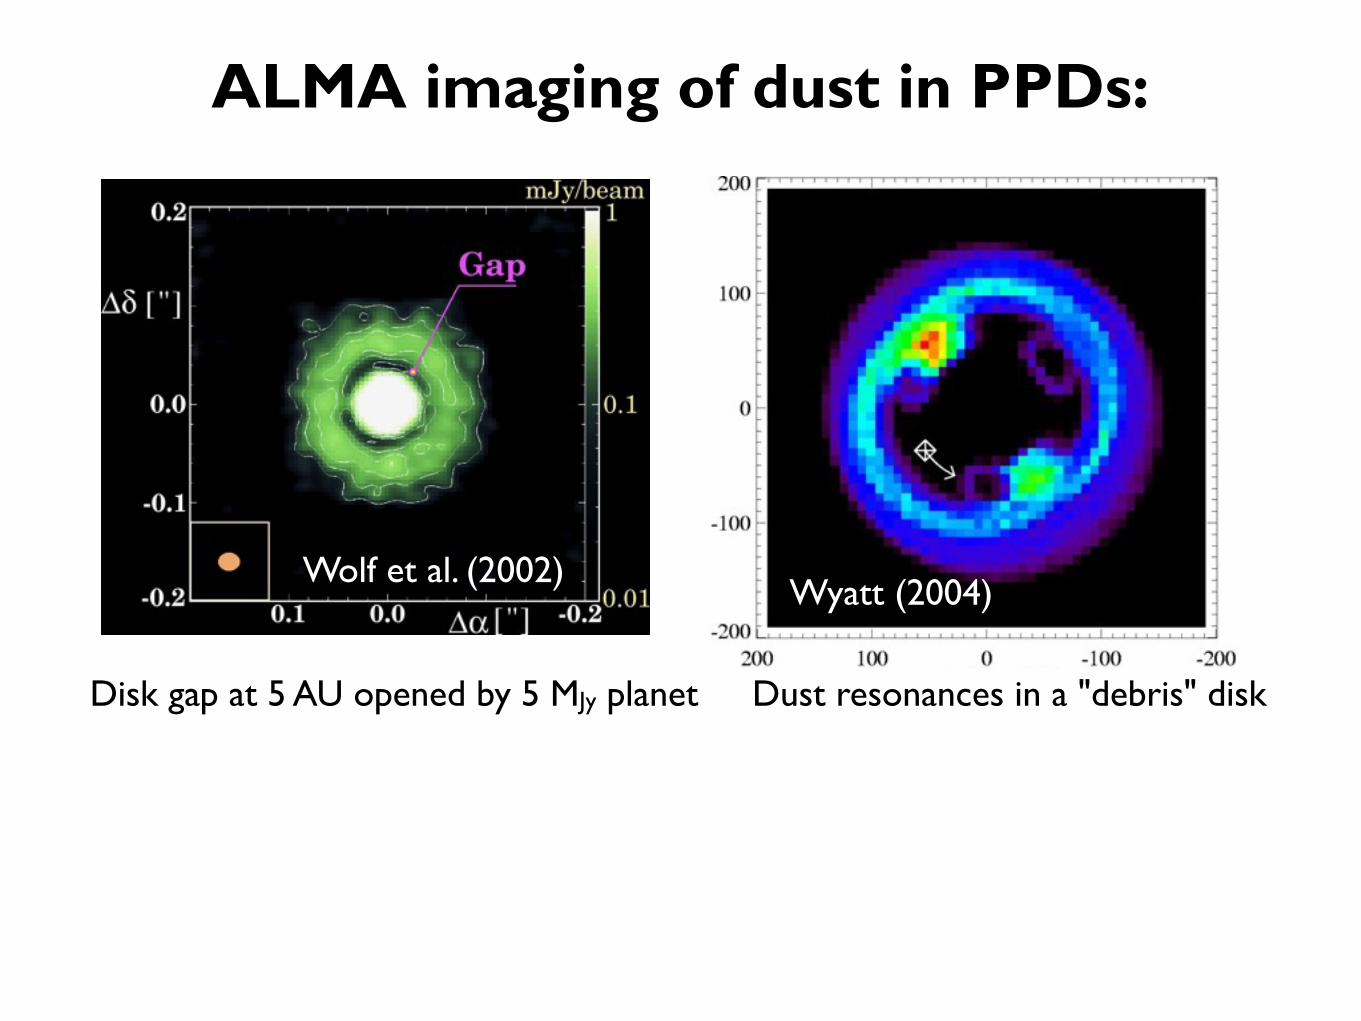
ALMA imaging of dust in PPDs:
Wolf et al. (2002)Wyatt (2004)
Disk gap at 5 AU opened by 5 MJy planet Dust resonances in a "debris" disk