district summary - dallas independent school district · district summary. 2011-12 data packet ......
TRANSCRIPT

Evaluation & Accountability Data Analysis, Reporting, and Research Services https://mydata.dallasisd.org [email protected] Published July 27, 2011
DISTRICT SUMMARY

Table of Contents2011-12 Data Packet: Standard Issue
2. Contents .................. Table of Contents 3. Notes ....................... Notes and Data Descriptions
STUDENTS AND STAFF6. Summary ................. Summary of Student and Teacher Statistics 7. Enrollment (1) .......... Enrollment Statistics by Ethnicity
10. Enrollment (2) .......... Enrollment Statistics by Select Student Group 13. Attendance .............. Student Attendance Statistics
16. Teachers ................. Teacher Statistics
TAKS / TAKS (ACCOMMODATED)17. TAKS Read ............. TAKS/TAKS(Acc) Reading/ELA 32. TAKS Math .............. TAKS/TAKS(Acc) Mathematics
47. TAKS Writing ........... TAKS/TAKS(Acc) Writing 54. TAKS SS ................. TAKS/TAKS(Acc) Social Studies
62. TAKS Science ......... TAKS/TAKS(Acc) Science 74. TAKS (SP) Read ..... Spanish TAKS/TAKS(Acc) Reading
78. TAKS (SP) Math ...... Spanish TAKS/TAKS(Acc) Mathematics 82. TAKS (SP) Writing ... Spanish TAKS/TAKS(Acc) Writing
86. TAKS (SP) Sci ......... Spanish TAKS/TAKS(Acc) Science
TAKS-MODIFIED90. TAKS-M Read ......... TAKS-M Reading/ELA 105. TAKS-M Math .......... TAKS-M Mathematics
120. TAKS-M Writing ....... TAKS-M Writing 127. TAKS-M SS ............. TAKS-M Social Studies
135. TAKS-M Science ..... TAKS-M Science
ITBS / LOGRAMOS149. ITBS Read ............... ITBS/ITED Reading 153. ITBS Math ............... ITBS/ITED Mathematics
161. LOG Read ............... Logramos Reading
ENGLISH PROFICIENCY163. WMLS ...................... Woodcock-Muñoz Language Survey 164. TELPAS ................... Texas English Language Proficiency Assessment System
COLLEGE READINESS167. SAT/ACT ................. SAT/ACT Average Scores for Seniors 168. PSAT ....................... PSAT Average Scores for Juniors
169. AP ............................ Advanced Placement (AP) Exams
LOCAL ASSESSMENT170. ACP ......................... Assessments of Course Performance
July 29, 2011 Dallas ISD Evaluation & Accountability (Data Analysis, Research, and Reporting Services) V:\CILT\1112\CILT_1012.mdb rpt_CONTENTS 2011-12 Campus Data Packet
DISTRICT SUMMARY 2

Notes, Definitions, and Data DescriptionsNotes
Student percentages are computed as the percentage of total student enrollment.•
Additional statistics are available in ENROLLMENT and TEACHER reports.•
“Economically disadvantaged” students are those who qualify for free or reduced-price lunch through the federal government's program.•Teacher demographics and assignments are those reported to the TEA in the Public Education Information Management System (PEIMS) submission for the district.•
2010-11 SCHOOL SUMMARY
Race/ethnic categories are based on the newest federal standards for ethinicity and race reporting, though some categories have been combined because of small group sizes. Students reporting their ethinicity as “Hispanic” are not counted in any race category.
•
Statistics are based on the school's enrollment at the end of the fifth six-weeks grading period.•
“Economically disadvantaged” students are those receiving free or reduced-price lunches.•
The “retention rate” is the percentage of students in the same grade at the end of the fifth six-weeks grading period for both 2009-10 and 2010-11.•“New” students were new to the district in 2010-11. They are counted as new if not enrolled in a district campus before the last day of the 2009-10 school year.•
ENROLLMENT
For 2010-11, race/ethnic categories are based on the newest federal standards for ethinicity and race reporting, though some categories have been combined because of small group sizes; students reporting their ethinicity as “Hispanic” are not counted in any race category. For prior years, race/ethnicity is based on the previous categories.
•
• Statistics are based on student attendance through the end of the sixth six-weeks grading period (the end of the school year).• “Average daily membership” is the total number of school days students were ENROLLED divided by the number of school days in the year.• The “average daily attendance” number (N) is the total number of school days students were IN ATTENDANCE divided by the number of school days in the year. The “average
daily attendance” percentage (%) is the average attendance rate. For each student, the number of days attended is divided by the number of days enrolled. This rate is then averaged across students.
• The number (N) of “yearly transactions” is the total number of transfer and withdrawal transactions in the school year. The percentage (%) is the number of transactions divided by “average daily membership,” which gives (on average) the percentage of the membership associated with a transaction.
• “Continuously enrolled” students are enrolled for a minimum number of instructional days between the beginning of the school year and the first day of the main TAKS testing period. This number varies from 125 to 130 depending on the calendar in a particular school year.
• The “stability rate” is the number of continuously enrolled students divided by “average daily membership.”
ATTENDANCE
• Teacher demographics and assignments are those reported to the TEA in the Public Education Information Management System (PEIMS) submission for the district.
TEACHERS
• Teacher absences counted towards the average DO NOT include vacation days (coded as VAC in personnel database).• Retention rate for a school year is computed with numerator “# teachers assigned to the school both that year and the year prior” and denominator “# of teachers assigned to
the school for the prior year”. That is, the retention rate is the percentage of the prior year's teachers who continued at the school.
July 29, 2011 Dallas ISD Evaluation & Accountability (Data Analysis, Research, and Reporting Services) V:\CILT\1112\CILT_1012.mdb rpt_NOTES 2011-12 Campus Data Packet
DISTRICT SUMMARY 3

Notes, Definitions, and Data DescriptionsNotes
Cells marked with an asterisk (*) indicate five or fewer students were tested. Blank cells indicate no students were tested.••
•
••
Student group assignments are those reported to the TEA in the Public Education Information Management System (PEIMS) submission for the district.
Cell shading for percentage meeting standard is based on the AEIS or AYP minimum requirement for 2012, whichever is higher for the subject test.
Statistics on the objective performance summaries are averages for all students in the grade indicated.An “average percentage correct” is computed as follows: for each student, divide the number of items correctly answered by the total number of items in the test section, then compute the average percentage for all students. For written compositions, an “average composition rating” is presented. TAKS compositions are rated on a scale of 1 to 4.
• TAKS statistics are based on both TAKS and TAKS-Accommodated results. TAKS-M statistics are based exclusively on TAKS-M results.
TAKS and TAKS-Modified
••
Cells marked with an asterisk (*) indicate five or fewer students were tested. Blank cells indicate no students were tested.Student group assignments are based on demographic data in the Dallas ISD student database.
• Kindergarten ITBS reading statistics are based on the Reading Profile Total (a combination of the Vocabulary, Word Analysis, and Listening subtests) for all years available. All other grades' ITBS reading statistics, and Logramos reading statistics for all grades, are based on Reading Total results. (Reading Total results are not available with use of the ITBS level 5R form administered in kindergarten.) “Number tested” statistics include kindergarten.
• Kindergarten ITBS mathematics statistics are based on the Mathematics subtest. All other grades' statistics reflect Mathematics Total results. (Mathematics Total summaries are not available with use of the ITBS level 5R form administered in kindergarten.) “Number tested” statistics include kindergarten.
• Mathematics Total results used for data packets are combinations of the Mathematics Concepts, Problems, and Computation subtest results. For schools who did not administer Mathematics Concepts or Mathematics Problems to their students, Mathematics Computation statistics are provided separately.
SCE COMPLIANCE and ITBS / ITED / LOGRAMOS
•
• If a student's composite rating did not increase at least one level from 2010 to 2011, the TEA did not report the 2010 composite rating.
Students are counted as having tested if any one of the four domains is rated. Because a TELPAS composite rating is not assigned to a student unless all four domains are rated, the number of TELPAS composite ratings may be smaller than the number tested.
• If a student is rated as advanced high in 2011, the TEA does not differentiate between the advanced and advanced high levels from 2010.
TELPAS
• For SAT and ACT “Percent Tested” is computed with “Number Tested” as numerator and, as demoninator, the Grade 12 “Enrollment” reported on Enrollment (1) and Enrollment (2) reports. For PSAT the denominator for “Percent Tested” is from the appropriate grade/year on the Enrollment reports.
• SAT scores range from 200 to 800. SAT administrations are offered throughout the school year. If a student has results from multiple administrations, only the latest is used.• ACT scores range from 0 to 36. ACT administrations are offered throughout the school year. If a student has results from multiple administrations, only the latest is used.• PSAT scores range from 20 to 80. PSAT is administered once in the fall of each year. The district tests all grade 10 students. Statistics for a grade level are based on all
students in that grade level in the fall with a PSAT score on record; the PSAT score may be from a prior school year.• AP scores range from 1 to 5; a minimum of 3 is needed to pass.
Cells marked with an asterisk (*) indicate five or fewer students were tested. Blank cells indicate no students were tested.•
• Score summaries for SAT and ACT contain all scores available for the schoool year at the time of publication.
• AP scores from May are not always received in time for processing and inclusion in data packets. The prior year's statistics will be reported if the latest results are not available. Check the report header to verify the test year.
COLLEGE READINESS
July 29, 2011 Dallas ISD Evaluation & Accountability (Data Analysis, Research, and Reporting Services) V:\CILT\1112\CILT_1012.mdb rpt_NOTES 2011-12 Campus Data Packet
DISTRICT SUMMARY 4

Notes, Definitions, and Data DescriptionsNotes
•
• Raw scores on the ACPs (percentage of items correct) are scaled each year to maintain similar annual passing rates for the district.
The ACPs are given as final course exams in grades 7-12. They account for a portion of students' final semester grades: 15 percent for high school and 10 percent for middle school. “Average course mark (no ACP)” is computed from semester grades before factoring in ACP scores.
• A scale score of at least 70 percent is required to pass an ACP. A course mark of at least 70 percent is required to pass a course.
Cells marked with an asterisk (*) indicate five or fewer students were tested. Blank cells indicate no students were tested.•
ACP
July 29, 2011 Dallas ISD Evaluation & Accountability (Data Analysis, Research, and Reporting Services) V:\CILT\1112\CILT_1012.mdb rpt_NOTES 2011-12 Campus Data Packet
DISTRICT SUMMARY 5

Summary 2010-11 Group Summary Statistics
Grade
STUDENT ENROLLMENT
Enrollment
PK 8,416
KN 13,638
1 13,821
2 13,412
3 13,001
4 12,874
5 12,067
6 10,397
7 10,348
8 10,131
9 10,755
10 9,728
11 8,072
12 8,002
ALL 154,662
STUDENT AND TEACHER RACE/ETHNICITY
Students
Number Percent Number PercentEthnicity/Race
Black/African American
American Indian/Alaska Native
Asian/Hawaiian/Pacific Islander
Hispanic
White
Multiple
38,517 24.9
828 0.5
1,729 1.1
105,874 68.5
6,973 4.5
4,007 37.5
2,744 25.7
3,415 31.9
229 2.1
* *
* *
659 0.4
SELECT STUDENT GROUP ENROLLMENT
Number PercentGroup
Economically disadvantaged
Limited English proficient (LEP)
Special education
135,689 87.7
59,380 38.4
11,699 7.6
*For teachers, “Other” category includes American Indican/Alaska Native and Asian/Haw aiian/Pacif ic Islander.
Not reported (students only) — —82 0.1
Other* (teachers only) 302 2.8— —
Talented and Gifted (TAG) 18,593 12.0
At-Risk 98,781 63.9
Teachers
July 29, 2011 Dallas ISD Evaluation & Accountability (Data Analysis, Research, and Reporting Services) V:\CILT\1112\CILT_1012.mdb rpt_SUMMARY 2011-12 Campus Data Packet
DISTRICT SUMMARY 6

N %
Asian
%NN %%
Hispanic
N N %Grade Year
African American American Indian
Enrollment
White
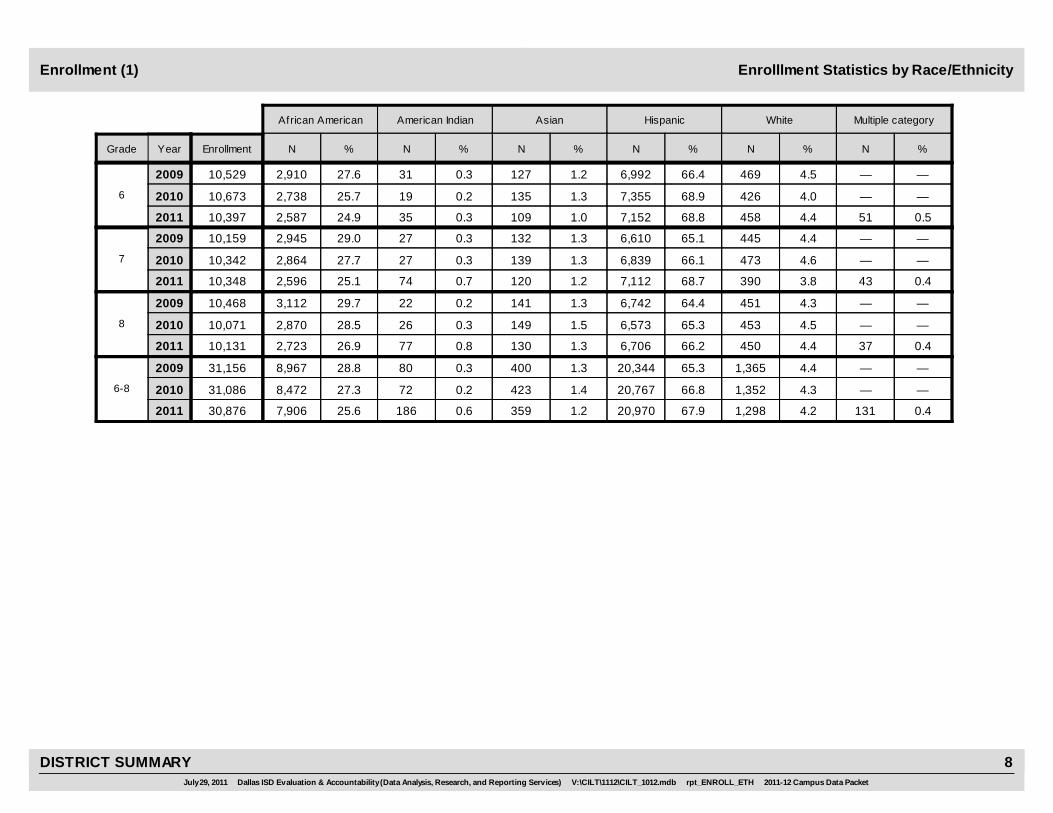
Enrolllment Statistics by Race/EthnicityEnrollment (1)
N %
Multiple category
2011
2009
2010
0.8
0.6
0.6
66
49
47
0.1
0.1
0.6
12
10
47
76.4
78.0
76.5
6,501
6,651
6,441
20.8
19.5
19.9
1,771
1,661
1,678
1.9
1.8
2.2
164
154
189
PK
8,416
8,525
8,514 —
—
0.2
—
—
13
2011
2009
2010
1.1
1.1
1.0
155
148
139
0.2
0.2
0.4
25
24
57
70.4
69.2
70.3
9,532
9,306
9,586
24.0
24.1
22.5
3,257
3,241
3,068
4.3
5.4
5.3
577
723
727
KN
13,638
13,442
13,546 —
—
0.4
—
—
54
2011
2009
2010
0.9
1.2
0.9
134
173
129
0.2
0.2
0.3
25
33
45
69.4
69.9
69.9
9,909
9,821
9,666
25.1
24.5
23.4
3,584
3,437
3,229
4.4
4.1
4.9
623
578
671
1
13,821
14,042
14,275 —
—
0.6
—
—
77
2011
2009
2010
1.0
1.1
1.0
140
154
133
0.2
0.2
0.3
32
25
41
68.3
69.0
70.8
9,520
9,372
9,501
25.7
25.2
23.2
3,588
3,418
3,109
4.7
4.5
4.0
658
611
543
2
13,412
13,580
13,938 —
—
0.6
—
—
77
2011
2009
2010
1.0
1.0
1.0
134
140
126
0.2
0.2
0.3
24
30
36
69.1
68.8
70.5
9,069
9,278
9,169
25.4
25.2
23.7
3,334
3,399
3,075
4.2
4.7
4.1
557
635
531
3
13,001
13,482
13,118 —
—
0.5
—
—
60
2011
2009
2010
0.9
1.2
1.0
110
148
124
0.1
0.2
0.2
18
22
27
67.8
69.3
69.8
8,226
8,599
8,980
26.6
25.1
24.2
3,226
3,118
3,118
4.6
4.3
4.3
554
530
556
4
12,874
12,417
12,134 —
—
0.5
—
—
65
2011
2009
2010
1.1
1.0
1.1
126
122
131
0.2
0.2
0.3
23
23
41
68.7
68.4
70.3
8,161
8,077
8,479
25.8
25.8
24.0
3,061
3,050
2,893
4.2
4.6
4.0
501
541
479
5
12,067
11,813
11,872 —
—
0.3
—
—
40
2011
2009
2010
1.0
1.1
1.0
869
934
829
0.2
0.2
0.3
159
167
294
69.7
70.0
70.9
61,237
61,104
61,822
25.0
24.4
23.1
21,958
21,324
20,170
4.2
4.3
4.2
3,681
3,772
3,696
PK-5
87,229
87,301
87,904 —
—
0.4
—
—
386
July 29, 2011 Dallas ISD Evaluation & Accountability (Data Analysis, Research, and Reporting Services) V:\CILT\1112\CILT_1012.mdb rpt_ENROLL_ETH 2011-12 Campus Data Packet
DISTRICT SUMMARY 7
N %
Asian
%NN %%
Hispanic
N N %Grade Year
African American American Indian
Enrollment
White
Enrolllment Statistics by Race/EthnicityEnrollment (1)
N %
Multiple category
2011
2009
2010
1.2
1.3
1.0
127
135
109
0.3
0.2
0.3
31
19
35
66.4
68.9
68.8
6,992
7,355
7,152
27.6
25.7
24.9
2,910
2,738
2,587
4.5
4.0
4.4
469
426
458
6
10,397
10,673
10,529 —
—
0.5
—
—
51
2011
2009
2010
1.3
1.3
1.2
132
139
120
0.3
0.3
0.7
27
27
74
65.1
66.1
68.7
6,610
6,839
7,112
29.0
27.7
25.1
2,945
2,864
2,596
4.4
4.6
3.8
445
473
390
7
10,348
10,342
10,159 —
—
0.4
—
—
43
2011
2009
2010
1.3
1.5
1.3
141
149
130
0.2
0.3
0.8
22
26
77
64.4
65.3
66.2
6,742
6,573
6,706
29.7
28.5
26.9
3,112
2,870
2,723
4.3
4.5
4.4
451
453
450
8
10,131
10,071
10,468 —
—
0.4
—
—
37
2011
2009
2010
1.3
1.4
1.2
400
423
359
0.3
0.2
0.6
80
72
186
65.3
66.8
67.9
20,344
20,767
20,970
28.8
27.3
25.6
8,967
8,472
7,906
4.4
4.3
4.2
1,365
1,352
1,298
6-8
30,876
31,086
31,156 —
—
0.4
—
—
131
July 29, 2011 Dallas ISD Evaluation & Accountability (Data Analysis, Research, and Reporting Services) V:\CILT\1112\CILT_1012.mdb rpt_ENROLL_ETH 2011-12 Campus Data Packet
DISTRICT SUMMARY 8

N %
Asian
%NN %%
Hispanic
N N %Grade Year
African American American Indian
Enrollment
White
Enrolllment Statistics by Race/EthnicityEnrollment (1)
N %
Multiple category
2011
2009
2010
1.7
2.2
1.7
209
259
183
0.2
0.2
0.9
23
24
97
63.2
64.1
65.0
7,747
7,610
6,996
30.1
28.7
27.0
3,693
3,414
2,904
4.8
4.8
4.9
591
573
530
9
10,755
11,880
12,263 —
—
0.3
—
—
34
2011
2009
2010
1.2
1.5
1.6
110
141
158
0.3
0.2
0.9
23
15
92
61.0
62.4
63.2
5,519
5,861
6,152
32.2
30.4
28.4
2,911
2,856
2,764
5.3
5.5
5.2
484
516
504
10
9,728
9,389
9,047 —
—
0.5
—
—
50
2011
2009
2010
1.2
1.4
1.3
92
113
102
0.3
0.2
1.0
23
17
81
59.1
60.9
62.2
4,468
4,908
5,022
33.2
31.6
29.2
2,512
2,550
2,356
6.2
5.8
6.0
465
471
484
11
8,072
8,059
7,560 —
—
0.3
—
—
24
2011
2009
2010
1.2
1.2
1.2
88
91
98
0.4
0.3
1.0
27
24
78
57.2
60.1
61.4
4,299
4,602
4,912
34.6
32.4
30.2
2,602
2,479
2,417
6.6
6.1
5.8
495
466
461
12
8,002
7,662
7,511 —
—
0.4
—
—
34
2011
2009
2010
1.4
1.6
1.5
499
604
541
0.3
0.2
1.0
96
80
348
60.6
62.1
63.1
22,033
22,981
23,082
32.2
30.5
28.6
11,718
11,299
10,441
5.6
5.5
5.4
2,035
2,026
1,979
9-12
36,557
36,990
36,381 —
—
0.4
—
—
142
2011
2009
2010
1.1
1.3
1.1
1,768
1,961
1,729
0.2
0.2
0.5
335
319
828
66.7
67.5
68.5
103,614
104,852
105,874
27.4
26.4
24.9
42,643
41,095
38,517
4.6
4.6
4.5
7,081
7,150
6,973
ALL
154,662
155,377
155,441 —
—
0.4
—
—
659
July 29, 2011 Dallas ISD Evaluation & Accountability (Data Analysis, Research, and Reporting Services) V:\CILT\1112\CILT_1012.mdb rpt_ENROLL_ETH 2011-12 Campus Data Packet
DISTRICT SUMMARY 9

N %
At RIsk New (to District)
N %
TAG
N %
Economically Disadvantaged
Grade Year
LEP Special Education
N % N % N %
Retention Rate (%)
Enrollment
Enrollment Statistics by Select Student GroupEnrollment (2)
63.0
58.4
57.7
5,368
4,977
4,852
99.3
98.6
98.1
PK
2011 8,416
8,525
8,514 93.9
95.1
94.0
7,996
8,106
7,909
59.8
59.9
59.6
5,089
5,103
5,019
1.6
1.7
2.1
139
149
173
0.0
0.0
0.0
0
0
0
0.5
1.1
1.1
2009
2010
8,454
8,406
8,260
65.2
63.5
72.3
8,828
8,537
9,861
40.3
40.1
40.0
KN
2011 13,638
13,442
13,546 91.1
91.5
91.0
12,341
12,293
12,415
52.6
50.2
50.4
7,130
6,752
6,869
3.2
3.2
3.5
432
434
478
3.0
2.9
1.9
408
385
258
1.9
1.7
1.8
2009
2010
5,459
5,391
5,461
66.3
69.6
69.9
9,465
9,767
9,664
9.4
9.3
9.1
1
2011 13,821
14,042
14,275 91.9
92.2
91.0
13,117
12,943
12,580
50.8
52.4
50.6
7,256
7,356
6,994
4.9
4.9
5.1
694
682
710
6.7
6.9
7.6
956
975
1,048
6.9
5.7
5.5
2009
2010
1,346
1,303
1,261
75.4
77.1
79.4
10,514
10,473
10,653
8.5
8.2
7.9
2
2011 13,412
13,580
13,938 91.6
92.6
91.9
12,771
12,571
12,328
48.8
50.9
52.6
6,805
6,919
7,055
5.9
5.8
5.8
817
783
782
9.8
9.3
10.2
1,365
1,260
1,374
5.2
4.1
4.6
2009
2010
1,179
1,112
1,054
72.6
73.6
75.1
9,518
9,922
9,758
8.5
7.8
7.9
3
2011 13,001
13,482
13,118 91.3
92.4
92.5
11,981
12,463
12,029
48.4
49.2
51.4
6,343
6,630
6,688
6.9
7.2
6.9
910
976
896
11.5
11.5
11.5
1,510
1,552
1,496
3.6
3.0
3.0
2009
2010
1,111
1,049
1,031
59.7
61.4
62.6
7,238
7,623
8,061
7.8
7.6
7.7
4
2011 12,874
12,417
12,134 90.6
91.9
91.8
10,988
11,417
11,817
44.0
48.0
49.3
5,337
5,961
6,347
9.4
8.3
8.6
1,142
1,034
1,109
14.9
14.8
16.3
1,811
1,839
2,096
1.7
1.3
1.5
2009
2010
946
943
990
55.1
54.9
65.1
6,539
6,483
7,855
7.2
7.3
6.9
5
2011 12,067
11,813
11,872 90.4
91.7
92.1
10,738
10,832
11,108
30.3
33.7
48.6
3,597
3,983
5,862
9.3
10.1
8.8
1,107
1,192
1,066
17.4
16.8
17.9
2,065
1,988
2,162
2.3
2.2
2.3
2009
2010
856
867
828
65.4
66.2
69.6
57,476
57,782
60,704
22.3
21.8
21.6
PK-5
2011 87,229
87,301
87,904 91.4
92.4
91.9
80,353
80,625
80,186
47.3
48.9
51.4
41,564
42,704
44,834
6.5
6.0
6.0
5,745
5,250
5,214
9.2
9.2
9.7
8,115
7,999
8,434
3.6
2.9
3.0
2009
2010
19,627
19,071
18,885
July 29, 2011 Dallas ISD Evaluation & Accountability (Data Analysis, Research, and Reporting Services) V:\CILT\1112\CILT_1012.mdb rpt_ENROLL_OTH 2011-12 Campus Data Packet
DISTRICT SUMMARY 10

N %
At RIsk New (to District)
N %
TAG
N %
Economically Disadvantaged
Grade Year
LEP Special Education
N % N % N %
Retention Rate (%)
Enrollment
Enrollment Statistics by Select Student GroupEnrollment (2)
55.2
52.4
53.2
5,807
5,589
5,531
7.5
7.3
7.1
6
2011 10,397
10,673
10,529 88.1
90.3
90.4
9,281
9,635
9,396
27.5
28.1
30.3
2,893
2,995
3,152
9.8
9.9
10.7
1,029
1,061
1,116
11.9
13.8
17.5
1,256
1,470
1,817
1.0
1.0
1.2
2009
2010
791
779
738
57.1
54.4
56.0
5,797
5,630
5,797
8.4
8.1
7.5
7
2011 10,348
10,342
10,159 84.9
87.7
87.8
8,621
9,065
9,084
21.3
26.1
27.9
2,166
2,701
2,882
10.8
9.7
9.7
1,096
1,007
1,005
15.4
16.0
13.7
1,569
1,659
1,417
2.2
1.6
1.9
2009
2010
852
835
780
62.9
58.5
56.3
6,585
5,892
5,699
7.3
8.1
7.0
8
2011 10,131
10,071
10,468 83.3
85.9
85.9
8,723
8,648
8,701
19.0
20.0
23.9
1,988
2,017
2,422
10.0
10.4
9.2
1,047
1,048
933
14.7
15.4
15.5
1,541
1,554
1,569
2.2
1.8
3.2
2009
2010
762
817
711
58.4
55.0
55.1
18,189
17,111
17,027
7.7
7.8
7.2
6-8
2011 30,876
31,086
31,156 85.5
88.0
88.0
26,625
27,348
27,181
22.6
24.8
27.4
7,047
7,713
8,456
10.2
10.0
9.9
3,172
3,116
3,054
14.0
15.1
15.6
4,366
4,683
4,803
1.8
1.4
2.1
2009
2010
2,405
2,431
2,229
July 29, 2011 Dallas ISD Evaluation & Accountability (Data Analysis, Research, and Reporting Services) V:\CILT\1112\CILT_1012.mdb rpt_ENROLL_OTH 2011-12 Campus Data Packet
DISTRICT SUMMARY 11

N %
At RIsk New (to District)
N %
TAG
N %
Economically Disadvantaged
Grade Year
LEP Special Education
N % N % N %
Retention Rate (%)
Enrollment
Enrollment Statistics by Select Student GroupEnrollment (2)
65.9
60.5
56.8
8,079
7,188
6,112
12.9
13.6
14.2
9
2011 10,755
11,880
12,263 77.4
80.0
79.7
9,487
9,507
8,576
21.9
21.0
20.9
2,686
2,494
2,253
10.7
9.8
9.9
1,311
1,166
1,066
13.3
12.8
12.7
1,636
1,522
1,364
18.9
11.3
8.9
2009
2010
1,579
1,614
1,532
65.6
62.4
60.8
5,938
5,863
5,915
5.8
6.5
6.0
10
2011 9,728
9,389
9,047 74.1
77.6
77.6
6,700
7,289
7,549
17.3
16.9
15.8
1,562
1,583
1,536
9.9
9.3
8.6
892
870
841
16.8
15.8
14.5
1,524
1,488
1,415
6.8
4.8
4.5
2009
2010
524
614
584
66.5
65.3
56.6
5,026
5,263
4,570
5.2
5.5
5.3
11
2011 8,072
8,059
7,560 71.9
75.2
77.5
5,438
6,061
6,253
14.2
15.6
13.9
1,075
1,257
1,126
8.3
9.2
9.0
627
741
730
20.0
17.0
16.8
1,512
1,372
1,354
3.1
2.7
2.1
2009
2010
392
445
430
60.1
56.4
55.6
4,515
4,319
4,453
3.2
3.2
3.1
12
2011 8,002
7,662
7,511 68.7
72.2
74.3
5,159
5,531
5,944
13.8
14.5
14.7
1,036
1,114
1,175
9.8
9.6
9.9
736
732
794
18.1
17.5
15.3
1,358
1,339
1,223
5.4
4.8
4.7
2009
2010
239
245
252
64.8
61.2
57.6
23,558
22,633
21,050
7.5
7.9
7.7
9-12
2011 36,557
36,990
36,381 73.6
76.7
77.5
26,784
28,388
28,322
17.5
17.4
16.7
6,359
6,448
6,090
9.8
9.5
9.4
3,566
3,509
3,431
16.6
15.5
14.7
6,030
5,721
5,356
9.8
6.4
5.3
2009
2010
2,734
2,918
2,798
63.8
62.8
63.9
99,223
97,526
98,781
15.9
15.7
15.5
ALL
2011 154,662
155,377
155,441 86.1
87.8
87.7
133,762
136,361
135,689
35.4
36.6
38.4
54,970
56,865
59,380
8.0
7.6
7.6
12,483
11,875
11,699
11.9
11.8
12.0
18,511
18,403
18,593
4.7
3.4
3.3
2009
2010
24,766
24,420
23,912
July 29, 2011 Dallas ISD Evaluation & Accountability (Data Analysis, Research, and Reporting Services) V:\CILT\1112\CILT_1012.mdb rpt_ENROLL_OTH 2011-12 Campus Data Packet
DISTRICT SUMMARY 12
Stability Rate (%)
District
ContinuouslyEnrolled (N)
District DistrictDistrict (N)District
Average DailyMembership (N)
Average Daily Attendance Yearly TransactionsGrade Year
District (N) District (%)District District (N) District (%) District (%) District (%) District
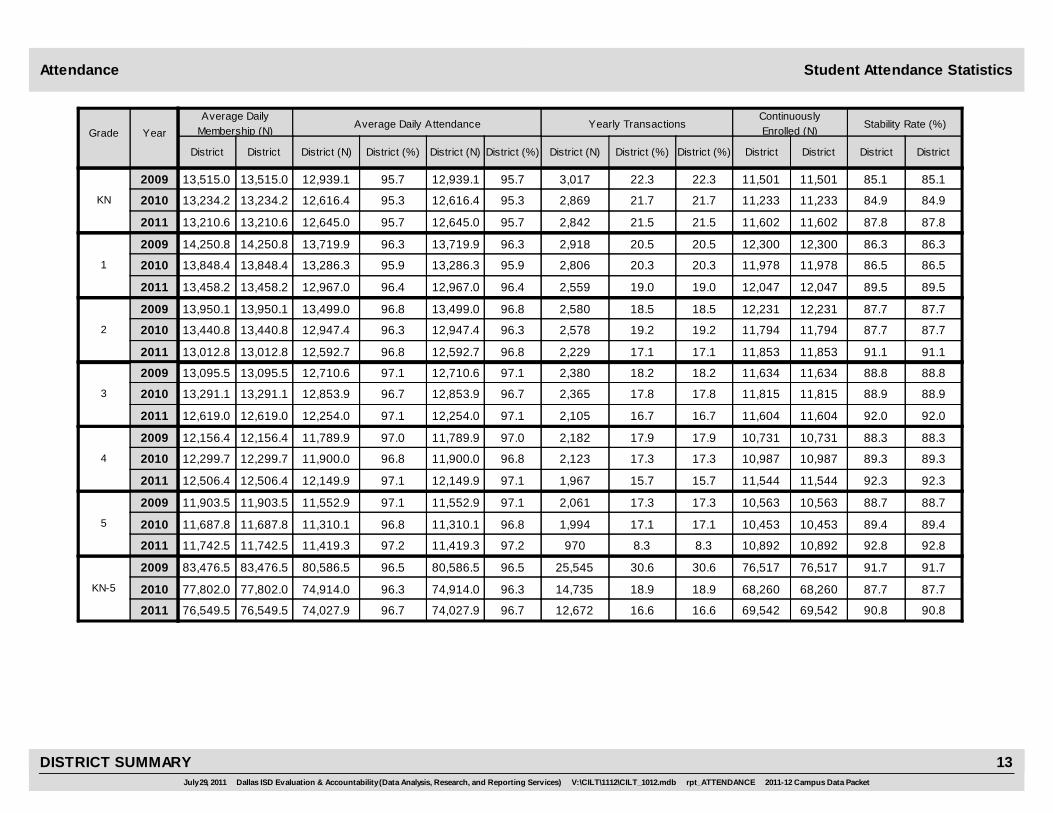
Student Attendance StatisticsAttendance
85.1
87.8
84.9
11,501
11,602
11,233
11,501
11,602
11,233
3,017
2,842
2,869KN
2009 95.712,939.1 22.3 22.3
2010
2011 95.712,645.0 21.5 21.5
95.312,616.4 21.7 21.7
13,515.0
13,210.6
13,234.2
95.7
95.7
95.3
12,939.1
12,645.0
12,616.4
85.1
87.8
84.9
13,515.0
13,210.6
13,234.2
86.3
89.5
86.5
12,300
12,047
11,978
12,300
12,047
11,978
2,918
2,559
2,8061
2009 96.313,719.9 20.5 20.5
2010
2011 96.412,967.0 19.0 19.0
95.913,286.3 20.3 20.3
14,250.8
13,458.2
13,848.4
96.3
96.4
95.9
13,719.9
12,967.0
13,286.3
86.3
89.5
86.5
14,250.8
13,458.2
13,848.4
87.7
91.1
87.7
12,231
11,853
11,794
12,231
11,853
11,794
2,580
2,229
2,5782
2009 96.813,499.0 18.5 18.5
2010
2011 96.812,592.7 17.1 17.1
96.312,947.4 19.2 19.2
13,950.1
13,012.8
13,440.8
96.8
96.8
96.3
13,499.0
12,592.7
12,947.4
87.7
91.1
87.7
13,950.1
13,012.8
13,440.8
88.8
92.0
88.9
11,634
11,604
11,815
11,634
11,604
11,815
2,380
2,105
2,3653
2009 97.112,710.6 18.2 18.2
2010
2011 97.112,254.0 16.7 16.7
96.712,853.9 17.8 17.8
13,095.5
12,619.0
13,291.1
97.1
97.1
96.7
12,710.6
12,254.0
12,853.9
88.8
92.0
88.9
13,095.5
12,619.0
13,291.1
88.3
92.3
89.3
10,731
11,544
10,987
10,731
11,544
10,987
2,182
1,967
2,1234
2009 97.011,789.9 17.9 17.9
2010
2011 97.112,149.9 15.7 15.7
96.811,900.0 17.3 17.3
12,156.4
12,506.4
12,299.7
97.0
97.1
96.8
11,789.9
12,149.9
11,900.0
88.3
92.3
89.3
12,156.4
12,506.4
12,299.7
88.7
92.8
89.4
10,563
10,892
10,453
10,563
10,892
10,453
2,061
970
1,9945
2009 97.111,552.9 17.3 17.3
2010
2011 97.211,419.3 8.3 8.3
96.811,310.1 17.1 17.1
11,903.5
11,742.5
11,687.8
97.1
97.2
96.8
11,552.9
11,419.3
11,310.1
88.7
92.8
89.4
11,903.5
11,742.5
11,687.8
91.7
90.8
87.7
76,517
69,542
68,260
76,517
69,542
68,260
25,545
12,672
14,735KN-5
2009 96.580,586.5 30.6 30.6
2010
2011 96.774,027.9 16.6 16.6
96.374,914.0 18.9 18.9
83,476.5
76,549.5
77,802.0
96.5
96.7
96.3
80,586.5
74,027.9
74,914.0
91.7
90.8
87.7
83,476.5
76,549.5
77,802.0
July 29, 2011 Dallas ISD Evaluation & Accountability (Data Analysis, Research, and Reporting Services) V:\CILT\1112\CILT_1012.mdb rpt_ATTENDANCE 2011-12 Campus Data Packet
DISTRICT SUMMARY 13

Stability Rate (%)
District
ContinuouslyEnrolled (N)
District DistrictDistrict (N)District
Average DailyMembership (N)
Average Daily Attendance Yearly TransactionsGrade Year
District (N) District (%)District District (N) District (%) District (%) District (%) District
Student Attendance StatisticsAttendance
86.2
89.6
85.7
9,131
9,074
9,083
9,131
9,074
9,083
2,107
1,754
1,9736
2009 96.010,165.3 19.9 19.9
2010
2011 96.29,742.1 17.3 17.3
95.410,110.8 18.6 18.6
10,588.3
10,126.2
10,602.4
96.0
96.2
95.4
10,165.3
9,742.1
10,110.8
86.2
89.6
85.7
10,588.3
10,126.2
10,602.4
82.8
87.4
81.0
8,389
8,791
8,310
8,389
8,791
8,310
2,639
2,292
2,3027
2009 94.79,601.8 26.0 26.0
2010
2011 95.39,588.9 22.8 22.8
93.99,636.4 22.4 22.4
10,135.8
10,058.0
10,258.0
94.7
95.3
93.9
9,601.8
9,588.9
9,636.4
82.8
87.4
81.0
10,135.8
10,058.0
10,258.0
80.3
85.4
79.0
8,477
8,465
7,894
8,477
8,465
7,894
2,977
1,757
1,5638
2009 94.39,945.8 28.2 28.2
2010
2011 94.89,388.4 17.7 17.7
93.39,325.9 15.6 15.6
10,551.1
9,906.7
9,995.5
94.3
94.8
93.3
9,945.8
9,388.4
9,325.9
80.3
85.4
79.0
10,551.1
9,906.7
9,995.5
83.1
87.5
82.0
25,997
26,330
25,287
25,997
26,330
25,287
7,723
5,803
5,8386-8
2009 95.029,712.9 24.7 24.7
2010
2011 95.428,719.4 19.3 19.3
94.229,073.2 18.9 18.9
31,275.2
30,090.9
30,855.9
95.0
95.4
94.2
29,712.9
28,719.4
29,073.2
83.1
87.5
82.0
31,275.2
30,090.9
30,855.9
July 29, 2011 Dallas ISD Evaluation & Accountability (Data Analysis, Research, and Reporting Services) V:\CILT\1112\CILT_1012.mdb rpt_ATTENDANCE 2011-12 Campus Data Packet
DISTRICT SUMMARY 14

Stability Rate (%)
District
ContinuouslyEnrolled (N)
District DistrictDistrict (N)District
Average DailyMembership (N)
Average Daily Attendance Yearly TransactionsGrade Year
District (N) District (%)District District (N) District (%) District (%) District (%) District
Student Attendance StatisticsAttendance
72.0
79.4
69.6
8,973
8,460
8,320
8,973
8,460
8,320
4,862
3,221
3,9309
2009 91.511,404.9 39.0 39.0
2010
2011 92.79,881.3 30.2 30.2
90.110,769.5 32.9 32.9
12,462.6
10,654.7
11,951.9
91.5
92.7
90.1
11,404.9
9,881.3
10,769.5
72.0
79.4
69.6
12,462.6
10,654.7
11,951.9
78.0
83.2
73.6
7,250
8,048
6,991
7,250
8,048
6,991
2,083
2,116
2,26310
2009 92.78,619.9 22.4 22.4
2010
2011 93.39,027.4 21.9 21.9
91.08,652.0 23.8 23.8
9,294.3
9,678.7
9,504.1
92.7
93.3
91.0
8,619.9
9,027.4
8,652.0
78.0
83.2
73.6
9,294.3
9,678.7
9,504.1
82.4
84.4
75.5
6,194
6,764
6,143
6,194
6,764
6,143
1,280
1,499
1,55611
2009 93.06,985.9 17.0 17.0
2010
2011 93.37,476.3 18.7 18.7
91.17,411.5 19.1 19.1
7,512.5
8,013.0
8,136.9
93.0
93.3
91.1
6,985.9
7,476.3
7,411.5
82.4
84.4
75.5
7,512.5
8,013.0
8,136.9
79.2
84.9
79.3
6,098
6,655
6,040
6,098
6,655
6,040
1,140
1,378
1,33812
2009 92.87,148.0 14.8 14.8
2010
2011 93.27,299.5 17.6 17.6
92.27,023.7 17.6 17.6
7,701.9
7,835.5
7,621.1
92.8
93.2
92.2
7,148.0
7,299.5
7,023.7
79.2
84.9
79.3
7,701.9
7,835.5
7,621.1
77.1
82.7
73.9
28,515
29,927
27,494
28,515
29,927
27,494
9,365
8,214
9,0879-12
2009 92.434,158.7 25.3 25.3
2010
2011 93.133,684.5 22.7 22.7
91.033,856.7 24.4 24.4
36,971.3
36,181.9
37,214.0
92.4
93.1
91.0
34,158.7
33,684.5
33,856.7
77.1
82.7
73.9
36,971.3
36,181.9
37,214.0
86.4
88.1
83.0
131,029
125,799
121,041
131,029
125,799
121,041
42,633
26,689
29,660ALL
2009 95.2144,458.0 28.1 28.1
2010
2011 95.5136,431.8 18.7 18.7
94.5137,843.9 20.3 20.3
151,723.0
142,822.2
145,872.0
95.2
95.5
94.5
144,458.0
136,431.8
137,843.9
86.4
88.1
83.0
151,723.0
142,822.2
145,872.0
July 29, 2011 Dallas ISD Evaluation & Accountability (Data Analysis, Research, and Reporting Services) V:\CILT\1112\CILT_1012.mdb rpt_ATTENDANCE 2011-12 Campus Data Packet
DISTRICT SUMMARY 15
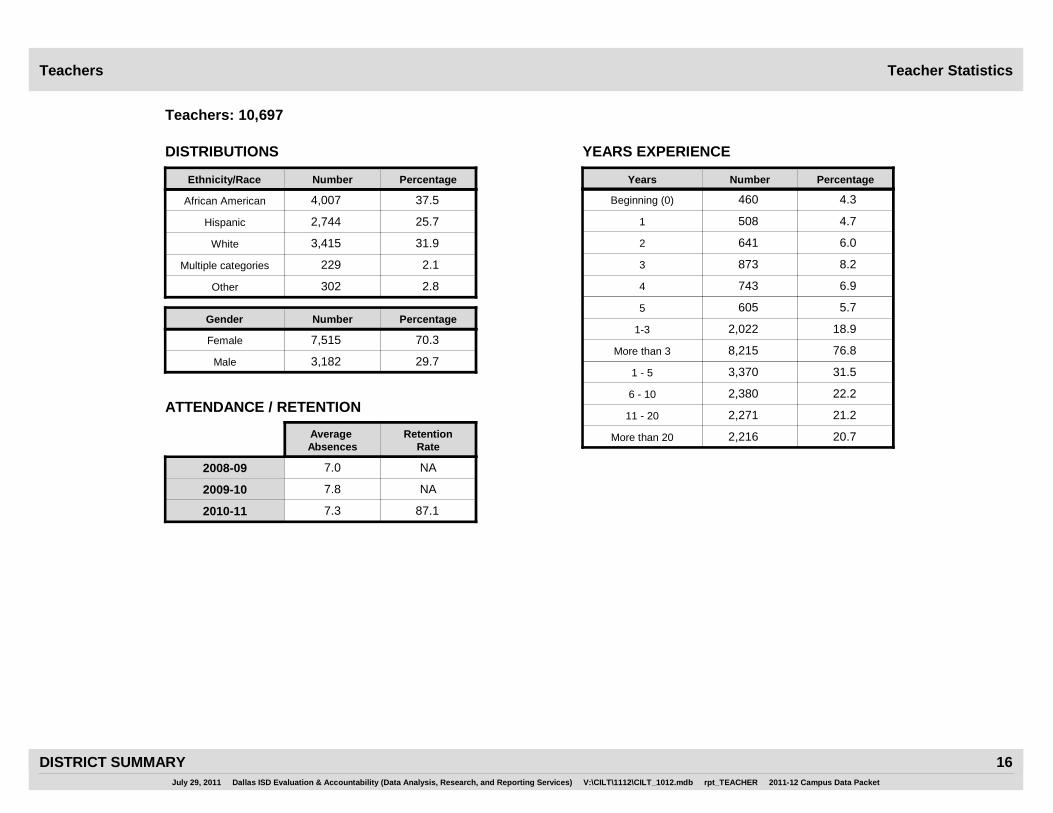
Teacher StatisticsTeachers
4.3
Percentage
460Beginning (0)
3,3701 - 5
2,3806 - 10
2,27111 - 20
2,216More than 20
Years Number
87.1
NA
NA
229
70.37,515
29.73,182
2.1
25.72,744
37.54,007
31.93,415White
African American
Hispanic
Multiple categories
Male
Female
7.8
7.0
Number PercentageEthnicity/Race
DISTRIBUTIONS YEARS EXPERIENCE
Teachers: 10,697
7.3
Average Absences
RetentionRate
31.5
22.2
21.2
20.7
2008-09
2009-10
2010-11
Number PercentageGender
4.75081
6.06412
8.28733
18.92,0221-3
6.97434
5.76055
8,215More than 3 76.8
302 2.8Other
ATTENDANCE / RETENTION
July 29, 2011 Dallas ISD Evaluation & Accountability (Data Analysis, Research, and Reporting Services) V:\CILT\1112\CILT_1012.mdb rpt_TEACHER 2011-12 Campus Data Packet
DISTRICT SUMMARY 16

FemaleMigrant MaleAt RiskWhite AfricanAmer
Hispanic EconDisadv
SpecialEduc
LEP All DistrictYearGrade Number Tested(All Students)
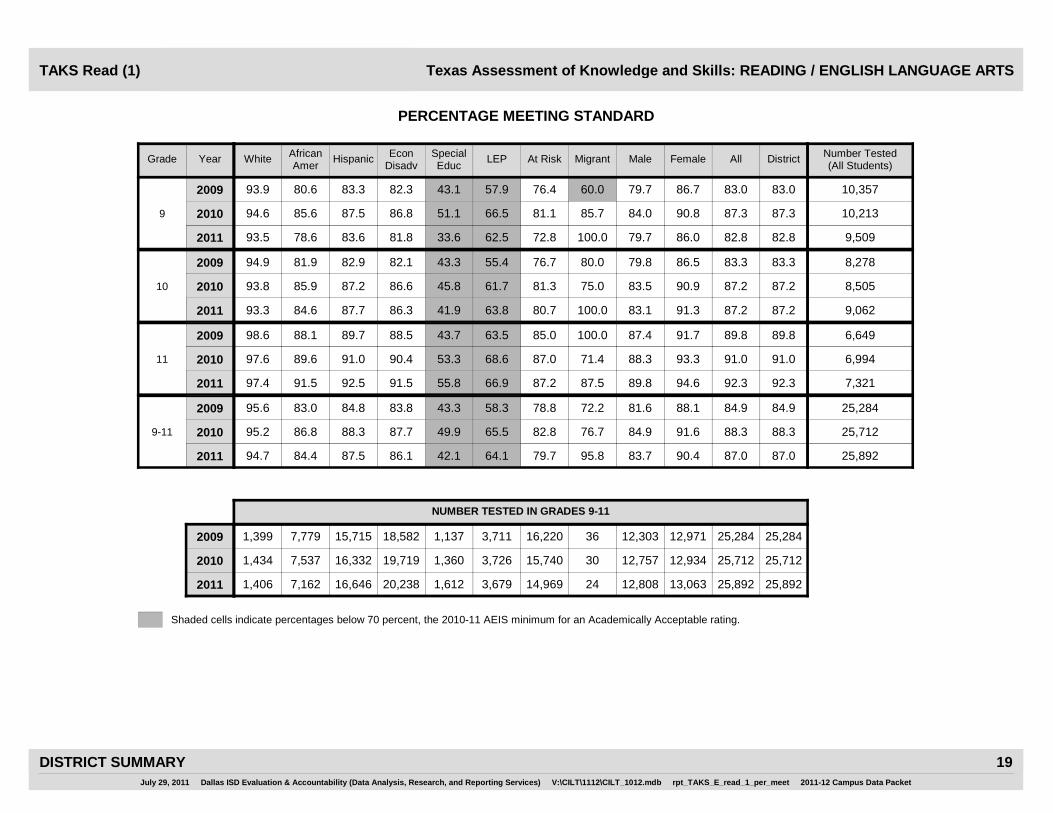
Texas Assessment of Knowledge and Skills: READING / ENGLISH LANGUAGE ARTS
PERCENTAGE MEETING STANDARD
TAKS Read (1)
* 79.2 85.0
* 85.6 89.0
* 83.2 87.5
82.02011 91.9 77.7 84.1 80.8 59.1 78.8 82.0 6,76174.2
3
87.32009 94.5 83.4 89.5 86.2 72.3 85.6 87.3 7,55881.8
85.42010 94.8 80.5 87.8 84.2 65.6 85.6 85.4 7,09477.1
* 76.8 80.6
71.4 71.9 79.6
* 75.9 79.9
78.62011 93.1 74.7 79.3 77.0 52.7 73.0 78.6 7,05163.9
4
75.82009 88.0 71.8 76.5 74.3 47.6 70.6 75.8 10,11365.7
77.92010 91.9 72.1 80.0 76.3 49.0 72.9 77.9 7,41054.9
100.0 87.4 90.7
50.0 81.0 84.7
75.0 84.0 88.2
89.02011 96.4 87.8 89.0 88.4 71.5 85.3 89.0 8,36982.3
5
82.92009 91.9 81.9 82.5 81.8 59.4 68.2 82.9 10,45571.0
86.12010 92.6 85.2 85.9 85.2 64.6 75.4 86.1 10,24771.1
88.9 81.6 85.7
65.5 79.0 84.0
77.8 81.3 85.5
83.62011 93.7 79.9 84.8 82.5 61.5 81.2 83.6 22,18174.9
3-5
81.52009 91.5 79.1 81.7 80.3 58.7 72.2 81.5 28,12672.1
83.42010 93.2 79.2 84.7 82.3 59.6 76.4 83.4 24,75169.7
9 11,257 10,898
29 14,030 14,065
18 12,325 12,408
22,1812011 1,457 11,9368,291 19,542 1,153 4,558 22,18111,251
28,1262009 1,503 17,5468,694 24,813 984 7,743 28,12615,273
NUMBER TESTED IN GRADES 3-5
24,7512010 1,587 14,1228,682 21,946 1,065 5,187 24,75110,062
Shaded cells indicate percentages below 70 percent, the 2010-11 AEIS minimum for an Academically Acceptable rating.
July 29, 2011 Dallas ISD Evaluation & Accountability (Data Analysis, Research, and Reporting Services) V:\CILT\1112\CILT_1012.mdb rpt_TAKS_E_read_1_per_meet 2011-12 Campus Data Packet
DISTRICT SUMMARY 17

FemaleMigrant MaleAt RiskWhite AfricanAmer
Hispanic EconDisadv
SpecialEduc
LEP All DistrictYearGrade Number Tested(All Students)
Texas Assessment of Knowledge and Skills: READING / ENGLISH LANGUAGE ARTS
PERCENTAGE MEETING STANDARD
TAKS Read (1)
77.8 72.3 80.5
85.7 85.5 87.2
50.0 74.3 82.3
76.42011 89.6 69.6 77.8 75.3 33.1 65.1 76.4 9,56062.9
6
86.42009 95.9 82.6 87.2 85.5 61.9 75.7 86.4 9,50277.4
78.32010 89.9 73.7 79.2 77.3 41.2 63.9 78.3 9,78064.5
78.6 75.3 79.2
87.5 73.7 80.5
100.0 74.1 80.0
77.22011 90.8 72.3 78.0 76.3 34.2 61.3 77.2 9,54163.8
7
77.12009 89.3 73.3 77.8 76.3 36.4 55.2 77.1 9,01564.5
77.12010 92.2 73.9 77.1 75.9 35.6 57.0 77.1 9,43162.7
88.9 85.5 91.0
66.7 89.8 92.6
81.8 86.7 91.0
88.22011 94.4 85.3 89.0 87.4 52.7 74.8 88.2 9,48380.8
8
91.22009 97.1 91.0 90.9 90.7 68.7 74.2 91.2 9,49387.0
88.92010 94.8 86.1 89.5 88.2 50.7 72.5 88.9 9,22482.6
81.3 77.7 83.5
79.4 83.1 86.9
78.1 78.2 84.4
80.62011 91.7 76.0 81.4 79.6 39.9 66.5 80.6 28,58469.3
6-8
85.02009 94.1 82.5 85.4 84.3 55.8 69.3 85.0 28,01076.9
81.32010 92.4 78.0 81.8 80.3 42.6 63.6 81.3 28,43570.2
32 14,266 14,294
34 13,947 14,041
32 14,202 14,211
28,5842011 1,205 19,6117,193 25,152 1,533 7,286 28,58415,533
28,0102009 1,262 18,4477,900 23,606 1,093 5,368 28,01015,842
NUMBER TESTED IN GRADES 6-8
28,4352010 1,259 19,1887,602 24,776 1,440 6,203 28,43515,283
Shaded cells indicate percentages below 70 percent, the 2010-11 AEIS minimum for an Academically Acceptable rating.
July 29, 2011 Dallas ISD Evaluation & Accountability (Data Analysis, Research, and Reporting Services) V:\CILT\1112\CILT_1012.mdb rpt_TAKS_E_read_1_per_meet 2011-12 Campus Data Packet
DISTRICT SUMMARY 18
FemaleMigrant MaleAt RiskWhite AfricanAmer
Hispanic EconDisadv
SpecialEduc
LEP All DistrictYearGrade Number Tested(All Students)
Texas Assessment of Knowledge and Skills: READING / ENGLISH LANGUAGE ARTS
PERCENTAGE MEETING STANDARD
TAKS Read (1)
100.0 79.7 86.0
60.0 79.7 86.7
85.7 84.0 90.8
82.82011 93.5 78.6 83.6 81.8 33.6 62.5 82.8 9,50972.8
9
83.02009 93.9 80.6 83.3 82.3 43.1 57.9 83.0 10,35776.4
87.32010 94.6 85.6 87.5 86.8 51.1 66.5 87.3 10,21381.1
100.0 83.1 91.3
80.0 79.8 86.5
75.0 83.5 90.9
87.22011 93.3 84.6 87.7 86.3 41.9 63.8 87.2 9,06280.7
10
83.32009 94.9 81.9 82.9 82.1 43.3 55.4 83.3 8,27876.7
87.22010 93.8 85.9 87.2 86.6 45.8 61.7 87.2 8,50581.3
87.5 89.8 94.6
100.0 87.4 91.7
71.4 88.3 93.3
92.32011 97.4 91.5 92.5 91.5 55.8 66.9 92.3 7,32187.2
11
89.82009 98.6 88.1 89.7 88.5 43.7 63.5 89.8 6,64985.0
91.02010 97.6 89.6 91.0 90.4 53.3 68.6 91.0 6,99487.0
95.8 83.7 90.4
72.2 81.6 88.1
76.7 84.9 91.6
87.02011 94.7 84.4 87.5 86.1 42.1 64.1 87.0 25,89279.7
9-11
84.92009 95.6 83.0 84.8 83.8 43.3 58.3 84.9 25,28478.8
88.32010 95.2 86.8 88.3 87.7 49.9 65.5 88.3 25,71282.8
24 12,808 13,063
36 12,303 12,971
30 12,757 12,934
25,8922011 1,406 16,6467,162 20,238 1,612 3,679 25,89214,969
25,2842009 1,399 15,7157,779 18,582 1,137 3,711 25,28416,220
NUMBER TESTED IN GRADES 9-11
25,7122010 1,434 16,3327,537 19,719 1,360 3,726 25,71215,740
Shaded cells indicate percentages below 70 percent, the 2010-11 AEIS minimum for an Academically Acceptable rating.
July 29, 2011 Dallas ISD Evaluation & Accountability (Data Analysis, Research, and Reporting Services) V:\CILT\1112\CILT_1012.mdb rpt_TAKS_E_read_1_per_meet 2011-12 Campus Data Packet
DISTRICT SUMMARY 19

FemaleMigrant MaleAt RiskWhite AfricanAmer
Hispanic EconDisadv
SpecialEduc
LEP All DistrictYearGrade Number Tested(All Students)
Texas Assessment of Knowledge and Skills: READING / ENGLISH LANGUAGE ARTS
PERCENTAGE MEETING STANDARD
TAKS Read (1)
87.7 80.8 86.5
72.7 81.2 86.3
77.5 81.4 87.1
83.62011 93.4 80.1 84.4 82.5 46.5 70.2 83.6 76,65774.5
3-11
83.82009 93.7 81.5 84.0 82.7 52.3 68.2 83.8 81,42076.0
84.22010 93.6 81.2 84.8 83.1 49.9 68.5 84.2 78,89874.9
65 38,331 38,255
99 40,280 41,077
80 39,284 39,553
76,6572011 4,068 48,19322,646 64,932 4,298 15,523 76,65741,753
81,4202009 4,164 51,70824,373 67,001 3,214 16,822 81,42047,335
NUMBER TESTED IN GRADES 3-11
78,8982010 4,280 49,64223,821 66,441 3,865 15,116 78,89841,085
Shaded cells indicate percentages below 70 percent, the 2010-11 AEIS minimum for an Academically Acceptable rating.
July 29, 2011 Dallas ISD Evaluation & Accountability (Data Analysis, Research, and Reporting Services) V:\CILT\1112\CILT_1012.mdb rpt_TAKS_E_read_1_per_meet 2011-12 Campus Data Packet
DISTRICT SUMMARY 20
FemaleMigrant MaleAt RiskWhite AfricanAmer
Hispanic EconDisadv
SpecialEduc
LEP All DistrictYearGrade
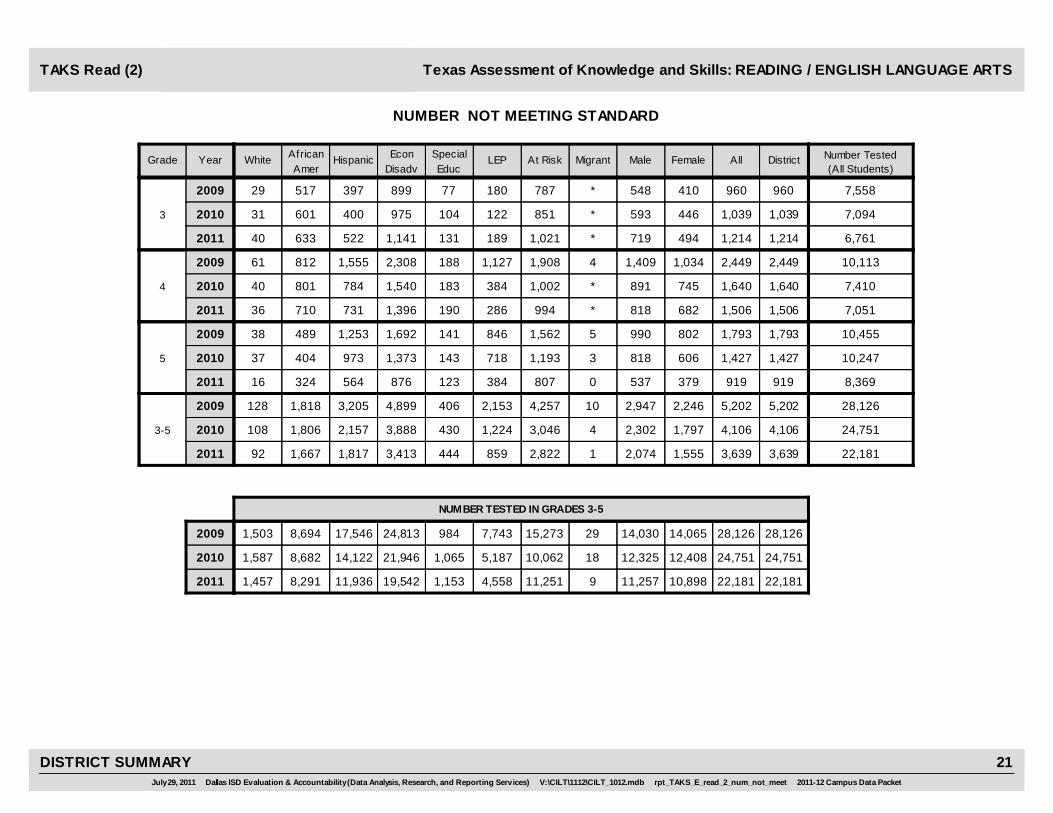
NUMBER NOT MEETING STANDARD
Number Tested(All Students)
Texas Assessment of Knowledge and Skills: READING / ENGLISH LANGUAGE ARTSTAKS Read (2)
* 719 494
* 548 410
* 593 446
1,2142011 40 633 522 1,141 131 189 1,214 6,7611,021
3
9602009 29 517 397 899 77 180 960 7,558787
1,0392010 31 601 400 975 104 122 1,039 7,094851
* 818 682
4 1,409 1,034
* 891 745
1,5062011 36 710 731 1,396 190 286 1,506 7,051994
4
2,4492009 61 812 1,555 2,308 188 1,127 2,449 10,1131,908
1,6402010 40 801 784 1,540 183 384 1,640 7,4101,002
0 537 379
5 990 802
3 818 606
9192011 16 324 564 876 123 384 919 8,369807
5
1,7932009 38 489 1,253 1,692 141 846 1,793 10,4551,562
1,4272010 37 404 973 1,373 143 718 1,427 10,2471,193
1 2,074 1,555
10 2,947 2,246
4 2,302 1,797
3,6392011 92 1,667 1,817 3,413 444 859 3,639 22,1812,822
3-5
5,2022009 128 1,818 3,205 4,899 406 2,153 5,202 28,1264,257
4,1062010 108 1,806 2,157 3,888 430 1,224 4,106 24,7513,046
9 11,257 10,898
29 14,030 14,065
18 12,325 12,408
22,1812011 1,457 11,9368,291 19,542 1,153 4,558 22,18111,251
28,1262009 1,503 17,5468,694 24,813 984 7,743 28,12615,273
NUMBER TESTED IN GRADES 3-5
24,7512010 1,587 14,1228,682 21,946 1,065 5,187 24,75110,062
July 29, 2011 Dallas ISD Evaluation & Accountability (Data Analysis, Research, and Reporting Services) V:\CILT\1112\CILT_1012.mdb rpt_TAKS_E_read_2_num_not_meet 2011-12 Campus Data Packet
DISTRICT SUMMARY 21

FemaleMigrant MaleAt RiskWhite AfricanAmer
Hispanic EconDisadv
SpecialEduc
LEP All DistrictYearGrade
NUMBER NOT MEETING STANDARD
Number Tested(All Students)
Texas Assessment of Knowledge and Skills: READING / ENGLISH LANGUAGE ARTSTAKS Read (2)
2 1,307 945
2 682 613
5 1,260 861
2,2582011 43 709 1,483 2,135 342 997 2,258 9,5601,855
6
1,2952009 18 450 811 1,203 130 570 1,295 9,5021,143
2,1232010 39 651 1,415 1,992 271 903 2,123 9,7801,721
3 1,182 989
1 1,187 877
0 1,221 942
2,1732011 33 650 1,457 1,973 343 939 2,173 9,5411,901
7
2,0652009 44 679 1,316 1,780 232 708 2,065 9,0151,756
2,1642010 35 665 1,445 1,972 308 934 2,164 9,4311,895
1 690 426
4 483 351
2 609 418
1,1162011 24 370 699 1,033 237 506 1,116 9,4831,012
8
8342009 12 250 564 726 121 372 834 9,493762
1,0282010 22 360 637 922 247 422 1,028 9,224933
6 3,179 2,360
7 2,352 1,841
7 3,090 2,221
5,5472011 100 1,729 3,639 5,141 922 2,442 5,547 28,5844,768
6-8
4,1942009 74 1,379 2,691 3,709 483 1,650 4,194 28,0103,661
5,3152010 96 1,676 3,497 4,886 826 2,259 5,315 28,4354,549
32 14,266 14,294
34 13,947 14,041
32 14,202 14,211
28,5842011 1,205 19,6117,193 25,152 1,533 7,286 28,58415,533
28,0102009 1,262 18,4477,900 23,606 1,093 5,368 28,01015,842
NUMBER TESTED IN GRADES 6-8
28,4352010 1,259 19,1887,602 24,776 1,440 6,203 28,43515,283
July 29, 2011 Dallas ISD Evaluation & Accountability (Data Analysis, Research, and Reporting Services) V:\CILT\1112\CILT_1012.mdb rpt_TAKS_E_read_2_num_not_meet 2011-12 Campus Data Packet
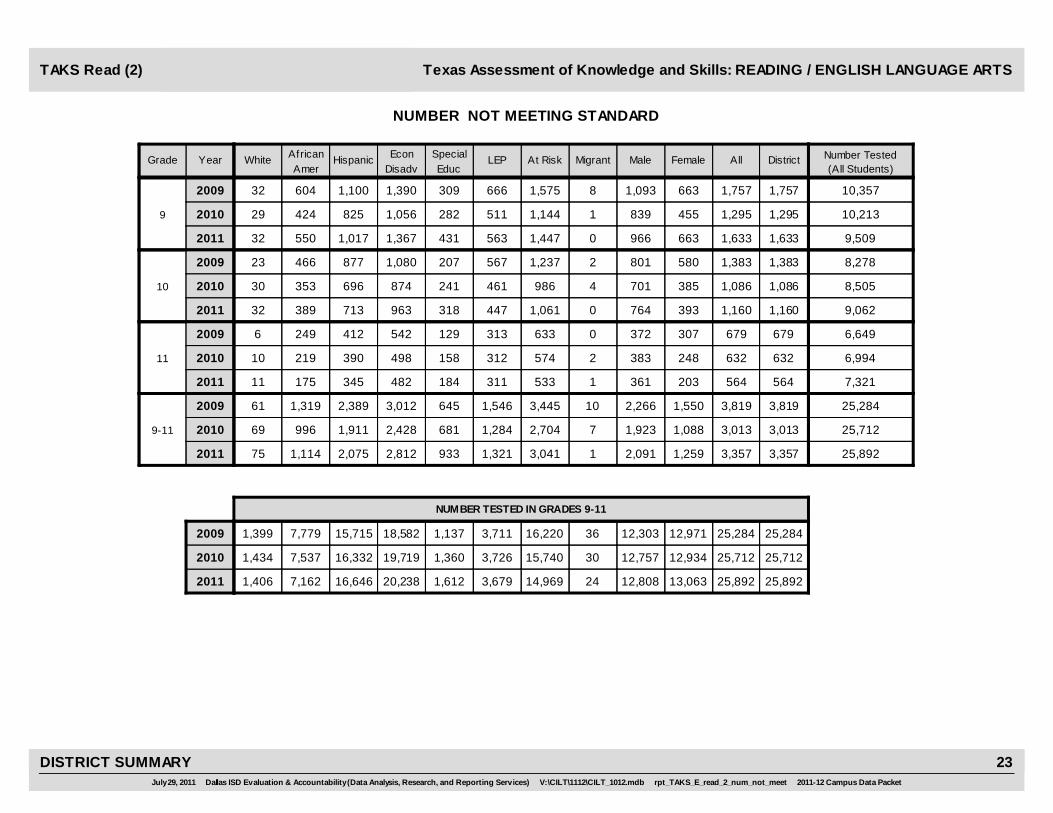
DISTRICT SUMMARY 22
FemaleMigrant MaleAt RiskWhite AfricanAmer
Hispanic EconDisadv
SpecialEduc
LEP All DistrictYearGrade
NUMBER NOT MEETING STANDARD
Number Tested(All Students)
Texas Assessment of Knowledge and Skills: READING / ENGLISH LANGUAGE ARTSTAKS Read (2)
0 966 663
8 1,093 663
1 839 455
1,6332011 32 550 1,017 1,367 431 563 1,633 9,5091,447
9
1,7572009 32 604 1,100 1,390 309 666 1,757 10,3571,575
1,2952010 29 424 825 1,056 282 511 1,295 10,2131,144
0 764 393
2 801 580
4 701 385
1,1602011 32 389 713 963 318 447 1,160 9,0621,061
10
1,3832009 23 466 877 1,080 207 567 1,383 8,2781,237
1,0862010 30 353 696 874 241 461 1,086 8,505986
1 361 203
0 372 307
2 383 248
5642011 11 175 345 482 184 311 564 7,321533
11
6792009 6 249 412 542 129 313 679 6,649633
6322010 10 219 390 498 158 312 632 6,994574
1 2,091 1,259
10 2,266 1,550
7 1,923 1,088
3,3572011 75 1,114 2,075 2,812 933 1,321 3,357 25,8923,041
9-11
3,8192009 61 1,319 2,389 3,012 645 1,546 3,819 25,2843,445
3,0132010 69 996 1,911 2,428 681 1,284 3,013 25,7122,704
24 12,808 13,063
36 12,303 12,971
30 12,757 12,934
25,8922011 1,406 16,6467,162 20,238 1,612 3,679 25,89214,969
25,2842009 1,399 15,7157,779 18,582 1,137 3,711 25,28416,220
NUMBER TESTED IN GRADES 9-11
25,7122010 1,434 16,3327,537 19,719 1,360 3,726 25,71215,740
July 29, 2011 Dallas ISD Evaluation & Accountability (Data Analysis, Research, and Reporting Services) V:\CILT\1112\CILT_1012.mdb rpt_TAKS_E_read_2_num_not_meet 2011-12 Campus Data Packet
DISTRICT SUMMARY 23

FemaleMigrant MaleAt RiskWhite AfricanAmer
Hispanic EconDisadv
SpecialEduc
LEP All DistrictYearGrade
NUMBER NOT MEETING STANDARD
Number Tested(All Students)
Texas Assessment of Knowledge and Skills: READING / ENGLISH LANGUAGE ARTSTAKS Read (2)
8 7,344 5,174
27 7,565 5,637
18 7,315 5,106
12,5432011 267 4,510 7,531 11,366 2,299 4,622 12,543 76,65710,631
3-11
13,2152009 263 4,516 8,285 11,620 1,534 5,349 13,215 81,42011,363
12,4342010 273 4,478 7,565 11,202 1,937 4,767 12,434 78,89810,299
65 38,331 38,255
99 40,280 41,077
80 39,284 39,553
76,6572011 4,068 48,19322,646 64,932 4,298 15,523 76,65741,753
81,4202009 4,164 51,70824,373 67,001 3,214 16,822 81,42047,335
NUMBER TESTED IN GRADES 3-11
78,8982010 4,280 49,64223,821 66,441 3,865 15,116 78,89841,085
July 29, 2011 Dallas ISD Evaluation & Accountability (Data Analysis, Research, and Reporting Services) V:\CILT\1112\CILT_1012.mdb rpt_TAKS_E_read_2_num_not_meet 2011-12 Campus Data Packet
DISTRICT SUMMARY 24

Basic UnderstandingApplying Knowledgeof Literary Elements
Using Strategiesto Analyze
Applying Critical-Thinking Skills
YearGrade
OBJECTIVE
AVERAGE PERCENTAGE OF ITEMS CORRECT BY OBJECTIVE
Texas Assessment of Knowledge and Skills: READING / ENGLISH LANGUAGE ARTSTAKS Read (3)
2011 79.4 76.6 79.6 75.3
2009
2010
78.4 80.2 81.9 83.0
3 81.5 79.1 77.4 76.8
2011 79.3 77.9 80.5 75.6
2009
2010
82.3 75.8 73.4 78.3
4 77.7 80.5 82.4 74.6
2011 85.3 81.8 84.7 80.9
2009
2010
77.2 79.6 81.1 74.5
5 83.1 82.6 81.0 77.3
2011 81.6 79.0 81.8 77.5
2009
2010
79.4 78.4 78.5 78.2
3-5 81.0 80.9 80.4 76.3
July 29, 2011 Dallas ISD Evaluation & Accountability (Data Analysis, Research, and Reporting Services) V:\CILT\1112\CILT_1012.mdb rpt_TAKS_E_read_3_obj_elem 2011-12 Campus Data Packet
DISTRICT SUMMARY 25

Basic UnderstandingApplying Knowledgeof Literary Elements
Using Strategiesto Analyze
Applying Critical-Thinking Skills
YearGrade
OBJECTIVE
AVERAGE PERCENTAGE OF ITEMS CORRECT BY OBJECTIVE
Texas Assessment of Knowledge and Skills: READING / ENGLISH LANGUAGE ARTSTAKS Read (3)
2011 80.3 80.5 76.6 78.9
2009
2010
81.5 74.6 78.4 81.3
6 79.8 82.1 73.7 77.0
2011 81.6 72.1 72.2 73.5
2009
2010
80.3 83.3 77.4 76.2
7 79.6 73.0 75.0 72.2
2011 85.7 83.4 84.6 82.6
2009
2010
87.3 84.6 83.9 85.4
8 88.2 83.4 85.1 81.8
2011 82.5 78.7 77.8 78.3
2009
2010
83.1 80.8 80.0 81.0
6-8 82.4 79.5 77.9 77.0
July 29, 2011 Dallas ISD Evaluation & Accountability (Data Analysis, Research, and Reporting Services) V:\CILT\1112\CILT_1012.mdb rpt_TAKS_E_read_3_obj_elem 2011-12 Campus Data Packet
DISTRICT SUMMARY 26
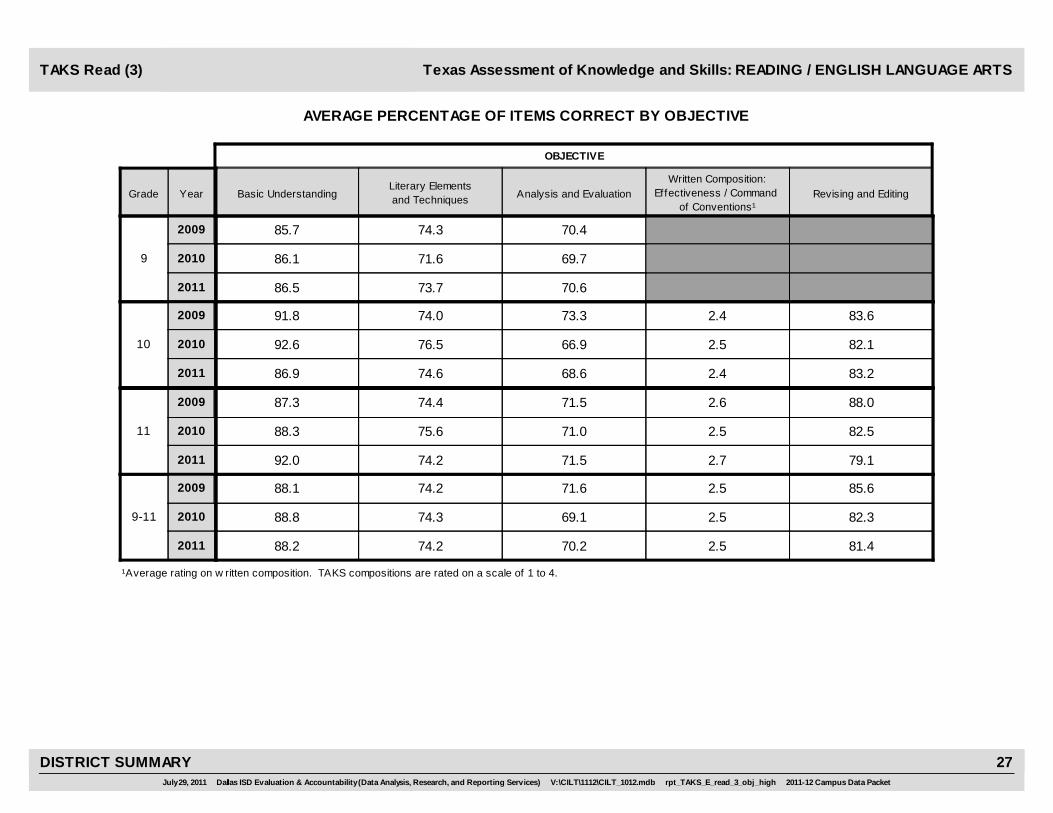
Written Composition:Effectiveness / Command
of Conventions¹Basic Understanding
Literary Elementsand Techniques Analysis and Evaluation Revising and EditingYearGrade
OBJECTIVE
AVERAGE PERCENTAGE OF ITEMS CORRECT BY OBJECTIVE
Texas Assessment of Knowledge and Skills: READING / ENGLISH LANGUAGE ARTSTAKS Read (3)
2009
2010
2011 70.6
70.4
69.7
86.5 73.7
85.7 74.3
9 86.1 71.6
2009
2010
2011 68.6 2.4 83.2
73.3 2.4 83.6
66.9 2.5 82.1
86.9 74.6
91.8 74.0
10 92.6 76.5
2009
2010
2011 71.5 2.7 79.1
71.5 2.6 88.0
71.0 2.5 82.5
92.0 74.2
87.3 74.4
11 88.3 75.6
2009
2010
2011 70.2 2.5 81.4
71.6 2.5 85.6
69.1 2.5 82.3
88.2 74.2
88.1 74.2
9-11 88.8 74.3
¹Average rating on w ritten composition. TAKS compositions are rated on a scale of 1 to 4.
July 29, 2011 Dallas ISD Evaluation & Accountability (Data Analysis, Research, and Reporting Services) V:\CILT\1112\CILT_1012.mdb rpt_TAKS_E_read_3_obj_high 2011-12 Campus Data Packet
DISTRICT SUMMARY 27

FemaleMigrant MaleAt RiskWhite AfricanAmer
Hispanic EconDisadv
SpecialEduc
LEP All DistrictYearGrade Number Tested(All Students)
Texas Assessment of Knowledge and Skills: READING / ENGLISH LANGUAGE ARTS
PERCENTAGE DEMONSTRATING COMMENDED PERFORMANCE
TAKS Read (4)
* 30.5 36.9
* 31.7 36.6
* 34.8 39.5
33.62011 57.9 27.3 35.0 30.5 14.1 27.8 33.6 6,76118.4
3
34.12009 58.4 29.0 34.6 31.0 19.8 26.2 34.1 7,55819.2
37.12010 62.2 29.5 39.1 33.7 20.2 33.0 37.1 7,09418.4
* 26.8 28.7
7.1 16.4 20.4
* 18.1 20.7
27.72011 54.9 22.5 27.2 24.4 8.5 20.8 27.7 7,05113.4
4
18.42009 38.4 13.8 18.6 16.7 7.0 13.1 18.4 10,11310.7
19.42010 45.6 14.4 19.3 16.4 8.1 13.4 19.4 7,4104.5
50.0 25.5 30.9
10.0 16.2 20.8
8.3 21.1 26.0
28.12011 56.1 26.3 26.1 25.5 10.7 19.7 28.1 8,36915.4
5
18.52009 49.3 18.9 16.1 16.2 7.2 5.6 18.5 10,4556.1
23.62010 46.0 22.3 22.1 21.4 10.4 9.6 23.6 10,2476.2
44.4 27.4 32.0
13.8 20.5 24.8
16.7 24.1 28.3
29.72011 56.3 25.4 28.9 26.7 10.8 21.5 29.7 22,18116.0
3-5
22.72009 48.8 20.8 21.0 20.3 10.7 12.6 22.7 28,12611.5
26.22010 51.9 22.3 25.3 23.4 12.4 14.5 26.2 24,75110.3
9 11,257 10,898
29 14,030 14,065
18 12,325 12,408
22,1812011 1,457 11,9368,291 19,542 1,153 4,558 22,18111,251
28,1262009 1,503 17,5468,694 24,813 984 7,743 28,12615,273
NUMBER TESTED IN GRADES 3-5
24,7512010 1,587 14,1228,682 21,946 1,065 5,187 24,75110,062
Shaded cells indicate percentages at or above 30 percent, the Gold Performance Acknow ledgment Standard for 2010-11.
July 29, 2011 Dallas ISD Evaluation & Accountability (Data Analysis, Research, and Reporting Services) V:\CILT\1112\CILT_1012.mdb rpt_TAKS_E_read_4_per_comm 2011-12 Campus Data Packet
DISTRICT SUMMARY 28

FemaleMigrant MaleAt RiskWhite AfricanAmer
Hispanic EconDisadv
SpecialEduc
LEP All DistrictYearGrade Number Tested(All Students)
Texas Assessment of Knowledge and Skills: READING / ENGLISH LANGUAGE ARTS
PERCENTAGE DEMONSTRATING COMMENDED PERFORMANCE
TAKS Read (4)
11.1 22.3 29.7
28.6 30.3 30.2
10.0 18.4 25.8
26.02011 49.8 20.5 26.2 23.9 4.3 12.7 26.0 9,56011.2
6
30.22009 65.6 25.7 29.4 27.3 10.3 13.2 30.2 9,50213.4
22.12010 47.8 19.5 21.3 20.2 3.7 8.1 22.1 9,7807.5
7.1 15.7 20.2
25.0 16.6 22.7
9.1 15.0 19.5
17.92011 49.6 14.3 17.3 16.0 2.9 5.2 17.9 9,5415.8
7
19.62009 41.8 17.7 18.7 17.7 2.2 7.0 19.6 9,0157.2
17.22010 51.4 15.0 15.5 14.6 3.6 3.9 17.2 9,4314.4
33.3 27.9 34.6
8.3 33.3 40.0
27.3 28.7 35.2
31.22011 65.3 26.9 30.3 28.4 8.6 11.0 31.2 9,48314.3
8
36.62009 61.4 32.0 36.7 34.3 9.3 13.3 36.6 9,49320.0
31.92010 55.5 27.6 31.7 29.7 6.0 11.7 31.9 9,22416.2
15.6 21.9 28.1
20.6 26.9 31.1
15.6 20.6 26.8
25.02011 55.3 20.7 24.5 22.8 5.2 9.7 25.0 28,58410.4
6-8
29.02009 56.5 25.3 28.4 26.6 7.2 11.4 29.0 28,01013.9
23.72010 51.7 20.8 22.7 21.4 4.4 7.5 23.7 28,4359.5
32 14,266 14,294
34 13,947 14,041
32 14,202 14,211
28,5842011 1,205 19,6117,193 25,152 1,533 7,286 28,58415,533
28,0102009 1,262 18,4477,900 23,606 1,093 5,368 28,01015,842
NUMBER TESTED IN GRADES 6-8
28,4352010 1,259 19,1887,602 24,776 1,440 6,203 28,43515,283
Shaded cells indicate percentages at or above 30 percent, the Gold Performance Acknow ledgment Standard for 2010-11.
July 29, 2011 Dallas ISD Evaluation & Accountability (Data Analysis, Research, and Reporting Services) V:\CILT\1112\CILT_1012.mdb rpt_TAKS_E_read_4_per_comm 2011-12 Campus Data Packet
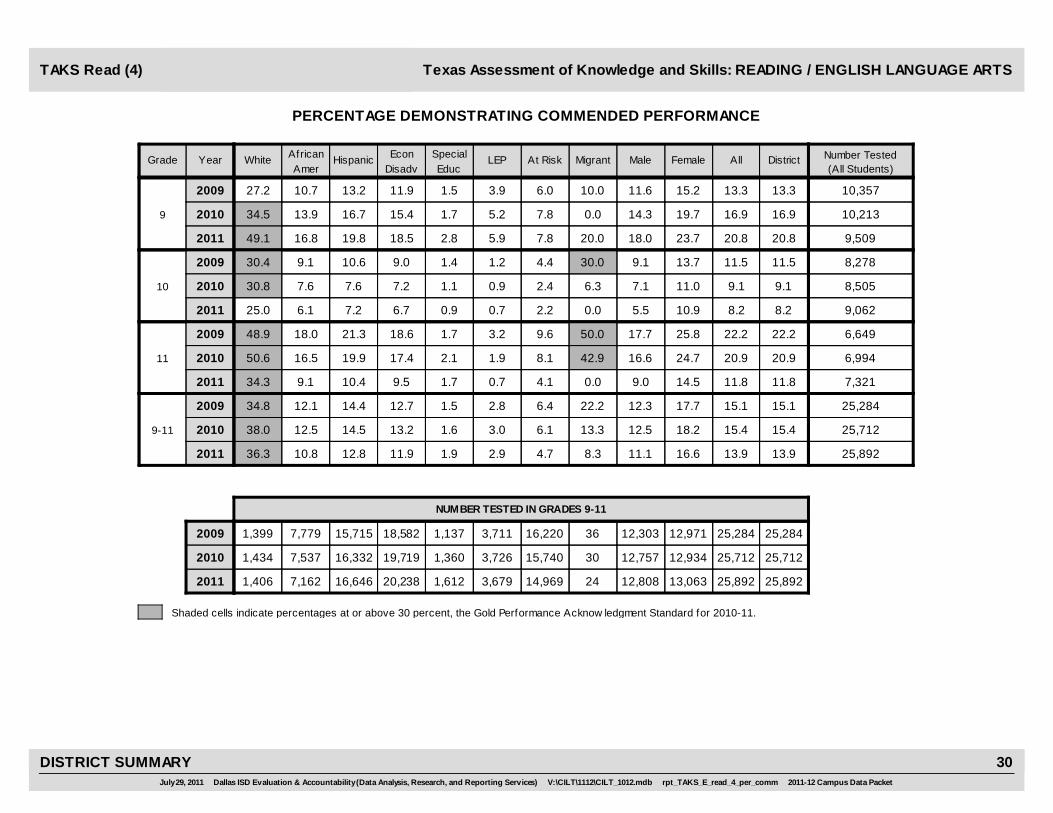
DISTRICT SUMMARY 29
FemaleMigrant MaleAt RiskWhite AfricanAmer
Hispanic EconDisadv
SpecialEduc
LEP All DistrictYearGrade Number Tested(All Students)
Texas Assessment of Knowledge and Skills: READING / ENGLISH LANGUAGE ARTS
PERCENTAGE DEMONSTRATING COMMENDED PERFORMANCE
TAKS Read (4)
20.0 18.0 23.7
10.0 11.6 15.2
0.0 14.3 19.7
20.82011 49.1 16.8 19.8 18.5 2.8 5.9 20.8 9,5097.8
9
13.32009 27.2 10.7 13.2 11.9 1.5 3.9 13.3 10,3576.0
16.92010 34.5 13.9 16.7 15.4 1.7 5.2 16.9 10,2137.8
0.0 5.5 10.9
30.0 9.1 13.7
6.3 7.1 11.0
8.22011 25.0 6.1 7.2 6.7 0.9 0.7 8.2 9,0622.2
10
11.52009 30.4 9.1 10.6 9.0 1.4 1.2 11.5 8,2784.4
9.12010 30.8 7.6 7.6 7.2 1.1 0.9 9.1 8,5052.4
0.0 9.0 14.5
50.0 17.7 25.8
42.9 16.6 24.7
11.82011 34.3 9.1 10.4 9.5 1.7 0.7 11.8 7,3214.1
11
22.22009 48.9 18.0 21.3 18.6 1.7 3.2 22.2 6,6499.6
20.92010 50.6 16.5 19.9 17.4 2.1 1.9 20.9 6,9948.1
8.3 11.1 16.6
22.2 12.3 17.7
13.3 12.5 18.2
13.92011 36.3 10.8 12.8 11.9 1.9 2.9 13.9 25,8924.7
9-11
15.12009 34.8 12.1 14.4 12.7 1.5 2.8 15.1 25,2846.4
15.42010 38.0 12.5 14.5 13.2 1.6 3.0 15.4 25,7126.1
24 12,808 13,063
36 12,303 12,971
30 12,757 12,934
25,8922011 1,406 16,6467,162 20,238 1,612 3,679 25,89214,969
25,2842009 1,399 15,7157,779 18,582 1,137 3,711 25,28416,220
NUMBER TESTED IN GRADES 9-11
25,7122010 1,434 16,3327,537 19,719 1,360 3,726 25,71215,740
Shaded cells indicate percentages at or above 30 percent, the Gold Performance Acknow ledgment Standard for 2010-11.
July 29, 2011 Dallas ISD Evaluation & Accountability (Data Analysis, Research, and Reporting Services) V:\CILT\1112\CILT_1012.mdb rpt_TAKS_E_read_4_per_comm 2011-12 Campus Data Packet
DISTRICT SUMMARY 30

FemaleMigrant MaleAt RiskWhite AfricanAmer
Hispanic EconDisadv
SpecialEduc
LEP All DistrictYearGrade Number Tested(All Students)
Texas Assessment of Knowledge and Skills: READING / ENGLISH LANGUAGE ARTS
PERCENTAGE DEMONSTRATING COMMENDED PERFORMANCE
TAKS Read (4)
16.9 19.9 25.3
19.2 20.2 24.7
15.0 19.1 24.5
22.62011 49.1 19.3 21.5 20.6 5.5 11.6 22.6 76,6579.9
3-11
22.52009 46.4 19.5 21.7 20.4 6.3 10.1 22.5 81,42010.5
21.82010 47.2 18.7 20.7 19.6 5.6 8.8 21.8 78,8988.4
65 38,331 38,255
99 40,280 41,077
80 39,284 39,553
76,6572011 4,068 48,19322,646 64,932 4,298 15,523 76,65741,753
81,4202009 4,164 51,70824,373 67,001 3,214 16,822 81,42047,335
NUMBER TESTED IN GRADES 3-11
78,8982010 4,280 49,64223,821 66,441 3,865 15,116 78,89841,085
Shaded cells indicate percentages at or above 30 percent, the Gold Performance Acknow ledgment Standard for 2010-11.
July 29, 2011 Dallas ISD Evaluation & Accountability (Data Analysis, Research, and Reporting Services) V:\CILT\1112\CILT_1012.mdb rpt_TAKS_E_read_4_per_comm 2011-12 Campus Data Packet
DISTRICT SUMMARY 31
FemaleMigrant MaleAt RiskWhiteAfricanAmer
HispanicEcon
DisadvSpecialEduc
LEP All DistrictYearGradeNumber Tested(All Students)
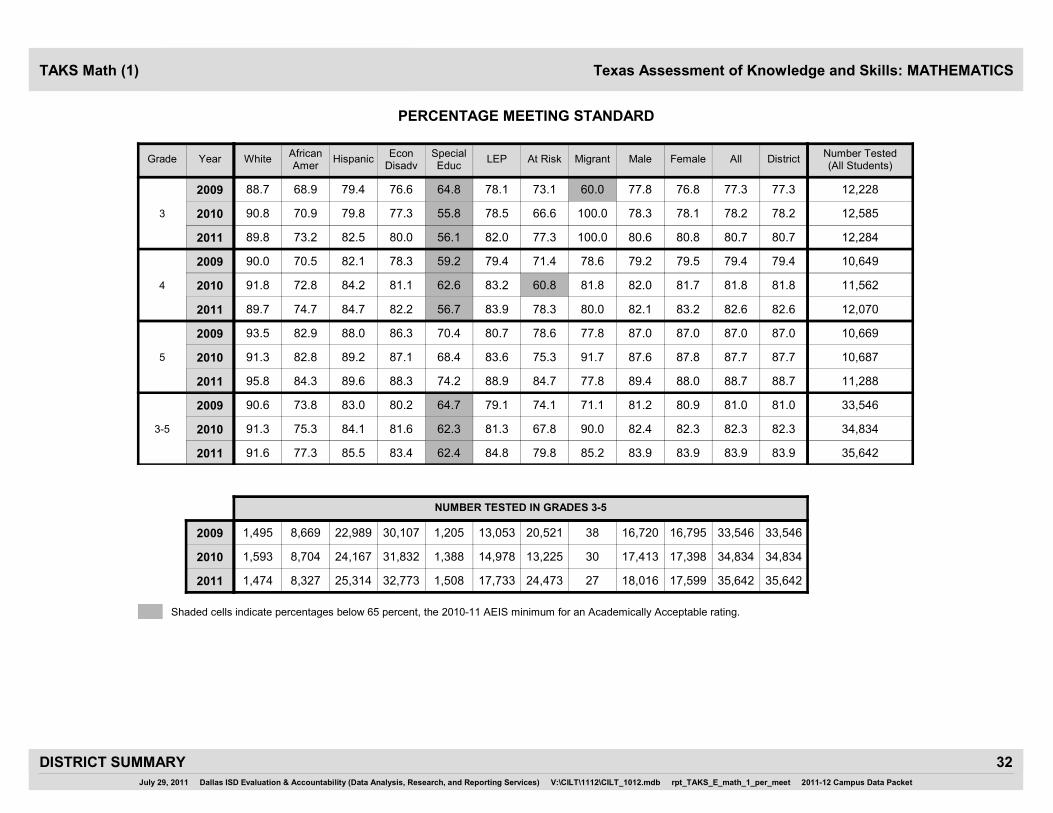
Texas Assessment of Knowledge and Skills: MATHEMATICS
PERCENTAGE MEETING STANDARD
TAKS Math (1)
100.0 80.6 80.8
60.0 77.8 76.8
100.0 78.3 78.1
80.72011 89.8 73.2 82.5 80.0 56.1 82.0 80.7 12,28477.3
3
77.32009 88.7 68.9 79.4 76.6 64.8 78.1 77.3 12,22873.1
78.22010 90.8 70.9 79.8 77.3 55.8 78.5 78.2 12,58566.6
80.0 82.1 83.2
78.6 79.2 79.5
81.8 82.0 81.7
82.62011 89.7 74.7 84.7 82.2 56.7 83.9 82.6 12,07078.3
4
79.42009 90.0 70.5 82.1 78.3 59.2 79.4 79.4 10,64971.4
81.82010 91.8 72.8 84.2 81.1 62.6 83.2 81.8 11,56260.8
77.8 89.4 88.0
77.8 87.0 87.0
91.7 87.6 87.8
88.72011 95.8 84.3 89.6 88.3 74.2 88.9 88.7 11,28884.7
5
87.02009 93.5 82.9 88.0 86.3 70.4 80.7 87.0 10,66978.6
87.72010 91.3 82.8 89.2 87.1 68.4 83.6 87.7 10,68775.3
85.2 83.9 83.9
71.1 81.2 80.9
90.0 82.4 82.3
83.92011 91.6 77.3 85.5 83.4 62.4 84.8 83.9 35,64279.8
3-5
81.02009 90.6 73.8 83.0 80.2 64.7 79.1 81.0 33,54674.1
82.32010 91.3 75.3 84.1 81.6 62.3 81.3 82.3 34,83467.8
27 18,016 17,599
38 16,720 16,795
30 17,413 17,398
35,6422011 1,474 25,3148,327 32,773 1,508 17,733 35,64224,473
33,5462009 1,495 22,9898,669 30,107 1,205 13,053 33,54620,521
NUMBER TESTED IN GRADES 3-5
34,8342010 1,593 24,1678,704 31,832 1,388 14,978 34,83413,225
Shaded cells indicate percentages below 65 percent, the 2010-11 AEIS minimum for an Academically Acceptable rating.
July 29, 2011 Dallas ISD Evaluation & Accountability (Data Analysis, Research, and Reporting Services) V:\CILT\1112\CILT_1012.mdb rpt_TAKS_E_math_1_per_meet 2011-12 Campus Data Packet
DISTRICT SUMMARY 32

FemaleMigrant MaleAt RiskWhiteAfricanAmer
HispanicEcon
DisadvSpecialEduc
LEP All DistrictYearGradeNumber Tested(All Students)
Texas Assessment of Knowledge and Skills: MATHEMATICS
PERCENTAGE MEETING STANDARD
TAKS Math (1)
100.0 73.7 75.4
71.4 71.7 75.0
60.0 71.7 73.8
74.52011 84.2 60.7 78.5 73.5 34.0 71.0 74.5 9,58462.0
6
73.32009 87.0 62.1 76.7 72.0 38.9 64.6 73.3 9,56060.1
72.72010 84.8 61.5 75.9 71.7 37.8 63.9 72.7 9,79958.7
64.3 69.0 70.5
62.5 65.3 69.1
75.0 68.1 68.8
69.72011 83.1 55.7 73.8 68.7 26.9 60.1 69.7 9,56354.8
7
67.22009 80.6 55.8 70.9 66.4 33.1 55.2 67.2 9,04451.0
68.52010 84.8 55.9 72.2 67.0 30.9 56.2 68.5 9,43252.0
80.0 76.8 79.9
61.5 72.6 72.0
81.8 74.7 78.1
78.32011 88.4 70.2 80.8 77.3 45.7 66.7 78.3 9,49065.9
8
72.32009 85.0 61.7 75.7 71.7 46.7 57.3 72.3 9,13459.9
76.42010 86.0 66.8 79.5 75.4 39.8 63.1 76.4 9,20264.0
78.8 73.2 75.2
65.7 69.9 72.1
72.7 71.5 73.5
74.22011 85.4 62.4 77.6 73.1 35.2 66.1 74.2 28,63760.9
6-8
71.02009 84.3 59.9 74.5 70.1 39.3 59.9 71.0 27,73857.2
72.52010 85.2 61.4 75.8 71.3 36.2 61.0 72.5 28,43358.3
33 14,291 14,323
35 13,857 13,852
33 14,205 14,203
28,6372011 1,210 19,6697,177 25,206 1,544 7,323 28,63715,583
27,7382009 1,266 18,3467,734 23,359 1,131 5,357 27,73815,681
NUMBER TESTED IN GRADES 6-8
28,4332010 1,250 19,2567,539 24,773 1,405 6,258 28,43315,292
Shaded cells indicate percentages below 65 percent, the 2010-11 AEIS minimum for an Academically Acceptable rating.
July 29, 2011 Dallas ISD Evaluation & Accountability (Data Analysis, Research, and Reporting Services) V:\CILT\1112\CILT_1012.mdb rpt_TAKS_E_math_1_per_meet 2011-12 Campus Data Packet
DISTRICT SUMMARY 33

FemaleMigrant MaleAt RiskWhiteAfricanAmer
HispanicEcon
DisadvSpecialEduc
LEP All DistrictYearGradeNumber Tested(All Students)
Texas Assessment of Knowledge and Skills: MATHEMATICS
PERCENTAGE MEETING STANDARD
TAKS Math (1)
55.6 58.3 61.1
41.2 54.7 58.4
57.1 58.0 63.0
59.72011 78.2 47.9 62.7 58.7 14.9 43.9 59.7 9,33742.0
9
56.52009 73.2 44.4 60.7 55.7 18.6 37.2 56.5 10,11942.5
60.42010 76.5 47.9 64.3 59.3 13.5 41.8 60.4 10,08044.5
* 63.7 64.9
70.0 55.0 56.6
29.4 66.4 69.3
64.32011 78.9 55.7 66.4 63.1 17.0 43.2 64.3 8,94049.1
10
55.82009 80.8 46.3 57.7 53.9 18.9 35.7 55.8 8,07338.8
67.82010 80.1 58.3 70.8 67.6 24.0 48.5 67.8 8,33453.7
80.0 86.5 88.1
83.3 77.7 76.3
85.7 85.7 85.5
87.32011 92.6 82.7 88.9 86.6 43.0 71.2 87.3 7,25079.4
11
77.02009 91.4 71.7 77.9 75.2 30.5 52.4 77.0 6,54466.2
85.62010 95.3 81.7 86.5 84.8 43.9 70.7 85.6 6,92378.7
70.8 68.1 70.3
57.6 60.4 62.9
48.4 67.9 71.6
69.12011 82.9 60.8 71.3 68.1 22.7 50.6 69.1 25,52755.0
9-11
61.72009 81.2 52.4 64.1 60.1 21.0 40.2 61.7 24,73647.5
69.72010 83.3 60.8 72.4 68.7 24.2 51.7 69.7 25,33757.2
24 12,595 12,910
33 11,994 12,724
31 12,542 12,770
25,5272011 1,388 16,4686,979 19,923 1,504 3,642 25,52714,618
24,7362009 1,374 15,3907,565 18,169 1,018 3,552 24,73615,668
NUMBER TESTED IN GRADES 9-11
25,3372010 1,426 16,1127,377 19,470 1,218 3,649 25,33715,395
Shaded cells indicate percentages below 65 percent, the 2010-11 AEIS minimum for an Academically Acceptable rating.
July 29, 2011 Dallas ISD Evaluation & Accountability (Data Analysis, Research, and Reporting Services) V:\CILT\1112\CILT_1012.mdb rpt_TAKS_E_math_1_per_meet 2011-12 Campus Data Packet
DISTRICT SUMMARY 34
FemaleMigrant MaleAt RiskWhiteAfricanAmer
HispanicEcon
DisadvSpecialEduc
LEP All DistrictYearGradeNumber Tested(All Students)
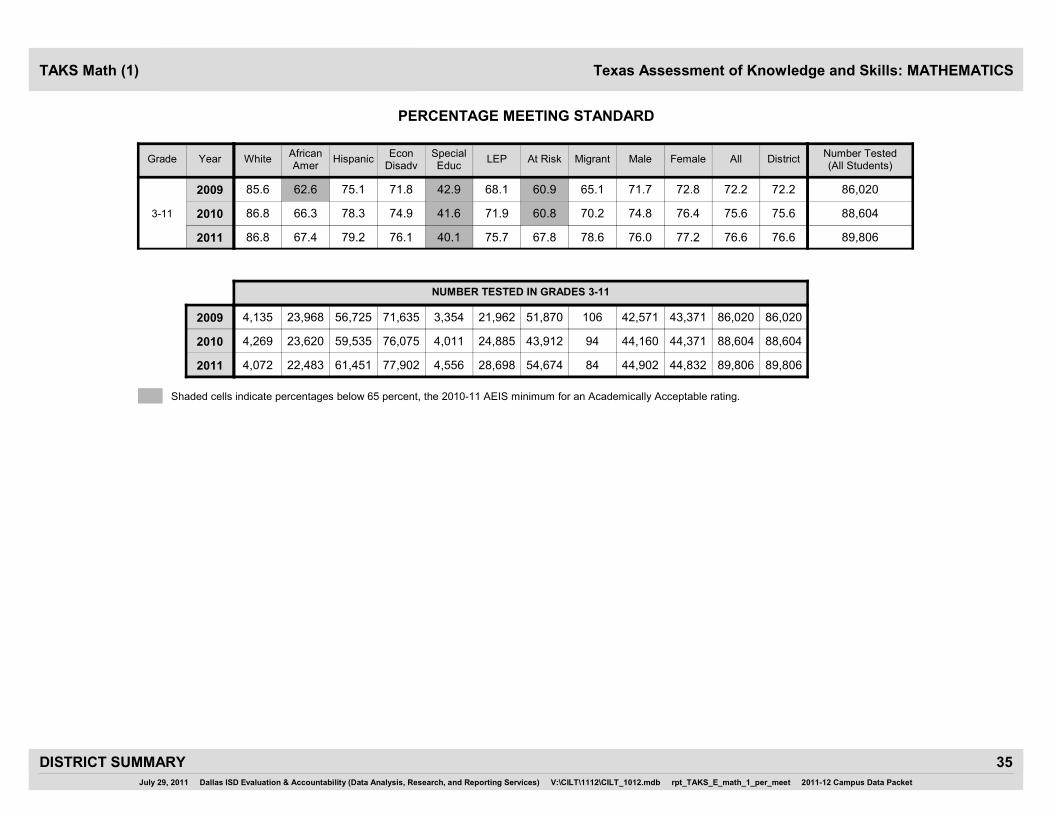
Texas Assessment of Knowledge and Skills: MATHEMATICS
PERCENTAGE MEETING STANDARD
TAKS Math (1)
78.6 76.0 77.2
65.1 71.7 72.8
70.2 74.8 76.4
76.62011 86.8 67.4 79.2 76.1 40.1 75.7 76.6 89,80667.8
3-11
72.22009 85.6 62.6 75.1 71.8 42.9 68.1 72.2 86,02060.9
75.62010 86.8 66.3 78.3 74.9 41.6 71.9 75.6 88,60460.8
84 44,902 44,832
106 42,571 43,371
94 44,160 44,371
89,8062011 4,072 61,45122,483 77,902 4,556 28,698 89,80654,674
86,0202009 4,135 56,72523,968 71,635 3,354 21,962 86,02051,870
NUMBER TESTED IN GRADES 3-11
88,6042010 4,269 59,53523,620 76,075 4,011 24,885 88,60443,912
Shaded cells indicate percentages below 65 percent, the 2010-11 AEIS minimum for an Academically Acceptable rating.
July 29, 2011 Dallas ISD Evaluation & Accountability (Data Analysis, Research, and Reporting Services) V:\CILT\1112\CILT_1012.mdb rpt_TAKS_E_math_1_per_meet 2011-12 Campus Data Packet
DISTRICT SUMMARY 35

FemaleMigrant MaleAt RiskWhite AfricanAmer
Hispanic EconDisadv
SpecialEduc
LEP All DistrictYearGrade Number Tested(All Students)
Texas Assessment of Knowledge and Skills: MATHEMATICS
NUMBER NOT MEETING STANDARD
TAKS Math (2)
2011
2009
2010
0 1,213 1,154
6 1,365 1,411
0 1,376 1,362
2,37051 763 1,531 2,270 208 1,132 2,370 12,2842,134
3
2,78159 958 1,748 2,598 142 1,275 2,781 12,2282,383
2,73955 904 1,772 2,617 199 1,326 2,739 12,5851,719
2011
2009
2010
2 1,089 1,005
3 1,092 1,099
2 1,033 1,061
2,10054 714 1,308 1,961 228 962 2,100 12,0701,663
4
2,19651 849 1,280 2,065 166 897 2,196 10,6491,740
2,10141 781 1,270 1,995 179 919 2,101 11,5621,450
2011
2009
2010
2 605 669
2 690 695
1 656 654
1,27419 417 833 1,215 131 607 1,274 11,2881,137
5
1,38630 465 880 1,304 117 555 1,386 10,6691,190
1,31443 467 794 1,258 145 550 1,314 10,6871,084
2011
2009
2010
4 2,907 2,828
11 3,147 3,205
3 3,065 3,077
5,744124 1,894 3,672 5,446 567 2,701 5,744 35,6424,934
3-5
6,363140 2,272 3,908 5,967 425 2,727 6,363 33,5465,313
6,154139 2,152 3,836 5,870 523 2,795 6,154 34,8344,253
27 18,016 17,599
38 16,720 16,795
30 17,413 17,398
35,6422011 1,474 25,3148,327 32,773 1,508 17,733 35,64224,473
33,5462009 1,495 22,9898,669 30,107 1,205 13,053 33,54620,521
NUMBER TESTED IN GRADES 3-5
34,8342010 1,593 24,1678,704 31,832 1,388 14,978 34,83413,225
July 29, 2011 Dallas ISD Evaluation & Accountability (Data Analysis, Research, and Reporting Services) V:\CILT\1112\CILT_1012.mdb rpt_TAKS_E_math_2_num_not_meet 2011-12 Campus Data Packet
DISTRICT SUMMARY 36

FemaleMigrant MaleAt RiskWhite AfricanAmer
Hispanic EconDisadv
SpecialEduc
LEP All DistrictYearGrade Number Tested(All Students)
Texas Assessment of Knowledge and Skills: MATHEMATICS
NUMBER NOT MEETING STANDARD
TAKS Math (2)
2011
2009
2010
0 1,242 1,193
4 1,344 1,203
4 1,392 1,277
2,44466 914 1,438 2,297 352 834 2,444 9,5841,909
6
2,55257 981 1,490 2,343 242 842 2,552 9,5602,036
2,67358 945 1,647 2,488 294 916 2,673 9,7992,007
2011
2009
2010
5 1,488 1,404
3 1,578 1,386
3 1,503 1,469
2,89561 1,040 1,742 2,616 384 975 2,895 9,5632,384
7
2,96679 1,124 1,734 2,534 257 714 2,966 9,0442,434
2,97568 1,116 1,758 2,693 318 955 2,975 9,4322,439
2011
2009
2010
2 1,102 952
5 1,247 1,277
2 1,156 1,011
2,05650 746 1,220 1,865 264 670 2,056 9,4901,799
8
2,53063 995 1,453 2,114 187 590 2,530 9,1342,248
2,17359 848 1,247 1,921 284 569 2,173 9,2021,927
2011
2009
2010
7 3,832 3,549
12 4,169 3,866
9 4,051 3,757
7,395177 2,700 4,400 6,778 1,000 2,479 7,395 28,6376,092
6-8
8,048199 3,100 4,677 6,991 686 2,146 8,048 27,7386,718
7,821185 2,909 4,652 7,102 896 2,440 7,821 28,4336,373
33 14,291 14,323
35 13,857 13,852
33 14,205 14,203
28,6372011 1,210 19,6697,177 25,206 1,544 7,323 28,63715,583
27,7382009 1,266 18,3467,734 23,359 1,131 5,357 27,73815,681
NUMBER TESTED IN GRADES 6-8
28,4332010 1,250 19,2567,539 24,773 1,405 6,258 28,43315,292
July 29, 2011 Dallas ISD Evaluation & Accountability (Data Analysis, Research, and Reporting Services) V:\CILT\1112\CILT_1012.mdb rpt_TAKS_E_math_2_num_not_meet 2011-12 Campus Data Packet
DISTRICT SUMMARY 37

FemaleMigrant MaleAt RiskWhite AfricanAmer
Hispanic EconDisadv
SpecialEduc
LEP All DistrictYearGrade Number Tested(All Students)
Texas Assessment of Knowledge and Skills: MATHEMATICS
NUMBER NOT MEETING STANDARD
TAKS Math (2)
2011
2009
2010
4 1,937 1,820
10 2,378 2,022
3 2,177 1,807
3,764104 1,305 2,288 3,055 537 827 3,764 9,3373,000
9
4,403137 1,684 2,529 3,399 406 944 4,403 10,1193,709
3,992122 1,501 2,323 3,229 469 881 3,992 10,0803,305
2011
2009
2010
* 1,613 1,573
3 1,725 1,835
12 1,388 1,291
3,192101 1,081 1,932 2,548 410 709 3,192 8,9402,737
10
3,56885 1,331 2,117 2,709 261 785 3,568 8,0733,128
2,68296 1,016 1,544 2,079 285 596 2,682 8,3342,362
2011
2009
2010
2 473 447
1 647 861
1 462 535
92332 351 508 753 216 264 923 7,250838
11
1,50836 583 875 1,146 137 395 1,508 6,5441,392
99820 378 583 782 169 286 998 6,923925
2011
2009
2010
7 4,023 3,840
14 4,750 4,718
16 4,027 3,633
7,879237 2,737 4,728 6,356 1,163 1,800 7,879 25,5276,575
9-11
9,479258 3,598 5,521 7,254 804 2,124 9,479 24,7368,229
7,672238 2,895 4,450 6,090 923 1,763 7,672 25,3376,592
24 12,595 12,910
33 11,994 12,724
31 12,542 12,770
25,5272011 1,388 16,4686,979 19,923 1,504 3,642 25,52714,618
24,7362009 1,374 15,3907,565 18,169 1,018 3,552 24,73615,668
NUMBER TESTED IN GRADES 9-11
25,3372010 1,426 16,1127,377 19,470 1,218 3,649 25,33715,395
July 29, 2011 Dallas ISD Evaluation & Accountability (Data Analysis, Research, and Reporting Services) V:\CILT\1112\CILT_1012.mdb rpt_TAKS_E_math_2_num_not_meet 2011-12 Campus Data Packet
DISTRICT SUMMARY 38

FemaleMigrant MaleAt RiskWhite AfricanAmer
Hispanic EconDisadv
SpecialEduc
LEP All DistrictYearGrade Number Tested(All Students)
Texas Assessment of Knowledge and Skills: MATHEMATICS
NUMBER NOT MEETING STANDARD
TAKS Math (2)
2011
2009
2010
18 10,762 10,217
37 12,066 11,789
28 11,143 10,467
21,018538 7,331 12,800 18,580 2,730 6,980 21,018 89,80617,601
3-11
23,890597 8,970 14,106 20,212 1,915 6,997 23,890 86,02020,260
21,647562 7,956 12,938 19,062 2,342 6,998 21,647 88,60417,218
84 44,902 44,832
106 42,571 43,371
94 44,160 44,371
89,8062011 4,072 61,45122,483 77,902 4,556 28,698 89,80654,674
86,0202009 4,135 56,72523,968 71,635 3,354 21,962 86,02051,870
NUMBER TESTED IN GRADES 3-11
88,6042010 4,269 59,53523,620 76,075 4,011 24,885 88,60443,912
July 29, 2011 Dallas ISD Evaluation & Accountability (Data Analysis, Research, and Reporting Services) V:\CILT\1112\CILT_1012.mdb rpt_TAKS_E_math_2_num_not_meet 2011-12 Campus Data Packet
DISTRICT SUMMARY 39

Numbers, Operations,and Quantitative
Reasoning
Patterns,Relationships, and
Algebraic Reasoning
Geometry andSpatial Reasoning
Concepts and Usesof Measurement
Probability andStatistics
MathematicalProcesses and Tools
YearGrade
OBJECTIVE
Texas Assessment of Knowledge and Skills: MATHEMATICS
AVERAGE PERCENTAGE OF ITEMS CORRECT BY OBJECTIVE
TAKS Math (3)
2011 81.0 77.9 84.2 79.8 81.7 65.3
2009 77.7 80.0 86.5 78.5 82.0
3
67.6
2010 79.9 76.5 82.5 77.4 80.5 63.8
2011 84.2 83.0 80.2 77.3 79.0 73.3
2009 85.0 80.2 76.9 78.6 79.2
4
72.9
2010 83.7 82.0 78.6 76.7 78.6 72.6
2011 81.8 79.7 84.8 77.9 80.9 74.6
2009 83.7 80.6 86.6 78.6 80.6
5
79.8
2010 81.9 79.6 83.8 78.5 80.2 75.1
2011 82.4 80.2 83.0 78.4 80.6 70.9
2009 81.9 80.3 83.5 78.5 80.7
3-5
73.2
2010 81.7 79.3 81.6 77.5 79.8 70.2
July 29, 2011 Dallas ISD Evaluation & Accountability (Data Analysis, Research, and Reporting Services) V:\CILT\1112\CILT_1012.mdb rpt_TAKS_E_math_3_obj_elem 2011-12 Campus Data Packet
DISTRICT SUMMARY 40
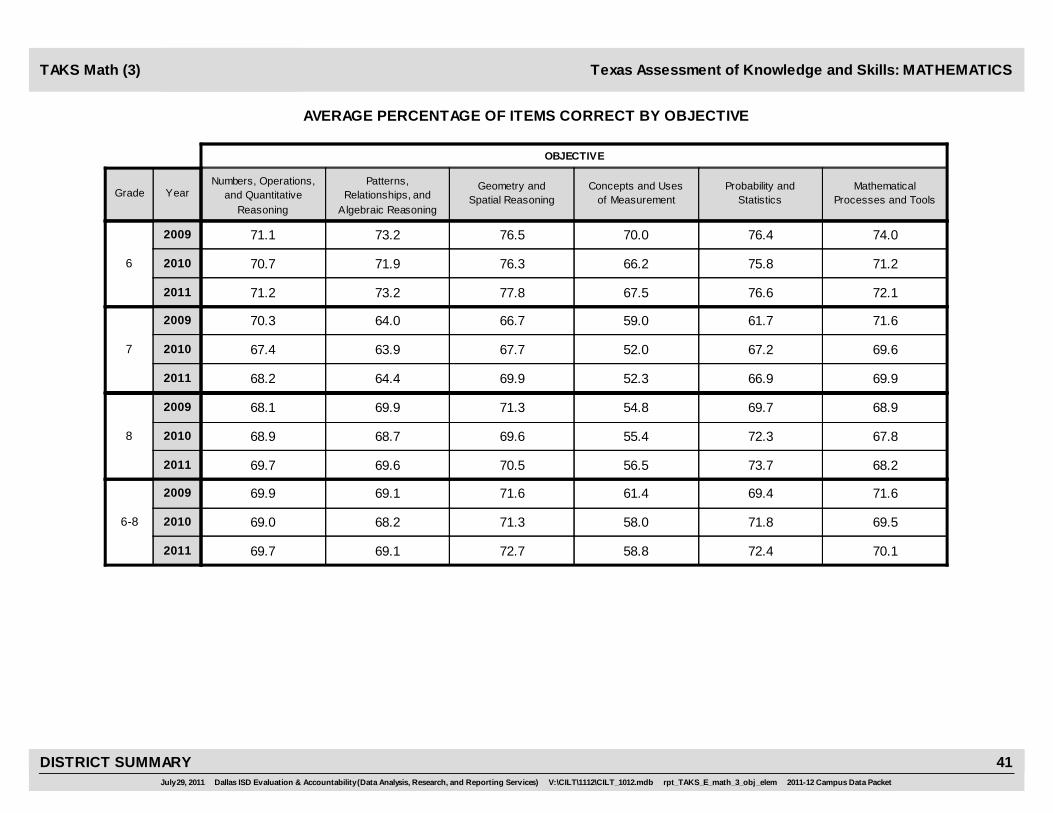
Numbers, Operations,and Quantitative
Reasoning
Patterns,Relationships, and
Algebraic Reasoning
Geometry andSpatial Reasoning
Concepts and Usesof Measurement
Probability andStatistics
MathematicalProcesses and Tools
YearGrade
OBJECTIVE
Texas Assessment of Knowledge and Skills: MATHEMATICS
AVERAGE PERCENTAGE OF ITEMS CORRECT BY OBJECTIVE
TAKS Math (3)
2011 71.2 73.2 77.8 67.5 76.6 72.1
2009 71.1 73.2 76.5 70.0 76.4
6
74.0
2010 70.7 71.9 76.3 66.2 75.8 71.2
2011 68.2 64.4 69.9 52.3 66.9 69.9
2009 70.3 64.0 66.7 59.0 61.7
7
71.6
2010 67.4 63.9 67.7 52.0 67.2 69.6
2011 69.7 69.6 70.5 56.5 73.7 68.2
2009 68.1 69.9 71.3 54.8 69.7
8
68.9
2010 68.9 68.7 69.6 55.4 72.3 67.8
2011 69.7 69.1 72.7 58.8 72.4 70.1
2009 69.9 69.1 71.6 61.4 69.4
6-8
71.6
2010 69.0 68.2 71.3 58.0 71.8 69.5
July 29, 2011 Dallas ISD Evaluation & Accountability (Data Analysis, Research, and Reporting Services) V:\CILT\1112\CILT_1012.mdb rpt_TAKS_E_math_3_obj_elem 2011-12 Campus Data Packet
DISTRICT SUMMARY 41

GeometricRelationshipsand SpatialReasoning
Tw o- and Three-Dimensional
Representations
Measurementand Similarity
Percents,Proportions,Probability,
and Statistics
MathematicalProcessesand Tools
FunctionalRelationships
Properties andAttributes of
Functions
LinearFunctions
LinearEquations and
Inequalities
Quadratic andOther Nonlinear
Functions
YearGrade
OBJECTIVE
Texas Assessment of Knowledge and Skills: MATHEMATICS
AVERAGE PERCENTAGE OF ITEMS CORRECT BY OBJECTIVE
TAKS Math (3)
2011 56.363.5 60.3 59.3 60.3 60.9 62.5 64.3 53.4 59.0
2009
2010
59.560.1 66.6 65.3 62.6 64.1
9
67.1 66.3 54.5 58.5
57.462.2 62.8 59.8 59.6 62.0 62.6 62.9 54.7 58.2
2011 59.671.8 59.0 63.3 68.9 64.5 67.1 70.7 58.9 57.5
2009
2010
60.570.2 58.4 63.6 63.6 61.2
10
61.1 72.4 50.3 58.1
60.872.5 62.0 66.7 70.6 66.3 68.3 71.5 59.1 58.1
2011 64.478.8 77.4 72.3 76.2 80.9 68.6 75.0 65.7 63.3
2009
2010
67.074.9 70.9 71.5 78.2 73.7
11
63.4 72.2 65.3 69.9
62.274.0 74.8 70.8 77.3 79.6 66.5 69.6 63.0 68.0
2011 59.870.8 64.7 64.4 67.8 67.9 65.8 69.6 58.8 59.7
2009
2010
61.867.3 65.1 66.4 67.1 65.7
9-11
64.2 69.8 56.0 61.4
59.868.8 65.8 65.1 68.1 68.2 65.5 67.6 58.4 60.9
July 29, 2011 Dallas ISD Evaluation & Accountability (Data Analysis, Research, and Reporting Services) V:\CILT\1112\CILT_1012.mdb rpt_TAKS_E_math_3_obj_high 2011-12 Campus Data Packet
DISTRICT SUMMARY 42

FemaleMigrant MaleAt RiskWhite AfricanAmer
Hispanic EconDisadv
SpecialEduc
LEP All DistrictYearGrade Number Tested(All Students)
Texas Assessment of Knowledge and Skills: MATHEMATICS
PERCENTAGE DEMONSTRATING COMMENDED PERFORMANCE
TAKS Math (4)
25.0 25.0 23.7
40.0 29.6 28.4
42.9 22.8 19.8
24.42011 41.8 20.2 24.5 23.1 8.9 22.9 24.4 12,28418.8
3
29.02009 48.4 21.0 30.4 27.5 17.4 27.7 29.0 12,22822.6
21.32010 39.8 15.6 21.9 19.9 9.6 19.5 21.3 12,5858.1
30.0 32.0 30.7
42.9 32.3 31.0
54.5 30.3 27.9
31.32011 45.2 22.3 33.2 30.3 11.0 32.1 31.3 12,07026.9
4
31.62009 48.2 21.7 34.1 30.2 16.0 29.2 31.6 10,64923.7
29.12010 46.4 20.4 30.8 27.9 14.4 28.9 29.1 11,5629.9
66.7 33.6 31.4
11.1 38.3 38.6
41.7 35.7 33.3
32.52011 53.6 22.6 34.2 31.2 13.4 32.6 32.5 11,28826.3
5
38.42009 58.0 30.7 39.8 36.5 20.5 26.3 38.4 10,66921.7
34.52010 54.9 24.8 36.3 32.7 14.6 24.8 34.5 10,68712.3
40.7 30.1 28.5
34.2 33.2 32.5
46.7 29.2 26.7
29.32011 46.6 21.7 30.5 28.1 11.1 28.9 29.3 35,64223.6
3-5
32.82009 51.3 24.3 34.5 31.2 17.9 27.9 32.8 33,54622.7
27.92010 46.6 20.0 29.2 26.4 12.9 24.1 27.9 34,83410.0
27 18,016 17,599
38 16,720 16,795
30 17,413 17,398
35,6422011 1,474 25,3148,327 32,773 1,508 17,733 35,64224,473
33,5462009 1,495 22,9898,669 30,107 1,205 13,053 33,54620,521
NUMBER TESTED IN GRADES 3-5
34,8342010 1,593 24,1678,704 31,832 1,388 14,978 34,83413,225
Shaded cells indicate percentages at or above 30 percent, the Gold Performance Acknow ledgment Standard for 2010-11.
July 29, 2011 Dallas ISD Evaluation & Accountability (Data Analysis, Research, and Reporting Services) V:\CILT\1112\CILT_1012.mdb rpt_TAKS_E_math_4_per_comm 2011-12 Campus Data Packet
DISTRICT SUMMARY 43

FemaleMigrant MaleAt RiskWhite AfricanAmer
Hispanic EconDisadv
SpecialEduc
LEP All DistrictYearGrade Number Tested(All Students)
Texas Assessment of Knowledge and Skills: MATHEMATICS
PERCENTAGE DEMONSTRATING COMMENDED PERFORMANCE
TAKS Math (4)
11.1 24.3 24.7
28.6 28.3 29.7
10.0 21.7 23.2
24.52011 45.6 13.2 26.8 22.9 6.2 15.5 24.5 9,58412.1
6
29.02009 58.7 18.2 31.0 26.8 7.8 18.6 29.0 9,56014.4
22.42010 37.3 14.0 24.3 21.3 7.2 13.4 22.4 9,7999.7
7.1 14.0 16.2
0.0 10.8 11.8
8.3 15.0 14.4
15.12011 31.4 8.4 16.1 14.0 3.2 7.2 15.1 9,5635.7
7
11.32009 28.7 6.4 12.0 10.2 2.3 4.5 11.3 9,0443.3
14.72010 44.9 7.4 15.2 12.6 3.0 6.2 14.7 9,4324.5
20.0 15.1 15.5
0.0 15.5 15.3
0.0 13.8 14.4
15.32011 43.6 8.7 15.5 13.3 3.3 5.7 15.3 9,4904.8
8
15.42009 31.0 8.3 16.9 14.1 4.0 5.9 15.4 9,1345.0
14.12010 31.6 7.2 15.4 12.9 2.1 7.3 14.1 9,2024.8
12.1 17.8 18.8
11.4 18.4 19.2
6.1 16.9 17.4
18.32011 40.7 10.1 19.5 16.8 4.3 10.1 18.3 28,6377.5
6-8
18.72009 39.8 11.0 20.2 17.4 4.8 11.1 18.7 27,7387.5
17.22010 38.1 9.5 18.5 15.8 4.1 9.4 17.2 28,4336.3
33 14,291 14,323
35 13,857 13,852
33 14,205 14,203
28,6372011 1,210 19,6697,177 25,206 1,544 7,323 28,63715,583
27,7382009 1,266 18,3467,734 23,359 1,131 5,357 27,73815,681
NUMBER TESTED IN GRADES 6-8
28,4332010 1,250 19,2567,539 24,773 1,405 6,258 28,43315,292
Shaded cells indicate percentages at or above 30 percent, the Gold Performance Acknow ledgment Standard for 2010-11.
July 29, 2011 Dallas ISD Evaluation & Accountability (Data Analysis, Research, and Reporting Services) V:\CILT\1112\CILT_1012.mdb rpt_TAKS_E_math_4_per_comm 2011-12 Campus Data Packet
DISTRICT SUMMARY 44

FemaleMigrant MaleAt RiskWhite AfricanAmer
Hispanic EconDisadv
SpecialEduc
LEP All DistrictYearGrade Number Tested(All Students)
Texas Assessment of Knowledge and Skills: MATHEMATICS
PERCENTAGE DEMONSTRATING COMMENDED PERFORMANCE
TAKS Math (4)
11.1 14.9 15.9
0.0 15.4 15.0
0.0 15.6 16.3
15.42011 37.7 9.1 15.6 13.9 1.3 6.6 15.4 9,3374.8
9
15.22009 34.1 8.9 16.3 13.9 1.2 6.3 15.2 10,1194.9
15.92010 34.0 9.2 16.9 14.6 0.7 4.6 15.9 10,0804.2
* 12.3 11.5
20.0 9.2 8.9
5.9 13.7 10.7
11.92011 30.5 6.9 11.8 10.6 0.8 3.3 11.9 8,9403.5
10
9.02009 28.7 4.8 8.8 7.6 1.2 2.5 9.0 8,0731.9
12.22010 31.5 6.8 12.3 11.1 1.1 3.2 12.2 8,3343.0
0.0 20.8 18.2
50.0 22.0 19.5
28.6 19.1 17.1
19.42011 40.3 11.9 20.2 18.0 1.3 7.7 19.4 7,2507.9
11
20.62009 45.2 14.1 20.8 18.8 5.6 8.2 20.6 6,5447.3
18.12010 43.3 10.9 18.5 16.2 3.3 6.3 18.1 6,9235.7
4.2 15.6 15.0
15.2 15.0 14.3
9.7 15.9 14.7
15.32011 36.0 9.1 15.5 13.9 1.1 5.7 15.3 25,5275.2
9-11
14.62009 35.7 9.0 15.0 13.1 2.1 5.4 14.6 24,7364.5
15.32010 35.9 8.9 15.8 13.9 1.5 4.6 15.3 25,3374.2
24 12,595 12,910
33 11,994 12,724
31 12,542 12,770
25,5272011 1,388 16,4686,979 19,923 1,504 3,642 25,52714,618
24,7362009 1,374 15,3907,565 18,169 1,018 3,552 24,73615,668
NUMBER TESTED IN GRADES 9-11
25,3372010 1,426 16,1127,377 19,470 1,218 3,649 25,33715,395
Shaded cells indicate percentages at or above 30 percent, the Gold Performance Acknow ledgment Standard for 2010-11.
July 29, 2011 Dallas ISD Evaluation & Accountability (Data Analysis, Research, and Reporting Services) V:\CILT\1112\CILT_1012.mdb rpt_TAKS_E_math_4_per_comm 2011-12 Campus Data Packet
DISTRICT SUMMARY 45

FemaleMigrant MaleAt RiskWhite AfricanAmer
Hispanic EconDisadv
SpecialEduc
LEP All DistrictYearGrade Number Tested(All Students)
Texas Assessment of Knowledge and Skills: MATHEMATICS
PERCENTAGE DEMONSTRATING COMMENDED PERFORMANCE
TAKS Math (4)
19.0 22.1 21.5
20.8 23.3 22.9
20.2 21.5 20.3
21.82011 41.2 14.1 23.0 20.8 5.5 21.2 21.8 89,80614.1
3-11
23.12009 42.6 15.2 24.6 22.1 8.7 20.2 23.1 86,02012.6
20.92010 40.5 13.2 22.1 19.8 6.4 17.6 20.9 88,6046.7
84 44,902 44,832
106 42,571 43,371
94 44,160 44,371
89,8062011 4,072 61,45122,483 77,902 4,556 28,698 89,80654,674
86,0202009 4,135 56,72523,968 71,635 3,354 21,962 86,02051,870
NUMBER TESTED IN GRADES 3-11
88,6042010 4,269 59,53523,620 76,075 4,011 24,885 88,60443,912
Shaded cells indicate percentages at or above 30 percent, the Gold Performance Acknow ledgment Standard for 2010-11.
July 29, 2011 Dallas ISD Evaluation & Accountability (Data Analysis, Research, and Reporting Services) V:\CILT\1112\CILT_1012.mdb rpt_TAKS_E_math_4_per_comm 2011-12 Campus Data Packet
DISTRICT SUMMARY 46

FemaleMigrant MaleAt RiskWhite AfricanAmer
Hispanic EconDisadv
SpecialEduc
LEP All DistrictYearGrade Number Tested(All Students)
Texas Assessment of Knowledge and Skills: WRITING
PERCENTAGE MEETING STANDARD
TAKS Writing (1)
* 84.1 89.7
84.6 83.6 91.2
* 86.3 93.3
86.92011 91.6 84.4 88.0 85.9 54.3 83.7 86.9 6,93576.6
4
87.42009 90.2 86.5 87.5 86.8 59.3 84.6 87.4 10,03282.1
89.82010 94.1 87.5 90.7 89.2 64.0 88.6 89.8 7,29477.9
3 3,445 3,488
13 4,968 5,058
3 3,627 3,665
6,9352011 510 3,4792,770 6,004 383 1,038 6,9352,722
10,0322009 499 6,5832,847 8,936 334 3,810 10,0325,527
NUMBER TESTED IN GRADE 4
7,2942010 490 3,8502,827 6,402 322 1,392 7,2942,191
Shaded cells indicate percentages below 70 percent, the 2010-11 AEIS minimum for an Academically Acceptable rating.
July 29, 2011 Dallas ISD Evaluation & Accountability (Data Analysis, Research, and Reporting Services) V:\CILT\1112\CILT_1012.mdb rpt_TAKS_E_write_1_per_meet 2011-12 Campus Data Packet
DISTRICT SUMMARY 47

FemaleMigrant MaleAt RiskWhite AfricanAmer
Hispanic EconDisadv
SpecialEduc
LEP All DistrictYearGrade Number Tested(All Students)
Texas Assessment of Knowledge and Skills: WRITING
PERCENTAGE MEETING STANDARD
TAKS Writing (1)
84.6 85.6 94.1
87.5 84.1 93.2
92.3 86.5 94.7
89.92011 92.8 87.3 90.6 89.4 52.6 81.3 89.9 9,50783.5
7
88.62009 93.9 86.8 88.9 88.2 57.7 75.1 88.6 8,98882.1
90.62010 94.9 89.2 90.8 90.2 56.9 80.5 90.6 9,36984.4
13 4,749 4,757
8 4,522 4,462
13 4,681 4,682
9,5072011 363 6,5782,339 8,315 515 2,427 9,5075,253
8,9882009 407 5,9252,523 7,476 333 1,578 8,9884,926
NUMBER TESTED IN GRADE 7
9,3692010 449 6,2782,524 8,118 432 2,145 9,3695,048
Shaded cells indicate percentages below 70 percent, the 2010-11 AEIS minimum for an Academically Acceptable rating.
July 29, 2011 Dallas ISD Evaluation & Accountability (Data Analysis, Research, and Reporting Services) V:\CILT\1112\CILT_1012.mdb rpt_TAKS_E_write_1_per_meet 2011-12 Campus Data Packet
DISTRICT SUMMARY 48

FemaleMigrant MaleAt RiskWhite AfricanAmer
Hispanic EconDisadv
SpecialEduc
LEP All DistrictYearGrade Number Tested(All Students)
Texas Assessment of Knowledge and Skills: WRITING
NUMBER NOT MEETING STANDARD
TAKS Writing (2)
* 548 360
2 815 445
* 498 246
9082011 43 433 419 845 175 169 908 6,935637
4
1,2642009 49 385 820 1,179 136 586 1,264 10,032992
7442010 29 353 357 694 116 159 744 7,294485
3 3,445 3,488
13 4,968 5,058
3 3,627 3,665
6,9352011 510 3,4792,770 6,004 383 1,038 6,9352,722
10,0322009 499 6,5832,847 8,936 334 3,810 10,0325,527
NUMBER TESTED IN GRADE 4
7,2942010 490 3,8502,827 6,402 322 1,392 7,2942,191
July 29, 2011 Dallas ISD Evaluation & Accountability (Data Analysis, Research, and Reporting Services) V:\CILT\1112\CILT_1012.mdb rpt_TAKS_E_write_2_num_not_meet 2011-12 Campus Data Packet
DISTRICT SUMMARY 49

FemaleMigrant MaleAt RiskWhite AfricanAmer
Hispanic EconDisadv
SpecialEduc
LEP All DistrictYearGrade Number Tested(All Students)
Texas Assessment of Knowledge and Skills: WRITING
NUMBER NOT MEETING STANDARD
TAKS Writing (2)
2 683 281
1 718 303
1 631 246
9642011 26 296 616 883 244 454 964 9,507869
7
1,0232009 25 332 659 879 141 393 1,023 8,988884
8782010 23 273 575 795 186 419 878 9,369790
13 4,749 4,757
8 4,522 4,462
13 4,681 4,682
9,5072011 363 6,5782,339 8,315 515 2,427 9,5075,253
8,9882009 407 5,9252,523 7,476 333 1,578 8,9884,926
NUMBER TESTED IN GRADE 7
9,3692010 449 6,2782,524 8,118 432 2,145 9,3695,048
July 29, 2011 Dallas ISD Evaluation & Accountability (Data Analysis, Research, and Reporting Services) V:\CILT\1112\CILT_1012.mdb rpt_TAKS_E_write_2_num_not_meet 2011-12 Campus Data Packet
DISTRICT SUMMARY 50

Written Composition:Effectiveness / Command
of Conventions¹
AppropriateOrganization of Ideas
Correct and EffectiveSentence Construction
Standard Usage andAppropriate Word Choice
Proofreading forPunctuation, Capitalization,
and SpellingYearGrade
OBJECTIVE
Texas Assessment of Knowledge and Skills: WRITING
AVERAGE PERCENTAGE OF ITEMS CORRECT BY OBJECTIVE
TAKS Writing (3)
2011 2.2 78.8 80.2 84.3 82.4
2009 2.2 85.2 80.4 85.1 89.5
4 2010 2.3 79.2 80.8 84.4 83.1
2011 2.4 77.6 70.4 79.2 81.7
2009 2.3 79.8 78.7 81.3 82.1
7 2010 2.4 77.8 70.7 79.8 82.0
¹Average rating on w ritten composition. TAKS compositions are rated on a scale of 1 to 4.
July 29, 2011 Dallas ISD Evaluation & Accountability (Data Analysis, Research, and Reporting Services) V:\CILT\1112\CILT_1012.mdb rpt_TAKS_E_write_3_obj 2011-12 Campus Data Packet
DISTRICT SUMMARY 51

FemaleMigrant MaleAt RiskWhite AfricanAmer
Hispanic EconDisadv
SpecialEduc
LEP All DistrictYearGrade Number Tested(All Students)
Texas Assessment of Knowledge and Skills: WRITING
PERCENTAGE DEMONSTRATING COMMENDED PERFORMANCE
TAKS Writing (4)
* 18.5 26.2
7.7 16.3 25.6
* 19.0 28.5
22.42011 44.9 19.8 20.3 19.3 4.2 15.2 22.4 6,9359.7
4
21.02009 38.3 19.9 19.9 19.1 6.9 13.6 21.0 10,03212.0
23.82010 43.7 21.6 22.4 21.1 7.5 16.8 23.8 7,2947.8
3 3,445 3,488
13 4,968 5,058
3 3,627 3,665
6,9352011 510 3,4792,770 6,004 383 1,038 6,9352,722
10,0322009 499 6,5832,847 8,936 334 3,810 10,0325,527
NUMBER TESTED IN GRADE 4
7,2942010 490 3,8502,827 6,402 322 1,392 7,2942,191
Shaded cells indicate percentages at or above 30 percent, the Gold Performance Acknow ledgment Standard for 2010-11.
July 29, 2011 Dallas ISD Evaluation & Accountability (Data Analysis, Research, and Reporting Services) V:\CILT\1112\CILT_1012.mdb rpt_TAKS_E_write_4_per_comm 2011-12 Campus Data Packet
DISTRICT SUMMARY 52

FemaleMigrant MaleAt RiskWhite AfricanAmer
Hispanic EconDisadv
SpecialEduc
LEP All DistrictYearGrade Number Tested(All Students)
Texas Assessment of Knowledge and Skills: WRITING
PERCENTAGE DEMONSTRATING COMMENDED PERFORMANCE
TAKS Writing (4)
30.8 18.2 31.4
0.0 16.7 27.9
23.1 21.0 31.5
24.82011 50.7 22.9 23.7 22.9 3.9 8.0 24.8 9,5079.4
7
22.32009 45.2 19.5 21.4 19.9 3.3 6.8 22.3 8,9888.3
26.32010 60.6 21.1 25.6 23.4 4.4 8.5 26.3 9,3699.4
13 4,749 4,757
8 4,522 4,462
13 4,681 4,682
9,5072011 363 6,5782,339 8,315 515 2,427 9,5075,253
8,9882009 407 5,9252,523 7,476 333 1,578 8,9884,926
NUMBER TESTED IN GRADE 7
9,3692010 449 6,2782,524 8,118 432 2,145 9,3695,048
Shaded cells indicate percentages at or above 30 percent, the Gold Performance Acknow ledgment Standard for 2010-11.
July 29, 2011 Dallas ISD Evaluation & Accountability (Data Analysis, Research, and Reporting Services) V:\CILT\1112\CILT_1012.mdb rpt_TAKS_E_write_4_per_comm 2011-12 Campus Data Packet
DISTRICT SUMMARY 53

FemaleMigrant MaleAt RiskWhite AfricanAmer
Hispanic EconDisadv
SpecialEduc
LEP All DistrictYearGrade Number Tested(All Students)
Texas Assessment of Knowledge and Skills: SOCIAL STUDIES
PERCENTAGE MEETING STANDARD
TAKS SS (1)
100.0 92.4 94.4
63.6 87.9 88.8
100.0 90.8 93.4
93.42011 96.2 91.2 94.1 93.0 69.3 87.7 93.4 9,32489.4
8
88.32009 96.3 86.3 88.6 87.7 66.6 75.6 88.3 9,23382.9
92.12010 95.0 89.4 93.0 91.7 65.1 84.1 92.1 9,08487.8
8 4,669 4,641
11 4,596 4,629
9 4,507 4,563
9,3242011 420 6,2172,473 7,993 501 1,956 9,3245,155
9,2332009 403 6,0082,688 7,572 365 1,388 9,2335,643
NUMBER TESTED IN GRADE 8
9,0842010 421 6,0062,519 7,725 473 1,512 9,0845,217
Shaded cells indicate percentages below 70 percent, the 2010-11 AEIS minimum for an Academically Acceptable rating.
July 29, 2011 Dallas ISD Evaluation & Accountability (Data Analysis, Research, and Reporting Services) V:\CILT\1112\CILT_1012.mdb rpt_TAKS_E_ss_1_per_meet 2011-12 Campus Data Packet
DISTRICT SUMMARY 54

FemaleMigrant MaleAt RiskWhite AfricanAmer
Hispanic EconDisadv
SpecialEduc
LEP All DistrictYearGrade Number Tested(All Students)
Texas Assessment of Knowledge and Skills: SOCIAL STUDIES
PERCENTAGE MEETING STANDARD
TAKS SS (1)
* 91.0 92.8
100.0 88.6 87.0
70.6 91.3 93.1
91.92011 96.4 87.9 93.1 91.6 54.8 80.2 91.9 8,83687.7
10
87.72009 98.4 85.7 87.8 86.8 60.8 68.0 87.7 7,95482.5
92.22010 97.3 88.6 93.3 91.7 65.8 82.7 92.2 8,25488.3
100.0 97.8 98.7
83.3 97.1 96.4
100.0 97.7 97.7
98.32011 99.5 97.6 98.7 98.2 87.3 93.7 98.3 7,24597.1
11
96.72009 99.5 96.2 96.7 96.4 79.6 86.9 96.7 6,53795.1
97.72010 100.0 96.6 98.0 97.4 81.3 92.1 97.7 6,91296.6
100.0 94.0 95.5
93.8 92.3 91.4
79.2 94.1 95.3
94.82011 97.9 92.3 95.6 94.6 68.9 86.0 94.8 16,08191.8
10-11
91.82009 99.0 90.5 91.7 91.1 68.0 75.7 91.8 14,49188.2
94.72010 98.6 92.3 95.4 94.2 72.6 87.0 94.7 15,16692.1
15 7,921 8,150
16 6,689 7,791
24 7,319 7,837
16,0812011 899 10,2454,474 12,468 929 2,107 16,0819,359
14,4912009 865 8,8944,469 10,408 563 2,024 14,4919,148
NUMBER TESTED IN GRADES 10-11
15,1662010 906 9,5394,469 11,477 727 2,129 15,1669,375
Shaded cells indicate percentages below 70 percent, the 2010-11 AEIS minimum for an Academically Acceptable rating.
July 29, 2011 Dallas ISD Evaluation & Accountability (Data Analysis, Research, and Reporting Services) V:\CILT\1112\CILT_1012.mdb rpt_TAKS_E_ss_1_per_meet 2011-12 Campus Data Packet
DISTRICT SUMMARY 55

FemaleMigrant MaleAt RiskWhite AfricanAmer
Hispanic EconDisadv
SpecialEduc
LEP All DistrictYearGrade Number Tested(All Students)
Texas Assessment of Knowledge and Skills: SOCIAL STUDIES
NUMBER NOT MEETING STANDARD
TAKS SS (2)
0 354 259
4 557 518
0 414 302
6152011 16 218 366 556 154 240 615 9,324547
8
1,0782009 15 369 687 933 122 338 1,078 9,233967
7192010 21 266 422 645 165 241 719 9,084634
8 4,669 4,641
11 4,596 4,629
9 4,507 4,563
9,3242011 420 6,2172,473 7,993 501 1,956 9,3245,155
9,2332009 403 6,0082,688 7,572 365 1,388 9,2335,643
NUMBER TESTED IN GRADE 8
9,0842010 421 6,0062,519 7,725 473 1,512 9,0845,217
July 29, 2011 Dallas ISD Evaluation & Accountability (Data Analysis, Research, and Reporting Services) V:\CILT\1112\CILT_1012.mdb rpt_TAKS_E_ss_2_num_not_meet 2011-12 Campus Data Packet
DISTRICT SUMMARY 56

FemaleMigrant MaleAt RiskWhite AfricanAmer
Hispanic EconDisadv
SpecialEduc
LEP All DistrictYearGrade Number Tested(All Students)
Texas Assessment of Knowledge and Skills: SOCIAL STUDIES
NUMBER NOT MEETING STANDARD
TAKS SS (2)
* 397 319
0 432 541
5 356 288
7182011 17 295 391 576 238 236 718 8,836652
10
9762009 7 345 604 761 136 383 976 7,954879
6442010 13 274 349 527 139 199 644 8,254590
0 76 50
1 83 129
0 75 84
1262011 2 50 59 101 51 58 126 7,245116
11
2132009 2 78 131 168 44 108 213 6,537200
1592010 0 71 86 133 60 77 159 6,912147
0 473 369
1 515 670
5 431 372
8442011 19 345 450 677 289 294 844 16,081768
10-11
1,1892009 9 423 735 929 180 491 1,189 14,4911,079
8032010 13 345 435 660 199 276 803 15,166737
15 7,921 8,150
16 6,689 7,791
24 7,319 7,837
16,0812011 899 10,2454,474 12,468 929 2,107 16,0819,359
14,4912009 865 8,8944,469 10,408 563 2,024 14,4919,148
NUMBER TESTED IN GRADES 10-11
15,1662010 906 9,5394,469 11,477 727 2,129 15,1669,375
July 29, 2011 Dallas ISD Evaluation & Accountability (Data Analysis, Research, and Reporting Services) V:\CILT\1112\CILT_1012.mdb rpt_TAKS_E_ss_2_num_not_meet 2011-12 Campus Data Packet
DISTRICT SUMMARY 57

Issues and Eventsin U.S. History
Geographic Inf luenceson History
Economic and SocialInf luences on History
Political Inf luenceson History Critical-Thinking SkillsYearGrade
OBJECTIVE
Texas Assessment of Knowledge and Skills: SOCIAL STUDIES
AVERAGE PERCENTAGE OF ITEMS CORRECT BY OBJECTIVE
TAKS SS (3)
2011 72.0 74.8 76.9 69.1 73.6
2009 73.5 77.2 75.2 71.2 80.3
8 2010 70.3 74.1 75.8 67.7 72.5
July 29, 2011 Dallas ISD Evaluation & Accountability (Data Analysis, Research, and Reporting Services) V:\CILT\1112\CILT_1012.mdb rpt_TAKS_E_ss_3_obj 2011-12 Campus Data Packet
DISTRICT SUMMARY 58

Issues and Eventsin U.S. History
Geographic Inf luenceson History
Economic and SocialInf luences on History
Political Inf luenceson History Critical-Thinking SkillsYearGrade
OBJECTIVE
Texas Assessment of Knowledge and Skills: SOCIAL STUDIES
AVERAGE PERCENTAGE OF ITEMS CORRECT BY OBJECTIVE
TAKS SS (3)
2011 71.8 79.7 81.4 71.2 77.4
2009 70.4 80.2 83.5 70.2 78.9
10 2010 70.7 79.2 81.9 71.7 78.2
2011 75.2 81.1 83.8 83.5 87.4
2009 73.9 82.6 83.9 83.9 85.8
11 2010 72.5 79.2 80.9 82.1 86.5
2011 73.3 80.3 82.5 76.8 81.9
2009 72.0 81.3 83.7 76.4 82.0
10-11 2010 71.5 79.2 81.4 76.5 82.0
July 29, 2011 Dallas ISD Evaluation & Accountability (Data Analysis, Research, and Reporting Services) V:\CILT\1112\CILT_1012.mdb rpt_TAKS_E_ss_3_obj 2011-12 Campus Data Packet
DISTRICT SUMMARY 59

FemaleMigrant MaleAt RiskWhite AfricanAmer
Hispanic EconDisadv
SpecialEduc
LEP All DistrictYearGrade Number Tested(All Students)
Texas Assessment of Knowledge and Skills: SOCIAL STUDIES
PERCENTAGE DEMONSTRATING COMMENDED PERFORMANCE
TAKS SS (4)
25.0 36.3 33.4
18.2 34.3 29.1
22.2 34.2 30.5
34.92011 66.9 26.6 35.6 32.7 10.2 17.7 34.9 9,32418.3
8
31.72009 62.8 25.9 31.7 29.5 10.7 14.2 31.7 9,23316.1
32.32010 55.6 25.1 33.3 30.3 6.8 16.2 32.3 9,08416.4
8 4,669 4,641
11 4,596 4,629
9 4,507 4,563
9,3242011 420 6,2172,473 7,993 501 1,956 9,3245,155
9,2332009 403 6,0082,688 7,572 365 1,388 9,2335,643
NUMBER TESTED IN GRADE 8
9,0842010 421 6,0062,519 7,725 473 1,512 9,0845,217
Shaded cells indicate percentages at or above 30 percent, the Gold Performance Acknow ledgment Standard for 2010-11.
July 29, 2011 Dallas ISD Evaluation & Accountability (Data Analysis, Research, and Reporting Services) V:\CILT\1112\CILT_1012.mdb rpt_TAKS_E_ss_4_per_comm 2011-12 Campus Data Packet
DISTRICT SUMMARY 60

FemaleMigrant MaleAt RiskWhite AfricanAmer
Hispanic EconDisadv
SpecialEduc
LEP All DistrictYearGrade Number Tested(All Students)
Texas Assessment of Knowledge and Skills: SOCIAL STUDIES
PERCENTAGE DEMONSTRATING COMMENDED PERFORMANCE
TAKS SS (4)
* 39.5 34.0
60.0 33.6 26.5
11.8 39.2 33.0
36.72011 65.8 26.6 38.2 34.2 5.9 15.6 36.7 8,83620.4
10
29.82009 66.6 25.3 28.4 26.5 9.2 6.9 29.8 7,95413.5
36.02010 62.4 27.1 37.4 33.6 6.2 15.9 36.0 8,25418.9
40.0 55.8 47.0
83.3 47.3 33.5
57.1 51.7 41.2
51.22011 76.9 45.9 51.2 48.1 16.9 28.0 51.2 7,24534.2
11
39.62009 74.6 32.4 39.2 35.3 14.8 12.9 39.6 6,53723.4
46.12010 80.7 38.9 45.9 42.8 15.3 21.9 46.1 6,91230.0
26.7 46.7 40.0
68.8 39.5 29.8
25.0 44.7 36.9
43.32011 71.1 35.4 44.0 40.5 10.7 21.0 43.3 16,08126.4
10-11
34.22009 70.5 28.6 33.2 30.4 11.4 9.3 34.2 14,49118.0
40.62010 71.0 32.6 41.3 37.7 10.2 18.6 40.6 15,16624.0
15 7,921 8,150
16 6,689 7,791
24 7,319 7,837
16,0812011 899 10,2454,474 12,468 929 2,107 16,0819,359
14,4912009 865 8,8944,469 10,408 563 2,024 14,4919,148
NUMBER TESTED IN GRADES 10-11
15,1662010 906 9,5394,469 11,477 727 2,129 15,1669,375
Shaded cells indicate percentages at or above 30 percent, the Gold Performance Acknow ledgment Standard for 2010-11.
July 29, 2011 Dallas ISD Evaluation & Accountability (Data Analysis, Research, and Reporting Services) V:\CILT\1112\CILT_1012.mdb rpt_TAKS_E_ss_4_per_comm 2011-12 Campus Data Packet
DISTRICT SUMMARY 61
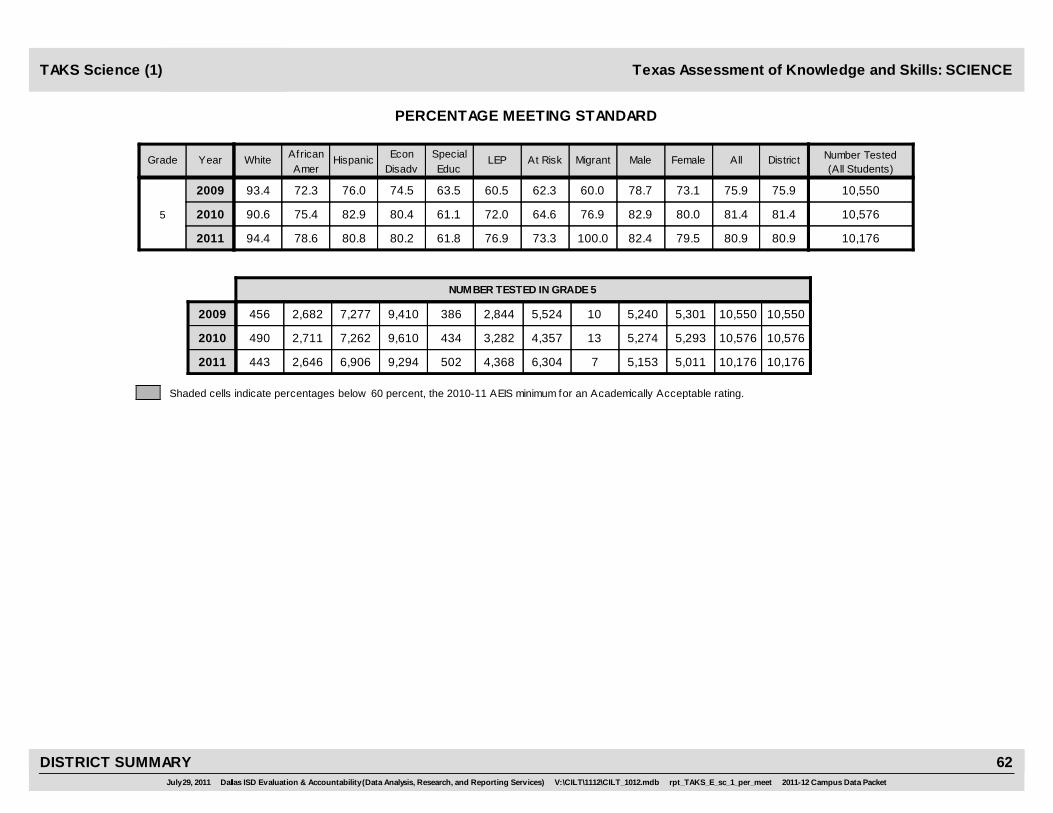
FemaleMigrant MaleAt RiskWhite AfricanAmer
Hispanic EconDisadv
SpecialEduc
LEP All DistrictYearGrade Number Tested(All Students)
Texas Assessment of Knowledge and Skills: SCIENCE
PERCENTAGE MEETING STANDARD
TAKS Science (1)
100.0 82.4 79.5
60.0 78.7 73.1
76.9 82.9 80.0
80.92011 94.4 78.6 80.8 80.2 61.8 76.9 80.9 10,17673.3
5
75.92009 93.4 72.3 76.0 74.5 63.5 60.5 75.9 10,55062.3
81.42010 90.6 75.4 82.9 80.4 61.1 72.0 81.4 10,57664.6
7 5,153 5,011
10 5,240 5,301
13 5,274 5,293
10,1762011 443 6,9062,646 9,294 502 4,368 10,1766,304
10,5502009 456 7,2772,682 9,410 386 2,844 10,5505,524
NUMBER TESTED IN GRADE 5
10,5762010 490 7,2622,711 9,610 434 3,282 10,5764,357
Shaded cells indicate percentages below 60 percent, the 2010-11 AEIS minimum for an Academically Acceptable rating.
July 29, 2011 Dallas ISD Evaluation & Accountability (Data Analysis, Research, and Reporting Services) V:\CILT\1112\CILT_1012.mdb rpt_TAKS_E_sc_1_per_meet 2011-12 Campus Data Packet
DISTRICT SUMMARY 62

FemaleMigrant MaleAt RiskWhite AfricanAmer
Hispanic EconDisadv
SpecialEduc
LEP All DistrictYearGrade Number Tested(All Students)
Texas Assessment of Knowledge and Skills: SCIENCE
PERCENTAGE MEETING STANDARD
TAKS Science (1)
66.7 69.8 65.5
45.5 61.7 56.7
77.8 67.3 61.2
67.62011 88.7 59.7 69.1 65.9 32.1 46.7 67.6 9,36850.6
8
59.22009 84.0 50.7 60.8 57.6 27.5 36.1 59.2 9,29242.8
64.22010 81.7 56.2 66.0 62.5 23.9 41.7 64.2 9,11247.5
9 4,691 4,663
11 4,635 4,649
9 4,527 4,571
9,3682011 426 6,2632,469 8,030 492 1,973 9,3685,186
9,2922009 406 6,0522,700 7,619 367 1,395 9,2925,686
NUMBER TESTED IN GRADE 8
9,1122010 420 6,0342,522 7,750 461 1,525 9,1125,239
Shaded cells indicate percentages below 60 percent, the 2010-11 AEIS minimum for an Academically Acceptable rating.
July 29, 2011 Dallas ISD Evaluation & Accountability (Data Analysis, Research, and Reporting Services) V:\CILT\1112\CILT_1012.mdb rpt_TAKS_E_sc_1_per_meet 2011-12 Campus Data Packet
DISTRICT SUMMARY 63

FemaleMigrant MaleAt RiskWhite AfricanAmer
Hispanic EconDisadv
SpecialEduc
LEP All DistrictYearGrade Number Tested(All Students)
Texas Assessment of Knowledge and Skills: SCIENCE
PERCENTAGE MEETING STANDARD
TAKS Science (1)
* 66.9 64.6
90.0 55.7 49.2
23.5 66.5 63.7
65.72011 87.3 57.8 66.9 64.3 19.1 39.0 65.7 8,91150.0
10
52.32009 88.2 45.4 51.9 49.2 22.3 22.9 52.3 8,04434.4
65.12010 85.5 56.4 66.8 63.2 25.3 37.7 65.1 8,32849.6
66.7 87.9 87.7
100.0 84.0 80.9
100.0 88.3 87.5
87.72011 95.8 84.1 88.8 86.9 47.1 67.9 87.7 7,24679.4
11
82.22009 97.1 80.0 81.6 80.4 39.2 57.5 82.2 6,54573.9
87.92010 97.9 86.1 87.8 86.7 50.0 69.6 87.9 6,92381.8
64.3 76.1 75.1
93.8 67.9 63.9
45.8 76.1 74.8
75.62011 91.3 69.7 76.7 74.4 31.1 51.3 75.6 16,15762.7
10-11
65.72009 92.6 61.2 65.0 63.0 28.6 36.9 65.7 14,58952.1
75.42010 91.3 70.1 76.2 73.7 36.1 52.2 75.4 15,25164.4
14 7,942 8,205
16 6,740 7,835
24 7,355 7,886
16,1572011 901 10,3124,472 12,512 896 2,154 16,1579,425
14,5892009 863 8,9474,517 10,481 535 2,046 14,5899,212
NUMBER TESTED IN GRADES 10-11
15,2512010 904 9,6004,492 11,551 707 2,148 15,2519,440
Shaded cells indicate percentages below 60 percent, the 2010-11 AEIS minimum for an Academically Acceptable rating.
July 29, 2011 Dallas ISD Evaluation & Accountability (Data Analysis, Research, and Reporting Services) V:\CILT\1112\CILT_1012.mdb rpt_TAKS_E_sc_1_per_meet 2011-12 Campus Data Packet
DISTRICT SUMMARY 64
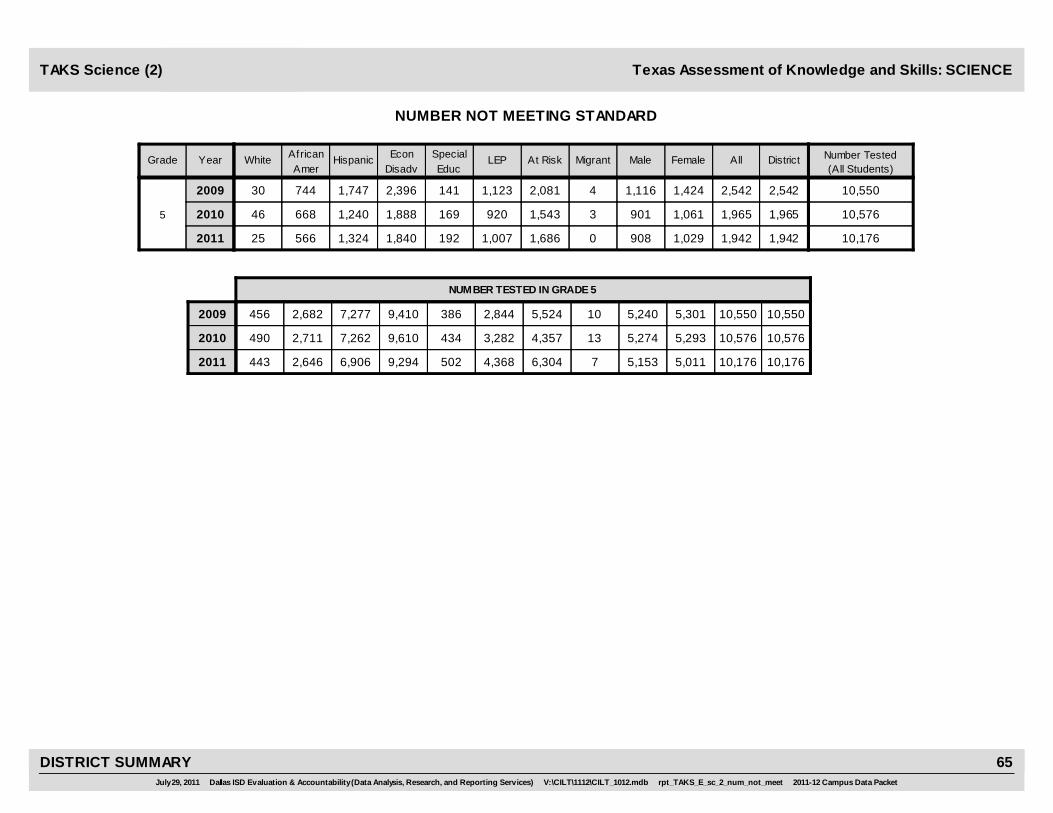
FemaleMigrant MaleAt RiskWhite AfricanAmer
Hispanic EconDisadv
SpecialEduc
LEP All DistrictYearGrade Number Tested(All Students)
Texas Assessment of Knowledge and Skills: SCIENCE
NUMBER NOT MEETING STANDARD
TAKS Science (2)
0 908 1,029
4 1,116 1,424
3 901 1,061
1,9422011 25 566 1,324 1,840 192 1,007 1,942 10,1761,686
5
2,5422009 30 744 1,747 2,396 141 1,123 2,542 10,5502,081
1,9652010 46 668 1,240 1,888 169 920 1,965 10,5761,543
7 5,153 5,011
10 5,240 5,301
13 5,274 5,293
10,1762011 443 6,9062,646 9,294 502 4,368 10,1766,304
10,5502009 456 7,2772,682 9,410 386 2,844 10,5505,524
NUMBER TESTED IN GRADE 5
10,5762010 490 7,2622,711 9,610 434 3,282 10,5764,357
July 29, 2011 Dallas ISD Evaluation & Accountability (Data Analysis, Research, and Reporting Services) V:\CILT\1112\CILT_1012.mdb rpt_TAKS_E_sc_2_num_not_meet 2011-12 Campus Data Packet
DISTRICT SUMMARY 65

FemaleMigrant MaleAt RiskWhite AfricanAmer
Hispanic EconDisadv
SpecialEduc
LEP All DistrictYearGrade Number Tested(All Students)
Texas Assessment of Knowledge and Skills: SCIENCE
NUMBER NOT MEETING STANDARD
TAKS Science (2)
3 1,416 1,607
6 1,775 2,014
2 1,482 1,772
3,0322011 48 995 1,935 2,739 334 1,052 3,032 9,3682,563
8
3,7942009 65 1,332 2,371 3,234 266 891 3,794 9,2923,254
3,2612010 77 1,104 2,051 2,905 351 889 3,261 9,1122,750
9 4,691 4,663
11 4,635 4,649
9 4,527 4,571
9,3682011 426 6,2632,469 8,030 492 1,973 9,3685,186
9,2922009 406 6,0522,700 7,619 367 1,395 9,2925,686
NUMBER TESTED IN GRADE 8
9,1122010 420 6,0342,522 7,750 461 1,525 9,1125,239
July 29, 2011 Dallas ISD Evaluation & Accountability (Data Analysis, Research, and Reporting Services) V:\CILT\1112\CILT_1012.mdb rpt_TAKS_E_sc_2_num_not_meet 2011-12 Campus Data Packet
DISTRICT SUMMARY 66

FemaleMigrant MaleAt RiskWhite AfricanAmer
Hispanic EconDisadv
SpecialEduc
LEP All DistrictYearGrade Number Tested(All Students)
Texas Assessment of Knowledge and Skills: SCIENCE
NUMBER NOT MEETING STANDARD
TAKS Science (2)
* 1,472 1,580
1 1,698 2,135
13 1,382 1,525
3,0582011 60 1,031 1,895 2,462 414 757 3,058 8,9112,679
10
3,8412009 52 1,341 2,402 2,974 261 941 3,841 8,0443,344
2,9102010 70 1,055 1,761 2,357 298 730 2,910 8,3282,574
3 423 461
0 466 695
0 378 460
8882011 18 322 512 735 203 293 888 7,246839
11
1,1622009 12 411 727 906 121 351 1,162 6,5451,073
8382010 9 288 523 682 154 297 838 6,923788
5 1,895 2,041
1 2,164 2,830
13 1,760 1,985
3,9462011 78 1,353 2,407 3,197 617 1,050 3,946 16,1573,518
10-11
5,0032009 64 1,752 3,129 3,880 382 1,292 5,003 14,5894,417
3,7482010 79 1,343 2,284 3,039 452 1,027 3,748 15,2513,362
14 7,942 8,205
16 6,740 7,835
24 7,355 7,886
16,1572011 901 10,3124,472 12,512 896 2,154 16,1579,425
14,5892009 863 8,9474,517 10,481 535 2,046 14,5899,212
NUMBER TESTED IN GRADES 10-11
15,2512010 904 9,6004,492 11,551 707 2,148 15,2519,440
July 29, 2011 Dallas ISD Evaluation & Accountability (Data Analysis, Research, and Reporting Services) V:\CILT\1112\CILT_1012.mdb rpt_TAKS_E_sc_2_num_not_meet 2011-12 Campus Data Packet
DISTRICT SUMMARY 67

Nature of Science Life Sciences Physical Sciences Earth SciencesYearGrade
OBJECTIVE
Texas Assessment of Knowledge and Skills: SCIENCE
AVERAGE PERCENTAGE OF ITEMS CORRECT BY OBJECTIVE
TAKS Science (3)
2011 83.3 84.8 84.1 82.2
2009 86.4 87.7 82.8 67.3
5 2010 84.2 86.3 85.3 74.4
July 29, 2011 Dallas ISD Evaluation & Accountability (Data Analysis, Research, and Reporting Services) V:\CILT\1112\CILT_1012.mdb rpt_TAKS_E_sc_3_obj_elem 2011-12 Campus Data Packet
DISTRICT SUMMARY 68

Nature of ScienceLiving Systems and
the EnvironmentStructures and
Properties of MatterMotion, Forces,
and EnergyEarth and
Space SystemsYearGrade
OBJECTIVE
Texas Assessment of Knowledge and Skills: SCIENCE
AVERAGE PERCENTAGE OF ITEMS CORRECT BY OBJECTIVE
TAKS Science (3)
2011 74.5 73.9 69.4 66.8 67.3
2009 71.9 68.8 66.1 73.2 60.5
8 2010 73.8 72.9 65.6 65.5 66.8
July 29, 2011 Dallas ISD Evaluation & Accountability (Data Analysis, Research, and Reporting Services) V:\CILT\1112\CILT_1012.mdb rpt_TAKS_E_sc_3_obj_mid 2011-12 Campus Data Packet
DISTRICT SUMMARY 68

Nature of ScienceOrganization ofLiving Systems
Interdependence ofOrganisms andthe Environment
Structures andProperties of Matter
Motion, Forces,and Energy
YearGrade
OBJECTIVE
Texas Assessment of Knowledge and Skills: SCIENCE
AVERAGE PERCENTAGE OF ITEMS CORRECT BY OBJECTIVE
TAKS Science (3)
2011 72.7 63.1 66.7 61.7 58.2
2009 69.2 62.6 60.1 52.5 66.2
10 2010 72.6 62.7 66.2 61.8 57.4
2011 73.0 71.5 78.7 71.4 68.8
2009 70.4 66.2 76.1 68.7 67.5
11 2010 70.9 63.7 73.6 68.6 69.5
2011 72.8 66.9 72.1 66.0 63.0
2009 69.7 64.3 67.2 59.8 66.8
10-11 2010 71.8 63.1 69.6 64.9 62.9
July 29, 2011 Dallas ISD Evaluation & Accountability (Data Analysis, Research, and Reporting Services) V:\CILT\1112\CILT_1012.mdb rpt_TAKS_E_sc_3_obj_high 2011-12 Campus Data Packet
DISTRICT SUMMARY 70

FemaleMigrant MaleAt RiskWhite AfricanAmer
Hispanic EconDisadv
SpecialEduc
LEP All DistrictYearGrade Number Tested(All Students)
Texas Assessment of Knowledge and Skills: SCIENCE
PERCENTAGE DEMONSTRATING COMMENDED PERFORMANCE
TAKS Science (4)
57.1 36.3 31.6
0.0 33.8 24.4
30.8 37.0 28.7
34.02011 58.2 29.8 33.4 32.3 18.1 29.1 34.0 10,17624.7
5
29.12009 59.9 24.5 28.6 26.9 17.6 15.6 29.1 10,55015.2
32.82010 59.2 24.9 33.7 30.8 16.4 20.7 32.8 10,57613.4
7 5,153 5,011
10 5,240 5,301
13 5,274 5,293
10,1762011 443 6,9062,646 9,294 502 4,368 10,1766,304
10,5502009 456 7,2772,682 9,410 386 2,844 10,5505,524
NUMBER TESTED IN GRADES 5
10,5762010 490 7,2622,711 9,610 434 3,282 10,5764,357
Shaded cells indicate percentages at or above 30 percent, the Gold Performance Acknow ledgment Standard for 2010-11.
July 29, 2011 Dallas ISD Evaluation & Accountability (Data Analysis, Research, and Reporting Services) V:\CILT\1112\CILT_1012.mdb rpt_TAKS_E_sc_4_per_comm 2011-12 Campus Data Packet
DISTRICT SUMMARY 71

FemaleMigrant MaleAt RiskWhite AfricanAmer
Hispanic EconDisadv
SpecialEduc
LEP All DistrictYearGrade Number Tested(All Students)
Texas Assessment of Knowledge and Skills: SCIENCE
PERCENTAGE DEMONSTRATING COMMENDED PERFORMANCE
TAKS Science (4)
11.1 21.6 16.2
0.0 15.3 11.4
11.1 19.5 14.6
18.92011 54.0 12.2 18.7 16.5 5.7 6.0 18.9 9,3686.2
8
13.32009 38.7 8.7 13.3 11.3 4.4 3.7 13.3 9,2923.9
17.02010 45.0 10.9 17.2 15.0 3.7 5.4 17.0 9,1125.3
9 4,691 4,663
11 4,635 4,649
9 4,527 4,571
9,3682011 426 6,2632,469 8,030 492 1,973 9,3685,186
9,2922009 406 6,0522,700 7,619 367 1,395 9,2925,686
NUMBER TESTED IN GRADES 8
9,1122010 420 6,0342,522 7,750 461 1,525 9,1125,239
Shaded cells indicate percentages at or above 30 percent, the Gold Performance Acknow ledgment Standard for 2010-11.
July 29, 2011 Dallas ISD Evaluation & Accountability (Data Analysis, Research, and Reporting Services) V:\CILT\1112\CILT_1012.mdb rpt_TAKS_E_sc_4_per_comm 2011-12 Campus Data Packet
DISTRICT SUMMARY 72

FemaleMigrant MaleAt RiskWhite AfricanAmer
Hispanic EconDisadv
SpecialEduc
LEP All DistrictYearGrade Number Tested(All Students)
Texas Assessment of Knowledge and Skills: SCIENCE
PERCENTAGE DEMONSTRATING COMMENDED PERFORMANCE
TAKS Science (4)
* 11.6 10.4
0.0 7.1 4.5
5.9 11.6 9.1
11.02011 34.2 6.4 10.3 9.3 1.4 2.5 11.0 8,9112.9
10
5.72009 22.9 3.5 5.1 4.0 1.5 1.0 5.7 8,0440.9
10.42010 32.9 6.0 9.8 8.5 0.5 1.9 10.4 8,3282.0
0.0 19.8 15.1
50.0 15.2 11.1
0.0 12.5 9.5
17.32011 42.3 11.9 16.8 15.0 1.3 4.8 17.3 7,2466.3
11
12.92009 38.5 10.6 10.9 10.2 2.5 1.6 12.9 6,5453.7
10.92010 32.5 7.7 10.0 9.0 1.6 3.0 10.9 6,9233.6
0.0 15.2 12.5
18.8 10.6 7.6
4.2 12.0 9.3
13.82011 38.1 8.9 13.2 11.8 1.3 3.5 13.8 16,1574.4
10-11
9.02009 30.5 6.7 7.6 6.8 1.9 1.2 9.0 14,5892.1
10.62010 32.7 6.8 9.9 8.7 1.0 2.4 10.6 15,2512.8
14 7,942 8,205
16 6,740 7,835
24 7,355 7,886
16,1572011 901 10,3124,472 12,512 896 2,154 16,1579,425
14,5892009 863 8,9474,517 10,481 535 2,046 14,5899,212
NUMBER TESTED IN GRADES 10-11
15,2512010 904 9,6004,492 11,551 707 2,148 15,2519,440
Shaded cells indicate percentages at or above 30 percent, the Gold Performance Acknow ledgment Standard for 2010-11.
July 29, 2011 Dallas ISD Evaluation & Accountability (Data Analysis, Research, and Reporting Services) V:\CILT\1112\CILT_1012.mdb rpt_TAKS_E_sc_4_per_comm 2011-12 Campus Data Packet
DISTRICT SUMMARY 73

FemaleMigrant MaleAt RiskWhite AfricanAmer
Hispanic EconDisadv
SpecialEduc
LEP All DistrictYearGrade Number Tested(All Students)
Spanish Texas Assessment of Knowledge and Skills: READING
PERCENTAGE MEETING STANDARD
TAKS (SP) Read (1)
100.0 83.8 90.7
88.9 86.4 92.3
* 80.1 89.1
87.22011 62.5 * 87.2 87.3 49.3 87.2 87.2 5,53787.1
3
89.42009 * * 89.4 89.5 58.2 89.3 89.4 4,83689.3
84.52010 * * 84.5 84.5 48.2 84.4 84.5 5,57274.6
87.5 82.0 88.0
68.8 76.0
75.0 82.1 86.7
85.02011 * * 85.0 85.0 41.1 84.9 85.0 5,02384.9
4
72.72009 72.7 72.8 30.0 73.0 72.7 98372.8
84.42010 * 84.4 84.3 54.7 84.4 84.4 4,18368.6
* 83.8 88.6
* 75.5 83.3
78.3 81.7
86.32011 * 86.3 86.3 53.2 86.3 86.3 2,90886.3
5
79.72009 79.7 80.2 42.9 79.4 79.7 42479.7
80.32010 80.3 80.0 45.5 80.2 80.3 60868.4
83.3 83.1 89.2
90.9 83.1 88.9
83.3 80.8 87.6
86.22011 73.3 * 86.2 86.2 46.9 86.1 86.2 13,46886.1
3-5
86.12009 * * 86.1 86.2 50.4 86.0 86.1 6,24386.0
84.22010 * * 84.2 84.2 50.2 84.2 84.2 10,36371.2
18 6,726 6,735
11 3,046 3,197
12 5,154 5,205
13,4682011 15 13,4223 13,221 290 13,239 13,46813,223
6,2432009 2 6,2361 6,088 135 6,110 6,2436,074
NUMBER TESTED IN GRADES 3-5
10,3632010 2 10,3544 10,154 209 10,127 10,3633,230
Shaded cells indicate percentages below 70 percent, the 2010-11 AEIS minimum for an Academically Acceptable rating.
July 29, 2011 Dallas ISD Evaluation & Accountability (Data Analysis, Research, and Reporting Services) V:\CILT\1112\CILT_1012.mdb rpt_TAKS_S_read_1_per_meet 2011-12 Campus Data Packet
DISTRICT SUMMARY 74

FemaleMigrant MaleAt RiskWhite AfricanAmer
Hispanic EconDisadv
SpecialEduc
LEP All DistrictYearGrade Number Tested(All Students)
Spanish Texas Assessment of Knowledge and Skills: READING
NUMBER NOT MEETING STANDARD
TAKS (SP) Read (2)
0 452 256
1 327 187
* 566 297
7102011 3 * 705 690 69 699 710 5,537700
3
5142009 * * 512 494 38 505 514 4,836504
8632010 * * 863 846 58 847 863 5,572364
1 458 297
139 129
2 368 283
7552011 * * 754 741 63 743 755 5,023744
4
2682009 268 262 21 264 268 983262
6512010 * 650 642 34 639 651 4,183465
* 225 173
* 48 38
57 63
3982011 * 397 393 22 393 398 2,908393
5
862009 86 82 8 86 86 42484
1202010 120 119 12 119 120 608100
3 1,135 726
1 514 354
2 991 643
1,8632011 4 * 1,856 1,824 154 1,835 1,863 13,4681,837
3-5
8682009 * * 866 838 67 855 868 6,243850
1,6342010 * * 1,633 1,607 104 1,605 1,634 10,363929
18 6,726 6,735
11 3,046 3,197
12 5,154 5,205
13,4682011 15 13,4223 13,221 290 13,239 13,46813,223
6,2432009 2 6,2361 6,088 135 6,110 6,2436,074
NUMBER TESTED IN GRADES 3-5
10,3632010 2 10,3544 10,154 209 10,127 10,3633,230
July 29, 2011 Dallas ISD Evaluation & Accountability (Data Analysis, Research, and Reporting Services) V:\CILT\1112\CILT_1012.mdb rpt_TAKS_S_read_2_num_not_meet 2011-12 Campus Data Packet
DISTRICT SUMMARY 75

Basic UnderstandingApplying Knowledge of
Literary ElementsUsing Strategies
to AnalyzeApplying Critical-Thinking SkillsYearGrade
OBJECTIVE
Spanish Texas Assessment of Knowledge and Skills: READING
AVERAGE PERCENTAGE OF ITEMS CORRECT BY OBJECTIVE
TAKS (SP) Read (3)
2011 77.0 85.0 79.1 80.0
2009
2010
78.6 86.7 80.8 76.5
3 74.8 83.6 77.6 77.9
2011 78.7 82.5 82.1 79.1
2009
2010
73.8 74.4 71.3 68.4
4 78.1 82.3 81.5 78.8
2011 76.1 80.2 78.3 76.7
2009
2010
75.3 73.9 73.5 66.0
5 73.3 76.6 75.5 71.9
2011 77.4 83.0 80.1 79.0
2009
2010
77.6 83.9 78.8 74.5
ALL 76.0 82.7 79.1 77.9
July 29, 2011 Dallas ISD Evaluation & Accountability (Data Analysis, Research, and Reporting Services) V:\CILT\1112\CILT_1012.mdb rpt_TAKS_S_read_3_obj 2011-12 Campus Data Packet
DISTRICT SUMMARY 76

FemaleMigrant MaleAt RiskWhite AfricanAmer
Hispanic EconDisadv
SpecialEduc
LEP All DistrictYearGrade Number Tested(All Students)
Spanish Texas Assessment of Knowledge and Skills: READING
PERCENTAGE DEMONSTRATING COMMENDED PERFORMANCE
TAKS (SP) Read (4)
28.6 39.7 47.4
55.6 25.7 35.5
* 35.3 44.0
43.52011 37.5 * 43.5 43.4 8.1 43.4 43.5 5,53743.5
3
30.62009 * * 30.6 30.5 12.1 30.3 30.6 4,83630.2
39.62010 * * 39.6 39.5 12.5 39.0 39.6 5,57223.6
37.5 34.2 42.9
20.7 21.4
50.0 30.5 38.3
38.52011 * * 38.5 38.4 13.1 38.0 38.5 5,02338.0
4
21.12009 21.1 21.2 0.0 21.1 21.1 98321.0
34.42010 * 34.5 34.4 8.0 34.3 34.4 4,18315.6
* 26.8 31.0
* 13.3 17.1
22.1 20.6
29.02011 * 29.0 28.9 6.4 28.9 29.0 2,90828.9
5
15.32009 15.3 15.2 7.1 15.6 15.3 42415.5
21.22010 21.2 21.3 9.1 21.3 21.2 6088.9
33.3 34.9 42.1
45.5 24.2 31.8
58.3 32.7 40.1
38.52011 26.7 * 38.5 38.4 9.7 38.3 38.5 13,46838.3
3-5
28.12009 * * 28.1 28.0 8.9 27.8 28.1 6,24327.8
36.42010 * * 36.4 36.4 10.5 36.0 36.4 10,36318.5
18 6,726 6,735
11 3,046 3,197
12 5,154 5,205
13,4682011 15 13,4223 13,221 290 13,239 13,46813,223
6,2432009 2 6,2361 6,088 135 6,110 6,2436,074
NUMBER TESTED IN GRADES 3-5
10,3632010 2 10,3544 10,154 209 10,127 10,3633,230
Shaded cells indicate percentages at or above 30 percent, the Gold Performance Acknow ledgment Standard for 2010-11.
July 29, 2011 Dallas ISD Evaluation & Accountability (Data Analysis, Research, and Reporting Services) V:\CILT\1112\CILT_1012.mdb rpt_TAKS_S_read_4_per_comm 2011-12 Campus Data Packet
DISTRICT SUMMARY 77
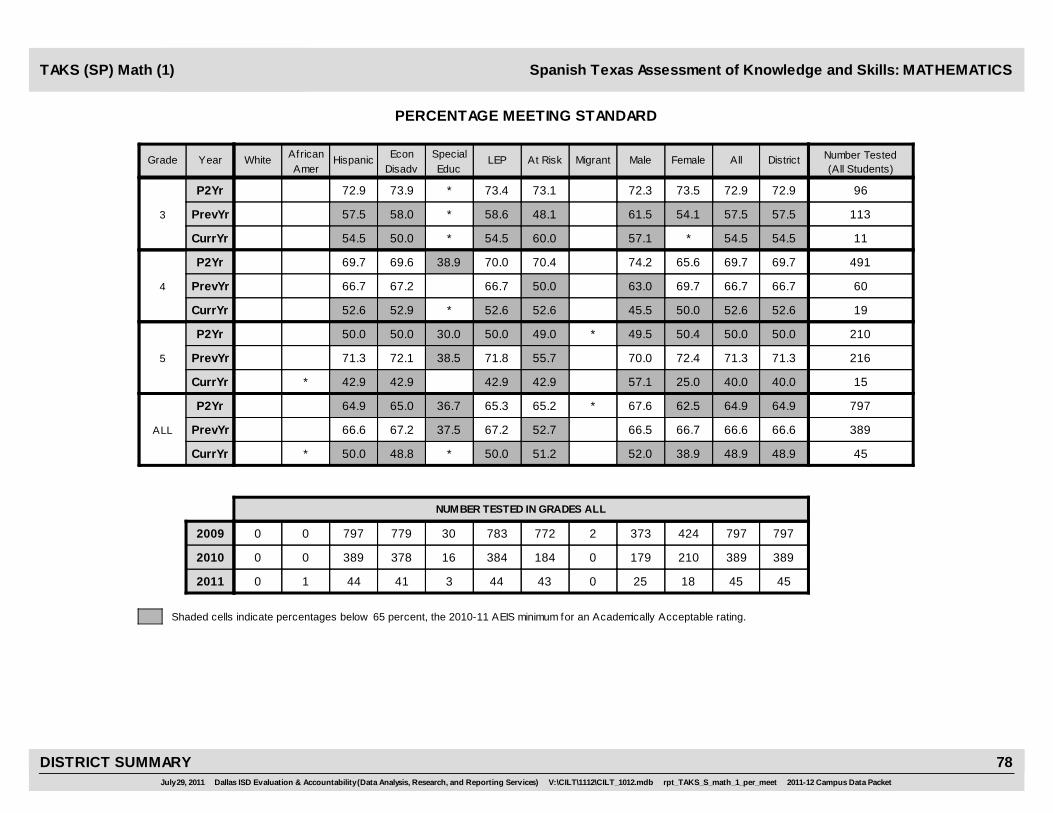
FemaleMigrant MaleAt RiskWhite AfricanAmer
Hispanic EconDisadv
SpecialEduc
LEP All DistrictYearGrade Number Tested(All Students)
Spanish Texas Assessment of Knowledge and Skills: MATHEMATICS
PERCENTAGE MEETING STANDARD
TAKS (SP) Math (1)
57.1 *
72.3 73.5
61.5 54.1
54.5CurrYr 54.5 50.0 * 54.5 54.5 1160.0
3
72.9P2Yr 72.9 73.9 * 73.4 72.9 9673.1
57.5PrevYr 57.5 58.0 * 58.6 57.5 11348.1
45.5 50.0
74.2 65.6
63.0 69.7
52.6CurrYr 52.6 52.9 * 52.6 52.6 1952.6
4
69.7P2Yr 69.7 69.6 38.9 70.0 69.7 49170.4
66.7PrevYr 66.7 67.2 66.7 66.7 6050.0
57.1 25.0
* 49.5 50.4
70.0 72.4
40.0CurrYr * 42.9 42.9 42.9 40.0 1542.9
5
50.0P2Yr 50.0 50.0 30.0 50.0 50.0 21049.0
71.3PrevYr 71.3 72.1 38.5 71.8 71.3 21655.7
52.0 38.9
* 67.6 62.5
66.5 66.7
48.9CurrYr * 50.0 48.8 * 50.0 48.9 4551.2
ALL
64.9P2Yr 64.9 65.0 36.7 65.3 64.9 79765.2
66.6PrevYr 66.6 67.2 37.5 67.2 66.6 38952.7
0 25 18
2 373 424
0 179 210
452011 0 441 41 3 44 4543
7972009 0 7970 779 30 783 797772
NUMBER TESTED IN GRADES ALL
3892010 0 3890 378 16 384 389184
Shaded cells indicate percentages below 65 percent, the 2010-11 AEIS minimum for an Academically Acceptable rating.
July 29, 2011 Dallas ISD Evaluation & Accountability (Data Analysis, Research, and Reporting Services) V:\CILT\1112\CILT_1012.mdb rpt_TAKS_S_math_1_per_meet 2011-12 Campus Data Packet
DISTRICT SUMMARY 78

FemaleMigrant MaleAt RiskWhite AfricanAmer
Hispanic EconDisadv
SpecialEduc
LEP All DistrictYearGrade Number Tested(All Students)
Spanish Texas Assessment of Knowledge and Skills: MATHEMATICS
NUMBER NOT MEETING STANDARD
TAKS (SP) Math (2)
3 *
13 13
20 28
52011 5 5 * 5 5 114
3
262009 26 24 * 25 26 9625
482010 48 47 * 46 48 11327
6 3
59 90
10 10
92011 9 8 * 9 9 199
4
1492009 149 147 11 146 149 491141
202010 20 19 20 20 6013
3 6
* 49 56
30 32
92011 * 8 8 8 9 158
5
1052009 105 102 7 101 105 210103
622010 62 58 8 60 62 21647
12 11
* 121 159
60 70
232011 * 22 21 * 22 23 4521
ALL
2802009 280 273 19 272 280 797269
1302010 130 124 10 126 130 38987
0 25 18
2 373 424
0 179 210
452011 0 441 41 3 44 4543
7972009 0 7970 779 30 783 797772
NUMBER TESTED IN GRADES ALL
3892010 0 3890 378 16 384 389184
July 29, 2011 Dallas ISD Evaluation & Accountability (Data Analysis, Research, and Reporting Services) V:\CILT\1112\CILT_1012.mdb rpt_TAKS_S_math_2_num_not_meet 2011-12 Campus Data Packet
DISTRICT SUMMARY 79

Numbers, Operations,and Quantitative
Reasoning
Patterns,Relationships, and
Algebraic Reasoning
Geometry andSpatial Reasoning
Concepts and Usesof Measurement
Probability andStatistics
MathematicalProcesses and Tools
YearGrade
OBJECTIVE
Spanish Texas Assessment of Knowledge and Skills: MATHEMATICS
AVERAGE PERCENTAGE OF ITEMS CORRECT BY OBJECTIVE
TAKS (SP) Math (3)
2011 61.8 65.2 74.2 65.2 54.5 62.5
2009 72.8 76.4 78.3 73.3 78.9
3
60.7
2010 66.0 71.7 75.5 69.9 72.6 56.0
2011 71.3 79.7 60.5 59.6 65.8 61.2
2009 77.1 77.4 68.3 69.2 67.8
4
69.9
2010 78.5 81.0 76.7 71.4 72.9 60.2
2011 63.6 54.3 63.8 54.3 65.0 49.2
2009 63.6 58.0 70.1 62.9 63.0
5
52.8
2010 76.0 74.7 79.6 70.7 74.2 67.5
2011 66.4 67.7 65.0 59.2 62.8 57.5
2009 73.1 72.2 70.0 68.1 67.9
ALL
64.3
2010 73.5 74.8 77.9 70.6 73.5 63.0
July 29, 2011 Dallas ISD Evaluation & Accountability (Data Analysis, Research, and Reporting Services) V:\CILT\1112\CILT_1012.mdb rpt_TAKS_S_math_3_obj 2011-12 Campus Data Packet
DISTRICT SUMMARY 80

FemaleMigrant MaleAt RiskWhite AfricanAmer
Hispanic EconDisadv
SpecialEduc
LEP All DistrictYearGrade Number Tested(All Students)
Spanish Texas Assessment of Knowledge and Skills: MATHEMATICS
PERCENTAGE DEMONSTRATING COMMENDED PERFORMANCE
TAKS (SP) Math (4)
0.0 *
19.1 12.2
13.5 19.7
9.12011 9.1 0.0 * 9.1 9.1 1110.0
3
15.62009 15.6 15.2 * 16.0 15.6 9615.1
16.82010 16.8 17.0 * 17.1 16.8 11311.5
18.2 0.0
29.3 23.7
25.9 18.2
10.52011 10.5 5.9 * 10.5 10.5 1910.5
4
26.32009 26.3 26.3 5.6 26.5 26.3 49126.4
21.72010 21.7 20.7 21.7 21.7 603.8
14.3 0.0
* 14.4 12.4
21.0 19.0
6.72011 * 7.1 7.1 7.1 6.7 157.1
5
13.32009 13.3 12.7 20.0 12.9 13.3 21012.4
19.92010 19.9 20.7 0.0 20.2 19.9 2165.7
12.0 5.6
* 24.1 19.3
19.6 19.0
8.92011 * 9.1 4.9 * 9.1 8.9 459.3
3-5
21.62009 21.6 21.4 10.0 21.7 21.6 79721.4
19.32010 19.3 19.6 0.0 19.5 19.3 3897.1
0 25 18
2 373 424
0 179 210
452011 0 441 41 3 44 4543
7972009 0 7970 779 30 783 797772
NUMBER TESTED IN GRADES 3-5
3892010 0 3890 378 16 384 389184
Shaded cells indicate percentages at or above 30 percent, the Gold Performance Acknow ledgment Standard for 2010-11.
July 29, 2011 Dallas ISD Evaluation & Accountability (Data Analysis, Research, and Reporting Services) V:\CILT\1112\CILT_1012.mdb rpt_TAKS_S_math_4_per_comm 2011-12 Campus Data Packet
DISTRICT SUMMARY 81

FemaleMigrant MaleAt RiskWhite AfricanAmer
Hispanic EconDisadv
SpecialEduc
LEP All DistrictYearGrade Number Tested(All Students)
Spanish Texas Assessment of Knowledge and Skills: WRITING
PERCENTAGE MEETING STANDARD
TAKS (SP) Writing (1)
87.5 90.6 95.8
82.0 91.2
100.0 91.7 95.6
93.22011 * * 93.2 93.2 64.8 93.1 93.2 5,05493.1
4
87.12009 87.1 87.0 64.3 87.3 87.1 98187.3
93.72010 * 93.7 93.6 67.5 93.7 93.7 4,21688.5
8 2,566 2,486
0 444 537
8 2,069 2,147
5,0542011 5 5,0421 4,954 125 4,957 5,0544,948
9812009 0 9810 959 28 973 981961
NUMBER TESTED IN GRADE 4
4,2162010 1 4,2140 4,124 83 4,125 4,2161,498
Shaded cells indicate percentages below 70 percent, the 2010-11 AEIS minimum for an Academically Acceptable rating.
July 29, 2011 Dallas ISD Evaluation & Accountability (Data Analysis, Research, and Reporting Services) V:\CILT\1112\CILT_1012.mdb rpt_TAKS_S_write_1_per_meet 2011-12 Campus Data Packet
DISTRICT SUMMARY 82
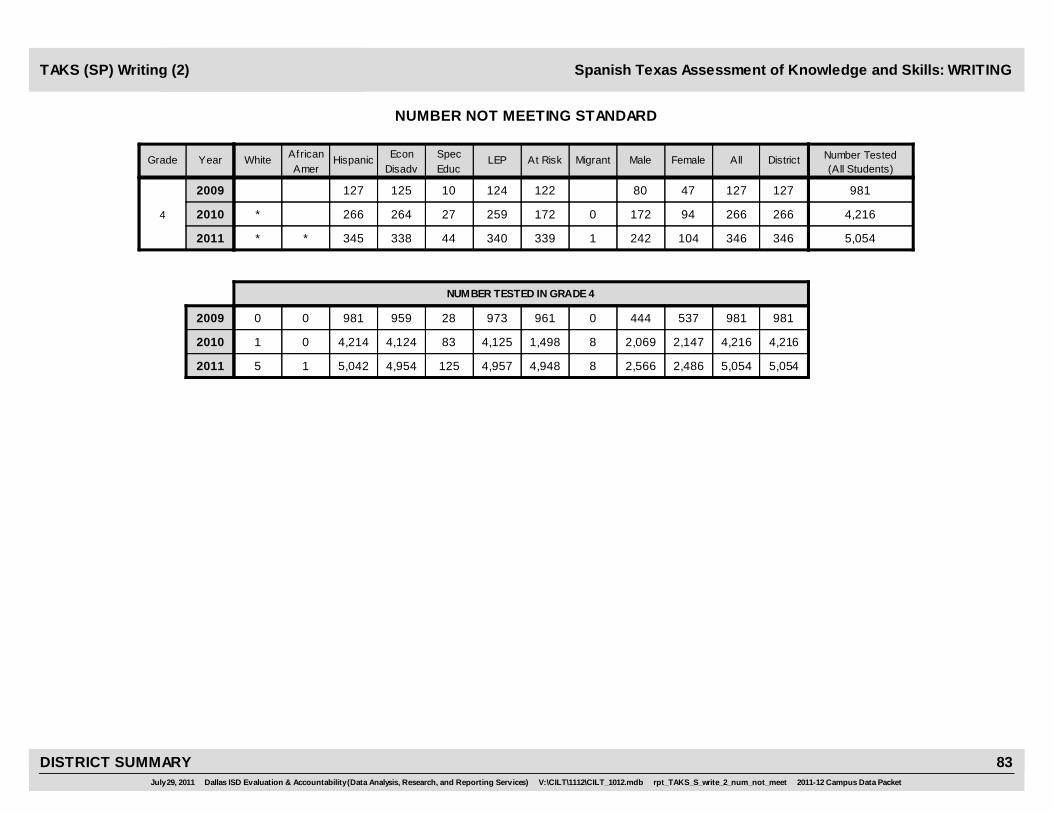
FemaleMigrant MaleAt RiskWhite AfricanAmer
Hispanic EconDisadv
SpecEduc
LEP All DistrictYearGrade Number Tested(All Students)
Spanish Texas Assessment of Knowledge and Skills: WRITING
NUMBER NOT MEETING STANDARD
TAKS (SP) Writing (2)
1 242 104
80 47
0 172 94
3462011 * * 345 338 44 340 346 5,054339
4
1272009 127 125 10 124 127 981122
2662010 * 266 264 27 259 266 4,216172
8 2,566 2,486
0 444 537
8 2,069 2,147
5,0542011 5 5,0421 4,954 125 4,957 5,0544,948
9812009 0 9810 959 28 973 981961
NUMBER TESTED IN GRADE 4
4,2162010 1 4,2140 4,124 83 4,125 4,2161,498
July 29, 2011 Dallas ISD Evaluation & Accountability (Data Analysis, Research, and Reporting Services) V:\CILT\1112\CILT_1012.mdb rpt_TAKS_S_write_2_num_not_meet 2011-12 Campus Data Packet
DISTRICT SUMMARY 83

Written Composition¹ :Effectiveness / Command
of Conventions
AppropriateOrganization of Ideas
Correct and EffectiveSentence Construction
Standard Usage andAppropriate Word Choice
Proofreading forPunctuation, Capitalization,
and SpellingYearGrade
OBJECTIVE
Spanish Texas Assessment of Knowledge and Skills: WRITING
AVERAGE PERCENTAGE OF ITEMS CORRECT BY OBJECTIVE
TAKS (SP) Writing (3)
2011 2.2 84.4 87.8 88.5 84.6
2009 2.2 85.0 78.0 88.2 79.8
4 2010 2.3 85.0 89.4 89.5 85.3
¹Average rating on w ritten composition. TAKS compositions are rated on a scale of 1 to 4.
July 29, 2011 Dallas ISD Evaluation & Accountability (Data Analysis, Research, and Reporting Services) V:\CILT\1112\CILT_1012.mdb rpt_TAKS_S_write_3_obj 2011-12 Campus Data Packet
DISTRICT SUMMARY 84

FemaleMigrant MaleAt RiskWhite AfricanAmer
Hispanic EconDisadv
SpecialEduc
LEP All DistrictYearGrade Number Tested(All Students)
Spanish Texas Assessment of Knowledge and Skills: WRITING
PERCENTAGE DEMONSTRATING COMMENDED PERFORMANCE
TAKS (SP) Writing (4)
25.0 22.5 33.1
16.2 23.8
37.5 26.5 34.2
27.72011 * * 27.7 27.7 7.2 27.6 27.7 5,05427.5
4
20.42009 20.4 20.4 3.6 20.5 20.4 98120.3
30.42010 * 30.4 30.2 12.0 30.4 30.4 4,21620.8
8 2,566 2,486
0 444 537
8 2,069 2,147
5,0542011 5 5,0421 4,954 125 4,957 5,0544,948
9812009 0 9810 959 28 973 981961
NUMBER TESTED IN GRADE 4
4,2162010 1 4,2140 4,124 83 4,125 4,2161,498
Shaded cells indicate percentages at or above 30 percent, the Gold Performance Acknow ledgment Standard for 2010-11.
July 29, 2011 Dallas ISD Evaluation & Accountability (Data Analysis, Research, and Reporting Services) V:\CILT\1112\CILT_1012.mdb rpt_TAKS_S_write_4_per_comm 2011-12 Campus Data Packet
DISTRICT SUMMARY 85

FemaleMigrant MaleAt RiskWhite AfricanAmer
Hispanic EconDisadv
SpecialEduc
LEP All DistrictYearGrade Number Tested(All Students)
Spanish Texas Assessment of Knowledge and Skills: SCIENCE
PERCENTAGE MEETING STANDARD
TAKS (SP) Sci (1)
* 65.5 53.2
* 36.6 34.6
54.1 37.0
59.12011 * * 59.2 58.9 10.5 58.9 59.1 1,12158.9
5
35.32009 * 35.7 35.9 0.0 35.1 35.3 20134.6
44.52010 44.7 44.8 27.3 45.1 44.5 24726.2
3 530 590
2 93 107
0 111 135
1,1212011 2 1,1151 1,110 19 1,103 1,1211,104
2012009 0 1991 195 8 194 201191
NUMBER TESTED IN GRADE 5
2472010 0 2460 241 11 244 247126
Shaded cells indicate percentages below 60 percent, the 2010-11 AEIS minimum for an Academically Acceptable rating.
July 29, 2011 Dallas ISD Evaluation & Accountability (Data Analysis, Research, and Reporting Services) V:\CILT\1112\CILT_1012.mdb rpt_TAKS_S_sc_1_per_meet 2011-12 Campus Data Packet
DISTRICT SUMMARY 86

FemaleMigrant MaleAt RiskWhite AfricanAmer
Hispanic EconDisadv
SpecialEduc
LEP All DistrictYearGrade Number Tested(All Students)
Spanish Texas Assessment of Knowledge and Skills: SCIENCE
NUMBER NOT MEETING STANDARD
TAKS (SP) Sci (2)
* 183 276
* 59 70
51 85
4592011 * * 455 456 17 453 459 1,121454
5
1302009 * 128 125 8 126 130 201125
1372010 136 133 8 134 137 24793
3 530 590
2 93 107
0 111 135
1,1212011 2 1,1151 1,110 19 1,103 1,1211,104
2012009 0 1991 195 8 194 201191
NUMBER TESTED IN GRADE 5
2472010 0 2460 241 11 244 247126
July 29, 2011 Dallas ISD Evaluation & Accountability (Data Analysis, Research, and Reporting Services) V:\CILT\1112\CILT_1012.mdb rpt_TAKS_S_sc_2_num_not_meet 2011-12 Campus Data Packet
DISTRICT SUMMARY 87

Nature of Science Life Sciences Physical Sciences Earth SciencesYearGrade
OBJECTIVE
Spanish Texas Assessment of Knowledge and Skills: SCIENCE
AVERAGE PERCENTAGE CORRECT BY OBJECTIVE
TAKS (SP) Sci (3)
2011 82.0 80.0 70.5 77.2
2009 71.6 69.5 64.2 53.5
5 2010 75.8 77.3 63.9 69.9
July 29, 2011 Dallas ISD Evaluation & Accountability (Data Analysis, Research, and Reporting Services) V:\CILT\1112\CILT_1012.mdb rpt_TAKS_S_sc_3_obj 2011-12 Campus Data Packet
DISTRICT SUMMARY 88
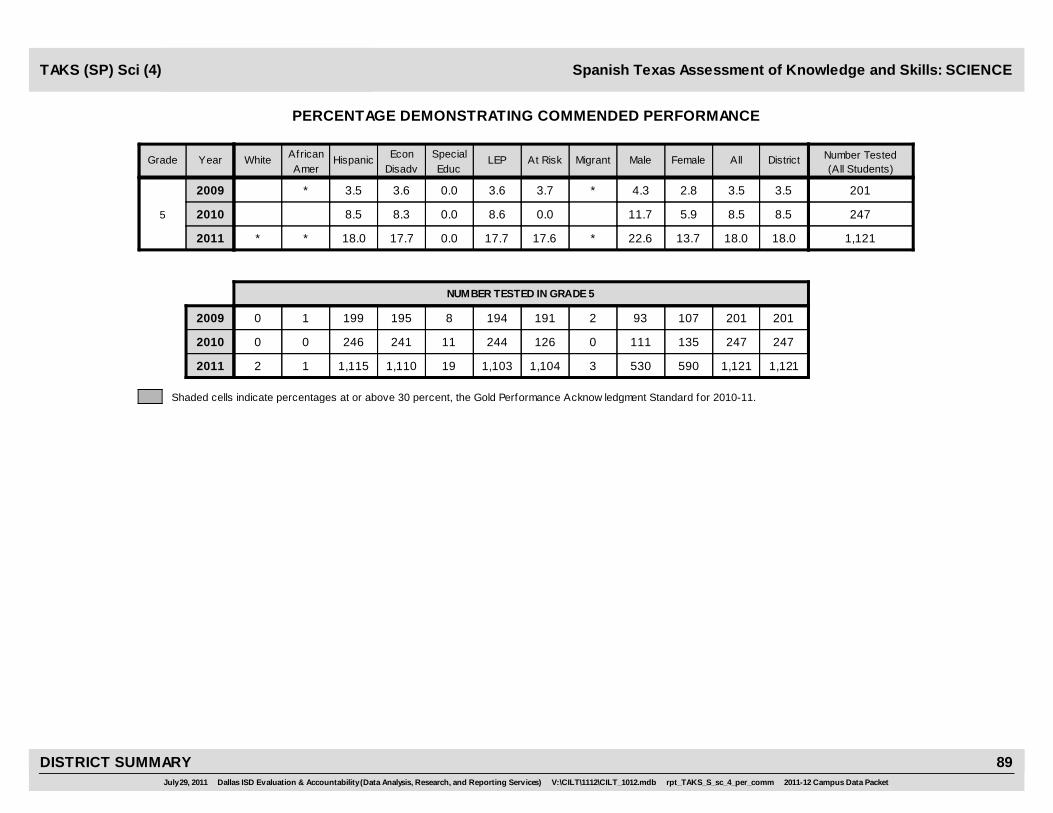
FemaleMigrant MaleAt RiskWhite AfricanAmer
Hispanic EconDisadv
SpecialEduc
LEP All DistrictYearGrade Number Tested(All Students)
Spanish Texas Assessment of Knowledge and Skills: SCIENCE
PERCENTAGE DEMONSTRATING COMMENDED PERFORMANCE
TAKS (SP) Sci (4)
* 22.6 13.7
* 4.3 2.8
11.7 5.9
18.02011 * * 18.0 17.7 0.0 17.7 18.0 1,12117.6
5
3.52009 * 3.5 3.6 0.0 3.6 3.5 2013.7
8.52010 8.5 8.3 0.0 8.6 8.5 2470.0
3 530 590
2 93 107
0 111 135
1,1212011 2 1,1151 1,110 19 1,103 1,1211,104
2012009 0 1991 195 8 194 201191
NUMBER TESTED IN GRADE 5
2472010 0 2460 241 11 244 247126
Shaded cells indicate percentages at or above 30 percent, the Gold Performance Acknow ledgment Standard for 2010-11.
July 29, 2011 Dallas ISD Evaluation & Accountability (Data Analysis, Research, and Reporting Services) V:\CILT\1112\CILT_1012.mdb rpt_TAKS_S_sc_4_per_comm 2011-12 Campus Data Packet
DISTRICT SUMMARY 89
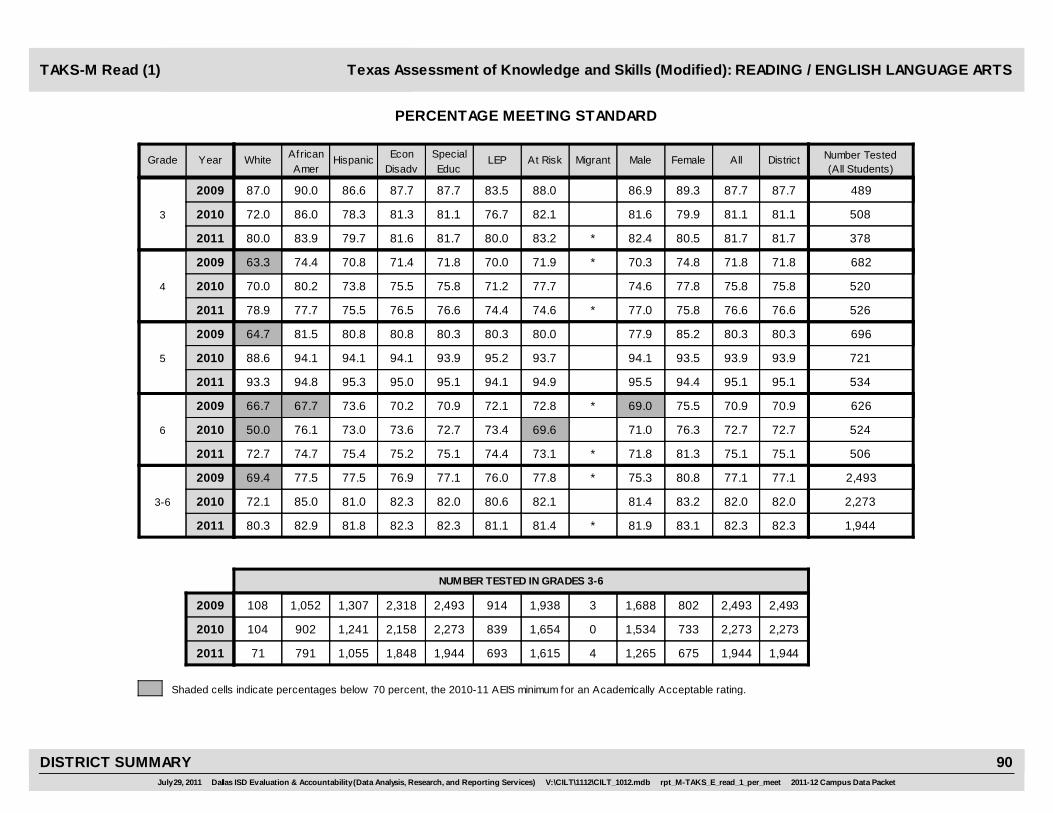
FemaleMigrant MaleAt RiskWhite AfricanAmer
Hispanic EconDisadv
SpecialEduc
LEP All DistrictYearGrade Number Tested(All Students)
PERCENTAGE MEETING STANDARD
TAKS-M Read (1) Texas Assessment of Knowledge and Skills (Modified): READING / ENGLISH LANGUAGE ARTS
* 82.4 80.5
81.6 79.9
81.72011 80.0 83.9 79.7 81.6 81.7 80.0 81.7 37883.2
3
2009
81.12010 72.0 86.0 78.3 81.3 81.1 76.7 81.1 50882.1
48986.9 89.3 87.787.0 90.0 86.6 87.7 87.7 83.5 87.788.0
* 77.0 75.8
74.6 77.8
76.62011 78.9 77.7 75.5 76.5 76.6 74.4 76.6 52674.6
4
2009
75.82010 70.0 80.2 73.8 75.5 75.8 71.2 75.8 52077.7
682* 70.3 74.8 71.863.3 74.4 70.8 71.4 71.8 70.0 71.871.9
95.5 94.4
94.1 93.5
95.12011 93.3 94.8 95.3 95.0 95.1 94.1 95.1 53494.9
5
2009
93.92010 88.6 94.1 94.1 94.1 93.9 95.2 93.9 72193.7
69677.9 85.2 80.364.7 81.5 80.8 80.8 80.3 80.3 80.380.0
* 71.8 81.3
71.0 76.3
75.12011 72.7 74.7 75.4 75.2 75.1 74.4 75.1 50673.1
6
2009
72.72010 50.0 76.1 73.0 73.6 72.7 73.4 72.7 52469.6
626* 69.0 75.5 70.966.7 67.7 73.6 70.2 70.9 72.1 70.972.8
* 81.9 83.1
81.4 83.2
82.32011 80.3 82.9 81.8 82.3 82.3 81.1 82.3 1,94481.4
3-6
2009
82.02010 72.1 85.0 81.0 82.3 82.0 80.6 82.0 2,27382.1
2,493* 75.3 80.8 77.169.4 77.5 77.5 76.9 77.1 76.0 77.177.8
4 1,265 675
0 1,534 733
1,9442011 71 1,055791 1,848 1,944 693 1,9441,615
2009
NUMBER TESTED IN GRADES 3-6
2,2732010 104 1,241902 2,158 2,273 839 2,2731,654
Shaded cells indicate percentages below 70 percent, the 2010-11 AEIS minimum for an Academically Acceptable rating.
3 1,688 802 2,493108 1,3071,052 2,318 2,493 914 2,4931,938
July 29, 2011 Dallas ISD Evaluation & Accountability (Data Analysis, Research, and Reporting Services) V:\CILT\1112\CILT_1012.mdb rpt_M-TAKS_E_read_1_per_meet 2011-12 Campus Data Packet
DISTRICT SUMMARY 90

FemaleMigrant MaleAt RiskWhite AfricanAmer
Hispanic EconDisadv
SpecialEduc
LEP All DistrictYearGrade Number Tested(All Students)
PERCENTAGE MEETING STANDARD
TAKS-M Read (1) Texas Assessment of Knowledge and Skills (Modified): READING / ENGLISH LANGUAGE ARTS
69.6 66.9
* 65.1 69.9
68.72011 56.3 68.1 69.8 67.8 68.7 65.2 68.7 40968.4
7
2009
66.62010 68.8 65.5 66.1 64.4 66.6 67.3 66.6 47963.9
661* 72.9 72.1 72.681.3 74.8 69.6 72.8 72.6 69.4 72.670.3
* 83.9 87.8
* 77.5 79.5
85.22011 91.7 88.2 81.9 84.3 85.2 84.7 85.2 37884.9
8
2009
78.32010 45.5 80.4 78.1 78.6 78.3 78.2 78.3 48977.1
645* 77.9 77.9 77.880.0 78.2 76.8 76.5 77.8 77.8 77.878.2
* 76.5 76.6
57.1 71.1 75.2
76.62011 71.4 78.4 75.3 75.7 76.6 74.4 76.6 78776.5
7-8
2009
72.52010 59.3 73.1 72.3 71.6 72.5 72.9 72.5 96870.7
1,306* 75.4 74.9 75.280.5 76.5 73.1 74.6 75.2 73.5 75.274.3
1 537 248
7 651 314
7872011 28 413333 713 787 305 787706
2009
NUMBER TESTED IN GRADES 7-8
9682010 27 469458 864 968 336 968802
Shaded cells indicate percentages below 70 percent, the 2010-11 AEIS minimum for an Academically Acceptable rating.
5 869 434 1,30641 640612 1,129 1,306 479 1,3061,137
July 29, 2011 Dallas ISD Evaluation & Accountability (Data Analysis, Research, and Reporting Services) V:\CILT\1112\CILT_1012.mdb rpt_M-TAKS_E_read_1_per_meet 2011-12 Campus Data Packet
DISTRICT SUMMARY 91

FemaleMigrant MaleAt RiskWhite AfricanAmer
Hispanic EconDisadv
SpecialEduc
LEP All DistrictYearGrade Number Tested(All Students)
PERCENTAGE MEETING STANDARD
TAKS-M Read (1) Texas Assessment of Knowledge and Skills (Modified): READING / ENGLISH LANGUAGE ARTS
61.6 60.0
66.5 75.4
61.02011 75.0 59.3 62.4 60.9 61.0 55.7 61.0 24960.2
10
2009
69.62010 71.4 73.9 64.5 68.2 69.6 62.2 69.6 34272.1
44464.1 73.4 67.375.0 70.1 63.5 65.7 67.3 61.8 67.368.2
* 58.4 57.6
* 61.6 69.1
58.02011 63.0 58.3 58.6 58.7 58.0 56.2 58.0 74656.6
9-11
2009
64.02010 66.7 66.4 61.6 62.6 64.0 59.1 64.0 1,09465.3
44464.1 73.4 67.375.0 70.1 63.5 65.7 67.3 61.8 67.368.2
1 502 243
1 734 356
7462011 27 331374 613 746 219 746668
2009
NUMBER TESTED IN GRADES 9-11
1,0942010 42 490541 902 1,094 330 1,094932
Shaded cells indicate percentages below 70 percent, the 2010-11 AEIS minimum for an Academically Acceptable rating.
0 290 154 44412 181241 341 444 123 444365
July 29, 2011 Dallas ISD Evaluation & Accountability (Data Analysis, Research, and Reporting Services) V:\CILT\1112\CILT_1012.mdb rpt_M-TAKS_E_read_1_per_meet 2011-12 Campus Data Packet
DISTRICT SUMMARY 92

FemaleMigrant MaleAt RiskWhite AfricanAmer
Hispanic EconDisadv
SpecialEduc
LEP All DistrictYearGrade Number Tested(All Students)
PERCENTAGE MEETING STANDARD
TAKS-M Read (1) Texas Assessment of Knowledge and Skills (Modified): READING / ENGLISH LANGUAGE ARTS
66.7 75.5 76.4
62.5 74.1 77.8
75.82011 74.6 75.8 76.0 76.2 75.8 74.9 75.8 3,47774.7
3-11
2009
75.32010 68.8 76.9 74.8 75.5 75.3 74.2 75.3 4,33574.8
4,24337.5 74.2 78.1 75.572.7 76.2 75.0 75.2 75.5 74.1 75.575.6
6 2,304 1,166
8 2,919 1,403
3,4772011 126 1,7991,498 3,174 3,477 1,217 3,4772,989
2009
NUMBER TESTED IN GRADES 3-11
4,3352010 173 2,2001,901 3,924 4,335 1,505 4,3353,388
Shaded cells indicate percentages below 70 percent, the 2010-11 AEIS minimum for an Academically Acceptable rating.
8 2,847 1,390 4,243161 2,1281,905 3,788 4,243 1,516 4,2433,440
July 29, 2011 Dallas ISD Evaluation & Accountability (Data Analysis, Research, and Reporting Services) V:\CILT\1112\CILT_1012.mdb rpt_M-TAKS_E_read_1_per_meet 2011-12 Campus Data Packet
DISTRICT SUMMARY 93

FemaleMigrant MaleAt RiskWhite AfricanAmer
Hispanic EconDisadv
SpecialEduc
LEP All DistrictYearGrade
NUMBER NOT MEETING STANDARD
Number Tested(All Students)
Texas Assessment of Knowledge and Skills (Modified): READING / ENGLISH LANGUAGE ARTSTAKS-M Read (2)
* 43 26
65 31
692011 3 27 39 68 69 24 69 37857
3
2009
962010 7 30 57 91 96 37 96 50865
48943 17 603 19 36 55 60 29 6048
* 79 44
90 36
1232011 4 50 67 118 123 43 123 526103
4
2009
1262010 6 38 79 119 126 59 126 52073
682* 134 58 19211 73 104 182 192 75 192140
16 10
28 16
262011 1 11 14 25 26 12 26 53422
5
2009
442010 4 17 23 41 44 13 44 72135
696103 34 13712 55 69 128 137 51 137113
* 91 34
103 40
1262011 6 47 72 117 126 52 126 506118
6
2009
1432010 12 50 77 130 143 54 143 524123
626* 137 45 1827 90 85 170 182 64 182129
* 229 114
286 123
3442011 14 135 192 328 344 131 344 1,944300
3-6
2009
4092010 29 135 236 381 409 163 409 2,273296
2,493* 417 154 57133 237 294 535 571 219 571430
4 1,265 675
0 1,534 733
1,9442011 71 1,055791 1,848 1,944 693 1,9441,615
2009
NUMBER TESTED IN GRADES 3-6
2,2732010 104 1,241902 2,158 2,273 839 2,2731,654
3 1,688 802 2,493108 1,3071,052 2,318 2,493 914 2,4931,938
July 29, 2011 Dallas ISD Evaluation & Accountability (Data Analysis, Research, and Reporting Services) V:\CILT\1112\CILT_1012.mdb rpt_M-TAKS_E_read_2_num_not_meet 2011-12 Campus Data Packet
DISTRICT SUMMARY 94

FemaleMigrant MaleAt RiskWhite AfricanAmer
Hispanic EconDisadv
SpecialEduc
LEP All DistrictYearGrade
NUMBER NOT MEETING STANDARD
Number Tested(All Students)
Texas Assessment of Knowledge and Skills (Modified): READING / ENGLISH LANGUAGE ARTSTAKS-M Read (2)
84 44
* 117 43
1282011 7 52 68 119 128 56 128 409114
7
2009
1602010 5 77 77 151 160 53 160 479140
661* 118 63 1813 79 99 158 181 75 181167
* 42 14
* 71 35
562011 1 20 34 54 56 22 56 37852
8
2009
1062010 6 46 53 94 106 38 106 48995
645* 96 46 1435 65 73 129 143 52 143125
* 126 58
3 188 78
1842011 8 72 102 173 184 78 184 787166
7-8
2009
2662010 11 123 130 245 266 91 266 968235
1,306* 214 109 3248 144 172 287 324 127 324292
1 537 248
7 651 314
7872011 28 413333 713 787 305 787706
2009
NUMBER TESTED IN GRADES 7-8
9682010 27 469458 864 968 336 968802
5 869 434 1,30641 640612 1,129 1,306 479 1,3061,137
July 29, 2011 Dallas ISD Evaluation & Accountability (Data Analysis, Research, and Reporting Services) V:\CILT\1112\CILT_1012.mdb rpt_M-TAKS_E_read_2_num_not_meet 2011-12 Campus Data Packet
DISTRICT SUMMARY 95

FemaleMigrant MaleAt RiskWhite AfricanAmer
Hispanic EconDisadv
SpecialEduc
LEP All DistrictYearGrade
NUMBER NOT MEETING STANDARD
Number Tested(All Students)
Texas Assessment of Knowledge and Skills (Modified): READING / ENGLISH LANGUAGE ARTSTAKS-M Read (2)
63 34
76 28
972011 3 50 41 79 97 31 97 24992
10
2009
1042010 4 47 50 91 104 37 104 34280
444104 41 1453 72 66 117 145 47 145116
* 209 103
* 282 110
3132011 10 156 137 253 313 96 313 746290
9-11
2009
3942010 14 182 188 337 394 135 394 1,094323
444104 41 1453 72 66 117 145 47 145116
1 502 243
1 734 356
7462011 27 331374 613 746 219 746668
2009
NUMBER TESTED IN GRADES 9-11
1,0942010 42 490541 902 1,094 330 1,094932
0 290 154 44412 181241 341 444 123 444365
July 29, 2011 Dallas ISD Evaluation & Accountability (Data Analysis, Research, and Reporting Services) V:\CILT\1112\CILT_1012.mdb rpt_M-TAKS_E_read_2_num_not_meet 2011-12 Campus Data Packet
DISTRICT SUMMARY 96
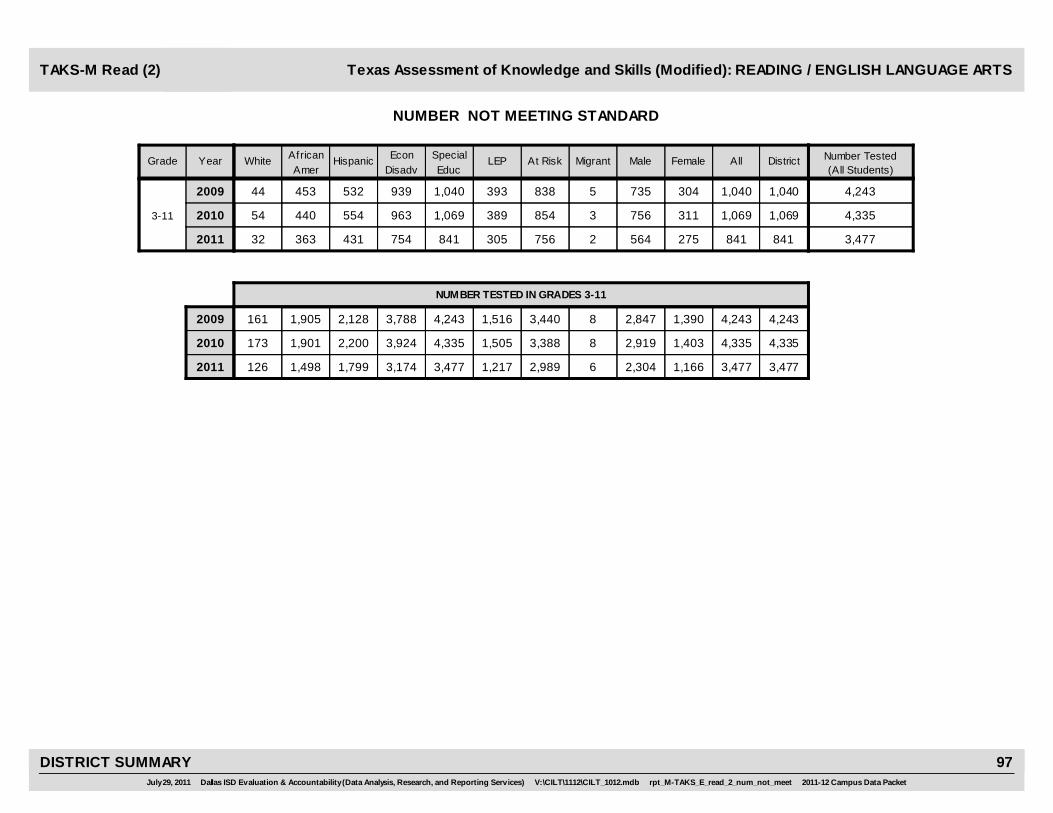
FemaleMigrant MaleAt RiskWhite AfricanAmer
Hispanic EconDisadv
SpecialEduc
LEP All DistrictYearGrade
NUMBER NOT MEETING STANDARD
Number Tested(All Students)
Texas Assessment of Knowledge and Skills (Modified): READING / ENGLISH LANGUAGE ARTSTAKS-M Read (2)
2 564 275
3 756 311
8412011 32 363 431 754 841 305 841 3,477756
3-11
2009
1,0692010 54 440 554 963 1,069 389 1,069 4,335854
4,2435 735 304 1,04044 453 532 939 1,040 393 1,040838
6 2,304 1,166
8 2,919 1,403
3,4772011 126 1,7991,498 3,174 3,477 1,217 3,4772,989
2009
NUMBER TESTED IN GRADES 3-11
4,3352010 173 2,2001,901 3,924 4,335 1,505 4,3353,388
8 2,847 1,390 4,243161 2,1281,905 3,788 4,243 1,516 4,2433,440
July 29, 2011 Dallas ISD Evaluation & Accountability (Data Analysis, Research, and Reporting Services) V:\CILT\1112\CILT_1012.mdb rpt_M-TAKS_E_read_2_num_not_meet 2011-12 Campus Data Packet
DISTRICT SUMMARY 97

Basic UnderstandingApplying Knowledgeof Literary Elements
Using Strategiesto Analyze
Applying Critical-Thinking Skills
YearGrade
OBJECTIVE
AVERAGE PERCENTAGE OF ITEMS CORRECT BY OBJECTIVE
Texas Assessment of Knowledge and Skills (Modified): READING / ENGLISH LANGUAGE ARTSTAKS-M Read (3)
2011 61.2 68.3 66.6 59.6
2009
20103 59.0 67.4 65.3 61.0
61.1 75.7 64.0 66.1
2011 65.6 67.9 60.8 61.2
2009
20104 64.0 68.3 61.5 62.8
58.3 55.1 52.7 57.5
2011 69.2 76.9 63.5 67.4
2009
20105 66.8 76.1 61.4 64.8
65.3 73.4 74.8 63.8
2011 63.9 57.2 62.7 58.7
2009
20106 62.7 58.0 61.6 59.7
65.5 66.7 57.2 59.8
2011 65.3 67.7 63.2 61.9
2009
20103-6 63.5 68.2 62.3 62.3
62.6 67.2 62.2 61.5
July 29, 2011 Dallas ISD Evaluation & Accountability (Data Analysis, Research, and Reporting Services) V:\CILT\1112\CILT_1012.mdb rpt_M-TAKS_E_read_3_obj_elem 2011-12 Campus Data Packet
DISTRICT SUMMARY 98

Basic UnderstandingApplying Knowledgeof Literary Elements
Using Strategiesto Analyze
Applying Critical-Thinking Skills
YearGrade
OBJECTIVE
AVERAGE PERCENTAGE OF ITEMS CORRECT BY OBJECTIVE
Texas Assessment of Knowledge and Skills (Modified): READING / ENGLISH LANGUAGE ARTSTAKS-M Read (3)
2011 59.3 56.1 53.6 58.1
2009
20107 58.1 57.0 53.3 59.1
65.9 64.0 66.0 57.0
2011 72.7 73.0 67.1 66.6
2009
20108 68.4 69.3 64.7 63.9
70.4 67.3 68.4 56.5
2011 65.7 64.3 60.1 62.2
2009
20107-8 63.3 63.2 59.1 61.5
68.1 65.6 67.2 56.8
July 29, 2011 Dallas ISD Evaluation & Accountability (Data Analysis, Research, and Reporting Services) V:\CILT\1112\CILT_1012.mdb rpt_M-TAKS_E_read_3_obj_elem 2011-12 Campus Data Packet
DISTRICT SUMMARY 99

Written Composition:Effectiveness / Command
of Conventions¹Basic Understanding
Literary Elementsand Techniques Analysis and Evaluation Revising and EditingYearGrade
OBJECTIVE
AVERAGE PERCENTAGE OF ITEMS CORRECT BY OBJECTIVE
Texas Assessment of Knowledge and Skills (Modified): READING / ENGLISH LANGUAGE ARTSTAKS-M Read (3)
70.1 1.2 54.8
75.7 1.4 60.8
2011 64.1 59.0
2009
10 2010 71.2 66.0
64.3 1.5 60.869.9 64.1
67.5 1.3 55.0
70.3 1.4 58.8
2011 63.8 62.7
2009
9-11 2010 68.8 66.4
64.3 1.5 58.869.9 64.1
¹Average rating on w ritten composition. TAKS compositions are rated on a scale of 1 to 4.
July 29, 2011 Dallas ISD Evaluation & Accountability (Data Analysis, Research, and Reporting Services) V:\CILT\1112\CILT_1012.mdb rpt_M-TAKS_E_read_3_obj_high 2011-12 Campus Data Packet
DISTRICT SUMMARY 100

FemaleMigrant MaleAt RiskWhite AfricanAmer
Hispanic EconDisadv
SpecialEduc
LEP All DistrictYearGrade Number Tested(All Students)
PERCENTAGE DEMONSTRATING COMMENDED PERFORMANCE
TAKS-M Read (4) Texas Assessment of Knowledge and Skills (Modified): READING / ENGLISH LANGUAGE ARTS
* 20.8 21.1
20.4 16.2
20.92011 33.3 22.6 18.8 20.8 20.9 16.7 20.9 37820.6
3
2009
19.12010 20.0 23.8 15.2 19.1 19.1 12.6 19.1 50819.2
14.6 19.5 16.221.7 18.9 13.8 14.8 16.2 12.5 16.217.3 489
* 15.1 11.0
16.9 11.1
13.72011 21.1 17.0 10.2 13.5 13.7 8.9 13.7 52611.8
4
2009
15.22010 20.0 17.2 14.0 15.3 15.2 12.2 15.2 52015.9
* 8.6 9.6 8.96.7 9.1 9.0 9.0 8.9 8.8 8.99.8 682
15.6 16.9
14.4 17.3
16.52011 0.0 16.9 16.6 17.1 16.5 15.8 16.5 53415.1
5
2009
15.42010 5.7 17.4 14.5 15.9 15.4 12.9 15.4 72114.5
12.2 17.9 14.114.7 17.1 11.7 14.1 14.1 11.6 14.114.0 696
* 5.6 15.9
9.9 16.0
9.32011 4.5 8.1 10.2 9.3 9.3 10.8 9.3 5068.7
6
2009
11.82010 16.7 14.4 9.5 12.4 11.8 8.9 11.8 5249.6
* 5.9 11.4 7.54.8 7.9 7.5 7.0 7.5 3.5 7.57.4 626
* 13.9 15.9
15.3 15.4
14.72011 14.1 16.1 13.6 14.9 14.7 12.8 14.7 1,94413.7
3-6
2009
15.42010 14.4 18.2 13.4 15.7 15.4 11.7 15.4 2,27314.6
* 10.1 14.3 11.412.0 12.8 10.3 11.1 11.4 9.0 11.412.0 2,493
4 1,265 675
0 1,534 733
1,9442011 71 1,055791 1,848 1,944 693 1,9441,615
2009
NUMBER TESTED IN GRADES 3-6
2,2732010 104 1,241902 2,158 2,273 839 2,2731,654
Shaded cells indicate percentages at or above 30 percent, the Gold Performance Acknowledgment Standard for 2010-11.
3 1,688 802 2,493108 1,3071,052 2,318 2,493 914 2,4931,938
July 29, 2011 Dallas ISD Evaluation & Accountability (Data Analysis, Research, and Reporting Services) V:\CILT\1112\CILT_1012.mdb rpt_M-TAKS_E_read_4_per_comm 2011-12 Campus Data Packet
DISTRICT SUMMARY 101

FemaleMigrant MaleAt RiskWhite AfricanAmer
Hispanic EconDisadv
SpecialEduc
LEP All DistrictYearGrade Number Tested(All Students)
PERCENTAGE DEMONSTRATING COMMENDED PERFORMANCE
TAKS-M Read (4) Texas Assessment of Knowledge and Skills (Modified): READING / ENGLISH LANGUAGE ARTS
8.7 7.5
* 10.7 7.7
8.32011 12.5 11.0 6.2 7.8 8.3 5.6 8.3 4096.9
7
2009
9.82010 12.5 11.2 7.9 9.4 9.8 6.2 9.8 4798.2
* 9.4 8.0 8.925.0 8.6 8.0 8.4 8.9 6.5 8.97.1 661
* 15.7 13.0
* 8.5 8.8
14.82011 8.3 15.9 14.9 14.0 14.8 13.2 14.8 37815.4
8
2009
8.62010 0.0 9.4 8.3 8.9 8.6 8.0 8.6 4899.4
* 8.3 4.8 7.112.0 5.0 8.9 7.1 7.1 6.4 7.16.6 645
* 12.1 10.1
0.0 9.7 8.3
11.42011 10.7 13.5 10.2 10.8 11.4 9.2 11.4 78711.0
7-8
2009
9.22010 7.4 10.3 8.1 9.1 9.2 7.1 9.2 9688.9
* 8.9 6.5 8.017.1 6.9 8.4 7.8 8.0 6.5 8.06.9 1,306
1 537 248
7 651 314
7872011 28 413333 713 787 305 787706
2009
NUMBER TESTED IN GRADES 7-8
9682010 27 469458 864 968 336 968802
Shaded cells indicate percentages at or above 30 percent, the Gold Performance Acknowledgment Standard for 2010-11.
5 869 434 1,30641 640612 1,129 1,306 479 1,3061,137
July 29, 2011 Dallas ISD Evaluation & Accountability (Data Analysis, Research, and Reporting Services) V:\CILT\1112\CILT_1012.mdb rpt_M-TAKS_E_read_4_per_comm 2011-12 Campus Data Packet
DISTRICT SUMMARY 102

FemaleMigrant MaleAt RiskWhite AfricanAmer
Hispanic EconDisadv
SpecialEduc
LEP All DistrictYearGrade Number Tested(All Students)
PERCENTAGE DEMONSTRATING COMMENDED PERFORMANCE
TAKS-M Read (4) Texas Assessment of Knowledge and Skills (Modified): READING / ENGLISH LANGUAGE ARTS
7.9 9.4
14.1 15.8
8.42011 16.7 6.5 10.1 8.9 8.4 7.1 8.4 2497.8
10
2009
14.92010 35.7 14.4 12.8 15.7 14.9 7.1 14.9 34215.7
14.5 14.3 14.425.0 13.7 15.5 15.0 14.4 13.8 14.415.1 444
* 10.8 9.9
* 16.1 16.3
10.52011 11.1 12.6 8.5 10.6 10.5 6.4 10.5 7469.7
9-11
2009
16.22010 23.8 17.4 14.3 16.7 16.2 12.4 16.2 1,09416.5
14.5 14.3 14.425.0 13.7 15.5 15.0 14.4 13.8 14.415.1 444
1 502 243
1 734 356
7462011 27 331374 613 746 219 746668
2009
NUMBER TESTED IN GRADES 9-11
1,0942010 42 490541 902 1,094 330 1,094932
Shaded cells indicate percentages at or above 30 percent, the Gold Performance Acknowledgment Standard for 2010-11.
0 290 154 44412 181241 341 444 123 444365
July 29, 2011 Dallas ISD Evaluation & Accountability (Data Analysis, Research, and Reporting Services) V:\CILT\1112\CILT_1012.mdb rpt_M-TAKS_E_read_4_per_comm 2011-12 Campus Data Packet
DISTRICT SUMMARY 103

FemaleMigrant MaleAt RiskWhite AfricanAmer
Hispanic EconDisadv
SpecialEduc
LEP All DistrictYearGrade Number Tested(All Students)
PERCENTAGE DEMONSTRATING COMMENDED PERFORMANCE
TAKS-M Read (4) Texas Assessment of Knowledge and Skills (Modified): READING / ENGLISH LANGUAGE ARTS
16.7 12.8 13.4
0.0 14.3 14.0
13.12011 12.7 14.6 11.8 13.1 13.1 10.8 13.1 3,47712.2
3-11
2009
14.22010 15.6 16.0 12.5 14.5 14.2 10.8 14.2 4,33513.8
0.0 10.2 11.9 10.714.3 11.0 10.2 10.5 10.7 8.6 10.710.6 4,243
6 2,304 1,166
8 2,919 1,403
3,4772011 126 1,7991,498 3,174 3,477 1,217 3,4772,989
2009
NUMBER TESTED IN GRADES 3-11
4,3352010 173 2,2001,901 3,924 4,335 1,505 4,3353,388
Shaded cells indicate percentages at or above 30 percent, the Gold Performance Acknowledgment Standard for 2010-11.
8 2,847 1,390 4,243161 2,1281,905 3,788 4,243 1,516 4,2433,440
July 29, 2011 Dallas ISD Evaluation & Accountability (Data Analysis, Research, and Reporting Services) V:\CILT\1112\CILT_1012.mdb rpt_M-TAKS_E_read_4_per_comm 2011-12 Campus Data Packet
DISTRICT SUMMARY 104

FemaleMigrant MaleAt RiskWhite AfricanAmer
Hispanic EconDisadv
SpecialEduc
LEP All DistrictYearGrade Number Tested(All Students)
PERCENTAGE MEETING STANDARD
TAKS-M Math (1) Texas Assessment of Knowledge and Skills (Modified): MATHEMATICS
2009
* 84.2 80.1
78.8 76.9
82.72011 87.5 82.6 82.2 82.4 82.7 80.2 82.7 36484.4
3 78.32010 82.6 78.9 77.9 78.0 78.3 75.0 78.3 46980.7
81.4 80.8 81.278.1 83.3 80.7 81.2 81.3 81.2 45383.090.0
2009
* 80.9 78.9
81.3 78.9
80.22011 78.9 78.6 81.0 80.7 80.2 82.7 80.2 51079.7
4 80.62010 82.4 82.2 79.0 80.4 80.6 75.7 80.6 47583.7
75.8 75.7 75.874.6 76.8 76.1 75.8 77.5 75.8 64979.275.8 *
2009
88.5 87.3
85.7 87.6
88.12011 92.3 86.3 89.0 88.2 88.1 87.9 88.1 50587.4
5 86.42010 77.8 85.9 87.6 86.6 86.4 86.6 86.4 67186.1
80.6 79.5 80.280.9 79.7 79.6 80.2 79.2 80.2 64178.978.1 *
2009
* 61.7 61.7
60.2 59.4
61.62011 44.4 63.1 61.5 62.2 61.6 60.2 61.6 48759.0
6 60.02010 60.7 54.8 64.4 59.7 60.0 65.9 60.0 50756.8
62.6 67.2 64.060.9 67.5 64.1 64.0 67.7 64.0 57067.150.0 *
2009
* 78.6 77.0
77.0 76.8
78.02011 74.2 77.6 78.2 78.3 78.0 77.4 78.0 1,86677.1
3-6 77.02010 75.0 75.7 78.1 76.9 77.0 76.7 77.0 2,12277.0
74.9 75.8 75.273.4 76.7 75.1 75.2 76.3 75.2 2,31377.074.8 *
4 1,186 677
0 1,398 720
1,8662011 66 999780 1,768 1,866 659 1,8661,543
2009
NUMBER TESTED IN GRADES 3-6
2,1222010 104 1,098902 2,009 2,122 738 2,1221,523
Shaded cells indicate percentages below 65 percent, the 2010-11 AEIS minimum for an Academically Acceptable rating.
4 1,543 768 2,313103 1,1591,030 2,146 2,313 806 2,3131,787
July 29, 2011 Dallas ISD Evaluation & Accountability (Data Analysis, Research, and Reporting Services) V:\CILT\1112\CILT_1012.mdb rpt_M-TAKS_E_math_1_per_meet 2011-12 Campus Data Packet
DISTRICT SUMMARY 105

FemaleMigrant MaleAt RiskWhite AfricanAmer
Hispanic EconDisadv
SpecialEduc
LEP All DistrictYearGrade Number Tested(All Students)
PERCENTAGE MEETING STANDARD
TAKS-M Math (1) Texas Assessment of Knowledge and Skills (Modified): MATHEMATICS
2009
60.8 59.0
* 58.5 61.8
60.22011 56.3 59.1 61.3 59.6 60.2 60.4 60.2 40258.8
7 59.52010 58.8 55.0 63.4 58.6 59.5 66.0 59.5 49458.1
59.1 66.9 62.060.3 63.5 62.4 62.0 63.5 62.0 65260.757.9 *
2009
75.4 73.6
* 65.3 58.4
74.82011 46.7 76.8 74.5 74.6 74.8 78.9 74.8 40075.2
8 63.02010 46.7 59.5 68.2 64.3 63.0 70.5 63.0 52162.8
66.5 68.0 67.164.5 70.2 66.6 67.1 68.4 67.1 63868.066.7 *
2009
68.1 66.0
57.1 61.8 59.9
67.52011 51.6 68.5 67.5 67.0 67.5 69.3 67.5 80267.0
7-8 61.32010 53.1 57.3 65.9 61.6 61.3 68.3 61.3 1,01560.5
62.8 67.5 64.562.4 66.7 64.5 64.5 65.9 64.5 1,29064.462.8 50.0
0 540 259
7 676 337
8022011 31 409349 721 802 296 802707
2009
NUMBER TESTED IN GRADES 7-8
1,0152010 32 463511 913 1,015 328 1,015846
Shaded cells indicate percentages below 65 percent, the 2010-11 AEIS minimum for an Academically Acceptable rating.
6 825 464 1,29043 610628 1,109 1,290 458 1,2901,120
July 29, 2011 Dallas ISD Evaluation & Accountability (Data Analysis, Research, and Reporting Services) V:\CILT\1112\CILT_1012.mdb rpt_M-TAKS_E_math_1_per_meet 2011-12 Campus Data Packet
DISTRICT SUMMARY 106

FemaleMigrant MaleAt RiskWhite AfricanAmer
Hispanic EconDisadv
SpecialEduc
LEP All DistrictYearGrade Number Tested(All Students)
PERCENTAGE MEETING STANDARD
TAKS-M Math (1) Texas Assessment of Knowledge and Skills (Modified): MATHEMATICS
2009
42.8 56.6
57.3 60.8
47.82011 22.2 41.5 59.1 47.3 47.8 57.9 47.8 27247.4
10 58.32010 47.4 55.8 64.2 58.9 58.3 62.1 58.3 38660.9
44.0 37.0 41.537.6 45.8 41.5 41.5 47.0 41.5 46042.852.9
2009
* 40.7 46.2
* 47.6 53.0
42.72011 20.0 40.7 47.0 42.5 42.7 43.4 42.7 79742.1
9-11 49.22010 43.6 45.8 54.4 49.4 49.2 53.4 49.2 1,16651.5
44.0 37.0 41.537.6 45.8 41.5 41.5 47.0 41.5 46042.852.9
1 523 273
1 761 396
7972011 25 336420 652 797 228 797717
2009
NUMBER TESTED IN GRADES 9-11
1,1662010 55 487605 945 1,166 326 1,166972
Shaded cells indicate percentages below 65 percent, the 2010-11 AEIS minimum for an Academically Acceptable rating.
0 298 162 46017 192242 359 460 134 460376
July 29, 2011 Dallas ISD Evaluation & Accountability (Data Analysis, Research, and Reporting Services) V:\CILT\1112\CILT_1012.mdb rpt_M-TAKS_E_math_1_per_meet 2011-12 Campus Data Packet
DISTRICT SUMMARY 107

FemaleMigrant MaleAt RiskWhite AfricanAmer
Hispanic EconDisadv
SpecialEduc
LEP All DistrictYearGrade Number Tested(All Students)
PERCENTAGE MEETING STANDARD
TAKS-M Math (1) Texas Assessment of Knowledge and Skills (Modified): MATHEMATICS
2009
* 67.3 67.7
62.5 65.5 66.4
67.42011 57.4 65.5 69.7 68.3 67.4 68.8 67.4 3,46566.3
3-11 65.82010 62.3 62.1 69.7 66.6 65.8 69.3 65.8 4,30365.4
67.7 68.5 68.065.2 70.6 68.5 68.0 70.1 68.0 4,06368.869.3 60.0
5 2,249 1,209
8 2,835 1,453
3,4652011 122 1,7441,549 3,141 3,465 1,183 3,4652,967
2009
NUMBER TESTED IN GRADES 3-11
4,3032010 191 2,0482,018 3,867 4,303 1,392 4,3033,341
Shaded cells indicate percentages below 65 percent, the 2010-11 AEIS minimum for an Academically Acceptable rating.
10 2,666 1,394 4,063163 1,9611,900 3,614 4,063 1,398 4,0633,283
July 29, 2011 Dallas ISD Evaluation & Accountability (Data Analysis, Research, and Reporting Services) V:\CILT\1112\CILT_1012.mdb rpt_M-TAKS_E_math_1_per_meet 2011-12 Campus Data Packet
DISTRICT SUMMARY 108

FemaleMigrant MaleAt RiskWhite AfricanAmer
Hispanic EconDisadv
SpecialEduc
LEP All DistrictYearGrade Number Tested(All Students)
NUMBER NOT MEETING STANDARD
TAKS-M Math (2) Texas Assessment of Knowledge and Skills (Modified): MATHEMATICS
2011
2009
2010
* 36 27
66 36
632 28 33 63 63 24 63 36451
3 1024 42 54 99 102 38 102 46963
56 29 852 41 40 80 85 31 8563 453
2011
2009
2010
* 62 39
60 32
1014 47 50 93 101 28 101 51080
4 923 33 56 87 92 45 92 47548
* 104 53 1578 72 75 144 157 49 15797 649
2011
2009
2010
37 23
61 30
601 28 31 56 60 23 60 50551
5 918 41 42 86 91 31 91 67171
* 82 45 1277 55 65 124 127 46 127111 641
2011
2009
2010
* 119 67
134 69
18710 72 104 172 187 74 187 487171
6 20311 103 88 192 203 58 203 507168
* 146 59 2059 106 90 187 205 65 205140 570
2011
2009
2010
* 254 156
321 167
41117 175 218 384 411 149 411 1,866353
3-6 48826 219 240 464 488 172 488 2,122350
* 388 186 57426 274 270 535 574 191 574411 2,313
4 1,186 677
0 1,398 720
1,8662011 66 999780 1,768 1,866 659 1,8661,543
2009
NUMBER TESTED IN GRADES 3-6
2,1222010 104 1,098902 2,009 2,122 738 2,1221,523
4 1,543 768 2,313103 1,1591,030 2,146 2,313 806 2,3131,787
July 29, 2011 Dallas ISD Evaluation & Accountability (Data Analysis, Research, and Reporting Services) V:\CILT\1112\CILT_1012.mdb rpt_M-TAKS_E_math_2_num_not_meet 2011-12 Campus Data Packet
DISTRICT SUMMARY 109
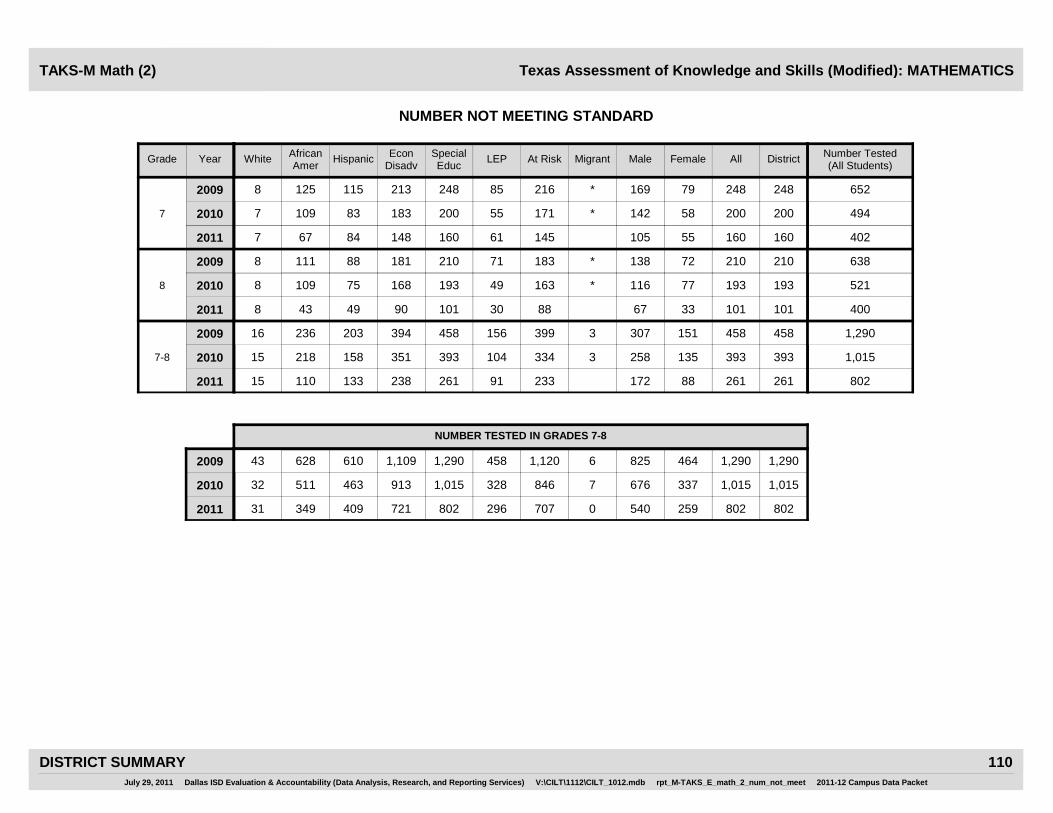
FemaleMigrant MaleAt RiskWhite AfricanAmer
Hispanic EconDisadv
SpecialEduc
LEP All DistrictYearGrade Number Tested(All Students)
NUMBER NOT MEETING STANDARD
TAKS-M Math (2) Texas Assessment of Knowledge and Skills (Modified): MATHEMATICS
2011
2009
2010
105 55
* 142 58
1607 67 84 148 160 61 160 402145
7 2007 109 83 183 200 55 200 494171
* 169 79 2488 125 115 213 248 85 248216 652
2011
2009
2010
67 33
* 116 77
1018 43 49 90 101 30 101 40088
8 1938 109 75 168 193 49 193 521163
* 138 72 2108 111 88 181 210 71 210183 638
2011
2009
2010
172 88
3 258 135
26115 110 133 238 261 91 261 802233
7-8 39315 218 158 351 393 104 393 1,015334
3 307 151 45816 236 203 394 458 156 458399 1,290
0 540 259
7 676 337
8022011 31 409349 721 802 296 802707
2009
NUMBER TESTED IN GRADES 7-8
1,0152010 32 463511 913 1,015 328 1,015846
6 825 464 1,29043 610628 1,109 1,290 458 1,2901,120
July 29, 2011 Dallas ISD Evaluation & Accountability (Data Analysis, Research, and Reporting Services) V:\CILT\1112\CILT_1012.mdb rpt_M-TAKS_E_math_2_num_not_meet 2011-12 Campus Data Packet
DISTRICT SUMMARY 110

FemaleMigrant MaleAt RiskWhite AfricanAmer
Hispanic EconDisadv
SpecialEduc
LEP All DistrictYearGrade Number Tested(All Students)
NUMBER NOT MEETING STANDARD
TAKS-M Math (2) Texas Assessment of Knowledge and Skills (Modified): MATHEMATICS
2011
2009
2010
99 43
108 51
1427 86 45 117 142 32 142 272133
10 16110 92 54 129 161 39 161 386126
167 102 2698 151 104 210 269 71 269215 460
2011
2009
2010
* 310 147
* 399 186
45720 249 178 375 457 129 457 797415
9-11 59231 328 222 478 592 152 592 1,166471
167 102 2698 151 104 210 269 71 269215 460
1 523 273
1 761 396
7972011 25 336420 652 797 228 797717
2009
NUMBER TESTED IN GRADES 9-11
1,1662010 55 487605 945 1,166 326 1,166972
0 298 162 46017 192242 359 460 134 460376
July 29, 2011 Dallas ISD Evaluation & Accountability (Data Analysis, Research, and Reporting Services) V:\CILT\1112\CILT_1012.mdb rpt_M-TAKS_E_math_2_num_not_meet 2011-12 Campus Data Packet
DISTRICT SUMMARY 111

FemaleMigrant MaleAt RiskWhite AfricanAmer
Hispanic EconDisadv
SpecialEduc
LEP All DistrictYearGrade Number Tested(All Students)
NUMBER NOT MEETING STANDARD
TAKS-M Math (2) Texas Assessment of Knowledge and Skills (Modified): MATHEMATICS
2011
2009
2010
* 736 391
3 978 488
1,12952 534 529 997 1,129 369 1,129 3,4651,001
3-11 1,47372 765 620 1,293 1,473 428 1,473 4,3031,155
4 862 439 1,30150 661 577 1,139 1,301 418 1,3011,025 4,063
5 2,249 1,209
8 2,835 1,453
3,4652011 122 1,7441,549 3,141 3,465 1,183 3,4652,967
2009
NUMBER TESTED IN GRADES 3-11
4,3032010 191 2,0482,018 3,867 4,303 1,392 4,3033,341
10 2,666 1,394 4,063163 1,9611,900 3,614 4,063 1,398 4,0633,283
July 29, 2011 Dallas ISD Evaluation & Accountability (Data Analysis, Research, and Reporting Services) V:\CILT\1112\CILT_1012.mdb rpt_M-TAKS_E_math_2_num_not_meet 2011-12 Campus Data Packet
DISTRICT SUMMARY 112

Numbers, Operations,and Quantitative
Reasoning
Patterns,Relationships, and
Algebraic Reasoning
Geometry andSpatial Reasoning
Concepts and Usesof Measurement
Probability andStatistics
MathematicalProcesses and Tools
YearGrade
OBJECTIVE
AVERAGE PERCENTAGE OF ITEMS CORRECT BY OBJECTIVE
Texas Assessment of Knowledge and Skills (Modified): MATHEMATICSTAKS-M Math (3)
72.8
63.3 71.2 80.2 58.1 64.9 54.4
60.8 67.0 76.8 54.1 57.9 51.3
68.9 70.6 73.6 55.9 49.1
2011
2009
3 2010
60.0
70.0 62.9 56.6 49.9 59.5 64.0
67.0 61.1 56.0 46.5 59.8 62.4
64.0 58.4 53.8 45.8 54.6
2011
2009
4 2010
63.1
68.2 61.5 70.0 71.5 78.9 68.2
66.8 59.9 68.6 71.0 76.3 66.3
60.1 61.6 61.5 64.6 63.3
2011
2009
5 2010
53.2
54.6 63.2 65.5 57.1 51.8 52.2
52.0 61.3 63.1 54.7 50.0 52.4
56.1 46.5 53.9 70.1 46.8
2011
2009
6 2010
61.7
64.2 64.2 67.1 59.2 63.8 60.2
62.0 62.1 66.3 57.9 62.2 58.8
61.9 58.7 59.9 59.0 54.0
2011
2009
3-6 2010
July 29, 2011 Dallas ISD Evaluation & Accountability (Data Analysis, Research, and Reporting Services) V:\CILT\1112\CILT_1012.mdb rpt_M-TAKS_E_math_3_obj_elem 2011-12 Campus Data Packet
DISTRICT SUMMARY 113

Numbers, Operations,and Quantitative
Reasoning
Patterns,Relationships, and
Algebraic Reasoning
Geometry andSpatial Reasoning
Concepts and Usesof Measurement
Probability andStatistics
MathematicalProcesses and Tools
YearGrade
OBJECTIVE
AVERAGE PERCENTAGE OF ITEMS CORRECT BY OBJECTIVE
Texas Assessment of Knowledge and Skills (Modified): MATHEMATICSTAKS-M Math (3)
48.7
53.5 48.7 47.5 50.2 47.1 53.6
50.6 49.0 44.9 49.3 49.1 54.6
49.7 48.6 48.5 46.2 56.4
2011
2009
7 2010
48.8
50.8 50.7 56.0 52.9 62.2 55.4
46.3 48.3 52.1 47.1 56.3 50.6
49.7 58.1 51.9 51.1 52.2
2011
2009
8 2010
48.8
52.2 49.7 51.7 51.6 54.6 54.5
48.4 48.6 48.6 48.2 52.8 52.5
49.7 53.3 50.2 48.6 54.3
2011
2009
7-8 2010
July 29, 2011 Dallas ISD Evaluation & Accountability (Data Analysis, Research, and Reporting Services) V:\CILT\1112\CILT_1012.mdb rpt_M-TAKS_E_math_3_obj_elem 2011-12 Campus Data Packet
DISTRICT SUMMARY 114
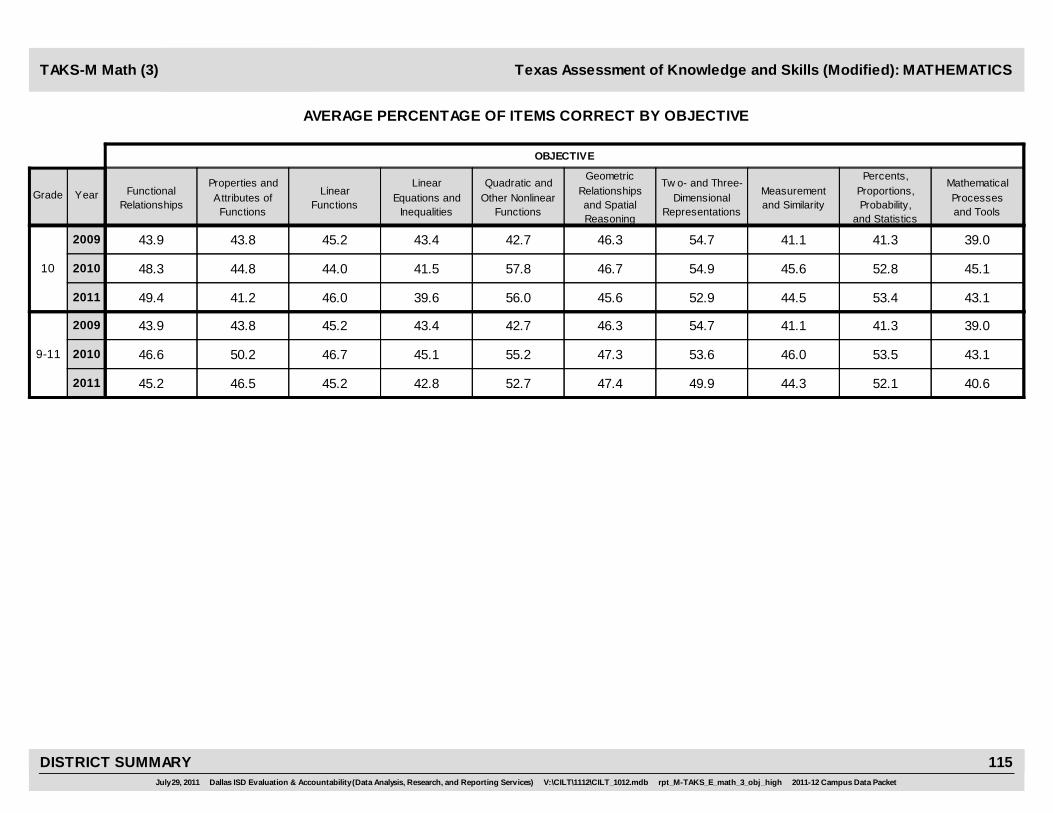
AVERAGE PERCENTAGE OF ITEMS CORRECT BY OBJECTIVE
GeometricRelationshipsand SpatialReasoning
Tw o- and Three-Dimensional
Representations
Measurementand Similarity
Percents,Proportions,Probability,
and Statistics
MathematicalProcessesand Tools
FunctionalRelationships
Properties andAttributes of
Functions
LinearFunctions
LinearEquations and
Inequalities
Quadratic andOther Nonlinear
Functions
YearGrade
OBJECTIVE
TAKS-M Math (3) Texas Assessment of Knowledge and Skills (Modified): MATHEMATICS
39.043.9 43.8 45.2 43.4 42.7 46.3 54.7 41.1 41.3
2011 43.149.4 41.2 46.0 39.6 56.0 45.6 52.9 44.5 53.4
2009
201010 45.148.3 44.8 44.0 41.5 57.8 46.7 54.9 45.6 52.8
39.043.9 43.8 45.2 43.4 42.7 46.3 54.7 41.1 41.3
2011 40.645.2 46.5 45.2 42.8 52.7 47.4 49.9 44.3 52.1
2009
20109-11 43.146.6 50.2 46.7 45.1 55.2 47.3 53.6 46.0 53.5
July 29, 2011 Dallas ISD Evaluation & Accountability (Data Analysis, Research, and Reporting Services) V:\CILT\1112\CILT_1012.mdb rpt_M-TAKS_E_math_3_obj_high 2011-12 Campus Data Packet
DISTRICT SUMMARY 115

FemaleMigrant MaleAt RiskWhite AfricanAmer
Hispanic EconDisadv
SpecialEduc
LEP All DistrictYearGrade Number Tested(All Students)
PERCENTAGE DEMONSTRATING COMMENDED PERFORMANCE
TAKS-M Math (4) Texas Assessment of Knowledge and Skills (Modified): MATHEMATICS
* 22.4 17.6
14.7 10.9
20.62011 6.3 24.8 17.8 20.4 20.6 12.4 20.6 36421.8
3
2009
13.42010 8.7 13.1 14.3 13.4 13.4 15.1 13.4 46913.8
22.9 21.2 22.320.0 25.7 20.1 22.7 22.3 15.7 22.323.5 453
* 28.6 19.5
21.8 17.1
25.32011 21.1 25.5 25.5 25.5 25.3 26.5 25.3 51024.8
4
2009
20.22010 17.6 19.5 20.2 20.5 20.2 18.9 20.2 47521.0
* 14.9 12.4 14.012.1 13.7 13.9 14.4 14.0 16.1 14.013.9 649
18.6 21.5
17.1 22.3
20.02011 7.7 18.6 21.7 20.7 20.0 21.1 20.0 50519.8
5
2009
18.92010 13.9 17.6 19.7 18.6 18.9 22.5 18.9 67118.9
* 16.8 17.8 17.23.1 16.3 19.1 17.6 17.2 17.6 17.217.1 641
* 10.9 14.3
11.0 9.4
12.12011 5.6 9.7 13.7 12.3 12.1 11.8 12.1 48710.1
6
2009
10.52010 14.3 9.2 11.3 10.7 10.5 13.5 10.5 5079.0
* 7.2 11.1 8.40.0 7.7 9.7 8.6 8.4 6.5 8.49.4 570
* 20.1 18.3
16.2 15.7
19.52011 10.6 19.6 19.8 19.8 19.5 18.2 19.5 1,86618.9
3-6
2009
16.02010 13.5 14.9 16.8 16.0 16.0 18.0 16.0 2,12215.7
* 15.0 15.4 15.18.7 15.0 15.6 15.5 15.1 14.0 15.115.8 2,313
4 1,186 677
0 1,398 720
1,8662011 66 999780 1,768 1,866 659 1,8661,543
2009
NUMBER TESTED IN GRADES 3-6
2,1222010 104 1,098902 2,009 2,122 738 2,1221,523
Shaded cells indicate percentages at or above 30 percent, the Gold Performance Acknow ledgment Standard for 2010-11.
4 1,543 768 2,313103 1,1591,030 2,146 2,313 806 2,3131,787
July 29, 2011 Dallas ISD Evaluation & Accountability (Data Analysis, Research, and Reporting Services) V:\CILT\1112\CILT_1012.mdb rpt_M-TAKS_E_math_4_per_comm 2011-12 Campus Data Packet
DISTRICT SUMMARY 116

FemaleMigrant MaleAt RiskWhite AfricanAmer
Hispanic EconDisadv
SpecialEduc
LEP All DistrictYearGrade Number Tested(All Students)
PERCENTAGE DEMONSTRATING COMMENDED PERFORMANCE
TAKS-M Math (4) Texas Assessment of Knowledge and Skills (Modified): MATHEMATICS
9.3 9.7
* 4.7 6.6
9.52011 25.0 9.1 8.8 9.6 9.5 7.8 9.5 4028.2
7
2009
5.32010 5.9 4.5 5.7 5.7 5.3 7.4 5.3 4945.4
* 7.0 9.6 8.015.8 5.7 9.8 7.2 8.0 10.7 8.08.2 652
5.1 8.0
* 3.0 4.3
6.02011 0.0 6.5 6.3 5.6 6.0 5.6 6.0 4005.6
8
2009
3.52010 0.0 2.6 4.7 3.6 3.5 5.4 3.5 5213.7
* 6.3 4.9 5.812.5 2.9 8.5 5.0 5.8 6.7 5.85.8 638
7.2 8.9
14.3 3.8 5.3
7.72011 12.9 7.7 7.6 7.6 7.7 6.8 7.7 8026.9
7-8
2009
4.32010 3.1 3.5 5.2 4.6 4.3 6.4 4.3 1,0154.5
0.0 6.7 7.3 6.914.0 4.3 9.2 6.1 6.9 8.7 6.97.0 1,290
0 540 259
7 676 337
8022011 31 409349 721 802 296 802707
2009
NUMBER TESTED IN GRADES 7-8
1,0152010 32 463511 913 1,015 328 1,015846
Shaded cells indicate percentages at or above 30 percent, the Gold Performance Acknow ledgment Standard for 2010-11.
6 825 464 1,29043 610628 1,109 1,290 458 1,2901,120
July 29, 2011 Dallas ISD Evaluation & Accountability (Data Analysis, Research, and Reporting Services) V:\CILT\1112\CILT_1012.mdb rpt_M-TAKS_E_math_4_per_comm 2011-12 Campus Data Packet
DISTRICT SUMMARY 117

FemaleMigrant MaleAt RiskWhite AfricanAmer
Hispanic EconDisadv
SpecialEduc
LEP All DistrictYearGrade Number Tested(All Students)
PERCENTAGE DEMONSTRATING COMMENDED PERFORMANCE
TAKS-M Math (4) Texas Assessment of Knowledge and Skills (Modified): MATHEMATICS
2.3 6.1
2.4 2.3
3.72011 0.0 2.7 5.5 3.2 3.7 1.3 3.7 2723.6
10
2009
2.32010 0.0 1.9 2.6 2.2 2.3 3.9 2.3 3862.5
3.7 1.2 2.80.0 1.7 4.7 3.6 2.8 5.2 2.82.9 460
* 2.1 3.3
* 2.1 1.0
2.52011 0.0 1.7 3.3 2.1 2.5 1.3 2.5 7972.2
9-11
2009
1.72010 0.0 1.0 2.7 1.8 1.7 2.1 1.7 1,1661.6
3.7 1.2 2.80.0 1.7 4.7 3.6 2.8 5.2 2.82.9 460
1 523 273
1 761 396
7972011 25 336420 652 797 228 797717
2009
NUMBER TESTED IN GRADES 9-11
1,1662010 55 487605 945 1,166 326 1,166972
Shaded cells indicate percentages at or above 30 percent, the Gold Performance Acknow ledgment Standard for 2010-11.
0 298 162 46017 192242 359 460 134 460376
July 29, 2011 Dallas ISD Evaluation & Accountability (Data Analysis, Research, and Reporting Services) V:\CILT\1112\CILT_1012.mdb rpt_M-TAKS_E_math_4_per_comm 2011-12 Campus Data Packet
DISTRICT SUMMARY 118

FemaleMigrant MaleAt RiskWhite AfricanAmer
Hispanic EconDisadv
SpecialEduc
LEP All DistrictYearGrade Number Tested(All Students)
PERCENTAGE DEMONSTRATING COMMENDED PERFORMANCE
TAKS-M Math (4) Texas Assessment of Knowledge and Skills (Modified): MATHEMATICS
* 12.8 12.9
12.5 9.5 9.3
12.92011 9.0 12.1 13.8 13.3 12.9 12.1 12.9 3,46512.0
3-11
2009
9.42010 7.9 7.8 10.8 9.8 9.4 11.6 9.4 4,3038.8
0.0 11.2 11.0 11.19.2 9.8 12.5 11.5 11.1 11.4 11.111.3 4,063
5 2,249 1,209
8 2,835 1,453
3,4652011 122 1,7441,549 3,141 3,465 1,183 3,4652,967
2009
NUMBER TESTED IN GRADES 3-11
4,3032010 191 2,0482,018 3,867 4,303 1,392 4,3033,341
Shaded cells indicate percentages at or above 30 percent, the Gold Performance Acknow ledgment Standard for 2010-11.
10 2,666 1,394 4,063163 1,9611,900 3,614 4,063 1,398 4,0633,283
July 29, 2011 Dallas ISD Evaluation & Accountability (Data Analysis, Research, and Reporting Services) V:\CILT\1112\CILT_1012.mdb rpt_M-TAKS_E_math_4_per_comm 2011-12 Campus Data Packet
DISTRICT SUMMARY 119

FemaleMigrant MaleAt RiskWhite AfricanAmer
Hispanic EconDisadv
SpecialEduc
LEP All DistrictYearGrade Number Tested(All Students)
Texas Assessment of Knowledge and Skills (Modified): WRITING
PERCENTAGE MEETING STANDARD
TAKS-M Writing (1)
72.5 75.5
* 0.0 0.0
73.5 73.9
73.52011 68.2 77.0 71.4 74.1 73.5 69.4 73.5 50670.8
4
0.02009 0.0 0.0 0.0 0.0 0.0 0.0 0.0 6940.0
73.42010 54.5 76.1 72.7 73.3 73.4 66.7 73.4 53174.8
0 342 163
1 463 229
0 373 157
5062011 22 259217 482 506 147 506380
6942009 32 364287 646 694 260 694508
NUMBER TESTED IN GRADE 4
5312010 22 304201 498 531 207 531330
Shaded cells indicate percentages below 70 percent, the 2010-11 AEIS minimum for an Academically Acceptable rating.
July 29, 2011 Dallas ISD Evaluation & Accountability (Data Analysis, Research, and Reporting Services) V:\CILT\1112\CILT_1012.mdb rpt_M-TAKS_E_write_1_per_meet 2011-12 Campus Data Packet
DISTRICT SUMMARY 120

FemaleMigrant MaleAt RiskWhite AfricanAmer
Hispanic EconDisadv
SpecialEduc
LEP All DistrictYearGrade Number Tested(All Students)
Texas Assessment of Knowledge and Skills (Modified): WRITING
PERCENTAGE MEETING STANDARD
TAKS-M Writing (1)
55.6 62.3
* 0.0 0.0
* 61.2 74.8
57.92011 52.6 60.8 56.3 57.7 57.9 53.5 57.9 40156.5
7
0.02009 0.0 0.0 0.0 0.0 0.0 0.0 0.0 6910.0
65.22010 64.7 64.6 65.4 64.0 65.2 66.8 65.2 51763.4
0 270 130
3 454 237
3 366 151
4012011 19 224153 362 401 157 401359
6912009 12 338336 613 691 258 691588
NUMBER TESTED IN GRADE 7
5172010 17 254243 470 517 184 517423
Shaded cells indicate percentages below 70 percent, the 2010-11 AEIS minimum for an Academically Acceptable rating.
July 29, 2011 Dallas ISD Evaluation & Accountability (Data Analysis, Research, and Reporting Services) V:\CILT\1112\CILT_1012.mdb rpt_M-TAKS_E_write_1_per_meet 2011-12 Campus Data Packet
DISTRICT SUMMARY 121
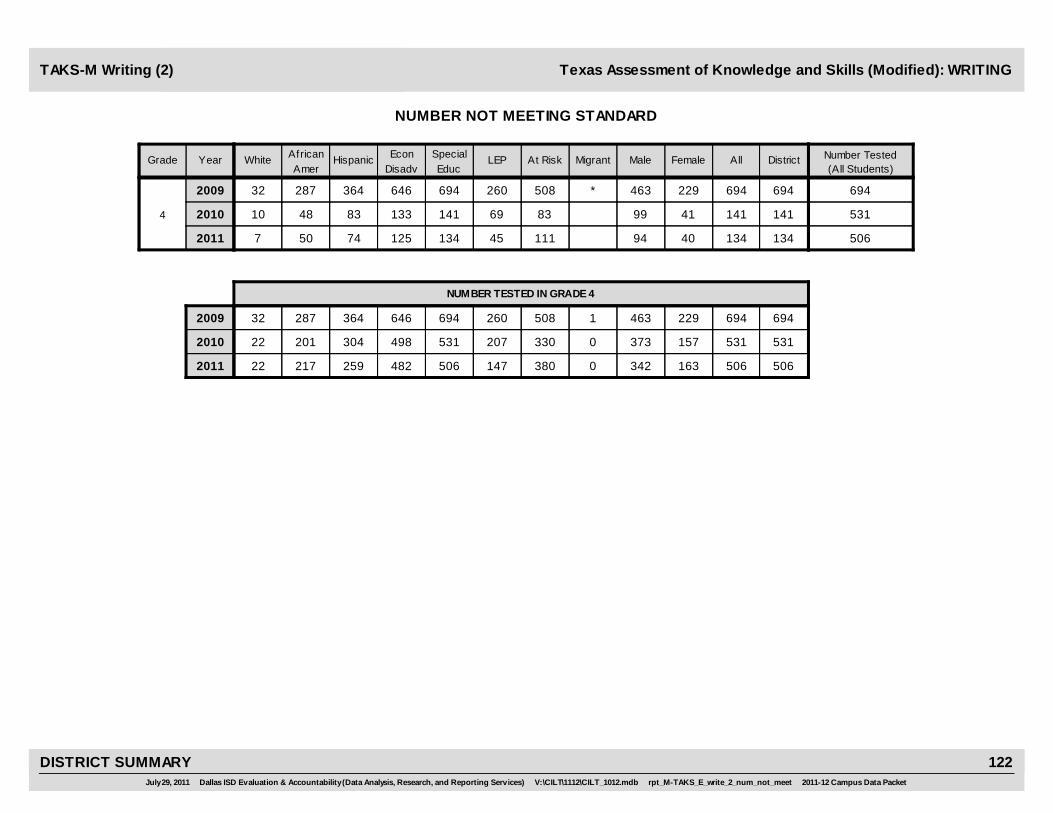
FemaleMigrant MaleAt RiskWhite AfricanAmer
Hispanic EconDisadv
SpecialEduc
LEP All DistrictYearGrade Number Tested(All Students)
Texas Assessment of Knowledge and Skills (Modified): WRITING
NUMBER NOT MEETING STANDARD
TAKS-M Writing (2)
94 40
* 463 229
99 41
1342011 7 50 74 125 134 45 134 506111
4
6942009 32 287 364 646 694 260 694 694508
1412010 10 48 83 133 141 69 141 53183
0 342 163
1 463 229
0 373 157
5062011 22 259217 482 506 147 506380
6942009 32 364287 646 694 260 694508
NUMBER TESTED IN GRADE 4
5312010 22 304201 498 531 207 531330
July 29, 2011 Dallas ISD Evaluation & Accountability (Data Analysis, Research, and Reporting Services) V:\CILT\1112\CILT_1012.mdb rpt_M-TAKS_E_write_2_num_not_meet 2011-12 Campus Data Packet
DISTRICT SUMMARY 122

FemaleMigrant MaleAt RiskWhite AfricanAmer
Hispanic EconDisadv
SpecialEduc
LEP All DistrictYearGrade Number Tested(All Students)
Texas Assessment of Knowledge and Skills (Modified): WRITING
NUMBER NOT MEETING STANDARD
TAKS-M Writing (2)
120 49
* 454 237
* 142 38
1692011 9 60 98 153 169 73 169 401156
7
6912009 12 336 338 613 691 258 691 691588
1802010 6 86 88 169 180 61 180 517155
0 270 130
3 454 237
3 366 151
4012011 19 224153 362 401 157 401359
6912009 12 338336 613 691 258 691588
NUMBER TESTED IN GRADE 7
5172010 17 254243 470 517 184 517423
July 29, 2011 Dallas ISD Evaluation & Accountability (Data Analysis, Research, and Reporting Services) V:\CILT\1112\CILT_1012.mdb rpt_M-TAKS_E_write_2_num_not_meet 2011-12 Campus Data Packet
DISTRICT SUMMARY 123

Written Composition:Effectiveness / Command
of Conventions¹
AppropriateOrganization of Ideas
Correct and EffectiveSentence Construction
Standard Usage andAppropriate Word Choice
Proofreading forPunctuation, Capitalization,
and SpellingYearGrade
OBJECTIVE
Texas Assessment of Knowledge and Skills (Modified): WRITING
AVERAGE PERCENTAGE OF ITEMS CORRECT BY OBJECTIVE
TAKS-M Writing (3)
2011 1.2 54.3 56.2 58.9 61.2
2009 1.3 65.1 55.5 57.9 63.7
4 2010 1.3 56.9 54.7 60.4 61.6
2011 1.4 56.1 49.2 56.3 50.5
2009 1.5 68.6 55.3 67.0 61.5
7 2010 1.5 58.4 52.6 59.0 51.4
¹Average rating on w ritten composition. TAKS compositions are rated on a scale of 1 to 4.
July 29, 2011 Dallas ISD Evaluation & Accountability (Data Analysis, Research, and Reporting Services) V:\CILT\1112\CILT_1012.mdb rpt_M-TAKS_E_write_3_obj 2011-12 Campus Data Packet
DISTRICT SUMMARY 124

FemaleMigrant MaleAt RiskWhite AfricanAmer
Hispanic EconDisadv
SpecialEduc
LEP All DistrictYearGrade Number Tested(All Students)
Texas Assessment of Knowledge and Skills (Modified): WRITING
PERCENTAGE DEMONSTRATING COMMENDED PERFORMANCE
TAKS-M Writing (4)
6.1 6.7
* 0.0 0.0
9.4 4.5
6.32011 9.1 8.8 4.2 6.6 6.3 3.4 6.3 5064.7
4
0.02009 0.0 0.0 0.0 0.0 0.0 0.0 0.0 6940.0
7.92010 13.6 6.0 8.6 7.8 7.9 7.7 7.9 5317.0
0 342 163
1 463 229
0 373 157
5062011 22 259217 482 506 147 506380
6942009 32 364287 646 694 260 694508
NUMBER TESTED IN GRADE 4
5312010 22 304201 498 531 207 531330
Shaded cells indicate percentages at or above 30 percent, the Gold Performance Acknow ledgment Standard for 2010-11.
July 29, 2011 Dallas ISD Evaluation & Accountability (Data Analysis, Research, and Reporting Services) V:\CILT\1112\CILT_1012.mdb rpt_M-TAKS_E_write_4_per_comm 2011-12 Campus Data Packet
DISTRICT SUMMARY 125
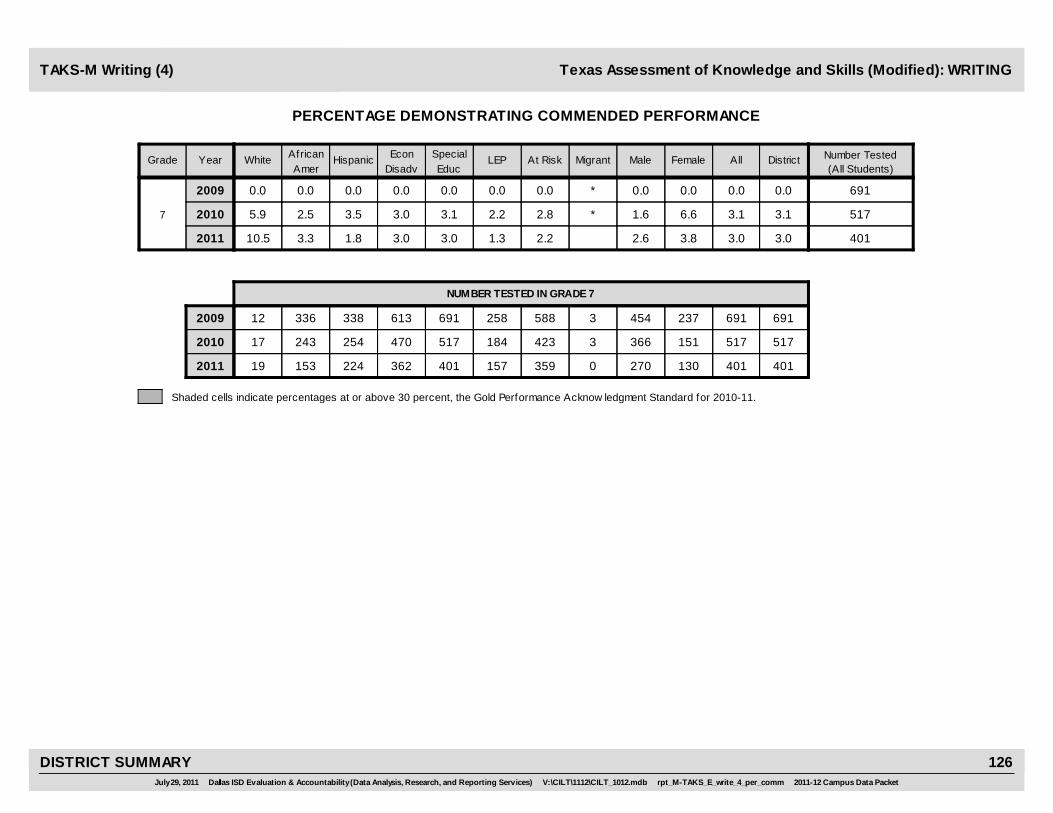
FemaleMigrant MaleAt RiskWhite AfricanAmer
Hispanic EconDisadv
SpecialEduc
LEP All DistrictYearGrade Number Tested(All Students)
Texas Assessment of Knowledge and Skills (Modified): WRITING
PERCENTAGE DEMONSTRATING COMMENDED PERFORMANCE
TAKS-M Writing (4)
2.6 3.8
* 0.0 0.0
* 1.6 6.6
3.02011 10.5 3.3 1.8 3.0 3.0 1.3 3.0 4012.2
7
0.02009 0.0 0.0 0.0 0.0 0.0 0.0 0.0 6910.0
3.12010 5.9 2.5 3.5 3.0 3.1 2.2 3.1 5172.8
0 270 130
3 454 237
3 366 151
4012011 19 224153 362 401 157 401359
6912009 12 338336 613 691 258 691588
NUMBER TESTED IN GRADE 7
5172010 17 254243 470 517 184 517423
Shaded cells indicate percentages at or above 30 percent, the Gold Performance Acknow ledgment Standard for 2010-11.
July 29, 2011 Dallas ISD Evaluation & Accountability (Data Analysis, Research, and Reporting Services) V:\CILT\1112\CILT_1012.mdb rpt_M-TAKS_E_write_4_per_comm 2011-12 Campus Data Packet
DISTRICT SUMMARY 126
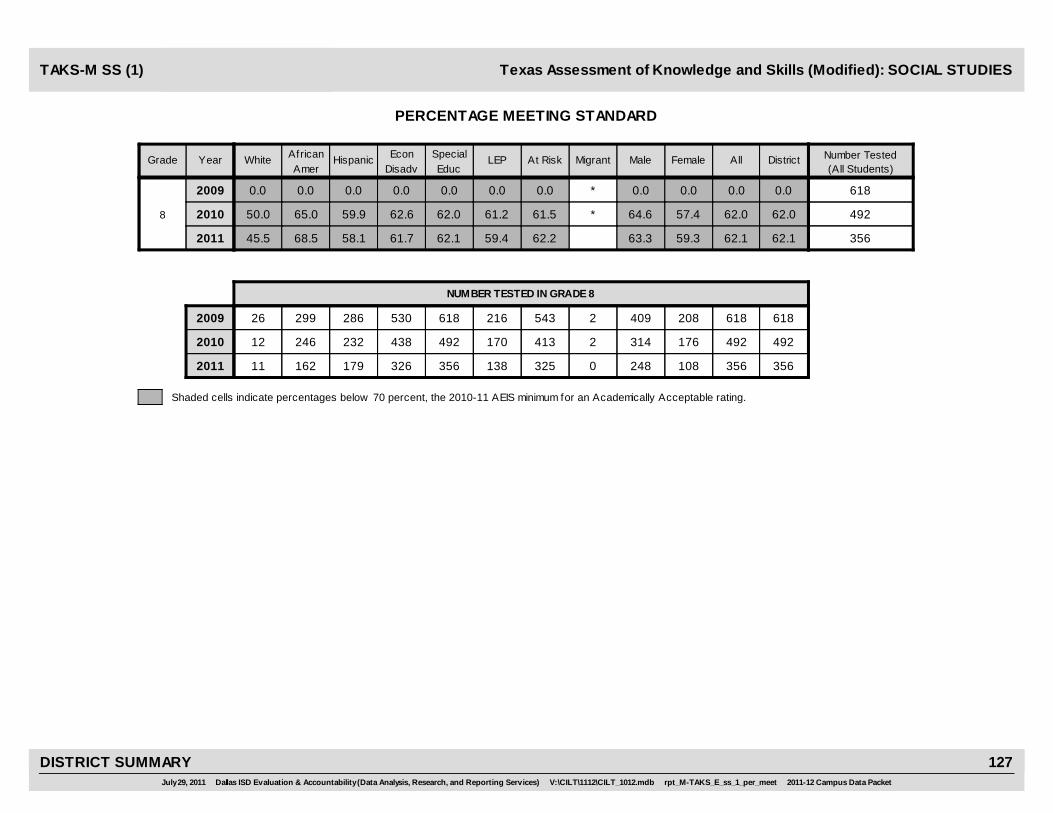
FemaleMigrant MaleAt RiskWhite AfricanAmer
Hispanic EconDisadv
SpecialEduc
LEP All DistrictYearGrade Number Tested(All Students)
Texas Assessment of Knowledge and Skills (Modified): SOCIAL STUDIES
PERCENTAGE MEETING STANDARD
TAKS-M SS (1)
63.3 59.3
* 0.0 0.0
* 64.6 57.4
62.12011 45.5 68.5 58.1 61.7 62.1 59.4 62.1 35662.2
8
0.02009 0.0 0.0 0.0 0.0 0.0 0.0 0.0 6180.0
62.02010 50.0 65.0 59.9 62.6 62.0 61.2 62.0 49261.5
0 248 108
2 409 208
2 314 176
3562011 11 179162 326 356 138 356325
6182009 26 286299 530 618 216 618543
NUMBER TESTED IN GRADE 8
4922010 12 232246 438 492 170 492413
Shaded cells indicate percentages below 70 percent, the 2010-11 AEIS minimum for an Academically Acceptable rating.
July 29, 2011 Dallas ISD Evaluation & Accountability (Data Analysis, Research, and Reporting Services) V:\CILT\1112\CILT_1012.mdb rpt_M-TAKS_E_ss_1_per_meet 2011-12 Campus Data Packet
DISTRICT SUMMARY 127

FemaleMigrant MaleAt RiskWhite AfricanAmer
Hispanic EconDisadv
SpecialEduc
LEP All DistrictYearGrade Number Tested(All Students)
Texas Assessment of Knowledge and Skills (Modified): SOCIAL STUDIES
PERCENTAGE MEETING STANDARD
TAKS-M SS (1)
53.2 52.2
0.0 0.0
61.5 62.8
52.82011 44.4 45.6 60.2 53.2 52.8 58.9 52.8 24652.0
10
0.02009 0.0 0.0 0.0 0.0 0.0 0.0 0.0 4050.0
61.72010 57.1 61.8 63.9 61.2 61.7 62.6 61.7 33263.1
49.5 48.1
0.0 0.0
55.4 52.9
49.02011 36.8 47.6 51.4 48.6 49.0 48.8 49.0 43747.6
10-11
0.02009 0.0 0.0 0.0 0.0 0.0 0.0 0.0 4050.0
54.62010 58.3 54.6 54.8 53.6 54.6 56.4 54.6 62355.9
0 279 158
0 268 137
0 415 206
4372011 19 179229 358 437 123 437399
4052009 13 163221 319 405 115 405332
NUMBER TESTED IN GRADES 10-11
6232010 24 263324 504 623 172 623522
Shaded cells indicate percentages below 70 percent, the 2010-11 AEIS minimum for an Academically Acceptable rating.
July 29, 2011 Dallas ISD Evaluation & Accountability (Data Analysis, Research, and Reporting Services) V:\CILT\1112\CILT_1012.mdb rpt_M-TAKS_E_ss_1_per_meet 2011-12 Campus Data Packet
DISTRICT SUMMARY 128

FemaleMigrant MaleAt RiskWhite AfricanAmer
Hispanic EconDisadv
SpecialEduc
LEP All DistrictYearGrade Number Tested(All Students)
Texas Assessment of Knowledge and Skills (Modified): SOCIAL STUDIES
NUMBER NOT MEETING STANDARD
TAKS-M SS (2)
91 44
* 409 208
* 111 75
1352011 6 51 75 125 135 56 135 356123
8
6182009 26 299 286 530 618 216 618 618543
1872010 6 86 93 164 187 66 187 492159
0 248 108
2 409 208
2 314 176
3562011 11 179162 326 356 138 356325
6182009 26 286299 530 618 216 618543
NUMBER TESTED IN GRADE 8
4922010 12 232246 438 492 170 492413
July 29, 2011 Dallas ISD Evaluation & Accountability (Data Analysis, Research, and Reporting Services) V:\CILT\1112\CILT_1012.mdb rpt_M-TAKS_E_ss_2_num_not_meet 2011-12 Campus Data Packet
DISTRICT SUMMARY 129

FemaleMigrant MaleAt RiskWhite AfricanAmer
Hispanic EconDisadv
SpecialEduc
LEP All DistrictYearGrade Number Tested(All Students)
Texas Assessment of Knowledge and Skills (Modified): SOCIAL STUDIES
NUMBER NOT MEETING STANDARD
TAKS-M SS (2)
73 43
268 137
84 42
1162011 5 68 43 94 116 30 116 246110
10
4052009 13 221 163 319 405 115 405 405332
1272010 6 68 48 107 127 34 127 332104
141 82
268 137
185 97
2232011 12 120 87 184 223 63 223 437209
10-11
4052009 13 221 163 319 405 115 405 405332
2832010 10 147 119 234 283 75 283 623230
0 279 158
0 268 137
0 415 206
4372011 19 179229 358 437 123 437399
4052009 13 163221 319 405 115 405332
NUMBER TESTED IN GRADES 10-11
6232010 24 263324 504 623 172 623522
July 29, 2011 Dallas ISD Evaluation & Accountability (Data Analysis, Research, and Reporting Services) V:\CILT\1112\CILT_1012.mdb rpt_M-TAKS_E_ss_2_num_not_meet 2011-12 Campus Data Packet
DISTRICT SUMMARY 130

Issues and Eventsin U.S. History
Geographic Inf luenceson History
Economic and SocialInf luences on History
Political Inf luenceson History Critical-Thinking SkillsYearGrade
OBJECTIVE
Texas Assessment of Knowledge and Skills (Modified): SOCIAL STUDIES
AVERAGE PERCENTAGE OF ITEMS CORRECT BY OBJECTIVE
TAKS-M SS (3)
2011 64.3 66.5 61.9 61.0 62.5
2009 45.6 50.5 59.3 51.2 62.7
8 2010 64.1 65.4 57.6 58.6 60.0
July 29, 2011 Dallas ISD Evaluation & Accountability (Data Analysis, Research, and Reporting Services) V:\CILT\1112\CILT_1012.mdb rpt_M-TAKS_E_ss_3_obj 2011-12 Campus Data Packet
DISTRICT SUMMARY 131

Issues and Eventsin U.S. History
Geographic Inf luenceson History
Economic and SocialInf luences on History
Political Inf luenceson History Critical-Thinking SkillsYearGrade
OBJECTIVE
Texas Assessment of Knowledge and Skills (Modified): SOCIAL STUDIES
AVERAGE PERCENTAGE OF ITEMS CORRECT BY OBJECTIVE
TAKS-M SS (3)
2011 51.1 57.1 58.8 53.3 52.6
2009 63.9 68.2 59.2 53.8 63.8
10 2010 54.0 61.7 62.9 58.8 56.2
2011 51.1 57.1 54.3 55.1 52.5
2009 63.9 68.2 59.2 53.8 63.8
10-11 2010 53.6 60.1 56.0 59.5 55.0
July 29, 2011 Dallas ISD Evaluation & Accountability (Data Analysis, Research, and Reporting Services) V:\CILT\1112\CILT_1012.mdb rpt_M-TAKS_E_ss_3_obj 2011-12 Campus Data Packet
DISTRICT SUMMARY 132

FemaleMigrant MaleAt RiskWhite AfricanAmer
Hispanic EconDisadv
SpecialEduc
LEP All DistrictYearGrade Number Tested(All Students)
Texas Assessment of Knowledge and Skills (Modified): SOCIAL STUDIES
PERCENTAGE DEMONSTRATING COMMENDED PERFORMANCE
TAKS-M SS (4)
10.9 4.6
* 0.0 0.0
* 6.7 1.7
9.02011 9.1 10.5 7.8 7.7 9.0 10.1 9.0 3568.3
8
0.02009 0.0 0.0 0.0 0.0 0.0 0.0 0.0 6180.0
4.92010 0.0 6.5 3.4 5.0 4.9 3.5 4.9 4925.3
0 248 108
2 409 208
2 314 176
3562011 11 179162 326 356 138 356325
6182009 26 286299 530 618 216 618543
NUMBER TESTED IN GRADE 8
4922010 12 232246 438 492 170 492413
Shaded cells indicate percentages at or above 30 percent, the Gold Performance Acknow ledgment Standard for 2010-11.
July 29, 2011 Dallas ISD Evaluation & Accountability (Data Analysis, Research, and Reporting Services) V:\CILT\1112\CILT_1012.mdb rpt_M-TAKS_E_ss_4_per_comm 2011-12 Campus Data Packet
DISTRICT SUMMARY 133

FemaleMigrant MaleAt RiskWhite AfricanAmer
Hispanic EconDisadv
SpecialEduc
LEP All DistrictYearGrade Number Tested(All Students)
Texas Assessment of Knowledge and Skills (Modified): SOCIAL STUDIES
PERCENTAGE DEMONSTRATING COMMENDED PERFORMANCE
TAKS-M SS (4)
5.8 4.4
0.0 0.0
7.8 3.5
5.32011 0.0 2.4 9.3 6.0 5.3 6.8 5.3 2465.7
10
0.02009 0.0 0.0 0.0 0.0 0.0 0.0 0.0 4050.0
6.32010 14.3 6.2 6.0 4.7 6.3 4.4 6.3 3326.7
5.0 2.5
0.0 0.0
5.5 2.4
4.12011 5.3 2.2 6.1 4.5 4.1 4.9 4.1 4374.3
10-11
0.02009 0.0 0.0 0.0 0.0 0.0 0.0 0.0 4050.0
4.52010 16.7 4.0 4.2 3.4 4.5 4.1 4.5 6234.6
0 279 158
0 268 137
0 415 206
4372011 19 179229 358 437 123 437399
4052009 13 163221 319 405 115 405332
NUMBER TESTED IN GRADES 10-11
6232010 24 263324 504 623 172 623522
Shaded cells indicate percentages at or above 30 percent, the Gold Performance Acknow ledgment Standard for 2010-11.
July 29, 2011 Dallas ISD Evaluation & Accountability (Data Analysis, Research, and Reporting Services) V:\CILT\1112\CILT_1012.mdb rpt_M-TAKS_E_ss_4_per_comm 2011-12 Campus Data Packet
DISTRICT SUMMARY 134
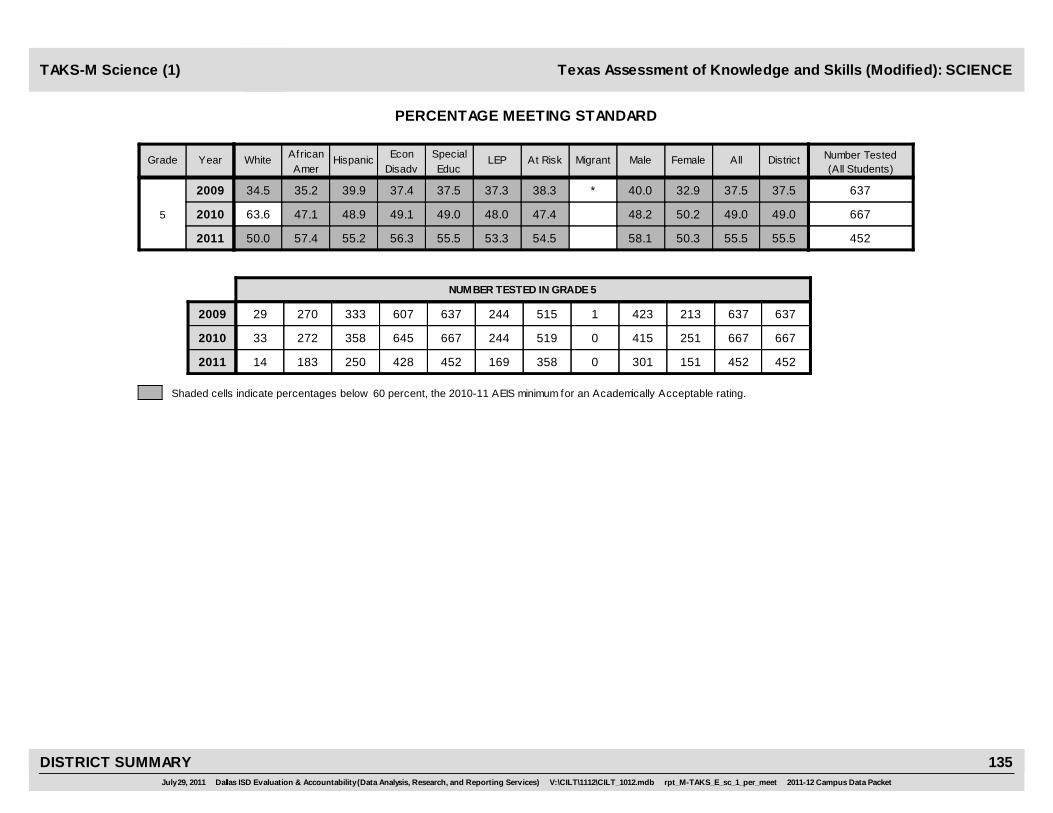
FemaleMigrant MaleAt RiskWhite AfricanAmer
Hispanic EconDisadv
SpecialEduc
LEP All DistrictYearGrade Number Tested(All Students)
PERCENTAGE MEETING STANDARD
TAKS-M Science (1) Texas Assessment of Knowledge and Skills (Modified): SCIENCE
58.1 50.3
48.2 50.2
55.52011 50.0 57.4 55.2 56.3 55.5 53.3 55.5 45254.5
5
2009
49.02010 63.6 47.1 48.9 49.1 49.0 48.0 49.0 66747.4
637* 40.0 32.9 37.534.5 35.2 39.9 37.4 37.5 37.3 37.538.3
0 301 151
0 415 251
4522011 14 250183 428 452 169 452358
2009
NUMBER TESTED IN GRADE 5
6672010 33 358272 645 667 244 667519
Shaded cells indicate percentages below 60 percent, the 2010-11 AEIS minimum for an Academically Acceptable rating.
1 423 213 63729 333270 607 637 244 637515
July 29, 2011 Dallas ISD Evaluation & Accountability (Data Analysis, Research, and Reporting Services) V:\CILT\1112\CILT_1012.mdb rpt_M-TAKS_E_sc_1_per_meet 2011-12 Campus Data Packet
DISTRICT SUMMARY 135

FemaleMigrant MaleAt RiskWhite AfricanAmer
Hispanic EconDisadv
SpecialEduc
LEP All DistrictYearGrade Number Tested(All Students)
PERCENTAGE MEETING STANDARD
TAKS-M Science (1) Texas Assessment of Knowledge and Skills (Modified): SCIENCE
56.7 53.0
* 52.5 44.4
55.62011 58.3 58.4 52.2 54.0 55.6 56.3 55.6 36955.2
8
2009
49.62010 33.3 49.2 51.3 52.0 49.6 49.7 49.6 50248.7
631* 40.8 38.7 40.139.3 35.6 44.4 41.0 40.1 41.8 40.139.8
0 254 115
2 322 178
3692011 12 186166 339 369 144 369337
2009
NUMBER TESTED IN GRADE 8
5022010 12 236252 448 502 171 502417
Shaded cells indicate percentages below 60 percent, the 2010-11 AEIS minimum for an Academically Acceptable rating.
1 417 212 63128 293303 541 631 225 631553
July 29, 2011 Dallas ISD Evaluation & Accountability (Data Analysis, Research, and Reporting Services) V:\CILT\1112\CILT_1012.mdb rpt_M-TAKS_E_sc_1_per_meet 2011-12 Campus Data Packet
DISTRICT SUMMARY 136

FemaleMigrant MaleAt RiskWhite AfricanAmer
Hispanic EconDisadv
SpecialEduc
LEP All DistrictYearGrade Number Tested(All Students)
PERCENTAGE MEETING STANDARD
TAKS-M Science (1) Texas Assessment of Knowledge and Skills (Modified): SCIENCE
29.6 36.2
40.6 34.1
32.02011 33.3 28.8 35.5 30.7 32.0 29.7 32.0 25330.9
10
2009
38.72010 52.9 34.2 43.1 37.3 38.7 43.2 38.7 35440.1
43638.5 34.0 36.942.9 36.0 38.9 35.2 36.9 37.2 36.938.2
31.3 32.9
41.2 34.7
31.92011 22.2 30.0 35.4 31.0 31.9 27.6 31.9 46429.9
10-11
2009
39.22010 50.0 38.8 38.5 37.1 39.2 37.9 39.2 66340.1
43638.5 34.0 36.942.9 36.0 38.9 35.2 36.9 37.2 36.938.2
0 294 170
0 434 225
4642011 18 189247 378 464 127 464422
2009
NUMBER TESTED IN GRADES 10-11
6632010 28 275348 533 663 182 663554
Shaded cells indicate percentages below 60 percent, the 2010-11 AEIS minimum for an Academically Acceptable rating.
0 283 153 43614 185228 338 436 129 436359
July 29, 2011 Dallas ISD Evaluation & Accountability (Data Analysis, Research, and Reporting Services) V:\CILT\1112\CILT_1012.mdb rpt_M-TAKS_E_sc_1_per_meet 2011-12 Campus Data Packet
DISTRICT SUMMARY 137

FemaleMigrant MaleAt RiskWhite AfricanAmer
Hispanic EconDisadv
SpecialEduc
LEP All DistrictYearGrade Number Tested(All Students)
NUMBER NOT MEETING STANDARD
TAKS-M Science (2) Texas Assessment of Knowledge and Skills (Modified): SCIENCE
126 75
215 125
2012011 7 78 112 187 201 79 201 452163
5
2009
3402010 12 144 183 328 340 127 340 667273
637* 254 143 39819 175 200 380 398 153 398318
0 301 151
0 415 251
4522011 14 250183 428 452 169 452358
2009
NUMBER TESTED IN GRADE 5
6672010 33 358272 645 667 244 667519
1 423 213 63729 333270 607 637 244 637515
July 29, 2011 Dallas ISD Evaluation & Accountability (Data Analysis, Research, and Reporting Services) V:\CILT\1112\CILT_1012.mdb rpt_M-TAKS_E_sc_2_num_not_meet 2011-12 Campus Data Packet
DISTRICT SUMMARY 138

FemaleMigrant MaleAt RiskWhite AfricanAmer
Hispanic EconDisadv
SpecialEduc
LEP All DistrictYearGrade Number Tested(All Students)
NUMBER NOT MEETING STANDARD
TAKS-M Science (2) Texas Assessment of Knowledge and Skills (Modified): SCIENCE
110 54
* 153 99
1642011 5 69 89 156 164 63 164 369151
8
2009
2532010 8 128 115 215 253 86 253 502214
631* 247 130 37817 195 163 319 378 131 378333
0 254 115
2 322 178
3692011 12 186166 339 369 144 369337
2009
NUMBER TESTED IN GRADE 8
5022010 12 236252 448 502 171 502417
1 417 212 63128 293303 541 631 225 631553
July 29, 2011 Dallas ISD Evaluation & Accountability (Data Analysis, Research, and Reporting Services) V:\CILT\1112\CILT_1012.mdb rpt_M-TAKS_E_sc_2_num_not_meet 2011-12 Campus Data Packet
DISTRICT SUMMARY 139

FemaleMigrant MaleAt RiskWhite AfricanAmer
Hispanic EconDisadv
SpecialEduc
LEP All DistrictYearGrade Number Tested(All Students)
NUMBER NOT MEETING STANDARD
TAKS-M Science (2) Texas Assessment of Knowledge and Skills (Modified): SCIENCE
112 60
136 81
1722011 6 94 69 142 172 52 172 253163
10
2009
2172010 8 127 78 183 217 54 217 354179
436174 101 2758 146 113 219 275 81 275222
202 114
255 147
3162011 14 173 122 261 316 92 316 464296
10-11
2009
4032010 14 213 169 335 403 113 403 663332
436174 101 2758 146 113 219 275 81 275222
0 294 170
0 434 225
4642011 18 189247 378 464 127 464422
2009
NUMBER TESTED IN GRADES 10-11
6632010 28 275348 533 663 182 663554
0 283 153 43614 185228 338 436 129 436359
July 29, 2011 Dallas ISD Evaluation & Accountability (Data Analysis, Research, and Reporting Services) V:\CILT\1112\CILT_1012.mdb rpt_M-TAKS_E_sc_2_num_not_meet 2011-12 Campus Data Packet
DISTRICT SUMMARY 140

Nature of Science Life Sciences Physical Sciences Earth SciencesYearGrade
OBJECTIVE
Texas Assessment of Knowledge and Skills (Modified): SCIENCE
AVERAGE PERCENTAGE OF ITEMS CORRECT BY OBJECTIVE
TAKS-M Science (3)
2011 72.4 75.8 77.6 71.1
2009
5 2010 72.0 73.8 75.4 70.4
66.9 68.2 68.4 56.9
July 29, 2011 Dallas ISD Evaluation & Accountability (Data Analysis, Research, and Reporting Services) V:\CILT\1112\CILT_1012.mdb rpt_M-TAKS_E_sc_3_obj_elem 2011-12 Campus Data Packet
DISTRICT SUMMARY 141

Nature of ScienceLiving Systems and
the EnvironmentStructures and
Properties of MatterMotion, Forces,
and EnergyEarth and
Space SystemsYearGrade
OBJECTIVE
Texas Assessment of Knowledge and Skills (Modified): SCIENCE
AVERAGE PERCENTAGE OF ITEMS CORRECT BY OBJECTIVE
TAKS-M Science (3)
2011 56.9 63.7 55.1 63.0 51.7
2009
8 2010 55.6 61.2 55.0 59.5 48.7
58.8 57.6 51.2 45.9 52.8
July 29, 2011 Dallas ISD Evaluation & Accountability (Data Analysis, Research, and Reporting Services) V:\CILT\1112\CILT_1012.mdb rpt_M-TAKS_E_sc_3_obj_mid 2011-12 Campus Data Packet
DISTRICT SUMMARY 141

Nature of ScienceOrganization ofLiving Systems
Interdependence ofOrganisms andthe Environment
Structures andProperties of Matter
Motion, Forces,and Energy
YearGrade
OBJECTIVE
Texas Assessment of Knowledge and Skills (Modified): SCIENCE
AVERAGE PERCENTAGE OF ITEMS CORRECT BY OBJECTIVE
TAKS-M Science (3)
2011 52.5 55.0 48.1 46.6 51.7
2009
10 2010 55.2 57.0 50.0 50.0 55.5
53.2 52.1 51.9 44.2 60.9
2011 52.2 52.0 47.6 47.7 52.1
2009
10-11 2010 54.5 53.0 48.9 50.4 55.3
53.2 52.1 51.9 44.2 60.9
July 29, 2011 Dallas ISD Evaluation & Accountability (Data Analysis, Research, and Reporting Services) V:\CILT\1112\CILT_1012.mdb rpt_M-TAKS_E_sc_3_obj_high 2011-12 Campus Data Packet
DISTRICT SUMMARY 143

FemaleMigrant MaleAt RiskWhite AfricanAmer
Hispanic EconDisadv
SpecialEduc
LEP All DistrictYearGrade Number Tested(All Students)
Texas Assessment of Knowledge and Skills (Modified): SCIENCE
PERCENTAGE DEMONSTRATING COMMENDED PERFORMANCE
TAKS-M Science (4)
16.3 13.9
10.8 9.2
15.52011 0.0 18.0 14.4 16.1 15.5 13.6 15.5 45214.2
5
2009
10.32010 6.1 10.7 10.3 10.2 10.3 11.5 10.3 66710.4
637* 5.4 3.8 4.96.9 2.6 6.6 4.8 4.9 7.0 4.95.4
0 301 151
0 415 251
4522011 14 250183 428 452 169 452358
2009
NUMBER TESTED IN GRADE 5
6672010 33 358272 645 667 244 667519
Shaded cells indicate percentages at or above 30 percent, the Gold Performance Acknow ledgment Standard for 2010-11.
1 423 213 63729 333270 607 637 244 637515
July 29, 2011 Dallas ISD Evaluation & Accountability (Data Analysis, Research, and Reporting Services) V:\CILT\1112\CILT_1012.mdb rpt_M-TAKS_E_sc_4_per_comm 2011-12 Campus Data Packet
DISTRICT SUMMARY 144

FemaleMigrant MaleAt RiskWhite AfricanAmer
Hispanic EconDisadv
SpecialEduc
LEP All DistrictYearGrade Number Tested(All Students)
Texas Assessment of Knowledge and Skills (Modified): SCIENCE
PERCENTAGE DEMONSTRATING COMMENDED PERFORMANCE
TAKS-M Science (4)
5.9 3.5
* 2.5 1.7
5.12011 8.3 6.0 4.3 5.3 5.1 5.6 5.1 3695.0
8
2009
2.22010 0.0 2.0 2.5 2.0 2.2 2.3 2.2 5022.2
631* 2.4 1.4 2.13.6 2.0 2.0 1.8 2.1 2.2 2.12.0
0 254 115
2 322 178
3692011 12 186166 339 369 144 369337
2009
NUMBER TESTED IN GRADE 8
5022010 12 236252 448 502 171 502417
Shaded cells indicate percentages at or above 30 percent, the Gold Performance Acknow ledgment Standard for 2010-11.
1 417 212 63128 293303 541 631 225 631553
July 29, 2011 Dallas ISD Evaluation & Accountability (Data Analysis, Research, and Reporting Services) V:\CILT\1112\CILT_1012.mdb rpt_M-TAKS_E_sc_4_per_comm 2011-12 Campus Data Packet
DISTRICT SUMMARY 145

FemaleMigrant MaleAt RiskWhite AfricanAmer
Hispanic EconDisadv
SpecialEduc
LEP All DistrictYearGrade Number Tested(All Students)
Texas Assessment of Knowledge and Skills (Modified): SCIENCE
PERCENTAGE DEMONSTRATING COMMENDED PERFORMANCE
TAKS-M Science (4)
3.1 3.2
7.9 3.3
3.22011 0.0 4.5 1.9 2.4 3.2 2.7 3.2 2532.5
10
2009
6.22010 11.8 4.7 7.3 5.1 6.2 6.3 6.2 3545.4
4366.0 2.6 4.80.0 3.1 7.6 5.3 4.8 4.7 4.84.7
2.7 2.4
5.8 2.2
2.62011 0.0 3.2 1.6 1.9 2.6 1.6 2.6 4642.1
10-11
2009
4.52010 7.1 3.7 5.1 4.1 4.5 4.9 4.5 6634.2
4366.0 2.6 4.80.0 3.1 7.6 5.3 4.8 4.7 4.84.7
0 294 170
0 434 225
4642011 18 189247 378 464 127 464422
2009
NUMBER TESTED IN GRADE 10-11
6632010 28 275348 533 663 182 663554
Shaded cells indicate percentages at or above 30 percent, the Gold Performance Acknow ledgment Standard for 2010-11.
0 283 153 43614 185228 338 436 129 436359
July 29, 2011 Dallas ISD Evaluation & Accountability (Data Analysis, Research, and Reporting Services) V:\CILT\1112\CILT_1012.mdb rpt_M-TAKS_E_sc_4_per_comm 2011-12 Campus Data Packet
DISTRICT SUMMARY 146

Number Tested(All Students)
Number Tested(All Students)
DistrictAt Risk Not At Risk All DistrictYearGrade At Risk Not At Risk All
State Compensatory Education (SCE) Compliance for At-Risk StudentsCompliance
PERCENTAGE AT OR ABOVE THE 40th PERCENTILE on the ITBS
YearGrade
MATHEMATICS TOTAL (**MATHEMATICS )READING TOTAL (**READING PROFILE TOTAL )
2009
K**
56.8 13,48963.32011 51.5 75.4 63.3 6,761 51.6 70.4 56.8
52.8
51.2
13,330
13,266
54.442.3 62.0 54.4 1,288 46.0 65.8 52.8
61.22010 43.3 70.4 61.2 6,262 42.8 65.9 51.2
2009
K**
2011
2010
2009
1
53.1 13,44358.12011 40.7 72.8 58.1 6,998 47.2 66.8 53.1
50.4
48.8
8,446
13,666
54.232.3 68.0 54.2 7,181 38.3 61.3 50.4
55.22010 34.8 71.0 55.2 6,985 43.2 61.6 48.8
2009
1
2011
2010
2009
2
56.8 13,13550.72011 33.6 80.1 50.7 6,794 52.0 75.7 56.8
53.2
54.6
8,787
13,231
47.928.8 74.4 47.9 7,454 41.6 73.9 53.2
48.62010 30.0 76.4 48.6 7,004 48.7 74.8 54.6
2009
2
2011
2010
2009
5
44.8 10,90736.22011 20.3 59.9 36.2 9,181 36.0 61.8 44.8
0
0
0
2010 0
2009
5
2011
2010
2009
1-5
53.3 51,01947.22011 29.8 69.9 47.2 23,002 47.5 68.2 53.3
52.3
51.5
30,563
40,163
51.030.2 70.7 51.0 14,637 42.9 66.3 52.3
51.92010 32.0 73.3 51.9 13,990 45.1 66.6 51.5
2009
K-5
2011
2010
29,7632011 16,418 13,356 29,763 51,01936,872 14,164 51,019
15,9252009 7,604 8,321 15,925
20,2522010 9,385 10,867 20,252
30,56318,333 12,230 30,563
40,16328,197 11,966 40,163NumberTested
2011
2009
2010NumberTested
filler
July 29, 2011 Dallas ISD Evaluation & Accountability (Data Analysis, Research, and Reporting Services) V:\CILT\1112\CILT_1012.mdb rpt_SCE_COMPLIANCE 2011-12 Campus Data Packet
DISTRICT SUMMARY 147

Number Tested(All Students)
Number Tested(All Students)
DistrictAt Risk Not At Risk All DistrictYearGrade At Risk Not At Risk All
State Compensatory Education (SCE) Compliance for At-Risk StudentsCompliance
PERCENTAGE AT OR ABOVE THE 40th PERCENTILE on the ITBS
YearGrade
MATHEMATICS TOTAL (**MATHEMATICS )READING TOTAL (**READING PROFILE TOTAL )
2009
8
42.1 9,26233.32011 13.2 60.5 33.3 9,423 23.4 67.3 42.1
48.3
45.5
9,737
9,135
33.615.7 66.3 33.6 9,813 30.5 80.7 48.3
33.92010 15.1 62.7 33.9 9,416 27.1 73.4 45.5
2009
8
2011
2010
9,4232011 5,418 4,005 9,423 9,2625,311 3,951 9,262
9,8132009 6,328 3,485 9,813
9,4162010 5,706 3,710 9,416
9,7376,289 3,448 9,737
9,1355,500 3,635 9,135NumberTested
2011
2009
2010NumberTested
filler
July 29, 2011 Dallas ISD Evaluation & Accountability (Data Analysis, Research, and Reporting Services) V:\CILT\1112\CILT_1012.mdb rpt_SCE_COMPLIANCE 2011-12 Campus Data Packet
DISTRICT SUMMARY 148

FemaleMigrant MaleAt RiskWhite AfricanAmer
Hispanic EconDisadv
SpecialEduc
LEP All DistrictYearGrade Number Tested(All Students)
ITBS: READING TOTAL (**READING PROFILE TOTAL)ITBS Read (1)
PERCENTAGE AT OR ABOVE THE 40th PERCENTILE
60.0 66.7
* 50.4 58.4
* 58.0 64.6
63.32011 84.9 63.9 57.5 60.5 32.2 42.1 63.3 6,76151.5
K**
54.42009 80.9 53.8 51.9 52.5 27.8 44.5 54.4 1,28842.3
61.22010 83.7 61.3 55.4 57.6 29.1 34.3 61.2 6,26243.3
* 53.9 62.6
* 50.3 58.4
51.1 59.5
58.12011 76.1 57.2 54.4 55.1 30.6 42.5 58.1 6,99840.7
1
54.22009 73.6 51.3 53.3 50.9 31.4 38.1 54.2 7,18132.3
55.22010 76.0 53.3 52.7 52.0 22.7 38.4 55.2 6,98534.8
47.9 53.7
* 46.2 49.5
* 45.9 51.4
50.72011 79.3 47.3 48.6 46.8 16.6 34.0 50.7 6,79433.6
2
47.92009 74.0 43.4 47.0 44.5 20.8 33.2 47.9 7,45428.8
48.62010 72.8 44.4 47.9 45.1 19.3 30.5 48.6 7,00430.0
* 50.9 58.2
* 48.3 53.8
* 48.5 55.4
54.42011 77.5 52.3 51.5 51.0 22.9 37.7 54.4 13,79236.6
1-2
51.02009 73.8 47.4 50.0 47.6 25.3 35.4 51.0 14,63730.2
51.92010 74.4 48.9 50.3 48.5 20.8 34.4 51.9 13,99032.0
33.3 34.9 37.8 36.22011 72.6 36.3 33.0 33.1 7.1 21.6 36.2 9,18120.3
5
2009 0
2010 0
50.0 44.6 50.1
* 48.3 53.8
* 48.5 55.4
47.22011 76.2 47.6 42.5 43.8 14.9 26.1 47.2 23,00229.8
1-5
51.02009 73.8 47.4 50.0 47.6 25.3 35.4 51.0 14,63730.2
51.92010 74.4 48.9 50.3 48.5 20.8 34.4 51.9 13,99032.0
8 11,836 11,149
4 7,463 7,173
2 7,209 6,781
23,0022011 1,599 12,1288,694 19,898 1,532 4,779 23,00212,992
14,6372009 1,225 6,3256,846 12,669 778 1,358 14,6377,110NumberTested
13,9902010 1,140 6,0446,533 12,192 727 1,342 13,9907,265
filler
July 29, 2011 Dallas ISD Evaluation & Accountability (Data Analysis, Research, and Reporting Services) V:\CILT\1112\CILT_1012.mdb rpt_ITBS_read_1_perGE40 2011-12 Campus Data Packet
DISTRICT SUMMARY 149

FemaleMigrant MaleAt RiskWhite AfricanAmer
Hispanic EconDisadv
SpecialEduc
LEP All DistrictYearGrade Number Tested(All Students)
ITBS: READING TOTAL (**READING PROFILE TOTAL)ITBS Read (1)
PERCENTAGE AT OR ABOVE THE 40th PERCENTILE
16.7 32.7 33.8
16.7 33.1 34.2
30.9 32.6 35.1
33.32011 75.5 29.6 31.2 30.3 4.8 8.6 33.3 9,42313.2
8
33.62009 72.6 29.4 32.4 30.7 3.9 7.3 33.6 9,81315.7
33.92010 72.5 31.2 31.9 31.3 3.6 8.8 33.9 9,41615.1
6 4,760 4,652
12 4,972 4,841
55 4,743 4,671
9,4232011 425 6,2762,507 7,830 730 2,064 9,4235,418
9,8132009 427 6,3412,918 7,973 918 1,724 9,8136,328NumberTested
9,4162010 422 6,2142,645 7,735 834 1,708 9,4165,706
filler
July 29, 2011 Dallas ISD Evaluation & Accountability (Data Analysis, Research, and Reporting Services) V:\CILT\1112\CILT_1012.mdb rpt_ITBS_read_1_perGE40 2011-12 Campus Data Packet
DISTRICT SUMMARY 150

FemaleMigrant MaleAt RiskWhite AfricanAmer
Hispanic EconDisadv
SpecialEduc
LEP All DistrictYearGrade Number Tested(All Students)
ITBS: READING TOTAL (**READING PROFILE TOTAL)ITBS Read (2)
NUMBER AT OR ABOVE THE 80th PERCENTILE
979 1,126
* 145 159
* 817 900
2,1062011 399 957 678 1,593 33 62 2,106 6,761670
K**
3042009 23 131 130 240 4 20 304 1,28889
1,7172010 373 807 504 1,235 25 42 1,717 6,262276
* 909 1,054
* 790 869
788 941
1,9632011 342 852 699 1,444 33 71 1,963 6,998394
1
1,6592009 279 746 600 1,215 35 53 1,659 7,181232
1,7292010 299 794 589 1,263 20 66 1,729 6,985259
503 517
* 488 539
* 443 511
1,0202011 224 397 348 682 20 39 1,020 6,794237
2
1,0272009 258 365 370 675 26 53 1,027 7,454225
9542010 212 387 330 655 12 29 954 7,004166
* 1,412 1,571
* 1,278 1,410
* 1,231 1,452
2,9832011 566 1,249 1,047 2,126 53 110 2,983 13,792631
1-2
2,6882009 537 1,113 970 1,892 61 106 2,688 14,637457
2,6832010 511 1,181 919 1,918 32 95 2,683 13,990425
0 343 357 7012011 174 157 334 429 14 81 701 9,181112
5
2009 0
2010 0
1 1,759 1,934
* 1,278 1,410
* 1,231 1,452
3,6942011 741 1,408 1,386 2,561 68 191 3,694 23,002744
1-5
2,6882009 537 1,113 970 1,892 61 106 2,688 14,637457
2,6832010 511 1,181 919 1,918 32 95 2,683 13,990425
8 11,836 11,149
4 7,463 7,173
2 7,209 6,781
23,0022011 1,599 12,1288,694 19,898 1,532 4,779 23,00212,992
14,6372009 1,225 6,3256,846 12,669 778 1,358 14,6377,110NumberTested
13,9902010 1,140 6,0446,533 12,192 727 1,342 13,9907,265
filler
July 29, 2011 Dallas ISD Evaluation & Accountability (Data Analysis, Research, and Reporting Services) V:\CILT\1112\CILT_1012.mdb rpt_ITBS_read_2_nGE80 2011-12 Campus Data Packet
DISTRICT SUMMARY 151

FemaleMigrant MaleAt RiskWhite AfricanAmer
Hispanic EconDisadv
SpecialEduc
LEP All DistrictYearGrade Number Tested(All Students)
ITBS: READING TOTAL (**READING PROFILE TOTAL)ITBS Read (2)
NUMBER AT OR ABOVE THE 80th PERCENTILE
0 312 296
0 298 277
1 305 285
6082011 188 127 264 318 5 7 608 9,42353
8
5752009 137 134 284 310 5 9 575 9,81361
5902010 151 135 276 330 4 6 590 9,41659
6 4,760 4,652
12 4,972 4,841
55 4,743 4,671
9,4232011 425 6,2762,507 7,830 730 2,064 9,4235,418
9,8132009 427 6,3412,918 7,973 918 1,724 9,8136,328NumberTested
9,4162010 422 6,2142,645 7,735 834 1,708 9,4165,706
filler
July 29, 2011 Dallas ISD Evaluation & Accountability (Data Analysis, Research, and Reporting Services) V:\CILT\1112\CILT_1012.mdb rpt_ITBS_read_2_nGE80 2011-12 Campus Data Packet
DISTRICT SUMMARY 152

FemaleMigrant MaleAt RiskWhite AfricanAmer
Hispanic EconDisadv
SpecialEduc
LEP All DistrictYearGrade Number Tested(All Students)
ITBS: MATHEMATICS TOTAL (**MATHEMATICS)ITBS Math (1)
PERCENTAGE AT OR ABOVE THE 40th PERCENTILE
* 55.1 58.6
66.7 50.3 55.4
62.5 49.2 53.3
56.82011 82.2 59.3 54.0 55.3 32.0 49.7 56.8 13,48951.6
K**
52.82009 79.6 56.4 49.8 50.9 28.5 46.3 52.8 13,33046.0
51.22010 80.1 55.0 47.6 48.9 28.4 42.8 51.2 13,26642.8
83.3 52.8 53.4
* 51.1 49.6
75.0 47.9 49.7
53.12011 78.1 53.6 50.8 51.3 33.0 47.3 53.1 13,44347.2
1
50.42009 75.2 45.1 50.7 47.7 30.1 44.0 50.4 8,44638.3
48.82010 74.9 47.2 47.6 47.0 22.3 45.5 48.8 13,66643.2
71.4 56.3 57.3
* 53.9 52.5
71.4 55.1 54.0
56.82011 78.0 50.6 57.5 55.6 24.8 56.2 56.8 13,13552.0
2
53.22009 74.5 47.4 54.3 50.7 27.2 47.0 53.2 8,78741.6
54.62010 76.1 49.7 54.7 53.1 21.8 52.7 54.6 13,23148.7
73.3 54.7 56.4
58.8 51.6 53.0
70.0 50.7 52.3
55.62011 79.6 54.5 54.1 54.1 29.5 51.1 55.6 40,06750.3
K-2
52.32009 76.3 49.5 51.1 50.0 28.4 46.0 52.3 30,56342.9
51.52010 77.3 50.6 50.0 49.7 23.6 47.0 51.5 40,16345.1
77.8 46.8 42.7 44.82011 69.6 35.8 46.1 43.2 12.2 42.6 44.8 10,90736.0
5
2009 0
2010 0
75.0 53.1 53.5
58.8 51.6 53.0
70.0 50.7 52.3
53.32011 77.7 50.3 52.4 51.8 23.6 49.4 53.3 51,01947.5
K-5
52.32009 76.3 49.5 51.1 50.0 28.4 46.0 52.3 30,56342.9
51.52010 77.3 50.6 50.0 49.7 23.6 47.0 51.5 40,16345.1
24 26,117 24,877
17 15,511 15,051
30 20,624 19,539
51,0192011 2,345 36,00711,797 46,348 2,425 25,753 51,01936,872
30,5632009 1,796 18,25910,100 27,337 1,290 10,876 30,56318,333NumberTested
40,1632010 1,865 28,0679,766 36,901 1,541 20,625 40,16328,197
filler
July 29, 2011 Dallas ISD Evaluation & Accountability (Data Analysis, Research, and Reporting Services) V:\CILT\1112\CILT_1012.mdb rpt_ITBS_math_1_perGE40 2011-12 Campus Data Packet
DISTRICT SUMMARY 153

FemaleMigrant MaleAt RiskWhite AfricanAmer
Hispanic EconDisadv
SpecialEduc
LEP All DistrictYearGrade Number Tested(All Students)
ITBS: MATHEMATICS TOTAL (**MATHEMATICS)ITBS Math (1)
PERCENTAGE AT OR ABOVE THE 40th PERCENTILE
42.9 40.8 43.4
33.3 45.3 51.4
37.0 43.9 47.2
42.12011 72.4 32.2 43.4 40.4 7.8 24.0 42.1 9,26223.4
8
48.32009 70.0 38.4 50.9 47.1 6.9 24.8 48.3 9,73730.5
45.52010 71.7 34.8 47.9 44.3 6.4 26.5 45.5 9,13527.1
7 4,655 4,596
12 4,933 4,804
54 4,605 4,528
9,2622011 413 6,2032,432 7,688 701 2,052 9,2625,311
9,7372009 410 6,3182,881 7,919 900 1,751 9,7376,289NumberTested
9,1352010 417 5,9922,592 7,505 811 1,637 9,1355,500
filler
July 29, 2011 Dallas ISD Evaluation & Accountability (Data Analysis, Research, and Reporting Services) V:\CILT\1112\CILT_1012.mdb rpt_ITBS_math_1_perGE40 2011-12 Campus Data Packet
DISTRICT SUMMARY 154

FemaleMigrant MaleAt RiskWhite AfricanAmer
Hispanic EconDisadv
SpecialEduc
LEP All DistrictYearGrade Number Tested(All Students)
ITBS: MATHEMATICS TOTAL (**MATHEMATICS)ITBS Math (2)
NUMBER AT OR ABOVE THE 80th PERCENTILE
* 1,367 1,447
0 1,147 1,308
2 1,095 1,263
2,8152011 336 708 1,697 2,353 49 1,068 2,815 13,4891,590
K**
2,4552009 271 642 1,494 2,016 34 991 2,455 13,3301,189
2,3582010 332 607 1,388 1,915 31 872 2,358 13,2661,086
4 1,447 1,268
* 831 746
3 1,198 1,068
2,7162011 310 660 1,669 2,243 47 1,016 2,716 13,4431,434
1
1,5772009 253 570 718 1,199 36 218 1,577 8,446416
2,2662010 262 559 1,390 1,855 36 922 2,266 13,6661,141
3 1,453 1,293
* 892 794
4 1,332 1,152
2,7462011 252 565 1,857 2,343 45 1,282 2,746 13,1351,667
2
1,6862009 275 556 803 1,289 47 259 1,686 8,787599
2,4842010 230 560 1,649 2,122 35 1,123 2,484 13,2311,437
7 4,267 4,008
1 2,870 2,848
9 3,625 3,483
8,2772011 898 1,933 5,223 6,939 141 3,366 8,277 40,0674,691
K-2
5,7182009 799 1,768 3,015 4,504 117 1,468 5,718 30,5632,204
7,1082010 824 1,726 4,427 5,892 102 2,917 7,108 40,1633,664
1 798 596 1,3952011 168 213 965 1,097 15 523 1,395 10,907582
5
2009 0
2010 0
8 5,077 4,616
1 2,870 2,848
9 3,625 3,483
9,6962011 1,069 2,150 6,203 8,054 156 3,895 9,696 51,0195,280
K-5
5,7182009 799 1,768 3,015 4,504 117 1,468 5,718 30,5632,204
7,1082010 824 1,726 4,427 5,892 102 2,917 7,108 40,1633,664
24 26,117 24,877
17 15,511 15,051
30 20,624 19,539
51,0192011 2,345 36,00711,797 46,348 2,425 25,753 51,01936,872
30,5632009 1,796 18,25910,100 27,337 1,290 10,876 30,56318,333NumberTested
40,1632010 1,865 28,0679,766 36,901 1,541 20,625 40,16328,197
filler
July 29, 2011 Dallas ISD Evaluation & Accountability (Data Analysis, Research, and Reporting Services) V:\CILT\1112\CILT_1012.mdb rpt_ITBS_math_2_nGE80 2011-12 Campus Data Packet
DISTRICT SUMMARY 155
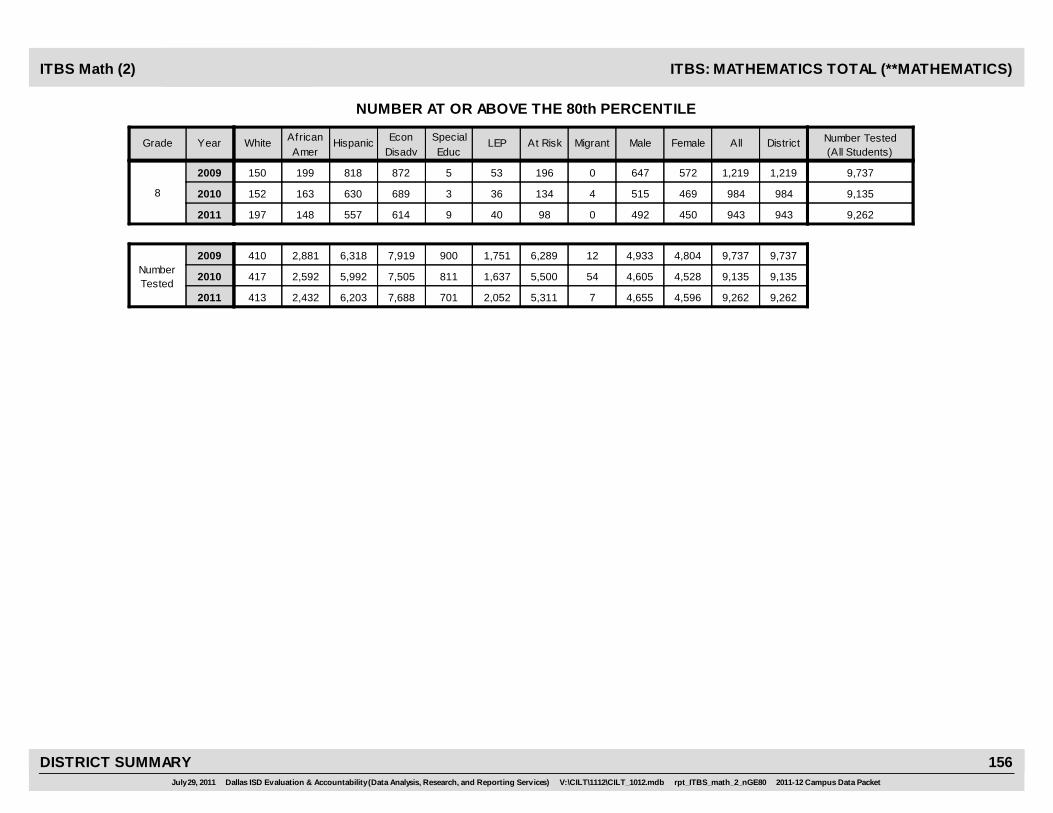
FemaleMigrant MaleAt RiskWhite AfricanAmer
Hispanic EconDisadv
SpecialEduc
LEP All DistrictYearGrade Number Tested(All Students)
ITBS: MATHEMATICS TOTAL (**MATHEMATICS)ITBS Math (2)
NUMBER AT OR ABOVE THE 80th PERCENTILE
0 492 450
0 647 572
4 515 469
9432011 197 148 557 614 9 40 943 9,26298
8
1,2192009 150 199 818 872 5 53 1,219 9,737196
9842010 152 163 630 689 3 36 984 9,135134
7 4,655 4,596
12 4,933 4,804
54 4,605 4,528
9,2622011 413 6,2032,432 7,688 701 2,052 9,2625,311
9,7372009 410 6,3182,881 7,919 900 1,751 9,7376,289NumberTested
9,1352010 417 5,9922,592 7,505 811 1,637 9,1355,500
filler
July 29, 2011 Dallas ISD Evaluation & Accountability (Data Analysis, Research, and Reporting Services) V:\CILT\1112\CILT_1012.mdb rpt_ITBS_math_2_nGE80 2011-12 Campus Data Packet
DISTRICT SUMMARY 156

FemaleMigrant MaleAt RiskWhite AfricanAmer
Hispanic EconDisadv
SpecialEduc
LEP All DistrictYearGrade Number Tested(All Students)
ITBS: MATHEMATICS COMPUTATIONITBS Math (3)
PERCENTAGE AT OR ABOVE THE 40th PERCENTILE
100.0 66.1 67.3
54.5 65.7 66.3
87.5 63.0 64.0
66.72011 76.5 60.9 67.7 65.9 49.7 67.0 66.7 13,50464.4
1
66.02009 75.8 56.8 68.7 65.2 43.8 69.9 66.0 13,91464.7
63.52010 75.6 55.9 65.4 62.6 40.7 65.7 63.5 13,66761.2
71.4 60.7 63.5
55.6 60.4 61.4
85.7 59.9 63.0
62.02011 70.9 55.2 63.7 61.3 34.6 64.4 62.0 13,15659.1
2
60.92009 67.5 51.8 63.7 60.3 36.1 65.5 60.9 13,56658.0
61.42010 65.4 52.8 64.2 60.9 33.1 64.9 61.4 13,27058.5
84.6 63.4 65.4
55.0 63.1 63.9
86.4 61.5 63.5
64.42011 74.0 58.1 65.7 63.6 41.6 65.7 64.4 26,66061.6
1-2
63.52009 71.6 54.3 66.2 62.8 39.6 67.8 63.5 27,48061.2
62.52010 70.4 54.4 64.8 61.8 36.4 65.3 62.5 26,93759.8
55.6 48.0 49.4 48.62011 61.1 40.8 50.4 47.8 22.3 49.7 48.6 11,47143.6
5
2009 0
2010 0
72.7 58.9 60.6
55.0 63.1 63.9
86.4 61.5 63.5
59.72011 70.4 52.8 61.2 59.0 33.1 61.2 59.7 38,17656.6
1-5
63.52009 71.6 54.3 66.2 62.8 39.6 67.8 63.5 27,48061.2
62.52010 70.4 54.4 64.8 61.8 36.4 65.3 62.5 26,93759.8
22 19,563 18,589
20 14,064 13,415
22 13,818 13,119
38,1762011 1,643 26,9378,881 34,677 1,983 19,341 38,17627,603
27,4802009 1,238 19,0196,913 25,173 1,120 13,801 27,48019,505NumberTested
26,9372010 1,155 18,8266,583 24,845 1,084 14,026 26,93719,791
filler
July 29, 2011 Dallas ISD Evaluation & Accountability (Data Analysis, Research, and Reporting Services) V:\CILT\1112\CILT_1012.mdb rpt_ITBS_math_3_perGE40 2011-12 Campus Data Packet
DISTRICT SUMMARY 157

FemaleMigrant MaleAt RiskWhite AfricanAmer
Hispanic EconDisadv
SpecialEduc
LEP All DistrictYearGrade Number Tested(All Students)
ITBS: MATHEMATICS COMPUTATIONITBS Math (3)
PERCENTAGE AT OR ABOVE THE 40th PERCENTILE
14.3 32.7 36.1
25.0 40.8 48.6
37.0 34.6 40.1
34.42011 60.0 27.8 35.1 33.1 14.1 26.2 34.4 9,53024.0
8
44.62009 56.8 36.3 47.2 44.2 13.9 31.3 44.6 10,01233.5
37.32010 52.0 29.2 39.5 36.6 10.8 27.8 37.3 9,51926.9
7 4,797 4,722
12 5,087 4,925
54 4,803 4,714
9,5302011 420 6,3472,517 7,909 730 2,130 9,5305,510
10,0122009 426 6,4962,950 8,141 928 1,872 10,0126,502NumberTested
9,5192010 421 6,2792,656 7,829 844 1,790 9,5195,795
filler
July 29, 2011 Dallas ISD Evaluation & Accountability (Data Analysis, Research, and Reporting Services) V:\CILT\1112\CILT_1012.mdb rpt_ITBS_math_3_perGE40 2011-12 Campus Data Packet
DISTRICT SUMMARY 158

FemaleMigrant MaleAt RiskWhite AfricanAmer
Hispanic EconDisadv
SpecialEduc
LEP All DistrictYearGrade Number Tested(All Students)
ITBS: MATHEMATICS COMPUTATIONITBS Math (4)
NUMBER AT OR ABOVE THE 80th PERCENTILE
4 2,340 2,086
4 2,477 2,120
4 2,165 1,964
4,4272011 307 915 3,105 3,917 113 2,216 4,427 13,5042,865
1
4,5972009 249 892 3,402 4,103 93 2,577 4,597 13,9142,992
4,1292010 265 853 2,940 3,665 84 2,259 4,129 13,6672,674
4 1,892 1,917
4 1,859 1,963
5 1,859 1,917
3,8102011 225 737 2,756 3,419 72 2,111 3,810 13,1562,693
2
3,8222009 222 787 2,758 3,422 88 2,059 3,822 13,5662,643
3,7762010 185 769 2,764 3,421 70 2,106 3,776 13,2702,664
8 4,232 4,003
8 4,336 4,083
9 4,024 3,881
8,2372011 532 1,652 5,861 7,336 185 4,327 8,237 26,6605,558
1-2
8,4192009 471 1,679 6,160 7,525 181 4,636 8,419 27,4805,635
7,9052010 450 1,622 5,704 7,086 154 4,365 7,905 26,9375,338
0 729 686 1,4162011 97 253 1,023 1,202 40 659 1,416 11,471740
5
2009 0
2010 0
8 4,964 4,693
8 4,336 4,083
9 4,024 3,881
9,6602011 630 1,905 6,888 8,541 225 4,988 9,660 38,1766,300
1-5
8,4192009 471 1,679 6,160 7,525 181 4,636 8,419 27,4805,635
7,9052010 450 1,622 5,704 7,086 154 4,365 7,905 26,9375,338
22 19,563 18,589
20 14,064 13,415
22 13,818 13,119
38,1762011 1,643 26,9378,881 34,677 1,983 19,341 38,17627,603
27,4802009 1,238 19,0196,913 25,173 1,120 13,801 27,48019,505NumberTested
26,9372010 1,155 18,8266,583 24,845 1,084 14,026 26,93719,791
filler
July 29, 2011 Dallas ISD Evaluation & Accountability (Data Analysis, Research, and Reporting Services) V:\CILT\1112\CILT_1012.mdb rpt_ITBS_math_4_nGE80 2011-12 Campus Data Packet
DISTRICT SUMMARY 159

FemaleMigrant MaleAt RiskWhite AfricanAmer
Hispanic EconDisadv
SpecialEduc
LEP All DistrictYearGrade Number Tested(All Students)
ITBS: MATHEMATICS COMPUTATIONITBS Math (4)
NUMBER AT OR ABOVE THE 80th PERCENTILE
0 350 402
1 560 728
3 382 478
7552011 95 153 469 546 10 73 755 9,530174
8
1,2882009 105 274 860 987 16 128 1,288 10,012446
8602010 81 178 568 656 13 85 860 9,519276
7 4,797 4,722
12 5,087 4,925
54 4,803 4,714
9,5302011 420 6,3472,517 7,909 730 2,130 9,5305,510
10,0122009 426 6,4962,950 8,141 928 1,872 10,0126,502NumberTested
9,5192010 421 6,2792,656 7,829 844 1,790 9,5195,795
filler
July 29, 2011 Dallas ISD Evaluation & Accountability (Data Analysis, Research, and Reporting Services) V:\CILT\1112\CILT_1012.mdb rpt_ITBS_math_4_nGE80 2011-12 Campus Data Packet
DISTRICT SUMMARY 160

FemaleMigrant MaleAt RiskWhite AfricanAmer
Hispanic EconDisadv
SpecialEduc
LEP All DistrictYearGrade Number Tested(All Students)
Logramos: READING TOTALLOG Read (1)
PERCENTAGE AT OR ABOVE THE 40th PERCENTILE
* 88.1 93.8
100.0 85.6 91.7
100.0 86.9 91.7
90.92011 91.3 100.0 90.9 91.0 74.3 90.9 90.9 6,45691.4
K
88.62009 83.3 * 88.7 88.5 69.7 88.8 88.6 6,39689.0
89.32010 * * 89.3 89.2 68.3 89.2 89.3 6,31089.4
* 86.6 92.3
80.0 86.1 91.3
100.0 86.1 92.3
89.42011 66.7 * 89.4 89.5 63.2 89.4 89.4 6,35889.8
1
88.62009 * 88.6 88.6 53.0 88.7 88.6 6,60388.9
89.12010 83.3 83.3 89.1 89.1 57.7 89.2 89.1 6,60989.5
85.7 93.4 96.4
66.7 92.2 96.0
100.0 92.1 95.7
94.92011 71.4 * 94.9 94.9 68.3 94.9 94.9 6,26795.0
2
94.02009 * * 94.0 94.0 53.1 94.1 94.0 6,07794.3
93.82010 * * 93.8 93.8 59.6 93.8 93.8 6,12293.9
92.3 89.3 94.2
83.3 87.9 92.9
100.0 88.3 93.2
91.72011 81.0 93.3 91.7 91.8 68.1 91.7 91.7 19,08192.0
K-2
90.42009 76.9 90.4 90.3 57.2 90.4 90.4 19,07690.7
90.72010 90.0 80.0 90.7 90.6 61.0 90.7 90.7 19,04190.9
* 92.2 94.8 93.52011 * 93.5 93.7 62.3 93.6 93.5 2,04493.6
5
2009 0
2010 0
92.9 89.6 94.2
83.3 87.9 92.9
100.0 88.3 93.2
91.92011 81.8 93.3 91.9 92.0 67.5 91.9 91.9 21,14192.2
K-5
90.42009 76.9 90.4 90.3 57.2 90.4 90.4 19,07690.7
90.72010 90.0 80.0 90.7 90.6 61.0 90.7 90.7 19,04190.9
14 10,777 10,356
24 9,708 9,368
26 9,720 9,321
21,1412011 44 21,03615 20,609 557 20,552 21,14120,401
19,0762009 8 19,05213 18,533 481 18,527 19,07618,339NumberTested
19,0412010 10 19,01710 18,598 495 18,614 19,04118,333
filler
July 29, 2011 Dallas ISD Evaluation & Accountability (Data Analysis, Research, and Reporting Services) V:\CILT\1112\CILT_1012.mdb rpt_LOG_read_1_perGE40 2011-12 Campus Data Packet
DISTRICT SUMMARY 161

FemaleMigrant MaleAt RiskWhite AfricanAmer
Hispanic EconDisadv
SpecialEduc
LEP All DistrictYearGrade Number Tested(All Students)
Logramos: READING TOTALLOG Read (2)
NUMBER AT OR ABOVE THE 80th PERCENTILE
* 1,871 2,092
5 1,564 1,961
3 1,656 1,867
3,9642011 12 5 3,941 3,887 41 3,830 3,964 6,4563,814
K
3,5252009 4 * 3,516 3,408 33 3,411 3,525 6,3963,357
3,5232010 * * 3,521 3,436 33 3,418 3,523 6,3103,363
* 1,116 1,342
3 1,165 1,358
4 1,090 1,439
2,4592011 5 * 2,448 2,392 24 2,385 2,459 6,3582,379
1
2,5232009 * 2,521 2,436 16 2,451 2,523 6,6032,440
2,5292010 2 2 2,523 2,463 16 2,476 2,529 6,6092,464
5 1,438 1,789
2 1,318 1,591
6 1,428 1,612
3,2272011 2 * 3,219 3,153 25 3,154 3,227 6,2673,143
2
2,9092009 * * 2,904 2,820 14 2,802 2,909 6,0772,819
3,0402010 * * 3,038 2,960 22 2,981 3,040 6,1222,956
8 4,425 5,223
10 4,047 4,910
13 4,174 4,918
9,6502011 19 6 9,608 9,432 90 9,369 9,650 19,0819,336
K-2
8,9572009 6 7 8,941 8,664 63 8,664 8,957 19,0768,616
9,0922010 4 3 9,082 8,859 71 8,875 9,092 19,0418,783
* 385 470 8562011 * 852 818 4 827 856 2,044841
5
2009 0
2010 0
9 4,816 5,700
10 4,047 4,910
13 4,174 4,918
10,5192011 20 6 10,473 10,263 94 10,206 10,519 21,14110,187
K-5
8,9572009 6 7 8,941 8,664 63 8,664 8,957 19,0768,616
9,0922010 4 3 9,082 8,859 71 8,875 9,092 19,0418,783
14 10,777 10,356
24 9,708 9,368
26 9,720 9,321
21,1412011 44 21,03615 20,609 557 20,552 21,14120,401
19,0762009 8 19,05213 18,533 481 18,527 19,07618,339NumberTested
19,0412010 10 19,01710 18,598 495 18,614 19,04118,333
filler
July 29, 2011 Dallas ISD Evaluation & Accountability (Data Analysis, Research, and Reporting Services) V:\CILT\1112\CILT_1012.mdb rpt_LOG_read_2_nGE80 2011-12 Campus Data Packet
DISTRICT SUMMARY 162

PercentageImprovedin 2011
PercentageImprovedin 2011
PercentageImprovedin 2011
PercentageImprovedin 2011
Level 1 in 2010 Level 2 in 2010 Level 3 in 2010 Levels 1-3 in 2010
NumberTested
Both Years
NumberTested
Both Years
GradeNumberTested
Both Years
NumberTested
Both Years
Woodcock-Muñoz Language Survey
PERCENTAGE DEMONSTRATING IMPROVEMENT
WMLS
03 1 0.0 - 0 - 1 0.0
4284 200 43.0 51.2 2,139 22.3 2,767 28.2
2325 163 47.9 49.6 0 - 395 48.9
1916 163 38.0 50.3 0 - 354 44.6
2147 141 45.4 45.3 0 - 355 45.4
2068 140 35.0 43.2 0 - 346 39.9
3299 351 38.7 39.5 0 - 680 39.1
26010 121 46.3 31.2 0 - 381 36.0
15811 56 33.9 35.4 0 - 214 35.0
412 2 50.0 25.0 0 - 6 33.3
2,022ALL 1,338 41.2 43.7 2,139 22.3 5,499 34.8
July 29, 2011 Dallas ISD Evaluation & Accountab ility (Data Analysis, Research, and Reporting Servi ces) V:\CILT\1112\CILT_1012.mdb rpt_W MLS 2011-12 Campus Data Packet
DISTRICT SUMMARY 163
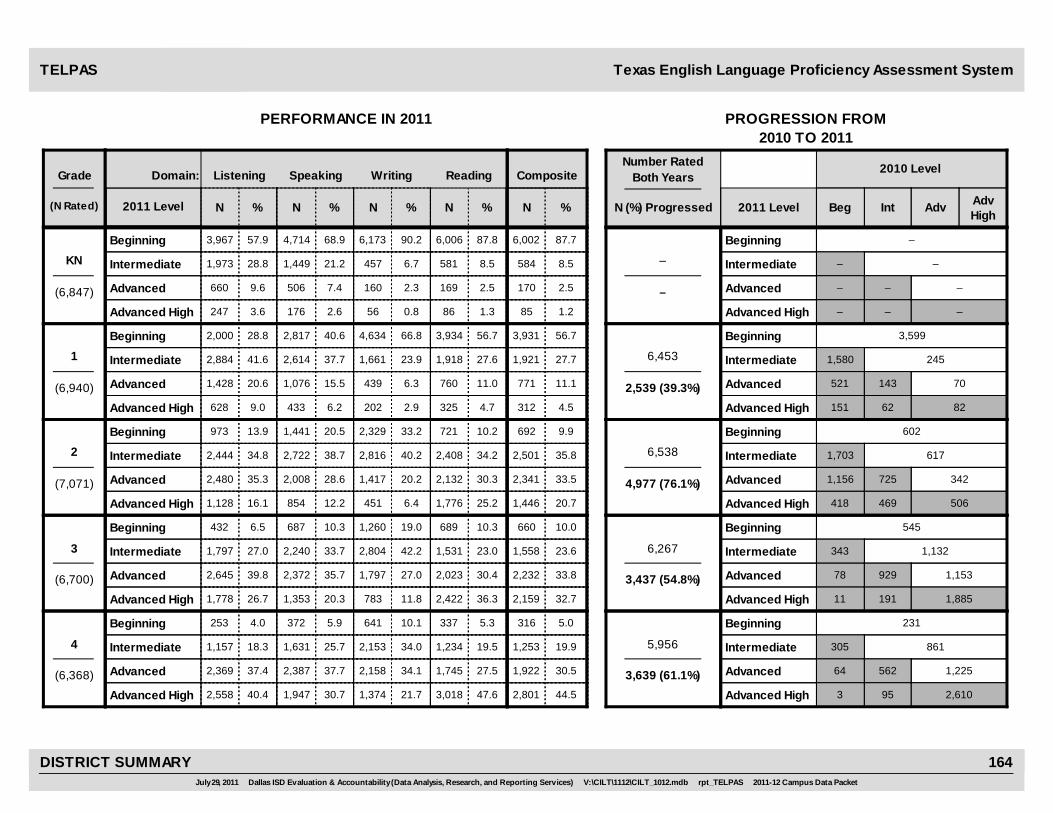
N (%) Progressed
Number RatedBoth Years
2010 Level
PERFORMANCE IN 2011 PROGRESSION FROM2010 TO 2011
Listening Speaking Writing
% % % %
Grade
N N N N(N Rated) 2011 Level N %
CompositeReading
2011 Level
Domain:
IntBeg Adv AdvHigh
Texas English Language Proficiency Assessment Syste mTELPAS
68.9
KN
3,967 57.9 4,714 6,173 90.2 6,006
(6,847)
Beginning
Intermediate
Advanced
Advanced High
87.8 87.76,002
21.21,973 28.8 1,449 457 6.7 581 8.5 8.5584
7.4660 9.6 506 160 2.3 169 2.5 2.5170
2.6247 3.6 176 56 0.8 86 1.3 1.285
–
–
Beginning
Intermediate
Advanced
Advanced High
–
––
–
–
–
–
–
–
40.6
1
2,000 28.8 2,817 4,634 66.8 3,934
(6,940)
Beginning
Intermediate
Advanced
Advanced High
56.7 56.73,931
37.72,884 41.6 2,614 1,661 23.9 1,918 27.6 27.71,921
15.51,428 20.6 1,076 439 6.3 760 11.0 11.1771
6.2628 9.0 433 202 2.9 325 4.7 4.5312
6,453
2,539 (39.3%)
Beginning
Intermediate
Advanced
Advanced High
3,599
2451,580
521
151
143
62
70
82
20.5
2
973 13.9 1,441 2,329 33.2 721
(7,071)
Beginning
Intermediate
Advanced
Advanced High
10.2 9.9692
38.72,444 34.8 2,722 2,816 40.2 2,408 34.2 35.82,501
28.62,480 35.3 2,008 1,417 20.2 2,132 30.3 33.52,341
12.21,128 16.1 854 451 6.4 1,776 25.2 20.71,446
6,538
4,977 (76.1%)
Beginning
Intermediate
Advanced
Advanced High
602
6171,703
1,156
418
725
469
342
506
10.3
3
432 6.5 687 1,260 19.0 689
(6,700)
Beginning
Intermediate
Advanced
Advanced High
10.3 10.0660
33.71,797 27.0 2,240 2,804 42.2 1,531 23.0 23.61,558
35.72,645 39.8 2,372 1,797 27.0 2,023 30.4 33.82,232
20.31,778 26.7 1,353 783 11.8 2,422 36.3 32.72,159
6,267
3,437 (54.8%)
Beginning
Intermediate
Advanced
Advanced High
545
1,132343
78
11
929
191
1,153
1,885
5.9
4
253 4.0 372 641 10.1 337
(6,368)
Beginning
Intermediate
Advanced
Advanced High
5.3 5.0316
25.71,157 18.3 1,631 2,153 34.0 1,234 19.5 19.91,253
37.72,369 37.4 2,387 2,158 34.1 1,745 27.5 30.51,922
30.72,558 40.4 1,947 1,374 21.7 3,018 47.6 44.52,801
5,956
3,639 (61.1%)
Beginning
Intermediate
Advanced
Advanced High
231
861305
64
3
562
95
1,225
2,610
July 29, 2011 Dallas ISD Evaluation & Accountab ility (Data Analysis, Research, and Reporting Servi ces) V:\CILT\1112\CILT_1012.mdb rpt_TELPAS 2011-12 Campus Data Packet
DISTRICT SUMMARY 164

N (%) Progressed
Number RatedBoth Years
2010 Level
PERFORMANCE IN 2011 PROGRESSION FROM2010 TO 2011
Listening Speaking Writing
% % % %
Grade
N N N N(N Rated) 2011 Level N %
CompositeReading
2011 Level
Domain:
IntBeg Adv AdvHigh
Texas English Language Proficiency Assessment Syste mTELPAS
4.1
5
169 2.9 239 358 6.1 192
(5,882)
Beginning
Intermediate
Advanced
Advanced High
3.3 2.9166
17.4797 13.6 1,014 1,475 25.3 530 9.0 9.3541
37.61,971 33.8 2,196 2,196 37.7 1,152 19.7 23.41,360
40.92,903 49.7 2,390 1,802 30.9 3,983 68.0 64.43,738
5,444
4,323 (79.4%)
Beginning
Intermediate
Advanced
Advanced High
103
349138
42
7
580
283
669
3,273
4.0
6
99 3.1 126 200 6.4 107
(3,229)
Beginning
Intermediate
Advanced
Advanced High
3.4 3.092
18.4556 17.7 579 888 28.3 358 11.2 11.6361
42.91,290 41.0 1,349 1,293 41.2 926 29.0 32.61,013
34.81,203 38.2 1,094 761 24.2 1,802 56.4 52.81,642
2,833
1,786 (63.0%)
Beginning
Intermediate
Advanced
Advanced High
63
22867
15
1
165
32
756
1,506
4.6
7
115 4.1 129 192 6.9 113
(2,847)
Beginning
Intermediate
Advanced
Advanced High
4.0 3.597
18.0456 16.3 503 756 27.1 282 10.0 10.4286
42.61,123 40.2 1,190 1,100 39.5 757 27.0 30.5835
34.81,099 39.3 971 740 26.5 1,655 59.0 55.61,523
2,391
1,606 (67.2%)
Beginning
Intermediate
Advanced
Advanced High
62
17054
23
2
163
34
553
1,330
4.0
8
79 3.4 94 120 5.1 124
(2,392)
Beginning
Intermediate
Advanced
Advanced High
5.3 4.6106
18.5435 18.5 435 648 27.6 271 11.6 12.2280
37.7845 35.9 888 923 39.3 667 28.6 30.6699
39.9997 42.3 939 655 27.9 1,267 54.4 52.51,201
1,955
1,225 (62.7%)
Beginning
Intermediate
Advanced
Advanced High
71
19144
16
2
144
15
468
1,004
15.4
9
257 11.8 334 372 17.4 290
(2,255)
Beginning
Intermediate
Advanced
Advanced High
13.3 11.0228
23.4505 23.3 508 614 28.7 333 15.3 17.7366
30.3674 31.0 657 652 30.5 536 24.6 28.6592
31.0735 33.9 672 498 23.3 1,017 46.7 42.7883
1,454
903 (62.1%)
Beginning
Intermediate
Advanced
Advanced High
102
13873
24
5
114
21
311
666
July 29, 2011 Dallas ISD Evaluation & Accountab ility (Data Analysis, Research, and Reporting Servi ces) V:\CILT\1112\CILT_1012.mdb rpt_TELPAS 2011-12 Campus Data Packet
DISTRICT SUMMARY 165
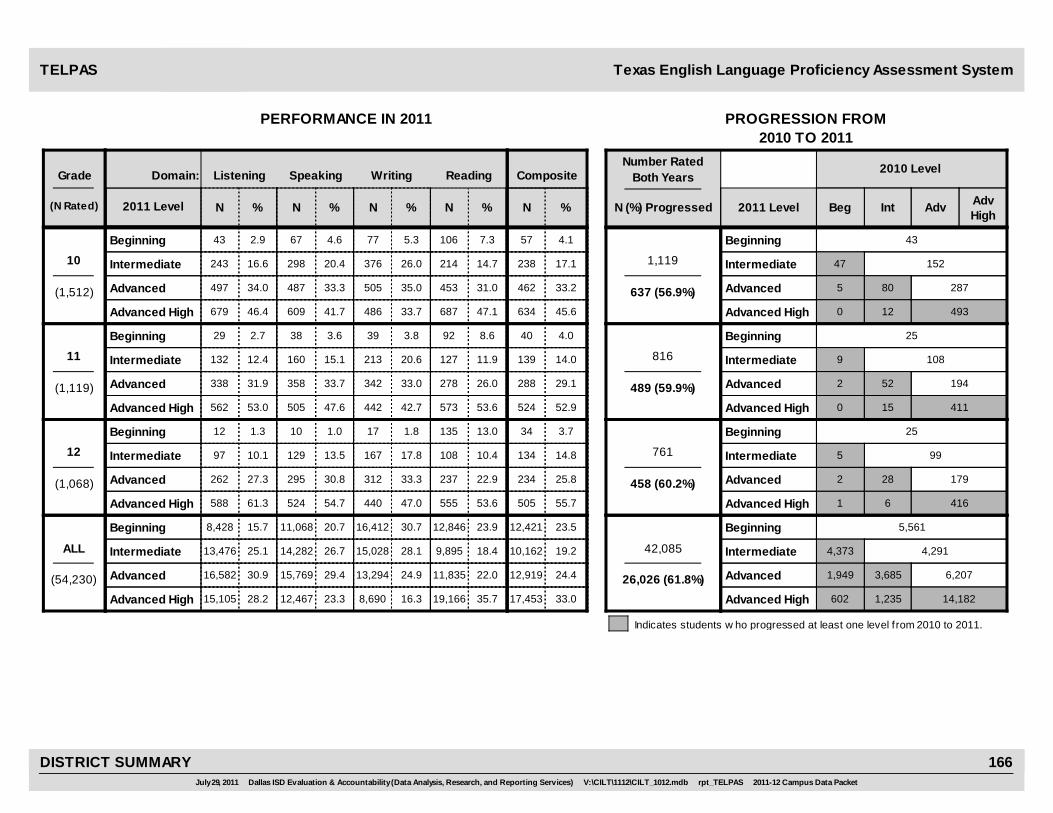
N (%) Progressed
Number RatedBoth Years
2010 Level
PERFORMANCE IN 2011 PROGRESSION FROM2010 TO 2011
Listening Speaking Writing
% % % %
Grade
N N N N(N Rated) 2011 Level N %
CompositeReading
2011 Level
Domain:
IntBeg Adv AdvHigh
Texas English Language Proficiency Assessment Syste mTELPAS
4.6
10
43 2.9 67 77 5.3 106
(1,512)
Beginning
Intermediate
Advanced
Advanced High
7.3 4.157
20.4243 16.6 298 376 26.0 214 14.7 17.1238
33.3497 34.0 487 505 35.0 453 31.0 33.2462
41.7679 46.4 609 486 33.7 687 47.1 45.6634
1,119
637 (56.9%)
Beginning
Intermediate
Advanced
Advanced High
43
15247
5
0
80
12
287
493
3.6
11
29 2.7 38 39 3.8 92
(1,119)
Beginning
Intermediate
Advanced
Advanced High
8.6 4.040
15.1132 12.4 160 213 20.6 127 11.9 14.0139
33.7338 31.9 358 342 33.0 278 26.0 29.1288
47.6562 53.0 505 442 42.7 573 53.6 52.9524
816
489 (59.9%)
Beginning
Intermediate
Advanced
Advanced High
25
1089
2
0
52
15
194
411
1.0
12
12 1.3 10 17 1.8 135
(1,068)
Beginning
Intermediate
Advanced
Advanced High
13.0 3.734
13.597 10.1 129 167 17.8 108 10.4 14.8134
30.8262 27.3 295 312 33.3 237 22.9 25.8234
54.7588 61.3 524 440 47.0 555 53.6 55.7505
761
458 (60.2%)
Beginning
Intermediate
Advanced
Advanced High
25
995
2
1
28
6
179
416
20.7
ALL
8,428 15.7 11,068 16,412 30.7 12,846
(54,230)
Beginning
Intermediate
Advanced
Advanced High
23.9 23.512,421
26.713,476 25.1 14,282 15,028 28.1 9,895 18.4 19.210,162
29.416,582 30.9 15,769 13,294 24.9 11,835 22.0 24.412,919
23.315,105 28.2 12,467 8,690 16.3 19,166 35.7 33.017,453
42,085
26,026 (61.8%)
Beginning
Intermediate
Advanced
Advanced High
5,561
4,2914,373
1,949
602
3,685
1,235
6,207
14,182
Indicates students w ho progressed at least one level f rom 2010 to 2011.
July 29, 2011 Dallas ISD Evaluation & Accountab ility (Data Analysis, Research, and Reporting Servi ces) V:\CILT\1112\CILT_1012.mdb rpt_TELPAS 2011-12 Campus Data Packet
DISTRICT SUMMARY 166

SAT/ACT Mean Standard Scores for Grade 12 SAT/ACT
All Students Hispanic White Other DistrictAfrican American
Subtest YearPercentTestedMeanN N Mean MeanNN MeanMeanN N MeanTest
PercentTested
English 2,14619.04324.314814.71,12814.282715.22,146 28.0 15.2
1,75418.43324.514815.275214.682115.81,754 23.4 15.8
2,84318.97723.717214.71,53214.61,04915.32,843 35.5 15.3
2008-09
2009-10
2010-11
28.0
23.4
35.5
Mathematics 2,14623.24323.914818.21,12816.882718.12,146 28.0 18.1
1,75421.13323.814818.175216.682118.01,754 23.4 18.0
2,84322.07723.817218.31,53217.21,04918.42,843 35.5 18.4
2008-09
2009-10
2010-11
28.0
23.4
35.5
ACT Reading 2,14620.74324.514816.31,12815.582716.72,146 28.0 16.7
1,75420.03324.714816.675215.482116.81,754 23.4 16.8
2,84320.27724.217216.31,53216.11,04916.82,843 35.5 16.8
2008-09
2009-10
2010-11
28.0
23.4
35.5
Science 2,14621.04323.714817.71,12816.982717.92,146 28.0 17.9
1,75419.93323.414817.575216.282117.41,754 23.4 17.4
2,84320.67723.217217.41,53216.71,04917.62,843 35.5 17.6
2008-09
2009-10
2010-11
28.0
23.4
35.5
Composite 2,14621.14324.214816.81,12816.082717.12,146 28.0 17.1
1,75419.93324.214817.075215.982117.11,754 23.4 17.1
2,84320.57723.817216.81,53216.21,04917.12,843 35.5 17.1
2008-09
2009-10
2010-11
28.0
23.4
35.5
4,2254451275343134122,3833961,3804174,225 52.8 417
3,916455835443094112,1563961,3684173,916 51.1 417
3,660463695533334171,8333941,4254213,660 48.7 421
Critical Reading
2008-09
2009-10
2010-11 52.8
51.1
48.7
SAT
4,2255031275423134472,3834171,3804464,225 52.8 446
3,916519835493094432,1564081,3684413,916 51.1 441
3,660503695533334441,8334101,4254423,660 48.7 442
Mathematics
2008-09
2009-10
2010-11 52.8
51.1
48.7
4,2254531275203134052,3833901,3804104,225 52.8 410
3,916437835273094062,1563921,3684113,916 51.1 411
3,660448695343334121,8333941,4254173,660 48.7 417
Writing
2008-09
2009-10
2010-11 52.8
51.1
48.7
July 29, 2011 Dallas ISD Evaluation & Accountability (Data Analysis, Research, and Reporting Services) V:\CILT\1112\CILT_1012.mdb rpt_SAT 2011-12 Campus Data Packet
DISTRICT SUMMARY 167

PSAT Mean Standard ScoresPSAT
All White OtherAfrican American Hispanic District
Mean MeanNN MeanMeanN N MeanMean NNGrade Subtest Year
Critical Reading
36.45530.4750 31.61629.8391 30.51,2121,212 30.5
37.15229.0720 33.6928.8536 29.21,3171,317 29.2
33.71,261 44.928134.63,024 42.494 35.14,6604,660 35.1
2008
2009
2010
Mathematics 38.85533.4750 31.81632.3391 33.31,2121,212 33.3
37.65232.1720 33.2930.9536 31.81,3171,317 31.8
9
36.11,261 45.228138.13,024 46.094 38.14,6604,660 38.1
2008
2009
2010
Writing 35.65530.9750 30.71629.6391 30.71,2121,212 30.7
36.15230.1720 31.7928.4536 29.71,3171,317 29.7
31.31,261 43.528133.43,024 39.994 33.64,6604,660 33.6
2008
2009
2010
Critical Reading
38.512333.32,488 32.14732.21,256 33.13,9143,914 33.1
37.712033.02,132 37.05731.11,366 32.53,6753,675 32.5
33.92,577 45.547535.75,891 39.2173 35.89,1169,116 35.8
2008
2009
2010
Mathematics 40.312336.92,488 34.94734.81,256 36.33,9143,914 36.3
39.512036.52,132 43.25734.01,366 35.83,6753,675 35.8
10
36.32,577 46.647539.55,891 44.2173 39.19,1169,116 39.1
2008
2009
2010
Writing 38.012333.22,488 30.44732.11,256 33.03,9143,914 33.0
37.712034.32,132 36.95732.31,366 33.73,6753,675 33.7
31.62,577 43.747533.85,891 37.7173 33.89,1169,116 33.8
2008
2009
2010
Critical Reading 47.643536.24,842 39.412634.82,364 36.57,7677,767 36.5
47.945435.64,414 41.411734.62,381 36.17,3667,366 36.1
35.62,289 48.346137.54,986 39.8133 37.67,8697,869 37.6
2008
2009
2010
Mathematics 49.743540.44,842 46.512637.82,364 40.27,7677,767 40.2
49.945439.24,414 46.811736.42,381 39.17,3667,366 39.1
11
38.82,289 50.046141.44,986 45.3133 41.27,8697,869 41.2
2008
2009
2010
Writing 47.743536.94,842 40.512635.72,364 37.27,7677,767 37.2
48.045437.14,414 41.411735.52,381 37.47,3667,366 37.4
35.22,289 47.046136.14,986 38.7133 36.57,8697,869 36.5
2008
2009
2010
July 29, 2011 Dallas ISD Evaluation & Accountability (Data Analysis, Research, and Reporting Services) V:\CILT\1112\CILT_1012.mdb rpt_PSAT 2011-12 Campus Data Packet
DISTRICT SUMMARY 168

2011 Advanced Placement ExamsAP
Dist School
Mean Score
DistSchool
% Passed
SchoolDistSchool
Exams Taken # Passed
Dist School
Mean Score
DistSchool
% Passed
SchoolDistSchool
Exams Taken # Passed
Dist School
Mean Score
DistSchool
% Passed
SchoolDistSchool
Exams Taken # Passed
750 12.1750 1.4 12.11.4
Biology
91 957 33.3957 2.1 33.32.1
Calculus AB
319 209 50.2209 2.7 50.22.7
Calculus BC
105
329 19.8329 1.7 19.81.7
Chemistry
65 161 53.4161 2.6 53.42.6
Computer Science A
86 475 16.8475 1.5 16.81.5
Economics: Macroeconomics
80
339 5.6339 1.2 5.61.2
Economics: Microeconomics
19 2,593 18.12,593 1.8 18.11.8
English Language & Composition
469 2,195 17.22,195 1.8 17.21.8
English Literature & Composition
378
759 21.6759 1.8 21.61.8
Environmental Science
164 138 29.7138 1.8 29.71.8
European History
41 28 25.028 1.9 25.01.9
French Language
7
1 *1 * **
German Language
* 1 *1 * **
Government & Politics: Comparative
* 916 11.2916 1.4 11.21.4
Government & Politics: United States
103
126 40.5126 2.2 40.52.2
History of Art
51 457 39.8457 2.3 39.82.3
Human Geography
182 1 *1 * **
Japanese Language & Culture
*
13 0.013 1.0 0.01.0
Latin: Virgil
0 57 57.957 2.9 57.92.9
Music Theory
33 189 36.0189 2.2 36.02.2
Physics B
68
68 60.368 3.0 60.33.0
Physics C: Electricity & Magnetism
41 250 32.0250 2.0 32.02.0
Physics C: Mechanics
80 360 25.6360 1.8 25.61.8
Psychology
92
1,035 63.51,035 3.0 63.53.0
Spanish Language
657 276 31.5276 1.9 31.51.9
Spanish Literature
87 413 31.7413 2.0 31.72.0
Statistics
131
50 78.050 3.6 78.03.6
Studio Art: 2-D Design
39 30 90.030 3.8 90.03.8
Studio Art: 3-D Design
27 34 61.834 3.0 61.83.0
Studio Art: Drawing
21
1,851 8.41,851 1.4 8.41.4
United States History
155 830 18.6830 1.7 18.61.7
World History
154
July 29, 2011 Dallas ISD Evaluation & Accountability (Data Analysis, Research, and Reporting Services) V:\CILT\1112\CILT_1012.mdb rpt_AP 2011-12 Campus Data Packet
DISTRICT SUMMARY 169

Course% Items Correct
CourseMark
ACP ACP
Averages % Passing District % Passing
Course Mark(no ACP)
ScaleScore
NumberTested
Course
Assessment of Course Performance
SEMESTER 1
ACP
Course% Items Correct
CourseMark
ACP ACP
Averages % Passing District % Passing
Course Mark(no ACP)
ScaleScore
NumberTested
Course
SEMESTER 2
ALGEBRA I ALGEBRA I
77.26,737 48.8 69.3 76.1 48.6 80.9 48.6 80.9 76.96,408 57.3 73.3 76.4 64.3 81.2 64.3 81.2
ALGEBRA I PRE-AP ALGEBRA I PRE-AP
83.12,764 65.3 79.2 82.7 80.3 95.9 80.3 95.9 83.72,654 71.0 80.7 83.4 85.0 96.2 85.0 96.2
ALGEBRA II ALGEBRA II
77.24,522 53.7 71.0 76.3 58.3 84.4 58.3 84.4 78.52,629 52.6 71.6 77.5 60.2 84.7 60.2 84.7
ALGEBRA II PRE-AP ALGEBRA II PRE-AP
80.32,558 57.8 76.1 79.7 75.4 91.4 75.4 91.4 81.42,408 63.8 75.9 80.6 70.2 91.9 70.2 91.9
BIOLOGY BIOLOGY
76.45,893 47.0 71.1 75.6 58.0 82.9 58.0 82.9 76.55,453 54.1 72.4 75.9 63.4 82.5 63.4 82.5
BIOLOGY PRE-AP BIOLOGY PRE-AP
80.12,826 47.2 71.2 78.8 55.6 89.2 55.6 89.2 81.22,782 57.3 72.7 80.0 65.0 89.9 65.0 89.9
CHEMISTRY CHEMISTRY
76.35,348 43.4 70.2 75.4 54.9 81.8 54.9 81.8 77.24,777 38.3 71.1 76.3 60.5 84.6 60.5 84.6
CHEMISTRY PRE-AP CHEMISTRY PRE-AP
80.32,807 46.2 72.2 79.1 59.9 90.1 59.9 90.1 80.42,672 45.4 70.7 79.0 50.7 88.4 50.7 88.4
COMPUTER APPLICATIONS COMPUTER APPLICATIONS
84.84,569 64.1 76.1 83.9 71.0 94.6 71.0 94.6 83.94,321 63.8 75.9 83.1 70.6 94.1 70.6 94.1
COMPUTER SCIENCE I (VB) COMPUTER SCIENCE I (VB)
86.0313 55.8 71.2 83.7 57.2 97.1 57.2 97.1 78.6264 42.3 67.3 76.9 40.2 80.3 40.2 80.3
July 29, 2011 Dallas ISD Evaluation & Accountability (Data Analysis, Research, and Reporting Services) V:\CILT\1112\CILT_1012.mdb rpt_ACP 2011-12 Campus Data Packet
DISTRICT SUMMARY 170

Course% Items Correct
CourseMark
ACP ACP
Averages % Passing District % Passing
Course Mark(no ACP)
ScaleScore
NumberTested
Course
Assessment of Course Performance
SEMESTER 1
ACP
Course% Items Correct
CourseMark
ACP ACP
Averages % Passing District % Passing
Course Mark(no ACP)
ScaleScore
NumberTested
Course
SEMESTER 2
COMPUTER SCIENCE I PRE-AP (JAVA) COMPUTER SCIENCE I PRE-AP (JAVA)
82.8300 63.3 75.5 81.7 64.3 92.7 64.3 92.7 81.7271 67.4 78.2 81.2 71.6 90.0 71.6 90.0
ECONOMICS ECONOMICS
81.62,326 60.9 73.9 80.5 67.8 95.6 67.8 95.6 79.564 53.1 70.7 78.2 56.3 93.8 56.3 93.8
ENGLISH FOR ELI ENGLISH FOR ELI
81.4217 61.3 77.2 80.8 70.5 90.3 70.5 90.3 79.3251 59.5 73.0 78.4 55.4 80.1 55.4 80.1
ENGLISH I ENGLISH I
78.55,339 65.3 76.9 78.3 75.8 86.8 75.8 86.8 79.05,047 70.5 80.4 79.2 83.5 87.0 83.5 87.0
ENGLISH I FOR ESL INT./ADV. ENGLISH I FOR ESL INT./ADV.
79.8416 61.5 74.4 79.0 64.2 87.7 64.2 87.7 80.3389 60.1 74.5 79.4 66.1 86.6 66.1 86.6
ENGLISH I PRE-AP ENGLISH I PRE-AP
80.93,546 60.4 75.3 80.0 77.3 89.9 77.3 89.9 82.13,420 59.6 75.3 81.1 75.8 92.7 75.8 92.7
ENGLISH II ENGLISH II
76.85,014 63.7 75.8 76.6 75.4 83.4 75.4 83.4 78.04,687 64.3 76.2 77.7 74.6 83.9 74.6 83.9
ENGLISH II FOR ESL ADVANCED ENGLISH II FOR ESL ADVANCED
81.1273 55.2 74.1 80.1 64.5 87.9 64.5 87.9 81.9256 53.6 73.7 80.6 64.1 89.5 64.1 89.5
ENGLISH II PRE-AP ENGLISH II PRE-AP
79.13,547 54.2 75.5 78.5 80.3 87.1 80.3 87.1 81.73,461 53.2 74.9 80.7 71.1 90.1 71.1 90.1
ENGLISH III ENGLISH III
78.04,894 64.5 76.3 77.7 74.7 87.5 74.7 87.5 78.64,301 64.4 76.3 78.2 74.4 87.2 74.4 87.2
July 29, 2011 Dallas ISD Evaluation & Accountability (Data Analysis, Research, and Reporting Services) V:\CILT\1112\CILT_1012.mdb rpt_ACP 2011-12 Campus Data Packet
DISTRICT SUMMARY 171

Course% Items Correct
CourseMark
ACP ACP
Averages % Passing District % Passing
Course Mark(no ACP)
ScaleScore
NumberTested
Course
Assessment of Course Performance
SEMESTER 1
ACP
Course% Items Correct
CourseMark
ACP ACP
Averages % Passing District % Passing
Course Mark(no ACP)
ScaleScore
NumberTested
Course
SEMESTER 2
ENGLISH IV ENGLISH IV
80.04,565 67.8 78.5 79.8 79.6 92.7 79.6 92.7 75.227 63.5 75.7 75.3 70.4 77.8 70.4 77.8
ENVIRONMENTAL SYSTEMS ENVIRONMENTAL SYSTEMS
81.11,976 62.0 74.6 80.1 72.1 93.6 72.1 93.6 82.6410 55.0 72.5 81.1 65.9 94.6 65.9 94.6
FRENCH I FRENCH I
78.71,456 55.2 75.6 78.3 65.5 85.5 65.5 85.5 76.61,321 47.3 73.6 76.2 60.3 80.3 60.3 80.3
FRENCH II FRENCH II
79.41,167 51.9 75.1 78.7 67.3 88.6 67.3 88.6 80.1992 51.4 74.0 79.2 60.5 86.4 60.5 86.4
GEOMETRY GEOMETRY
75.96,264 57.0 72.5 75.4 61.8 83.0 61.8 83.0 76.25,678 54.1 70.7 75.3 54.2 81.1 54.2 81.1
GEOMETRY PRE-AP GEOMETRY PRE-AP
81.03,188 51.4 72.5 79.8 62.2 89.6 62.2 89.6 81.03,150 54.8 74.4 80.0 68.8 89.3 68.8 89.3
GOVERNMENT GOVERNMENT
82.02,138 54.5 73.7 80.7 64.7 95.6 64.7 95.6 81.465 49.8 72.6 80.1 64.6 93.8 64.6 93.8
HEALTH EDUCATION HEALTH EDUCATION
85.51,421 61.3 75.8 84.6 77.3 96.0 77.3 96.0 85.71,512 66.4 77.6 84.9 79.2 92.7 79.2 92.7
HEALTH I HEALTH I
85.53,821 60.9 73.9 83.7 68.9 96.0 68.9 96.0 84.53,231 61.1 75.7 83.1 73.8 94.6 73.8 94.6
INTEGRATED PHYSICS & CHEMISTRY INTEGRATED PHYSICS & CHEMISTRY
77.23,813 51.2 68.9 75.9 47.2 84.6 47.2 84.6 77.33,438 53.9 72.9 76.7 63.0 85.0 63.0 85.0
July 29, 2011 Dallas ISD Evaluation & Accountability (Data Analysis, Research, and Reporting Services) V:\CILT\1112\CILT_1012.mdb rpt_ACP 2011-12 Campus Data Packet
DISTRICT SUMMARY 172

Course% Items Correct
CourseMark
ACP ACP
Averages % Passing District % Passing
Course Mark(no ACP)
ScaleScore
NumberTested
Course
Assessment of Course Performance
SEMESTER 1
ACP
Course% Items Correct
CourseMark
ACP ACP
Averages % Passing District % Passing
Course Mark(no ACP)
ScaleScore
NumberTested
Course
SEMESTER 2
LANGUAGE ARTS 7 LANGUAGE ARTS 7
79.06,753 54.5 72.7 78.4 63.5 88.7 63.5 88.7 79.56,546 65.7 77.1 79.2 78.9 89.4 78.9 89.4
LANGUAGE ARTS 7 PRE-AP LANGUAGE ARTS 7 PRE-AP
84.72,566 70.6 80.4 84.3 91.1 96.9 91.1 96.9 84.52,546 68.8 79.2 84.0 88.1 96.1 88.1 96.1
LANGUAGE ARTS 8 LANGUAGE ARTS 8
77.76,145 60.8 73.9 77.3 72.2 86.0 72.2 86.0 78.55,959 57.7 75.1 78.2 75.3 86.9 75.3 86.9
LANGUAGE ARTS 8 PRE-AP LANGUAGE ARTS 8 PRE-AP
83.72,755 56.0 74.1 82.7 75.7 95.1 75.7 95.1 83.92,708 58.9 74.9 83.0 75.6 95.0 75.6 95.0
MATHEMATICAL MODELS W/APPLICATIONS MATHEMATICAL MODELS W/APPLICATIONS
77.03,586 54.4 70.9 76.0 58.2 86.2 58.2 86.2 77.13,189 46.5 71.4 76.2 53.6 85.5 53.6 85.5
MATHEMATICS 7 MATHEMATICS 7
78.06,621 52.7 70.4 77.2 54.0 85.1 54.0 85.1 77.96,512 55.0 71.9 77.3 61.9 86.0 61.9 86.0
MATHEMATICS 7 PRE-AP MATHEMATICS 7 PRE-AP
85.02,865 67.6 78.4 84.3 81.4 97.1 81.4 97.1 84.62,779 60.6 76.3 83.8 76.5 96.8 76.5 96.8
MATHEMATICS 8 MATHEMATICS 8
76.36,562 50.5 71.5 75.8 56.7 83.2 56.7 83.2 77.46,417 57.2 71.5 76.8 57.2 85.0 57.2 85.0
MS ADV READING-WRITING FOR ESL MS ADV READING-WRITING FOR ESL
80.2182 56.9 71.9 79.4 59.9 89.0 59.9 89.0 81.1182 55.0 73.0 80.3 60.4 87.9 60.4 87.9
MS ADVANCED LA FOR ESL MS ADVANCED LA FOR ESL
79.9173 57.6 71.7 79.1 57.8 86.7 57.8 86.7 81.3176 63.5 75.7 80.8 68.8 88.1 68.8 88.1
July 29, 2011 Dallas ISD Evaluation & Accountability (Data Analysis, Research, and Reporting Services) V:\CILT\1112\CILT_1012.mdb rpt_ACP 2011-12 Campus Data Packet
DISTRICT SUMMARY 173

Course% Items Correct
CourseMark
ACP ACP
Averages % Passing District % Passing
Course Mark(no ACP)
ScaleScore
NumberTested
Course
Assessment of Course Performance
SEMESTER 1
ACP
Course% Items Correct
CourseMark
ACP ACP
Averages % Passing District % Passing
Course Mark(no ACP)
ScaleScore
NumberTested
Course
SEMESTER 2
MS BEGINNING LA FOR ESL MS BEGINNING LA FOR ESL
86.0133 59.3 76.0 85.0 63.9 97.7 63.9 97.7 85.2161 60.1 74.5 84.1 58.4 97.5 58.4 97.5
MS INTERMEDIATE LA FOR ESL MS INTERMEDIATE LA FOR ESL
83.4186 52.1 73.4 82.4 60.8 97.3 60.8 97.3 83.3188 60.9 73.9 82.3 62.2 98.4 62.2 98.4
MS INTERMEDIATE READING FOR ESL MS INTERMEDIATE READING FOR ESL
82.5192 54.4 72.1 81.5 55.7 96.9 55.7 96.9 82.9186 62.9 75.3 82.1 63.4 97.3 63.4 97.3
MULTIMEDIA MULTIMEDIA
85.4923 57.3 76.3 84.0 74.0 95.4 74.0 95.4 84.1583 57.5 74.5 82.7 65.9 89.2 65.9 89.2
PHYSICS PHYSICS
77.55,202 43.3 70.2 76.4 49.2 85.2 49.2 85.2 79.02,461 42.9 71.0 77.8 56.6 88.4 56.6 88.4
PHYSICS PRE-AP PHYSICS PRE-AP
80.92,368 44.1 71.6 79.5 57.1 92.1 57.1 92.1 82.32,026 50.4 73.4 81.0 68.1 93.0 68.1 93.0
PRE-CALCULUS PRE-CALCULUS
76.23,021 47.7 71.5 75.5 61.1 85.5 61.1 85.5 78.8503 41.0 69.5 77.4 46.5 85.7 46.5 85.7
PRE-CALCULUS PRE-AP PRE-CALCULUS PRE-AP
80.61,836 53.2 68.8 78.8 47.2 90.6 47.2 90.6 82.21,348 49.8 72.1 80.7 59.7 90.8 59.7 90.8
READING 7 READING 7
82.43,886 67.9 78.6 82.0 80.4 94.2 80.4 94.2 83.23,884 68.0 78.7 82.7 79.6 95.1 79.6 95.1
READING 8 READING 8
82.23,359 62.8 75.7 81.5 77.2 93.9 77.2 93.9 83.23,387 73.4 82.2 83.2 90.3 94.9 90.3 94.9
July 29, 2011 Dallas ISD Evaluation & Accountability (Data Analysis, Research, and Reporting Services) V:\CILT\1112\CILT_1012.mdb rpt_ACP 2011-12 Campus Data Packet
DISTRICT SUMMARY 174

Course% Items Correct
CourseMark
ACP ACP
Averages % Passing District % Passing
Course Mark(no ACP)
ScaleScore
NumberTested
Course
Assessment of Course Performance
SEMESTER 1
ACP
Course% Items Correct
CourseMark
ACP ACP
Averages % Passing District % Passing
Course Mark(no ACP)
ScaleScore
NumberTested
Course
SEMESTER 2
READING I READING I
81.12,455 66.7 77.8 80.6 78.8 91.3 78.8 91.3 80.62,248 65.9 77.3 80.1 75.1 89.8 75.1 89.8
READING II FOR ESL INT./ADV. READING II FOR ESL INT./ADV.
80.8351 53.6 73.2 79.6 62.1 88.6 62.1 88.6 80.3325 62.6 76.1 79.7 69.8 85.2 69.8 85.2
READING III FOR ESL ADVANCED READING III FOR ESL ADVANCED
82.2248 55.6 73.4 80.9 62.5 91.5 62.5 91.5 82.8220 54.8 76.2 81.8 70.9 95.5 70.9 95.5
READING MASTERY 7 READING MASTERY 7
79.33,498 59.7 74.3 78.8 69.0 89.6 69.0 89.6 79.33,404 62.7 75.7 78.9 71.4 90.7 71.4 90.7
READING MASTERY 8 READING MASTERY 8
77.83,549 59.9 74.9 77.5 72.3 87.1 72.3 87.1 78.83,344 67.1 78.0 78.7 80.4 89.3 80.4 89.3
SCIENCE 7 & SCIENCE 7 PRE-AP SCIENCE 7 & SCIENCE 7 PRE-AP
79.49,482 57.2 74.3 78.9 71.0 88.8 71.0 88.8 79.99,274 65.2 76.8 79.6 76.4 89.0 76.4 89.0
SCIENCE 8 & SCIENCE 8 PRE-AP SCIENCE 8 & SCIENCE 8 PRE-AP
79.89,356 54.2 73.6 79.2 65.7 89.3 65.7 89.3 81.29,076 63.7 75.8 80.6 74.9 91.6 74.9 91.6
SPANISH FOR NATIVE SPEAKERS I SPANISH FOR NATIVE SPEAKERS I
80.21,186 55.9 75.5 79.5 73.3 87.2 73.3 87.2 81.21,098 57.5 74.0 80.1 70.5 87.8 70.5 87.8
SPANISH FOR NATIVE SPEAKERS II SPANISH FOR NATIVE SPEAKERS II
82.21,075 60.9 76.6 81.4 75.9 91.1 75.9 91.1 82.6938 59.7 74.3 81.4 76.4 92.5 76.4 92.5
SPANISH I SPANISH I
82.24,444 67.1 81.4 82.1 77.3 90.5 77.3 90.5 80.84,058 66.2 80.1 80.7 70.8 87.2 70.8 87.2
July 29, 2011 Dallas ISD Evaluation & Accountability (Data Analysis, Research, and Reporting Services) V:\CILT\1112\CILT_1012.mdb rpt_ACP 2011-12 Campus Data Packet
DISTRICT SUMMARY 175

Course% Items Correct
CourseMark
ACP ACP
Averages % Passing District % Passing
Course Mark(no ACP)
ScaleScore
NumberTested
Course
Assessment of Course Performance
SEMESTER 1
ACP
Course% Items Correct
CourseMark
ACP ACP
Averages % Passing District % Passing
Course Mark(no ACP)
ScaleScore
NumberTested
Course
SEMESTER 2
SPANISH I 7 SPANISH I 7
86.61,069 77.1 84.7 86.4 83.6 96.0 83.6 96.0 85.01,074 77.8 85.2 85.0 81.9 93.9 81.9 93.9
SPANISH I 8 SPANISH I 8
87.6657 74.5 83.0 87.1 77.3 98.0 77.3 98.0 86.1686 75.3 84.9 86.0 79.0 96.1 79.0 96.1
SPANISH II SPANISH II
82.25,143 68.0 78.7 81.6 72.2 90.1 72.2 90.1 82.63,990 69.7 79.8 82.2 72.4 92.1 72.4 92.1
TEXAS STUDIES 7 TEXAS STUDIES 7
79.17,384 54.1 71.3 78.3 55.3 87.7 55.3 87.7 79.17,279 54.8 73.9 78.6 63.4 87.1 63.4 87.1
TEXAS STUDIES 7 PRE-AP TEXAS STUDIES 7 PRE-AP
86.21,956 65.8 77.2 85.3 74.2 96.2 74.2 96.2 86.21,991 68.4 79.0 85.5 81.4 96.9 81.4 96.9
U.S. HISTORY U.S. HISTORY
81.24,961 62.3 75.4 80.4 69.4 91.7 69.4 91.7 81.94,314 64.1 77.1 81.2 73.7 92.7 73.7 92.7
UNITED STATES STUDIES 8 UNITED STATES STUDIES 8
78.96,995 58.4 72.3 78.2 54.9 86.5 54.9 86.5 80.46,746 62.5 77.0 80.1 71.7 89.7 71.7 89.7
UNITED STATES STUDIES 8 PRE-AP UNITED STATES STUDIES 8 PRE-AP
85.92,352 75.9 83.9 85.7 90.4 96.6 90.4 96.6 87.32,331 81.6 87.7 87.3 95.5 96.8 95.5 96.8
WEB MASTERING WEB MASTERING
85.01,083 61.3 74.2 83.4 67.9 96.0 67.9 96.0 81.8649 53.5 72.1 80.4 60.1 86.3 60.1 86.3
WORLD GEOGRAPHY WORLD GEOGRAPHY
78.85,449 61.7 74.4 78.2 65.4 87.5 65.4 87.5 78.95,047 67.5 78.3 78.8 77.1 87.4 77.1 87.4
July 29, 2011 Dallas ISD Evaluation & Accountability (Data Analysis, Research, and Reporting Services) V:\CILT\1112\CILT_1012.mdb rpt_ACP 2011-12 Campus Data Packet
DISTRICT SUMMARY 176
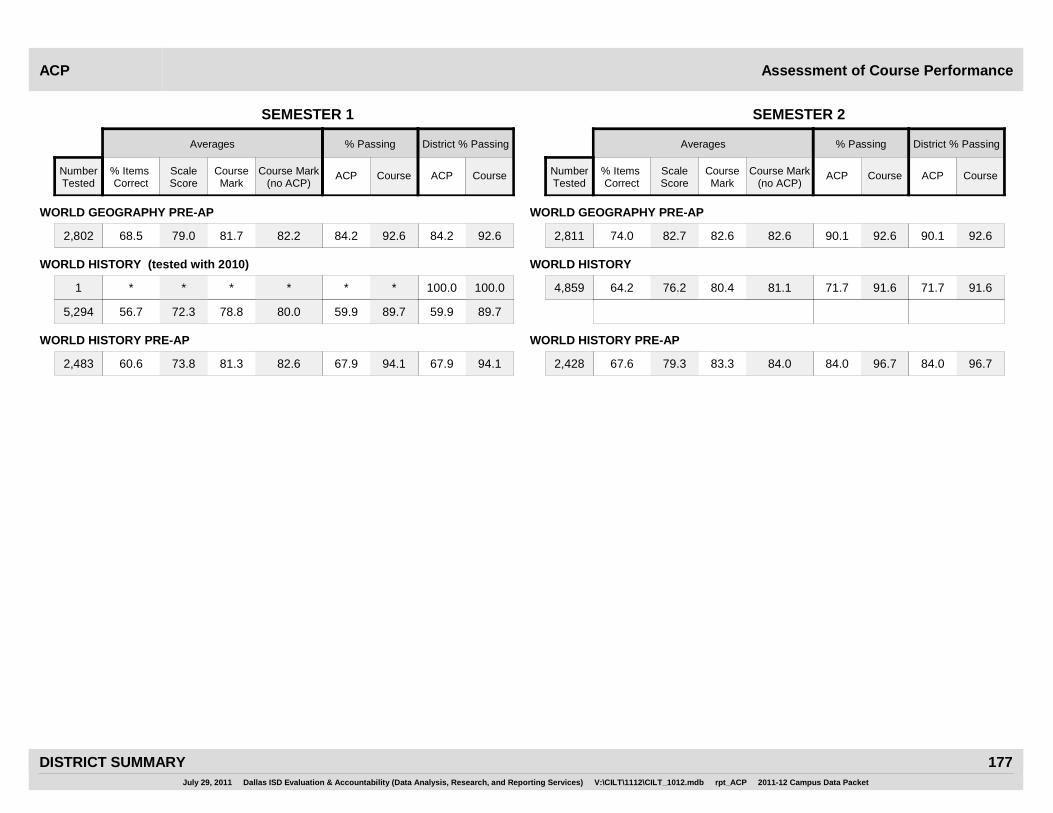
Course% Items Correct
CourseMark
ACP ACP
Averages % Passing District % Passing
Course Mark(no ACP)
ScaleScore
NumberTested
Course
Assessment of Course Performance
SEMESTER 1
ACP
Course% Items Correct
CourseMark
ACP ACP
Averages % Passing District % Passing
Course Mark(no ACP)
ScaleScore
NumberTested
Course
SEMESTER 2
WORLD GEOGRAPHY PRE-AP WORLD GEOGRAPHY PRE-AP
82.22,802 68.5 79.0 81.7 84.2 92.6 84.2 92.6 82.62,811 74.0 82.7 82.6 90.1 92.6 90.1 92.6
WORLD HISTORY (tested with 2010) WORLD HISTORY
*1 * * * * * 100.0 100.0 81.14,859 64.2 76.2 80.4 71.7 91.6 71.7 91.6
80.05,294 56.7 72.3 78.8 59.9 89.7 59.9 89.7
WORLD HISTORY PRE-AP WORLD HISTORY PRE-AP
82.62,483 60.6 73.8 81.3 67.9 94.1 67.9 94.1 84.02,428 67.6 79.3 83.3 84.0 96.7 84.0 96.7
July 29, 2011 Dallas ISD Evaluation & Accountability (Data Analysis, Research, and Reporting Services) V:\CILT\1112\CILT_1012.mdb rpt_ACP 2011-12 Campus Data Packet
DISTRICT SUMMARY 177