district 15 data summary
TRANSCRIPT

NYC Department of Education | Office of District Planning
District 15 Data Summary 2022-2023 Strategic Planning Data Considerations
SUMMER 2021

District 15 Data Summary Report | Summer 2021
For Planning Purposes 1
CONTENTS
CITYWIDE TRENDS ............................................................................................................................................................................................. 2
DISTRICT PLANNING PROCESS ..................................................................................................................................................................... 4
DISTRICT ENROLLMENT ................................................................................................................................................................................... 5
District and Charter Enrollment..................................................................................................................................................................... 6
District 15 School Enrollment ......................................................................................................................................................................... 7
Where District 15 Enrolled Students Live ................................................................................................................................................... 8
District Retention - Where District 15 Residents Are Enrolled ........................................................................................................... 9
SEAT DEMAND .................................................................................................................................................................................................... 12
Elementary School Seat Need ....................................................................................................................................................................... 12
Middle School Seat Need ................................................................................................................................................................................ 13
BUILDINGS & CAPACITY ................................................................................................................................................................................. 14
Building Summary .............................................................................................................................................................................................. 14
District 15 Under-Utilized Buildings ............................................................................................................................................................ 15
District 15 Buildings Over 100% Utilization .............................................................................................................................................. 16
New Capacity .................................................................................................................................................................................................... 17
Transportable Classroom Units (TCUs) .................................................................................................................................................... 18
DISTRICT 75 SEAT NEED ................................................................................................................................................................................. 19
DEMOGRAPHICS & STUDENT POPULATION ......................................................................................................................................... 21
Race/Ethnicity .................................................................................................................................................................................................... 21
Students with Disabilities, English Language Learners, and Students Who are Economically Disadvantaged .......................... 26
Students in Temporary Housing ................................................................................................................................................................... 27
SCHOOLS & PROGRAMS ................................................................................................................................................................................. 28
Special Programs ............................................................................................................................................................................................... 29
2020-2021 DISTRICT MAP ................................................................................................................................................................................ 30
District 15 Data Summary Report | Summer 2021
For Planning Purposes 2
CITYWIDE TRENDS
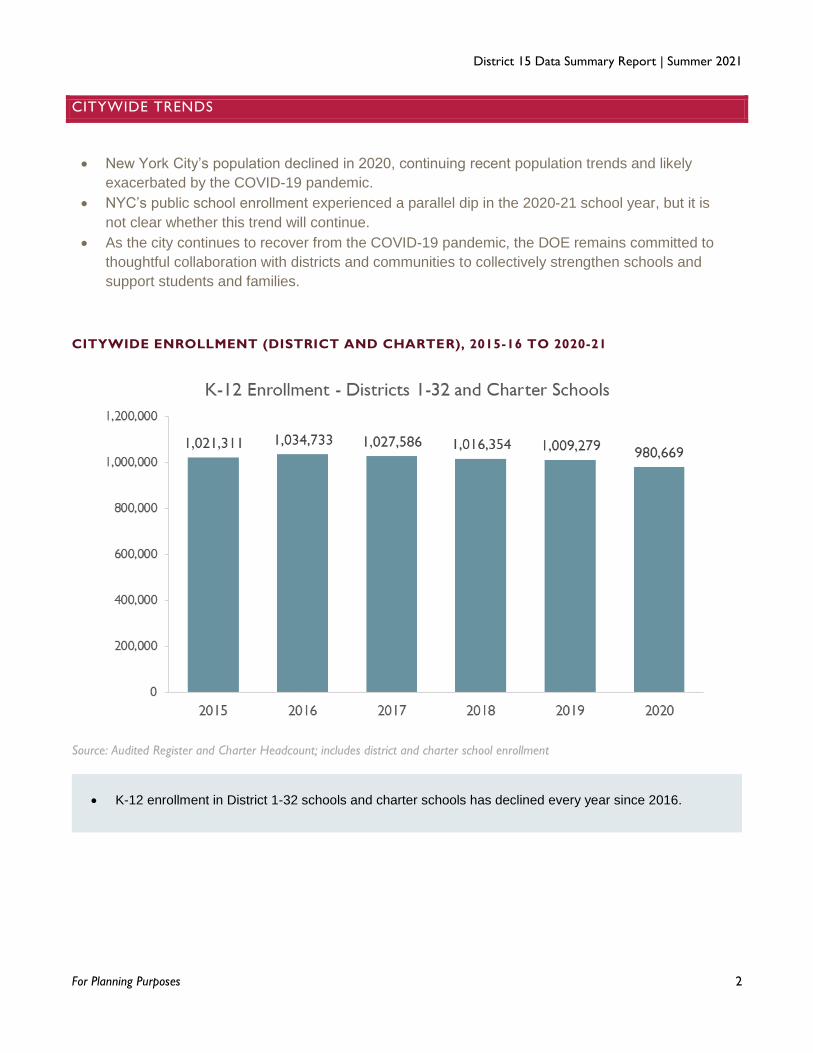
CITYWIDE ENROLLMENT (DISTRICT AND CHARTER), 2015-16 TO 2020-21
Source: Audited Register and Charter Headcount; includes district and charter school enrollment
K-12 enrollment in District 1-32 schools and charter schools has declined every year since 2016.
New York City’s population declined in 2020, continuing recent population trends and likely
exacerbated by the COVID-19 pandemic.
NYC’s public school enrollment experienced a parallel dip in the 2020-21 school year, but it is
not clear whether this trend will continue.
As the city continues to recover from the COVID-19 pandemic, the DOE remains committed to
thoughtful collaboration with districts and communities to collectively strengthen schools and
support students and families.

District 15 Data Summary Report | Summer 2021
For Planning Purposes 3
CITYWIDE DISTRICT 75 ENROLLMENT
Source: Audited Register
Even as enrollment in District 1-32 schools and charter schools has declined in recent years, the
number of students enrolled in District 75 special classes – programs for students with more intensive
special education needs – has continued to rise.
Citywide enrollment in District 75 special classes increased by more than 400 students from the 2019-
20 to the 2020-21 school year, and has grown by 12% since the 2016-17 school year.
District 15 Data Summary Report | Summer 2021
For Planning Purposes 4
DISTRICT PLANNING PROCESS
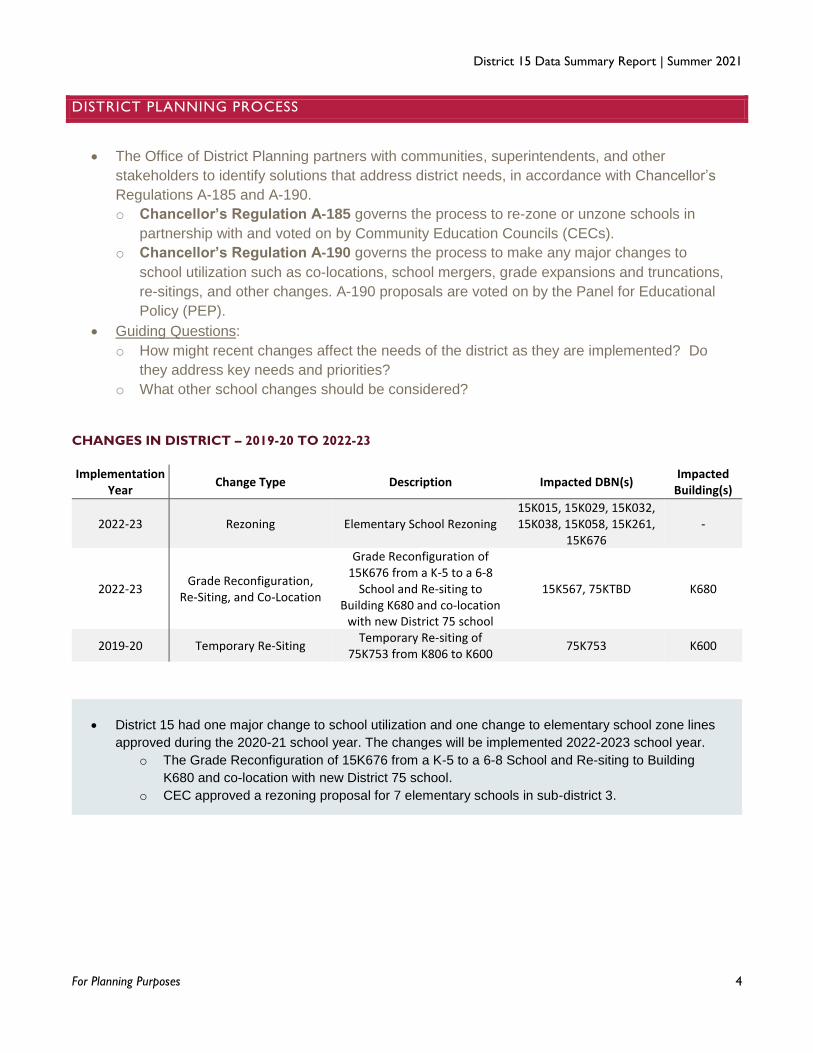
CHANGES IN DISTRICT – 2019-20 TO 2022-23
Implementation Year
Change Type Description Impacted DBN(s) Impacted
Building(s)
2022-23 Rezoning Elementary School Rezoning
15K015, 15K029, 15K032, 15K038, 15K058, 15K261,
15K676
-
2022-23 Grade Reconfiguration,
Re-Siting, and Co-Location
Grade Reconfiguration of 15K676 from a K-5 to a 6-8
School and Re-siting to Building K680 and co-location
with new District 75 school
15K567, 75KTBD K680
2019-20 Temporary Re-Siting Temporary Re-siting of
75K753 from K806 to K600 75K753 K600
District 15 had one major change to school utilization and one change to elementary school zone lines
approved during the 2020-21 school year. The changes will be implemented 2022-2023 school year.
o The Grade Reconfiguration of 15K676 from a K-5 to a 6-8 School and Re-siting to Building
K680 and co-location with new District 75 school.
o CEC approved a rezoning proposal for 7 elementary schools in sub-district 3.
The Office of District Planning partners with communities, superintendents, and other
stakeholders to identify solutions that address district needs, in accordance with Chancellor’s
Regulations A-185 and A-190.
o Chancellor’s Regulation A-185 governs the process to re-zone or unzone schools in
partnership with and voted on by Community Education Councils (CECs).
o Chancellor’s Regulation A-190 governs the process to make any major changes to
school utilization such as co-locations, school mergers, grade expansions and truncations,
re-sitings, and other changes. A-190 proposals are voted on by the Panel for Educational
Policy (PEP).
Guiding Questions:
o How might recent changes affect the needs of the district as they are implemented? Do
they address key needs and priorities?
o What other school changes should be considered?

District 15 Data Summary Report | Summer 2021
For Planning Purposes 5
DISTRICT ENROLLMENT
DISTRICT ENROLLMENT (DISTRICT AND CHARTER), 2015-16 TO 2020-21
2015-16 2016-17 2017-18 2018-19 2019-20 2020-21 5yr
Change
PK 1,599 1,646 1,574 1,598 1,662 1,325 -17.1%
K-5 19,443 19,535 19,363 19,018 18,949 17,736 -8.8%
6-8 6,478 6,723 7,046 7,428 7,545 7,253 12.0%
9-12 6,834 7,140 7,057 7,188 6,928 7,375 7.9%
Total 34,354 35,044 35,040 35,232 35,084 33,689 -2%
% Change YoY 2.0% 0.0% 0.5% -0.4% -4.0%
2015-16 2016-17 2017-18 2018-19 2019-20 2020-21 5yr
Change
K 3,406 3,338 3,293 3,198 3,248 2,916 -14.4%
6 2,289 2,370 2,452 2,717 2,560 2,356 2.9%
9 1,848 2,005 1,882 1,928 1,889 1,821 -1.5%
Source: Audited Register and Charter Headcount; includes district and charter school enrollment
Enrollment in District 15 has decreased at the elementary school level over the past five years, with the largest decline from 2019-2020 to 2020-2021.
Middle school enrollment had seen an overall increase in the last 5 years, however enrollment declined from 2019-2020 to 2020-2021.
UNPACKING ENROLLMENT TRENDS
Enrollment is a key data component in the District Planning Process. Enrollment data helps us
identify trends, make hypotheses, and understand where we need to dig deeper in
partnership with our stakeholders.
Guiding Questions:
o What has happened to district enrollment over the last six years overall? By incoming
grade (i.e. K and sixth)? Are there notable trends?
o Are students remaining in the district to attend school? If not, where are they going?
o Are students residing in other districts enrolling in large numbers? Does this vary by grade
level?

District 15 Data Summary Report | Summer 2021
For Planning Purposes 6
DISTRICT AND CHARTER ENROLLMENT
Source: Audited Register and Charter Headcount
Enrollment in charter schools (K-5) has increased over the last 3 years.
The charter presence in District 15 is slightly higher at the middle school level and saw a decline from
2019-2020 school year to 2020-2021.
There are 2 charter schools serving elementary students that are currently phasing in District 15.

District 15 Data Summary Report | Summer 2021
For Planning Purposes 7
DISTRICT 15 SCHOOL ENROLLMENT
Enrollment Range
Count of Schools
ECC ES MS HS Transfer
HS K-8 6-12 K-12 Total
0-499 0 12 3 5 3 0 0 0 23
500-999 0 11 3 2 0 0 3 0 19
1,000-1,499 0 4 2 1 0 0 0 0 7
Total 0 27 8 8 3 0 3 0 49
Source: Audited Register; includes district schools only; excludes pre-K centers.
Low Enrolled Schools
Source: Audited Register
Enrollment trends at individual schools are informed by a multitude of factors, such as space, demand,
and special programming.
A proposal to reconfigure the grades of P.S. 676 from a K-5 to 6-8 was approved in the spring of 2021
by the Panel for Educational Policy.
P.S. 896 is a non-zoned elementary school in Sunset Park which opened in 2018-2019 and will serve
students in grades K-3 next year.
District 15 Data Summary Report | Summer 2021
For Planning Purposes 8
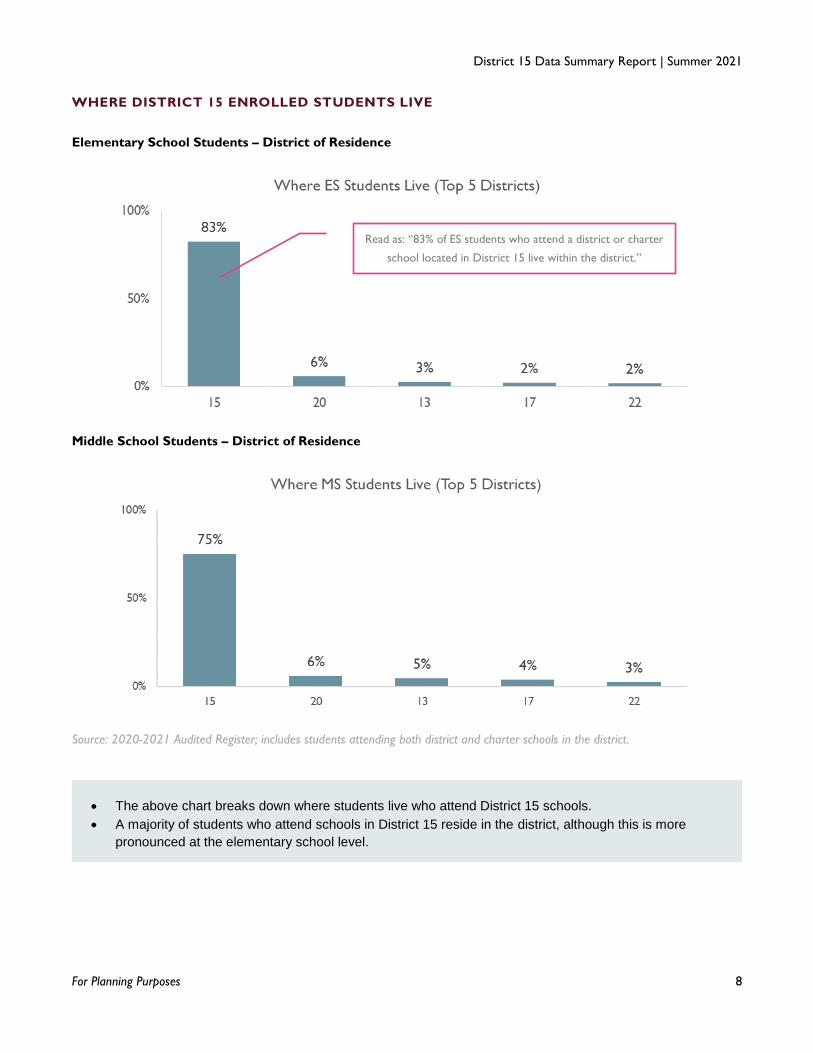
WHERE DISTRICT 15 ENROLLED STUDENTS LIVE
Elementary School Students – District of Residence
Middle School Students – District of Residence
Source: 2020-2021 Audited Register; includes students attending both district and charter schools in the district.
The above chart breaks down where students live who attend District 15 schools.
A majority of students who attend schools in District 15 reside in the district, although this is more
pronounced at the elementary school level.
Read as: “83% of ES students who attend a district or charter
school located in District 15 live within the district.”

District 15 Data Summary Report | Summer 2021
For Planning Purposes 9
DISTRICT RETENTION - WHERE DISTRICT 15 RESIDENTS ARE ENROLLED
Elementary School Students
Middle School Students
Source: 2020-2021 Audited Register; includes only students attending District 1-32 schools in the district.
Read as: “86% of ES students who live in
District 15 attend a district/non-charter
elementary school in the district.”

District 15 Data Summary Report | Summer 2021
For Planning Purposes 10
By School Level and District vs. Charter
Source: 2020-2021 Audited Register
District 15 retains their elementary school students at one of the highest rates in Brooklyn.
Middle school retention is also high, and ranks 4th when compared to all the districts in Brooklyn.
District 15 Data Summary Report | Summer 2021
For Planning Purposes 11
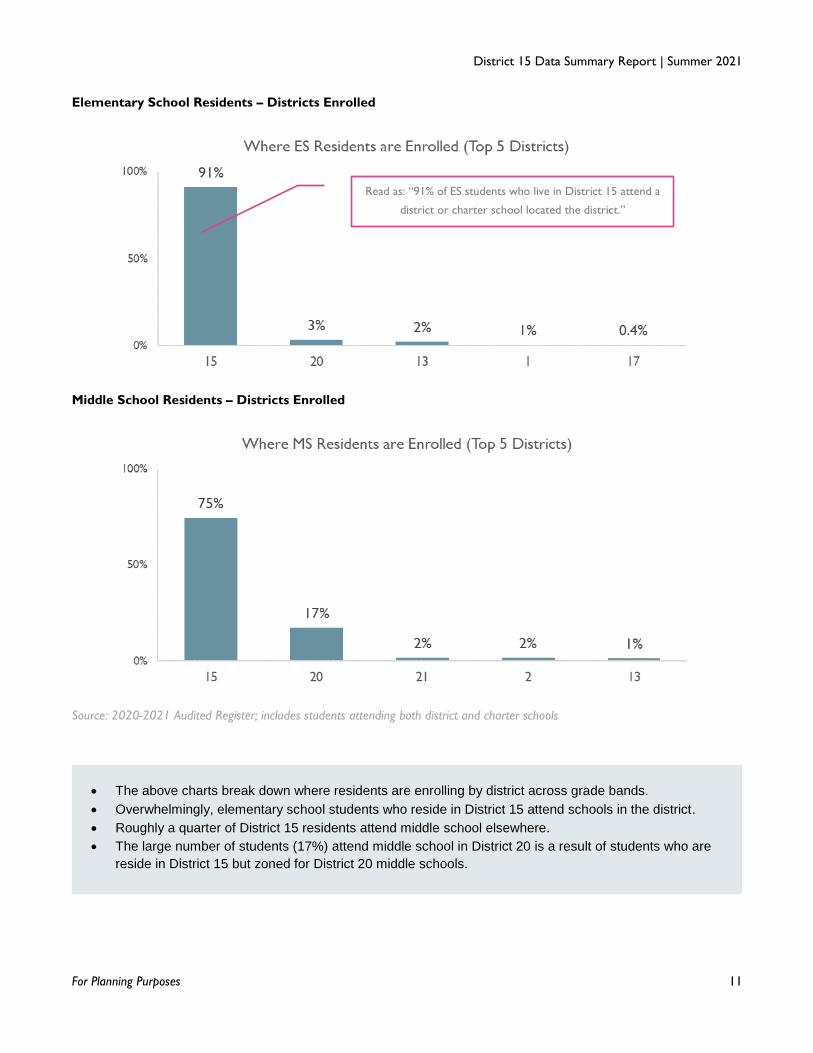
Elementary School Residents – Districts Enrolled
Middle School Residents – Districts Enrolled
Source: 2020-2021 Audited Register; includes students attending both district and charter schools
The above charts break down where residents are enrolling by district across grade bands.
Overwhelmingly, elementary school students who reside in District 15 attend schools in the district.
Roughly a quarter of District 15 residents attend middle school elsewhere.
The large number of students (17%) attend middle school in District 20 is a result of students who are
reside in District 15 but zoned for District 20 middle schools.
Read as: “91% of ES students who live in District 15 attend a
district or charter school located the district.”

District 15 Data Summary Report | Summer 2021
For Planning Purposes 12
SEAT DEMAND
ELEMENTARY SCHOOL SEAT NEED
District 15 elementary school enrollment has declined each year since 2016.
New capacity is expected to open for the 2021-2022 school year as well as in subsequent years.
Given enrollment trends and new school buildings opening in District 15, it is anticipated that capacity
will exceed demand in the coming years.
CAPACITY WITHIN THE DISTRICT
We consider the total number of students and the total number of seats to see if there is a net
surplus or deficit of seats within a district.
Some districts, and particular areas within a district, struggle with over-utilization, while others
have excess capacity.
Excess seats across a district can sometimes lead to low enrollment and unpredictable
enrollment trends for individual schools.
Guiding Questions:
o Are there certain parts of the district with significant excess space? Areas of crowding or
over-utilization?
o How does projected enrollment compare to capacity?
o Do projections align with current, on-the-ground experience?

District 15 Data Summary Report | Summer 2021
For Planning Purposes 13
MIDDLE SCHOOL SEAT NEED
Demand & Capacity Sources: Historical Enrollment is based on Audited Register for years 2015 through 2020. Projected enrollment
range is based on 2021-2022 NYCDOE register estimates as well as demographic projections provided by the School Construction
Authority. Capacity estimates are based on 2019-2020 Blue Book with adjustments for known future capacity changes; excludes
charter enrollment and capacity.
Middle school enrollment in District 15 has increased in the last 5 years.
Middle school enrollment peaked in 2019 and is expected to continue decline over the next few years.
Given enrollment trends and new school buildings opening in District 15, it is anticipated that capacity
will exceed demand in the coming years
District 15 Data Summary Report | Summer 2021
For Planning Purposes 14
BUILDINGS & CAPACITY
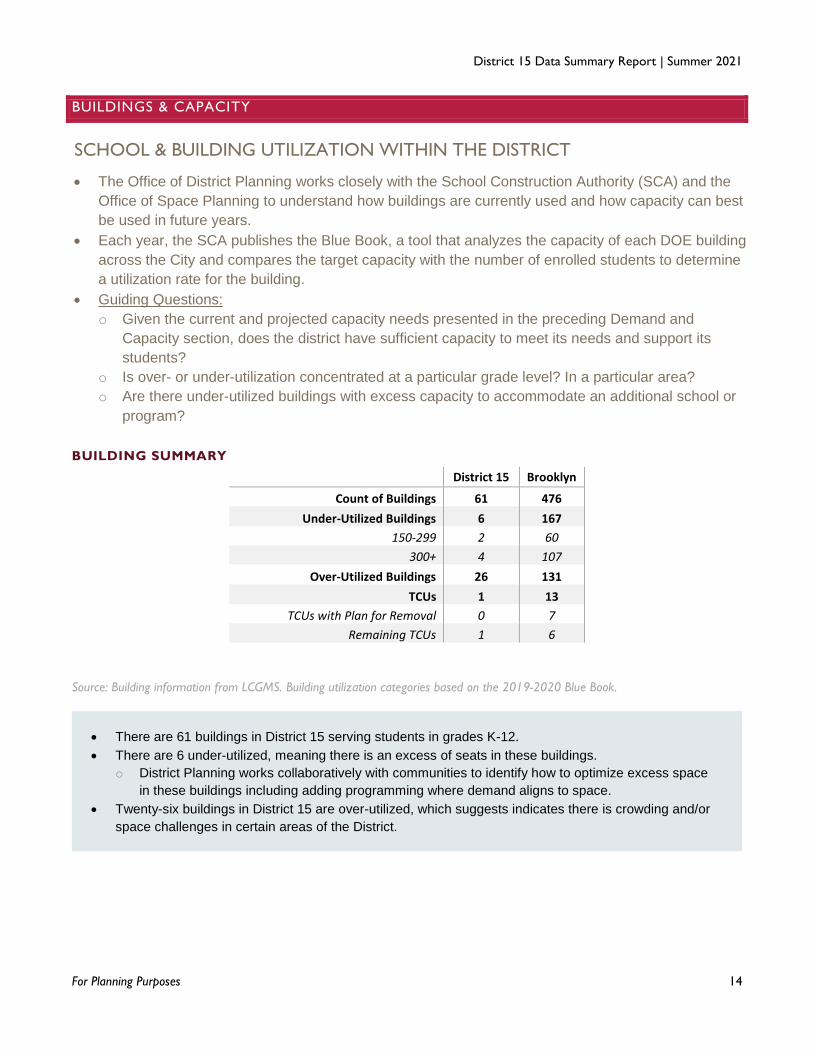
BUILDING SUMMARY
District 15 Brooklyn
Count of Buildings 61 476
Under-Utilized Buildings 6 167
150-299 2 60
300+ 4 107
Over-Utilized Buildings 26 131
TCUs 1 13
TCUs with Plan for Removal 0 7
Remaining TCUs 1 6
Source: Building information from LCGMS. Building utilization categories based on the 2019-2020 Blue Book.
There are 61 buildings in District 15 serving students in grades K-12.
There are 6 under-utilized, meaning there is an excess of seats in these buildings.
o District Planning works collaboratively with communities to identify how to optimize excess space
in these buildings including adding programming where demand aligns to space.
Twenty-six buildings in District 15 are over-utilized, which suggests indicates there is crowding and/or
space challenges in certain areas of the District.
SCHOOL & BUILDING UTILIZATION WITHIN THE DISTRICT
The Office of District Planning works closely with the School Construction Authority (SCA) and the
Office of Space Planning to understand how buildings are currently used and how capacity can best
be used in future years.
Each year, the SCA publishes the Blue Book, a tool that analyzes the capacity of each DOE building
across the City and compares the target capacity with the number of enrolled students to determine
a utilization rate for the building.
Guiding Questions:
o Given the current and projected capacity needs presented in the preceding Demand and
Capacity section, does the district have sufficient capacity to meet its needs and support its
students?
o Is over- or under-utilization concentrated at a particular grade level? In a particular area?
o Are there under-utilized buildings with excess capacity to accommodate an additional school or
program?

District 15 Data Summary Report | Summer 2021
For Planning Purposes 15
DISTRICT 15 UNDER-UTILIZED BUILDINGS
Source: 2019-2020 Blue Book; UU status accounts for planning changes implemented in 2020-2021 and after.
Utilization rates do not always capture the full narrative of space in a building, but provide a starting
point for assessing potential space availability. For example, some buildings, although under-utilized,
may not have sufficient space to add another school.
Other buildings with significant excess seats could be candidates to address pressing district needs,
including housing another school or adding or expanding programs such as dual language offerings,
District 75 programming, Autism Spectrum Disorder (ASD) programs, and/or other district needs.
Building K027 has 668 excess seats, the most excess space of any school serving grades K-5.

District 15 Data Summary Report | Summer 2021
For Planning Purposes 16
DISTRICT 15 BUILDINGS OVER 100% UTILIZATION
Source: 2019-20 Blue Book
There are 26 buildings in District 15 operating at over 100% utilization.
The Office of District Planning seeks to work with the superintendent, CEC, and partner offices to
alleviate overcrowding through the leveraging of available capacity.

District 15 Data Summary Report | Summer 2021
For Planning Purposes 17
NEW CAPACITY
Building Building Name Building
Level Total Seats
Anticipated Opening
K671 P.S. @ 836-841 5TH AVENUE - BROOKLYN PS 404 September 2022
K730 P.S. @ 4513 8TH AVENUE - BROOKLYN PS 328 September 2022
K557 P.S. @ 4302 4TH AVENUE - BROOKLYN PS 332 September 2023
K710 PRE-K CENTER @ 168 8TH STREET - BROOKLYN PRE-K 180 September 2023
K347 P.S. @ 763 PRESIDENT STREET - BROOKLYN PS 476 September 2024
K680 I.S. @ 21-31 & 35 DELEVAN STREET - BROOKLYN IS 555 September 2025
K654 P.S./H.S. @ 362 SCHERMERHORN STREET - BROOKLYN PS/HS 846 TBD
Based on a School Construction Authority report from Feb 2021. Opening timelines subject to change.
CAPITAL PLAN FUNDED SEATS
Sub-District Feb 2021
Identified Need Feb 2021
Funded Need Seats Completed or
In Process
Sunset Park 572 572
Park Slope 824 824 432
Carroll Gardens / Gowanus / Red Hook 1028 1028 937
Source: New York City School Construction Authority, 2020 Five-Year Capital Plan Proposed Amendment, February 2021
District 15 has 7 new capacity projects in progress.
New capacities will necessitate long term planning and potential rezoning.
District 15 has a funded need of 1,028 seats in the Carroll Gardens / Gowanus / Red Hook sub-district,
1,028 of which are completed or in process, per the FY 2020–2024 Five-Year Capital Plan Proposed
Amendment (February 2020).
A combined 1,396 seats have been for the Sunset Park and Park Slope sub-districts for the 2021
school year and beyond.

District 15 Data Summary Report | Summer 2021
For Planning Purposes 18
TRANSPORTABLE CLASSROOM UNITS (TCUS)
Main Bldg ID Building Number of TCUs
Status
K261 P.S. 261 1 Remaining
There is one TCU in District 15 at P.S. 261, which historically has been used for arts programming.

District 15 Data Summary Report | Summer 2021
For Planning Purposes 19
DISTRICT 75 SEAT NEED
District 75 Seat Need and Capacity
ES MS HS
District Borough City District Borough City District Borough City
Capacity 106 3,038 12,266 230 1,432 5,360 266 2,296 8,767
Residents 207 2,533 10,284 64 1,167 4,638 138 2,075 7,782
Deficit -101 No Deficit No Deficit No Deficit No Deficit No Deficit No Deficit No Deficit No Deficit
Source: 2020-2021 Audited Register; includes only students enrolled in D75 special classes
District 75
NYCDOE’s District 75 provides highly specialized instructional support for students with
significant challenges, such as Autism Spectrum Disorder (ASD), significant cognitive delays,
emotional disturbance, sensory impairment, and multiple disabilities.
District 75 serves students through a number of different program models designed for
students of different ages and education needs.
o Most District 75 students attend Special Class programs, which operate as distinct schools
and may be located in standalone sites or co-located with district schools
o A smaller number of students attend Inclusion Programs, in which students receive District
75 services within general education classes at a district school partner.
Guiding Questions:
o Does the district have a need for more District 75 seats?
o Are there potential options for new D75 sites to provide opportunities for students to
attend programs closer to their homes?

District 15 Data Summary Report | Summer 2021
For Planning Purposes 20
District 15 D75 Special Class Enrollment by Year
District 75 serves students in a variety of settings across District 15 based upon an individual student’s IEP.
District 15 has a deficit of 101 seats at the ES level.
District 15 Data Summary Report | Summer 2021
For Planning Purposes 21
DEMOGRAPHICS & STUDENT POPULATION
RACE/ETHNICITY
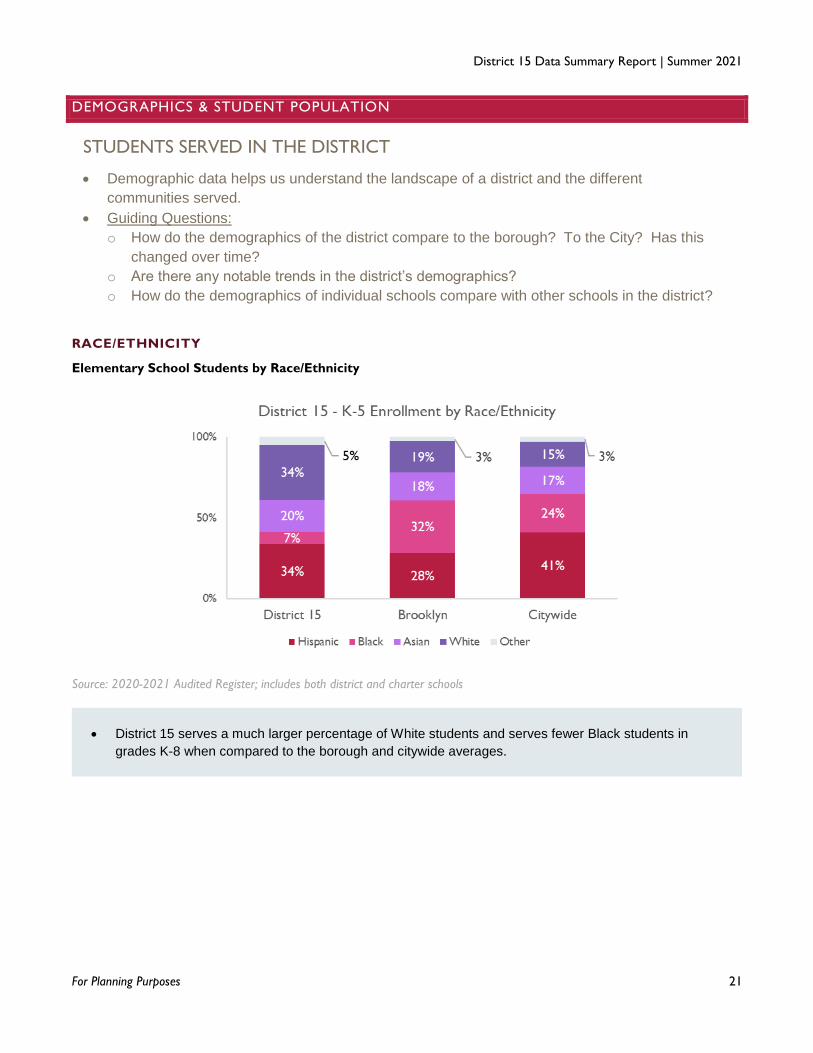
Elementary School Students by Race/Ethnicity
Source: 2020-2021 Audited Register; includes both district and charter schools
District 15 serves a much larger percentage of White students and serves fewer Black students in
grades K-8 when compared to the borough and citywide averages.
STUDENTS SERVED IN THE DISTRICT
Demographic data helps us understand the landscape of a district and the different
communities served.
Guiding Questions:
o How do the demographics of the district compare to the borough? To the City? Has this
changed over time?
o Are there any notable trends in the district’s demographics?
o How do the demographics of individual schools compare with other schools in the district?
District 15 Data Summary Report | Summer 2021
For Planning Purposes 22
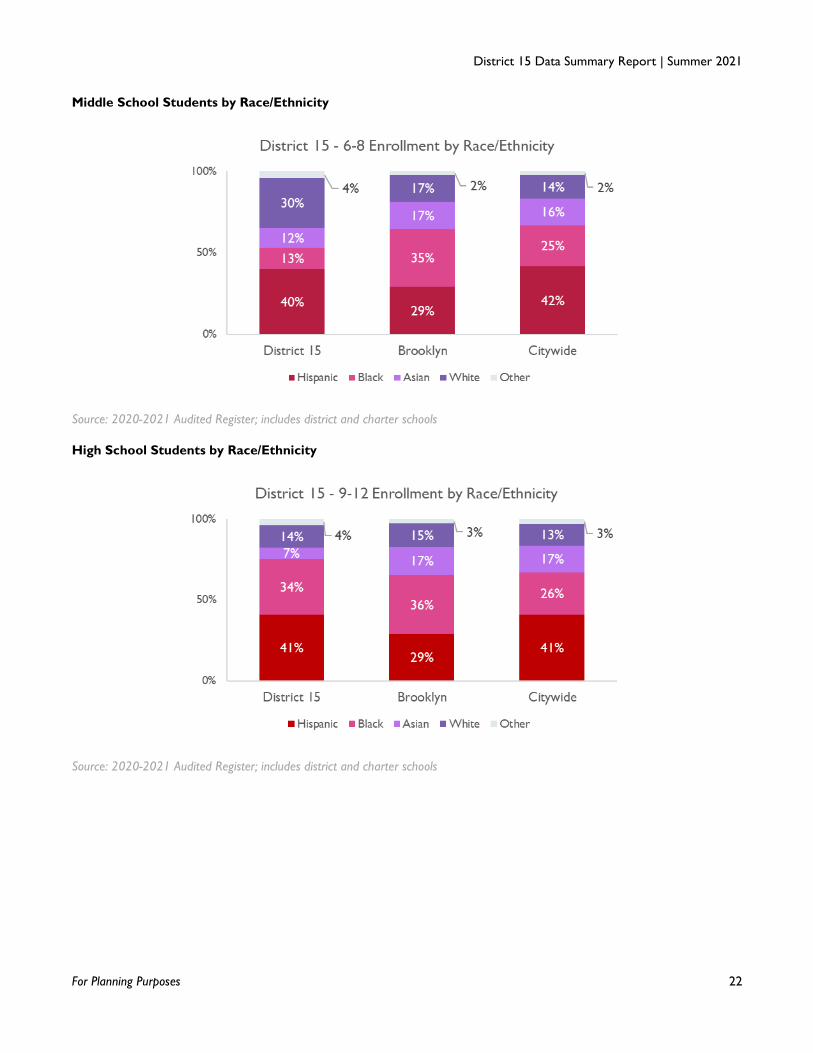
Middle School Students by Race/Ethnicity
Source: 2020-2021 Audited Register; includes district and charter schools
High School Students by Race/Ethnicity
Source: 2020-2021 Audited Register; includes district and charter schools

District 15 Data Summary Report | Summer 2021
For Planning Purposes 23
Source: 2020-2021 Audited Register; for schools also serving other grades (marked with “*”) breakdown includes only students
enrolled in grades K-5.
District 15 has a significant number of elementary schools that serve an ethnically and racially
diverse population of students.

District 15 Data Summary Report | Summer 2021
For Planning Purposes 24
Source: 2020-2021 Audited Register; for schools also serving other grades (marked with “*”) breakdown includes only students
enrolled in grades 6-8.
Middle school’s in District 15 also serve an ethnically and racially diverse population of students.
Only two middle schools in the district serve one racial majority.

District 15 Data Summary Report | Summer 2021
For Planning Purposes 25
Index of Economic Disparity Across Schools in District 15
The index values charted in the graphs below reflect the average percentage point difference between the
district’s overall percentage of economically disadvantaged students and the percentage of economically
disadvantaged students at each of the schools in the district. Higher values mean there is greater variation from
school-to-school and lower values mean the schools in the district more closely resemble the district overall.
While districts that are more homogenous tend to have lower values overall, the year-to-year trend in a given
district – whether the index is going up or down – can help determine whether economically disadvantaged
students are becoming more concentrated in a subset of schools versus evenly spread out across the schools in
the district. Because changes in admissions practices mainly affect schools’ entry grade levels, the charts here
show the index values for Kindergarten and 6th grade cohorts alone.
Source: MarGrady Research, integrateny.org/district, 2021; includes district and charter schools
The economic disparity index is significantly higher at the kindergarten level than the 6th grade level in
District 15.
The middle school index plunged in 2019-20, the first year the District 15 Middle School Diversity Plan
went into effect
Sixth grade cohorts look much more like the district overall than they did before

District 15 Data Summary Report | Summer 2021
For Planning Purposes 26
STUDENTS WITH DISABILITIES, ENGLISH LANGUAGE LEARNERS, AND STUDENTS WHO
ARE ECONOMICALLY DISADVANTAGED
Source: 2020-2021 Audited Register; includes district and charter schools
21% of District 15 students in grades
K-8 qualify for Individualized
Education Programs (IEPs).
This is on par with the borough and
citywide averages.
About 53% of District 15 students are
considered economically
disadvantaged based upon FRL or
HRA benefits.
This is lower than the borough and
citywide averages.
About 15% of District 15 students
qualify for English Language Learner
(ELL) services.
This is on par with the borough and
citywide averages.

District 15 Data Summary Report | Summer 2021
For Planning Purposes 27
STUDENTS IN TEMPORARY HOUSING
ES MS HS
District Borough City District Borough City District Borough City
# Students in Temp. Housing
785 10,217 38,162 375 5,517 20,330 477 6,515 22,912
% Students in Temp. Housing
4% 7% 9% 5% 8% 9% 6% 7% 7%
Source: 2020-2021 Audited Register; includes all students not in permanent housing (excluding students with unknown status)
Source: NYC DOE Report on Students in Temporary Housing, 2021 (data for 2019-20 school year)
District 15 serves 1,673 (total) students in temporary housing across grades K-12.
There are 6 schools in District 15 where 10% or more of students live in temporary housing.

District 15 Data Summary Report | Summer 2021
For Planning Purposes 28
SCHOOLS & PROGRAMS
District Schools Charter Schools Total
District 15 Brooklyn District 15 Brooklyn District 15 Brooklyn
ECC 0 2 0 0 0 2
ES 27 207 5 50 32 257
K-8 0 36 2 20 2 56
MS 8 87 1 39 9 126
6-12 3 19 2 5 5 24
K-12 0 0 0 0 0 0
HS 8 96 1 19 9 115
Transfer HS 3 16 0 0 3 16
YABC 0 9 0 0 0 9
PK 4 23 0 0 4 23
Source: 2020-2021 Audited Register; split-sited charter schools under the same DBN counted separately if different school levels (e.g.
K-5 and 6-8) are served at separate sites
District 15 serves students in a total of 63 schools inclusive of district and charter schools.
There are 38 district schools and 10 charter schools serving students in grades K-8.
SCHOOL TYPES AND PROGRAMS AVAILABLE TO STUDENTS
Understanding the landscape of schools, special programming, and offerings helps identify
potential district needs.
Guiding Questions:
o For all programs, are sites geographically dispersed/accessible?
o Are ASD Nest and/or Horizon programs available in the district? What grade levels do they
serve?
o Does the availability of DL/TBE programs align with ELL needs in the district?

District 15 Data Summary Report | Summer 2021
For Planning Purposes 29
SPECIAL PROGRAMS
District
15 Brooklyn
Schools with ASD Program 5 32
Horizon 1 12
Nest 4 19
Horizon & Nest - -
Intensive K/Nest - 1
Schools with G&T Programs 3 26
Schools with Bilingual Ed Programs 16 107
DL 13 68
TBE 2 29
DL/TBE 1 10
District 15 students are served in a variety
of specialized programs to meet their
unique needs and the interests of the
community.
The Office of District Planning seeks
opportunity to match demand for programs
with excess seats in District Schools.

District 15 Data Summary Report | Summer 2021
For Planning Purposes 30
2020-2021 DISTRICT MAP