distribution of investments in the furniture industry …
TRANSCRIPT

DISTRIBUTION OF INVESTMENTS
IN THE FURNITURE INDUSTRY AND
WOOD PROCESSING IN THE
REPUBLIC OF CROATIA FOR PERIOD
2005.-2009.
Maja Moro, Renata Ojurović,
Ksenija Šegotić, Darko Motik, Andreja Pirc

June 8th - 10th 2011 WoodEMA - DISTRIBUTION OF
INVESTMENTS...
2
INTRODUCTION
Development of a competitive economy is of
great importance of investments in education,
science and technology.
The aim of this study is to examine and
analyze the seven types of investments of
Croatian Wood Industry Companies for period
2005.- 2009

June 8th - 10th 2011 WoodEMA - DISTRIBUTION OF
INVESTMENTS...
3
The spreading of new technologies and
the globalization transform the economies of
the developed industrial countries into
knowledge-based economies.
An important part of the competitiveness
of the national economy is the level of
knowledge and expertise of the personnel
(Bejaković, 2006.).

June 8th - 10th 2011 WoodEMA - DISTRIBUTION OF
INVESTMENTS...
4
New and capital investments at present to
increase the efficiency and benefits in the
future are the only permanent solution for
long-term development (Vedriš, 2005).
This paper presents a distribution of
investments in the furniture industry and
wood processing in the Republic of Croatia
for period 2005.-2009.
June 8th - 10th 2011 WoodEMA - DISTRIBUTION OF
INVESTMENTS...
5
According to the Development Strategy
enacted in 2004., Ministry of Regional
Development, Forestry and Water
Management, Department of Wood Industry,
announced once a year a tender for
assignation irrecoverable dedicated funds for
stimulation and sustainability development of
wood processing and furniture production in
Republic of Croatia.

June 8th - 10th 2011 WoodEMA - DISTRIBUTION OF
INVESTMENTS...
6
Companies from industrial wood
processing proposed a projects for financing
and for this purpose they had to fill-in the
several forms.
The seven types of investments have
been chosen and they are shown in Table1.

June 8th - 10th 2011 WoodEMA - DISTRIBUTION OF
INVESTMENTS...
7
Table 1. Types of investments
Type Description
t1 training of personnel
t2 marketing and promotion activities
t3 product innovation, service and manufacturing processes
t4 technology of wood processing and furniture manufacturing
t5 technology of environmental protection
t6 technology of energy efficiency
t7 increasing capacity

June 8th - 10th 2011 WoodEMA - DISTRIBUTION OF
INVESTMENTS...
8
MATERIAL AND METHODS
Data required for this paper had beengathered from the database of subventiondonors.
They include business entities, i.e.holders of capital investment, total incomeper years and values of investments in allseven types of investments in furnitureindustry and wood processing in the Republicof Croatia for 2005.-2009. period (tables 2.and 3.).

June 8th - 10th 2011 WoodEMA - DISTRIBUTION OF
INVESTMENTS...
9
Table 2. Classification according to value of total income per year and
investments in specific types of investments per year for all the
companies in wooden sector for 2005.-2009. period
Types of investments (mill. euro) Year Total number
of companies Total income (mill. euro) t1 t2 t3 t4 t5 t6 t7
2005 110 351,01 0,13 1,20 0,10 9,32 0,47 0,45 6,49
2006 130 395,04 0,20 1,40 0,11 12,97 0,22 1,04 7,09
2007 149 480,88 0,23 1,48 0,25 15,27 1,76 4,48 11,42
2008 156 500,24 0,36 1,65 0,73 15,27 4,63 7,73 12,76
2009 161 432,61 0,25 1,67 0,49 10,28 2,31 7,02 9,93

June 8th - 10th 2011 WoodEMA - DISTRIBUTION OF
INVESTMENTS...
10
Table 3. Classification according to number of companies that invested
in specific type of investment per year for 2005.-2009.
Types of investments (number of companies) Year
Total number of companies t1 t2 t3 t4 t5 t6 t7
2005 110 56 65 11 79 12 12 51
2006 130 60 69 15 88 11 21 64
2007 149 71 78 22 97 22 27 79
2008 156 81 82 19 105 34 42 82
2009 161 69 88 23 102 33 45 75

June 8th - 10th 2011 WoodEMA - DISTRIBUTION OF
INVESTMENTS...
11
The assumption is that investment
priorities will be the same regardless on
the classification of the observed
companies.
June 8th - 10th 2011 WoodEMA - DISTRIBUTION OF
INVESTMENTS...
12
RESULTS AND DISCUSSION
Descriptive statistics were determined for
annual income per company and annual
share of investments for all of seven types of
investments. Results are given in table 4.
June 8th - 10th 2011 WoodEMA - DISTRIBUTION OF
INVESTMENTS...
13
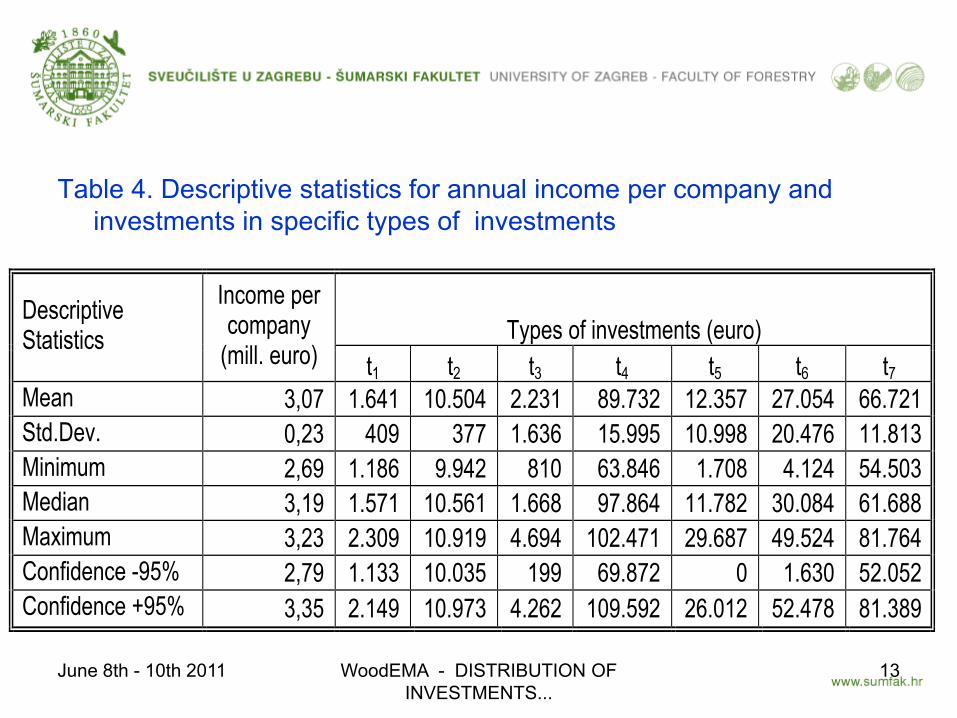
Table 4. Descriptive statistics for annual income per company and
investments in specific types of investments
Types of investments (euro) Descriptive Statistics
Income per company
(mill. euro) t1 t2 t3 t4 t5 t6 t7
Mean 3,07 1.641 10.504 2.231 89.732 12.357 27.054 66.721
Std.Dev. 0,23 409 377 1.636 15.995 10.998 20.476 11.813
Minimum 2,69 1.186 9.942 810 63.846 1.708 4.124 54.503
Median 3,19 1.571 10.561 1.668 97.864 11.782 30.084 61.688
Maximum 3,23 2.309 10.919 4.694 102.471 29.687 49.524 81.764
Confidence -95% 2,79 1.133 10.035 199 69.872 0 1.630 52.052
Confidence +95% 3,35 2.149 10.973 4.262 109.592 26.012 52.478 81.389

June 8th - 10th 2011 WoodEMA - DISTRIBUTION OF
INVESTMENTS...
14
In the years 2005.-2009. average annualrate of change for total income per companywas negative, -4.2%.
Average annual rate of change for totalinvestments (in all seven types of investments)per company in wooden sector was positive,4.7%.
Movement of total revenue for the companyand the total investment per company in thefive-year period are shown in Figure 1. and 2.
4.2%S

June 8th - 10th 2011 WoodEMA - DISTRIBUTION OF
INVESTMENTS...
15
2,2
2,4
2,6
2,8
3,0
3,2
3,4
3,6
2004 2005 2006 2007 2008 2009 2010
Years
Inco
me p
er
co
mp
an
y (
mil
l.
eu
ro)
Figure 1. Total income per company for period 2005.-2009.

June 8th - 10th 2011 WoodEMA - DISTRIBUTION OF
INVESTMENTS...
16
Figure 2. Total investments per company for period 2005.-2009.
100
125
150
175
200
225
250
275
300
2004 2005 2006 2007 2008 2009 2010
Years
Inv
es
tme
nts
pe
r c
om
pa
ny
(th
ou
sa
nd
s o
f e
uro
s)

June 8th - 10th 2011 WoodEMA - DISTRIBUTION OF
INVESTMENTS...
17
Figure 3. Investments per company and types of investments for period 2005.-2009.
0
20
40
60
80
100
120
t1 t2 t3 t4 t5 t6 t7
Types of investments
Inv
es
tme
nts
pe
r c
om
pa
ny
(th
ou
sa
nd
s o
f e
uro
s)
2005 2006 2007 2008 2009

June 8th - 10th 2011 WoodEMA - DISTRIBUTION OF
INVESTMENTS...
18
Figure 4. Ranking by type of investment with respect to the amount of invested money
t5
technology of
environmental
protection
6,2%
t7
increasing
capacity
31,5%
t1
training of
personnel
0,8%
t3
product
innovation,
service and
manufacturing
processes
1,1%
t4
technology of
wood processing
and furniture
manufacturing
41,8%
t2
marketing and
promotion
activities
4,9%
t6
technology of
energy efficiency
13,7%

June 8th - 10th 2011 WoodEMA - DISTRIBUTION OF
INVESTMENTS...
19
Then we looked at the number of
companies in the furniture industry and wood
processing in the Republic of Croatia for
period 2005.-2009. that annually invested in
concerned types of investments.
Results are given in table 5.

June 8th - 10th 2011 WoodEMA - DISTRIBUTION OF
INVESTMENTS...
20
Table 5. Descriptive statistics for number of companies that invested in
specific types of investments
Types of investments (number of companies) Descriptive Statistics t1 t2 t3 t4 t5 t6 t7
Mean 67 76 18 94 22 29 70
Std.Dev. 10 9 5 11 11 14 13
Minimum 56 65 11 79 11 12 51
Median 69 78 19 97 22 27 75
Maximum 81 88 23 105 34 45 82
Confidence -95, % 55 65 12 81 9 12 54
Confidence +95% 80 88 24 107 36 47 86

June 8th - 10th 2011 WoodEMA - DISTRIBUTION OF
INVESTMENTS...
21
0
20
40
60
80
100
120
t1 t2 t3 t4 t5 t6 t7
Type of investment
Nu
mb
er o
f co
mp
anie
s
2005 2006 2007 2008 2009
Figure 5. Investments due to number of companies

June 8th - 10th 2011 WoodEMA - DISTRIBUTION OF
INVESTMENTS...
22
Figure 6. Ranking by type of investment with respect to the number of
companies
t1
training of
personnel
17,8% t2
marketing and
promotion activities
20,2%
t3
product innovation,
service and
manufacturing
processes
4,8%
t4
technology of w ood
processing and
furniture
manufacturing
24,9%
t7
increasing capacity
18,6%t6
technology of
energy eff iciency
7,8%
t5
technology of
environmental
protection
5,9%

June 8th - 10th 2011 WoodEMA - DISTRIBUTION OF
INVESTMENTS...
23
Analysis showed that in Croatian wooden
sector the most important type for investment is
type t4, which means that as the most important
investment they considered investment in
technology of wood processing and furniture
manufacturing.
Results are presented in table 6. where
Rank 1 is distribution of investments according
to amount of invested money and Rank 2
according to number of companies.

June 8th - 10th 2011 WoodEMA - DISTRIBUTION OF
INVESTMENTS...
24
Table 6. Comparing priorities for investments
Types of investments Rank 1 Rank 2
t1 training of personnel 7 4
t2 marketing and promotion activities 5 2
t3 product innovation, service and manufacturing processes 6 7
t4 technology of wood processing and furniture manufacturing 1 1
t5 technology of environmental protection 4 6
t6 technology of energy efficiency 3 5
t7 increasing capacity 2 3

June 8th - 10th 2011 WoodEMA - DISTRIBUTION OF
INVESTMENTS...
25
CONCLUSION
Investment in technology of wood processingand furniture manufacturing is the most importanttype of investment for companies in Croatianwooden sector.
For the future research it would be interesting toexamine distributions of investments if we dividecompanies in subcategories according to activities(wood processing and wood and cork productproduction / furniture production), sizes (small-size,middle-size and large-size), ownership (Croatian,foreign, partially Croatian, partially foreign) etc.

June 8th - 10th 2011 WoodEMA - DISTRIBUTION OF
INVESTMENTS...
26
REFERENCES
1. Anić I.D., Božić Lj., Buturac G., Lovrinčević Ž., Mikulić D., Nušinović M., Rajh E.,
Rašić Bakarić I., Teodorović I., Vizek Maruška (2008) Razvoj prerađivačke
industrije u Hrvatskoj za razdoblje 2007.-2015..(znanstvena studija)
2. Bejaković P. (2006) Uloga obrazovnog sustava u postizanju zapošljivosti i
konkurentnosti radne snage u Hrvatskoj, Društvo istraživača Zagreba, 3(83):401-
425
3. Jurčević J. (2007) Uloga upravljanja ljudskim potencijalima u unapređenju
sustava kvalitete. Poslovna izvrsnost, 1(2):99-109
4. Lučić M. (2009) Održivi razvoj. Quantum, 2(1):124
5. Ojurović R. (2010) Model investicijskih ulaganja proizvodnih subjekata prerade
drva i proizvodnje namještaja Republike Hrvatske u funkciji održivog razvoja.
(disertacija)
6. Vedriš M. (2005) Konkurentnost nacionalne ekonomije - osnova izvoznih
performansi zemlje. Ekonomija, 12(1):37-55