digital analytics: wrap-up (lecture 12)
TRANSCRIPT
Information Technology Program
Aalto University, 2015
Dr. Joni Salminen
[email protected], tel. +358 44 06 36 468
DIGITAL ANALYTICS
1
WRAP-UP WHAT DID WE LEARN?
1
Program (1st week)
• Monday: Introduction & Basics of analytics
• Tuesday: Google Analytics (hands-on stuff)
• Wednesday: Metrics time
• Thursday: Dashboards, data problems, etc.
• It’ll be fun!
2

Program: 2nd & 3rd week
• Optimization
• A/B testing / multivariate testing
• Cohort analysis
• Visualization
• Universal analytics & multichannel
• The real ”Big Data”
• Algorithm-based marketing automatization
• Data philosophy
• …it’ll still be fun :)
3

Program: 2nd & 3rd week
• Optimization
• A/B testing / multivariate testing
• Cohort analysis
• Visualization
• Universal analytics & multichannel
• The real ”Big Data”
• Algorithm-based marketing automatization
• Data philosophy (lying with data)
• …it’ll still be fun :)
4
You will learn to…
• choose relevant KPIs and metrics for a business
• manage data scientists and analytics projects
• make and report a website audit
• use dashboards to make better sense of data
• basic use of the best tools: Google Analytics,
Tableau, R
• …and, hopefully, how to make better business
decisions (and/or recommendations) based on data.
5
Closing thoughts follow…
6
What’s the difference between data and
information?
7
It’s a rocky road from data to changes in the
world…
Data → Information → Insight → Action
At every step, there are obstacles to bring you down!
8

Show me the mone…data!
fact > data > assumption > opinion
"it's like this“ (high certitude)
"it seems like this“
"i think it's like this“
"it's like this" (high certitude)
9
What’s the best data?
behavioral data > survey data > interview data >
guesses
10
What are the questions different data
answers to?
11
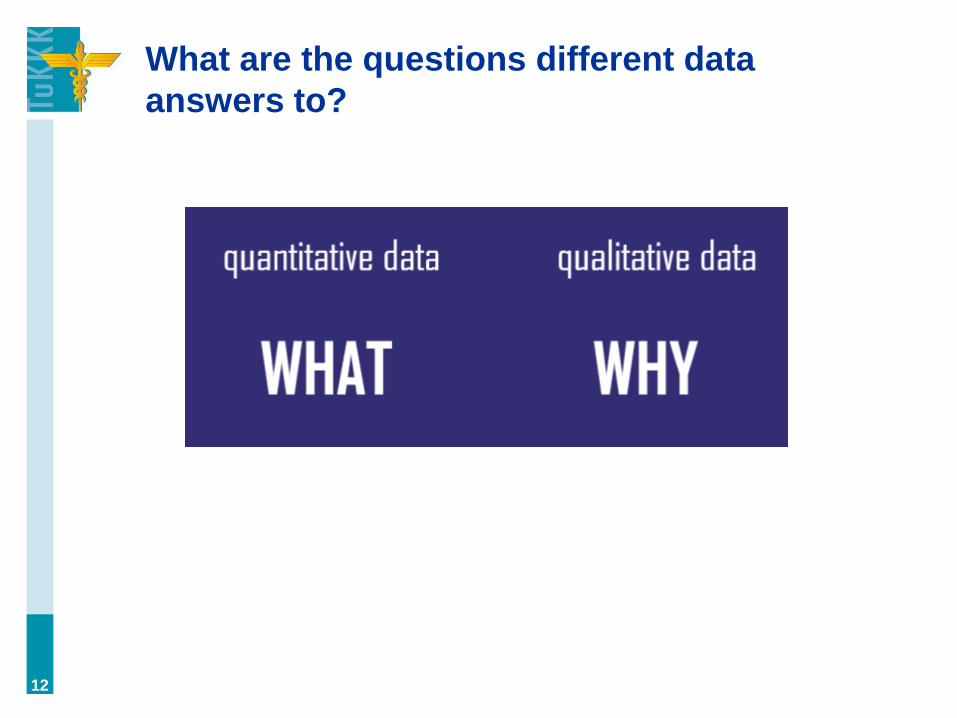
What are the questions different data
answers to?
12
Don’t forget qualitative data!
In usability studies, they often refer to ”task completion”.
This is measured in % of people able to perform a given
task (e.g., find and buy a specific product on an
ecommerce site). If the user fails to accomplish the task,
usability researchers ask why. We can adopt the same
logic in analytics:
– Why did customers come to your site?
– Were they able to complete their intended task?
– Why they were (or not) able to complete their task?
13
The curse of ”Excel marketing managers”
“I agree completely that direct marketing attitudes and
skills have met online metrics, and the relationship is not a
healthy one for advertising. Measuring direct response to
ads undervalues advertising by a wide margin, because it’s
ADVERTISING. It’s meant to have an indirect influence
on perceptions and preferences, not trigger a
transaction. Ultimately, the Google and Facebook metrics
engines play into these attitudes by allowing ROI and other
calculations to be applied to advertising that is presumed
to be much more transactional in nature. But there’s
nothing like a beautiful print or banner ad to subtly shape
perceptions and preferences.”
14
”Data is just one part of decision-making”
(Mosseri, 2010)
• data-driven: data tells us what to do
• data-informed: data helps us finding out what to do,
but we apply our strategy
15
”Data alone is worhless” (Hamel, 2014)
“You need context to turn data into knowledge, and it
needs to be actionable data to be considered insight.
Tools can make you dumb. Limiting your ability to ask
“why?” and think outside the box.
Explaining the context and process— leading to
insight—often has more value than the result itself.”
16
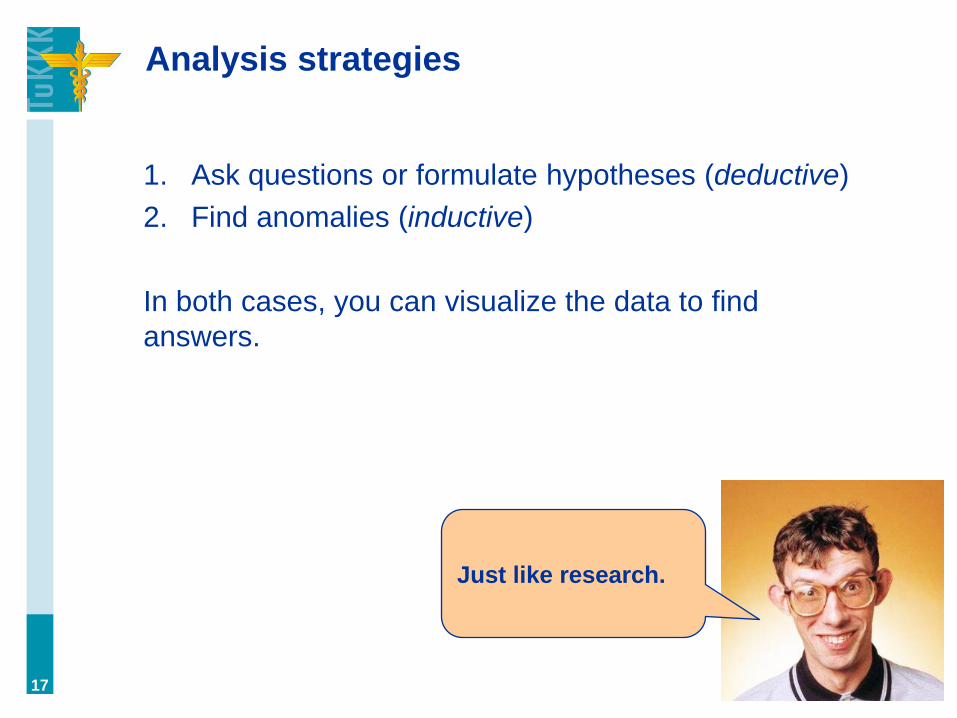
Analysis strategies
1. Ask questions or formulate hypotheses (deductive)
2. Find anomalies (inductive)
In both cases, you can visualize the data to find
answers.
17
Just like research.
There are two type of metrics…
a. relative
b. absolute
• both are needed!
• relative will give you a comparable view on other
campaigns
• absolute will give view on relative (!) importance
18
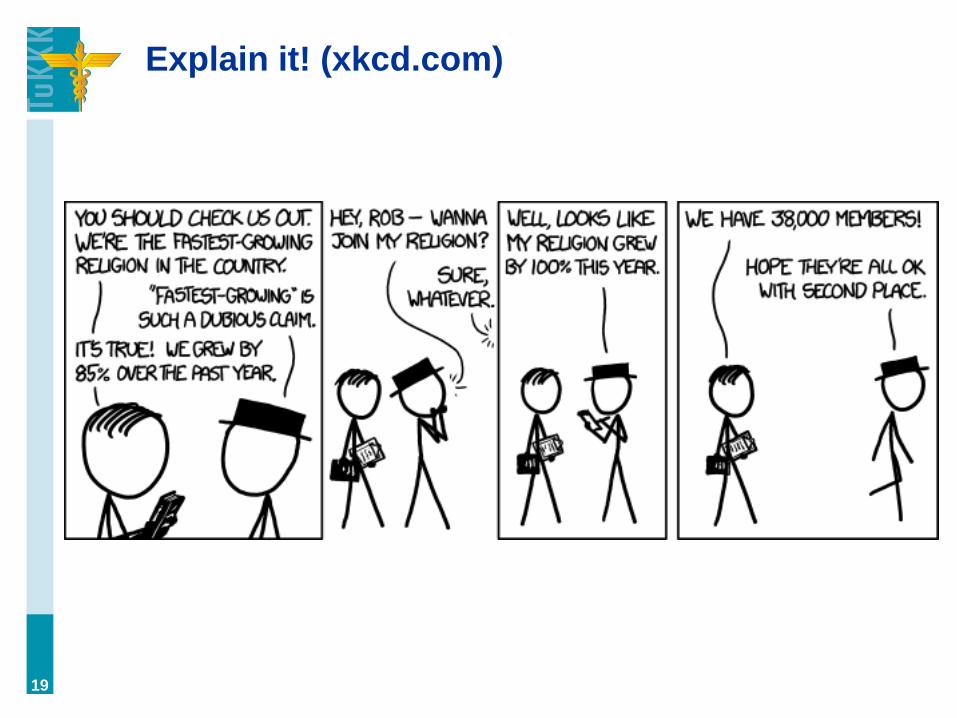
Explain it! (xkcd.com)
19
You have some observations on difference
between A and B. When will you use
percentage and when the actual value?
• actual number = when there are few observations
• percentage = when there are a lot of observations
20
Data can exist in two forms…
a. cross-sectional, a ”snapshot” of the situation
b. longitudinal, a ”trend”, i.e. development of the
chosen metrics in time
…so, be careful that you’re not only measuring metrics
in one point of time, but actually thinking about the
development of performance in a given period.
21
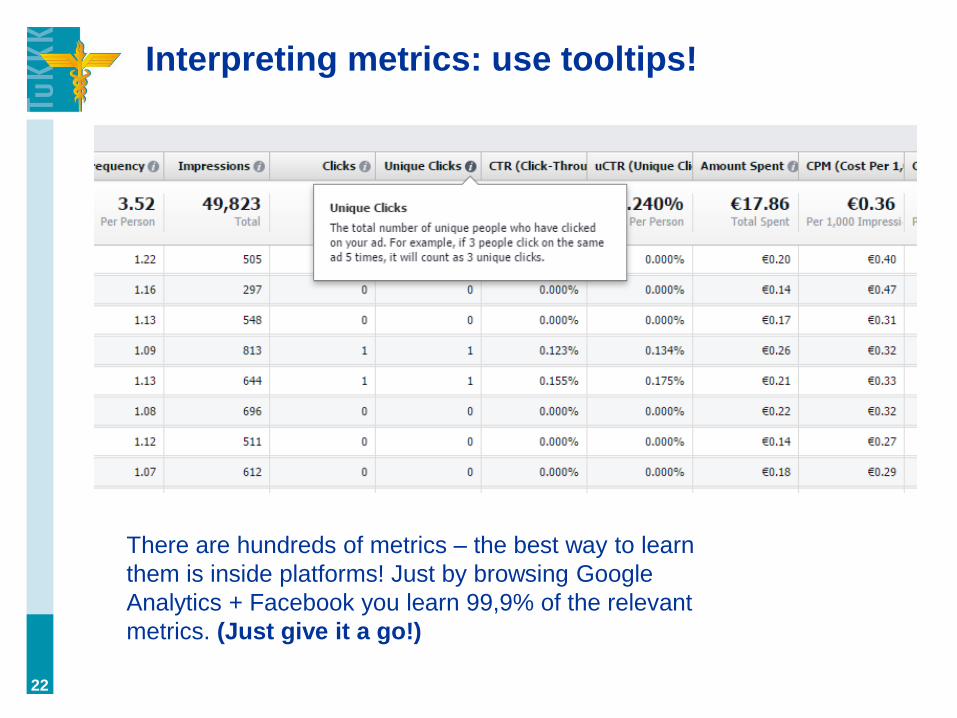
Interpreting metrics: use tooltips!
22
There are hundreds of metrics – the best way to learn
them is inside platforms! Just by browsing Google
Analytics + Facebook you learn 99,9% of the relevant
metrics. (Just give it a go!)
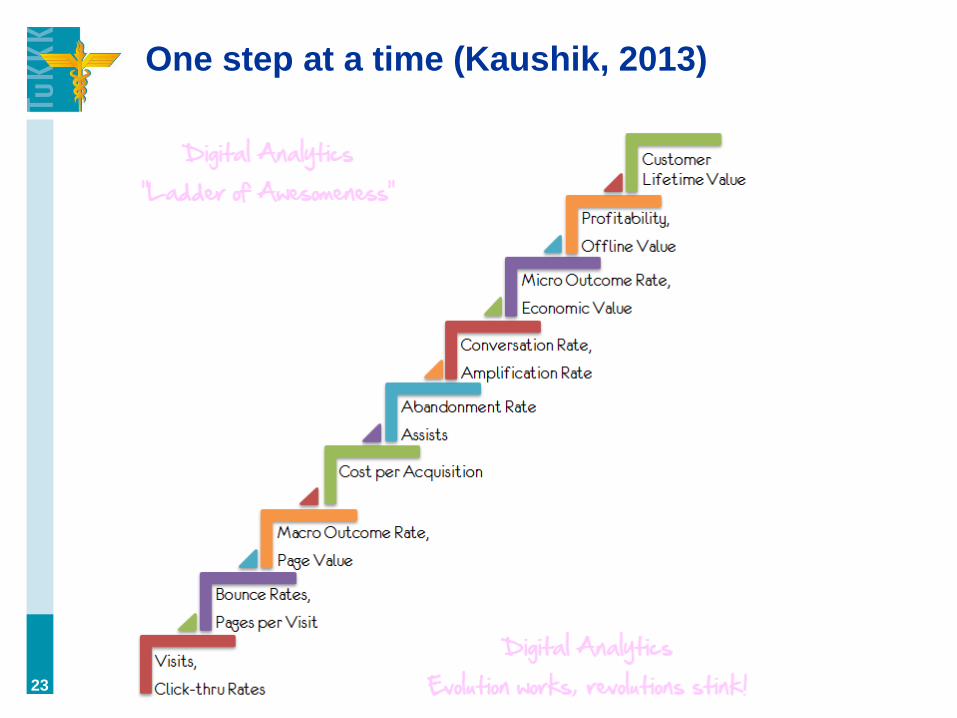
One step at a time (Kaushik, 2013)
23
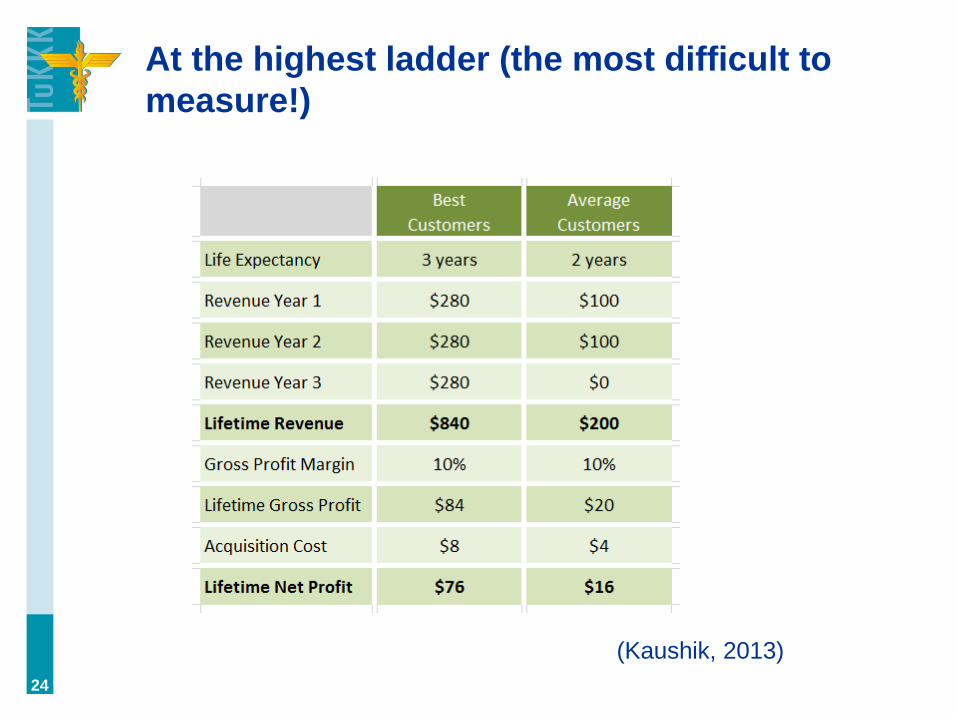
At the highest ladder (the most difficult to
measure!)
24
(Kaushik, 2013)
Predicting CLV: Signal or noise?
The issue with predicting customer lifetime value is that
there may be no theoretical reason to assume that a
channel, age, or any known segmentation would
effectively predict the differences in spending patterns -
people are that much unique. If this holds, we can only
identify the most profitable customers ex post, which is
of course useful also: let's make sure they remain loyal.
#analytics
(in other words, no use in CPA calculation, but use in
retention-focused actions.)
25
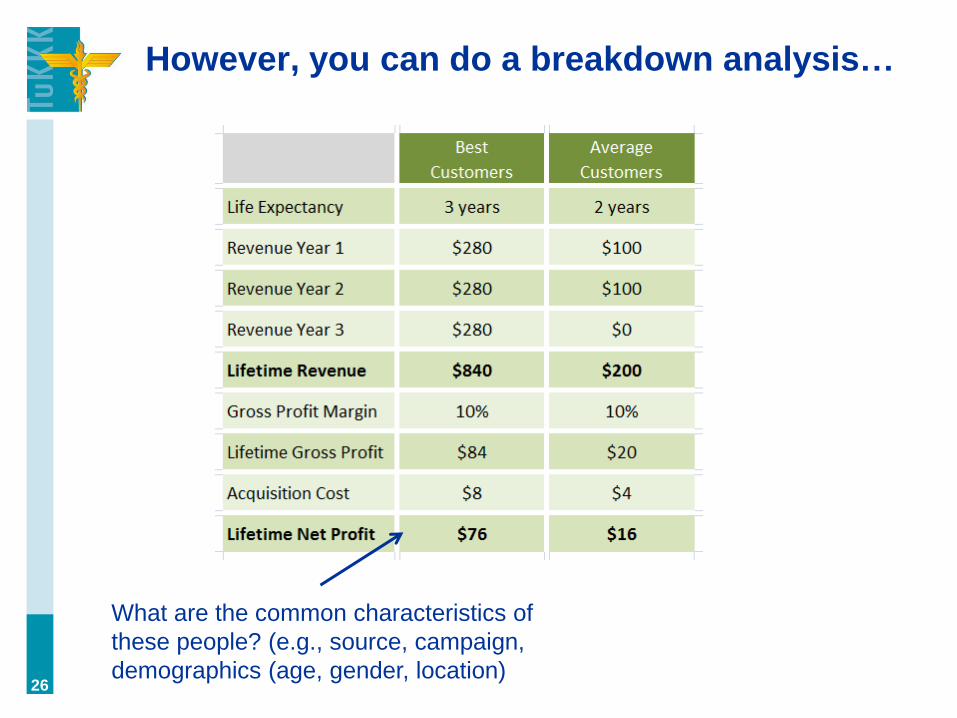
However, you can do a breakdown analysis…
26
What are the common characteristics of
these people? (e.g., source, campaign,
demographics (age, gender, location)
ROI or CPA - which would you use to
measure success of online advertising?
Everyone talks about ROI, but the fatal flaw is that ROI
doesn't measure profitability. CPA is much better when
you know your average margin, because then you can
know whether your campaigns are profitable or not
(instead of knowing whether they are "effective").
27
Always know what
is being measured.
Don’t take crap
(metrics) from
anyone!
Joni’s criteria: actionable & useful
• There was a guy who was very proud of knowing all
the time how many users there are in his e-store.
Everywhere he went he’d always take up his mobile
phone and show the audience this and this many
visitors are on the store at that moment.
• …but, whereas it was nice bragging, I’ve since
wondered: who the hell cares? Knowing how many
visitors you have at a given point in time is not
particularly useful or actionable.
28
I am guilty…
• ” Vanity metrics combined with an obsession with
checking stats is a deadly combination! Well, maybe
not deadly, but at least time-consuming and
unproductive.”
• (→ stats-checking addiction)
• “I'm guilty of being the guy who loves to look at
the Google Analytics charts but only rarely do I
ever DO something as a result.”
29
“people upon whom this data is
regurgitated often do not posses skills to
understand the data, ability or access to
ask clarifying questions of the data or
key context to transform the data into
insights.” (Kaushik, 2014)
30
Dashboard = KPIs + charts
• choose the right KPIs
• choose the right chart types
• (Remember, dashboards are great for reporting, but
you need deeper segmentation to optimize.)
• (Visualization, storytelling, context…)
31
The ultimate problem of analytics
• Analytics does not create action, it only measures it.
• In reality, people act on intuition – this is how great
inventions in science and business are born.
• Analytics cannot explain the innovation process, it
can only measure its impact.
• The role of analytics is to be a part of continuous
evolution of stimuli-response, or a feedback loop,
in which the data on our actions is leveraged to
improve those actions in the future. (sounds
pretty impressive, right? ;)
32
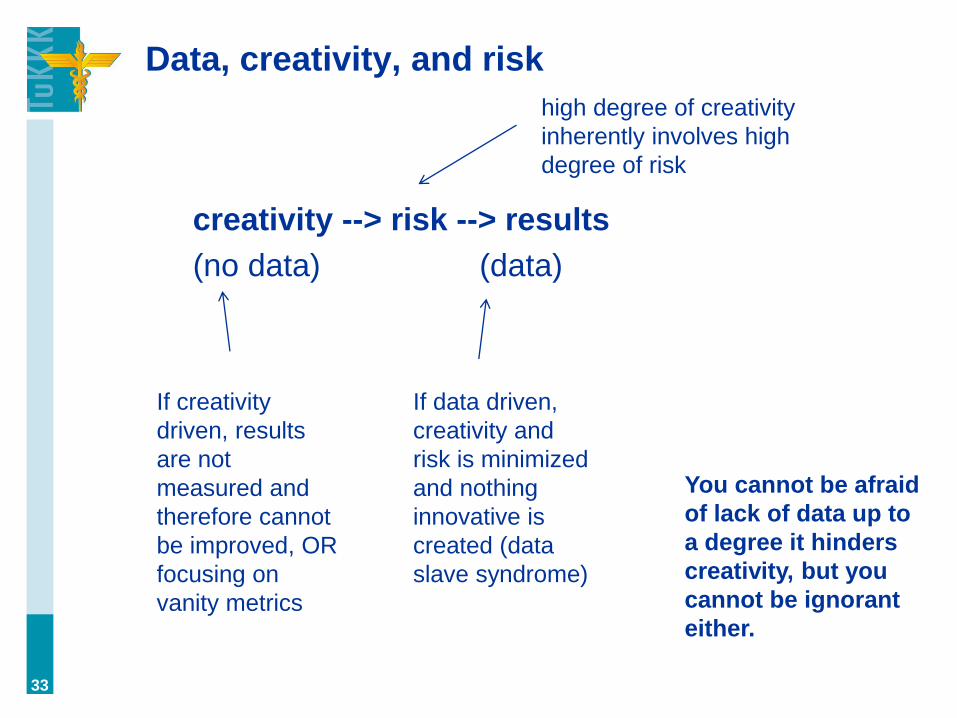
Data, creativity, and risk
creativity --> risk --> results
(no data) (data)
33
If data driven,
creativity and
risk is minimized
and nothing
innovative is
created (data
slave syndrome)
If creativity
driven, results
are not
measured and
therefore cannot
be improved, OR
focusing on
vanity metrics
high degree of creativity
inherently involves high
degree of risk
You cannot be afraid
of lack of data up to
a degree it hinders
creativity, but you
cannot be ignorant
either.
Continue learning, and there will be jobs for
you…
• web analyst (Google Analytics, FB Insights, etc.)
• data scientist (R + stats)
• visualist (Tableau + R)
• analytics manager (wide basic knowledge, generalist)
• in all these professions, you can make a lot of money
34
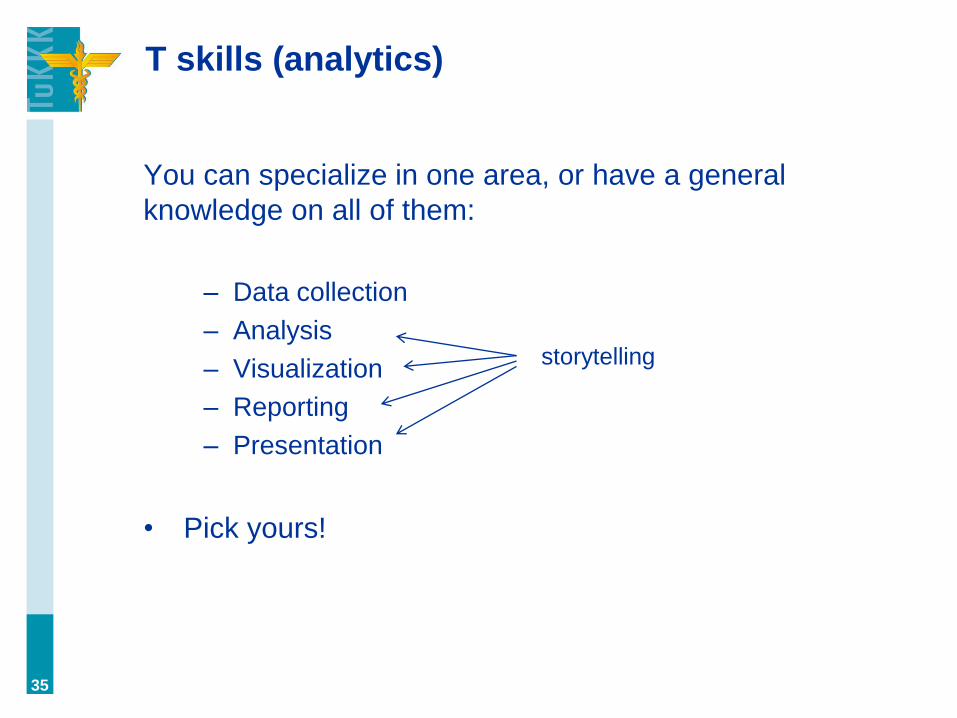
T skills (analytics)
You can specialize in one area, or have a general
knowledge on all of them:
– Data collection
– Analysis
– Visualization
– Reporting
– Presentation
• Pick yours!
35
storytelling
”What if money was no object?”
36
https://www.youtube.com/watch?v=khOaAHK7efc
How to carry on?
• understand you won’t learn skills in school
• understand you need to update your skills through
your whole life
• understand educating is an investment – make that
investment of time and money
• It’s up to YOU to learn – nobody else.
37
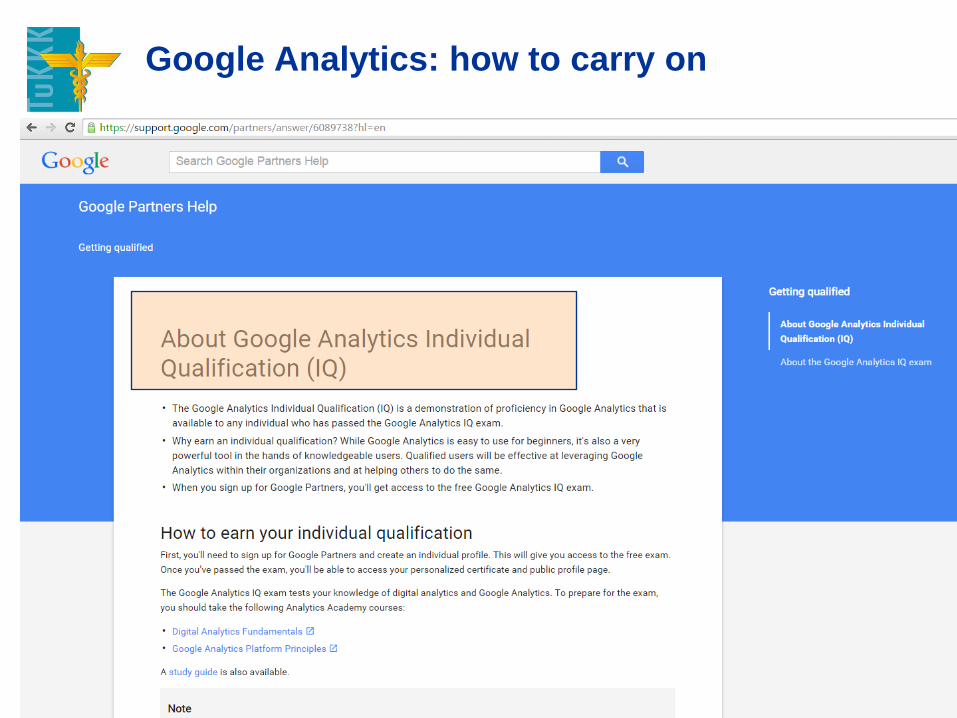
Google Analytics: how to carry on
38
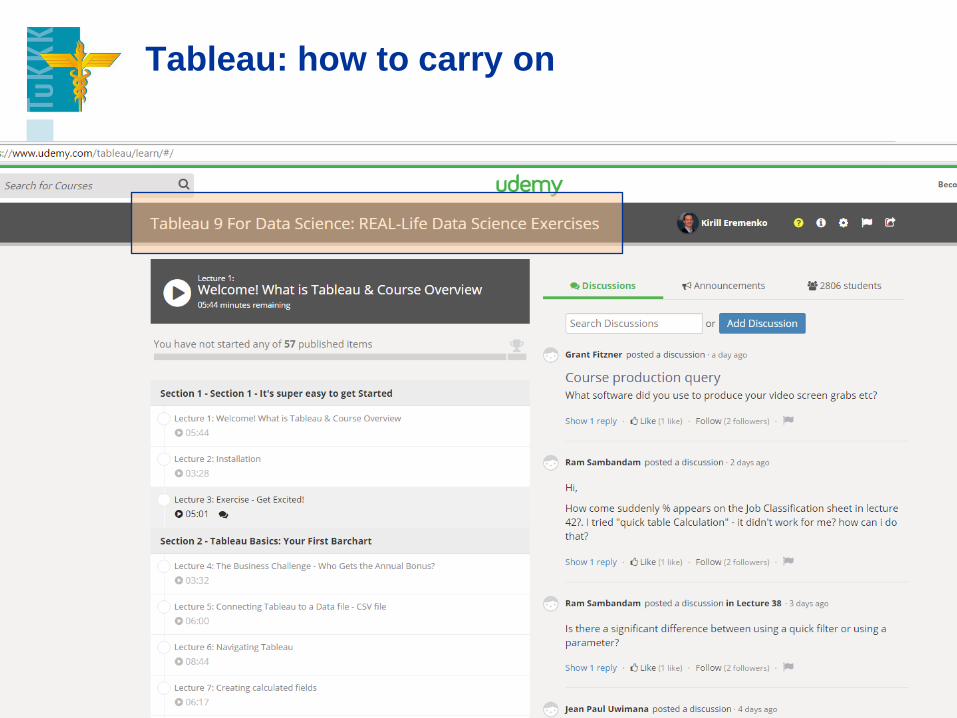
Tableau: how to carry on
39
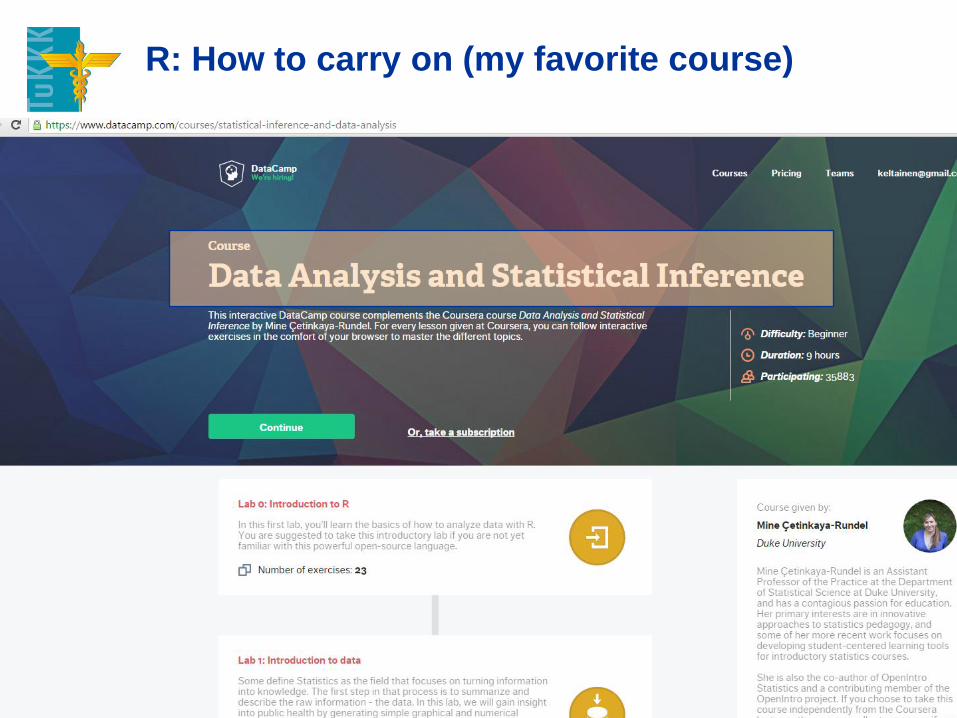
R: How to carry on (my favorite course)
40
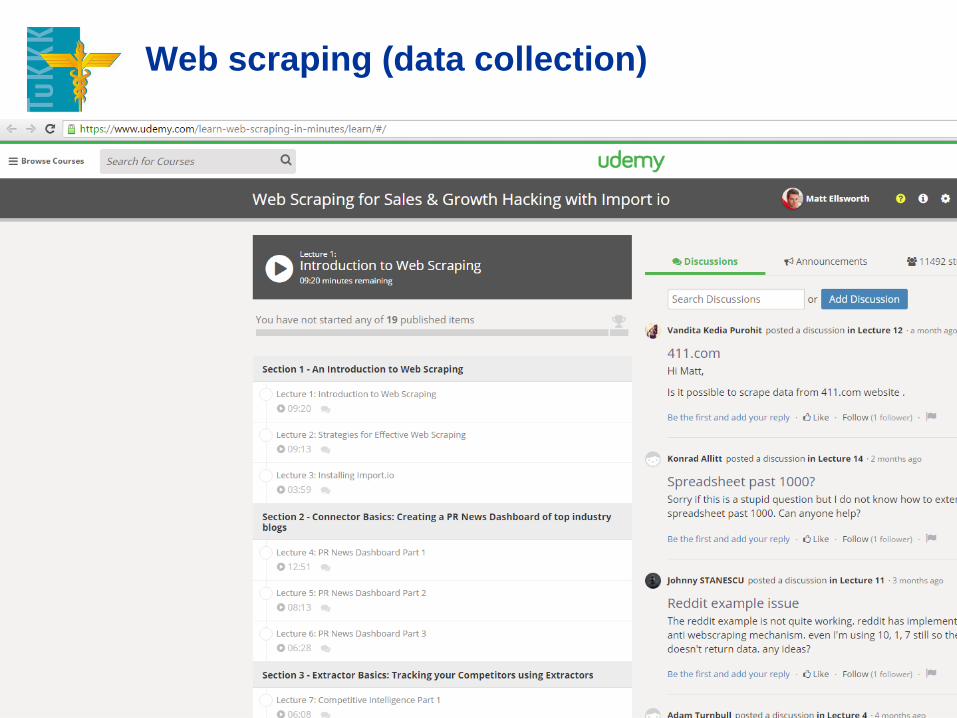
Web scraping (data collection)
41
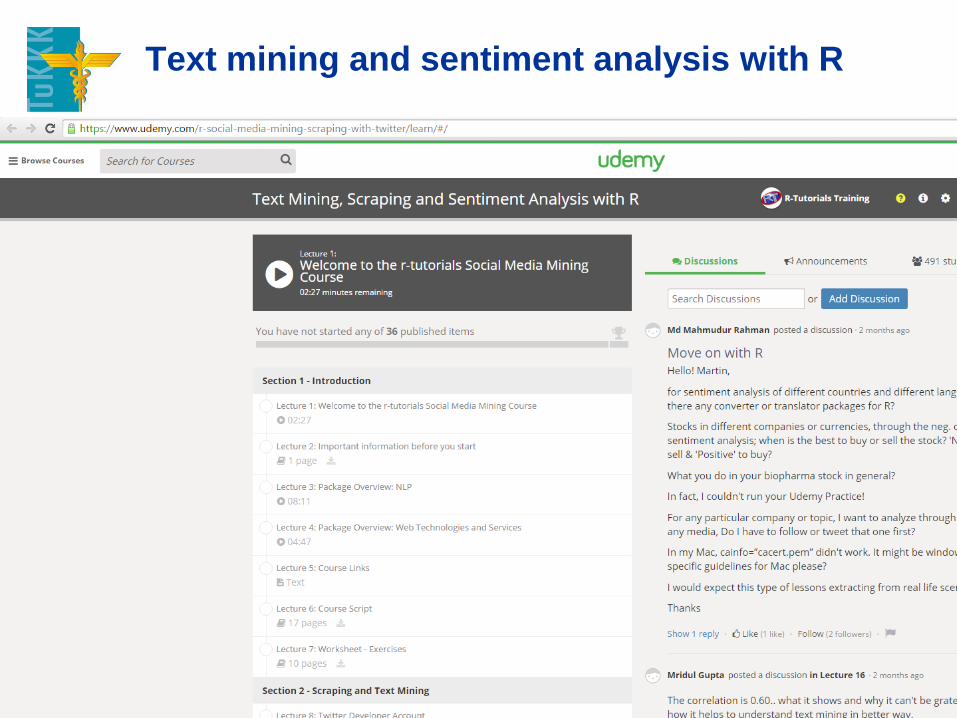
Text mining and sentiment analysis with R
42
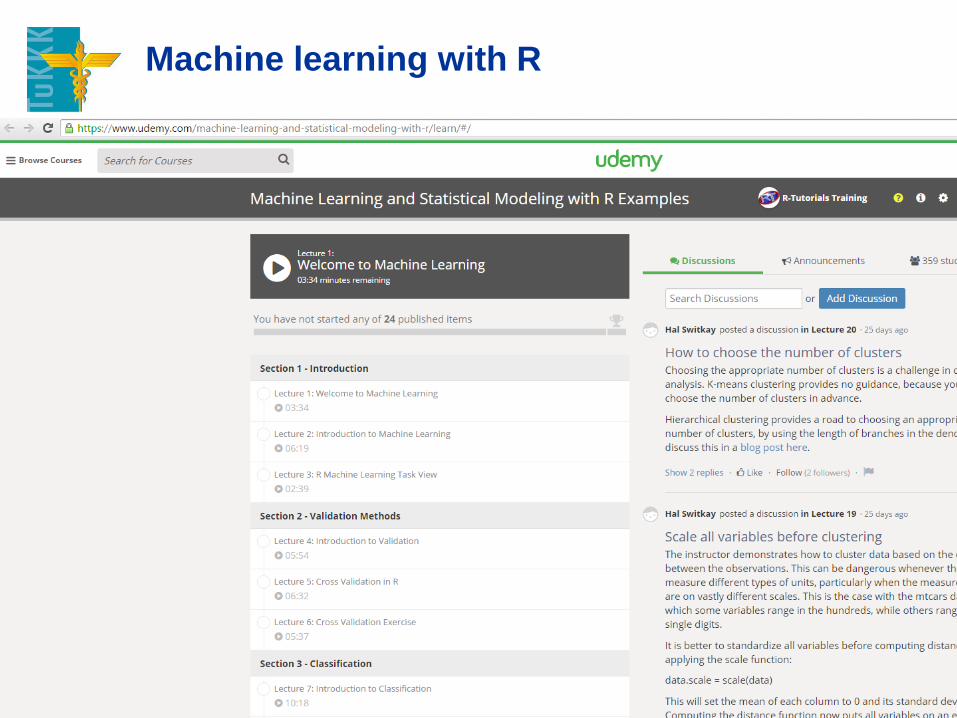
Machine learning with R
43
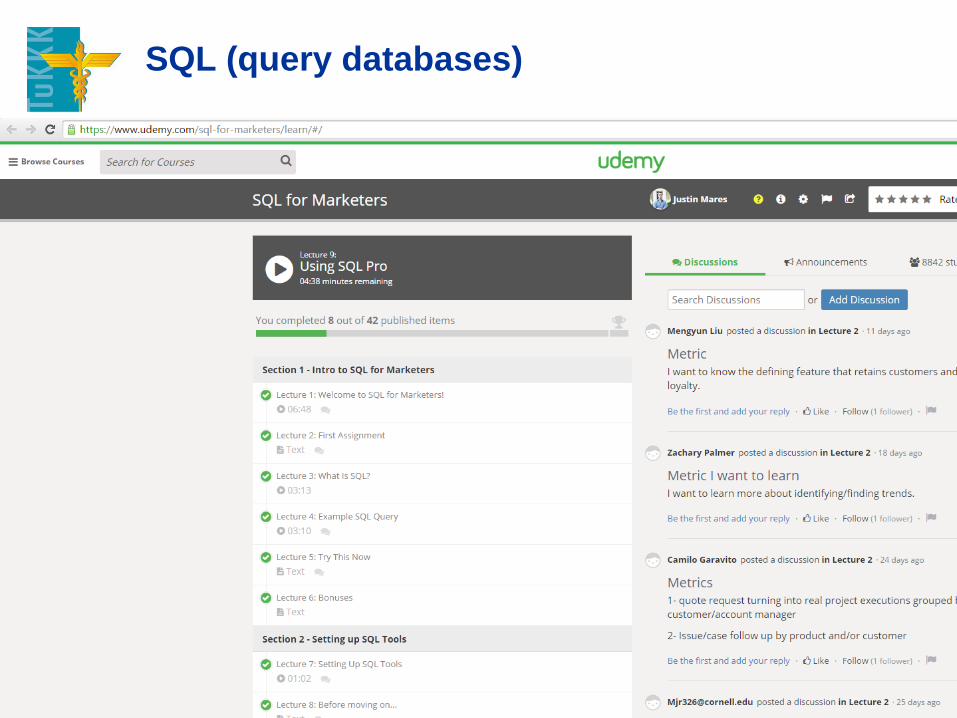
SQL (query databases)
44

The future of education
So, education! Many university teachers are far
behind. I look at these MOOCs, and see some of them
are absolutely brilliant. Much better than my teaching
(and I don't consider myself being a bad teacher, at
least relative to other university teachers). If it was a
free market for education, many university teachers
would have zero chance in competing against MOOC
teachers. Young, energetic, inspiring, and most
importantly: they teach you the skills needed NOW,
not ten years ago. Bravo!
# Moocs # education # learning # futureisnow
45

If you’re into books instead, here’s two
recommendations:
46
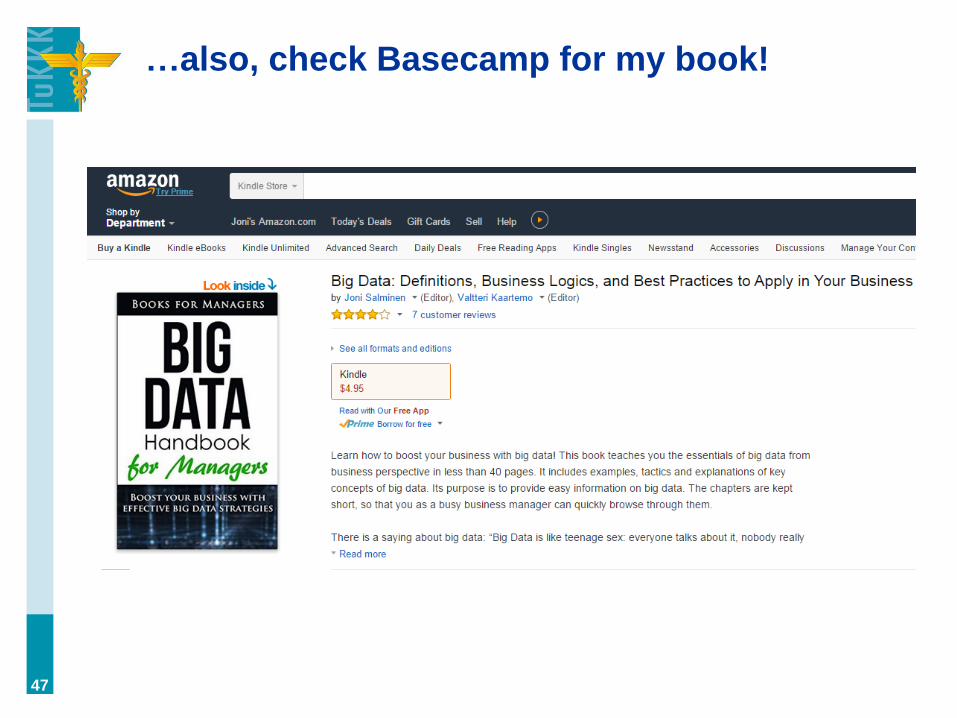
…also, check Basecamp for my book!
47
(+ Extra slides on Big data & Managing an
analytics team)
• Be sure to check them out on Basecamp.
• (+ CLV spreadsheets)
48

…do this, and you’ll succeed.
49
”Damn, that Joni boy is smart”
– Trump
Me & you??
1. Connect in LinkedIn: www.linkedin.com/in/jonisal
2. Check out the thesis ideas: https://goo.gl/qmXKnG
(you can always ask advice)
3. Do an internship at ElämysLahjat.fi & learn a bunch
of digital marketing stuff ([email protected])
4. …oh yeah, join the Facebook group of digital
marketing students (in Finnish): https://www.facebook.com/groups/digimarkkinointi/
50
I’ll always
remember you!

Good luck & see you around!
51