wrap-up from last lecture - umd
TRANSCRIPT
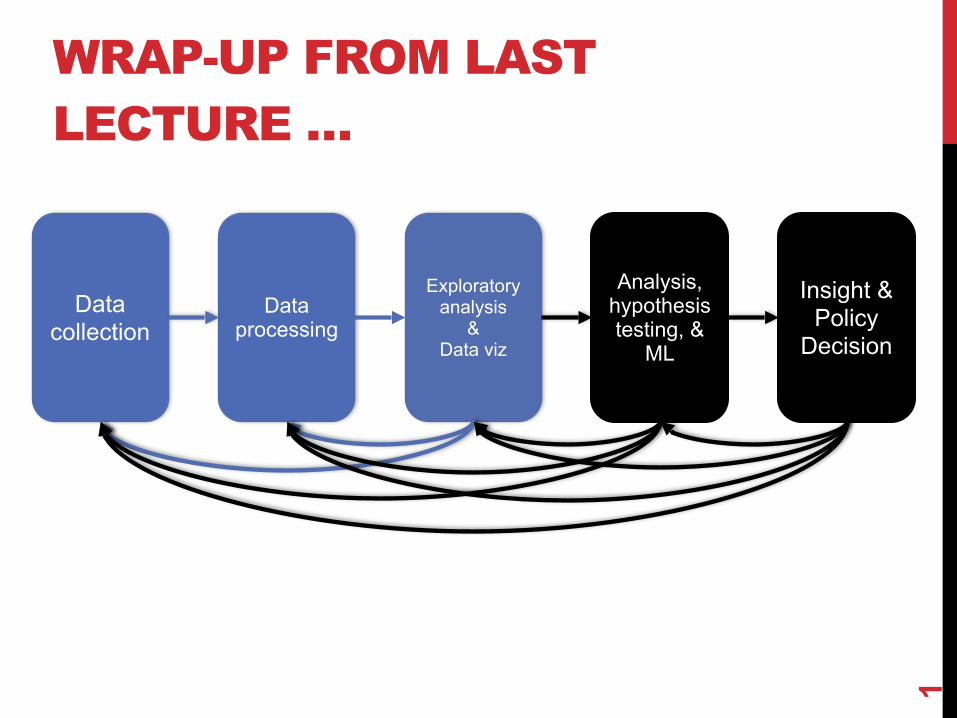
WRAP-UP FROM LAST LECTURE …
Data collection
Data processing
Exploratory analysis
& Data viz
Analysis, hypothesis testing, &
ML
Insight & Policy
Decision
1

DISCRETE TO CONTINUOUS VARIABLESSome models only work on continuous numeric data Convert a binary variable to a number ??????????? • health_insurance = {“yes”, “no”} ! {1, 0} Why not {-1, +1} or {-10, +14}? • 0/1 encoding lets us say things like “if a person has healthcare
then their income increases by $X.” • Might need {-1,+1} for certain ML algorithms (e.g., SVM)
2

DISCRETE TO CONTINUOUS VARIABLESWhat about non-binary variables? My main transportation is a {BMW, Bicycle, Hovercraft} One option: { BMW ! 1, Bicycle ! 2, Hovercraft ! 3 } • Problems ?????????? One-hot encoding: convert a categorical variable with N values into a N-bit vector: • BMW ! [1, 0, 0]; Bicycle ! [0, 1, 0]; Hovercraft ! [0, 0, 1]
3
# Converts dtype=category to one-hot-encoded colscols = [‘BMW’,’Bicycle’,’Hovercraft’]df = pd.Series(cols)df = pd.get_dummies( df )

CONTINUOUS TO DISCRETE VARIABLESDo doctors prescribe a certain medication to older kids more often? Is there a difference in wage based on age? Pick a discrete set of bins, then put values into the bins Equal-length bins: • Bins have an equal-length range and skewed membership • Good/Bad ???????? Equal-sized bins: • Bins have variable-length ranges but equal membership • Good/Bad ????????
4

BIN SIZES
5http://www.hcbravo.org/IntroDataSci/bookdown-notes/eda-data-transformations.html
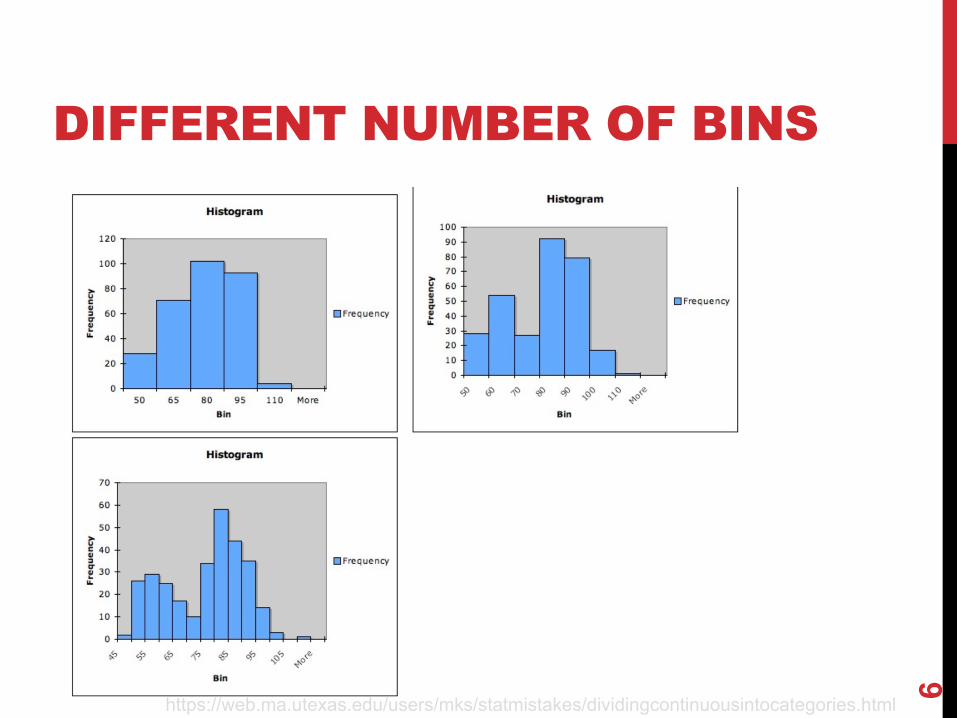
DIFFERENT NUMBER OF BINS
6https://web.ma.utexas.edu/users/mks/statmistakes/dividingcontinuousintocategories.html
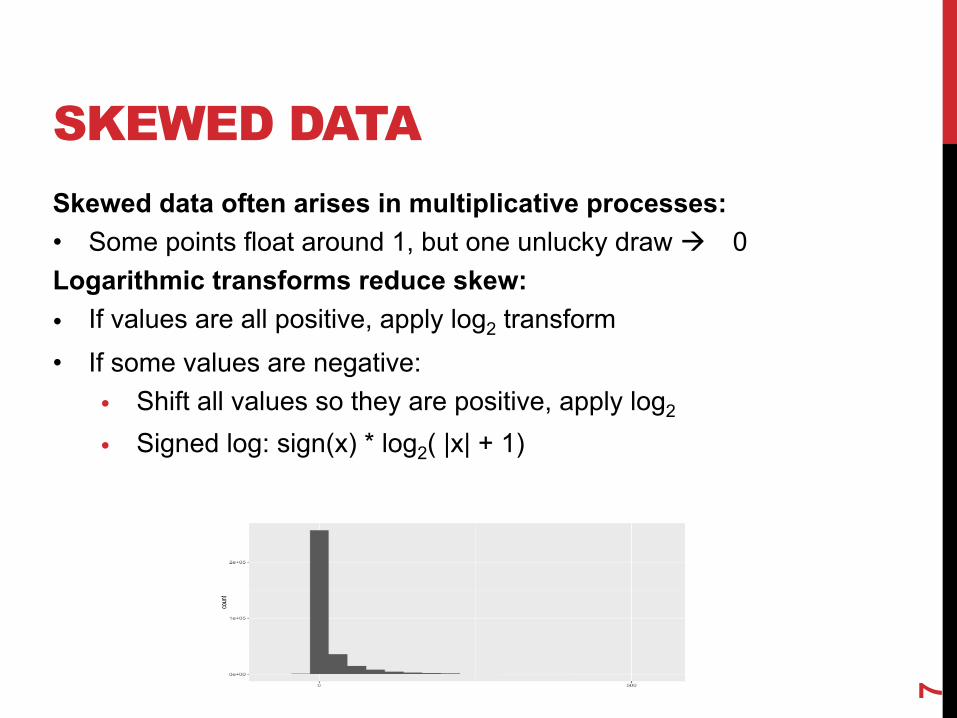
SKEWED DATASkewed data often arises in multiplicative processes: • Some points float around 1, but one unlucky draw ! 0 Logarithmic transforms reduce skew: • If values are all positive, apply log2 transform • If some values are negative:
• Shift all values so they are positive, apply log2
• Signed log: sign(x) * log2( |x| + 1)
7

SKEWED DATA
8
log2 transform on airline takeoff delays

HISTOGRAM BINS AND WIDTHS
Square formula
Sturges formula
Rice formula
Scott formula
Freedman-Diaconis formula
9
bins = n binwidth =max(valuees) − min(values)
n
bins = ceil(log2n) + 1 binwidth =max(valuees) − min(values)
ceil(log2 n) + 1
bins = 2 × n1/3 binwidth =max(valuees) − min(values)
bins
bins =max(values) − min(values)
3.5 × stdev(valuesn1/3
binwidth = 3.5 ×stdev(values
n1/3
bins =max(values) − min(values)
2 × IQR(values)n1/3
binwidth = 2 ×IQR(values)
n1/3
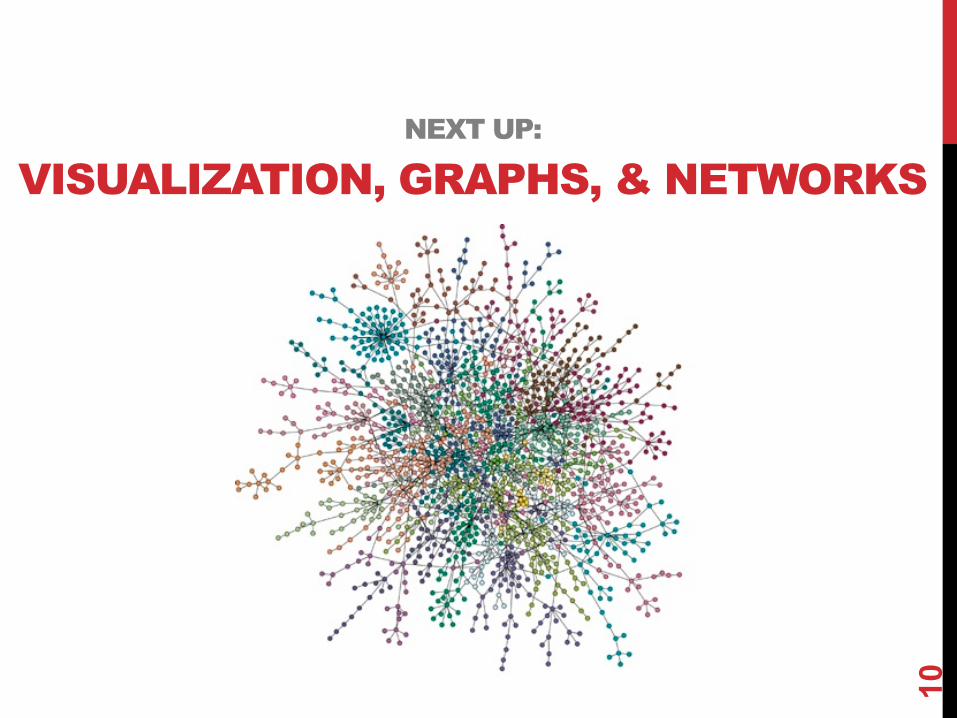
NEXT UP:
VISUALIZATION, GRAPHS, & NETWORKS
10

AND NOW!Graph Processing • Representing graphs • Centrality measures • Community detection Natural Language Processing • Bag of Words, TF-IDF, N-grams • (If we get to this today …) Thank you to: Sukumar Ghosh (Iowa), Lei Tang (Yahoo!), Huan Liu (ASU), Zico Kolter (CMU)
11
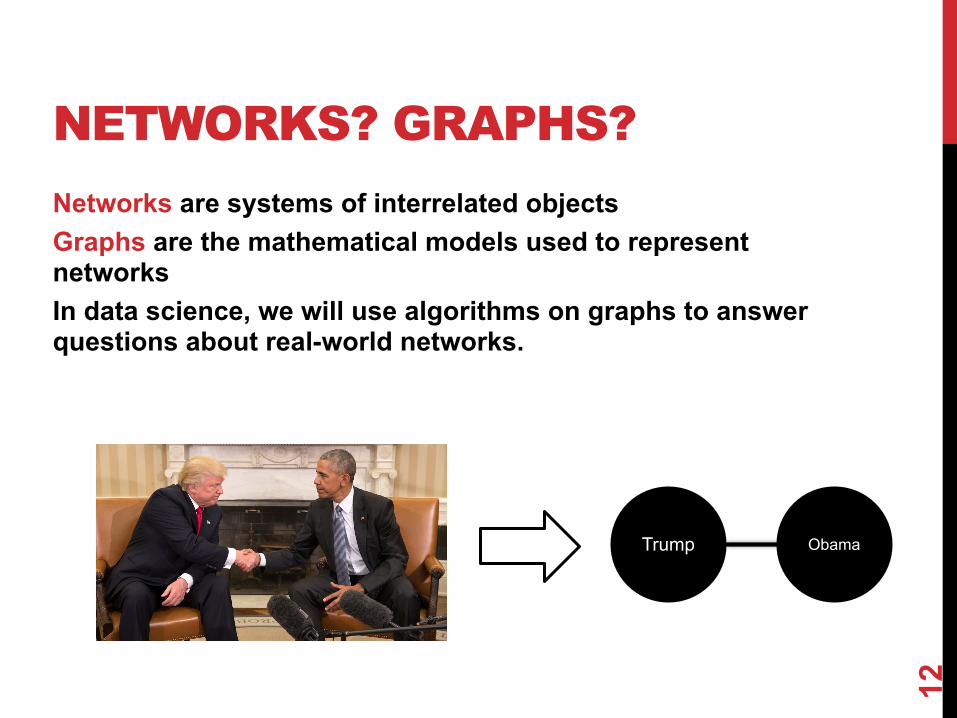
NETWORKS? GRAPHS?Networks are systems of interrelated objects Graphs are the mathematical models used to represent networks In data science, we will use algorithms on graphs to answer questions about real-world networks.
12
Trump Obama

GRAPHSA graph G = (V,E) is a set of vertices V and edges E Edges can be undirected or directed
13
C
B D
A
V = {A, B, C, D} E = {(A,B), (B,C), (C,D), (A,C)}
C
B D
A
V = {A, B, C, D} E = {(A,C), (C,A), (B,C), (B,D)}
Examples of directed vs undirected graphs ????????????
Nodes = Vertices Edges = Arcs

GRAPHSEdges can be unweighted or weighted • Unweighted ! all edges have unit weight
14
C
B D
A C
B D
A
Unweighted Weighted
1
244
Examples of unweighted and weighted graphs ????????????

GRAPHS AND THE NETWORKS THEY REPRESENT
15http://thepoliticsofsystems.net/category/network-theory/
Facebook posts (in black), and users liking or commenting on those posts
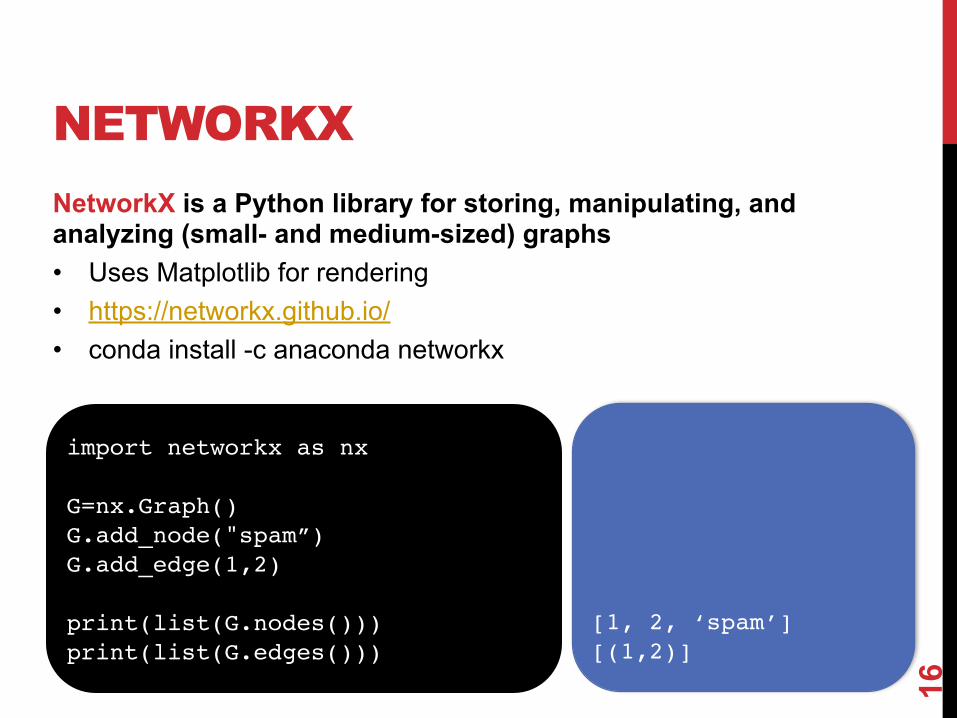
NETWORKXNetworkX is a Python library for storing, manipulating, and analyzing (small- and medium-sized) graphs • Uses Matplotlib for rendering • https://networkx.github.io/ • conda install -c anaconda networkx
16
import networkx as nx
G=nx.Graph()G.add_node("spam”)G.add_edge(1,2)
print(list(G.nodes()))print(list(G.edges()))
[1, 2, ‘spam’][(1,2)]

STORING A GRAPHThree main ways to represent a graph in memory: • Adjacency lists • Adjacency dictionaries • Adjacency matrix
The storage decision should be made based on the expected use case of your graph: • Static analysis only? • Frequent updates to the structure? • Frequent updates to semantic information?
17

ADJACENCY LISTSFor each vertex, store an array of the vertices it connects to
Pros: ???????? • Iterate over all outgoing edges; easy to add an edge Cons: ???????? • Checking for the existence of an edge is O(|V|), deleting is hard
18
C
B D
AVertex NeighborsA [C]B [C, D]C [A]D []

ADJACENCY DICTIONARIESFor each vertex, store a dictionary of vertices it connects to
Pros: ????????? • O(1) to add, remove, query edges Cons: ????????? • Overhead (memory, caching, etc)
19
C
B D
AVertex NeighborsA {C: 1.0}B {C: 1.0, D: 1.0}C {A: 1.0}D {}

ADJACENCY MATRIXStore the connectivity of the graph in a matrix
Cons: ????????? • O(|V|2) space regardless of the number of edges Almost always stored as a sparse matrix
20
C
B D
AA B C D
A 0 0 1 0
B 0 0 0 0
C 1 1 0 0
D 0 1 0 0
From
To

NETWORKX STORAGENetworkX uses an adjacency dictionary representation • Built-ins for reading from/to SciPy/NumPy matrices
21
# Make a directed 3-cycleG=nx.DiGraph()G.add_edges_from([(‘A’,’B’), (‘B’, ‘C’), (‘C’, ‘A’)])
# Get all out-edges of vertex ’B’print(G[‘B’])
# Loop over verticesfor v in G.nodes(): print(v)
# Loop over edgesfor u,v in G.edges(): print(u, v)

ASIDE: GRAPH DATABASESTraditional relational databases store relations between entities directly in the data (e.g., foreign keys) • Queries search data, JOIN over relations Graph databases directly relate data in the storage system using edges (relations) with attached semantic properties
22Image thanks to Wikipedia

EXAMPLE GRAPH DATABASETwo people, John and Sally, are friends. Both John and Sally have read the book, Graph Databases.
23Thanks to: http://neo4j.com
Nodes ?????????? • John • Sally • Graph Databases

EXAMPLE GRAPH DATABASETwo people, John and Sally, are friends. Both John and Sally have read the book, Graph Databases.
24
Labels ?????????? • Person • Book
A named construct that groups nodes into sets
Next: assign labels to the nodes

EXAMPLE GRAPH DATABASETwo people, John and Sally, are friends. Both John and Sally have read the book, Graph Databases. Relationships ???????? • John is a friend of Sally; Sally is a friend of John • John has read Graph Databases; Sally has read Graph
Databases
25

EXAMPLE GRAPH DATABASECan associate attributes with entities in a key-value way • Attributes on nodes, relations, labels
26

EXAMPLE GRAPH DATABASEQuerying graph databases needs a language other than SQL Recall: graph databases explicitly represent relationships • Adhere more to an object-oriented paradigm • May be more suitable for managing ad-hoc data • May scale better, depending on the query types (no JOINs)
27
# When did Sally and John become friends?MATCH (sally:Person { name: 'Sally' })MATCH (john:Person { name: 'John' })MATCH (sally)-[r:FRIEND_OF]-(john)RETURN r.since AS friends_since
Cypher query

BULBFLOWMany graph databases out there: • List found here: https://en.wikipedia.org/wiki/Graph_database neo4j and Titan are popular, easy-to-use solutions • https://neo4j.com/ • http://titan.thinkaurelius.com/ Bulbflow is a Python framework that connects to several backing graph-database servers like neo4j • http://bulbflow.com/ • https://github.com/espeed/bulbs
28