diffusion strategy of green technology and green …
TRANSCRIPT

DIFFUSION STRATEGY OF GREEN TECHNOLOGY AND GREEN INDUSTRY IN AFRICA
A Study of Renewable Energy Technology Market and Energy Efficiency Adoption in Maize and Cassava Processing Industries in Kenya and Nigeria


DIFFUSION STRATEGY OF GREEN TECHNOLOGY AND GREEN INDUSTRY IN AFRICAA Study of Renewable Energy Technology Market and Energy Efficiency Adoption in Maize and Cassava Processing Industries in Kenya and Nigeria
May 2014
UNIDO UNU-MERIT

COVER PHOTO: SHUTTERSTOCK

I I I
List of tables vList of figures viAbbreviations and Acronyms viiiAcknowledgements xi
ExECUTIVE SUMMARy xii
1. INTRODUCTION 1 1.1 Background of the study 1 1.2 Research objectives 3 1.3. Research questions 4 1.4. Research sample 4 1.5. Why the study is of interest 5 1.6. Scope and limitations of the study 5
2. GLOBAL RENEWABLE ENERGY TECHNOLOGY AND GREEN INVESTMENT TRENDS 7 2.1 Overview of global outlook on RET 7 2.2 Growth in global wind generation capacity 10 2.3 Growth in global solar generation capacity 13 2.4. Biomass 15 2.5. Hydro 16 2.6. Geothermal 17 2.7 Renewable energy investments 17 2.8. Financing renewable energy in sub-Saharan Africa 18
3. THEORETICAL UNDERPINNING OF GREEN TECHNOLOGY DIFFUSION IN AFRICA AND SECTORS OF INVESTIGATION 25 3.1. Adoption, innovation and diffusion theories 25
3.2. The System of Innovation perspective 27 3.3. Agro-industry and green technology investment 30 3.4. Cassava and maize value chains 32
4. RESEARCH METHODOLOGY AND STUDY AREA 45 4.1. Study area 45 4.2. Sources of data and methods of data collection 48 4.3. Sampling procedure 49 4.4. Methods of data analysis 54
Contents

DIFFUSION STRATEGY OF GREEN TECHNOLOGY AND GREEN INDUSTRY IN AFRICA
IV
5. EMPIRICAL ANALYSIS OF GREEN TECHNOLOGY DIFFUSION IN AFRICA 55 5.1. Status and potentials of RETs and EE adoption in Africa 55 5.2. Status and potentials of RETs and EE adoption in Nigeria and Kenya 56 5.3. Overview of the policy for promoting RETs and EE diffusion
and adoption in Nigeria and Kenya 67 5.4. Innovation system for RE and EE technology diffusion
in Nigeria and Kenya’s agro-industry 72
6. RET SUPPLY AND MARKETING IN NIGERIA AND KENYA 85 6.1. Types, origin and development of RETs 85 6.2. Clients and markets for RETs 91 6.3. Technology development and innovation 95 6.4. Finance for RETs 99 6.5. Areas of possible government intervention in RET markets 107 6.6. Use of RETs by cassava and maize processing firms 110
7. ADOPTION OF ENERGY EFFICIENCY MEASURES IN NIGERIAN AND KENYAN AGRO-INDUSTRY 113
7.1. Employment generation, capacity utilization and sales turnover of firms 113
7.2. Adoption of EE measures 118 7.3. Finance of EE measures 122 7.4. Energy efficiency projects and their impacts 125 7.5. Factors facilitating or restraining adoption of EE measures 131
8. CASE STUDIES OF RET AND EE ADOPTION BY FIRMS 137 8.1. Nigerian cases 137 8.2. Kenyan cases 149 9. TECHNICAL COOPERATION FOR GREEN TECHNOLOGY DIFFUSION 163 9.1. Development aid model 163 9.2. Development finance institutions based models 165 9.3 South-South cooperation models 167 9.4 Intra Africa cooperation 169 9.5 The Going Out Model 170 9.6 Enterprises’ initiatives 176 9.7. Outlook for technical cooperation for the diffusion
of RE and EE technologies 178

V
10. CONCLUSIONS AND POLICY RECOMMENDATIONS 185 10.1. Conclusions 185 10.2. Policy recommendations 196
REFERENCES 225
APPENDICES 230Appendix 3.1: Interview guide for CERD RET experts in Nigeria 230Appendix 4.1: Questionnaire about RET supplier market 231Appendix 4.2: Questionnaire about adoption of EE and RET in
Kenya and Nigeria 240Appendix 9.1: Potential cooperation projects in Kenya 250Appendix 9.2: Potential cooperation projects in Nigeria 255Appendix 9.3: Technical cooperation guidelines in Nigeria and Kenya
for a technology advanced economy 258Appendix 9.4: Examples of UNIDO technical cooperation – Development
Aid Model 263
LIST OF TABLESTable 1.1: Regional distribution of number of countries with the highest
potential for renewable energy 3Table 2.1: Global renewable power capacity by 2030 in recent scenario 9Table 2.2: The shares of RET in Africa’s electricity mix in different scenarios 10Table 2.3: Globally installed wind power capacity – regional distribution 11Table 2.4: Summary of external financial flows and tax receipts in Africa (2002-12) 19Table 2.5: Selected list of ongoing or recently concluded RE projects in Kenya 22Table 3.1: Global trends in the cassava value chain 36Table 4.1: Key features of Nigeria’s cassava processing firms included in case study 53Table 4.2: Key features of Kenyan maize processing firms included in case study 54Table 5.1: Renewable energy resources in Nigeria 60Table 5.2: Renewable energy sources in Kenya 65Table 5.3: Kenya’s committed and ongoing energy projects 66Table 6.1: Time of establishment of RETs marketing firms,
development and employment 87Table 6.2: Preferred sources of RETs and quality of technology 90Table 6.3: Percentage breakdown of RETs sold to different sectors
of the economy in 2012 92Table 6.4: Situation analysis of sales of RETs since 2007 and expectation for 2018 93Table 6.5: Barriers to RETs adoption 94Table 6.6: Involvement in research on RETs products improvements 96

DIFFUSION STRATEGY OF GREEN TECHNOLOGY AND GREEN INDUSTRY IN AFRICA
VI
Table 6.7: Distribution of respondents by types of maintenance and provision of technical support to clients 97
Table 6.8: Provision of technical support and product guarantee for clients 98Table 6.9: Factors facilitating RETs marketing 99Table 6.10: Benefit derived from subsidies by RETs marketers 100Table 6.11: Provision of financial support to clients 101Table 6.12: Current sales of RETs and expected sales in the next 5 years 102Table 6.13: Expected sales of RETs to various submarkets in the
next 5 years (energy industry, manufacturing, government agencies) 104Table 6.14: Expected sales of RETs to various submarkets
(NGOs, farmers, households) 105Table 6.15: Change in RET sales in the last 2 years 106Table 6.16: Possible areas of government intervention in RETs marketing 107Table 6.17: Factors constraining the use of RETs by cassava processing firms 111Table 6.18: Foreign companies’ assistance with the use of RETs 112Table 7.1: Basic characteristics of the respondent firms 116Table 7.2: Firm’s average production hours per day using power supply
from public utilities 117Table 7.3: Distribution of EE measures employed by the sampled c
assava processing firms 118Table 7.4: Energy efficiency improvement measures in the last 5 years 121Table 7.5: Mode of financing EE measures 123Table 7.6: Programme of energy auditing and impact of EE project 125Table 7.7: Sources and components of EE projects 128Table 7.8: Visitations on EE advice 130Table 7.9: Factors affecting the adoption of EE measures 131Table 7.10: Visits to firm by others encourage adoption 133Table 7.11: Usefulness of supports for EE measures and knowledge spillovers 133Table 7.12: Importance of consultancy /external advisors for EE project success 134Table 7.13: Results of Pearson Product Moment Correlation for EE technology adoption 135
LIST OF FIGURESFigure 2.1: Share of primary energy sources in world energy demand 8Figure 2.2: Global cumulative renewable energy capacity 8Figure 2.3: Growth rate in wind power capacity in the world, 1995 to 2010 10Figure 2.4: Evolution of global wind power capacity, 1996 to 2012 11Figure 2.5: Wind power installed capacity by African countries 13

VII
Figure 2.6: Global PV cumulative installed capacity (MW) 14Figure 2.7: Summary of share of infrastructure funding in Africa between 2008-2010 23Figure 3.1: Different adopter groups of innovation 27Figure 3.2: Cassava tuber 35Figure 3.3: Cassava marketing opportunities 35Figure 3.4: A Simplified example of cassava value chain 37Figure 3.5: Kenya’s maize production compared to other leading
producers and Nigeria (tonnes) 39Figure 3.6: Kenya’s maize production trends 40Figure 3.7: Value chain, a typical good harvest year 42Figure 3.8: Value chain, a less typical deficit year 43Figure 4.1: Regions in Nigeria (cassava firms) where survey took place (coloured) 50Figure 4.2: Regions in Kenya (maize processors) where survey took place (coloured) 51Figure 5.1: Share of primary energy sources in African electricity generation 56Figure 5.2: Distribution of total energy consumption in Nigeria in 2010 60Figure 5.3: Distribution of total energy consumption in Kenya, 2013 61Figure 5.4: Electric power generation sources in Kenya, 2013 64Figure 5.5: Main sources of manufacturing equipment 75Figure 5.6: Source of energy efficiency technology used 75Figure 5.7: Development of technology content of RETs sold by respondents (%) 77Figure 5.8: Mode RET technology supply by RET marketers in Kenya 77Figure 5.9: Type of organization involved in successful EE project 81Figure 6.1: Distribution of RET markets in research sample 85Figure 6.2: Development of technology content of RETs sold by respondents (%) 89Figure 6.3: Origin of RETs sold by respondent firms 91Figure 6.4: Factors responsible for expected RETs sales growth in the next 5 years 103Figure 6.5: Best possible measures policy makers/government
can take to stimulate RET market 108Figure 7.1: Capacity utilization of research sample firms (percentage) 115Figure 7.2: Distribution of EE measures employed by the sampled cassava
processing firms 119Figure 7.3: Firms’ perception of importance of reducing energy costs 124Figure 7.4: Organizations involved in successful EE project 126Figure 7.5: Sources of EE technology used 129Figure 9.1: Distribution of Concessional Loans from China by 2009 172Figure 9.2: Technology cooperation mechanisms 179

DIFFUSION STRATEGY OF GREEN TECHNOLOGY AND GREEN INDUSTRY IN AFRICA
VII I
ADP Agricultural Development ProjectAFREPREN African Energy Policy Research
NetworkAtRE Access to Renewable Energy ATA Agricultural Transformation AgendaCBN Central Bank of NigeriaCEDP Cassava Enterprise Development
ProjectCDM Clean Development MechanismCMTDC Cassava Market and Trade
Development CorporationCPS Current Policies ScenarioCREDC Community Research and
Development CentreCVC Cassava Value ChainDARE Developmental Association for
Renewable EnergyDEEM Database of Energy Efficiency
MeasuresECN Energy Commission of NigeriaEE Energy EfficiencyEEU Energy Efficiency UnitETP Energy Technology PerspectivesEPS Efficient World ScenarioFAO Food and Agriculture Organization of
the United Nations FDI Foreign Direct InvestmentFGN Federal Government of Nigeria FiT Feed in TariffFME Federal Ministry of EnvironmentGEF Global Environment FacilityGHGs Greenhouse Gases HQCF High Quality Cassava Flour ICEED International Centre for Energy
Environment and DevelopmentIEA International Energy AgencyIFAD International Fund for Agricultural
DevelopmentIITA International Institute of Tropical
AgricultureIRENA International Renewable Energy
AgencyKEEI Korea Energy Economics InstituteKNBS Kenya National Bureau of StatisticsLGAs Local Government AreasMDGs Millennium Development GoalsMEPS Minimum Energy Performance
StandardsNEEDS National Economic Empowerment and
Development StrategyNEP National Energy PolicyNGO Non-Governmental OrganizationNBS National Bureau of StatisticsNCAM National Centre for Agriculture
MechanizationPHCN Power Holding Company of NigeriaNPS New Policies ScenarioPHCN Power Holding Company of NigeriaPIND Partnership Initiatives in the Niger
DeltaREEEN Renewable Energy and Energy
Efficiency NetworkPREEEN Promoting Renewable Energy and
Energy Efficiency in NigeriaREN21 Renewable Energy Policy Network for
the 21st CenturyREEP Renewable Energy and Energy
Efficiency PartnershipREMP Renewable Energy Master PlanRETs Renewable Energy TechnologiesR&D Research and Development RTEP Roots and Tubers Expansion
ProgrammeS&L Standard and LabelSMEs Small and Medium Enterprises
Abbreviations and Acronyms
IX
SMEIS Small and Medium-sized Enterprises Investment Scheme
UNDP United Nations Development Programme
UNIDO United Nations Industrial Development Organization
UNU-MERIT United Nations University -
Maastricht Economic and Social Research Institute on Innovation and Technology
VAT Value-added TaxWEO World Energy Outlook

XI
AcknowledgementsThis report was prepared by a team of UNU-MERIT researchers and UNIDO under the overall guidance of Ludovico Alcorta, Director of the Development Policy, Statistics and Strategic Research Branch of UNIDO. The UNU-MERIT research team included René Kemp (team leader), John O. Adeoti, Jacinta Ndichu, Abiodun E. Obayelu, Julian Blohmke, Raphael Kaplinsky and Kevin Urama. Byung Nae yang, UNIDO Senior Green Growth Adviser, was the research project manager, and Ah-young Lee, also from UNIDO, provided support during the production of the final report and this publication.
We would like to express special thanks to the Korea Energy Economics Institute (KEEI) for its generous financial contribution. We are also grateful for the continued support from Namil Kim and Woonam Seok of KEEI.
We would like to extend our sincere gratitude to the company directors and production managers who provided data and agreed to be interviewed for the survey of cassava and maize processing firms in Nigeria and Kenya, respectively. We would also like to thank the Kenyan policymakers who participated in the policy dialogue; the Nigerian Minister of Energy, Prof. Chinedu O. Nebo, for providing insights into the renewable energy policy perspectives in Nigeria; and Prof. J.F.K. Akinbami and Dr. Abiodun Momodu of the Centre for Energy Research and Development, Obafemi Awolowo University, Ile-Ife, for agreeing to be interviewed on renewable energy research and the policy context in Nigeria. We gratefully acknowledge the strenuous efforts of the field research teams in the course of the survey: Odunayo Adebayo, Femi Popoola and Tope Omirin (in Nigeria) and Virginia Njoki Wango, Josphat Korir, Jack Okomo and Josphat Mokaya (in Kenya). We thank the participants who attended the workshop at UNIDO in Vienna in August 2013: Jae Hong Suh of the Korea Photovoltaic Industry Association, Zhen Wang and Michele Clara of UNIDO.
The researchers would also like to thank all UNIDO colleagues for their invaluable inputs and substantive guidance: Francis Bartels, Kolade Olaoluwa Esan, Jossy Thomas, and especially Diego Masera and Sunyoung Suh.
Niki Rodousakis, UNIDO staff member, provided editorial assistance in finalizing the manuscript for publication and Iguaraya Saavedra provided administrative support.

DIFFUSION STRATEGY OF GREEN TECHNOLOGY AND GREEN INDUSTRY IN AFRICA
XII
There is increasing evidence that the fossil fuel-based economy has its limits. The world needs to decrease its fossil fuel use and find new engines for economic growth by investing in green technologies and industries. A technological transformation that includes the use of renewable energy (RE) and energy efficiency (EE) technologies is an essential element of a green growth strategy aimed at reducing industry’s carbon intensity. This report presents the findings of a comprehensive study that examines the status of sales and investment in RE and EE technologies (RET) in Nigeria and Kenya: their sources, potential, drivers and barriers. The study of RETs investigates RET markets and diffusion, while the study on the adoption of EE technologies focuses on micro-, small- and medium-sized enterprises in two agro-industry sub-industries: cassava processing in Nigeria and maize processing in Kenya.
The study’s methodological approach builds on an extensive documentary review of global RE investment trends and prospects, and original data collection from two surveys: a survey of RET suppliers/marketers and a survey of the adoption of EE measures among cassava processors in Nigeria and maize processors in Kenya. The sample of firms included in the survey analysis consists of 22 RET suppliers/marketers and 62 cassava processing firms in Nigeria, and 41 RET suppliers/marketers and 40 maize processing firms in Kenya. In the report, we compare the results for the Nigerian RET marketers with those in Kenya; likewise, the results of the EE adoption analysis for cassava processing companies are compared with those of maize millers. The comparative element helps to delineate national and cross-sectoral differences. The study also includes 12 mini cases of RET supply and adoption and EE adoption (six in Nigeria and six in Kenya).
The findings of the study reveal that the diffusion of RE and EE technologies in Africa and other developing economies depends, to a large extent, on existing government policies and regulatory conditions. The results also confirm the notion that the market for RE and EE technologies in Africa is relatively underdeveloped and that government policies are important because of their capacity for creating an enabling environment for the diffusion of green technologies, especially through the mobilization of critical resources, encouragement/incentives for private sector involvement, and the facilitation of development cooperation activities. Some of the key findings of the study include:
ExECutivE SummAry

XII I
EXECUTIVE SUMMARY
• The RET industry in the two countries is young and growing. Solar and biomass are among the biggest RET markets, with solar PV based on foreign technology and biomass mostly based on domestic technology and know-how.
• The foreign components of both RE and EE technologies derive mainly from China, and to a lesser extent from India. Foreign technology needs to be better adapted to African requirements and African technology needs to be updated. Technical cooperation should be based on this factor.
• Energy costs are a significant cost factor for many agro-industrial industries, and only companies have adopted sophisticated EE measures. The main reason for this is that the system of innovation for energy efficiency is weakly developed.
• The major factor facilitating the sale of RETs is the unreliable and sporadic power supply in Nigeria; in Kenya, the volatility of the foreign exchange rate acts as a positive stimulus for RET deployment as changes in the exchange rate affect electricity utility costs.
• The most influential drivers of EE technology adoption are similar in both countries. The key drivers and facilitating factors for the adoption of EE measures by cassava and maize processors are in-house knowledge about energy management, the availability of technical expertise, and the desire and need to save costs.
• ‘Unfavourable business climate/environment for FDI and high tariffs’ and ‘lack of technical competence on the part of potential adopters’ are the two most important barriers to the adoption of RETs as perceived by the majority of respondents in the two countries.
• High initial setup costs and high cost of finance are the most important barriers to the adoption of EE measures among cassava processors and maize millers in the two countries.
This study found that there is great interest among African companies and African governments to engage in technical cooperation with foreign companies and research institutes. Such cooperation can assume many forms: education of African students and training of workers, joint research programmes and exchange programmes, technological transfer based on African solutions which are upgraded, and non-African technologies which are adapted to the African context. Technical cooperation should, however, go beyond the transfer of technology and include issues of creating an enabling environment for technological acquisition, finance, education and training. Appendices 9.1 and 9.2 provide specific suggestions of technical cooperation projects that an advanced country may adopt in partnership with Nigeria and Kenya.


1
1. introduCtion1.1 Background of the study
Developing countries face the twin challenge of developing stronger economies through measures such as expanding energy supply, increasing agricultural production and improving transportation systems, while also playing an active role in global efforts to reduce greenhouse gas emissions. If not well managed, there might be trade-offs between these two important objectives in nations’ pursuit of sustainable economic growth. Lim (2010), however, asserts that green growth and poverty reduction do not necessarily entail a trade-off, but may actually lead to valuable synergies.
In a statement issued at the Rio+20 Conference in 2011, the African Union recognizes the benefits and opportunities of the green economy concept for the attainment of its sustainable development objectives such as poverty reduction, employment creation, economic growth and equality. The African Union asserts that the concept should be defined as a framework for sustainable development and highlights African countries’ priorities. In the African context, one should not expect green technologies to be adopted for their greenness or social inclusion benefits, but for their economic benefits. Certain technologies and areas provide such benefits. Examples in the case of agriculture are higher yields from green biotechnology, electricity from renewable sources allowing farmers to pump water for irrigation and better processing of agricultural produce. In areas with geothermal heat and good conditions for creating hydropower stations, RE is potentially cheaper, thus giving it an advantage over fossil fuel-based power. The Green Revolution can be realized in Africa with RE by enhancing the energy supply to and increasing labour productivity in the agricultural sector. Energy savings in energy-dependent industries will produce economic benefits through lower energy costs.
This study investigates the status of renewable energy and energy efficiency technologies and conditions for use in the case of sub-Saharan Africa by looking at markets for renewable energy technologies (RETs) in Nigeria and Kenya and at the adoption of energy efficiency (EE) measures in the cassava and maize processing industries.
In the context of a rapidly growing global market for RETs and the diffusion of EE technologies, this report presents original data on RET suppliers in Kenya
DIFFUSION STRATEGY OF GREEN TECHNOLOGY AND GREEN INDUSTRY IN AFRICA
2
and Nigeria, and on the use of EEs in the cassava processing industry in Nigeria and maize milling in Kenya. The study was underpinned by the desire to better understand the markets for RET and EE and possible models for technical cooperation based on an assessment of the need for technical assistance from the perspectives of African companies.
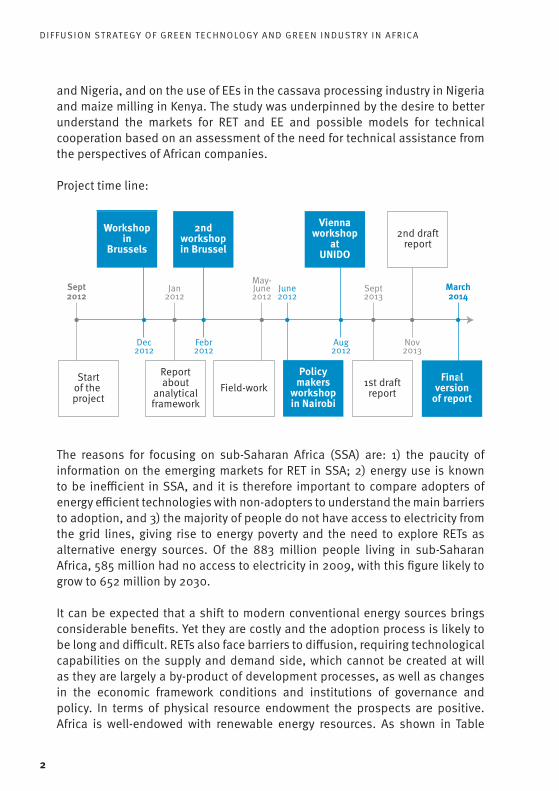
Project time line:
The reasons for focusing on sub-Saharan Africa (SSA) are: 1) the paucity of information on the emerging markets for RET in SSA; 2) energy use is known to be inefficient in SSA, and it is therefore important to compare adopters of energy efficient technologies with non-adopters to understand the main barriers to adoption, and 3) the majority of people do not have access to electricity from the grid lines, giving rise to energy poverty and the need to explore RETs as alternative energy sources. Of the 883 million people living in sub-Saharan Africa, 585 million had no access to electricity in 2009, with this figure likely to grow to 652 million by 2030.
It can be expected that a shift to modern conventional energy sources brings considerable benefits. yet they are costly and the adoption process is likely to be long and difficult. RETs also face barriers to diffusion, requiring technological capabilities on the supply and demand side, which cannot be created at will as they are largely a by-product of development processes, as well as changes in the economic framework conditions and institutions of governance and policy. In terms of physical resource endowment the prospects are positive. Africa is well-endowed with renewable energy resources. As shown in Table
Sept2012
Dec2012
Jan2012
Febr2012
May-June2012
June2012
Aug2012
Sept2013
Nov2013
March2014
Workshopin
Brussels
2ndworkshopin Brussel
Policymakers
workshopin Nairobi
Viennaworkshop
atUNIDO
Finalversion
of report
Reportabout
analyticalframework
1st draftreport
2nd draftreport
Startof the project
Field-work

3
1.1, it is estimated that 18 of the top 35 developing countries ranked highest in renewable energy potential are located in Africa.
Table 1.1: Regional distribution of the number of countries with the highest potential for renewable energy
RegionTotal Re-newable Energy
Solar Wind HydroGeother-
mal
Africa 18 24 8 11 9East Asia/Pacific 4 5 3 6 4Europe/Central Asia 3 0 6 5 14Latin America/Caribbean 7 5 8 9 3Middle East 1 0 1 0 0South Asia 0 0 1 1 0All World Bank Regions* 33 34 27 27 30Source: Buys et al. (2007). * 188 countries [taken from AfDB WPS 170]
The global market for RETs is large and growing rapidly. Investments in 2012 amounted to USD 244 billion for renewable energy power and fuels excluding large scale hydroelectric projects (UNEP, 2013). Total investments in developing economies rose by 19 percent in 2012 to USD 112 billion, while investments in developed countries dropped 29 percent to USD 132 billion. Information on RET investments in Africa is limited, and warrants a closer look at the sources, drivers and barriers to the diffusion of RETs and EE technologies.
1.2 Research objectives
The gneneral objective of the study is to analyse the status of sales and investments in energy efficiency (EE) and renewable energy technologies (RETs) in Nigeria and Kenya: their sources, potential, drivers and barriers.
The specific objectives are:• To identify the different forms and sources of energy efficiency (EE) and
renewable energy technologies (RETs) use along the value chains of cassava and maize processing, as well as the existing laws, rules and regulations guiding EE and RET investments in Nigeria and Kenya;
• To analyse the status, extent and potentials of EE and RET diffusion in Nigeria and Kenya with a focus on the cassava and maize value chains
1. INTRODUCTION

DIFFUSION STRATEGY OF GREEN TECHNOLOGY AND GREEN INDUSTRY IN AFRICA
4
in the two countries;• To examine factors that facilitate the choice and adoption of EE and RET
in the cassava/ maize processing industry in the selected countries;• To analyse the constraints/barriers to the RET market and EE measures
in Nigeria and Kenya, specifically in the cassava and maize agro-industrial system;
• To estimate the willingness of agro-processors to invest in EE technologies and RETs;
• To examine possibilities for technical cooperation.
1.3. Research questions
These objectives are studied with the help of the following research questions:• What are the trends in RET deployment and investment across various
world regions, and how does investment in SSA compare with these global trends?
• What are the existing energy policies in selected African countries illustrated by Nigeria and Kenya?
• What are the various forms and sources of EE and RETs use along cassava value chains in Nigeria and maize value chains in Kenya?
• What is the extent of the development of green industry in Africa, and what is the status of green technology adoption?
• What are the factors determining the choice and adoption of EE and RETs?
• What are the constraints/barriers to import and sales of RETs and EE measures?
• Are agro-processors and marketers willing to invest more in EE measures and RETs?
• Is there a need for technical cooperation in RET and EE? If so, what forms can this take?
The research questions are assessed against the background of both global RETs and green investment trends, of the potential for RETs in Africa, and the drivers and barriers to RETs and EE diffusion. The project draws on literature on diffusion and the adoption of new technologies, innovation systems, and global value chains. Local and global aspects of value chains and innovation are introduced into the analysis, helping us understand the indigenous and foreign sources of knowledge and technology, the ways in which national policies act as a barrier or driver, and the need for financial assistance, technology transfer and technical cooperation.

5
1.4. Research sample
The sample of firms included in the survey consisted of 22 RET suppliers/distributors and 62 cassava processing firms in Nigeria, and 41 RET suppliers and 40 maize millers in Kenya. In the study, we compare the results for the Nigerian RET suppliers/distributors with those in Kenya. The results of the EE adoption analysis for cassava processing companies are compared with those of maize millers. The comparative element helps delineate national and cross-sectoral differences. The study also includes 12 mini cases of RET supply and adoption and EE adoption (six in Nigeria and six in Kenya).
1.5. Why the study is of interest
Answers to the research questions are relevant from the point of view of national governments interested in dealing with energy poverty, industrial development, greening of industry and environmental protection. The results will help international organizations like UNIDO and bilateral donors such as the Republic of Korea better understand the possibilities for green industrial development in Africa, based on an analysis of drivers and barriers/obstacles to the adoption and marketing of EE and RETs in African countries in general, and in Kenya and Nigeria in particular. It will also help national governments and agencies in Africa and beyond to develop measures that promote green investments in Africa, based on identified barriers. The measures may take various forms: energy efficiency regulations, subsidies for RET deployment, feed-in tariff systems, training, education and research programmes, technical assistance activities, and extension services offered by special agencies.
1.6. Scope and limitations of the study
A study of African industry that covers all sectors and many countries is ideal for a full-scale study of green technology diffusion in African industry. However, the time and resources available for this study did not suffice. Moreover, a focus on critical industries(s) and selected countries was considered adequate for this study which was exploratory in nature. The scope of the study was thus limited to the use of EE measures and RETs in agro-industry (cassava and maize) in selected African countries. Agro-industry is an important feature of virtually every sector of the African economy through value addition and inter-linkages of critical value chains. In Africa, agro-industry mainly comprises small-, micro- and medium-sized enterprises (SMMEs). Green technology applications in the
1. INTRODUCTION

DIFFUSION STRATEGY OF GREEN TECHNOLOGY AND GREEN INDUSTRY IN AFRICA
6
form of mini-hydro, biomass energy sources, photovoltaic (solar panels) in agro-processing and value chain efficiency in Africa are not diverse and are amenable to comparative analysis of selected country cases. This study therefore only covers two countries: Kenya and Nigeria. Though Nigeria is larger than Kenya in terms of population and size of the economy, the two countries have similarities and are characterized by extensive diversity.
In a follow-up project covering more African countries and an analysis of current policies, we propose to examine these issues more closely in collaboration with UNIDO, national policymakers, development agencies and research institutes, such as KEEI, based on interviews and commissioned position papers by team members and international experts on topics such as policies for capacity development, identifying forms of policy coordination, green industrial policy, innovation portfolios, low-carbon policy instruments, educational reform and international cooperation and technology transfer for green energy and economic development.
7
2. GLoBAL rEnEWABLE EnErGy tECHnoLoGy And GrEEn invEStmEnt trEndS2.1 Overview of global outlook on RET
Based on available data on trends in energy technology capacity generation and investment, various studies have projected that RETs will grow strongly in coming years. The growth of renewable energy markets over the past decade has been accompanied by remarkable technology improvements and cost reductions. However, the new technologies must compete with fossil fuel technologies and depend on the overall evolution of demand. A common way to investigate the diffusion of energy technologies is through the use of model-based scenarios, offering a systematic exploration of possible energy futures. In this respect, the World Energy Outlook (WEO) develops four scenarios for the world energy system: the “Current Policies Scenario”, the “New Policies Scenario” (NPS), the “450 parts per million of carbon-dioxide equivalent Scenario”, and the “Efficient World Scenario”. (IEA, 2012). The NPS details the impact of existing policy commitments and the implementation of those recently announced on key energy demand, supply, trade, investment and emissions trends in the period up to 2035. In this scenario, fossil fuel subsidies will have been phased out by 2020 in all net energy importing countries and more gradually in exporting countries that have announced plans to do so. Apart from this important assumption, other major assumptions include population growth to 8.6 billion by 2035, and an average rate of economic growth in real terms of 3.5 percent per year by 2035. The NPS also predicts that the price of crude oil imports will reach USD125/barrel (in year 2011 dollars), that the price of coal will reach USD115/tonne, and that carbon prices will range from USD 30 to USD45/tonne by 2035.
The WEO 2012 uses the World Energy Model that replicates the dynamics of energy markets based on historical data on economic and energy variables to generate projections. In the NPS, global primary energy demand has been projected to increase by 35 percent between 2010 and 2035. While the share of fossil fuels will decrease from 79 percent in 2020 to 75 percent in 2035 as shown in Figure 2.1, oil, coal, and gas will remain the predominant sources of

DIFFUSION STRATEGY OF GREEN TECHNOLOGY AND GREEN INDUSTRY IN AFRICA
8
energy. Renewable energy sources will continue to grow; from 15 percent of the global primary energy demand in 2020 to 18 percent at the end of 2035.
Figure 2.1: Share of primary energy sources in world energy demand
In terms of renewable installed capacity, the growth of wind power means that the dominance of hydropower will decline. As shown in Figure 2.2, by the end of the outlook period, these two technologies combined will account for nearly three-quarters of total renewable installed capacity. Beyond hydro and wind, solar PV capacity will exceed biomass capacity by 2015, and solar PV will increase by more than 15-fold to reach over 600 GW by 2035. The growth rate of concentrated solar power (CSP or solar thermal) will be significant, but its deployment in terms of capacity will be less significant than for solar PV. Geothermal and ocean remain relatively small, compared to solar, wind, biomass and hydro.
Figure 2.2: Global cumulative renewable energy capacity
0%
20%
40%
60%
80%
100%
Current2010 2020 2035
CurrentNPS 450 450NPS
81 80 79 77 80 75 63
6 6 6 7 5 711
13 14 15 16 14 18 27
RenewablesNuclearFossil fuels
Source: International Energy Agency (IEA) (2012)
0
350030002500200015001000
500
4000450050005500
2010 2020 2035NPS 450 450NPS
OceanSolar Thermal Solar PV Geothermal Wind Biomass Hydro
Source: International Energy Agency (IEA) (2012)
1033 1348 1395 1684 1875
198 135586266
143655303
2521098
602
338
1658
966
219

9
The growth rates in renewable energy deployment reflect the “off-take” phase of RET, demonstrating that RET has become mainstream and that investments and continuous developments in performance and scale have contributed to this (REN21, 2013).
Scenarios until 2035, illustrated in Figure 2.2, show that the trend of RET deployment will continue in the future. Similar scenarios until 2030 developed by other organizations presented in Table 2.1 also suggest an increasing deployment of RETs dominated by hydro and wind power. In Africa, RETs will also grow strongly according to a number of reports. As shown in Table 2.2, RETs will comprise up to 50 percent of Africa’s electricity mix.
Table 2.1: Global renewable power capacity by 2030 in recent scenario
Data source
Renewable power capacity in Gigawatts
Hydro Wind Solar PV CSP Bio-
massGeo-ther-mal
Ocean
Actual 2006 capacity for comparison - 74 8 0.4 45 9.5 0.3
Actual 2011 capacity for comparison 970 238 70 1.8 72 11 0.5
IEA-WEO (2012) “New policies” 1,580 920 490 40 210 40 10
IEA-WEO (2012) “450” 1,740 1,340 720 110 260 50 10IEA-ETP (2012) “205” 1,640 1,400 700 140 340 50 20BNEF GREMO (2011) - 1,350 1,200 260 30 -IEA RETD (2010) “ACES” 1,300 2,700 1,000 120 340 - -
Greenpeace (2012) 1,350 2,900 1,750 700 60 170 180
Note: IEA-WEO = International Energy Agency-World Energy Outlook; ETP = Energy Technology Perspectives; BNEF GREMO= Bloomberg New Energy Finance’s Global Renewable Energy Market Outlook, CSP stands for solar thermal power. Figures for 2030 are rounded to nearest 50 GW from original sources. Hydropower figure for 2011 excludes pure pumped hydro capacity; a comparable figure for 2006 is not available.
Source: REN 21 Feb., 2013
2. GLOBAL RENEWABLE ENERGY TECHNOLOGY AND GREEN INVESTMENT TRENDS

DIFFUSION STRATEGY OF GREEN TECHNOLOGY AND GREEN INDUSTRY IN AFRICA
10
Table 2.2: The shares of RET in Africa’s electricity mix in different scenarios
Scenario Year ShareGreenpeace (2011) energy revolution (South Africa) 2030 50%IRENA (2012) renewables (all Africa) 2030 50%IRENA (2012) renewables (all Africa) 2050 73%Greenpeace (2012) energy revolution (all Africa) 2050 92%GEA (2012) global energy assessment (sub-Saharan Africa) 2050 34 -92%
Note: IRENA = International Renewable Energy Agency Source: REN21, Renewables, Global Futures Report [taken from REN21]
Prospects for diffusion differ strongly between RETs and nations. In sections 2.2 to 2.5, we examine the prospects of various world regions with a special focus on Africa.
2.2 Growth in global wind generation capacity
As shown in Figures 2.3 and 2.4, cumulative wind generation capacity has increased strongly since 2006 (above 20 percent annually), and in Africa, additional capacity has gone online. Table 2.3 presents data on the status of wind generation in selected countries. The largest markets in Africa are Egypt and Morocco, while Ethiopia and Tunisia have also installed significant wind power capacity in 2012. Thirty-five percent of all planned projects are located in South Africa followed by Egypt (27 percent) and Morocco (21 percent).
Figure 2.3: Growth rate in wind power capacity in the world, 1995 to 2010
Capacity (MW)Growth (%)
Grow
th (%
)
Capa
city
(MW
)
Source: World Wind Turbine and Wind Farm Database (taken from AfDB WPS 170)
0
50,000
100,000
150,000
200,000
25,000
0
70
60
50
40
30
20
10
1995
1996
1997
1998
1999
2000
2001
2002
2003
2004
2005
2006
2007
2008
2009
2010

11
Figure 2.4: Evolution of global wind power capacity, 1996 to 2012
Table 2.3: Globally installed wind power capacity – regional distribution
Region Country End 2011 New 2012 Total (end 2012)
Africa & Middle East
Tunisia 54 50 104Ethiopia - 52 52Egypt 550 - 550Morocco 291 - 291Iran 91 - 91Cape Verde 24 - 24Others 23 - 23Total 1,033 102 1,135
Asia
PR China** 62,364 12,960 75,324India 16,084 2,336 18,421Japan 2,536 88 2,614Taiwan 564 - 564South Korea 407 76 483Pakistan 6 50 56Others 109 - 108Total 82,070 15,510 97,570
Europe
Germany 29,071 2,415 31,308Spain 21,674 1,122 22,796UK 6,556 1,897 8,445Italy 6,878 1,273 8,144France** 6,807 757 7,564
2. GLOBAL RENEWABLE ENERGY TECHNOLOGY AND GREEN INVESTMENT TRENDS
0
50,000
100,000
150,000
200,000
250,000
300,000
Period
6,10
0
7,600
10,2
00
13,6
00
23,9
00
17,4
00
31,10
0
39,4
31
47,6
20
59,0
91
74,0
06 93,6
39
120,
267
158,
864
197,6
86 238,
035 28
2,43
0
MW
Source: Global Wind Statistics 2012[GWEC http://www.gwec.net/wp-content/uploads/2013/02/GWEC-PRstats-2012_english.pdf, accessed 23 July 2013
1996
1997
1998
1999
2000
2001
2002
2003
2004
2005
2006
2007
2008
2009
2010
2012
2011

DIFFUSION STRATEGY OF GREEN TECHNOLOGY AND GREEN INDUSTRY IN AFRICA
12
Region Country End 2011 New 2012 Total (end 2012)
Europe
Portugal 4,379 145 4,525Denmark 3,956 217 4,162Sweden 2,899 846 3,745Poland 1,616 880 2,497Netherlands 2,272 119 2,391Turkey 1,806 506 2,312Romania 982 923 1,905Greece 1,634 117 1,749Ireland 1,614 125 1,738Austria 1,084 296 1,378Rest of Europe (3) 3,815 1,106 4,922Total Europe 97,043 12,744 109,581of which EU-27 (4) 94,352 11,895 106,041
Latin America & Caribbean
Brazil 1,431 1,077 2,508Argentina 113 54 167Costa Rica 132 15 147Nicaragua 62 40 102Venezuela - 30 30Uruguay 43 9 52Caribbean (5) 271 - 271Others (6) 229 - 229Total 2,280 1,225 3,505
North America
USA 46,929 13,124 60,007Canada 5,265 935 6,200Mexico 569 801 1,370Total 52,763 14,860 67,576
Pacific RegionAustralia 2,226 358 2,584New Zealand 623 - 623Pacific Islands 12 - 12Total 2,861 358 3,219World total 238,050 44,799 282,587
Notes: 1 Israel, Jordan, Kenya, Libya, Nigeria, South Africa2 Bangladesh, Indonesia, Philippines, Sri Lanka, Thailand, Viet Nam3 Bulgaria, Croatia, Cyprus, Czech Republic, Estonia, Finland, Faroe Islands, FyROM, Hungary, Iceland, Latvia, Liechtenstein,
Lithuania, Luxembourg, Malta, Norway, Romania, Russia, Switzerland, Slovakia, Slovenia, Ukraine4 Austria, Belgium, Bulgaria, Cyprus, Czech Republic, Denmark, Estonia, Finland, France, Germany, Greece, Hungary, Ireland,
Italy, Latvia, Lithuania, Luxembourg, Malta,Netherlands, Poland, Portugal, Romania, Slovakia, Slovenia, Spain, Sweden, UK5 Caribbean: Aruba, Bonaire, Curacao, Cuba, Dominica, Dominican Republic, Guadalupe, Honduras, Jamaica, Martinique6 Colombia, Chile, Ecuador, Peru** Provisional FigureProject decommissioning of approximately 263 MW and rounding affect the final sumsSource: Global Wind Statistics 2012 [GWEC http://www.gwec.net/wp-content/uploads/2013/02/GWEC-PRstats-2012_english.pdf, Accessed 23 July 2013]

13
Figure 2.5: Wind power installed capacity by African countries
As demonstrated by Figure 2.5, wind power generation in the African countries is currently concentrated in Egypt and Morocco, while projects are either ongoing or being planned in South Africa, Kenya and Namibia. Africa’s total installed capacity of wind energy was 1.1 GW in 2011 representing under 1 percent of Africa’s total capacity and with 99 percent of it being installed in Egypt (43 percent), Morocco (42 percent) and Tunisia (14 percent, Tunisia and others)1. Although wind generation sites in Africa are small in size, over 60 percent of either ongoing or planned projects have more than 200 MW with an overall capacity of over 10GW, meaning that the contribution of wind power to the continental energy portfolio is still growing. Nigeria also has ongoing wind power projects in the Northwest region of the country and planned wind projects for the coastal areas. Kenya’s energy portfolio consists of a small installed capacity of 5.1 MW. However, an additional capacity of 510 MW of wind energy is under construction and is expected to go online between 2013 and 20152. Of this capacity, only 20 MW is being developed by a public enterprise with the remainder being developed by four IPPs.
2.3 Growth in global solar generation capacity
As shown in Figure 2.6, Europe is the leading region in terms of cumulative installed capacity of PV technology. It represents roughly 70 percent of the world’s cumulative PV capacity. China, USA and Japan are catching up; 1 Mukasa et al., Development of Wind Energy in Africa. 2 KPLC Annual Report, 2012.
2. GLOBAL RENEWABLE ENERGY TECHNOLOGY AND GREEN INVESTMENT TRENDS
4000
3500
3000
2500
2000
1500
1000
500
0
Capa
city
(MW
)
Source: AfDB 2012 [taken from AfDB WPS 170] * Excluding the planned Sahara Wind Project (5000 MW)
Egyp
t
Mor
occo
*
Sout
h Af
rica
Keny
a
Nam
ibia
Ethi
opia
Djib
outi
Ghan
a
Mau
ritiu
s
Nige
ria
Tanz
ania
Moz
ambi
que
Alge
ria
Mau
ritan
ia
Cape
Verd
e
Eritr
ea
Planned Ongoing Completed

DIFFUSION STRATEGY OF GREEN TECHNOLOGY AND GREEN INDUSTRY IN AFRICA
14
nevertheless, they are still far behind in terms of utilizing their enormous potential.
Concentrated solar power (CSP) is at the verge of rapid development in Africa. Several small CSP power plants have been developed or will become operational in the coming years.3 This is the case especially in Egypt, Algeria and Morocco, where very good solar irradiation enables such technology deployment. The development of large-scale solar projects has yet to take off in sub-Saharan Africa. Interestingly, Mauritania brought the largest solar photovoltaic power plant online on the African continent in April 2013 with an overall capacity of 15 MW.4 Egypt has some 5 MW installed PV capacity while the installed capacities in Kenya are negligible. The use of solar technologies in Kenya by the private sector such as the hospitality industry, institutions and residential homes, has been on the rise and is expected to continue increasing in the future. However, this capacity has not been quantified and therefore remains unknown.
Figure 2.6: Global PV cumulative installed capacity (MW)
Source: EPIA Global Market Outlook for Photovoltaics 2013-2017
3 http://www.nrel.gov/csp/solarpaces/by_country.cfm [for additional information on Kenya, see http://www.africanbuilding.com/index.php/kipevu-iii-power-plant, accessed 23 July 2013, Kipevu III Power Plant: Construction Completed
4 http://dailyfusion.net/2013/04/africas-largest-photovoltaic-plant-opens-6377/ (accessed on 23 July 2013).
120000
100000
80000
60000
40000
20000
0
Inst
alle
d ca
paci
ty (M
W)
2000
2001
2002
2003
2004
2005
2006
2007
2008
2009
2010
2011
2012
EuropeAPACAmericasChinaMEAROW
Period

15
2.4. Biomass
Biomass provided approximately 10.2 percent of the global annual energy supply5, but in sub-Saharan Africa biomass constitutes about percent of total energy consumption.6 Consumption is in the form of low efficiency traditional biomass feedstock such as wood, charcoal, agricultural residues and cow dung. Technology applications to biomass fuels are therefore very low or absent with fuels being burnt in the open. The use of energy saving stoves in Africa is widespread, but their efficiency still remains low. Charcoal production methods are also inefficient.
Although Africa’s biofuel production potential is huge, especially through agricultural co-production, its growth has been slow, owing largely to inefficiencies in the agricultural systems. Experience with large-scale biofuels remains limited in sub-Saharan Africa with only Kenya, Malawi, and more recently Zimbabwe (40,000 million litres of ethanol/year)7 and Mozambique8 indicating some progress in their industries. To compare production capacities, sub-Saharan Africa exported 2 percent of denatured bio ethanol to the EU between 2009 and 2011, while Brazil, the world leader, exported 71 percent9. This development is the result of a notable leap in export volumes from 63 tonnes to 3,328 tonnes of denatured alcohol.
In Kenya and Nigeria, biomass is largely non-commercial. In Kenya, biomass comprises 77.9 percent of domestic energy consumption, while industry, transport and agriculture utilize commercial energy in the form of electricity and petroleum-based fuels10. Biomass is used by a majority of rural populations as well as a significant share of the urban poor. Overreliance on biomass for energy has contributed to deforestation and the decline of water resources, and is associated with respiratory diseases and economic loss through labour and time used to collect fuel wood.
The use of organic waste through modern technologies appears an attractive route for Africa, given that Africa has a large agricultural sector and indigenous technologies to make use of it. We came across several examples of biomass-based technologies that helped save costs and provided development benefits for Africa.
5 IEA, 2010.6 Gottesfeld & Cherry (2011) & REN21, Renewables Global Status Report, 2011.7 Ibid.8 AfDB, Report on Bio-Energy Consultative Meeting “Fuelling our Strategy Right”, Tunis, April 2011.9 PANGEA.10 Ibid
2. GLOBAL RENEWABLE ENERGY TECHNOLOGY AND GREEN INVESTMENT TRENDS

DIFFUSION STRATEGY OF GREEN TECHNOLOGY AND GREEN INDUSTRY IN AFRICA
16
2.5. Hydro
Electricity generated from hydro resources made up 70 percent of sub-Saharan Africa’s total generated electricity (excluding South Africa)11. Its development is immensely capital intensive and it is therefore disregarded as most states are hard pressed for financial resources against many other competing priorities. It is estimated that Africa’s total hydro potential could generate power equivalent to that being consumed by Germany, Italy, France and the United Kingdom combined. yet only a paltry 5 percent is currently being exploited. Hydro energy may also be affected by climate change, notably in Kenya, DRC and Zambia12. CDM implementation13 comprises 16 projects in Africa, but even these fail to come close to exploiting the existing huge potential. Countries with the highest potential include D.R. Congo, which has 40,000 MW, Angola, Cameroon, Gabon, Mozambique, Nigeria, Egypt, Zambia, Ethiopia and Madagascar. Of these, one and two projects are respectively being implemented under the CDM in Nigeria and Madagascar, respectively.
Both hydro and geothermal power projects have been unable to attract funding owing to the inefficiencies of the already unprofitable national grids. Political obstacles resulting from a lack of effective cooperation mechanisms between countries have also contributed to the failure to develop and exploit hydropower systems’ full potential. A case in point here is the Orange River in the southern Africa region and the Nile river basin, where developments are adversely affected by poor cooperation. Hydropower for Ethiopia and Sudan has stagnated for many years due to political disagreements between the 10 states that share the the Nile water resources14. Lessons can be gleaned from the regional cooperation and development approaches adopted by the Mekong River Commission that brings 6 countries together to utilize and manage shared water resources through regional cooperation. Regional cooperation, particularly between states sharing hydro resources coupled with the preference of bundled projects for greater gains under the CDM, present opportunities that countries can strategize for.
11 AICD, Background Paper No. 6, Underpowered: The State of Power Sector in Sub-Saharan Africa, 200812 AMCEN-AU, Guidebook-Addressing Climate Change Challenges in Africa, 201113 CDM stands for Clean Development Mechanism. The CDM allows emission-reduction projects in developing countries
to earn certified emission reduction (CER) credits, each equivalent to one tonne of CO2. These CERs can be traded and sold, and used by industrialized countries to a meet a part of their emission reduction targets under the Kyoto Protocol. From: http://cdm.unfccc.int/about/index.html
14 Tadesse, Debay, The Hydropolitics of the Nile: Climate Change, Water and Food Security in Ethiopia, in Climate Change and Resource Conflicts in Africa, Institute for Security Studies, 2010

17
2.6. Geothermal
Africa’s geothermal resources are concentrated along the Rift valley whose combined potential is estimated to be 14,000 MW capacity. However, only 127 MW and 7 MW are currently being exploited by Kenya and Ethiopia, respectively. Other countries considering the exploitation of geothermal resources are Eritrea, Tanzania and Uganda. Kenya’s potential for geothermal resources ranges between 7,000-10,000 MW in various locations along the Rift valley, but currently, only 157 MW is being exploited. Sixteen prospective sites have been identified. The two leading geothermal wells are Menengai and Olkaria with estimated capacities of 1,600 MW and 1,000 MW, respectively. The commissioning of wells at Olkaria Block with 280 MW was scheduled to take place in 2013, with Menengai (400 MW) and Bogoria (800 MW) being in the drilling and project development phases, respectively.
Although power generated from geothermal resources is capital intensive, especially in the exploration drilling phase, it remains the most attractive renewable source for Kenya in the long term. The Government of Kenya has introduced mechanisms to minimize development cost risks. Kenya has become a member of the Multilateral Investment Guarantee Agency (MIGA) which enables it to provide investors with an opportunity to insure their investment in Kenya against a wide variety of non-commercial risks. Other risk mitigation measures include membership in the African Trade Insurance Agency (ATI), which is a multilateral political and credit risk agency for the COMESA regional economic block and the possibility to utilize the International Council for Settlement of Investment Disputes (ICSID) where necessary.
2.7 Renewable energy investments
According to UNEP (2013), the total world renewable energy investment in 2012 was USD 244 billion for renewable energy power and fuels, not including approximately USD 33 billion large-scale hydroelectric projects.
Total investment in developing economies rose 19 percent in 2012 to USD 112 billion, while investment in developed countries slumped 29 percent to USD 132 billion.
The rise of renewables in Africa was not limited to South Africa. Morocco also saw a jump in outlays, from USD 297 million to USD 1.8 billion, while outlays in Kenya amounted to USD 1.1 billion in 2012, up from almost no investments in 2011.
2. GLOBAL RENEWABLE ENERGY TECHNOLOGY AND GREEN INVESTMENT TRENDS
DIFFUSION STRATEGY OF GREEN TECHNOLOGY AND GREEN INDUSTRY IN AFRICA
18
Morocco committed to two large projects in 2012: the MASEN Ouarzazate CSP power plant phase one (at 160 MW and USD 1.2 billion) and the Nareva led Tarfaya Wind Farm (at 300 MW and USD 563 million). In Kenya an investment of USD 900 million was committed for the 400 MW Menengai geothermal project phase one and USD 180 million for the 36 MW Ormat Olkaria geothermal project expansion phase one.
The Middle East and Africa experienced a steep threefold increase in investments in renewable energy between 2011 and 2012. It can generally be said that a shift in RET investments has taken place from the “North” to the “South” over the last years.
In 2012, global investments in RETs fell by 12 percent, marking a break in the trend. The main reason for the 12 percent decline in 2012 was investor concern over policies to support renewable energy in its longest-established markets, Europe and the US. Retroactive cuts in renewable energy support in some European countries (i.e. Spain), pressure on utility balance sheets in Europe and the poor performance of clean energy share prices contributed to that overall negative trend.
2.8. Financing renewable energy in sub-Saharan Africa
As shown in Table 2.4, Foreign Direct Investment (FDI) flows in Africa have been on a rapid increase since 2000, growing nearly fivefold by 201115. At 20 percent, Africa’s FDI share of overall capital formation has been more than twice the global average of 8 percent. In sub-Saharan Africa, FDI growth has been driven by rising commodity prices for resource endowed countries as well as by continually improving macroeconomic conditions across the board. Investments have reached beyond extractive industries to other industries such as finance, telecommunication, tourism, consumer products, construction, and renewable energy.
Despite this upward trend, the capital needed to develop Africa’s infrastructure dwarfs the FDI inflows, reflecting the huge existing gap. For instance, the World Bank estimates that USD 4 billion and USD 14.2 billion are needed annually over the next decade to address Kenya and Nigeria’s infrastructure deficit. These figures represent 20 percent and 12 percent of the countries’ respective GDPs. Current annual infrastructure expenditure is estimated at USD 2.1 and USD 5.9 billion in Kenya and Nigeria, respectively. The estimates for infrastructural needs 15 African Economic Outlook, 2012

19
in Africa on the whole in terms of both new and existing infrastructure were determined at USD 47 billion per annum in the period 2006-2015, requiring an increase in annual spending of an average of USD 11 billion between 2001 and 2006.
Table 2.4: Summary of external financial flows and tax receipts in Africa (2002-12)
Flows (real USD Billions) 2002 2003 2004 2005 2006 2007 2008 2009 2010 2011 2012
1. ODA, net total, all donors
21.4 27.4 30.0 35.8 44.6 39.6 45.2 47.8 47.9 48.4 48.9
2. Portfolio invest-ments
-0.1 -0.4 6.8 5.8 22.2 12.8 -27.0 -2.1 12.2 7.7 16.2
3. FDI in ward 16.1 20.4 21.7 38.2 46.3 63.1 73.4 60.2 55.0 54.4 53.14. Remit-
tances 13.2 15.8 19.8 22.7 26.8 37.0 41.5 37.7 39.3 41.6 45.0
5. Tax rev-enues 123.9 159.0 204.6 262.4 312.5 357 458.5 339.2 416.3
Total Exter-nal flows (1+2+3+4)
50.6 63.3 78.3 102.5 139.6 152.5 133.1 143.5 154.4 152.2 163.2
North Africa 13.6 15.0 20.2 27.4 37.2 43.4 33.5 23.7 37.5 27.6 31.6West Africa 9.6 10.7 13.9 23.6 34.0 32.2 33.6 37.6 37.7 42.4 45.2Central Africa 4.0 8.8 5.1 6.0 6.0 8.0 4.6 7.0 9.5 8.4 8.6East Africa 8.7 11.3 13.1 14.5 19.0 22.3 24.5 25.2 23.4 26.1 26.7Southern Africa 13.0 14.9 23.3 28.2 40.5 42.5 31.9 44.2 41.2 39.1 45.9
Source: OECD/DAC, World Bank, IMF and African Economic Outlook Data. Author’s estimates for 2011 ODA data, by using the forecasted rate of increase for Country Programmable Aid in the 2011 OECD Aid Predictability Report. Projections for 2012: FDI and portfolio: IMF, Remittances: World Bank, ODA: OECD/DAC (author’s calculations). (This table excludes loans from commercial banks, official loans and trade credits).
Several notable events have impacted the capital flow in Africa. Since the 1990s, private investments declined as firms reeled from the effects of the Asian and Latin American financial crises. Later, the Enron scandal and its aftermath and the 2008/9 crisis had a precautionary effect on financial industries in northern countries. At the same time, Africa has continued to enjoy improved macroeconomic conditions. These events have resulted in changes in the financial conditions in northern countries pushing investors into risky frontiers such as sub-Saharan Africa. The OECD has observed a sudden interest in Africa by investment and financial actors from Europe since 2005.
2. GLOBAL RENEWABLE ENERGY TECHNOLOGY AND GREEN INVESTMENT TRENDS

DIFFUSION STRATEGY OF GREEN TECHNOLOGY AND GREEN INDUSTRY IN AFRICA
20
This interest is attributed to low yields in OECD countries and high returns on investments as the two most important factors.16. Overseas Development Aid (ODA) flows have not grown significantly and were exceeded by FDI flows in 2005. Consequently, these trends have triggered a shift in sources of finance both in the public and private sectors. The public sector has seen an increase in flows coming from Development Finance Institutions (DFIs), particularly those from the EU.17 The increase in DFIs’ participation in renewable energy projects has been concentrated in a few countries in SSA and does not always involve renewable energy investments but also those based on thermal energy investments. Another reason is the long-term experience of DFIs in SSA through their corresponding development aid organizations that helps them gauge and manage risk, thus crowding out private investors.
Sources of funding for RE in sub-Saharan Africa
Funding for energy in general and more recently for renewable energy projects originates primarily in OECD countries. While funding from these countries continues to remain a key source of funding, new sources are emerging as well, notably from Asian state-backed export credit agencies. Local private capital and sovereign bonds from SSA are growing much more slowly. SSA’s sources of funding for RETs can be grouped into five categories.
The first is the CDM mechanism which entails numerous projects that are at various stages of development18. This source funds projects to exploit biomass, hydro, geothermal and wind resources under the framework of UNFCCC in least developed countries. The role of this source of funding is limited in Kenya and Nigeria, and is likely to diminish as they are no longer classified as low income countries and thus no longer qualify to participate under the CDM framework.
The second source of funding is offered by the Development Finance Institutions (DFIs). This source plays a major role in SSA investments, not only in the energy industry where both IPPs and state utilities are being financed, but in other industries as well. DFIs can be further categorized into two distinct sub-categories based on the terms under which they offer financial services: a) State-backed DFIs that provide public resources from governments, often from developed countries. They act as “safe” FDI vessels, mainly offering financial resources to large private companies on commercial terms. Interestingly, the OECD considers
16 http://www.oecdobserver.org/ Africa:an emerging markets frontier Accessed on 17 September, 201317 Ibid, Mukasa et al, Mukasa et al, Development of Wind Energy in Africa.18 http://www.cdmpipeline.org/cdm-projects-region.htm Accessed 2nd September, 2013

21
this type of finance to be official development funds19. DFIs do not usually fund full projects, but promote participation among other similar institutions in the form of loans, equity participation or risk mitigating instruments. Examples of DFIs include organizations such as CDC (Comment Wealth Development Corporation), DEG (German Investment & Development Corporation), FMO, IFC, NORFUND, FINNFUND, BIO, PROPARCO and the European Investment Bank (EIB). Others include multi-donor facilities such as the Emerging Africa Infrastructure Fund (EAIF) which bring together DFIs from the EU, the Clean Technology Fund (CTF) and Infraco20. b) The second sub-category includes multilateral banks, such as AfDB, and the World Bank which provide funding to public utilities mostly and on concessionary terms. Numerous projects have and continue to receive long-term funding from these two categories.
The third source is export credit agencies which emerged with the rise of Asian involvement in Africa. These include the Chinese Export-Import Bank, the Export-Import Bank of Korea, Nippon Export and Investment Insurance (NExI), the European Investment Bank (EIB) and the Japan Bank for International Cooperation (JBIC). These agencies have contributed to several energy projects in Africa.
The fourth source is private capital in the form of bonds and private equity funds. As a result of dwindling funding from the second category of lenders in the last 5-6 years, SSA countries have been exploring alternative sources of funding such as government bonds and other similar instruments. Both Nigeria and Kenya have joined South Africa to become the three top SSA countries that have shown potential to launch bond issuances both domestically and in the international market over the last 6 years. This is usually the initial stage of deepening capital markets, especially the longer-term financial investments. Other countries that utilize bonds include Ethiopia, Gabon, Ghana, Namibia, Rwanda, Senegal and Zambia21. Kenya has had some notable success. In 2009, the leading power generating enterprise, KenGen, issued Public Infrastructure Bonds (PIBOs), raising USD 330 million, 80 percent of which was taken up by public institutions from the Eastern Africa Community (EAC) and the remainder was taken up by other retailers of investments22. The Government of Kenya raised USD 120 billion for 2009-2011 through a series of 4 PIBO issues23, part of which has been used to finance energy projects. 19 OECD, Mapping Africa’s Support for Africa’s Infrastructure Investment, 201220 Ibid21 AfDB, Closing Africa’s Infrastructure Gap: Innovative Financing and Risks, African Economic Brief, Vol 2,
Issue 1 April 201122 IRENA, IRENA Handbook on Renewable Nationally Appropriate Mitigation Actions for Policy Makers and Project
Developers, 2013 & Kengen Annual Report , 201023 C. A. Beng Mezui & B. Hundal, Structured Finance, Conditions for Infrastructure Project Bonds in African Markets,
African Development Bank Group, 2013
2. GLOBAL RENEWABLE ENERGY TECHNOLOGY AND GREEN INVESTMENT TRENDS

DIFFUSION STRATEGY OF GREEN TECHNOLOGY AND GREEN INDUSTRY IN AFRICA
22
The fifth source is governments whose contributions come not only in the form of actual funds injected in domestic utilities, but in the form of other instruments meant to stimulate growth in energy investments. Tax holidays, VAT and duty exemptions extended to investors, risk and credit guarantees, economic and financial incentives and pooling together funds from other sources that can be leant to private sector for project development are notable examples. The role of government agencies in providing a facilitating environment, assuming a regulatory and oversight function and the coordination of energy development is particularly important.
Table 2.5 illustrates the diversity of renewable energy funding sources in Kenya for selected projects.
Table 2.5: Selected list of ongoing or recently concluded RE projects in Kenya
Project name Capacity in MW Source of FinanceSondu Miriu 60 JICA & KenGenOptimisation of Kiambere 24 PIBONgoing Wind Phase 15.1 5.1 KCB Bank of Belgium through GoKOlkaria II 3rd Unit 35 IDA, AFD, EIB, & KenGenRedevelopment of Tana 20 PIBOKipevu III 120 PIBOEburru Wind 2.5 Kengen & PIBOWellhead Generators (Pilot) 5 KenGenSangoro 21 JICA &PIBOKindaruna Unit III 24 KfW & PIBOKindaruma Upgrade of Unit I & II 8 KfW & PIBOOklaria I (Unit 4 & 5) & IV 250 EIB, AFD,KfW, JICA,JDA & KenGen
Source: Kengen Annual Report, 2012
Analysing energy investments over a five-year period, Giovannetti and Ticci (2012) found that the share allocated to Africa’s energy infrastructure for 2001-2006 averaged USD 4.6 billion a year. In terms of funding sources, the domestic public sector provided the bulk of funding followed by financiers outside the OECD (predominantly China) with 24 percent, ODA (15 percent) and the private sector (11 percent)24. Only two years earlier, Eberhard and Gratwick (2010) distributed funding sources as 80 percent from public sources, 9 percent from non-OECD states, 6 percent from ODA and 4 percent from the private sector. The two studies reflect the changing landscape of RE funding sources in SSA.
24 Giovannetti & Ticci, Sub-Saharan Africa in global trends of investment in renewable energy. Drivers and the challenges of the water-energy-land nexus, European Report on Development, 2012

23
Sources of funding for renewable energy projects in SSA have a significant bearing on its development path and will ultimately lead to success, given that up to 70 percent of most projects are financed by debt. Government sponsored projects tend to be cheaper because they are usually larger and therefore accommodate extra costs, such as costs for related infrastructure, on a cost per unit installed basis better. Another advantage arises from access to finance such as loans and grants at concessionary terms. It takes much longer to reach financial agreements for projects funded by DFIs due to the high number of participating entities, which often increases transaction costs. However, there are also several benefits that result from the involvement of bilateral agencies as well as multilateral institutions. DFIs have a preference for enterprises with a proven track record in Africa25, which have accumulated expertise over the years. Bilateral agencies and multilateral institutions can use their influence to ensure that contracts are adhered to (OrPower, Tsavo Ke) and that disagreements between contractual parties are arbitrated objectively (Songas Tz). Naturally, while this could be a disadvantage for the host country, especially where negotiation capacity and ability to draft an agreement that benefits the public is limited, it contributes to the successful completion of projects. A third advantage for development outcomes is that bilateral agency participation helps in terms of objective risk assessment, as they are familiar with local contexts.
Figure 2.7: Summary of share of infrastructure funding in Africa between 2008-2010
25 OECD, Mapping Africa’s Support for Africa’s Infrastructure Investment, 2012
2. GLOBAL RENEWABLE ENERGY TECHNOLOGY AND GREEN INVESTMENT TRENDS
World Bank AfDB Arab Fund Japan Norway 21 Others
AfDB World Bank EU Insti Germany USA 20 Others
Soft infrastructure Hard infrastructure
45%
29%
5%4%3%
14% 38%
22%8%5%
5%
22%

DIFFUSION STRATEGY OF GREEN TECHNOLOGY AND GREEN INDUSTRY IN AFRICA
24
Renewable energy investors in sub-Saharan Africa
Private sector participation in energy generation in SSA began in mid-1990 as countries introduced reforms in the energy industry. At the time, the public sector’s role was to bridge the gap in terms of reliability and efficiency of national power utilities and as such, most of these earlier IPPs were generating thermal power. By 2010, there were about 20 IPPs in SSA, each with an excess of 40 MW grid connected capacity supplying national utilities with power under long-term contractual terms. Together, these IPPs provide over 40GW, although future capacity could grow as generation capacity is expanded and more IPPs join the industry. Unlike in other developing countries such as Malaysia and China, a good share of IPPs operating in SSA are foreign owned with some exceptions such as in Ghana, Kenya, Nigeria, Uganda, Senegal and Tanzania where there is a significant share of equity participation26. They are primarily European, though some are Asian (Malaysia) and from the US. Contracts tend to adopt the Build-Own-Operate model, although some include provisions for transfer at a later stage.
With regard to SSA, the origin of investors (firms) of renewable energy is important for various reasons. One notable feature of some of the IPPs that have been present in SSA over the last decade is their association with development agencies that have been involved in development programmes in SSA for decades. Based on this involvement, these firms are able to derive benefits from prior socio-economic and political experiences in a given country, and can thus evaluate and appropriately hedge risks. As African governments gradually seek to develop their renewable energy resources, those IPPs that have been involved in thermal generation are being considered as participants in renewable energy projects. Another emerging trend that is being observed is that the source of technologies used in such projects often has an influence on the type and origin of the investors participating in these projects.
26 Eberhard & Gratwick (2010).

25
3. tHEorEtiCAL undErPinninG oF GrEEn tECHnoLoGy diFFuSion in AFriCA And SECtorS oF invEStiGAtionThis section discusses adoption, innovation and diffusion theories, agro-industry and green technology investment in Africa and the nature of cassava and maize value chains.
3.1. Adoption, innovation and diffusion theories
There is a vast literature on technology adoption and diffusion which is quite difficult to summarize. The most consistent conclusion in the technology adoption literature is that the adoption path typically follows a sigmoid (S-shaped) curve as illustrated in Figure 3.1. Adoption and diffusion of technology are two interrelated concepts describing the decision to use or not to use and the spread of a given technology among economic units over a period of time. The adoption and diffusion of an innovation within an institution does not guarantee its successful integration in other institutions or its continued use.
Adoption is a behavioural choice at a particular time and space while diffusion is the adoption pattern over time. First- time adopters may continue or cease to use the new technology. Rogers (1995) identified five characteristics of innovations that have an impact on the speed of adoption. Those characteristics of innovations include: relative advantage, compatibility, complexity, divisibility and observability. The study by Supe (1983) added two more characteristics that affect the rate of adoption: variations in the cost of adoption and group action requirements of the technology. The traditional adoption/diffusion continuum recognizes five categories of participants: 1) innovators who tend to be experimentalists and interested in technology itself; 2) early adopters

DIFFUSION STRATEGY OF GREEN TECHNOLOGY AND GREEN INDUSTRY IN AFRICA
26
who may be technically sophisticated and interested in technology to solve their problems; 3) the early majority who are pragmatists and constitute the first part of the mainstream; 4) the late majority who are less comfortable with technology and are the sceptical second half of the mainstream; 5) laggards who may never adopt technology and may be antagonistic and critical of its use by others.
Diffusion analysis does not seek to find answers as to why a particular unit (company or consumer) has adopted an innovation at a particular time, but rather focuses on the adoption decisions of a population of companies (Kemp and Volpi, 2008). Adoption analysis examines the multitude of factors that affect adoption decisions of individual companies (as in Montalvo, 2002).
In this study, we embed an adopter analysis into a wider innovation system and value chain analysis. We achieve this by building on insights from adoption/diffusion studies about the innovation decision process, the risk-taking element and influence of perceived attributes giving rise to various theories (summarized in Rogers, 1983). These insights include:
• Potential adopters of a technology progress over time through five stages in the diffusion process. First, they must learn about the innovation (knowledge); second, they must be persuaded of the value of the innovation (persuasion); they must then decide to adopt it (decision); the innovation must consequently be implemented (implementation); and finally, the decision must be reaffirmed or rejected (confirmation).
• Individuals who are risk takers or otherwise innovative will adopt an innovation earlier in the continuum of the adoption/diffusion process.
• Diffusion takes place over time with innovations going through a slow, gradual growth period, followed by dramatic and rapid growth, followed by gradual stabilization and, finally, decline.
• There are five characteristics upon which an innovation is assessed: that it can be tried (trialability), that results can be observed (observability), that it has an advantage over other innovations or the present situation (relative advantage), that it is not overly complex to learn or use (complexity), that it fits in or is compatible with the circumstances into which it will be adopted (compatibility).

27
Rogers distinguishes adopters in terms of 4 categories: early adopters, early majority, later majority and laggards, based on the moment of adoption. Missing from this scheme is the important category of non-adopters.
Figure 3.1: Different adopter groups of innovation
Diffusion studies have been criticized for paying too little attention to the environment in which diffusion takes places and how it is possible for a non-adopter to become an adopter. Tessmer (1990) stresses the need to analyse the environment in which the potential adopter is expected to use the technology. This process includes identifying the relevant physical and use characteristics of both the instructional situation and the support system. Relevant situational aspects include: (i) risk exposure and capacity to bear risk, (ii) human capital, (iii) labour availability, (iv) credit constraints (Besley and Case (1993); Adesina and Baidu-Forson (1995); Zeller et al. (1997)) to determine the costs and benefits of adoption.
In our study, we include these aspects into an innovation system analysis with special attention on global value chains.
3.2. The system of innovation perspective
In innovation studies, various frameworks have been developed to understand the nature, shaping factors and dynamics of innovation. In this section, we will examine two frameworks: the national system of innovation (NSI) framework and the sectoral system of innovation (SSI) framework. The innovation system
3. THEORETICAL UNDERPINNING OF GREEN TECHNOLOGY DIFFUSION IN AFRICA AND SECTORS OF INVESTIGATION
Laggards
Late majority
Early majority
Innovators
Time
Adop
tion
shar
e
Early adopters

DIFFUSION STRATEGY OF GREEN TECHNOLOGY AND GREEN INDUSTRY IN AFRICA
28
perspective (of which the NSI and SSI are examples) sees knowledge generation an interactive process between many actors springing from multiple sources (Lundvall, 1988, 1992; OECD, 2000). Knowledge is distributed in society among the specialized knowledge producers who need to coordinate and collaborate with each other for efficient innovation. The innovation system perspective emphasizes the central role of interactive learning between companies (users and producers) in the value chain for the innovation process.
In the literature on national systems of innovation the following elements have been identified as being crucial to innovation decisions (Lundvall, 1992; Adeoti, 2002):
•Internalorganizationoffirms
•Inter-firmrelationships
•Roleofpublicsector
•Institutionalset-upofthefinancialsector
•R&DintensityandR&Dorganization,and
•Educationandtraining.
These elements suggest that institutional settings are very important in shaping the processes (e.g. interacting, learning, knowledge sharing) that are critical for innovation. In this respect, the NSI framework does not limit institutions to include only bodies such as enterprises, research institutes, government and non-governmental organizations, but to also embrace the new institutional economics definition of institutions as sets of common habits or norms, routines, practices, rules or laws that regulate the relationships and interactions between individual agents and groups (Edquist, 1997). When the elements of the NSI are well developed, the firm that is regarded as the core or centre of the NSI becomes more innovative, and the impact of innovation as the engine of economic growth and technological progress is widespread (Freeman, 1992, 1995). Structural transformation becomes evident and international competitiveness of national or local firms begins to thrive (Kim, 1997; Mytelka, 1998; Lall, 2001).
In this study our focus is on the sectoral system of innovation. As observed by Malerba and Nelson (2012), while the national innovation system concept is more aggregative and oriented towards broad national characteristics, the sectoral innovation system concept, by contrast, recognizes broad factors that influence development across a wide range of industries. The sectoral innovation system

29
highlights the sector-specific characteristics of the environment within which development takes place. The sectoral innovation system framework addresses the nature, structure, organization and dynamics of innovation and production in different sectors. In this framework, Malerba and Nelson (2012) identify three key elements of sectoral systems: actors, knowledge base and institutions. Actors in sectoral systems of innovation are varied and sector dependent. They may include firms in upstream and/or downstream supply chains; universities and public laboratories; financial organizations and government or public sector agents. These actors form a network of agents and within the sectoral system, firms and non-firm organizations are connected in various ways through market and non-market relationships. The knowledge base of different sectoral systems of innovation is also varied and can be multi-dimensional. As emphasized in Malerba and Nelson (2012), different sectors are characterized by different knowledge bases, and knowledge plays a central role in innovation and affects the types of learning and capabilities of firms. As in the national innovation system framework, agents’ cognition, actions, and interactions in sectoral systems of innovation are shaped by institutions which include laws, standards, norms, common routines and habits and established practices.
In our study, we apply the sectoral system of innovation framework to the agro-industry as a major sector considered crucial for growth and poverty reduction in Africa. In this respect, the agricultural sector and its linkage with industry is very important for countries in which agriculture is the main economic activity of the vast majority of the population. Nigeria’s economy is considered largely agrarian despite the country’s oil industry. As M. McMillan and D. Rodrick (2011) note, in countries with a relatively large share of natural resources such as oil in exports, such “enclave” natural resource sectors usually operate at very high productivity but cannot absorb the surplus labour from agriculture. The share of agriculture is increasing. Whereas the agricultural sector accounted for about 21 percent of production in 1980, it made up 41 percent of GDP in 2009 (Ogbu et al., 2012). By contrast, the manufacturing sector’s contribution to GDP declined from about 8 percent in 1980 to 5.5 percent in 1990, and has remained relatively small, contributing only about 4 percent of GDP (Ogbu et al., 2012). With the exception of the services sector led by the telecommunications industry which has emerged as a driver of growth, there has been no significant change or improvement in other sectors’ contribution to GDP. Thus, structural change has been very limited in the Nigerian economy. In particular, the continued dominance of the agricultural sector and the absence of significant growth in the manufacturing sector suggest that an examination of the sectoral innovation system might be worthwhile to identify the necessary interventions that could provide stimulus for structural change.
3. THEORETICAL UNDERPINNING OF GREEN TECHNOLOGY DIFFUSION IN AFRICA AND SECTORS OF INVESTIGATION

DIFFUSION STRATEGY OF GREEN TECHNOLOGY AND GREEN INDUSTRY IN AFRICA
30
The SSI framework applied to study adopter decisions by potential adopters of EE; we do not offer an analysis of the production technologies and institutions governing the development of the agro-industrial sectors under investigation (cassava processing in Nigeria and maize milling in Kenya). A discussion of the agro-industrial sectors is provided in sections 3.3 and 3.4.
3.3. Agro-industry and green technology investment
Africa’s efforts to promote social and economic development have been hampered by a number of recent events, specifically the soaring food prices and the global economic recession. Because of high food prices, the import bill for cereals rose substantially in Africa to 49 percent in 2008 alone. Despite a decline since the second half of 2008, current levels of food prices continue to be above average and their volatility remains high. As a result, the challenge of achieving food security and the slower pace of poverty reduction resulting from high food prices continue to be problematic for most African countries. The onset of the global financial crisis in late 2008 has led to a slowdown of world economic growth, a reduction in trade and recession in many countries. The crisis has affected African countries, with economic growth dropping from 6.0 percent to 5.1 percent between 2007 and 2008. In the near future, remittances are likely to be reduced, foreign direct investments are expected to decline, the demand for imports and oil-based agricultural inputs such as fertilizer will likely be affected by weakening exchange rates, while official development assistance is expected to be reduced (FAO/UNIDO, 2010). African economic growth remains largely commodity-based, i.e. dependent on export of oil, minerals and agricultural commodities with little or no processing involved. African countries should give priority to energy, agriculture and industry to promote resource productivity and mitigate the environmental impact of resource use (UNCTAD, 2012). As Daron Acemoglu (2007) notes, societies with a high agricultural productivity can afford to shift part of their labour force to a knowledge-producing sector such as manufacturing. To accelerate sustainable and inclusive growth and development in Africa, there is an urgent need to foster a new development approach based on exploiting the continent’s full agribusiness potential. This could entail increasing agro-industrial value added and employment along the entire agribusiness value chain in agriculture, industry and services (UNIDO, 2011). Alongside its role in stimulating economic growth, agribusiness and agro-industrial development has the potential of substantially contributing to poverty reduction and improved social outcomes. Moreover, “a consensus is emerging that agro-industries are a decisive component of socially-inclusive, competitive development strategies” (Wilkinson and Rocha, 2008).
31
Both productivity and efficiency in agriculture rely heavily on the use and application of cutting-edge technology. For agro-industries, technological innovation has long been a major contributor to progress and will continue to influence agricultural inputs, production, processing, distribution and marketing. Four key areas of technological innovation will play a key role in shaping the future of agro-industries: global positioning systems, geographic information systems, biotechnology, and the Internet (Weick, 2001). In developing countries, the diffusion and adoption of such new technologies is slow especially among smallholder farmers and SMMEs working in agro-industries. Numerous studies have shown that technological innovation is more likely in enterprises that are connected to others through business networks which introduces them to new technologies and teaches them how to adapt these technologies within their firms (Newell and Clark 1990; Porter 1990; Adeoti and Adeoti, 2011).
Africa’s indigenous technological capability is not only limited in its functions but also lacks significant capacity to assimilate, absorb or adapt foreign technology (Adeoti 2002). Africa’s agricultural economy is largely subsistence and efforts to build capacity for innovation have yet achieved significant results. For example, a recent study by Adeoti et al. (2010) concluded that addressing the innovation deficit in agro-food processing in Nigeria remains difficult despite the improved contribution of agriculture to GDP in recent years. The empirical evidence from the analysis of Adeoti et al. demonstrated that building innovation capacity in Nigeria’s agro-industry is limited by poor infrastructure, inadequate policies and the attitudes of key innovation agents. Consequently, there has been limited firm-level R&D capability and knowledge institutions such as universities have been unable to achieve commercialization of inventions that could engender innovation in agro-industry.
All these point to the need for huge investments in green technology in Africa’s agro-industry. This is essential for sustainable economic growth on the continent. Investments in green technology involve both private and public participation. There are new opportunities for investing in agribusiness and integration into value chains. These range from large-scale commercial cultivation and processing of food crops and energy crops for bio-fuel (UNIDO & FAO, 2009), to medium and smallholder production of fresh fruit and vegetables and horticultural products for export to supermarkets abroad (Best & Mamic, 2008; Omosa, 2002). There are opportunities for stimulating private investment in the so-called ‘green enterprise’ initiative which is linked to environmental protection (forest conservation, ecotourism, forest products, waste management and biomass renewable energy) (UNIDO, 2011).
3. THEORETICAL UNDERPINNING OF GREEN TECHNOLOGY DIFFUSION IN AFRICA AND SECTORS OF INVESTIGATION

DIFFUSION STRATEGY OF GREEN TECHNOLOGY AND GREEN INDUSTRY IN AFRICA
32
There is evidence of opportunities for green investments in agro-industry in some African countries. The small hydro for greening the tea industry in Eastern and Southern Africa project is expected to directly or indirectly benefit over eight million people, including tea farmers, workers and their dependents through the installation of small hydroelectricity generation stations in the region’s tea industry. In addition to reducing greenhouse gas (GHG) emissions, the small hydropower installations will reduce the tea industry’s energy costs, enhance global competitiveness of the region’s tea industry and increase the share of global tea revenues flowing to the region’s tea farming community. Also, the cogeneration for Africa, an innovative and first of its kind clean energy regional initiative funded by Global Environment Facility, is building on the success of cogeneration in Mauritius, which currently meets close to 40 percent of the country’s electricity needs. It seeks to significantly scale up the use of efficient cogeneration systems, initially in seven Eastern and Southern African countries (Kenya, Ethiopia, Malawi, Sudan, Uganda, the United Republic of Tanzania and Swaziland) (UNIDO, 2011).
However, opportunities still abound for the African continent to improve on its agro-industry green investment. The Clean Development Mechanism (CDM) is one of three measures under the Kyoto Protocol in which developed countries can reduce their greenhouse gas emissions. Under this arrangement, developed countries invest in projects implemented in developing countries which reduce GHG, including energy projects. Africa has yet to adequately tap into this resource and currently only implements two percent of the total number of projects under the CDM worldwide (UNFCCC, 2008). The CDM could be the future driver of technology diffusion processes in Africa and of the creation of green jobs and investment opportunities through the penetration of renewable energy sources. If the institutional implementation can be coordinated to link African farmers to world carbon markets, there is potential for carbon sequestration among small farmers to become an important new ‘cash crop’ in sub-Saharan Africa. Better management of agricultural by-products and manures can lead to greater local production of biogas to fuel farm and agro-processing operations (World Bank, 2007).
3.4. Cassava and maize value chains
Value chains include input suppliers, producers, processors and buyers, a range of technical, business and financial service providers and the final markets into which a product or service is sold, whether local, national, regional or global. In this study, we will only analyse the operators in the value chain from input

33
suppliers to processors, the distribution of energy technology and the dynamics of the relationship among them.
The knowledge aspects and institutional elements are the main focus of Sectoral System of Innovation (SSI) studies, whereas Value Chain Analysis (VCA) focuses on economic and governance links. In this study, we combine the two approaches, allowing us to identify positive and negative interaction effects that give rise to blocking mechanisms and positive development spillovers. The study directs its attention to the national and international elements of the value chains of agriculture and renewable energy in Nigeria and Kenya.
Although the term value chain was not intended to address issues relating to agricultural practices or activities alone, it is widely used to explain value addition at different stages in most agricultural practices. Value chain has been employed to create a competitive advantage in the production of goods and the rendering of services by a firm. The value chain concept was introduced in Michael Porter’s bestseller “Competitive Advantage: Creating and Sustaining Superior Performance” in 1985. Since then, it has been applied varyingly in explaining the production stages that a particular good (or service) undergoes from the input end (from the raw materials) to the final consumer. According to Kaplinsky and Morris (2001), the value chain describes the full range of activities that are required to bring a product or service from conception through the different phases of production (involving a combination of physical transformation and the input of various producer services) to delivery to final consumers and final disposal after use.
The cassava subsystem in Nigeria
Cassava (Manihot esculenta Crantz) is one of around 100 species of trees, shrubs and herbs of the genus Manihot, which is distributed from northern Argentina to the southern United States. While some studies indicate that cassava has multiple centres of origin, others suggest that the cultivated species originated on the southern edge of the Brazilian Amazon. Botanically, cassava is a woody perennial shrub, which grows from 1 meter to 5 meters in height. It is believed to have been cultivated for 9,000 years, mainly for its starchy roots, making it one of agriculture’s oldest crops. In the pre-Colombian era, it was grown in many parts of South America, Mesoamerica and the Caribbean islands (FAO, 2013).
Following the Spanish and Portuguese conquests, cassava was taken from Brazil to the Atlantic coast of Africa. By the 1800s, it was cultivated along Africa’s east coast and in southern Asia. Farming of cassava expanded considerably in the
3. THEORETICAL UNDERPINNING OF GREEN TECHNOLOGY DIFFUSION IN AFRICA AND SECTORS OF INVESTIGATION

DIFFUSION STRATEGY OF GREEN TECHNOLOGY AND GREEN INDUSTRY IN AFRICA
34
20th century, when it emerged as an important food crop across sub-Saharan Africa and in India, Indonesia and the Philippines. Since it is sensitive to frost and has a growing season of nearly one year, cassava is cultivated almost exclusively in tropical and subtropical regions. It is grown today by millions of small-scale farmers in more than 100 countries (FAO, 2013).
Figure 3.2 shows the cassava tuber which can be processed into food, animal feed or industrial intermediate products such as flour or starch. Nweke (2001) projected cassava to become a food security crop that has great potential for tackling malnutrition and raising the income of rural households. Nigeria is the largest producer of cassava in the world, producing about 45 million tonnes of the world’s production of 242 million tonnes in 2009, but accounts for a negligible share of global trade in value added cassava products due to the uncompetitive nature of its production and weak processing systems (PIND, 2011). Cassava production in Nigeria is increasing at 3 percent annually, but Nigeria continues to import starch, flour and sweeteners that can be made from cassava. According to FAO (2012), Nigeria produced 18 percent of the world’s total cassava production of about 250 million tonnes, Thailand produced 10 percent, Indonesia 9 percent, Brazil 8 percent, Congo 5 percent and other countries produced 50 percent. Figures 3.3 and 3.4, and Table 3.1 present the results of a study by UNIDO and the Federal Ministry of Industry, Trade and Investment on the cassava value chain and marketing opportunities under the Presidential Initiative on Cassava Processing and Export which was launched in the early 2000s.
On account of Nigeria’s government’s efforts to promote a 20 percent inclusion of High Quality Cassava Flour (HQCF) in confectioneries as a major component of the Agricultural Transformation Agenda (ATA), it is expected that cassava production will continue to rise in Nigeria. There is also a strong growth prospect for cassava production elsewhere in Africa, particularly in Ghana, Angola, Mozambique, Malawi and Rwanda. This is based on government efforts to promote greater national food security in response to the 2008 global food price surge. In Nigeria, the ‘cassava transformation’ seeks to create a new generation of cassava farmers, oriented towards commercial production and farming as a business and to link them up with reliable demand, either from processors or a guaranteed minimum price scheme of the government. Under the current Agricultural Transformation Agenda in Nigeria, the Cassava Market and Trade Development Corporation (CMTDC) was recently established as the primary vehicle for the implementation of value-added chain activities. The primary activities of the CMTDC are market development, including advocacy with potential users of cassava-based products and policymakers to ensure reliable demand. Figure 3.4 is a simple illustration of

35
the cassava value chain as conceived in a study for the Presidential Initiative for Cassava Processing and Export in 2006.
Figure 3.2: Cassava tuber
iStockphoto.com
Figure 3.3: Cassava marketing opportunities
3. THEORETICAL UNDERPINNING OF GREEN TECHNOLOGY DIFFUSION IN AFRICA AND SECTORS OF INVESTIGATION
Fresh Cassava
Animal Feed Ruminants, Poultry,Aquaculture
Commercial Food,Beverage and Pharma
Industrial Textiles,Oil and Gas
Traditional Food
Ethanol Production
Flour Milling
Starch Production
Glucose
Food Processing

DIFFUSION STRATEGY OF GREEN TECHNOLOGY AND GREEN INDUSTRY IN AFRICA
36
Table 3.1: Global trends in the cassava value chain
Raw Material Production Processing Activities Market
Production systems Technologies Diversified consumer demands
- Shift to commercial production of raw cas-sava tubers
- Shift from traditional to indus-trial type processing
- Emerging huge global market de-mand for diversified cassava-based products, e.g. ethanol, starch, flour (HQCF) and pellets
Productivity Competitiveness Market development
- Higher yields at farm level
- Processing enterprises becoming competitive through efficient production
- Government policies on import substitution and increased use of cassava-based products in develop-ing countries’ increasing domestic demand
- Improved raw material quality
- Large-scale state of the art technologies used especially in starch and ethanol production
- The Far East, especially China, is emerging as a major world market for starch and pellets
- Ex-farm competitiveness improving
- Emerging subcontract production.
- Increased use of inputs - Small- and medium-scale food and animal feed industry pro-cessors using more efficient technologies
- Increased mechanizationSupply volumes Supply capacity and quality
specificationsProduct quality specifications and product quantities demanded
- Improved capacity to supply the high volumes required by industry
- Clusters of small-scale proces-sors working to meet market demand volumes
- Consumer demand for high product standard
- Subcontract/cluster farmer production on increase
- HACCP (Hazard Analysis Criti-cal Control Point)/GMP(Good Manufacturing Practices)/ISO (International Organization for Standardization) 22,000 imple-mentations at plant level
- Consumer demand for quality and safety certification
- Plantation production on increase
- Products demanded in large volumes
Market access- Cassava products competing against
other products (maize and sugar-cane). Cassava-based products and ex-factory prices must be competi-tive
Source: United Nations Industrial Development Organization (UNIDO), Ministry of Trade and Industry and the Presidential Initiative on Cassava (2006).

37
Figure 3.4: A simplified example of the cassava value chain
3. THEORETICAL UNDERPINNING OF GREEN TECHNOLOGY DIFFUSION IN AFRICA AND SECTORS OF INVESTIGATION
Sour
ce: U
nite
d Na
tions
Indu
stria
l Dev
elop
men
t Org
aniz
atio
n (U
NIDO
), M
inis
try o
f Ind
ustry
, Tra
de a
nd In
vest
men
t, an
d th
e Pr
esid
entia
l Ini
tiativ
e on
Cas
sava
(200
6)
RAW
MAT
ERIA
L
PRO
CESS
ING
PRIM
ARY
PRO
CESS
ING
Flou
r Pro
duct
ion
(Chi
ppin
g, D
ryin
g, M
illin
g)Ba
kery
and
co
nfec
tiona
ry b
akin
g
Gari,
Lan
fun,
fufu
Brea
d, c
andi
es, c
akes
, ic
e cr
eam
Anim
al fe
ed
Fuel
eth
anol
oth
er in
dust
ry
Beve
rage
s, p
harm
indu
stry
Soup
s, s
auce
s, s
usag
es
Garm
ent
Pills
, cap
sule
s an
d sy
rups
Furn
iture
s
Oth
er in
dust
ries
Pelle
ts E
xtru
sion
Dist
iller
ies
Fina
l Dis
tilla
tion
Proc
esse
d Fo
ods
Bulli
ons
Text
ile in
dust
ry
Phar
mac
eutic
als
Oth
er m
odifi
ed S
tarc
hes
Dext
rinPa
per &
woo
d
Chip
s Pr
oduc
tion
(Chi
ppin
g, D
ryin
g)
Crud
e Et
hano
l Pro
duct
ion
(Liq
uifa
ctio
n, S
acch
arifi
catio
n,
Ferm
enta
tion,
Dis
tilla
tion)
Nativ
e St
arch
Pro
duct
ion
(Filt
erin
g, S
ettli
ng, S
tarc
h W
ashi
ng, D
ryin
g, M
illin
g)
* Al
l pro
cess
es a
bove
in
clud
e pe
elin
g an
d w
ashi
ng
Trad
ition
al A
fric
an Fo
od
Proc
essi
ng (G
ratin
g, P
ress
ing,
Si
evin
g, C
ooki
ng)
SECO
NDAR
Y PR
OCE
SSIN
GM
ARKE
T
Cass
ava
–Fr
esh
root
s
* Tr
ansp
ort,
hand
ling,
pac
kagi
ng,
qual
ity, s
tora
ge q
ualit
y
**Lo
gist
ics
trans
porta
tion

DIFFUSION STRATEGY OF GREEN TECHNOLOGY AND GREEN INDUSTRY IN AFRICA
38
The maize subsystem in Kenya
Maize is Kenya’s most important food crop and is consumed by the entire population. Maize has high economic potential as every part of the plant can be put into economic use through value addition. Globally, maize serves as a source of animal feed, bio-fuel feedstock and as an input for industrial products in developed countries, while it remains an important source of human food in developing regions such as sub-Saharan Africa27. Its industrial purposes vary widely, ranging from fibre, building materials, pharmaceuticals to metal electroplating and many others. However, industrial exploitation of maize is limited in Kenya.
Though production is currently limited to human and animal feed, maize has high potential for economic growth opportunities through backward and forward linkages in production and consumption. The Government of Kenya estimates that the maize industry’s economic impact presents a factor of 1.48 as a result of its growth linkages, meaning that a rise in agricultural GDP of KES 100 arising from maize is accompanied by another KES 0.48 in non-agricultural GDP28. A national study for the industrialization master plan found that the food processing industry, which includes grain milling, meets the three criteria for growth potential and economic impact. These criteria are value addition of more than 105, high productivity in terms of labor and other inputs found to be above the average levels, and a growth rate averaging 5 percent29. Specific to grain milling, there was high labour productivity but low input productivity30, implying possible manufacturing inefficiencies.
Globally, the importance of maize has been and continues to grow, driven by various factors. These include biofuel policies in the EU and the US that impact on global supply and demand, increasing the use of maize in the production of animal protein and the rapidly growing population in developing regions coupled with an increasingly larger share of the population becoming more affluent and demanding more food and industrial consumption31. Increased economic integration in the region has the potential to affect Kenya’s production due to 27 www.cgiar.org28 Republic of Kenya, Agricultural Sector Development Strategy Medium-Term Investment Plan: 2010–2015.29 Kenya Industrialization Master Plan Study Report, 2007.30 Ibid.31 Meuller et al., Impact of biofuel production and other supply and demand factors on food price increases in 2008,
Biomass & Bio-energy 35 pg. 1623-1632, 2011; Meuller et al. (2011) estimate that bioethanol produced from maize in the US increased from 8 billion litres in 2002 to 35 litres in 2008. According to the American Chemical Society (2011), the use of maize for bio-fuel production in the US increased eighth fold from 2000-2010; the cost of the grain rose 3.75-fold from 2001-2011 while the share of domestic use of ethanol reached 44 percent in 2011. Given the influential role the US plays in production, export and stocking of maize, it is clear that these trends have contributed to the global volatility of maize prices; UNDP, Global Maize Production, Environmental Impacts and Sustainable Production Opportunities: A Scoping Paper, 2010; Awika, J.M., Major Cereal Grains Production and use Around the World, American Chemical Society, 2011; http://www.igc.int/downloads/gmrsummary/gmrsumme.pdf accessed on 16th January, 2013.
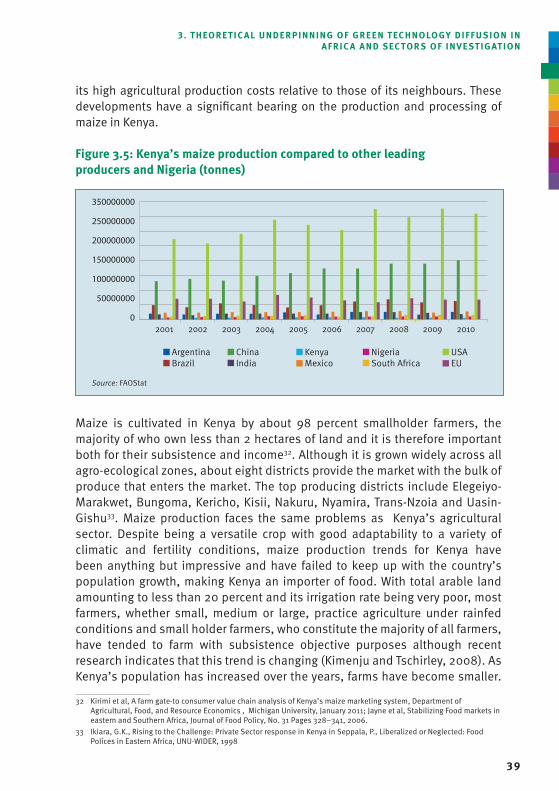
39
its high agricultural production costs relative to those of its neighbours. These developments have a significant bearing on the production and processing of maize in Kenya.
Figure 3.5: Kenya’s maize production compared to other leading producers and Nigeria (tonnes)
Maize is cultivated in Kenya by about 98 percent smallholder farmers, the majority of who own less than 2 hectares of land and it is therefore important both for their subsistence and income32. Although it is grown widely across all agro-ecological zones, about eight districts provide the market with the bulk of produce that enters the market. The top producing districts include Elegeiyo-Marakwet, Bungoma, Kericho, Kisii, Nakuru, Nyamira, Trans-Nzoia and Uasin-Gishu33. Maize production faces the same problems as Kenya’s agricultural sector. Despite being a versatile crop with good adaptability to a variety of climatic and fertility conditions, maize production trends for Kenya have been anything but impressive and have failed to keep up with the country’s population growth, making Kenya an importer of food. With total arable land amounting to less than 20 percent and its irrigation rate being very poor, most farmers, whether small, medium or large, practice agriculture under rainfed conditions and small holder farmers, who constitute the majority of all farmers, have tended to farm with subsistence objective purposes although recent research indicates that this trend is changing (Kimenju and Tschirley, 2008). As Kenya’s population has increased over the years, farms have become smaller.
32 Kirimi et al, A farm gate-to consumer value chain analysis of Kenya’s maize marketing system, Department of Agricultural, Food, and Resource Economics , Michigan University, January 2011; Jayne et al, Stabilizing Food markets in eastern and Southern Africa, Journal of Food Policy, No. 31 Pages 328–341, 2006.
33 Ikiara, G.K., Rising to the Challenge: Private Sector response in Kenya in Seppala, P., Liberalized or Neglected: Food Polices in Eastern Africa, UNU-WIDER, 1998
3. THEORETICAL UNDERPINNING OF GREEN TECHNOLOGY DIFFUSION IN AFRICA AND SECTORS OF INVESTIGATION
350000000
250000000
200000000
150000000
100000000
50000000
0
Source: FAOStat
2001 2002 2003 2004 2005 2006 2007 2008 2009 2010
Argentina Brazil
China India
Kenya Mexico
Nigeria South Africa
USA EU

DIFFUSION STRATEGY OF GREEN TECHNOLOGY AND GREEN INDUSTRY IN AFRICA
40
Kirimi et al. (2011) found a decline of 15 percent in farm size between 1987 and 2007, and approximately one-third of the smallholder farms nationwide were less than 1.0 hectares in size34. These trends appear to diminish both technical and allocative efficiencies35 in maize production which, despite varying with producer characteristics, are generally low across the board, with smaller farmers manifesting even lower efficiency levels than larger ones36. Consequently, Kenya’s productivity is particularly low compared to that of leading maize producing countries, as illustrated in Figure 3.6 below.
Figure 3.6: Kenya’s maize production trends
Kenya’s maize industry is highly concentrated with a few large producers, traders and processors37. Twenty percent of medium- and small-sized elite farmers are responsible for the bulk of the maize marketed and of these under 3 percent are responsible for up to 50 percent of total maize traded in Kenya38. In processing, four major milling companies process and distribute 80 percent of all maize produce in the country39. There are also reports of major millers who
34 Ibid35 Olwande (2012) defines technical efficiency as the optimal output derived from a unit of inputs used; allocative
efficiency as being reflective of optimal choice of input proportions and levels and posits that the two come together to form a measure of economic efficiency.
36 Olwande, J., Smallholder maize Production Efficiency in Kenya Tegemeo Institute of Agricultural Policy and Development, 2005, 2012; Kibaara, B., Technical Efficiency in Kenya’s Maize Production: The Stochastic Frontier Approach, Tegemeo Institute of Agricultural Policy and Development, 2005
37 Four major milling companies handle 80% of all produce processed in the country (Kirimi et al, 2011). There are also reports of major millers who have recently bought up smaller millers (Jayne T.S., et al, The Effects of NCPB marketing policies on Maize prices in Kenya, Agricultural Economics Pages 313–325, 2008)
38 Jayne T.S., et al, The Effects of NCPB marketing policies on Maize prices in Kenya, Agricultural Economics Pages 313–325, 2008
39 Kirimi et al, A farm gate-to consumer value chain analysis of Kenya’s maize marketing system, Department of Agricultural, Food, and Resource Economics , Michigan University, January 2011
350000000
250000000
200000000
150000000
100000000
50000000
0
Source: FAOStat
2001 2002 2003 2004 2005 2006 2007 2008 2009 2010
Area Harvested (Ha) Yield (Hg/Ha) Production (tonnes)

41
have recently bought up smaller millers, although details are unclear.
Marketing and processing was heavily controlled by the government in the first decades following independence. Previously, only the National Cereal and Produce Board (NCPB) could buy maize from farmers through its countrywide network of agents that it licensed. It bulked and sold maize to the few large millers and large institutions around the country. In addition, a few large farmers could sell their produce directly to the Board, though this process was often less transparent and based on political patronage. Perhaps the most critical feature of the NCPB’s operation was the fact that it subsidized producers, buyers and bulkers in various ways; farmers received prices that were higher than those on the market; buyers/bulkers were compensated for costs relating to collection, storage and transportation of the grain and millers were supplied with grains at subsidized prices.
While liberalization of the maize industry around the late 1980s to early 90s made room for private trading and processing to expand, the new industry never fully recovered from the problems that plagued it in the past40. The industry is still riddled with corruption, tax evasion, illegal imports and exports and government interference in market activities. Other factors have transformed the maize market over time. The population increase and growing urbanization have resulted in higher demand not only for maize products but for food in general within the context of declining domestic production. An increase in the number of maize millers and in international trade openness, particularly towards EAC member states, is likely to have prompted competitiveness among grain millers, which has resulted in a drop in prices of maize products, as Muyanga et al. (2005) found in their study covering the years 1995 to 2003.
There are between 120-150 registered commercial maize processors in Kenya. These processors include small posho millers who use simple and low cost technologies, larger millers who use more capital intensive and larger scale roller mill technology, animal feed and cooking oil manufacturers. Maize processing results in whole and refined maize meal, processed sugars (dextrose and glucose syrup), starch, cornflakes, bran, maize cake, confectionery flour and edible oil. Processors also sell their by-products to food manufacturers, breweries, pharmaceuticals and other industries. Installed capacities of processors in all categories vary, with posho millers producing between one and two 90kg bags
40 Ikiara, G.K., Rising to the Challenge: Private Sector response in Kenya in Seppala, P., Liberalized or Neglected: Food Polices in Eastern Africa, UNU-WIDER, 1998; Wangia et al, Review of Maize marketing in Kenya: Implementation and Impact of Liberalisation, 1989-1999, 2002.
3. THEORETICAL UNDERPINNING OF GREEN TECHNOLOGY DIFFUSION IN AFRICA AND SECTORS OF INVESTIGATION

DIFFUSION STRATEGY OF GREEN TECHNOLOGY AND GREEN INDUSTRY IN AFRICA
42
of maize41, medium-sized millers having an installed capacity of 10-80 bags and large ones between 1,000-6,700 bags per day42.
Figure 3.7 Value chain, a typical good harvest year
41 Muyanga et al, Staple Food Consumption Patterns in Urban Kenya: Trends and Policy Implications, Working paper 19. Tegemeo Institute of Agricultural Policy and Development, Egerton University, 2004
42 Own data from medium and large millers collected from company profiles on the Internet.
Note: The intensity of shading in the boxes represents the volumes within the marketing channels while the thickness of the arrow represents the volumes of grain flowing between various nodes. The dotted lines indicate less flow.Source: Kirimi et al., 2011
Maize surplus smallholder farmers
Informal importsfrom
Tanzania/Uganda
Large-scale
farmers
Large-scale
farmers
Ruralconsumers
Brokers/Local
assemblers
Externalitineranttraders
Wholesaletraders
National Cerealsand
Produce Board
Poshomillers
WFP,NGOs
Processors,animalfeeders
Medium- andlarge-scale
millers
Kiosks / dukas /traditional retail
marketsSupermarkets
Urban consumers

43
3. THEORETICAL UNDERPINNING OF GREEN TECHNOLOGY DIFFUSION IN AFRICA AND SECTORS OF INVESTIGATION
Figure 3.8 Value chain, a less typical deficit year
The role played by market actors within the maize value chain varies depending on the production levels in a given year and government directives on import and domestic markets, as illustrated above in Figures 3.7 and 3.8 (Kirimi et al., 2011). The volumes handled by the actors also vary depending on whether the year is a good harvest year or one requiring import. In a good year, smallholder
Note: The intensity of shading in the boxes represents the volumes within the marketing channels while the thickness of the arrow represents the volumes of grain flowing between various nodes. The dotted lines indicate less flow.Source: Kirimi et al., 2011
Maize surplus smallholder farmers
Informal importsfrom
Tanzania/Uganda
Large-scale
farmers
Large-scale
farmers
Ruralconsumers
Brokers/Local
assemblers
Externalitineranttraders
Wholesaletraders
National Cerealsand
Produce Board
Poshomillers
WFP,NGOs
Processors,animalfeeders
Medium- andlarge-scale
millers
Kiosks / dukas /traditional retail
markets
Supermarkets
Urban consumers

DIFFUSION STRATEGY OF GREEN TECHNOLOGY AND GREEN INDUSTRY IN AFRICA
44
producers, local assemblers, brokers, itinerant traders and wholesale traders yield most of the produce. By contrast, in a deficit year, their participation is reduced as large wholesalers, traders and the NCPB procure grain from neighbouring countries and international markets for the domestic market.

45
4. rESEArCH mEtHodoLoGy And Study ArEA4.1. Study area
This study was carried out in Africa (the cassava value chain in Nigeria and maize value chain in Kenya), a continent endowed with abundant, but unevenly distributed resources of oil (Libya, Nigeria, Algeria and Angola), natural gas (Libya, Nigeria, Algeria and Egypt), coal (South Africa) and hydro (mainly East and Central Africa). These resources are underexploited and demand is underserved due to Africa’s low capacity to mobilize investment, especially from private sources, due to the high political risk and low creditworthiness of many of the countries and their utilities (SOFRECO, 2011).
Basic facts: Nigeria
Nigeria is a federal republic with 36 states and a Federal Capital Territory (FCT) which serves as the seat of the federal government. The country is the 12th largest oil producing country in the world and sixth largest in the Organisation of Petroleum Exporting Countries (OPEC), i.e., Nigeria’s economy is crude oil-based. It lies within the latitudes 4.32°N and 14°N and longitudes 2.72°E and 14.64 °E. It has an estimated population of 167 million (National Population Commission, 2011), which is about 15 percent of the continent’s total population, making it the most populous country in Africa and the 10th most populous country in the world. About 65 percent of the population lives in rural areas. It has a total area of about 924,000 sq. km, which is about 3.1 percent of Africa’s total land area and the 32nd largest country in the world. The country has a vast coastline spanning 853 km. The country’s land mass is watered by several rivers and streams providing opportunities for economic activities that require freshwater. 13,000 sq. km of Nigeria’s land mass is covered by rivers/streams, natural and man-made reservoirs. The vegetation stretches from mangrove and rain forests in the south to the Guinea Savannah in the middle belts and Sudan and Sahel Savannah in the north. In recent decades, the encroachment of the Sahara Desert in the north and gully erosion due to intensive rains, especially in the southeast, have constituted significant economic and social challenges. This notwithstanding, Nigeria is reckoned to be one of the countries that is rich in biodiversity and the country’s ecological composition confers significant

DIFFUSION STRATEGY OF GREEN TECHNOLOGY AND GREEN INDUSTRY IN AFRICA
46
economic advantages. Nigeria’s agricultural land area is 83.6 million hectares, which comprises arable land (33.8 percent), land permanently in crops (2.9 percent), forest or woods (13.0 percent), pasture (47.9 percent) and irrigable land or FADAMA (2.4 percent) (Adetunji, 2006). Average rainfall ranges from 300 mm in the extreme north to about 2,500 mm in the coastal areas. The economy is still mainly agrarian and dominated by subsistence agriculture, and the agricultural sector is the largest employer of labour, employing about 70 percent of the population, though contributing only an average of about 35 percent GDP in recent years. As reported recently by FGN (2011), the oil industry represents the major source of revenue, and it contributes about 95 percent of total merchandise export receipts and 70 percent of total government revenue. Nigeria is currently one of the rapidly growing developing economies. Apart from China and India, which are reputed for their unprecedented growth rates over the last two decades, Nigeria has maintained a growth rate of more than 6 percent since the mid-2000s, signalling economic recovery and the possibility of sustainable growth and structural change. Previously, the performance of Nigeria’s economy had been unimpressive in terms of growth rate and structural transformation.
According to the Nigerian Energy Policy report from 2003, it is estimated that less than 40 percent of the population is connected to the grid and those who are connected are short of power supply over 60 percent of the time (Okoye, 2007). The grid is powered by hydropower and thermal consisting of fossil fuels. The country has other resources that are not yet being utilized. For instance, Nigeria is endowed with annual daily sunshine that averages 6.25 hours, ranging between approximately 3.5 hours in the coastal areas of the north. It receives about 49,09,212 kWh of energy from the sun which is equivalent to about 1,082 million tonnes of oil; this is about 4,000 times the current daily crude oil production, and about 13,000 times the daily natural gas production based on energy units. The country has large rivers and a few natural falls. Small rivers and streams also exist and there are currently 11 River Basin Authorities, some of which maintain minimum discharges year round. Hydropower presently accounts for about 29 percent of the total electrical power supply.
Basic facts: Kenya
Kenya has a population of 41 million (2011), 70 percent of whom live in rural areas and the remaining 30 percent in urban centres. Poverty levels have declined from 52.3 percent in 1997 to 49.5 percent in 2005 (World Bank, 2005). The national census survey found that 76 percent of rural farmers consider their land to be sufficient for them and their children. Forty-three percent of the population is under 15 years of age, 21 percent are aged between 15 and 24, and 2.7 percent are aged 65 years and older. Primary school enrolment was

47
110 percent (gross), while secondary school enrolment was 48 percent (gross) (KNBS, 2010). Literacy levels among persons aged 15-24 was 83.9 percent, while it was 81.8 percent for the total adult population (UNESCO, 2010). Since the introduction of free primary education and subsidization for secondary education, the enrolment rates have been growing, although the student-teacher ratio has not, and government expenditure on education has been on the decline (KNBS, 2012). About 40 percent of primary school participants do not graduate to the secondary level (yakaboski and Nolan, 2011). Furthermore, the education system’s hierarchical structure limits access to tertiary and higher education, undoing the benefits of the policies implemented for access at lower levels (yakaboski et al., 2011).
Kenya has a total area of 587,000 sq. km, of which 11,000 sq. km are bodies of water. Of 576,000 sq. km of Kenya’s territory, only 16 percent, that is 92,160 sq. km, has agricultural potential that can be rated as medium to high, with the remaining 84 percent being arid and semi-arid. Kenya is divided into three agro-ecological zones based on rainfall levels, altitude, temperatures, soil types, fertility and, ultimately, the range of suitable crops. The high rainfall zone has over 1,000 mm of rainfll; the medium rainfall zone has between 750-1,000 mm and the low rainfall zone has under 250 mm of rain. The high rainfall zone comprises 20 percent of agricultural productive land (18,432 sq. km) and is home to over 50 percent of the country’s population. The bulk of the country’s food and cash crops is grown and 75 percent of milk is produced in this zone. The medium rainfall zone covers 30-35 percent of the countries landmass and is home to 30 percent of the country’s population. Agricultural activities in this region include livestock rearing (cattle, sheep and goats) and the growing of draught resistant crops. High population pressure in the high rainfall zone has induced internal migration to the medium rainfall zone in the last decade. The low rainfall zone hosts 20 percent of the country’s population and 80 percent of the country’s livestock. It is also home to 65 percent of Kenya’s wildlife found in several national parks and reserves.
Given that the majority of agriculture is concentrated in the densely populated ecological zone, it is not surprising that the average small-scale farms range between 0.2-3 hectares and are characterized by low use of inputs and machinery. Seventy-five percent of Kenya’s agricultural output and 70 percent of its marketed agricultural produce originates from this zone. Settlement patterns pose a huge challenge to agricultural development and commercialization. In drier zones, livestock rearing is practiced by pastoralists who keep huge herds of animals for subsistence use and with little technological inputs. The zones offer tremendous opportunities for technology applications to develop innovative solutions to perennial draughts, nutrition for livestock, pests and
4. RESEARCH METHODOLOGY AND STUDY AREA

DIFFUSION STRATEGY OF GREEN TECHNOLOGY AND GREEN INDUSTRY IN AFRICA
48
disease control, installation of irrigation infrastructure, marketing of produce and introduction of draught resistant varieties of food.
As mentioned in section 3.4, Kenya’s maize value chain is highly concentrated with few producers, traders/importers and processors being active in the value chain along with many other smaller actors. All actors appear to be concentrated in the capital Nairobi and in regional cities in the maize growing areas. Our survey focused on both large- and medium-small processing firms located in Nairobi, Mombasa and other cities in the maize producing region such as Nakuru, Kitale, Kisumu and Eldoret. Distributors of processing equipment, both local and foreign, were identified and included in the survey to better understand the adoption process. Importers, distributors and local manufacturers of renewable energy equipment who are concentrated in Nairobi and the city’s surrounding areas were also surveyed.
4.2. Sources of data and methods of data collection
The field survey was conducted between May and June 2013. Data for the study were collected from both primary and secondary sources. Primary data provided inputs at the local level based on samples from small- and medium-sized enterprises (SMEs) in the agro-processing industry and from RET markets in the two selected countries. Case studies of EE and RETs adoption were also carried out. The primary data derived from a cross-sectional survey of cassava and maize processors across a range of cassava/maize products including fresh cassava / maize, dried chips, cassava/ maize flour, etc. as these products move along their value chains (especially from inputs to processing stage). Primary data comprised two sources. The first was survey data derived from interviews with cassava/ maize processors and RETs suppliers and marketers using semi-structured questionnaires. The second source was interviews with key stakeholders and case study analyses of selected adopters and potential adopters of EE and RETs. This was supported by secondary data and information gained from reviews of existing documents from relevant international and national sources / agencies.
The study’s main research instrument consists of two semi-structured questionnaires. The first questionnaire (technology adopters questionnaire) sought to elicit data/information from the agro-processing industry; while the second questionnaire (RET suppliers/marketers questionnaire) sought to obtain data/information from suppliers/marketers of RETs. A total of 84 respondents (22 RETs marketers; 62 cassava processing firms) from south-western Nigeria were interviewed, while a total of 81 respondents (41 RETs

49
marketers; 40 maize processing firms) were interviewed in Kenya using semi-structured questionnaires. Data elicited from the questionnaires include sales and investments into RETs and EE and the barriers to their diffusion along the cassava value chain in Nigeria and maize value chain in Kenya. In addition, detailed information about the activities of some of the selected cassava processing firms on the adoption of RETs and EE measures was gained from case studies. This entailed interviews and observations. In addition, two RET experts (J.F.K. Akinbami and Abiodun Momodu) based at the Centre for Energy Research and Development (CERD), Obafemi Awolowo University, were interviewed in the case of Nigeria. The interview questions posed to CERD’s RET experts can be found in Appendix 3.1.
A workshop with policymakers was held in Kenya to share fieldwork experiences and obtain data/information on policies that facilitate RET and EE adoption and barriers that continue to obstruct RET and EE adoption. The workshop also provided opportunities for policymakers to voice their expectations on development cooperation options for promoting the adoption of RETs and EE in Africa. Questions raised at the workshop focused on understanding the current state of green technology (RET and EE) diffusion, the extent to which green industries have been developed in Africa, factors that contribute to /constrain green technological choices and the prospects for rapid and sustained diffusion of green technology on the African continent as well as what could contribute to accelerating this diffusion. High level policymakers, e.g. the Minister of Energy in Nigeria, were interviewed on the policy process and prospects of harnessing the potentials of RET in Nigeria.
4.3. Sampling procedure
A multi-stage sampling technique was used to select the respondents (cassava processors and RETs suppliers/marketers in Nigeria and maize processors and RETs suppliers/marketers in Kenya).
In the first phase, Nigeria in West Africa and Kenya in East Africa were intentionally selected due to the study’s limited resources and the fact that it is a scoping/pilot study seeking to prepare a background report for a broad and more comprehensive study of green technology diffusion in Africa’s industry. In the second phase, , Nigeria’s southwest region comprising the states Ogun, Ondo, Oyo, Osun, Lagos and Ekiti was selected for the survey due to the limited funds available for conducting a national survey. A major cassava production belt and nearly half of Nigeria’s industrial production activities are concentrated in this region. In the third phase, three states (Ogun, Osun and Oyo) were selected due
4. RESEARCH METHODOLOGY AND STUDY AREA

DIFFUSION STRATEGY OF GREEN TECHNOLOGY AND GREEN INDUSTRY IN AFRICA
50
to the prevalence of cassava producers and processors (processing firms) as well as relevant research institutions (such as the IITA, University of Agriculture) in these areas (IITA, 2004). For instance, Ogun is now a leading producer of cassava in Nigeria, producing close to six million metric tonnes of cassava annually, and accounting for over 10 percent of the total annual national production figure (Olubori, 2012). In the fourth phase, the research sample was selected based on the sample compiled from the list of cassava processing firms obtained from cassava processing groups in each of the selected states with assistance of the State Agricultural Development Programme (ADP), the Cassava: Adding Value for Africa (C:AVA) project and the Agricultural Media Resources and Extension Centre (AMREC) of the Federal University of Agriculture, Abeokuta (FUNNAB). This was complemented by the snowballing sampling technique, as some of the firms listed in the sample were found to be no longer operational. Through the snowballing technique, other firms were identified and interviewed. A total number of 62 cassava processing firms (17 in Ogun, 22 in Osun and 23 in Oyo) actively involved in cassava processing were sampled and interviewed.
Figure 4.1: Regions in Nigeria (cassava firms) where the survey was conducted (coloured)

51
In Kenya, maize processing firms were initially identified through desk research involving an extensive literature review. Part of the milling firms were identified from a study conducted in 2009 while the rest were found with an ordinary Internet search. Maize millers are concentrated in large cities, the majority of which are located in Nairobi and operations being carried out in cities’ industrial zones, which made it easier to visit them. However, in traditional maize producing areas such as Eldoret, Uasin Gishu and Kitale, there were no millers, although large companies own the collection and storage facilities based there. Mombasa, albeit not a maize producing zone, hosts several large millers who thereby avoid the transportation and storage costs related to imported maize.
The majority of millers interviewed were based in Nairobi and its suburbs, while the rest were based in Thika, Nanyuki, Nakuru, Eldoret and Mombasa. This is a reasonable geographical distribution of milling firms in the country. Firms visited ranged from the largest in the country to one-man operated posho mills in poor residential areas. Both geographical distribution and the mix of firm size are a good representation of the national maize industry in Kenya.
Figure 4.2: Regions in Kenya (maize processors) where the survey was conducted (coloured)
4. RESEARCH METHODOLOGY AND STUDY AREA
Nakuru
Laikipia
UsainGishu
Nyeri
Kajiado
Meru
Kiambo

DIFFUSION STRATEGY OF GREEN TECHNOLOGY AND GREEN INDUSTRY IN AFRICA
52
For the case study, six firms (three adopters and three potential adopters of EE and RETs) were intentionally selected from the list of 62 firms interviewed based on the types and level of adoption of EE/ RETs and information collected from the respondents during the first interview on these firms’ readiness to allow further visits and interviews. The selected firms were revisited, closely observed and interviewed in more detail. Each firm actively participated in the study, and the respondents agreed to disclose their identity (see Tables 4.1 and 4.2 which present the key features of the firms included in the case study).
To select RET suppliers and marketers, the list of RET marketer/supplier firms in Nigeria was compiled mainly through an extensive literature review, an Internet search and snowballing. The findings revealed that over 80 percent of RET marketers/suppliers in Nigeria are located in Lagos, which is the main industrial centre of the country. We therefore selected Lagos and Oyo which coincidentally are located in southwest Nigeria. The suppliers were initially contacted by telephone before being interviewed, and while some agreed to be interviewed, others refused. A total of 22 RET suppliers/marketers were interviewed in Nigeria (21 in Lagos and 1 in Ibadan, Oyo).
In Kenya, RET marketers/suppliers were identified through a desk research. Since the number of firms identified thereby was not large enough, a snowballing approach was used by asking respondents to provide the contact details of someone they knew who works in the same business. This approach proved useful in supplementing our initial list. The bulk of firms in RET distribution are located in Nairobi, although some can be found in smaller cities as well. The firms contacted were all based in Nairobi and to a lesser extent in Mombasa, with their operations spread out throughout the country both in urban and in rural areas. The location of implemented RET projects depended on the type of RET supplied. The suppliers visited were largely small firms and nearly half of them had less than 10 permanent employees. Several large firms were also included in the sample.
In terms of importing, wholesale and retailing of RETs, firms included in the sample are a good representation of RET distributors in Kenya both in terms of scale of operations as well as type of RET distributed. From the perspective of RET adoption in terms of wattage and joules, small-scale technologies are overrepresented. The main reason for focusing on RET sellers instead of RET project developers is that this study seeks to examine the market characteristics of tradable RETs. Large developers implement projects and sell electricity directly to the national distribution agency and thus do not participate in the ordinary RET market. Another reason was that most of those contacted were

53
not available and were in inaccessible locations where projects are based. If they were willing to participate, their availability to be interviewed fell on dates that were beyond the field work period. These large developers together make a much larger contribution to the national energy supply, and the fact that they are not covered means that this report offers insights mainly into the importation, wholesale and retail of RETs.
Table 4.1: Key features of Nigeria’s cassava processing firms included in case study
S/ N
Name of firm
Types EE and RETs
Year estab-lished
Quantity of cas-
sava pro-cessed/
day
Capac-ity
utiliza-tion
No. of persons
employed full-time
Main product
Sources of main tech
equipment
1 Deban Faith Adopter of EE 2007 32 tonnes 60 10
Flour, starch,
fufu, gari
Locally fabricated
2
Irewolede Fadama
Community Association
(FCA)
Adopter of EE, adopter
of RET (biomass)
2007 7 tonnes 90 10Gari, fufu,
starch
Combina-tion of local
& foreign equipment
3Psaltery In-ternational
farm limited
Potential adopter of
EE, adopter of RET
(biomass)
2005 70 tonnes 70 50 Starch, flour
Completely foreign
4Ifelodun Cassava
Processing Industry
Potential adopter of
EE (a UNIDO supported
centre)
2004 2 tonnes 50 6
Gari, fufu,
chips, tapioca, starch
Locally fabricated
5Rewaju
Foods Lim-ited
Adopter of RETs and potential
adopter of EE2010 2.6
tonnes 902 (per-
manent) 15(tem-porary)
Gari, tapi-
oca and lafun
Locally fabricated
6BISMONCO Nigeria Lim-ited (BNL)
Adopter of EE 2009 2.2
tonnes 60 15Cassava
flour, lafun, gari
Local fabricators
4. RESEARCH METHODOLOGY AND STUDY AREA
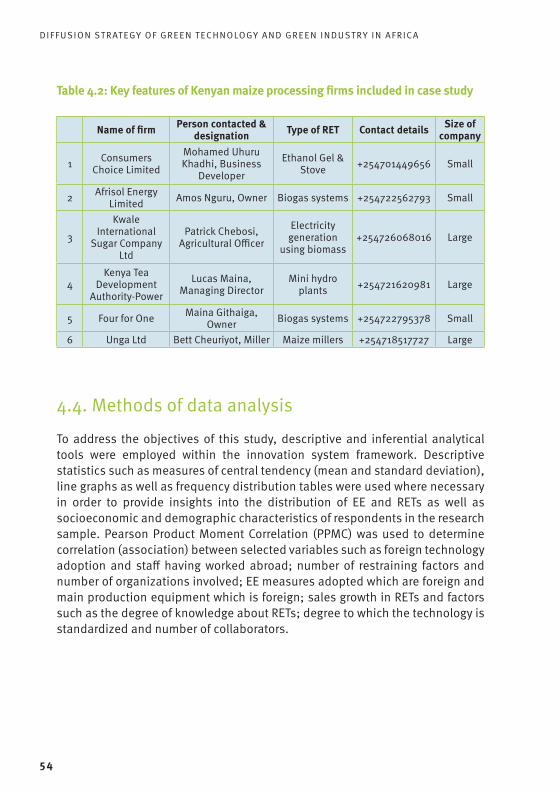
DIFFUSION STRATEGY OF GREEN TECHNOLOGY AND GREEN INDUSTRY IN AFRICA
54
Table 4.2: Key features of Kenyan maize processing firms included in case study
Name of firm Person contacted & designation Type of RET Contact details Size of
company
1 Consumers Choice Limited
Mohamed Uhuru Khadhi, Business
Developer
Ethanol Gel & Stove +254701449656 Small
2 Afrisol Energy Limited Amos Nguru, Owner Biogas systems +254722562793 Small
3
Kwale International
Sugar Company Ltd
Patrick Chebosi, Agricultural Officer
Electricity generation
using biomass+254726068016 Large
4Kenya Tea
Development Authority-Power
Lucas Maina, Managing Director
Mini hydro plants +254721620981 Large
5 Four for One Maina Githaiga, Owner Biogas systems +254722795378 Small
6 Unga Ltd Bett Cheuriyot, Miller Maize millers +254718517727 Large
4.4. Methods of data analysis
To address the objectives of this study, descriptive and inferential analytical tools were employed within the innovation system framework. Descriptive statistics such as measures of central tendency (mean and standard deviation), line graphs as well as frequency distribution tables were used where necessary in order to provide insights into the distribution of EE and RETs as well as socioeconomic and demographic characteristics of respondents in the research sample. Pearson Product Moment Correlation (PPMC) was used to determine correlation (association) between selected variables such as foreign technology adoption and staff having worked abroad; number of restraining factors and number of organizations involved; EE measures adopted which are foreign and main production equipment which is foreign; sales growth in RETs and factors such as the degree of knowledge about RETs; degree to which the technology is standardized and number of collaborators.

55
5. EmPiriCAL AnALySiS oF GrEEn tECHnoLoGy diFFuSion in AFriCA
5.1. Status and potentials of RETs and EE adoption in Africa
As observed in Chapter 2, most African countries are endowed with large renewable energy (RE) resources, but their lack of expertise, poor management and policies have kept them at the bottom of RE implementation (Nwulu and Philips, 2011). Africa’s energy industry is best understood when divided into three distinct regions. North Africa is heavily dependent on oil and gas, South Africa depends on coal and the rest of sub-Saharan Africa mainly relies on biomass energy (Karekezi, 2002). Biomass energy, which refers to a wide range of natural organic fuels such as wood, charcoal, agricultural residues and animal waste, is often used in its traditional and unprocessed form (Karekezi et al., 2003).
In the Renewable scenario of the International Renewable Energy Agency (IRENA, 2012), electricity generation in Africa is projected to increase from 620 TWh in 2008 to 3,146 TWh in 2050, 15 percent lower than in the Reference scenario. Renewables will generate half of Africa’s electricity in 2030 and nearly 75 percent in 2050. As shown in Figure 5.1, the renewables share is expected to increase from 17 percent in 2009 to approximately 30 percent in 2050. The share of solar PV will grow from virtually none in 2008 to 8 percent in 2030 and 14 percent in 2050. Solar thermal (CSP) is expected to grow to 6 percent of total generation in 2030 and 10 percent in 2050; wind will reach 14 percent in 2030 and 17 percent in 2050; and biomass technologies will reach 4 percent in 2030 and 10 percent in 2050. Hydro’s share will be relatively stable at 17 percent in 2030 and 21 percent in 2050. Fossil fuel-based generation will fall to 50 percent in 2030 and 23 percent by 2050, and nuclear will play a minor role in the future.

DIFFUSION STRATEGY OF GREEN TECHNOLOGY AND GREEN INDUSTRY IN AFRICA
56
Figure 5.1: Share of primary energy sources in African electricity generation
Source: IREN (2012)
Most of the early policy initiatives on renewable energy in the region were driven by the oil crises of the early and late 1970s. In response to the crises, governments established either an autonomous Ministry of Energy or a department dedicated to the promotion of sound energy policies, including the development of RETs. For example, in its Third National Development Plan (1979-83), Zambia responded by outlining policy proposals to develop alternative forms of energy as partial substitutes for conventional energy resources. Unfortunately, once the energy crisis subsided, government support for energy development and RETs activities diminished significantly.
5.2. Status and potentials of RETs and EE ado ption in Nigeria and Kenya
Nigeria’s energy situation
Table 5.1 presents the huge potential for renewable energy and in Nigeria. These energy resources remain largely unexploited and, consequently, the existing renewable energy projects in the country are very few. The existing projects are mostly funded and implemented by international agencies and non-government organizations, and they are typically pilot or demonstration projects. The mode of funding usually takes place through grants, resulting in a distorted market situation that can neither be sustained over time nor replicated throughout the country. Nigeria’s adoption of ‘new’ renewable energy sources including solar
0%
20%
40%
60%
80%
100%
Ref2009 2030 2050
RenewRenew Ref
17 22 50 29 73
RenewablesFossil fules and nuclear83 78 50 71 27

57
photovoltaics, solar thermal, wind, small hydropower and efficient biomass is a relatively recent development when compared to developed countries. Unlike the United States, the United Kingdom, Japan and Germany, Nigeria is far behind in the development of solar photovoltaic technology. Local research and development activities in this technology are scanty. There appears to be no investment in RETs in comparison to other energy generating sources like hydro, thermal, nuclear and others. The level of renewable energy technology diffusion in Nigeria is very low, if not negligible. A handful of wealthy individuals and corporations have installed standalone renewable energy systems to supplement the erratic power supply from the national grid, but there is no official estimate of their number. A 1999 survey conducted by the Energy Commission of Nigeria (ECN) revealed that 44 companies and research centres were involved in the import and installation of photovoltaic systems out of which only one national company produces batteries for use in photovoltaic systems.
Even though solar photovoltaic technologies are gaining increasing acceptance in Nigeria, the level of knowledge about these technologies and their market potential is still highly inadequate (Nwulu and Agboola, 2011). Below we discuss the status of renewable technologies and sources:
Solar energy: Solar PV is emerging as a major power source in Nigeria, although the annual quantity of energy and power generated by this source is not yet documented. This technology is presently being applied in Nigeria by the government as a source of power for traffic systems and advertising bill boards of large enterprises. Solar power has already penetrated the Nigerian energy scene with many street lights being powered by solar PV cells. The technology is increasingly being used as an alternative source of energy by households to power their electrical appliances such as refrigerators, bulbs, fans, village electrification, water pumping and purification as well as heating sources in Nigeria.
PV technologies are showing increasing promise in terms of efficiency improvements and costs. The estimated lifetime of PV modules is 25 and 30 years, making them exceptionally attractive for investors. Today, all PV modules in the Nigerian market are imported. The annual average of total solar radiation varies from about 12.6 MJ/m2/day (3.5 kWh/ m2/day) in the coastal latitudes to about 25.2 MJ/ m2/day (7.0 kWh/ m2/day) in the far north. This gives an average annual solar energy intensity of 1934.5 kWh/m2/yr; thus, over the course of a year, an average of 6,372,613 PJ/yr (≈1,770,000 TWh/yr) of solar energy falls on Nigeria’s entire land area (Bala et al., 2000). This is equivalent to about
5. EMPIRICAL ANALYSIS OF GREEN TECHNOLOGY DIFFUSION IN AFRICA

DIFFUSION STRATEGY OF GREEN TECHNOLOGY AND GREEN INDUSTRY IN AFRICA
58
120,000 times the total annual average electrical energy generated by the PHCN. With a 10 percent conservative conversion efficiency, the available solar energy resource is about 23 times the Energy Commission of Nigeria’s (ECN) projection of total final energy demand for Nigeria in the year 2030 (ECN, 2005).
Wind: Wind power is mostly used in Nigeria to power water supply, especially in the northern part of the country. Recently, efforts by Nigeria’s government have largely been geared towards its use for electricity generation. Wind speed is generally weak in southern Nigeria, ranging from 1.4 - 3.0m/s and high in the far north with a range of 4.0 - 5.12m/s. Available wind data shows that wind energy installation in Nigeria generate about 2.2 MW.
Wind energy has a long and chequered history in Nigeria. Wind was initially harnessed for pumping water in Nigeria as early as the 1960s, with installations of hundreds of locally manufactured wind pumps in the northern part of the country being rendered useless due to the lack of maintenance culture. However, a few northern states (e.g. Jigawa, Kano and Katsina) have undertaken efforts in recent years to revitalize and promote investments in wind energy.
Biomass/gas: Biomass is a major source of energy in Nigeria, contributing about 78 percent of the country’s primary energy supply. It is the main source of household fuel generated mainly from forest products such as wood, agricultural crops/residues, municipal solid and animal waste. Agricultural crop residues mostly used in Nigeria include cassava, rice (rice husk) and oil palm (palm kernel).
Biogas research began in Nigeria in 1982. Since then, research activities have continued, but not intensely enough for this technology to attain commercial status in the country. As demonstrated in Figure 5.2, biomass dominates the structure of energy consumption in Nigeria. It is estimated to contribute about 97 percent of household energy needs (IEA, 2001). As shown in Table 4.2, biomass resources in Nigeria have been estimated to be about 816 MJ. Biomass can be utilized as fuel for small-scale businesses and industries. Biogas assessment in Nigeria has identified feedstock substrate, which is considered to be an economically feasible biogas and includes dung, water lettuce, water hyacinth, cassava leave, solid (including industrial) waste, urban refuse, agricultural residues and savage (Akinbami et al., 2001). The fact that biomass and biogas technology is relatively cheap and locally obtainable has not proven an adequate incentive for full take-off of this technology in the country. Even though countries like India, China and Kenya are notable examples in the development and use of improved woodstoves, their diffusion is still not a reality in Nigeria.

59
Current efforts by the Nigerian government to improve biomass utilization are predominantly directed towards the transportation industry. The 2007 bioethanol policy specifies 10 percent ethanol inclusion into petroleum products. Current estimates show that around 61 million tonnes/year of animal waste can be collected and that about 83 million tonnes/year of crop residue can be obtained. The use of staple crops like cassava, sugarcane and sorghum for the production of ethanol in Nigeria has been highly criticized, as these are staple foodstuffs for a majority of the country’s population. The government can extend the use of bioethanol into power generation which will produce a significant effect, since feedstock for bioethanol is renewable.
Hydroelectric power: Hydropower is an important supply technology providing about 32 percent of Nigeria’s national electricity grid supply. The gross hydro potential for the country is approximately 11 GW, enough to power the current electricity generation in the country. Current hydropower generation amounts to about 10 percent of the country’s hydropower potential, which represents about 50 percent of total installed grid connected electricity generation capacity. The percentage share of electricity generated from hydroenergy source is about 38.1 percent43. The value for electricity production from hydroelectric sources (kWh) in Nigeria was about 6,374,000,000 in 2010. Hydroelectricity is generated from running water by building a dam across a lake or river in a valley to trap water. The water flows through tunnels and turns the turbines which generate electricity
The technical and economic prospects for renewable use are good, but the education system is poorly geared towards renewables. Renewable energy education has not been incorporated into the academic curriculum of universities and other tertiary institutions in Nigeria. There is presently no educational institution in the country that offers training on renewable energy at any level. The application of renewable energy to fields such as engineering, geography and architecture is not being taught, and professionals in these fields are therefore not aware of the value renewable energy can add to their work.
43 http://www.nationmaster.com/country/ni-nigeria/ene-energy
5. EMPIRICAL ANALYSIS OF GREEN TECHNOLOGY DIFFUSION IN AFRICA

DIFFUSION STRATEGY OF GREEN TECHNOLOGY AND GREEN INDUSTRY IN AFRICA
60
Table 5.1: Renewable energy resources in Nigeria
S/N Resource type Reserves ( natural units) Utilization level1. Large hydropower 11.25 MW 1.972 MW2. Small hydropower 3,500 MW 64.2 MW
3. Solar radiation3.5 – 7 KWh/m2/day (485million MWh/d using only 0.1% of our land
- 10 MW solar PV stand-alone
- No solar thermal electricity
4. Wind (2.4) m/s at 10m height
- 2x2.5 KW electricity generator
- 10 MW wind farm contracted in 2009
5. Biomass
Fuel wood 11 million hectares of forest and woodland
43.4 million tonnes of fuel wood/yr
Animal waste 245million assorted in 2001
Energy crops and agric. residue
72million hectares of agric. land
Sources: NNPC (2007); REMP (2005); Ministry of Mines and Steel Development (2008)
Figure 5.2: Distribution of total energy consumption in Nigeria in 2010
Traditional biomass & waste Oil Natural gasHydro
Note: Nigeria consumed about 9,000 short tons of coal in 2010.
13%
82%
1%
4%

61
Kenya’s energy situation
Kenya has huge potential for modern renewable energy, just like Nigeria. Renewable energy can enhance energy security and sustainable development in Kenya. Research shows that demand for electricity has been on an upward trend since 2004, largely due to economic growth. There has been a tremendous increase in demand for electricity and the number of electricity consumers has more than doubled between 2004/5 and 2013. 44 Connection rates are, however, still fairly low. In June 2013, 28.9 percent of the Kenyan population was connected to electricity while only 4 percent of those living in rural areas were connected.45
Like Nigeria, traditional biomass accounts for the bulk of total energy consumption. The economic survey of 2013 showed that biomass provides 69 percent of Kenya’s overall energy requirements, followed by petroleum (22 percent) and electricity (9 percent)46
Figure 5.3: Distribution of total energy consumption in Kenya, 2013
Source: Ministry of Energy and Petroleum of Kenya
44 Ministry of Energy and Petroleum of Kenya, National Energy Policy Report, November 2013.45 Ibid.46 Kenya, National Energy Policy Report, 2013.
5. EMPIRICAL ANALYSIS OF GREEN TECHNOLOGY DIFFUSION IN AFRICA
Biomass (Renewable Energy)Petroleum (Fossil Fules)Electricity
Note: Ministry of Energyand Petroleum of Kenya
22%
69%
9%

DIFFUSION STRATEGY OF GREEN TECHNOLOGY AND GREEN INDUSTRY IN AFRICA
62
Below we discuss the status of renewable technologies and sources.
Solar energy: Kenya’s geographical location astride the equator gives the country a unique opportunity to participate in a vibrant solar energy market47. Kenya has an abundance of solar energy resources and it is estimated that the country has a daily insolation of 4-6 KWh/m2.48 The solar energy market has developed gradually over the past years to provide electricity to people who are not connected to the national grid. However, there is still relatively low utilization due to low awareness of the potential opportunities.49 Another barrier is the high initial capital costs. To increase further investment, the government has introduced a zero-rated import duty and removed the Value Added Tax (VAT) on renewable energy equipment and accessories.50 In 2005, it was estimated that the annual market demand for PV panels was 500 KWp and was projected to grow at 15 percent annually.51
Wind: Kenya has a proven wind energy potential of as much as 346 W/m2 in many regions.52 There are high wind speeds in various parts of northern Kenya and some other areas. The installed wind energy capacity is 5.4 MW and is operated by the Kenya Electricity Generating Company (KenGen) at the Ngong site, where winds are high.53 In Kenya, exploitation of wind energy has become more attractive due to the rising price of oil.54 However, there is a lack of sufficient data on wind sites. It is estimated that wind regimes in certain parts of Kenya, like Marsabit, Ngong and the coastal region, can support commercial electricity generation with a potential to produce over 1,000 MW of wind power. High capital costs and absence of a good wind regime are the main reasons for the lack of exploitation. Plans for development of wind energy in Kenya exist, however.
Biomass/gas: Biomass fuels are the most important and largest source of primary energy in Kenya. Biomass is largely non-commercial and comprises 69 percent of final energy demand. The main sources of biomass are charcoal, agricultural waste and wood fuel, which is the largest source of biomass.55 Biomass is used by a majority of rural households as well as by a significant part of the urban poor. About 90 percent of rural households use biomass for
47 National Energy Policy Report, 2013.48 Ibid.49 Institute of Economic Affairs, 2013.50 Energy Regulatory Commission, Erc: http://www.erc.go.ke/, accessed on 28th January 2014.51 Ibid.52 National Energy Policy Report, 2013.53 Institute of Economic Affairs, 2013.54 National Energy Policy Report, 2013.55 Ibid.

63
energy.56 The main reasons are local availability and low price. Biomass use, however, comes with a cost to users and society. Reliance on biomass for energy has resulted in deforestation and decline of water resources, and is associated with respiratory diseases and economic loss through labour and time used to collect fuel wood. There is a need to shift towards modern forms of biomass use which are biogas, the burning of biomass in co-generation plants and biofuels.
Biogas in Kenya is generated in more than 8,000 biogas plants using different raw materials like agricultural waste.57 The total capacity of biogas is unclear as there are no consolidated data on this. The potential of biogas is estimated at 1,000 MW.58 The biofuel market is small but has appreciable potential.
Hydroelectric power: Hydropower is the most successful form of renewable power with a huge potential for further exploitation. Kenya has a hydropower potential of approximately 6,000 MW comprising both large and small hydro plants.59 The country’s current installed hydropower capacity is 814 MW60. Of the large hydros, 807 MW has been exploited, while only 25 MW of the small hydros has been exploited.61 Just like other renewable energy sources, hydropower has high installation costs, averaging at 2,500 per KW.62 Moreover, it is highly dependent on climate changes which limit its full capacity, and there is limited local training and knowledge to manufacture small hydro plants.63 In addition, there are inadequate hydrological data which are important for building hydropower plants.
Geothermal: Geothermal power plants use steam or hot water from a natural underground reservoir to generate electrical energy.64 Current capacity in Kenya is 198 MW, but the future of geothermal seems promising because additional projects are being developed by the government. It is estimated that Kenya has more than 14 high temperature prospective sites in the Rift Valley, with an estimated potential of 7,000-10,000 MWe.65 Geothermal energy has numerous advantages. First, it is not affected by drought or other climate changes unlike hydropower. Secondly, it is a form of green energy that does not have adverse effects on the environment. Thirdly, geothermal energy is indigenous and
56 Institute of Economic Affairs, 2013.57 Energy Regulatory Commission, accessed on 28th January 2014.58 Ibid.59 National Energy Policy Report, 2013.60 Institute of Economic Affairs, 2013.61 National Energy Policy Report, 2013.62 Renewable Energy Policy Report, 2013.63 Institute of Economic Affairs, 2103.64 National Energy Policy Report, 2013.65 Institute of Economic Affairs, 2013.
5. EMPIRICAL ANALYSIS OF GREEN TECHNOLOGY DIFFUSION IN AFRICA

DIFFUSION STRATEGY OF GREEN TECHNOLOGY AND GREEN INDUSTRY IN AFRICA
64
readily available in Kenya and is particularly suitable for Kenya’s situation.66 This is why geothermal energy has become a target for power generation. Vision 2030 aims to increase it to 1,600 MW by 2016 and 5,000 MW by 2030. 67
As illustrated in Figure 5.4 below, Kenya’s electricity is currently generated as follows: hydro 53.1 percent, diesel 25.5 percent, geothermal 19.8 percent, co-generation 0.9 percent, imports 0.5 percent and wind 0.2 percent68. This translates into 74.5 percent of Kenya’s electricity being generated by renewable sources. The total amount of the renewable energy used in electricity generation increased from 66 percent in 2011 to 74.5 percent in 2013. 69 Moreover, the amount of fossil fuels in electric power generation has decreased from 34.1 percent in 2011 to 25.5 percent in 2013. The decrease in fossil fuels is attributable to the increased prices of imported fossil fuels. Geothermal energy increased from 13.2 percent in 2011 to 19.8 percent in 2013. This considerable increase can be explained by the active and committed role played by the government and many ongoing projects in the areas of the Rift Valley in Kenya.
Figure 5.4: Electric power generation sources in Kenya, 2013
Source: Ministry of Energy and Petroleum of Kenya
66 Energy Regulatory Commission, accessed on 28th January 2014.67 Ibid.68 National Energy Policy Report, 2013.69 The statistics are consistent, since the two documents used in this report, National Energy Policy Report, 2013 and
Energy Regulation Commission, indicated similar ranges of statistics.
Hydro Fossil fuels Geothermal
Cogeneration WindImports
Note: 74.5% renewable energy & 25.5% fossil fules were usedSource: Ministry of Energy and Petroleum of Kenya
22,50%
19,80%
53,10%
0,50%
0,90%
0,20%

65
Table 5.2 provides an overview of the use and total potential of various renewable energy sources. It illustrates that there is huge potential for renewable energy in Kenya. However, Kenya lacks the investments, local capacity and skills to exploit its affluence of renewable energy sources.
Table 5.2: Renewable energy sources in Kenya
Resource type Potential Current capacity
1. Hydroelectric power
- 3,000MW in small hydro- 6,000MW comprising of large and
small hydro plants
Large hydro power: 807MW Small hydro power: 25MW
2. Solar energy 4-6 KWh/m2/day
- Small PV systems with capacity of 12-50W
- PV systems: 1,450 KW in 450 institutions
3. Wind
- 346W/m2
- wind speed ranges 8-14m/s in some areas and have potential to produce over 1,000MW
5.45 MW (June, 2010),and additional 20 MW (2013)
4. Geothermal 7,000-10,000MW in 14 potential sites in Rift Valley 212MW
5. Biomass- co-generation using sugarcane
bagasse up to 193MW- more opportunities up to 300MW
6. Biogas 1,000MW
Sources: National Energy Policy Report (2013); Renewable Energy Portal, Energy RegulatoryCommission; Institute of Economic Affairs, Kenya (2013)
A key challenge for the country’s electricity agencies KPLC and KenGen is the expansion of generation and transmission capacity against the rapidly increasing demand for electricity. The other challenge is that the cost of electricity in Kenya is high compared to other countries in the region, rendering the county’s economy uncompetitive. Nevertheless, the future seems positive because there are many committed and ongoing renewable energy projects in Kenya. The government is taking initiatives and the responsibility to electrify the entire country. Table 5.3 presents the status of Kenya’s committed and ongoing energy projects.
5. EMPIRICAL ANALYSIS OF GREEN TECHNOLOGY DIFFUSION IN AFRICA

DIFFUSION STRATEGY OF GREEN TECHNOLOGY AND GREEN INDUSTRY IN AFRICA
66
Table 5.3: Kenya’s committed and ongoing energy projects
Committed and ongoing energy projects in Kenya
Projects by National Generating Agency (KENGEN) RET Type Capacity (MW)
Expected Commissioning Date
Wellhead Units Geothermal 10 Jun-2013Wellhead Units Geothermal 15 Dec-2013Wellhead Units Geothermal 40 Dec-2014Olkaria IV Geothermal 140 Sep-2014Olkaria 1 –Life Extension Geothermal 140 Jun-2014Ngong phase II Wind 13.6 Jul-2014Ngong 1 phase II Wind 6.8 Jul-2014Kindaruma 3rd unit Hydro 32 June 2013SubTotal 397
Projects by Independent Power Producers (IPPS) RET Type Capacity (MW)
Expected Commissioning Date
Athi River 1 Diesel 80 Jan-2014Athi River 2 Diesel 83 Feb-2014Thika 1 Diesel 87 Jun-2013Lake Turkana Wind 300 Jul-2015Aeolus wind Wind 60 Jan-2015Kipeto Wind Wind 100 Jul-2015Prunus Wind Wind 50 Jul-2015Orpower4 Geothermal 36 Mar-2013Orpower4 Geothermal 16 Mar-2014Kwale Sugar Co. Ltd Biomass 18 Dec-2014Small Hydros (Genpro,Gura and Hydel) Small hydro 21 Jul-2015
Sub Total 851 Total 1248

67
5.3. Overview of policy for promoting RETs and EE diffusion and adoption in Nigeria and Kenya
Policies in Nigeria
Prior to 2003, when an energy policy was proposed for Nigeria, the country had no comprehensive energy policy. Instead, the country had separate policy documents for different energy sub-industries, namely electricity, oil, gas and solid minerals, with no consideration for the inclusion of renewable energy sources in the national energy mix. The Nigerian National Energy Policy was approved in 2004 with the overall thrust of optimal utilization of the nation’s energy resources; both conventional and renewable energy for sustainable development and with the active participation of the private sector. The policy provided guidelines for the coordination and general surveillance of the systematic development of energy resources in Nigeria. Nine objectives of the energy policy were enumerated ranging from the development of the nation’s energy resources to a guaranteed, adequate, reliable and sustainable supply of energy, to the process of acquisition and diffusion of technology and management expertise. The first draft of the Energy Policy was issued by the Federal Ministry of Science and Technology in 1984. This was followed by a draft National Energy Policy published by the Energy Commission of Nigeria (ECN) in 1993. Currently, EE and RETs are regulated by the Energy Commission of Nigeria (ECN). The National Energy Policy recognized the need for energy security and called for the diversification of the country’s energy supply mix. It recommended pursuing the development of alternative fuels from locally available energy resources. The policy also acknowledged the role of private sector participation in the areas of building, maintenance and refurbishment of energy supply infrastructure. It asserted that increased private sector participation will attract new investments and resolve many of the management problems associated and experienced under public ownership. It thus called for both the deregulation and privatization of crucial energy industries. The National Energy Policy accepted the need for effective coordination of the various energy sub-industries. It recognized the multi-dimensional nature of energy and addressed a number of issues for optimal utilization of the nation’s resources for sustainable development. One problem with Nigeria’s energy policy is that it underestimated the benefits of energy efficiency for society, the environment and economic growth. The outcome of this is energy wastage, primarily due to the use of inefficient technologies, corruption and a low level of infrastructural development. Secondly, solar energy is not part of Nigeria’s energy mix, as it is currently at an early stage of development. Thirdly, issues
5. EMPIRICAL ANALYSIS OF GREEN TECHNOLOGY DIFFUSION IN AFRICA

DIFFUSION STRATEGY OF GREEN TECHNOLOGY AND GREEN INDUSTRY IN AFRICA
68
relating to present and future energy needs of the urban poor, women, children, rural population and other vulnerable groups have not been properly addressed (Etim and Oni, 2012).
Nigeria introduced a Renewable Energy Master Plan (‘Renewable Energy Plan’) prepared by the ECN in 2005. The plan’s main objective is to upscale the use of renewable energy. The Renewable Energy Plan articulates Nigeria’s vision for achieving sustainable development. It also aims to move the economy from a monolithic fossil fuel-based economy to one driven by an increasing share of renewable energy in the national energy mix. It involves the exploitation of renewable energy in quantities and at prices that will promote the achievement of equitable and sustainable growth. Under the current energy policy, the biomass resources of Nigeria have been identified as wood, forage grasses and shrubs, animal waste and waste arising from forestry, agricultural, municipal and industrial activities, as well as aquatic biomass. Nigeria’s biomass energy resources have been estimated to be significant and it is expected that the non-fuelwood biomass energy resources will be harnessed and integrated with other energy resources.
REMP stipulates a national vision, targets and a road map to address key development challenges Nigeria faces through an accelerated exploitation of renewable energy. It classifies renewable energy targets into three levels according to the timeframe for implementation: short-term (2005-2007), medium-term (2008-2015) and long-term (2016-2025). Therefore, the plan spans a period of 20 years by which new renewable energy sources are expected to contribute 10 percent of the nation’s energy supply. The REMP proposes six different activities to be implemented within six different programmes: the Framework Programme for Renewable Energy Promotion; the Nigerian Solar Programme; the Nigerian Small Hydro Programme; the Nigerian Wind Programme; the Nigerian Biomass Programme and the New Energy Research and Development Programme.
The deadline for achieveing the short-term goals (2007) has passed, and not many of the set tasks have been accomplished. One shortcoming of the REMP observed by Sesan (2008) is that it does not advocate a separate rural renewable energy programme. It acknowledges that renewable energy is a viable tool for fostering rural empowerment and development, but does not fully capitalize on the unique opportunity presented for rural development by renewable energy technologies.

69
Policies in Kenya
Kenya has implemented numerous policy and institutional reforms in the energy industry since the mid-1990s. Prior to these reforms, the energy industry was plagued by the usual problems common in many public utilities in SSA. The initial wave of institutional reforms commenced in 1997 when the Power Act of 1996 entered into force. The first major reform was the separation of responsibilities which saw the formation of KenGen, tasked with the responsibility to oversee the generation of electricity in all public plants in the country. KPLC, which had previously been responsible for planning, the generation, transmission and distribution of electricity, was now responsible for transmission and distribution only. The Electricity Regulatory Board (ERB) was established to regulate electricity issues under the same Act of Parliament and the Rural Electrification Fund was founded to expand access in rural areas.
The second wave of reforms was introduced following the enactment of the Energy Act 2006, creating momentum for further changes. Under this new act, the Energy Regulatory Commission (ERC) was created replacing the ERB and tasked with a more comprehensive mandate covering the entire energy industry. Key among this task was supervision of energy agencies’ performance targets, interests of consumers and other stakeholders through the regulation of all market prices of energy sources, tariffs, license issuances and dispute arbitration in the energy industry. The Kenya Electricity Grid Code 2008 synthesizes regulations and standards in the electricity industry for all stakeholders and is a key instrument used by ERC.
Since then, a number of developments have taken place under the supervision of the ERC. One of these is tariff restructuring to reflect long run underlying costs of electricity provision, thus eliminating losses. This is in addition to the 25 percent increase in the cost of electricity under the initial wave of reforms. The second change is the enforcement of the international competitive bidding system which has since resulted in corrections of contracting mishaps that occurred with the first two IPPs as well as helping to reduce incidences of corruption. A third development is the formulation of a Feed-in-Tariff which has provided guidelines, standards and clarity necessary for private sector participation. The FiT has been amended in the recent years to include other energy resources such as solar and biomass which had previously been excluded. The minimum generation capacity has been reduced to 3 MW. This has led to the development of numerous smaller power plants around the country such as those established in the tea industry.
5. EMPIRICAL ANALYSIS OF GREEN TECHNOLOGY DIFFUSION IN AFRICA

DIFFUSION STRATEGY OF GREEN TECHNOLOGY AND GREEN INDUSTRY IN AFRICA
70
A fourth challenge is overall electricity planning which is carried out by a planning committee due to the lack of ERC’s capacity, which brings together relevant agencies and government departments. ERC takes the lead in the committee’s activities. One of this committee’s key outputs is the Least Cost Power Development Plan (LCPDP 2011-2031), a planning tool that has helped the government formulate energy development targets and to align these with other national strategies. The plan provides outlays of forecasted energy demand in accordance with the national Socio-Economic Development Strategy Vision 2030 as well as resources that offer best returns in terms of costs and long-term sustainability. Identifying energy targets based on different resources, FiT and a regulatory body have helped set the stage for private sector participation. The fifth development is partial privatization (30 percent) of KenGen in 2006 and later of KPLC (50 percent). Commercialization and regulatory oversight by ERC has significantly reduced inefficiencies and both enterprises have been recording growth in terms of output and revenue.
Other agencies have also been set up under the new energy reforms. The Rural Electrification Authority (REA) was created in 2007 to expand rural electrification and by 2010, had helped raise the number of rural customers by 88 percent. The Geothermal Development Company (GDC), already foreseen under Sessional Paper No. 4 of 2004, has been tasked to undertake exploratory drilling and feasibility work for geothermal resources, thus reducing the cost for private sector developers. The Kenya Electricity Transmission Company (KETRACO), which is fully state owned, has been mandated with the development, operation and ownership of new electricity power lines. Electricity infrastructure development is part of an ongoing effort to enhance the national transmission grid in order to facilitate regional interconnectivity with Ethiopia, Tanzania and Uganda. KETRACO was established to circumvent a challenge that arises from the unique ownership of KPLC (50 percent public, 50 percent private) that make it difficult to secure the huge capital outlay needed from donors to expand the grid. There is expectation that KETRACO will take over transmission from KPLC in a further institutional restructuring in the future. Energy efficiency has also been an area of concern in the reform process in terms of generation, transmission, distribution and use. On the supply side, state utilities have started enhancing the efficiency of their processes while in the area of use, KPLC is implementing pilot phases for smart grids in two large cities. On the demand side, energy efficiency has also been addressed in the Energy Act. The ERC is working together with industry to promote efficient energy management and conservation.
Former policy instruments have been adapted and new ones drawn up to provide the necessary regulatory framework. Existing institutions have been

71
revamped and several others created to match the new and changing electricity landscape. The first round of reforms attained marginal results, namely the entry of two IPPs and better financial performance of the two utilities. A study conducted by AFREPEN in 2003 found that the overall increase in electrification was minor and when disaggregated, the new connections were located in urban centres. The majority of the population in rural areas did not benefit from these reforms and the study also found that the total number of persons without access to electricity had actually increased driven by population growth.
The second round of reforms has borne considerable results in the last 6-7 years as outlined above. Following commercialization, access to electricity is reported to be growing as is its generation, but so has the cost of electricity connection and consumption. The entry of 6 new IPPs into Kenya’s energy industry between 2006 and 2010 has brought the total number to 8 and can be credited to these reforms. Other IPPs are reported to either be in the process of developing power projects or negotiating them. But there is still room for further improvement, particularly in ensuring that the benefits are spread across the entire population spectrum. A few of them are identified here.
First, the two public utilities agencies still dominate the industry with KPLC maintaining its monopoly in transmission and distribution. KenGen produces over 80 percent of total energy, while IPPs produce the remainder. Although there now is some level of competition in the generating market, there is no competition in the final market, since there is only one buyer and distributor. Competition in distribution could help lower consumption prices. Second, these positive developments have come at the cost of elimination of former social welfare service provisions and without an alternative being introduced. This, coupled with the rising costs of energy, could mean that energy access may not be reaching the poor, particularly in the rural areas. Third, reform-driven achievements have focused on attracting medium to large project developers, mostly foreigners. Such projects require capital intensive and complex technologies and are thus difficult to replicate on a smaller scale and often find no local participation. The implication is that their impact on the poor is limited. Furthermore, the fact that these projects are not bound to local participation requirements for labour or equity eliminates opportunities for technology and know-how acquisition. With the exception of accommodating small power plants under the FiT and connecting over 10 rural government institutions to the grid, the government has no clear framework for developing small-medium off grid power projects which can benefit rural communities and address poverty. And yet, these projects can be cost effective where costs of grid expansion are amplified by sparse populations. Such projects can utilize
5. EMPIRICAL ANALYSIS OF GREEN TECHNOLOGY DIFFUSION IN AFRICA

DIFFUSION STRATEGY OF GREEN TECHNOLOGY AND GREEN INDUSTRY IN AFRICA
72
cheaper, less complex, easily available local and foreign technologies and can successfully exploit existing resources, particularly biomass that is available in rural areas. They also have potential to attract local investors.
5.4. Innovation system for RE and EE technology diffusion in the Nigerian and Kenyan agro-industry
According to the Oslo Manual for innovation measurement (OECD, 1997), the adoption of a technology that is new to the company is an act of innovation. The implementation of a technology is an extension of the inventive process (Leonard-Barton, 1988) and brings many actors and different forms of coordination and learning into process. Adoption is also linked to other changes within the organizations that sell and adopt the innovation and outside those organizations. These changes manifest themselves as adoptions and adaptations or imitations and development of technologies. As a rule, innovations come to life and fruition through broader actor networks, providing the necessary platform on which social interaction and the learning process takes place and creating a system in which innovation takes place (Smith, 2000).
There is a national, sectoral and regional element in acts of innovation and the processes and conditions that shape them. In this section, we examine the national and sectoral elements of the system of innovations for RET and EE. With regard to actors, we distinguish between two types: first line actors who are involved in the more complex technical aspects of innovation and who can be seen as carrying out the ‘hard’ functions, and second line actors who operate in the background70. First line actors include manufacturers, importers and distributors, foreign investment firms that develop energy projects, technology users, research bodies, government institutions, higher learning institutions, consultants, energy auditors and technicians.
In addition to direct first line actors, systems of innovations also include other organizations responsible for the coordination and support of these processes, often categorized as secondary actors71. The 2nd line of actors performs ‘softer’ functions. Their main role is catalysing and enabling interactions between the
70 Coenen, L, and Lopez, F., Comparing systems approaches to innovation and technological change for sustainable and competitive economies: an explorative study into conceptual commonalities, differences and complementarities, University of Lund, 2009.
71 Eva Dantas, The ‘system of innovation’ approach, and its relevance to developing countries, 2005.

73
various first line actors72. They include government agencies responsible for policy formulation, implementation, planning and coordination activities, as well as development agencies. They also include government regulatory bodies, RE firm associations, technical advisory firms, equity and investment firms, local financial institutions, cooperative societies, mobile phone operators, multilateral banks and development finance institutions. The fact that they are considered secondary does not imply that they play a lesser role. Rather, their secondary position refers to the proximity of their actions within the innovation systems, and they can have a tremendous impact on innovation processes. Typical models of systems of innovation from developing countries may exclude certain categories that emerge as important in developed country cases, reflecting variation in context.
The system of innovation approach is applied to the adoption of RE and EE technologies in Kenya’s maize and in Nigeria’s cassava industry. We examine the system of innovation for RE and EE technologies in terms of the nature and sources of knowledge, the energy technology offered by suppliers, the technical issues for EE and RE technologies and the second line actors who offer facilitating services. The discussion of the systems of innovation for RETs and EE is organized around these aspects.
Before turning to the system of innovation for RET and EE adoption decisions by companies in the cassava processing and maize milling industries, we will briefly address the two industries’ and economies’ energy technology context.
The energy technology landscape
The energy technology context of the agro-industries in Nigeria and Kenya is characterized by EE and RET use which can generate enormous social and economic benefits for the sub-Saharan Africa population through improved industrial performance and national and regional competitiveness. Given the low energy access in both countries in Africa, the use of such technologies becomes a fundamental part of promoting green economies. Specifically, the use of energy efficiency technologies has the potential to support the efficient use of diminishing natural resources, energy, promote cleaner production and greenhouse gas mitigation in the production of both goods and services73. Presently, the drivers for these technologies are economic instead of environmental. Environmental policy is known to be a weak driver for RE and EE investments. EE technologies comprise a wide array of technologies,
72 Ibid73 OECD 1989 the Promotion and Diffusion of Clean Technologies in Industry
5. EMPIRICAL ANALYSIS OF GREEN TECHNOLOGY DIFFUSION IN AFRICA
DIFFUSION STRATEGY OF GREEN TECHNOLOGY AND GREEN INDUSTRY IN AFRICA
74
methods and techniques used in the production, materials and technical measures that enable efficient use of energy. Benefitting from EE technology often implies having to invest in either more advanced manufacturing systems or the implementation of some form of adaptation.
Nigeria’s energy industry differs from Kenya’s in that it has a long history of exploiting petroleum resources while Kenya is on the verge of developing its petroleum industry. Although Nigeria has much better electrification rates than Kenya, its installed capacity is not functional state. Consequently, enterprises and households are forced to install own power generating units at much higher costs. Conversely, although Kenya’s grid is not perfect, reliance on own generation is comparatively lower and efforts are underway to restore the existing grid and expand it to newer areas. Consequently, the two countries’ energy industry differs considerably, with factors such as costs, and national policies implying different firm behaviour with regard to energy needs.
Nature and source of energy technologies
In terms of knowledge base, the energy industries in both countries have utilized hardware technology with local or imported content to varying degrees. Local content has come in the form of materials used and knowledge. Although there has been little variation in content over time, the technologies used and their origin differ. Over 85 percent of Nigeria’s cassava processors surveyed used domestic equipment (albeit incorporating some imported elements) while in Kenya, was only 12.5 percent (Figure 5.5 below). The companies significantly differ in size. The EE survey in Kenya includes seven one-person businesses in the form of posho millers, using hammer mill technologies. Even these small processors use equipment from China and India. Consequently, EE technologies and measures adopted in Nigeria’s and Kenya’s agricultural sector reflected this same pattern (Figure 5.6).

75
Figure 5.5: Main sources of manufacturing equipment
Figure 5.6: Source of energy efficiency technology used
In the case of Nigeria, the technology used for cassava processing is predominantly manufactured locally. The production of local agricultural machinery in Nigeria has included local technical and higher institutions of learning interacting with local producing firms to maintain a steady supply system over decades. Although this reflects the presence of a technological capability base, a look at the EE measures adopted reveals that local content
5. EMPIRICAL ANALYSIS OF GREEN TECHNOLOGY DIFFUSION IN AFRICA
0
5
10
15
20
25
30Cassava processing firms Maize processing firms
Chin
a
4,8
27,5
3,2
10
1,6
5
1,6
5
0 0
5
0
5
20
2,55
2,50 0 0 0 0
Germ
any
Japa
n
Mal
aysi
a
Sout
h Af
rica UK
Switz
erla
nd
Indi
a
US Italy
Denm
ark
0 10 20 30 40 50 60 70 80
Maize processing firmsCassava processing firms
3,125
74,27,5
12,912,5
9,745
foreign
Percentage
partly domestic
wholly domestic
no response

DIFFUSION STRATEGY OF GREEN TECHNOLOGY AND GREEN INDUSTRY IN AFRICA
76
did not translate into local energy management solutions in terms of hardware technology. The measures adopted largely fostered fuel switches from petrol to diesel and entailed purchasing of imported generators. Other technologies adopted included dryers and graters, and their use resulted in product quality improvements and diversification. It is clear that cost cutting and product enhancement motives dominated firms’ action rather than the technical aspects of energy management within the production process itself. Indeed, Nigerian firms reported that energy management (95 percent of firms) and environmental regulation (77 percent of firms) were not influential factors in the type of EE measures taken.
Adoption of RETs in both countries was found to reflect the extent of government measures towards renewable resources. Commitment to national targets for improved electricity and of RE resource development in Kenya has created space for the adoption of smaller units of RETs. In Nigeria, where such commitment is much lower, adoption appeared slow as was government progress towards overall energy improvement and exploitation of renewable resources. Consequently, adoption of RETs was found to be much lower in Nigeria compared to Kenya.
The role of foreign RETs is dominant in both countries, and the technology content of the RETs sold by the respondents has large foreign components (Figure 5.7). RETs from China and India are dominant in both countries while technologies from developed countries such as Germany, UK, Italy, Netherlands and the US played a less significant role. Solar technology emerged as the leading RET in the two countries, manifested by the fact that 60 percent of the firms interviewed in Kenya and all firms interviewed in Nigeria were involved in its distribution. Supply and adoption of RETs was more diversified in Kenya compared to Nigeria. Of the companies surveyed in Kenya, 37 percent offer solar technology products, 34 percent offer biomass, 7 provide electricity generation, 7 percent offer wind, 9 percent offer multiple RETs while only 3 percent of the firms interviewed offer small hydro and financial investments. Kenya also appeared to be ahead of Nigeria in terms of RET diffusion. Unlike in Nigeria, several firms were involved in some form of imitation and adaptation of foreign technologies through fabrication of biogas systems, wind turbines and small hydro. An example is the biogas digester of Afrisol Energy limited (described in Chapter 8) for which only related equipment was being imported, with the actual digesters using local materials and know-how.

77
Figure 5.7: Development of technology content of RETs sold by respondents (%)
Energy technology product offerings
Product offerings constitute an important element of the system of innovation. Interestingly, RET suppliers in both countries offered their products as “bundles” comprising technology and services. The reason for bundling is to overcome challenges of market access caused by technical and financial gaps that prevent technology uptake. A closer analysis of RE production offerings, however, revealed that these are very much technology-focussed, as shown in Figure 5.8 for Kenya. Few companies offer complete packages that also arrange funding.
Figure 5.8: Mode RET technology supply by RET marketers in Kenya
5. EMPIRICAL ANALYSIS OF GREEN TECHNOLOGY DIFFUSION IN AFRICA
Based on foreigntechnology only
Involves domestic technology to asmall degree
Involves domestic technology to alarge degree
Primarily based on domestic technology
No response
Nigeria Kenya
54,5
31,8
13,6 24,4
29,3
29,3
9,8
7,3
We mainly supply the technology We supply the technology and help with implementation We supply the technology, training and after sale care We supply the technology, training and advise on finance We provide a complete package, in which finance is arranged
00
000
0
22
2
7
75
10
3
3
33
111
1111
Solar
Biomass
Wind
Hydro
Multi

DIFFUSION STRATEGY OF GREEN TECHNOLOGY AND GREEN INDUSTRY IN AFRICA
78
The funding of EE measures in both countries derived predominantly from own capital. Reasons commonly cited were high cost of finance and stringent requirements by financial institutions. In Kenya, the Microfinance Act of 2006 has helped in the development of a variety of financial services that are being exploited but cost remains a barrier, with 31 percent of firms in Kenya reporting finance as a major obstacle to adoption. In Nigeria, 44 percent of companies reported finance as posing a major problem.
Training and help with implementation was part of the majority of product offerings, providing a solution to the problem of lack of technical skills. In sub-Saharan Africa, the lack of qualified technicians for installations and repairs of solar panels has been found to be the reason for the failure of uptake for decades. Knowledge gaps among users are known to have been the reason for the failure of technologies in the past. Elaborating on their approach to these two problems, one supplier noted that it was not uncommon to have quality technologies fail simply because information on energy consumption by customers was not taken into account when selecting a technology. Circumventing these challenges, bundling as practiced by many RET suppliers demonstrates their creativity, by using contextual knowledge and networking with other institutions to develop more customized solutions while capitalizing on government policies that favour them. Technological know-how included in services was offered for installation, maintenance and repair.
Various innovative models have been tried and tested to deal with poor access to funding. These include partnering with financial institutions, with service providers such as mobile money operators and targeting aggregative structures in society, such as agricultural cooperatives. Finance was also included in the bundles either as credit, advice on where to find loan packages designed specifically for RETs or in form of assistance with negotiations. Bundle content varied by technology type, with solar and biomass technology being the most bundled, even including training in equipment use. According to one marketing director of a leading RET supplier firm in Kenya, although the use of solar technology is not new to Kenya, its success is often hampered by the lack of technicians and inability to match equipment with energy needs. He stated that:
“…we have found it necessary to conduct some basic assessment of needs, as most customers appeared not to know what type and size of equipment was suitable based on their household needs. The growing number of technicians with knowledge about installation, maintenance and repairs coupled with incorporating some sort of energy need assessment for customers is bearing fruit. Although the tariff and duty waivers have also

79
contributed to growing sales, sound technical support for customers is definitely boosting market confidence and driving sales upwards.”
While installations were nearly always included in the product price, a one-year warranty appeared to be the norm in most cases and for all technologies. Beyond the warranty, services for repair and maintenance had to be paid for. Financial services offered included payment for technologies in instalments, arranging credit packages with institutions, negotiating with banks for loans, targeting cooperative societies, all with varying degrees of success. For instance, one supplier stated that although offering technologies that are payable on instalments had helped increase sales, high collection costs had forced them to abandon this method. By contrast, another RET supplier, who was not available to participate in our survey, had developed a bundling model that entailed working in collaboration with the leading mobile money company in the country. Under this model, customers can access technologies after making a down payment. The remainder is paid through a mobile payment system under a pay-as-you-use scheme and upon completion, the customer fully owns the technology74. This method is helping disseminate small home solar systems in rural areas. A fabricator of wind power was in negotiations with a bank to develop a package for their products at the time of the survey. A biogas systems distributor stated that targeting dairy cooperatives had proven so successful that they were targeting similar cooperatives in neighbouring countries.
To summarize, the role of bundling in the adoption and diffusion of RETs was found to be important. Bundling has the overall effect of helping enhance the quality of the product (successful technology use) and reducing costs in terms of reduced repair incidences.
Technical issues for EE and RET
The adoption of RET and EE is often held back by a number of technical issues in both countries, relating to information asymmetries and low technological awareness. A number of solutions have been put in place for these problems. In collaboration with development agencies, the Kenyan government has established the Centre for Energy Efficiency and Conservation (CEEC). The services offered by CEEC include subsidized energy audits and training in energy management. The Kenyan government has also introduced a regulation for energy management which specifies a number of requirements for energy management and conservation for industry and businesses in general. The
74 www.m-kopa.com/, accessed on 24th September, 2013
5. EMPIRICAL ANALYSIS OF GREEN TECHNOLOGY DIFFUSION IN AFRICA

DIFFUSION STRATEGY OF GREEN TECHNOLOGY AND GREEN INDUSTRY IN AFRICA
80
requirements also pertain to the maize milling industry, but few companies stated that they knew about the Energy Management Regulation (2012). Firms also reported a lack of knowledge of energy efficiency in terms of methods and suitable technologies.
A few millers reported having bought parts in an attempt to address energy-related problems only to encounter problems either because of lack of knowledge or wrong choices. Some firms cited problems within their processing units for which they did not have solutions or any idea of where to look for solutions. In Kenya, a few large millers with no financial constraints appeared to be more aware of efficiency matters. Three firms reported having engaged with CEEC to find solutions to energy management and costs. Medium and small firms all reported not having heard of EE campaigns in their country and those who were aware of such campaigns thought that the costs and technological sophistication involved was beyond their reach. Information was found to be lacking not just with regard to what technologies, techniques and methods to use, but also with regard to where to find qualified experts or agencies that could provide assistance. While technical experts such as electricians, engineers and energy auditors have to be certified and licensed to offer their services, there is no accessible register of individual experts and small firms. Furthermore, the emergence of ICTs has rendered the role of yellow pages redundant, leaving a gap that has yet to be filled.
It cannot be said, however, that energy efficiency technologies are entirely lacking in Kenya. The survey established the presence of representatives/distributors of foreign technology manufacturers from developing countries such as Buhler and Golfetto for milling equipment. ABB, Siemens, Spirax Sarco and International Energy Technik for automation and power technologies were found to have a long-term presence in Kenya. However, their technologies - both hardware and know-how - were mainly used by larger firms with adequate financial resources to afford them. Managers of smaller companies considered such options beyond their reach, financially and technologically.
In Nigeria, as shown in Figure 5.9, interaction with equipment providers, development agencies and research institutions was more influential for EE adoption than in Kenya. Awareness and learning of EE technologies in Nigeria was more prevalent resulting from firms’ interaction with government agencies, research institutions and development organizations. By contrast, the inward-looking nature of companies in Kenya’s maize industry related to heavy competition and a culture of secrecy which prevented fruitful interactions between firms and other organizations.

81
Figure 5.9: Type of organizations involved in successful EE projects
Technical ability and financial resources to undertake medium-large projects was considered daunting by many small biogas installers emphasizing the gaps. Useful services were provided by the Climate Innovation Centre (CIC), an innovation hub funded by the World Bank and DFID in Nairobi, as reported during one site visit. Firms hosted by CIC stated that they benefited from a host of services which strengthened their technical abilities. They received business and technical advisory services for a period of two years, assistance to access greenfield finance available and in lobbying government for policy and regulatory action. Having a desk in the same building fostered collaboration and learning. For small-scale suppliers, collaboration is important for reasons of credibility and learning. Such collaborations were reported to help pool resources and knowledge resulting in better quality services and furthermore promoted learning from each other, thus fostering further diffusion.
Different RETs were found to present variety of technical challenges. Solar appeared to face more technical challenges in terms of diffusion due to its low applicability in developing country contexts such as Nigeria and Kenya. As such, technical know-how for solar is limited to installations, repairs and maintenance with manufacturing and fabrication being absent. The presence of one firm assembling solar PVs in Kenya presents the seeds of diffusion although at the time of our study their operations were fairly limited. Contrasting the situation in Kenya, the National Centre for Energy Research and Development (NCERD) at Nsukka in Nigeria has developed solar products which include solar
5. EMPIRICAL ANALYSIS OF GREEN TECHNOLOGY DIFFUSION IN AFRICA
0 10 20 30 40 50 60
Kenya Nigeriauniversity/
public research institute
a government agency
energy research centre
consultancy
equipment provider

DIFFUSION STRATEGY OF GREEN TECHNOLOGY AND GREEN INDUSTRY IN AFRICA
82
dryers, solar water heaters, solar cookers and solar chick brooders. However, these were still below international standards and thus not marketable. They present a foundation on which further innovation and development of national products could take place.
One complication for Kenya is that the country has a low number of technical experts relative to its population size. In addition, the government has not been very active in ensuring that the projects result in knowledge transfer that can translate into future local innovations75. In such a context, technical advisory companies have an important role to play in the form of feasibility studies for EE and RE adoption for large adopters such as hotels, lodges and institutions. For RE projects, services range from resource assessment and feasibility studies to risk evaluations.
The role of second line actors in green technology adoption and diffusion
From the preceding sections, it is clear that firms must to interact not only with so-called “first line” actors who deal with ‘hard’ aspects of technology for adoption and diffusion of technologies to take place, but also with “second line” actors in the periphery of their technological field in order to overcome various challenges. The previous examples reaffirm the notion that a firm has to be well embedded in the system of innovation and be able to interact with entities within it in order to innovate. There are various types of second line actors that were found to play important roles in the diffusion of energy technologies: government agencies, financial institutions, mobile money service providers, multilateral companies and DFIs. Below, each type of second line actor is discussed.
Government agencies include a wide range of actors that carry out various activities which contribute to a smooth diffusion of technologies. These include the Energy Regulatory Commission (ERC), the Kenya Revenue Authority (KRA), the Energy Commission of Nigeria and ministries of energy. In Kenya, the ERC is responsible for drafting policies for energy regulation and management, for setting standards for improved cooking stoves and certifying and licensing energy auditors. This is being done in cooperation with the private sector. Agencies responsible for implementing duty and VAT waivers are gathering information on inefficiencies of the waiver system. They are also contacted by firms about specific problems. Firms working in biogas had contacted these agencies to highlight omissions of biogas-related materials and imported
75 Wright, H. Et al, Engineering capacity needs in SSA, in Africa Infrastructure Investment Report, Commonwealth Business Council, 2013

83
equipment that had been omitted from the VAT and duty exemption schedule for RE and managed to have them included.
Government agencies also work in collaboration with development organizations on energy issues. Two examples of such collaboration were observed in Kenya. The first one is the CEEC (Centre for Energy Efficiency and Conservation) set up with funds from the government of Kenya and with support from development agencies. CEEC was established to raise awareness on the importance of energy efficiency in the industrial sector and to offer technical advisory services. Its work is carried out in collaboration with the Kenya Association of Manufacturers and has raised awareness through a series of annual energy management awards ceremonies. It also offers training courses for energy managers and auditors, filling a technical knowledge gap that has been present in Kenya’s industrial sector. Other services offered include feasibility studies for EE projects and retrofitting. But CEEC’s role has evolved and it is now playing an important catalytic function in the adoption of EE and RE technologies by bringing financial institutions and industry together. This newer scope of work is being carried out in Uganda and Tanzania as well and has helped financial institutions understand energy issue enabling them to issue finance for related projects. By working together with Agence Française de Developpement, and two partner banks in each country, CEEC assists in evaluating EE and RE projects for funding at concessional rates. However their services appear designed to target large firms, excluding small-medium firms.
A second model of collaboration is the Climate Innovation Centre’s incubation hub where SME operators are hosted for a period of two years. During these two years, SME operators are offered a wide range of services from business training, technical advice in their respective line of operations, access to sectoral, national and even international networks, access to finance and the possibility to articulate issues that affect them by lobbying governments. The CIC is located at a private university in Nairobi and has links to education. The benefits have already been discussed in earlier sections.
Financial institutions active in energy technology transfer include banks, micro finance institutions and Cooperatives and Savings and Credit Co-operatives (SACCOs). Financial institutions are also eager to expand their market share and as such work with technology distributors and other service providers to create innovative packages that serve rural and urban poor households in particular. Furthermore, aggregative institutions such as agricultural cooperatives are noted as being important conduits for technology adoption through their
5. EMPIRICAL ANALYSIS OF GREEN TECHNOLOGY DIFFUSION IN AFRICA

DIFFUSION STRATEGY OF GREEN TECHNOLOGY AND GREEN INDUSTRY IN AFRICA
84
ability to rope in larger numbers of people. Their potential is enhanced by their ability to disseminate awareness and reach wider populations through their membership.
Next to these institutions are equity and investment firms that offer finance either in form of loans or equity participation in large energy projects. The number of both national and foreign investment firms is slowly gaining significance in SSA. The role of multilateral banks and DFIs goes beyond that of facilitating access to large amounts of finance for energy projects. These institutions also offer risk mitigation instruments and guarantees. Their work on the continent over decades allows them political leverage when it comes to negotiations with government agencies, as well as the possibility to evaluate risks and viability of projects. Their most crucial role is offering guarantees to creditors financing projects that have to wait for several years before they can generate revenue, as is typical with large energy projects.
Second line actors provide a vital mechanism through which technologies can be diffused as technology firms interact with them in an attempt to meet their business objectives. It is through these interactions that learning and innovation takes place.

85
6. rEt SuPPLy And mArKEtinG in niGEriA And KEnyA 6.1. Types, origin and development of RETs
Distribution of RETs marketers by type of products sold
The majority (95.5 percent) of RETs marketers are located in Lagos State, Nigeria, with about 54.5 percent of the sampled marketers found on the “Alaba” international market, located in Lagos, Nigeria, with some suppliers having up to three outlets in the market. The concentration of marketers in Lagos might be attributable to the closeness of the area to the sea port and economic agglomeration in Lagos as Nigeria’s business and commercial capital. As shown in Figure 6.1, all RET marketers surveyed are involved in the sale of solar systems such as solar inverters, solar controllers, solar batteries, solar panels, solar bulbs/solar street lighting, solar lanterns, solar fridges, solar pumps,, etc. 36.4 percent sell both solar power equipment and wind power facilities, while
Figure 6.1: Distribution of RET markets in the research sample
Source: Analysis of field data, 2013
0
20
40
60
80
100Nigeria Kenya
Solar system
100
39
4,5
31,736,4
9,84,5
9,80
4,90
4,9
Biomass Wind power Mini-hydro
Types of RETs
Finance Multi
Perc
enta
ge

DIFFUSION STRATEGY OF GREEN TECHNOLOGY AND GREEN INDUSTRY IN AFRICA
86
biomass and mini-hydro are only sold by 4.5 percent (only one respondent). The sellers could not ascertain the type of buyers of these RETs owing to the fact that they only sell their products without further probing the destination of the products. In Kenya, RET distribution was more developed with more types of technologies being sold. Still, solar emerged as the most popular with 39 percent of firms interviewed distributing it. Biomass was also popular, in particular, small biogas systems which are distributed by 32 percent of the sampled firms. Sugarcane (bagasse) was offered by two firms with feed stock for energy generation and one firm sold material for developing ethanol gel for use by households.
Time of establishment and estimated size of employment generated by RETs marketing
Table 6.1 reveals that 13.6 percent and 22 percent of the sampled RETs marketing firms were established in Nigeria and Kenya before 2000; 68.2 percent and 49 percent of the firms were established between 2000 and 2010 and 13.6 percent and 30 percent were founded between 2011 and 2012. Only 4.5 percent of the respondents in Nigeria refused to disclose when their firms were established. This suggests that the sale of RETs is an emerging and promising enterprise in both countries. We also found that in 2012, the largest percentage of RETs marketing firms in the Nigerian research sample (77.3 percent) have one to ten employees while 13.6 percent employ 11 to 20 employees; 4.5 percent have over 20 employees and 4.5 percent could not disclose the number employed by their firm. The case was slightly different in Kenya where the number of employees was more varied among firms. 39 percent of firms had up to 10 employees, and 20 percent of the firms had 10-20 and 20 and more employees. This suggests that sales of RETs could reduce the level of unemployment in the country.
RET marketing firms and the development of RETs
Table 6.1 also presents the development of RETs and uses of RETs in employment generation among the respondent RET marketers. Discussions with the respondents shows that they are aware that RETs products such as solar dryers, solar water heaters, solar cookers and solar chick brooders have been developed in various research institutions such as the National Centre for Energy Research and Development (NCERD) at Nsukka, Enugu State, Nigeria. However, many of these locally developed appliances have not yet been developed to international standards and most, if not all, are only still at the research and development stage and yet to be commercially viable. This challenge needs to be surmounted to reduce cost of importation of these

87
products and to attain widespread dissemination of RETs in Nigeria. Figure 6.2 shows that a larger share of RETs of the research sample is based on foreign technology only, while about 13.6 percent involve domestic technology to a large extent. None of these technologies has a fully local content. About 90.1 percent of the RETs do not have more than a 50 percent local content, with about two-thirds including less than 10 percent local content. In Kenya, this content was higher than in Nigeria where 24 percent reported distributing RETs based on purely foreign technology. Kenya also has a larger share of firms distributing technologies based on domestic knowledge (29 percent to a lesser degree and another 29 percent to a larger degree). Unlike in Nigeria where RETs based on domestic knowledge was absent, Kenya had 10 percent firms that deal with such technologies. These included small- to medium-sized wind turbines and biogas systems. Our findings point to the fact that the majority of RETs have a certain degree of foreign content which suggests that the market is controlled by foreign economies. This trend may continue for a while because the majority of the marketers (81.8 percent) noted that there has been no rise in the level of domestic component since 2007, while about 63.6 percent were pessimistic about any further change in the domestic contribution to RET component development in the next five years (2018).
Table 6.1: Time of establishment of RETs marketing firms, development and employment
Time of establishmentNigeria Kenya
Frequency Frequency Frequency Percentage
Before 2000 3 13.6 9 22.02000 -2010 15 68.2 20 48.82011-2012 3 13.6 12 29.3No response 1 4.5 0 0Total 22 100 41 100Development of RETs sold in Nigeria and Kenya Frequency Percentage Frequency Percentage
Based on foreign technology only 12 54.5 10 24.4Involves domestic technology to a small degree 7 31.8 12 29.3
Involves domestic technology to a large degree 3 13.6 12 29.3
Primarily based on domestic technology 0 0 4 9.8No response 0 0 3 7.3Total 22 100 41 100
6. RET SUPPLY AND MARKETING IN NIGERIA AND KENYA
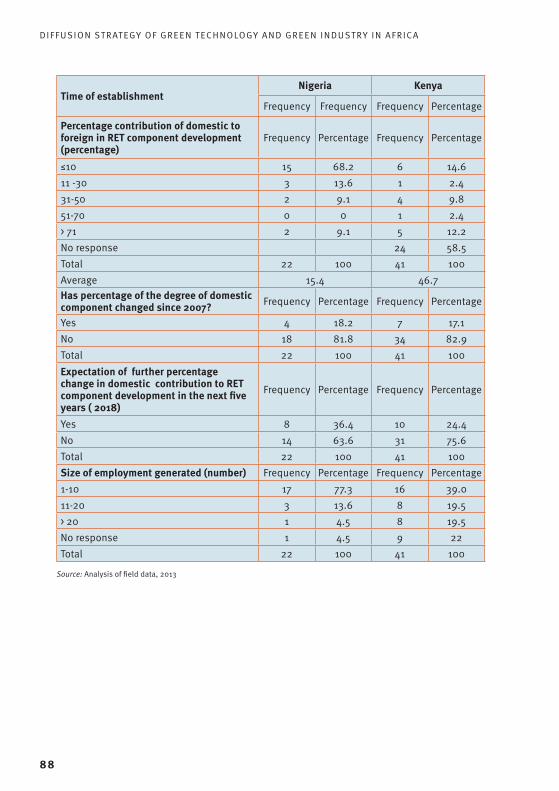
DIFFUSION STRATEGY OF GREEN TECHNOLOGY AND GREEN INDUSTRY IN AFRICA
88
Time of establishmentNigeria Kenya
Frequency Frequency Frequency Percentage
Percentage contribution of domestic to foreign in RET component development (percentage)
Frequency Percentage Frequency Percentage
≤10 15 68.2 6 14.611 -30 3 13.6 1 2.431-50 2 9.1 4 9.851-70 0 0 1 2.4> 71 2 9.1 5 12.2No response 24 58.5Total 22 100 41 100Average 15.4 46.7Has percentage of the degree of domestic component changed since 2007? Frequency Percentage Frequency Percentage
yes 4 18.2 7 17.1No 18 81.8 34 82.9Total 22 100 41 100Expectation of further percentage change in domestic contribution to RET component development in the next five years ( 2018)
Frequency Percentage Frequency Percentage
yes 8 36.4 10 24.4No 14 63.6 31 75.6Total 22 100 41 100Size of employment generated (number) Frequency Percentage Frequency Percentage1-10 17 77.3 16 39.011-20 3 13.6 8 19.5> 20 1 4.5 8 19.5No response 1 4.5 9 22Total 22 100 41 100
Source: Analysis of field data, 2013

89
Figure 6.2: Development of technology content of RETs sold by respondents (%)
Source: Analysis of field data, 2013
Origin and assessment of quality of RETs sold
As shown in Figure 6.3, China currently sells the majority of RETs to the respondents in the research sample. India also plays an important role as an origin of RETs. 68 percent and 44 percent of respondents from Nigeria and Kenya, respectively, mentioned China as the origin of the RET they market. India as an origin of RETs was also quite significant for Nigerian firms at 36 percent, but much less important amongst Kenyan firms which appeared to source their RETs from a variety of EU states. Other sources of RETs in both countries come from Japan, USA, Canada, UAE and European countries such as the UK, Germany, the Netherlands and Turkey, though to a lesser extent, apparently due to the perceived relatively high cost of RETs from those countries.
Table 6.2 revealed that about 50 percent and 44 percent of firms in the two research samples, respectively, preferred to import products from China because they are cheaper. A leading solar distributor in Kenya stated that Chinese solar products were of good quality and that even lower quality products fulfilled the firm’s objective of manufacturing on a large scale and to cater to its large share of poor population. Products of lower quality that are affordable are perceived to be more marketable. This in part explains the interest in China as a source of RETs. 81.8 percent of RET marketers interviewed reported that the products they sell are standardized and only 13.6 percent stated that their products involve customization. Only one of the respondents said that the RET products the firm sells are highly customized to individual needs. In Kenya, 59 percent of firms distributed standardized RETs while 44 percent reported being involved in
Based on foreigntechnology only
Involves domestic technology to asmall degree
Involves domestic technology to alarge degree
Primarily based on domestic technology
Nigeria Kenya
54,5
31,8
13,6 24,4
29,3
29,3
9,8
7,3
6. RET SUPPLY AND MARKETING IN NIGERIA AND KENYA

DIFFUSION STRATEGY OF GREEN TECHNOLOGY AND GREEN INDUSTRY IN AFRICA
90
modifying equipment to suit users’ needs. The aforementioned solar distributor reported that customization entailed matching household characteristics, behaviour and needs with capacity of solar products and support for appliances sold. Failure to do this was a very common source of dissatisfaction among RET users. Customization for wind was based on site-specific conditions while customization for biogas was largely based on the feedstock used. This points to increasing know-how of foreign goods among Kenya’s RET distributors. The low share of customization might be a result of little or no contribution of Nigerian sources in the production of the equipment and the high cost involved in customization which only few consumers can afford.
Table 6.2: Preferred sources of RETs and quality of technology
Preferred source of RETs acquisition origin of RETs
Nigeria KenyaFrequency Percentage Frequency Percentage
China 11 50 18 43.9India 4 18.2 4 7.8Dubai 1 4.5 0 0USA 4 18.2 3 7.3UK 1 4.5 0 0Germany 1 4.5 3 7.3Total 22 100Views on the quality of technology Frequency Percentage Frequency PercentageVery much standardized 18 81.8 24 58.5Involves a good deal of customization 3 13.6 0 0Highly customized to individual needs 1 4.5 17 41.5Total 22 100 41 100Components of customization Frequency Percentage Frequency PercentageConsist of alternative components to the standard 2 50.0 2 11.8
Designed and customized based on client specification and needs 2 50.0 15 88.2
Total 4 100 17 100
Source: Analysis of field data, 2013

91
Figure 6.3: Origin of RETs sold by respondent firms
Source: Analysis of field data, 2013
6.2. Clients and markets for RETs
Breakdown of sales of RETs in 2012
Table 6.3 presents the sales of RETs and the results show that government and non-profit organizations (hospitals, schools, community centres, etc.) are the major buyers of RETs (77.3 percent) from the respondent firms in Nigeria, followed by the non-industrial companies (68.2 percent) and households (40.9 percent). In Kenya, the segments were slightly different with households being the major buyers at 56 percent. Government institutions (44 percent) were the second most important group of buyers in Kenya with other segments, namely energy companies (32 percent), non-industrial companies (29 percent) and farmers (32 percent) taking a more or less equal share of the market. It is worth noting that 10 firms were involved in cross-border distribution of RETs. Overall, the three most important markets for RETs of our research sample are the government and non-profit organizations, companies that are not engaged in industrial production activities and households. Manufacturing companies in both countries appeared quite slow in taking up RETs. This may be explained by the fact that solar PVs are the main RETs currently dominating the market, and it is known that solar PVs are incapable of generating adequate power to
0
10
20
30
40
50
60
70
80Nigeria Kenya
Chin
a
UAE
68,2
43,9
4,5 4,5 4,54,57,3 7,313,6
36,4
7,8 9
0 0 04,5 4,8 2,40 0 0 2,40 2,4
17,1
0 04,8
00
Origin of RETs
Germ
any
Japa
n
Indi
a
USA UK
Cana
da
Aust
ralia
Fran
ce
Neth
erla
nds
Euro
pe
Gree
ce
No re
spon
se
Turk
ey
6. RET SUPPLY AND MARKETING IN NIGERIA AND KENYA

DIFFUSION STRATEGY OF GREEN TECHNOLOGY AND GREEN INDUSTRY IN AFRICA
92
support industrial production. Also, manufacturing firms are often clustered in industrial parks with no access to renewable energy sources such as wind and hydro power. These industrial zones also lack space to mount solar products for energy generation.
Table 6.3: Percentage breakdown of RETs sold to different sectors of the economy in 2012
Sales *Nigeria Kenya
Frequency Percentage % average sale Frequency Percentage % average
saleTo energy com-panies 5 22.7 16 13 31.7 20
To manufacturing companies 8 36.4 11.88 7 17.1 12
To non-industrial companies 15 68.2 35.80 12 29.3 38
To government and non-profit or-ganizations (hos-pitals, schools, community cen-tres, etc.)
17 77.3 44.29 18 43.9 32
To farmers 2 9.1 37.50 13 31.7 33To households 9 40.9 53.13 23 56.1 35To outside na-tional borders 1 4.5 10.33 10 24.4 18
Sales to companies in the cassava chain
frequency percentage Major client frequency percentage Major
Client
yes 3 13.6FADAMA
users
3 7.3House-holdsNo 19 86.4 38 92.7
Total 22 100 41 100Note: *multiple choice responses
Source: Analysis of field data, 2013
Change in sales of RETs since 2007
Table 6.4 presents the situation analysis of sales of RETs since 2007 and expected sales up to 2018. The results show that a majority of the respondent marketers (81.8 percent in Nigeria, 70.7percent in Kenya) have not experienced any significant change in the volume of sales over the last five years. However, the majority of respondents (63.6 percent and 56 percent in Nigeria and Kenya, respectively) are optimistic that the market will experience a significant change

93
in the next five years, though many of them could not predict how extensive the change would be. For the firms in Nigeria, only eight respondents shared their expectations for future sales. Half of them indicated a 1 to 50 percent change in sales, while the other half expects a more than 50 percent change. In Kenya, about 37 percent of respondent firms indicated their expectation that sales would grow between 1 percent and 50 percent over the next 5 years. If these expectations are assumed for the populations of RET marketers in both countries, they suggest that there is a good prospect for substantial growth in the two countries’ RET markets over the next five years. This notwithstanding, the ongoing expansion of energy infrastructure by relevant agencies in Kenya and Nigeria could also impact on the growth prospects of the RET markets.
Table 6.4: Situation analysis of sales of RETs since 2007 and expectation for 2018
Any significant change in sales over the last five years (since 2007)?
Nigeria KenyaFrequency Percentage Frequency Percentage
yes 4 18.2 12 29.3No 18 81.8 29 70.7Total 22 100 41 100Likelihood of significant change in sales over the next five years (2018) Frequency Percentage Frequency Percentage
yes 14 63.6 23 56.1No 8 36.4 18 43.9Total 22 100 41 100Percentage of expectation of change in sales Frequency Percentage Frequency Percentage
Inconclusive 14 63.6 7 17.11 to50 4 18.2 15 36.6> 50 4 18.2 1 2.4No response - - 18 43.9Total 22 100 41 100
Source: Analysis of field data, 2013
Barriers to RET adoption
Understanding the size and nature of the barriers to RET adoption is essential if policies to increase RET diffusion are to be successful (Reddy and Painuly, 2004). As shown in the results presented in Table 6.5, an unfavourable business climate/environment for FDI and high tariffs are perceived by the majority of RET marketers interviewed as overwhelming barriers to the adoption of RETs
6. RET SUPPLY AND MARKETING IN NIGERIA AND KENYA

DIFFUSION STRATEGY OF GREEN TECHNOLOGY AND GREEN INDUSTRY IN AFRICA
94
in Nigeria. About 46 percent of respondents claimed that ‘lack of technical competence on the part of potential adopters’ was a barrier to RET adoption, while the high cost of technology is mentioned by only about 27 percent of respondents. These results suggest that for the RET marketers interviewed in Nigeria, improving the business climate, lowering tariffs and improving the technical competence of potential adopters are important strategies for removing barriers to RET adoption. It is also instructive that many of the respondents (45.5 percent) viewed government policy as a major barrier to RET adoption. Thus, improving policy and strategies for RET adoption in Nigeria is an important issue for RET marketers.
For the Kenyan firms, the ‘unfavourable business climate/environment for FDI’ was mentioned by 24 percent of respondents and was ranked the highest barrier to RET adoption. The second biggest barriers are ‘lack of technical competence on the part of potential adopters’ and ‘high tariffs on foreign equipment’ mentioned by 17 percent and 15 percent of respondents, respectively. Government policy is considered a barrier to RET adoption by 61 percent of respondents. These results
Table 6.5: Barriers to RET adoption
Nature of barriers*Nigeria Kenya
Frequency Percentage Frequency PercentageGovernment’s preference for local equipment 2 9.1 0 0.0
High tariffs on foreign equipment 15 68.2 6 14.6Unfavourable business climate/environment for FDI 16 72.7 10 24.4
Lack of technical competence on the part of potential adopters 10 45.5 7 17.1
Language / different culture 1 4.5 1 2.4Product offerings from foreign suppliers do not fully match the needs of African companies
4 18.2 0 0.0
High cost of technology 6 27.3 0 0.0Fake products (RETs) 0 0 0 0.0Importance of government policy as a barrier to RET adoption Frequency Percentage Frequency Percentage
Not a barrier 0 0.0 25 61.0Only a minor barrier 12 54.5 4 9.8Major barrier 10 45.5 12 29.2Total 22 100 41 100
Note * Multiple responsesSource: Analysis of field data, 2013

95
suggest that although there is a need to improve the business climate in Kenya, the country’s policy of import duty exemption and VAT waivers is perceived as helpful in reducing barriers to RET adoption. It is also noteworthy that the firms that claimed ‘high tariffs’ were a barrier to adoption are those distributing biogas systems which were excluded from tax exemptions. Firms distributing other RET types also reported hiccups in the implementation of tax waivers. Such hiccups include bureaucratic delays and poor specifications that omitted many components of RET. Among the developers of large renewable energy projects with participation of several sub-contractor companies, it was only the developer who benefited, suggesting that the tax exemption policy’s impact may not be sufficiently far-reaching. Furthermore, one respondent with an assembly plant for solar PVs stated that even if VAT was imposed on his products, the impact on sales would be insignificant given the need for alternative energy sources. Another respondent specializing in solar water heating systems in Kenya’s tourism region stated that some of his clients were unaware of the VAT exemption and only learnt of it when they realized it was not being charged.
6.3. Technology development and innovation
Table 6.6 presents the findings on the involvement of RET marketers in research aimed at product improvement. A large share (72.7 percent) of marketers interviewed claimed that they have engaged in research to improve RETs. 40.9 percent claimed to be involved in research continuously and 31.8 percent only occasionally. On average, RET marketers invested 25.5 percent of their sales in product improvement with over half of the RET marketers investing less than 10 percent while 18.7 percent invested more than 50 percent of their sales in product improvement in 2012. In Kenya, the extent of engagement in product development was less with 27 percent stating that they were not involved in research, 27 percent claiming that they occasionally were while a 46 percent were engaged in continuous product development. Furthermore, a higher share of marketers have increased the percentage of sales spent on product improvement in the last two years while 13.6 percent and 7.3 percent in Nigeria and Kenya, respectively, reported that they have reduced the amount spent on product improvement. This suggests that the marketers are willing to undertake and invest in research on product improvement. It must, however, be stated that further inquiry into the nature of the research on product improvement by RET marketers revealed that the research often only comprises in-house adaptations and fixing of equipment within the firm. The research does not result in any substantial new product, nor does it involve any new process that can reasonably be regarded as process innovation.
6. RET SUPPLY AND MARKETING IN NIGERIA AND KENYA

DIFFUSION STRATEGY OF GREEN TECHNOLOGY AND GREEN INDUSTRY IN AFRICA
96
Table 6.6: Involvement in research on RET product improvements
Research to improve RET products soldNigeria Kenya
Frequency Percentage Frequency PercentageNo 6 27.3 11 26.8yes , occasionally 7 31.8 11 26.8yes, continuously 9 40.9 19 46.3Total 22 100 41 0.0Percentage of sales spent on product improvement in 2012 Frequency Percentage Frequency Percentage
≤10 9 56.3 16 53.311 -30 2 12.5 6 20.031-50 2 12.5 1 3.351-70 1 6.2 0 0> 71 2 12.5 0 0Indecisive 0 0 7 23.3Total 16 100 30 100Average percentage of sales spent on product improvement 25.50 22.2
Change in the amount spent on product improvements in last 2 years (since 2010) Frequency Percentage Frequency Percentage
Increased 12 54.5 14 34.2No change 7 31.8 24 58.5Declined 3 13.6 3 7.3Total 22 100 41 100
Source: Analysis of field data, 2013
Types of RET maintenance and percentage of firm revenue for maintenance
Table 6.7 presents the distribution of respondents by type of maintenance and provision of technical support for clients. The results show that most of the marketers interviewed (81.8 percent) affirmed that maintenance is not automatically included in project tenders while 59.1 percent offer maintenance as an option which interested clients pay an extra charge. Also, 54.7 percent have a policy to recommend a maintenance contract to clients, and the majority of the marketers (59.1 percent) make no revenue from maintenance of the RETs they sell. 31.8 percent of the marketers generate less than 10 percent of their income from maintenance of RETs while only 9.1 percent generate more than 30 percent of their income from maintenance of RETs. In Kenya, 54 percent of firms included maintenance in their project offerings while 31 percent offered maintenance as an option for an extra charge, and 39 percent reported that

97
recommending a maintenance contract was part of their marketing policy. 22 percent of Kenyan firms reported that they generated 0 to 10 percent of their revenue from maintenance contracts. Another 12 percent reported that they generated revenue of between 11 percent and 30 percent from such services.
Table 6.7: Distribution of respondents by type of maintenance and provision of technical support to clients
Types of RET maintenance applicable in firm operation*
Nigeria KenyaFrequency Percentage Frequency Percentage
Maintenance is automatically included in project offerings 4 18.2 22 53.7
Maintenance is an option for which clients pay an additional fee 13 59.1 14 31.1
Policy in place to recommend a maintenance contract 12 54.5 16 39.0
Percentage of revenue stemming from maintenance Frequency Percentage Frequency Percentage
≤10 % 7 31.8 9 21.911 % -30 % 2 9.1 2 4.9>30 % 0 0.0 3 7.3None 13 59.1 27 65.9Total 22 100 41 100Average % revenue for maintenance 10.0 14.2
Note: * multiple choice responses Source: Analysis of field data, 2013
Provision of technical support for clients in the form of training and installation
As shown in Table 6.8, the majority of respondent marketers (90.9 percent) provide technical support for clients in the form of training and installation of RETs. The technical support is, however, provided by a local expert (86.4 percent in Nigeria and 90.2 percent in Kenya). Technical support was to a limited extent also being offered by foreign experts. About 66.7 percent of respondents interviewed believe that foreign experts will be replaced by local experts over the next 5 to 10 years. In Kenya, the perception was that foreign experts would be completely replaced by local ones within five to 10 years. All RET marketers in Nigeria (100 percent) provide some kind of warranty of between 6 to 12 months for the products they sell. In Kenya, this figure was 80.5 percent and can perhaps be explained by the availability of small solar appliances that do not include a warranty. 36 percent of Kenyan firms offered warranties of between 6-12 months, 15 percent of between 1-2 years, while 49 percent offered warranties of
6. RET SUPPLY AND MARKETING IN NIGERIA AND KENYA

DIFFUSION STRATEGY OF GREEN TECHNOLOGY AND GREEN INDUSTRY IN AFRICA
98
2 years. This difference in warranties being offered in Kenya and Nigeria can be attributed to type of RETs offered, particularly the higher presence of solar water heating systems in the Kenyan market. The warranty for such products involves replacement of damaged parts that does not result from careless handling.
Table 6.8: Provision of technical support and product warranty for clients
Provision of technical support for clients in the form of training and installation
Nigeria KenyaFrequency Percentage Frequency Percentage
yes 20 90.9 33 80.5No 2 9.1 8 19.5Total 22 100 41 100Technical support provided by foreign experts Frequency Percentage Frequency Percentage
yes 3 13.6 4 9.8No 19 86.4 37 90.2Total 22 100 41 100Expectation of local experts replacing foreign ones in the next 5 to 10 years Frequency Percentage Frequency Percentage
yes 2 66.7 4 100No 1 33.3 0 0.0Total 3 100 4 100Provision of product guarantee/ warranty Frequency Percentage Frequency Percentageyes 22 100 33 80.5No 0 0 8 19.5Total 22 100 41 100Components of guarantee/warranty provided Frequency Percentage Frequency Percentage
< 6 months warranty including replacement of damage to component 2 9.1 0 0.0
6 months - 1year including replacement 19 86.4 12 36.31.1 – 2 years including replacement 1 4.5 5 15.2> 2 years including replacement 0 0 16 48.5Total 22 100 33 100
Source: Analysis of field data, 2013

99
6.4. Finance for RETs
Drivers of sales of RETs
Table 6.9 presents the factors facilitating the sales of RETs as perceived by the RET marketers interviewed. 72.7 percent of respondents claimed that the major factor facilitating the sale of RETs is the unreliable and sporadic power supply and foreign currency exchange rate in Nigeria. Added to this, more than half of the respondents identified access to loans from commercial banks as a source of help to their sales. In Kenya, the most important factor driving the uptake of RETs is the foreign exchange rate (56 percent). Following closely was access to finance (53.7 percent), NGOs (42 percent) and power outages (39 percent). The significance of these factors as key drivers of sales is not unexpected. Power outages have been a perennial and unresolved challenge in Nigeria and to a lesser extent in Kenya. Although foreign exchange volatility has been appreciably limited in the past eight years, this was not the case in Kenya where the cost of electricity fluctuated with global prices. In both countries, banks are noted to be favourably disposed to financing marketing or commercial activities that afford short-term turnovers and return on investments.
6. RET SUPPLY AND MARKETING IN NIGERIA AND KENYA
Table 6.9: Factors facilitating RET marketing
Factors
Nigeria KenyaFrequency Frequency
Crucial Helpful Hardly helpful
Not ap-plicable Crucial Helpful Hardly
helpfulNot ap-plicable
Feed-in tariff 6(27.3)
2(9.1)
2(9.1)
12(54.6)
8(19.5)
8(19.5)
7(17.1)
18(43.9)
Volatility of exchange rate
16(72.7)
3(13.6)
1(4.6)
2(9.1)
23(56.1)
9(22.0)
5(12.2)
4(9.8)
Fossil fuel subsidies
1(4.5)
2(9.1)
10(45.4)
9(40.91)
3(7.3)
7(17.1)
15(36.6)
16(39.0)
Oil price volatility
6(27.3)
1(4.5)
5(22.7)
10(45.4)
14(34.1)
16(39.0)
3(7.3)
8(19.5)
Power out-ages
16(72.7)
3(13.6)
1(4.5)
2(9.1)
19(39.0)
11(26.8)
2(4.9)
9(22.0)
Access to finance
13(59.1)
4(18.2)
1(4.5)
4(18.2)
22(53.7)
12(29.3
2(4.9)
5(12.2)
NGOs and aid agencies
2(9.1)
5(22.7)
5(22.7)
10(45.4)
17(41.5)
13(31.7)
5(12.2)
6(14.6)
Values in parentheses are in percentageSource: Analysis of field data, 2013
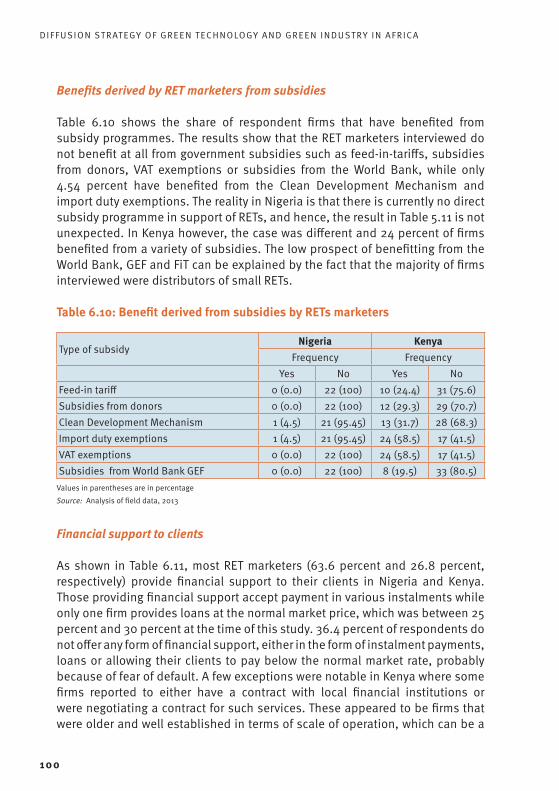
DIFFUSION STRATEGY OF GREEN TECHNOLOGY AND GREEN INDUSTRY IN AFRICA
100
Benefits derived by RET marketers from subsidies
Table 6.10 shows the share of respondent firms that have benefited from subsidy programmes. The results show that the RET marketers interviewed do not benefit at all from government subsidies such as feed-in-tariffs, subsidies from donors, VAT exemptions or subsidies from the World Bank, while only 4.54 percent have benefited from the Clean Development Mechanism and import duty exemptions. The reality in Nigeria is that there is currently no direct subsidy programme in support of RETs, and hence, the result in Table 5.11 is not unexpected. In Kenya however, the case was different and 24 percent of firms benefited from a variety of subsidies. The low prospect of benefitting from the World Bank, GEF and FiT can be explained by the fact that the majority of firms interviewed were distributors of small RETs. Table 6.10: Benefit derived from subsidies by RETs marketers
Type of subsidyNigeria Kenya
Frequency Frequencyyes No yes No
Feed-in tariff 0 (0.0) 22 (100) 10 (24.4) 31 (75.6)Subsidies from donors 0 (0.0) 22 (100) 12 (29.3) 29 (70.7)Clean Development Mechanism 1 (4.5) 21 (95.45) 13 (31.7) 28 (68.3)Import duty exemptions 1 (4.5) 21 (95.45) 24 (58.5) 17 (41.5)VAT exemptions 0 (0.0) 22 (100) 24 (58.5) 17 (41.5)Subsidies from World Bank GEF 0 (0.0) 22 (100) 8 (19.5) 33 (80.5)
Values in parentheses are in percentageSource: Analysis of field data, 2013
Financial support to clients
As shown in Table 6.11, most RET marketers (63.6 percent and 26.8 percent, respectively) provide financial support to their clients in Nigeria and Kenya. Those providing financial support accept payment in various instalments while only one firm provides loans at the normal market price, which was between 25 percent and 30 percent at the time of this study. 36.4 percent of respondents do not offer any form of financial support, either in the form of instalment payments, loans or allowing their clients to pay below the normal market rate, probably because of fear of default. A few exceptions were notable in Kenya where some firms reported to either have a contract with local financial institutions or were negotiating a contract for such services. These appeared to be firms that were older and well established in terms of scale of operation, which can be a

101
prerequisite for securing an agreement with a financial institution. It appeared that more firms were interested, but found the contract negotiation with financial institutions lengthy. A few firms reported that the collection of instalments took too much time and was therefore not an effective option for them
Table 6.11: Provision of financial support to clients
Provision of financial support to clients Nigeria Kenya
Frequency Percentage Frequency Percentageyes 14 63.6 11 26.8No 8 36-4 30 73.2Total 22 100 41 100Components of financial support Frequency Percentage Frequency Percentage
•Loanatnormalmarketprice 1 7.1 2 18.2
•Loanatratebelowthe normal market rate 0 0 2 18.2
•Possibilityofpaymentin various instalments 14 100 8 72.7
Source: Analysis of field data, 2013.
Estimated total market sales for RETs in 2012
As shown in Table 6.12, 54.5 percent of marketers interviewed in Nigeria were unwilling to declare their revenue for the year 2012, while in Kenya, 68 percent declined. This is probably because of the sensitive nature of such a question, which might lead to an estimation of the marketer’s profit. Some marketers thought exposing the profitability of their business may attract new marketers into the market and thus stiffen competition. Other factors adduced to the reluctance to disclose information on revenue are security and taxation. The respondents believe that the disclosure of revenue levels increases potential security hazards and possibly taxes as well. For those who disclosed their firm’s revenue (45.5 percent of respondents), the average sales of RETs in 2012 amounted to N 26.01 million with only 27 percent of the marketers attaining sales revenues of over N 20 million. As indicated in Table 6.13, most of the marketers are optimistic (81.8 percent in Nigeria and 78 percent in Kenya) that their revenue from RETs will be at least 25 percent higher in the next 5 years. As shown in Figure 6.4, the major factors responsible for the expected growth are lower prices through tariff reductions (27.3 percent) and an increase in the level of awareness (22.7 percent). In Table 6.14, the respondents indicate that in the next five years, the expected sales of RETs to the energy industry will increase
6. RET SUPPLY AND MARKETING IN NIGERIA AND KENYA

DIFFUSION STRATEGY OF GREEN TECHNOLOGY AND GREEN INDUSTRY IN AFRICA
102
by 47.78 percent and 58 percent and sales of RETs to the manufacturing industry will rise by 40.47 percent and 79 percent in Nigeria and Kenya, respectively.
Table 6.12: Current sales of RETs and expected sales in the next 5 years
Amount of RET products sold (solar, biomass, biogas, mini-hydro, wind) in 2012 ( in million Naira/ Ksh)
Nigeria Kenya
Frequency Percentage Frequency Percentage
0.5-1 1 4.5 2 4.91.1-10 1 4.5 4 9.810.1-20 1 4.5 1 2.4> 20 6 27 6 14.6No response 12 54.5 28 68.3Total 22 100 41 100Total expected market sales of RET products in the next 5 years (in million Naira/Ksh)
Frequency Percentage Frequency Percentage
0.5-1 0 0 1 2.41.1-10 1 4.5 4 9.810.1-20 0 0 1 2.4> 20 9 41 8 19.5No response 12 54.5 27 65.9Total 22 100 41 100Total market sales will be at least 25% higher in the next 5 years (2018) Frequency Percentage Frequency Percentage
yes 18 81.8 32 78.0No 4 18.2 9 22.0Total 22 100 41 100
Source: Analysis of field data, 2013
83 percent of respondents reported their average annual turnover for 2012 at USD 7,194,403. However, it should be borne in mind that RET suppliers in Kenya vary considerably in size, age and, consequently, capability. Out of all the firms that responded, 33.3 percent had an annual turnover of less than USD 50,000 and 45.5 percent had an annual turnover of between USD 50,001-USD 500,000, implying that over 88 percent of respondents’ turnovers are less than half a million US dollars per year. The remaining 12 percent of respondents were also equally varied. These firms had turnovers ranging from between USD 1 million – USD 212 million. Firms in this category were much older, larger in size, had experience in supplying other imported products and had a market reach beyond Kenya’s borders. These findings are hardly surprising as the industry is young with new firms having recently been established and the market only starting to take off.

103
Table 6.13 shows that the respondents expect that sales of RETs to government agencies will increase by 48.13 percent over the next five years, by 38.75 percent to NGOs, by 41.88 percent to farmers and by 56.36 percent to households. Sales to households is expected to be higher owing to increasing awareness of RET benefits, and prospects of increasing households’ disposable income attributable to the growing middle class. Furthermore, government is also expected to launch several development projects requiring modular power sources that can, inter alia, be achieved through RETs. So far, such examples include the use of solar energy for street lighting in urban areas and some rural electrification projects to power schools, hospital equipment, solar boreholes, streets and in some cases homes. In Kenya, growth in sales is expected to reach 58 percent for energy firms, 79 percent for manufacturers and 37 percent for government agencies. Sales to NGOs are expected to grow by 39 percent, to farmers by 5 percent and to households by 63 percent. The future market of RETs in Kenya is therefore expected to focus on both industry and households, particularly in the rural areas.
6. RET SUPPLY AND MARKETING IN NIGERIA AND KENYA
Figure 6.4: Factors responsible for expected RETs sales growth in the next 5 years
0
5
10
15
20
25
30Nigeria Kenya
Incr
ease
inaw
aren
ess
leve
l
Low
er p
rices
thro
ugh
tariff
redu
ctio
n
Impo
rt w
aive
rs fo
rRE
Ts c
ompo
nent
s
Gove
rnm
ent s
ubsi
dyon
RET
s
Assi
st in
fina
ncin
gin
telle
ctua
lpr
oper
ty ri
ght o
n…
Fina
ncia
l pro
visi
onfo
r mor
e re
serc
hes
on R
ETs
Pers
iste
nce
epile
ptic
pow
er s
uppl
yin
Nig
eria
Good
gov
erna
nce
22,719,5
27,3
14,6
9,1
2,44,5
12,2
4,5 4,9
13,6 13,6
0 0
4,9 4,5
Factors
Perc
enta
ge

DIFFUSION STRATEGY OF GREEN TECHNOLOGY AND GREEN INDUSTRY IN AFRICA
104
Table 6.13: Expected sales of RETs to various submarkets in the next 5 years (energy industry, manufacturing, government agencies)
Expected total market sales of RETs to various submarkets in the next 5 years (2018)Energy industry (%) Frequency Percentage Frequency Percentage≤10 2 9.1 6 14.611-20 1 4.5 2 4.921-30 0 0 2 4.931-40 1 4.5 0 041-50 2 9.1 1 2.451-60 0 0 0 0≥ 60 3 13.6 3 7.3No response 13 59.1 27 65.8Total 22 100 41 100Mean value of products sold (%) 47.78 58Manufacturing (%) Frequency Percentage Frequency Percentage≤10 0 0 5 12.211-20 2 9.1 1 2.421-30 2 9.1 4 9.831-40 2 9.1 0 041-50 2 9.1 1 2.451-60 1 4.5 2 4.9≥ 60 0 0 4 9.8No response 13 59.1 24 58.5Total 22 100 41 100Mean value of product sold (%) 40.47 79Govt. agencies (%) Frequency Percentage Frequency Percentage≤10 2 9.1 6 14.611-20 0 0 1 2.421-30 3 13.6 2 4.931-40 0 0 0 0.041-50 0 0 3 7.351-60 0 0 0 0.0≥ 60 3 13.6 3 7.3No response 14 63.6 26 63.4Total 22 100 41 100Mean value of products sold (%) 48.13 37
Source: Analysis of field data, 2013

105
Table 6.14: Expected sales of RETs to various submarkets (NGOs, farmers, households)
Expected total market sales to various submarkets in the next 5 years (2018)
Non-Governmental Organization (%)Nigeria Kenya
Frequency Percentage Frequency Percentage≤10 2 9.1 4 9.811-20 0 0 3 7.321-30 0 0 1 2.431-40 0 0 0 041-50 0 0 1 2.451-60 1 4.5 1 2.4≥ 60 1 4.5 4 9.8No response 18 81.8 27 65.9Total 22 100 41 100Mean value of products sold (%) 38.75 39Farmers (%) Frequency Percentage Frequency Percentage≤10 3 13.6 1 2.411-20 1 4.5 0 021-30 1 4.5 0 031-40 0 0 0 041-50 0 0 0 051-60 0 0 0 0≥ 60 2 9.1 0 0No response 14 63.6 40 97.6Total 22 100 41 100Mean value of product sold (%) 41.88 5Households (%) Frequency Percentage Frequency Percentage≤10 1 4.5 3 7.311-20 0 0 3 7.321-30 1 4.5 2 4.931-40 0 0 1 2.441-50 4 18.2 1 2.451-60 2 9.1 1 2.4≥ 60 2 9.1 8 19.5No response 11 50.0 22 53.7Total 22 100 41 100Mean value of products sold (%) 56.36 63
Source: Analysis of field data, 2013
6. RET SUPPLY AND MARKETING IN NIGERIA AND KENYA

DIFFUSION STRATEGY OF GREEN TECHNOLOGY AND GREEN INDUSTRY IN AFRICA
106
Observations of significant change in RET sales since 2010
Table 6.15 presents the RET marketers’ perception of change in RET sales since 2010. Respondents (95.5 percent) in Nigeria and Kenya (73 percent) acknowledge that the sales of RETs have drastically changed over the past two years. The average increase as estimated by the respondents is 31.67 percent and 62 percent in Nigeria and Kenya, respectively. Only four respondents claimed that sales have decreased, and the average rate of decrease based on their responses is 21.25 percent, while in Kenya 6 firms reported a decline in sales citing growing competition.
Table 6.15: Change in RET sales in the last 2 years
Change in sales over last 2 years (2010)Nigeria Kenya
Frequency Percentage Frequency Percentageyes 21 95.5 30 73.2No 1 4.5 11 26.8Total 22 100 41 100Average annual increase in sales over last two years or in 2010 (%) Frequency Percentage Frequency Percentage
≤5 4 18.2 1 2.46-10 2 9.1 2 4.911-20 0 0 3 7.321-30 5 22.7 5 12.231- 40 2 9.1 3 7.341-50 2 9.1 3 7.3> 50 3 13.6 8 19.5No response 4 18.2 16 39.0Total 22 100 41 100Average percentage increase 31.67 62Average annual decrease in sales over last two years or in 2010 (%) Frequency Percentage Frequency Percentage
≤ 5 1 4.5 1 2.46-10 2 9.1 0 0.011-20 0 0 1 2.421-30 0 1 2.431- 40 0 0 1 2.441-50 0 0 1 2.4> 50 1 4.5 1 2.4No response 18 81.8 35 85.4Total 22 100 41 100Average percentage decrease 21.25 39.4
Source: Analysis of field data, 2013
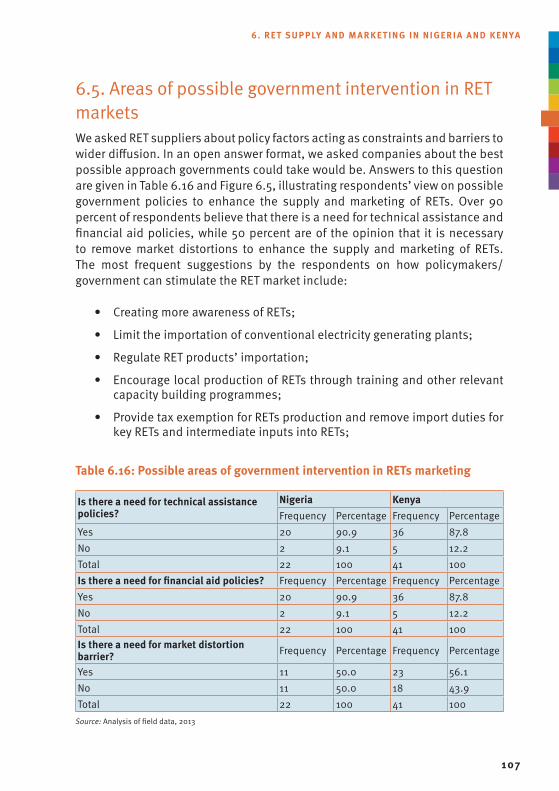
107
6.5. Areas of possible government intervention in RET marketsWe asked RET suppliers about policy factors acting as constraints and barriers to wider diffusion. In an open answer format, we asked companies about the best possible approach governments could take would be. Answers to this question are given in Table 6.16 and Figure 6.5, illustrating respondents’ view on possible government policies to enhance the supply and marketing of RETs. Over 90 percent of respondents believe that there is a need for technical assistance and financial aid policies, while 50 percent are of the opinion that it is necessary to remove market distortions to enhance the supply and marketing of RETs. The most frequent suggestions by the respondents on how policymakers/government can stimulate the RET market include:
• CreatingmoreawarenessofRETs;
• Limittheimportationofconventionalelectricitygeneratingplants;
• RegulateRETproducts’importation;
• EncouragelocalproductionofRETsthroughtrainingandotherrelevantcapacity building programmes;
• ProvidetaxexemptionforRETsproductionandremoveimportdutiesforkey RETs and intermediate inputs into RETs;
6. RET SUPPLY AND MARKETING IN NIGERIA AND KENYA
Table 6.16: Possible areas of government intervention in RETs marketing
Is there a need for technical assistance policies?
Nigeria KenyaFrequency Percentage Frequency Percentage
yes 20 90.9 36 87.8No 2 9.1 5 12.2Total 22 100 41 100Is there a need for financial aid policies? Frequency Percentage Frequency Percentageyes 20 90.9 36 87.8No 2 9.1 5 12.2Total 22 100 41 100Is there a need for market distortion barrier? Frequency Percentage Frequency Percentage
yes 11 50.0 23 56.1No 11 50.0 18 43.9Total 22 100 41 100
Source: Analysis of field data, 2013
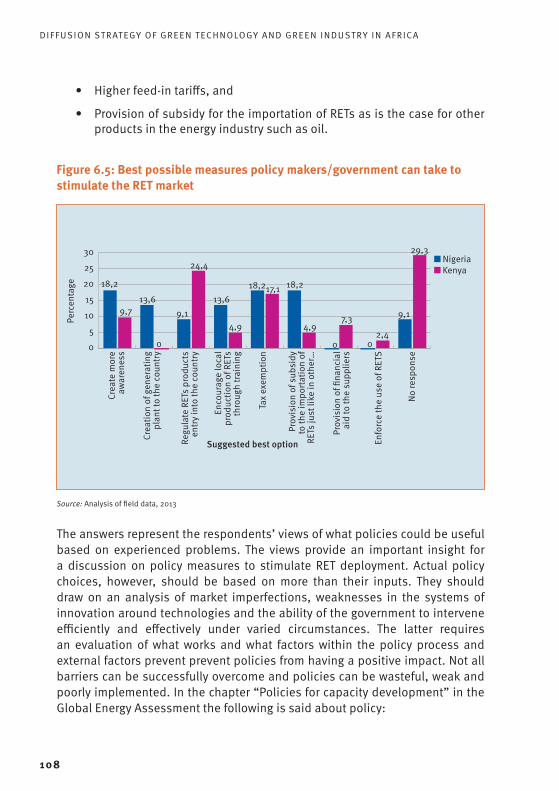
DIFFUSION STRATEGY OF GREEN TECHNOLOGY AND GREEN INDUSTRY IN AFRICA
108
• Higherfeed-intariffs,and
• ProvisionofsubsidyfortheimportationofRETsasisthecaseforotherproducts in the energy industry such as oil.
Figure 6.5: Best possible measures policy makers/government can take to stimulate the RET market
Source: Analysis of field data, 2013
The answers represent the respondents’ views of what policies could be useful based on experienced problems. The views provide an important insight for a discussion on policy measures to stimulate RET deployment. Actual policy choices, however, should be based on more than their inputs. They should draw on an analysis of market imperfections, weaknesses in the systems of innovation around technologies and the ability of the government to intervene efficiently and effectively under varied circumstances. The latter requires an evaluation of what works and what factors within the policy process and external factors prevent prevent policies from having a positive impact. Not all barriers can be successfully overcome and policies can be wasteful, weak and poorly implemented. In the chapter “Policies for capacity development” in the Global Energy Assessment the following is said about policy:
0
5
10
15
20
25
30Nigeria Kenya
Crea
te m
ore
awar
enes
s
Crea
tion
of g
ener
atin
gpl
ant t
o th
e co
untry
Regu
late
RET
s pr
oduc
tsen
try in
to th
e co
untry
Enco
urag
e lo
cal
prod
uctio
n of
RET
sth
roug
h tra
inin
g
Tax
exem
ptio
n
Prov
isio
n of
sub
sidy
to th
e im
porta
tion
ofRE
Ts ju
st li
ke in
oth
er…
Prov
isio
n of
fina
ncia
lai
d to
the
supp
liers
No re
spon
se
Enfo
rce
the
use
of R
ETS
18,2
9,713,6
0
9,1
24,4
13,6
4,9
18,217,1 18,2
4,97,3
002,4
9,1
29,3
Suggested best option
Perc
enta
ge

109
“Designing policies to increase the demand for and supply of clean, energy-efficient technologies, speeding their adoption in sectors such as transport, energy, buildings and building materials, and strengthening their contribution to overall development goals requires the capacity to work from a systems perspective. Bringing key actors together in task forces, panels, and platforms could play an important role here. While not yet widespread, there is evidence that universities in a growing number of countries have created interdisciplinary graduate programs in sustainable engineering that could train a new generation of intermediaries and help change the existing reward structure. But more needs to be done, and more rapidly than in the past, to meet the GEA’s goals”.76
Capacity issues go beyond the aggregation of skills and competences; capacities are required at all levels, including at the level of government:
“Energy transitions are long-term, socially embedded processes that involve changes in production and consumption patterns, knowledge, skills, formal and informal institutions, and the habits and practices of the actors involved. These characteristics have major consequences for the choice of an energy transition pathway today and the capacities that might be needed to move down that pathway successfully in the future. From this perspective, capacity development can no longer be seen as a simple aggregation of individual skills and competences or the introduction of a new “technology.” In the course of an energy transition, moreover, capacities at the actor and systems levels, and the policies for capacity development themselves, will inevitably change. This will require feedback and the capacity for flexible adaptation over time”.77
Much is expected from dialogues between policymakers, researchers, companies and civil society actors. For such a dialogue to be effective, the legitimacy of local concerns, interests and needs must be considered in the discussion on barriers and attention should be given to the role of informal institutions and the constraints in real-life situations (Mytelka et al, 2012). Policy is best understood in this context as a process rather than a set of policies printed on paper.
For our study, we organized with a meeting with policymakers in Nairobi and individuals from the private and public sector. Results of the meeting are presented in the workshop report. One important conclusion from the discussions is that we should look at the interaction of barriers and the
76 Mytelka et al. (2012, p. 1749)77 Mytelka et al (2012, p. 1786).
6. RET SUPPLY AND MARKETING IN NIGERIA AND KENYA

DIFFUSION STRATEGY OF GREEN TECHNOLOGY AND GREEN INDUSTRY IN AFRICA
110
deeper issues behind those barriers, namely how they jointly create a blocking mechanism against adoption. When costs of adoption are high, we should investigate what factors make those costs high. The ethanol gel case study presented in Chapter 8 serves as a useful example. The price of the gel is considerably above that of kerosene (170 Kes vs 90-100 Kes), but kerosene is not taxed and is less energy efficient. The cost of the stove for the gel is high because of import duties and excise taxes and because retailers are taking high margins. This hints at structural barriers such as an inefficient retailing system and unequal tax treatment of energy sources. Poor production capacity is also a relevant factor in this specific case: if the stove was produced in Africa there would be no excise duties and shipping costs. What this teaches is that besides the barriers mentioned by interviewees there are other barriers not listed in the closed answer categories having to do with the structure and efficiency of the economy which have to be considered in the analysis. A more efficient economy would serve to alleviate various barriers. Simple questions about experienced barriers may have compound answers. The innovation system model helps to identify barriers and opportunities in a systematic analysis.
6.6. Use of RETs by cassava and maize processing firmsFactors constraining the use of RETs
The results in Table 6.17 reveal that the majority (93.5 percent) of cassava processing firms in the research sample claimed to use RETs. However, the results also clearly show that the RET being uses is biomass, mainly fuel wood and charcoal, of which there is an abundance in the study area. The use of solar PV and other RETs is rare among the cassava processors. Only one firm used solar PV for street lighting as part of a government street lighting project since the firm was owned by a government agency.
From the results in Table 6.17, the major barriers to RET use according to the cassava processing firms interviewed are lack of information on RETs (24.2 percent), lack of support or government incentive for RET adoption (19.4 percent), RETs are expensive (17.7 percent) and lack of technical skills (14.5 percent).
None of the Kenyan firms interviewed reported using RETs for processing grain. According to one respondent, machinery used in medium to large milling systems requires 850 MW on average. This high capacity and the fact that

111
millers are normally located in industrial zones with limited land implies that RETs cannot be exploited. Table 6.17: Factors constraining the use of RETs by cassava processing firms
Using RETs as a source of power in your firm
Nigeria KenyaFrequency Percentage Frequency Percentage
yes 58 93.5 0 0.0No 4 6.5 40 100.0Total 62 100 40 100.0Types of RETs currently in use Frequency Percentage Frequency PercentageSolar PV 1 1.7 0 0.0Wind power 0 0 0 0.0Biomass 57 98.3 0 0.0Mini-hydro 0 0 0 0.0Total 58 100 0 0Constraints for not using RETs* Frequency Percentage Frequency PercentageLack of information on RETs 15 24.2 7 17.5RETs are expensive 11 17.7 8 20.0Lack of technical skills 9 14.5 3 7.5Lack of support or government incentive for RET adoption 12 19.4 3 7.5
Available RETs are not able to meet firm’s energy demands 3 4.9 8 20.0
Other priority 0 0 1 2.5Note* multiple choice responsesSource: Analysis of field data, 2013
Willingness to work with foreign companies on RET adoptionWith regard to willingness to work with foreign companies that seek to assist local firms with RET adoption, Table 6.18 shows that 91 percent of respondents in Nigeria and 87.5 percent in Kenya are interested in cooperating. Perceived barriers to such cooperation in Nigeria include high tariffs on foreign equipment (48.4 percent), lack of technical competence to engage foreign companies (46.8 percent) and unfavourable business climate/environment for FDI (35.5 percent). In Kenya, high tariffs on foreign equipment was the only barrier identified by the respondents.
6. RET SUPPLY AND MARKETING IN NIGERIA AND KENYA

DIFFUSION STRATEGY OF GREEN TECHNOLOGY AND GREEN INDUSTRY IN AFRICA
112
Table 6.18: Foreign companies’ assistance with the use of RETs Willingness to work with foreign companies on RET adoption
Nigeria KenyaFrequency Percentage Frequency Percentage
yes 57 91.9 35 87.5No 4 6.4 5 12.5Undecided 1 1.6 0 0Total 62 100 40 100Barriers to working with foreign companies* Frequency Percentage Frequency Percentage
Government’s preference for local equipment 7 11.3 0 0
High-tariffs on foreign equipment 30 48.4 40 100Unfavourable business climate/environment for FDI 22 35.5 0 0
Firm lacks technical competence to engage foreign companies 29 46.8 0 0
Total 62 100 40 100Source: Analysis of field data, 2013
113
7. AdoPtion oF EnErGy EFFiCiEnCy mEASurES in tHE niGEriAn And KEnyAn AGro-induStry 7.1. Employment generation, capacity utilization and sales turnover of firms
Table 7.1 presents the basic characteristics of the respondent firms in Nigeria’s cassava processing industry and Kenya’s maize milling industry. These characteristics include employment generation, time of establishment, capacity utilization and sales turnover.
Employment generation in 2012 and time of establishment
The results show that the respondent cassava processing firms employed on average 13 persons full time in 2012. The smallest firm employed two persons while the largest employed 53 full-time employees. The majority (69.4 percent) of existing cassava processing firms included in our study areas were established between 2010 and 2012. This implies that many cassava processing firms in the research sample are fairly new start-ups.
Although the oldest maze milling firm in Kenya was established in 1910, 42.5 percent of firms were set up before 2000. A further 42.5 percent were established in the period 2000-2010 as a result of reforms in the public sector, which included liberalization of the maize marketing structures. The remaining firms were established after 2010, indicating that the industry is older and well established with fewer new entrants. Maize millers in Kenya were much larger compared to cassava processors in Nigeria, with an average of 70 full-time employees in 2012. However, it should be noted that Kenyan maize millers have a tendency to operate longer than 8 hours a day, and about one-third of the firms interviewed operated for more than 10 hours per day. This has an impact

DIFFUSION STRATEGY OF GREEN TECHNOLOGY AND GREEN INDUSTRY IN AFRICA
114
on staffing levels, with most firms using short-term employees, particularly for night shifts, and these levels are adjusted on the basis of grain availability.
Current capacity utilization and sales turnover
The average capacity utilization for the respondent cassava processing firms is 63.65 percent, indicating that the firms generally have good operational conditions. Also, the mean value of the sales turnover in 2012 was N 5,612,452, with about 54.8 percent having a turnover of less than N 1 million while about 21 percent earned above N 2 million. It is noteworthy that about 14.5 percent did not respond to the question. The average annual increase in sales in the last three years was 31.85 percent, with about half (51.61 percent) having witnessed a less than 31 percent (average) increase in the last three years and 14.5 percent experiencing no increase in sales. Although average annual decrease in sales was 31 percent, 81.7 percent of firms did not experience any decrease in sales. However, about 8.06 percent of firms had less than 31 percent (average) decrease in sales. This suggests that the cassava processing firms in our research sample are profitable.
In Kenya, capacity utilization among maize millers averaged 65 percent while average sales for 2012 were USD 21,000. As in the case of Nigeria, the distribution of capacity utilization among firms was concentrated between 41-80 percent, given that 70 percent of firms fall within this range (Figure 7.1). Only 7.5 percent of firms in Kenya have capacity utilization in excess of 80 percent, while no Nigerian firm in the research sample has capacity utilization in excess of 80 percent. In Kenya, only 7.5 percent of maize milling firms has capacity utilization of less than 40 percent. This latter category is largely small-scale hammer mills that are operated part time only, i.e. operating from the late afternoon to the early evening hours. Capacity utilization was reported to vary depending on the harvest and on government directives on import and export of maize. Government interference in the maize market was reported to have negative consequences on capacities, with some firms going for days with no raw materials. Scholars attribute the prevalence of illegal import and export of grains for hoarding purposes in neighbouring countries as the main reason for government interventions in Kenya’s maize market.
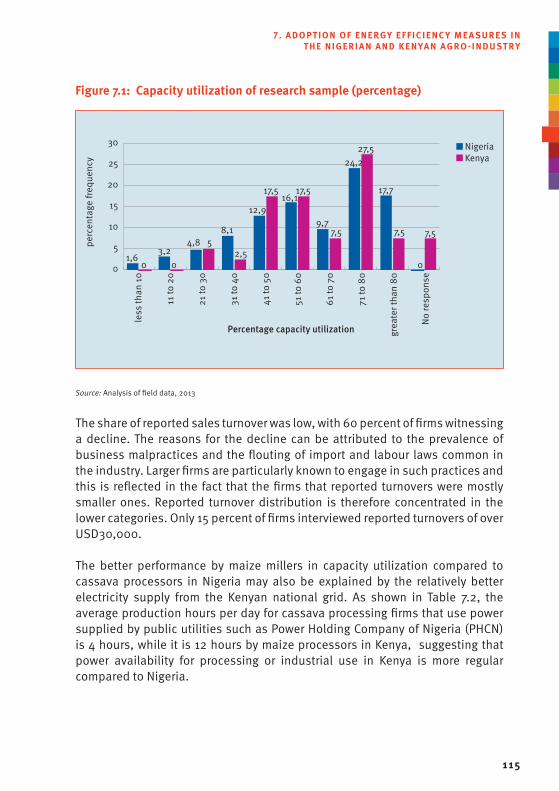
115
Figure 7.1: Capacity utilization of research sample (percentage)
Source: Analysis of field data, 2013
The share of reported sales turnover was low, with 60 percent of firms witnessing a decline. The reasons for the decline can be attributed to the prevalence of business malpractices and the flouting of import and labour laws common in the industry. Larger firms are particularly known to engage in such practices and this is reflected in the fact that the firms that reported turnovers were mostly smaller ones. Reported turnover distribution is therefore concentrated in the lower categories. Only 15 percent of firms interviewed reported turnovers of over USD30,000.
The better performance by maize millers in capacity utilization compared to cassava processors in Nigeria may also be explained by the relatively better electricity supply from the Kenyan national grid. As shown in Table 7.2, the average production hours per day for cassava processing firms that use power supplied by public utilities such as Power Holding Company of Nigeria (PHCN) is 4 hours, while it is 12 hours by maize processors in Kenya, suggesting that power availability for processing or industrial use in Kenya is more regular compared to Nigeria.
0
5
10
15
20
25
30 Nigeria Kenya
less
than
10
perc
enta
ge fr
eque
ncy
21 to
30
11 to
20
31 to
40
41 to
50
51 to
60
61 to
70
71 to
80
grea
ter t
han
80
No re
spon
se
1,60
3,24,8
8,1
2,5
12,9
17,516,1
17,5
9,77,5
24,227,5
17,7
7,5 7,55
0 0
Percentage capacity utilization
7. ADOPTION OF ENERGY EFFICIENCY MEASURES IN THE NIGERIAN AND KENYAN AGRO-INDUSTRY

DIFFUSION STRATEGY OF GREEN TECHNOLOGY AND GREEN INDUSTRY IN AFRICA
116
Table 7.1: Basic characteristics of respondent firms
Size of employment generation (number)Nigeria Kenya
Frequency Percentage Frequency Percentage2-10 39 62.9 15 37.511-20 13 21 6 15> 20 9 14.5 17 42.5No response 1 1.6 2 5Total 62 100 40 100Average, minimum, maximum 13, 2, 53 70, 1, 400Time of establishment Frequency Percentage Frequency PercentageBefore 2000 9 14.5 17 42.52000 - 2010 43 69.4 17 42.52011 - 2012 9 14.5 4 10No response 1 1.6 2 5Total 62 100 40 100Average capacity utilization of firms 63.65 65.08Firm’s sales turnover in 2012 ( in million Naira for Nigeria and Ksh for Kenya) Frequency Percentage Frequency Percentage
≤ 0.5 23 37.1 7 17.50.51– 1 11 17.7 1 2.51.1 -1.5 4 4.8 1 2.51.6 -2 2 3.2 1 2.52.1- 2.5 2 3.2 0 02.6 – 3 3 4.8 0 0> 3 8 12.9 6 15No response 9 14.5 24 60Total 62 100 40 100
Mean value of sales turnover N5,612,452.83 ($35,748)
KSh1,840,797 ($21,062)
Average annual increase in sales in last three years (in %) Frequency Percentage Frequency Percentage
< 5 6 9.7 4 5.06-10 8 12.9 2 2.511-20 11 17.7 11 27.521-30 7 11.3 4 1.031- 40 5 8.1 1 2.541-50 7 11.3 1 2.5> 50 9 14.5 0 0.0No response 9 14.5 17 5.0

117
Size of employment generation (number)Nigeria Kenya
Frequency Percentage Frequency PercentageTotal 62 100 40 100.0Average 31.85 29.23Average annual decrease in sales in last three years (in %) Frequency Percentage Frequency Percentage
< 5 1 3.2 1 2.56-10 0 0 0 0.011-20 2 3.2 1 2.521-30 2 3.2 3 7.531- 40 0 0 1 2.541-50 2 3.2 3 7.5> 50 1 3.2 0 0.0No response 54 87.1 31 77.5Total 62 100 40 100.0Average 31.00 34.29
Source: Analysis of field data, 2013
Table 7.2: Firm’s average production hours per day using power supply from public utilities
Average production hours per day (hrs)Nigeria Kenya
Frequency Percentage Frequency Percentage≤ 5 13 21 7 17.56-10 4 6.4 10 2511-15 0 0 3 7.516-20 0 0 4 10> 20 0 0 6 15No response 45 72.6 10 25Total 62 100 40 100Average (hrs) 3.94 11.68
Source: Analysis of field data, 2013
7. ADOPTION OF ENERGY EFFICIENCY MEASURES IN THE NIGERIAN AND KENYAN AGRO-INDUSTRY

DIFFUSION STRATEGY OF GREEN TECHNOLOGY AND GREEN INDUSTRY IN AFRICA
118
7.2. Adoption of EE measures
As shown in Table 7.3 and Figure 7.3, a number of EE measures has been adopted by the cassava and maize processing firms interviewed in both countries. The most prominent EE measure adopted by cassava processors is the use of diesel engine (27.4 percent) substituting for petrol engines. The major products of the cassava processing firms in the research sample are gari (granulated cassava output) and lafun (a form of cassava flour prepared as staple food). This confirms the notion of cassava products as a major food security crop, and cassava processing among the sampled firms largely target local food demands. The production of industrial starch and flour by the sampled firms is also significant as the interviews and field observations indicate. Industrial starch produced is mainly supplied to local food processing firms, while High Quality Cassava Flour (HQCF) is important feedstock for flour mills, biscuit firms, bakeries and other confectionery firms. Besides, previous government policies and advocacy on the use of cassava flour (Gu et al, 2012) and of HQCF in confectioneries is being specifically encouraged as a major component of the current government’s Agricultural Transformation Agenda.
An overview of the measures adopted is provided in Table 7.3 and Figure 7.2.
Table 7.3: Distribution of EE measures employed by the sampled cassava processing firms
Types of EE measure* Frequency PercentageUse of black oil to replace kerosene 2 3.2Flash dryer and bigger hammer for milling 1 1.6Use of coal boiler for steam generation 1 1.6Regular servicing, use of new grater, chipping machine and sifter 1 1.6Modern heater ( traditional frying pan to stainless) 3 4.8Regular servicing of equipment and replacement 7 11.3Use of diesel engine to replace petrol engine 17 27.4Use of diesel generator and grater 6 9.7Diesel engine and regular servicing 3 4.8Use of steel grater, silter and chipping machine 3 4.8New grater and regular servicing 6 9.7Change of power source from diesel to electricity 0 0Regular training of operators of processing equipment 0 0
Note * multiple responses
Source: Analysis of field data, 2013

119
Figure 7.2: Distribution of EE measures employed by the sampled cassava processing firms
Source: Analysis of field data, 2013
Figure 7.2 shows that the most prevalent measures are good housekeeping (adopted by 59.7 percent of cassava processing firms and by 52.5 percent of maize milling firms), better process control (adopted by 53.2 percent of cassava processing firms and 52.5 percent of maize milling firms), equipment modification (adopted by 37.5 percent of maize millers in Kenya) and acquisition of new technology (adopted by 43.5 percent of cassava processors in Nigeria).
77.5 percent of firms contacted in Kenya reported having implemented some form of energy efficiency measure, and 58 percent (45 percent of all firms contacted) implementing such measures stated that this was the result of lessons learnt from an earlier EE measure (Table 7.4). However, the actual EE measures being implemented mainly relate to upkeep such as routine maintenance and repairs. Depending on the type of processing method used, some maintenance and repair measures can have a considerable impact in terms of energy efficiency as we will see below. Some firms went beyond these measures in an attempt to curb the rising costs of electricity, including installations of small machinery parts that improve energy efficiency such as replacing old motors with newer ones and installations of power factor corrective equipment. The latter is supported
0 20 40 60 80 100
Among maize processing firms
Among cassava processing firms
good house keeping52,5
59,7
1522,6
42,553,2
37,522,6
17,548,5
2,59,7
12,511,3
7,517,7
82,51,6
substitute energy carrier
better process control
equipment modification
technological change(acquisition of new equipment)
on-site reuse and recovery of heat
production of useful by-products(eg. Use of low-grade waste)
product diversification
No response
7. ADOPTION OF ENERGY EFFICIENCY MEASURES IN THE NIGERIAN AND KENYAN AGRO-INDUSTRY

DIFFUSION STRATEGY OF GREEN TECHNOLOGY AND GREEN INDUSTRY IN AFRICA
120
by a regulation that requires manufacturing firms to install capacitors to help stabilize demand and supply. The only contribution to energy efficiency is their potential to reduce power outages that are likely to arise if demand and supply are not stable.
Three large firms (two of these are among the top five in Kenya) knew about the centre and had received energy audit assistance from it. At the time of the survey, the first firm was in the process of implementing the recommendations of the audits, and although the only measure was a switch to LED lights, this did not entail a substantial technological change. Owing to the size of the firm, the measure was expected to bring substantial savings. The second firm switched from an electric to a firewood boiler in a bid to cut costs. It also replaced water pumps and implemented repair and maintenance measures to mitigate pressure leakage, thus minimizing steam loss. The measure resulted in cost reductions of up to 50 percent and reduced the process time. The implementation of measures at the other firm is discussed in the case study presentation in Chapter 8.
Table 7.5 presents an analysis of EE measures adopted over the past five years by the firms in our research sample. Nearly all cassava processing firms and a high share of maize millers (77.5 percent) have been participating in energy efficiency improvement measures since 2007. Furthermore, 80.6 percent and 47.5 percent in Nigeria and Kenya, respectively, reported that the measures they implemented benefited from lessons gleaned from the adoption of earlier measures. Based on the interviews conducted, the most highly rated benefits from using energy efficiency measures are consumption of less fuel and faster operation of heat exchange systems and dryers. A large share of the firms (90.3 percent) could not quantify the percentage of electricity they would have conserved. This proportion was lower in Kenya, with 42.5 percent (of 89 percent firms that carried out measures) not being able to quantify energy savings resulting from these measures. This can be interpreted as meaning that cost motivations play a more important role than environmental protection or sustainability when it comes to adopting EE measures. Although the industry conserves an average of 32.1 percent of the petrol/diesel bill, about one half (51.61 percent) of them do not conserve more than 30 percent of the petrol/diesel bill. About 39 percent of the firms spend above the average share (39.2 percent) of the total energy costs. Thus, it can be inferred that cassava processing firms in our research sample have benefited substantially from EE measures.

121
Table 7.4: Energy efficiency improvement measures in the last 5 years
Implemented energy efficiency improvement measures since 2007
Nigeria Kenya
Frequency Percentage Frequency Percentage
yes 60 96.8 31 77.5No 2 3.2 9 22.5Total 62 100 40 100.0EE measure derives benefits from previous EE measures Frequency Percentage Frequency Percentage
yes 50 80.6 19 47.5No 7 11.3 21 52.5Undecided 5 8.1 0 0.0Total 62 100 40 100.0Amount spent on electricity use would probably be ….. percent higher without the use of EE measures
Frequency Percentage Frequency Percentage
< 5 0 0 2 5.06-10 0 0 4 10.011-20 4 6.5 6 15.021-30 0 0 4 10.031- 40 0 0 4 10.041-50 1 1.6 1 2.5> 50 1 1.6 2 5.0No response 56 90.3 17 42.5Total 62 100 40 100.0Average 35.0 25.70Amount spent on petrol/diesel use would probably be …. percent higher without the use of EE measures
Frequency Percentage Frequency Percentage
≤ 5 1 1.6 1 2.56-10 7 11.3 0 0.011-20 15 24.2 1 2.521-30 9 14.5 1 2.531- 40 2 3.2 0 0.041-50 8 12.9 0 0.0> 50 6 9.7 0 0.0No response 14 22.6 37 92.5Total 62 100 40 100.0Average 32.1 18.33
7. ADOPTION OF ENERGY EFFICIENCY MEASURES IN THE NIGERIAN AND KENYAN AGRO-INDUSTRY

DIFFUSION STRATEGY OF GREEN TECHNOLOGY AND GREEN INDUSTRY IN AFRICA
122
Implemented energy efficiency improvement measures since 2007
Nigeria Kenya
Frequency Percentage Frequency PercentageShare of energy costs in your total costs (percentage) Frequency Percentage Frequency Percentage
≤ 5 2 3.2 4 10.06-10 4 6.5 6 15.011-20 7 11.3 10 25.021-30 14 22.6 5 12.531- 40 18 29.0 3 7.541-50 5 8.1 3 7.5> 50 19 30.6 2 5.0No response 1 1.6 7 17.5Total 62 100 40 100.0Average 39.2 28.0
Source: Analysis of field data, 2013
7.3. Finance of EE measures
As shown in Table 7.5, 85.5 percent of cassava processing firms in the Nigerian research sample finance their EE measures with the firm’s own capital. An average of 68.4 percent of the costs of EE measures were financed from firms’ own capital. This suggests that a substantial part of the funds to finance EE measures are internal funds. While only 11 out of the 62 firms (18 percent) interviewed have other funding sources apart from own capital, other sources such as development banks, NGOs, donor organizations and importers of EE technologies were not mentioned as sources of capital for financing the implementation of EE measures. The World Bank/GEF, informal sources such as family and friends and commercial banks are notable among other agents mentioned as sources of capital for funding EE measures. Other agents mentioned that are not listed in Table 7.6 include cooperative societies, state government loan schemes and the World Bank supported Fadama III project. Furthermore, Figure 7.3 indicates that while 90.3 percent of the processing firms focus on reducing energy costs for the company, 9.7 percent consider it a minor issue. These results suggest that most of the firms interviewed regard the implementation of EE measures as crucial for the firm.

123
Table 7.5: Mode of financing EE measuresFinance EE measures with firm’s own capital
Nigeria KenyaFrequency Percentage Frequency Percentage
yes 53 85.5 31 77.5No 9 14.5 9 22.5Total 62 100 40 100.0Percentage of cost of EE measures financed with own capital Frequency Percentage Frequency Percentage
< 20 3 4.8 4 10.021-40 11 17.7 1 2.541- 60 12 19.4 1 2.561-80 4 6.5 0 0.081- 100 23 37.1 18 45.0No response 9 14.5 16 40.0Total 62 100 40 100.0Mean percentage of capital invested in EE measures 68.4 81.0
Sources of EE financing apart from own capital Frequency Percentage Frequency Percentage
Commercial bank 4 6.5 2 5.0Development bank 0 0 0 0.0NGOs 0 0 0 0.0Donor organization 0 0 0 0.0World Bank/GEF 8 12.9 0 0.0Importer/seller of the EE technology 0 0 0 0.0Consultancy involved in setup/implementation 1 1.6 0 0.0
Financial intermediary 2 2.3.2 0 0.0Friend or family relation 5 5.81 0 0.0Others sources such as cooperatives 11 17.7 38 95.0
Source: Analysis of field data, 2013
7. ADOPTION OF ENERGY EFFICIENCY MEASURES IN THE NIGERIAN AND KENYAN AGRO-INDUSTRY

DIFFUSION STRATEGY OF GREEN TECHNOLOGY AND GREEN INDUSTRY IN AFRICA
124
Figure 7.3: Firms’ perception of the importance of reducing energy costs
Source: Analysis of field data, 2013
Nearly half of all firms contacted in Kenya (45 percent) financed energy efficiency measures with 100 percent own capital. 15 percent used own capital shares of between 20 percent and 60 percent while the remaining 40 percent did not respond to the question. It is worth noting that half of those who did not respond to this question, answered positively to having funded an energy efficiency measure with their own capital but did not answer the question about how much percentage of their own capital was used. Given the local context and entrepreneurial behaviour, it could be possible that 20 percent of these firms funded the measures fully. Interestingly, only 5 percent of the firms supplemented own capital with bank loans while the rest used other sources including cooperatives, family and friends for smaller enterprises, and own capital. This reflects the high cost of finance in the country and the stringent requirements of assets to act as a security for loans, deterring enterprises from obtaining credit. The fact that only 57.5 percent of firms reported that energy costs are an important issue warranting the highest level of attention is notable (Figure 7.2). This comes as a surprise given the rising costs of energy over the last five years. However, given the complexity of maize markets, other issues such as sources of grain may be considered more important. Another factor is that when an industry is characterized by business malpractices, informal opportunities to reduce costs such as energy costs also present themselves. Examples of such opportunities may come in the form of employing large parts of the staff on a casual basis, thus keeping wages low and evading employee-related expenses or importing grain illegally instead of buying it locally. These examples can have significant impacts on business margins. Consequently,
0
10
20
30
40
50
60 Nigeria Kenya
perc
enta
ge
54,8 57,5
35,5
12,5 9,7
30
it is a very importantissue for the company,so we give attention at
the highest level
it is somethingwe give
attention to
Level of importance
It is of minorimportance

125
we can say that business malpractices can be a deterrent to energy efficiency adoption.
7.4. Energy efficiency projects and their impacts
Successful EE projects carried out by firms
Table 7.6 presents findings on EE projects by Nigerian cassava processing firms and Kenyan maize millers. Despite the potential benefits of EE measures, only one quarter of the cassava processing firms interviewed have an energy auditing programme. As shown in Figure 7.3, the EE project implemented is best
7. ADOPTION OF ENERGY EFFICIENCY MEASURES IN THE NIGERIAN AND KENYAN AGRO-INDUSTRY
Table 7.6: Programme of energy auditing and impact of EE projects
Have an energy auditing programmeNigeria Kenya
Frequency Percentage Frequency Percentageyes 16 25.8 11 27.5No 46 74.2 29 72.5Total 62 100 40 100.0Percentage of energy saved Frequency Percentage Frequency Percentage≤5 5 8.1 4 10.06-10 6 9.7 8 20.011-20 12 19.4 3 7.521-30 11 17.7 5 12.531- 40 2 3.2 1 2.541-50 7 11.3 1 2.5> 50 5 8.1 0 0.0No response 14 22.6 18 45.0Total 62 100 40 100.0Average 28.9 16.79Form of energy saved Frequency Percentage Frequency PercentagePetrol 9 14.5 0 0.0Electricity 1 1.6 10 25.0Petrol and electricity 1 1.6 0 0.0Firewood 4 6.5 0 0.0Kerosene 2 3.2 0 0.0Diesel 21 33.9 1 2.5Diesel & electricity 2 3.2 0 0.0No response 21 33.9 29 72.5Total 62 100 40 100.0
Source: Analysis of field data, 2013

DIFFUSION STRATEGY OF GREEN TECHNOLOGY AND GREEN INDUSTRY IN AFRICA
126
described as good housekeeping by 59.7 percent of the respondents, as having better process control by 53.2 percent of the respondents, and as technological change or acquisition of new equipment by 43.5 percent of the respondents. About 58 percent claimed that the most important organization involved in the success of EE projects is the equipment provider; 43.5 percent claimed it was a government agency while 22.6 percent claimed it was a consultancy (Figure 7.4).
Among the cassava processing firms interviewed, an average of 28.93 percent energy savings were attained through EE projects, with diesel and petrol being the most frequently mentioned sources of energy savings.
Maize processors were very much like cassava processors when it came to conducting internal audits. 27.5 percent of firms reported that they carried out energy audits internally, a proportion that is comparable to that of cassava processors. However, it became clear during the course of data collection that the majority of firms understood energy audits as a process for monitoring energy consumption at the meter as an input. Very few understood it in the holistic sense that incorporates processes, technologies, materials and practices in a manner geared towards the reduction of wastage of both energy and raw materials.
0
10
20
30
40
50
60Nigeria Kenya
perc
enta
ge
58,1
47,5
22,6
40
3,2 5
43,5
2,59,7 10
4,8000
Organisations
equi
pmen
tpr
ovid
er
Cons
ulta
ncy
ener
gyre
sear
chce
ntre a
gove
rnm
ent
agen
cy
univ
ersi
ty/
publ
ic re
sear
ch
Oth
ers
No re
spon
se
Figure 7.4: Organizations involved in successful EE projects
Source: Analysis of field data, 2013
127
Although the Centre for Energy Efficiency and Conservation (CEEC) has been established and mandated to support industry in energy efficiency matters such as energy audits and recommendations, most maize millers were not aware of its existence. Though the Energy Management Regulation has been in place since 2012, it was not well known in the industry as the findings above illustrate. There was also little awareness of ongoing initiatives by the Energy Regulatory Commission (ERC) to train and certify energy auditors.
In terms of interaction with other firms and agencies involved in energy efficiency and audits, both cassava processors (58.1 percent) and maize millers (47.5 percent) reported having engaged with equipment providers during the implementation of the EE measure more than they did with any other type of firm. However, more cassava processors appeared to engage with government (43.5 percent) and research institutions (9.7 percent) compared to maize millers, where 2.5 percent of firms reported having interacted with government and none with a research institution. Interactions with consultants were reported in both countries, with Kenya engaging them more (40 percent of firms compared to Nigeria’s 22.6 percent). Maize processors reported receiving a variety of services from consultants. Out of the 47.5 percent firms that engaged with equipment providers, about half reported having received consultancy services from equipment providers. A quarter of all firms contacted reported using consultants to install new equipment while other services included energy audits, diagnostics, repairs and maintenance and advice on appropriate technologies.
Source and composition of EE projects
Table 7.7 presents the sources of EE technology and the composition of EE projects implemented by the cassava and maize processing firms interviewed. It is noteworthy that two-thirds of the cassava processing firms in the research sample were offered an entire package consisting of training, equipment, financing, maintenance and repair. Training is the most accessible component of the EE measures used by the firms (66.1 percent of respondents); 35.5 percent claimed that maintenance was the most accessible component while 27.4 percent stated that repair and 24.2 percent that financing was the most accessible component of the EE measures they used. Maize processors’ responses on the components of EE projects differed. Offers of an entire EE project comprising technology, training, repair and maintenance and finance were only reported by 35 percent of maize processors compared to 66.1 percent cassava processors. A further analysis of EE offers reveals that training (37.5 percent) and maintenance (27.5 percent) were the main services received during
7. ADOPTION OF ENERGY EFFICIENCY MEASURES IN THE NIGERIAN AND KENYAN AGRO-INDUSTRY

DIFFUSION STRATEGY OF GREEN TECHNOLOGY AND GREEN INDUSTRY IN AFRICA
128
project implementation. Repairs were offered to 20 percent of maize processing firms that implemented EE projects. The notable difference in the share of EE project components offered between the two countries can be attributed to the degree of availability of locally developed technologies in Nigeria, making it easier to bundle services with equipment.
A larger percentage (74.2 percent) of cassava processing firms has their employees trained by someone else on the EE measure project. According to the interviews, these trainers include the EE equipment providers, Fadama programme staff, RTEP/IFAD staff and friends in the same business. For 74.2 percent of respondents, the main source of EE technology used is entirely domestic (designed and produced in Nigeria). However, 54.1 percent of the firms claimed that they had not received any support from donors and government agencies for EE projects.
45 percent of maize processing firms reported having received training as part of the EE project. 27.5 of the entire sample had received training from equipment
Table 7.7: Sources and components of EE projects
Offered an entire EE project package consisting of training, equipment, financing, maintenance and repair
Nigeria Kenya
Frequency Percentage Frequency Percentage
yes 42 67.7 14 35No 20 32.3 26 65Total 62 100 40 100Components of EE project* Frequency Percentage Frequency PercentageTraining 41 66.1 14 35Financing 15 24.2 2 5Maintenance 22 35.5 11 27.5Repair 17 27.4 8 20Employee trained by someone else on EE project Frequency Percentage Frequency Percentage
yes 46 74.2 18 45No 14 22.6 24 60Total 62 100 40 100Support from donors and government agencies for EE project Frequency Percentage Frequency Percentage
yes 28 45.9 0 0No 34 54.1 32 80Total 61 100 40 100
Source: Analysis of field data, 2013

129
distributors. A few firms reported having received training from other consulting firms. The case study on maize processing firms reveals that some of the world’s leading distributors of maize milling machinery and electrical engineering technologies have localized representation in Kenya and are therefore able to offer technical support to firms with resources.
These findings are in line with the reality that Nigeria’s agricultural sector has engaged in local equipment manufacture for many decades with the government taking the lead and involving institutions of learning. The component of entirely domestic technologies applied to EE projects in Nigeria was 74.2 percent while it was 17.5 percent in Kenya (Figure 7.5). 45 percent of Kenya’s technology sourcing was fully foreign and 12.5 percent was partially domestic. Maize millers considerable reliance on consultants for technical expertise, who are largely licensed distributors from developed countries, demonstrates the importance of trade as a vehicle for technology adoption.
Figure 7.5: Sources of EE technology used
Source: Analysis of field data, 2013
Energy efficiency advice
As shown in Table 7.8, 51.6 percent of the cassava processing firms interviewed had visited a company that had adopted the EE innovation prior to the decision to adopt the EE measure. Most of these cassava processing firms have also been visited by other firms on an average of approximately four times to learn
7. ADOPTION OF ENERGY EFFICIENCY MEASURES IN THE NIGERIAN AND KENYAN AGRO-INDUSTRY
0
10
20
30
40
50
60
70
80 Nigeria Kenya
perc
enta
ge
9,7
45
12,9 12,5
74,2
17,5
3,1
25
foreign partly domestic(Nigerian)
wholly domestic(designed and
produced in Nigeria)
Source of EE technology used
no response

DIFFUSION STRATEGY OF GREEN TECHNOLOGY AND GREEN INDUSTRY IN AFRICA
130
about their experiences with the EE measure. From the interviews conducted, the main focus of discussion during such visits is largely the benefit of using EE technology to minimize the cost of energy and for effective processing. The maize industry in Kenya is much more closed with less interaction between firms. Only 22.5 percent of firms reported having visited another firm prior to adopting EE measures. Stiff competition and suspicion among firms within the industry may explain the reliance on advice from firms outside the maize business (consultants and equipment suppliers). Table 7.8: Visit for EE advice
Visit a company that adopted the innovation prior to making the decision to adopt it
Nigeria Kenya
Frequency Percentage Frequency Percentage
yes 32 51.6 9 22.5No 30 48.4 31 77.5Total 62 100 40 100.0Other company visiting the respondent to learn about its experience with a specific EE project
Frequency Percentage Frequency Percentage
yes 34 54.8 9 22.5No 28 45.2 31 77.5Total 62 100 40 100.0Number of company that visited respondent in 2012 Frequency Percentage Frequency Percentage
1-3 15 8.1 6 15.04-6 9 14.5 2 5.07-9 1 1.6 1 2.510-12 3 4.8 0 0.0> 13 0 0 0 0.0No response (30) 30 48.4 31 77.5Total 62 100 40 100.0Mean 3.66 3.22
Source: Analysis of field data, 2013

131
7.5. Factors facilitating or restraining the adoption of EE measuresDrivers of EE adoptionThe most influential drivers of EE technology adoption were similar in both countries as Table 7.9 below illustrates. The key drivers of the adoption of EE measures by cassava and maize processors were in-house knowledge about energy management, availability of technical expertise and the need to save costs. The only difference was that the influence of these three drivers differed in the two countries. In Nigeria, in-house knowledge was the most influential factor among 88.7 percent of firms. The availability of local technical expertise was an important factor for 87.1 percent and the need for cost savings was mentioned by 82.3 percent of the respondents. The need for energy savings was the most powerful driver for the maize processors interviewed (80 percent). The other two drivers played less of an influential role in Kenya compared to
7. ADOPTION OF ENERGY EFFICIENCY MEASURES IN THE NIGERIAN AND KENYAN AGRO-INDUSTRY
Table 7.9: Factors affecting the adoption of EE measures
Facilitating factors* for the adoption of EE measures
Nigeria KenyaFrequency Percentage Frequency Percentage
In-house knowledge about energy management 55 88.7 26 65.0
Technical expertise locally available 54 87.1 12 30.0Need for cost savings 51 82.3 32 80.0Requirement by parent company 3 4.8 1 2.5Energy regulatory requirement 2 3.2 3 7.5Environmental regulation 14 22.6 1 2.5Government incentives for EE measures 9 14.5 1 2.5EE measure adoption by other firms 16 25.8 2 5.0Advocacy or campaign by environmental NGOs 2 2.2 1 2.5
Support from development partners 21 33.9 2 5.0Restraining factors to the adoption of EE measures* Frequency Percentage Frequency Percentage
High cost of financing 50 80.6 20 50.0Uncertainty about EE project 19 30.6 4 10.0Lack of technical capability 13 21.0 5 12.5Lack of information on appropriate EE measure 35 56.5 8 20.0
Available EE measures are too complex for our company 8 12.9 0 0.0
Lack of support or government incentive 38 61.3 4 10.0Note* multiple responses Source: Analysis of field data, 2013

DIFFUSION STRATEGY OF GREEN TECHNOLOGY AND GREEN INDUSTRY IN AFRICA
132
Nigeria, with in-house knowledge for energy management being cited by 65 percent and the availability of local technical expertise by 30 percent of the firms. The weak influence of energy regulatory requirements and support from development partners is notable, despite these two instruments being in place. Government incentives were a facilitating factor for 2.5 percent of the firms interviewed. The most important facilitating factor for maize millers in Kenya was energy regulatory requirements. For Nigerian firms, government policies were more important, with 22.6 percent of the firms mentioning environmental regulation as a facilitating factor. In Nigeria, government incentives were a facilitating factor for 14.5 percent of the cassava processing firms compared to 2.5 percent in Kenya, reflecting the fact that the cassava processing firms in Nigeria received more support than the maize millers in Kenya. When asked if all support measures were helpful, 53.2 percent of the respondents in Nigeria stated they were not.
Barriers to the adoption of EE measures
As shown in Table 7.9, about 81 percent of respondents claimed that the initial setup costs are the main barrier to the adoption of EE measures; about 61 percent claimed that the lack of support or government incentives were a restraining factor, while lack of information on appropriate EE measures was mentioned by 56.5 percent of respondents as an obstacle to EE adoption. Like in Nigeria, the high cost of finance was the main deterrent factor in Kenya, cited by 60 percent of the firms interviewed. Although Kenyan firms rarely borrow from banks, as observed earlier, high costs imply that the firms have to accumulate savings in order to implement EE projects. Lack of information on what the appropriate technologies or measures would be was another deterrent mentioned by 20 percent of firms. Other factors preventing the adoption of EE measures, albeit to a lesser extent, include uncertainty of EE projects, lack of government incentives and poor technical capabilities.
Influence of visits to other EE adopters on EE adoption
The results in Table 7.10 reveal that in both Nigeria (50 percent) and Kenya (68 percent) visits by other firms to firms that have already adopted EE technologies did not really result in the adoption of EE technologies, but to some extent (50 percent in Nigeria and 32.5 percent in Kenya) such visits contributed to the later adoption of EE projects.

133
Table 7.10: Visits to firm by others encourage adoption
Observations Nigeria Kenya
Frequency Percentage Frequency PercentageNot really 31 50.1 27 67.5Some companies adopted the technologies discussed with them 18 29.0 4 10
Many companies took similar measures after talking to us 13 20.9 9 22.5
Total 62 100 40 100Source: Analysis of field data, 2013
EE support and knowledge spillovers
Table 7.11 shows that all forms of support for EE measures were not viewed as being helpful by the majority (53.2 percent) of cassava processing firms in Nigeria, probably as a result of the non-conformity of some of the assistance in the form of supply of foreign equipment for processing operations or fake supply of equipment by the intermediary. A typical case in Nigeria was a cassava-based Fadama group in Iwo, a town in Osun State, visited during the survey, which had received biogas equipment from the World Bank three years earlier, but the equipment had not worked for a single day because the supplier never replaced a part he promised he would. The second case involves a UNIDO/IITA assisted project which supplies flash dryers to improve the quality of cassava products. The firm, located in Oyo State, disclosed that it was still waiting for the machine to arrive two years later. Some of the trainings on EE technology received from institutions such as the International Institute of Tropical Agriculture (IITA) in Nigeria was said to be inadequate, thus preventing firms from applying
7. ADOPTION OF ENERGY EFFICIENCY MEASURES IN THE NIGERIAN AND KENYAN AGRO-INDUSTRY
Table 7.11: Usefulness of support for EE measures and knowledge spillovers
Usefulness of all forms of support for EE Nigeria Kenya
Frequency Percentage Frequency PercentageAll helpful 29 46.2 - -All not helpful 33 53.2 - -Total 62 100Knowledge spillovers from EE to resource efficiency Frequency Percentage Frequency Percentage
There is knowledge spillover 52 83.9 12 30There is no knowledge spillover 10 16.1 28 70Total 62 100 40 100
Source: Analysis of field data, 2013

DIFFUSION STRATEGY OF GREEN TECHNOLOGY AND GREEN INDUSTRY IN AFRICA
134
knowledge in practice, even though about 84 percent of firms in Nigeria and 30 percent in Kenya asserted that there were knowledge spillovers from EE to resource efficiency. The majority of firms (70 percent) in Kenya stated that there were no knowledge spillovers.
The results presented in Table 7.12 show that the use of consultancy /external advisors for EE in Nigeria (64 percent) and Kenya (70 percent) is crucial for the success of EE projects. The majority (77.5 percent in Nigeria and 57 percent in Kenya) consider consultancy services to be important in terms of introduction of modern technology and the provision of advisory /capacity building for the staff of the processing firms. One striking difference between Nigeria and Kenya is the provision of energy audit (14 percent) and the modification of equipment (18 percent) by consultants in Kenya, which was absent in Nigeria.
Table 7.12: Importance of consultancy /external advisors for success of EE projects
Role of consultancy /external advisors for success of EE projects
Nigeria KenyaFrequency Percentage Frequency Percentage
Not necessary 13 21 4 10Highly necessary 20 32 16 40Necessary 20 32 12 30Undecided 09 15 8 20Total 62 100 40 100Services provided Frequency Percentage Frequency PercentageAssist in equipment acquisition only 3 7.5 0 0Supply and installation of equipment 6 15 7 25Introduction of modern technology; advisory services/ capacity building 17 42.5 9 32.1
Equipment acquisition and training 14 35 3 10.7Energy audit 0 0 4 14.3Equipment modifications 0 0 5 17.9Total 40 100 28 100
Source: Analysis of field data, 2013
Relationships among some important variables affecting EE adoption
The PPMC results in Table 7.13 show that there is a statistically significant negative correlation between foreign EE measures adopted by cassava processors and the main production equipment being foreign, though the correlation was not strong (r = -0.484, p < 0.01). For maize milling in Kenya, the correlation of these
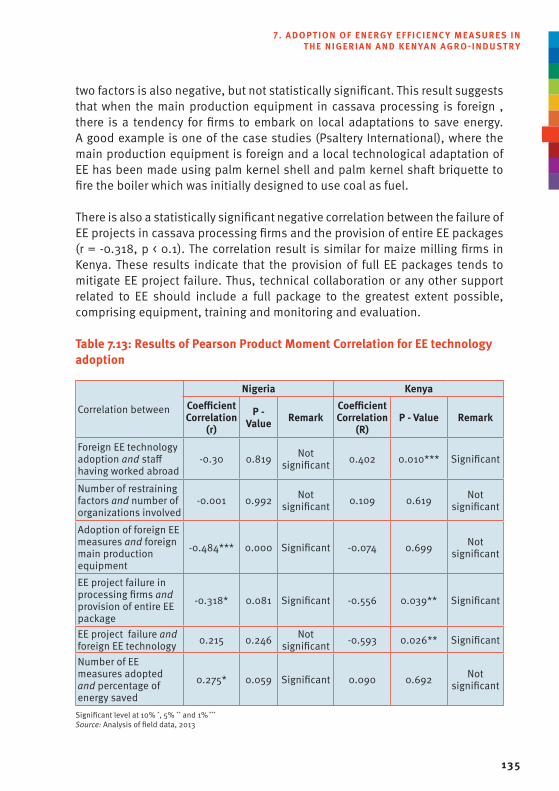
135
two factors is also negative, but not statistically significant. This result suggests that when the main production equipment in cassava processing is foreign , there is a tendency for firms to embark on local adaptations to save energy. A good example is one of the case studies (Psaltery International), where the main production equipment is foreign and a local technological adaptation of EE has been made using palm kernel shell and palm kernel shaft briquette to fire the boiler which was initially designed to use coal as fuel.
There is also a statistically significant negative correlation between the failure of EE projects in cassava processing firms and the provision of entire EE packages (r = -0.318, p < 0.1). The correlation result is similar for maize milling firms in Kenya. These results indicate that the provision of full EE packages tends to mitigate EE project failure. Thus, technical collaboration or any other support related to EE should include a full package to the greatest extent possible, comprising equipment, training and monitoring and evaluation.
7. ADOPTION OF ENERGY EFFICIENCY MEASURES IN THE NIGERIAN AND KENYAN AGRO-INDUSTRY
Table 7.13: Results of Pearson Product Moment Correlation for EE technology adoption
Correlation between
Nigeria KenyaCoefficient Correlation
(r)
P - Value Remark
Coefficient Correlation
(R)P - Value Remark
Foreign EE technology adoption and staff having worked abroad
-0.30 0.819 Not significant 0.402 0.010*** Significant
Number of restraining factors and number of organizations involved
-0.001 0.992 Not significant 0.109 0.619 Not
significant
Adoption of foreign EE measures and foreign main production equipment
-0.484*** 0.000 Significant -0.074 0.699 Not significant
EE project failure in processing firms and provision of entire EE package
-0.318* 0.081 Significant -0.556 0.039** Significant
EE project failure and foreign EE technology 0.215 0.246 Not
significant -0.593 0.026** Significant
Number of EE measures adopted and percentage of energy saved
0.275* 0.059 Significant 0.090 0.692 Not significant
Significant level at 10% *, 5% ** and 1% ***
Source: Analysis of field data, 2013

DIFFUSION STRATEGY OF GREEN TECHNOLOGY AND GREEN INDUSTRY IN AFRICA
136
However, there is a positive and statistically significant correlation between EE measures adopted and the percentage of energy saved (r = 0.275, p < 0.1) for cassava processors, but a positive and statistically insignificant correlation for maize millers. This may be a reflection of the relatively high energy intensive nature of cassava processing compared to maize milling.
Other factors with a statistically significant correlation for the maize milling sample are a positive correlation between foreign EE technology adoption and staff having worked abroad and a negative correlation between EE project failure and foreign EE technology. Thus, for maize milling in Kenya, staff that has worked abroad may be helpful for the adoption of EE with substantial foreign components, while the adoption of foreign EE technology may help reduce the odds of EE project failure.

137
8. CASE StudiES oF rEt And EE AdoPtion By FirmS 8.1. Nigerian cases
Case 1: Deban Faith Agro-Allied Ventures
Deban Faith Agro-Allied Ventures is an adopter of EE in Nigeria located in Km 1, Ijeun-Lukosi, Lagos - Abeokuta Expressway of Ogun State Nigeria. The firm was established in 2007 and had 10 employees in 2012. The firm processes about 32 tonnes of cassava per day and the firm’s major products are cassava flour, starch, fufu flour and gari which are sold to retailers and consumers. The firm has adopted some energy efficiency measures in the past five years but has yet to use any renewable energy technology. Some of the EE measures include:
• Replacing the use of kerosene with blackoil to power the heat exchanger which supplies the heat used in the drying process;
• Switching from sun drying to the use of flash dryers;• Switching from old heat exchanger to modern heat exchanger;• Avoiding heat loss by ensuring that no part of the equipment, from the
fire-exchanger to the flash dryer, is leaking.
The firm is also aware that charcoal can be used in place of black oil. Although the use of charcoal has yet to be adopted by the firm, it is believed that this could further reduce the cost of energy usage, as charcoal use is even cheaper than blackoil. The benefits derived from the EE measures adopted by the firm include:
• Increase in output: The rate of heat generation of the new heat exchanger installed has resulted in an increase in output since more cassava flour can now be dried within a very short period.
• Reduction in cost of production: The firm switched from using kerosene to blackoil. The cost of energy has reduced as a result. The firm uses about 220 litres of kerosene (at N 110 per litre) to produce 1 tonne of cassava while it uses 200 litres (N 70 per litre) of black oil to produce the same 1 tonne.

DIFFUSION STRATEGY OF GREEN TECHNOLOGY AND GREEN INDUSTRY IN AFRICA
138
• Increase in quality of output: Initially, when the firm was sun drying its fufu and cassava flour (it now uses a flash dryer), it produced discoloured products (brownish). This invariably reduced the price of the fufu flour in the market. This is also a form of knowledge spillover from energy efficiency to resource-use efficiency in the firm.
An external auditor from the government visited the company to audit its energy consumption. However, there has been no feedback from the auditor since then and the firm therefore does not know what the results of the audit are.
Case 2: Irewolede FCA Cassava Processing Firm
As part of the World Bank supported Fadama project, the Irewolede Fadama Community Association (FCA) has 10 Fadama users’ groups which established the Irewolede FCA Cassava Processing Firm in 2007. The firm was registered for operation under the Ogun State Agro-input Co-operative Limited. The firm has adopted EE and RETs in the form of biomass. The firm’s main commercial activity is the processing of cassava from tuber to finished products like gari, fufu and starch, which are sold to retailers and consumers. The firm employed 10 workers in 2012 and processed about 7 tonnes of cassava per day. The firm is currently not connected to the national grid and the RETs adopted by the firm are charcoal and firewood for firing the cassava fryers. The firewood is sourced from the surrounding forest and the charcoal is purchased from producers of charcoal in Ogun and Oyo States.
The firm employs locally manufactured equipment with some foreign components such as electric motors. The driver of the adoption of EE measures by the firm is the need to improve production. The EE measures adopted include both process adaptation and the acquisition of new equipment. The highlights of the EE measures as reported by the firm manager are:
• Switch from manual graters to electricity powered graters: With the support of the World Bank assisted Fadama project, the firm was able to exchange its manually operated cassava graters for electricity powered graters. This necessitated the purchase of a larger capacity electricity generator through the Fadama project. An added advantage of the larger capacity electricity generator is that work can now be performed more efficiently and effectively. Previously, each of the graters had to be operated individually, with each consuming its own fuel. The switch to larger capacity electricity generator makes it possible to operate the graters and other machines simultaneously when the power source

139
from the generator is switched on. This has brought about a substantial reduction in the total amount of fuel consumed.
• Switch from petrol engine to diesel engine: The firm also exchanged its petrol engine motors for diesel engine motors. Although the price of diesel per litre is higher than that of petrol, the overall consumption makes the use of diesel more cost effective. For a given amount of output, the cost of petrol required is thrice that of diesel.
• Construction of the hearth: The hearth is constructed in a way to minimize heat loss and to prevent the heat from reaching the person frying gari or preparing fufu.
• Reduction in material losses: Efforts made by the firm to reduce material resource losses include reduction in leakages, recycling of residues obtained from sifting into feedstock feed and reduction in waste arising from peeling of cassava.
Case 3: Ifelodun Cassava Processing Company
The Ifelodun Cassava Processing Company can be described as a potential adopter of EE, located in floor 22, phase 1, Agodongbo, Sawmill, Oyo State. This firm is involved in the processing of cassava into gari, fufu flour, cassava flour, starch, cassava strips and tapioca. It sources its raw cassava from members’ farms and buys from other farmers as well. The firm, which was founded in 2004 with the capacity to process 50 tonnes of cassava per day, presently processes two tonnes of cassava per day and employs six factory workers. The company, owned by a cooperative group, was established with the support of the International Institute of Tropical Agriculture (IITA) and UNIDO. In 2010, an agreement was signed between Japan and Nigeria to improve cassava processing in Nigeria, which led to the firm being connected to UNIDO by IITA. With the support of UNIDO, an agreement was signed between the Japanese government and Ifelodun Cassava Processing Company. UNIDO’s role was to provide technical support to smallholder processors that would enhance output and quality to help meet international standards. The components to be provided under the funding include cassava processing equipment such as graters, flash dryers, hammer mills and a borehole.
The firm acknowledges the energy efficiency of flash dryers, which is completely independent of weather conditions and can process larger quantities of cassava in a day, thus saving time and energy. The firm uses a locally manufactured rotary dryer that uses charcoal as its source of heat to dry cassava flour and fufu flour. This makes the processing less dependent upon weather conditions such as when using the heat of the sun to dry the products. Factors limiting the use
8. CASE STUDIES OF RET AND EE ADOPTION BY F IRMS

DIFFUSION STRATEGY OF GREEN TECHNOLOGY AND GREEN INDUSTRY IN AFRICA
140
of other forms of RETs are lack of information, high costs and lack of technical skills in RETs.
Case 4: Psaltery International Farm Limited
Psaltery International Farm Limited is a cassava processing firm located in Alayide, Wasimi village, Iseyin, Oyo State, and is a potential adopter of EE and of RETs. The firm was initially established as a cassava growing farm in 2005, and later engaged in value addition (forward linkage) in 2012 by processing cassava into starch and cassava flour. Although the firm has the capacity to process 70 tonnes of cassava per day, it presently processes 50 tonnes of cassava per day.
Oluyemisi Iranloye, the managing director/CEO of Psaltery International Limited, stated that before the establishment of the firm in the area, the total income of about 500 cassava farmers in Alayide village78 was said to be just about N 2 million annually. After the establishment of the firm which started buying cassava from the farmers, the farmers have been able to expand their production and the total annual income is about N 50 million. Due to the fact that farmers in the immediate community are only able to supply 20 percent of total cassava needed for production, the firm also buys cassava from other villages within a 50 kilometre radius to the north, south, east and west of the factory. The firm has a well-established outgrowers scheme, which is highly successful and also provides support for farmers through its agricultural extension staff which regularly visit the farmers. The firm has a total of 140 staff members (including engineers, biochemists, agricultural extension officers, managers, scientists). The skilled staff is predominantly from Lagos while some of the unskilled members are from the local community. The firm has also brought infrastructural development to the village it is located in by providing borehole water as part of its corporate social responsibility. The firm also plans to build a school in the community for easy access to farmers’ out-of-school children who have to travel long distances to get to the nearest school.
The firm uses imported equipment but sources raw cassava from the rural area. Although the production site is in the rural area, its products are for industries, most of which are located in cities. There is a domestic and international market for these products. For instance, flour mills buy the high quality cassava flour and mix it with wheat flour. The respective firm invested in the procurement of equipment to help achieve its production targets. It is not connected to the national grid and relies on two diesel generators for electricity provision. Some
78 The village consists of 50 hamlets with about 5,000 hectares of under-utilized farmland.

141
of the energy efficiency measures undertaken by the firm include:
• Use of imported flash dryer with a capacity of drying 100 tonnes of cassava flour per day.
• Use of palm kernel shell and palm kernel shaft briquette to fire the boiler, generate steam, alternative energy supply.
The coal boiler process involves the combustion of biomass (palm kernel shell and shaft + wood + charcoal) in a coal boiler which produces steam that drives machines within the firm. The company started by using coal and some wood (called co-firing), which when combusted in the coal boiler produced the needed steam. As coal is expensive (N30,000 per tonne), and the process required 2 tonnes of coal per hour, the firm took advantage of knowledge of RET and decided to substitute palm kernel shell and shaft briquette for coal at a certain proportion until it finally shifted fully to using biomass (palm kernel shell and shaft + wood + charcoal). Psaltery buys palm kernel shells, shaft briquette and charcoal, and uses these to generate power in the factory’s boiler. Psaltery International also has a backup farm where they train farmers and grow cassava stems to distribute to other farmers.
It is noteworthy that fuel from biomass is cleaner relative to that from coal because it is renewable More so, biomass is a cheaper source of fuel than coal, which the companies source from Kogi State, about 400 km away from the respondent cassava processing firm. The firm is also aware that it can generate biogas from human and animal waste. In addition, it recognizes the benefit of using a solar borehole that can deliver 20 cubic metres of water per hour, solar lighting for factory and housing units, solar dryers to dry its products from 32 percent to 10 percent moisture content. All these are derived from clean energy sources, but the firm claims that any such progress could only be achieved because of external support from the government or development agencies.
First Bank Nigeria Plc assists the firm in terms of funding the company’s project at an interest rate of 9 percent79, which is considered too expensive by the firm. The bank also provides back-up funding for farmers to expand their production80. The firm continues to support the farmers with extension services. Keeping to the terms of the contract, farmers around the firm are now expanding their production with First Bank support.
79 The interest rate is assumed to be relatively high compared to the rate operators in Thailand and other agro-based countries offer to agro-businesses (3 percent).
80 The firm buys cassava from the farmers and pays them through the First Bank account.
8. CASE STUDIES OF RET AND EE ADOPTION BY F IRMS

DIFFUSION STRATEGY OF GREEN TECHNOLOGY AND GREEN INDUSTRY IN AFRICA
142
One major constraint to the operation of the firm is poor government infrastructural support. The firm runs on generators, has sunken boreholes and constructed the road to the factory81.
Palm kernel and palm fruit
Case 5: Rewaju Foods Limited
Rewaju Foods Limited is a gari processing firm that began its operations in February 2010. It is located in Osun State’s agricultural farm settlement site, Oke Osun, Osogbo, Osun State. The firm had two permanent workers in 2012 and approximately 15 temporary staff. It has a branch factory at Ifon Osun, Osun State, with two permanent staff members and 12 temporary workers. In addition, the firm has an ad hoc certified auditor to assess the firm’s financial position at regular intervals. Although the firm has the facility to process 90 tonnes of cassava per day, it presently only processes 2.6 tonnes per day. Cassava tubers are procured from farmers in the community and from neighbouring villages, while the product is marketed in Osogbo and Lagos.
Some energy efficiency improvement measures adopted by the firm include:
• Biogas:thefacilitywassetupasanalternativesourceofenergy.Itusesanimal dung and other waste materials.
• Battery-operatedkerneltechnologyservingasanalternativepowergeneration.
• Chimneyconstructedinasectionwheregariisfriedtopreventsmokefrying, thus increasing the efficiency, quality and quantity of gari fried in a short period of time.
• Asameansofreducinglossofinput,thefirmhasadoptedcertain81 No bank gives a manufacturer funds to construct roads and other infrastructure projects.

143
measures such as measuring the cassava tuber before and after peeling, grating and frying. Through this method, the firm is able to obtain 1 kg from every 4 kg of cassava processed. The method also helps ascertain the quality of cassava being processed through the determination of water content.
Major product of the firm
The total cost of the installed biogas facility was about N 220,000, and the facility was installed by a researcher from Obafemi Awolowo University, Ile-Ife, Osun State, Nigeria. This technology has helped the firm reduce the cost of production by 60 percent through a reduction in the cost of electricity and firewood in the first year of operation.
Inlet to the biodiesel facility Installed biodiesel facility
8. CASE STUDIES OF RET AND EE ADOPTION BY F IRMS

DIFFUSION STRATEGY OF GREEN TECHNOLOGY AND GREEN INDUSTRY IN AFRICA
144
Biodiesel facility connected to the factory
The firm was motivated to install this equipment due to the following factors:
• Availabilityoffreerawmaterialsintheformofby-products.Theseinclude cassava peels and water obtained during the dewatering of cassava (recycled into the storex). Also poultry manure, cow and pig dung and other domestic waste are easily found around the processing firms at little or no cost.
• Reductionofthecostoffirewoodandconsiderationofworkers’health. Before the installation of the biogas plant, firewood was used as the main source of fire to fry the fermented cassava granules to dry gari. Firewood is expensive at N 5,000 (USD 32) and is insufficient to process a gauge/lorry load of cassava (about 1 tonne) and the situation becomes worse during the rainy season when firewood is scarce and too wet to catch fire. Time is also lost when attempting to regulate the amount of heat when firewood is used to fry gari, since this can only be done manually.
• Concernforenvironmentalpollutioncausedbyimproperdisposalofdomestic waste and those from poultry and piggery houses. In most cases, all these wastes are collected at no cost and recycled to generate power.
• Questforalternativesourcesofpowerthatcanreducetheuseofpowerfrom the national grid and from petrol/diesel as well as job creation for empowerment purposes.

145
If the installed biogas is fully put into operation, the firm intends to increase its current level of employment. The development in the firm will also serve as another income generating avenue for poultry and pig farmers through the collection of waste for a fee.
Some of the barriers to the use of the biodiesel facility are:
• Inadequateconstructionofthefacilitybythemanufacturer(theinletofthe facility is too small for easy flow of animal dung).
• Culturalchallenges:pigdungcontainsahigherpercentageofmethanegas than any other animal dung. It is a religious taboo among Muslims to be in close proximity of pigs or pork products. Some of the workers are Muslim and cannot get involved in pig dung collection.
• Thehighinitialcostofconstructionandtheneedforamoreknowledgeable engineer who can construct an effective industrial biodiesel facility in the country.
Another energy efficiency technology adopted by the firm is kernel technology as a source of heat to replace firewood. To further save energy costs, the firm developed a heat regulatory mechanism using a fan to replace human labour. The percentage of energy saved though this technology varies with the quantity of cassava being processed into gari. On average, the firm saved 25 percent of its total budget in the production of five tonnes of gari. The firm believes that there are further prospects for biogas/renewable energy technology in the cassava processing chain.
Case 6: BISMONCO Nigeria Limited
BISMONCO Nigeria Limited is a private firm established in 2009 and had 15 employees in 2012. The firm is located in Odo-Ori, Iwo town along the Iwo-Ibadan express way, Osun State. The main products are cassava flour, lafun, gari and maize powder or pap. The firm has a capacity to process 60 tonnes of cassava per day but currently processes an average of 2.2 metric tonnes of cassava per day at an average of six hours for production per day.
The firm is the only surviving cassava processing firm in Iwo town and the energy efficiency improvement measures adopted over the past five years include:
• Acquisitionofadieselenginethatpowersallequipmentusedwithinthe firm;
8. CASE STUDIES OF RET AND EE ADOPTION BY F IRMS

DIFFUSION STRATEGY OF GREEN TECHNOLOGY AND GREEN INDUSTRY IN AFRICA
146
• Useofdryingtechnology–twoflashdryerswithaheatexchangerand dual purpose burner manufactured locally (capable of drying 2.5 tonnes/day of finished products like gari and fufu);
• Aburnerthatproducesheatusedfortheflashdryerandwhichabsorbsthe heat generated to the surroundings;
• Regularservicingoftheengineplant.
Sign post of BISMONCO Nig. Ltd production manager and the interviewer, Dr Elijah Obayelu
Melting of the black oil Feeding point of already dewatered cassava into dryer

147
The firm’s major challenges were the high cost of black oil which is the main input used by the firm to generate heat in the flash dryer. The product comes from the Kaduna refinery located in the northern part of Nigeria. At the time of the interview, one drum (about 220 litres) of black oil cost as much as N 25,000 (USD160). Another major challenge the firm faces is the lack of a market for their cassava products, with some of their flour locked up in storage. However, the firm is optimistic that a market for its cassava products will develop if the Federal Government of Nigeria passes the proposed policy of a 20 percent inclusion of cassava flour in bread, which would positively impact cassava producers’ revenue.
The firm is seen as a potential adopter of RETs. At the time of the interview, it had only adopted the use of biomass (firewood) for heating. Due to its desire to become energy efficient, the firm collaborated with researchers inform the University of Ife, Osun State, and IITA, located in Ibadan, Oyo State. It was a joint effort to understand how waste products from cassava as well as other materials available in their environment can be utilized for heat generation.
Case 7: Biofuel Stove in Nigeria: Smeefund Enterprises Ltd
Our project team first discovered the existence of a biofuel stove and biogel in Kenya in June 2013. During an extension of the fieldwork activities in August 2013, we discovered banners advertising a similar cooking stove and biogel in Nigeria. The biofuel cooking stove and biogel are solely marketed by Smeefund Enterprises Ltd in Nigeria. The Chief Executive Officer of Smeefund is Engr Femi Oye. We interviewed one of his managers in Ibadan in September 2013. According to the findings from the key respondent, Oye had the idea of developing a biofuel stove and biogel. He was serving the country as a youth Corper at the time and discovered that a lot of gas was being flared in the
8. CASE STUDIES OF RET AND EE ADOPTION BY F IRMS
Dryer with timers and the production managerDryer

DIFFUSION STRATEGY OF GREEN TECHNOLOGY AND GREEN INDUSTRY IN AFRICA
148
country and sought to reduce that amount. He also sought to find alternatives to burning fossil fuels.
These aims led him to make enquiries about how to address this challenge. This led to the design of the gel stove, which Oye then patented and began to manufacture in Nigeria. However, the first stoves produced were substandard. In addition to its lacking aesthetics, the locally manufactured stove was not able to capture the heat directly under the pot. Oye had to halt the local production and sent it to a company overseas which manufactures the stove the company is now marketing. However, the gel to fuel the stove is manufactured in Nigeria by a company owned by Smeefund. The materials used in the manufacturing of the gel include sawdust, water hyacinth and other non-food plant materials. These efforts resolved certain environmental challenges, particularly the disposal of sawdust and clearing of water hyacinth, which represents a tremendous transportation problem for residents in water-side areas of Lagos State, Nigeria. The firm is also involved in the sale of solar lamps (referred to as Solar Fitila).
Samples of the products sold by the firm. The first slide shows the biofuel gel in various quantities, the second is the biogel stove and the third is a Solar Fitila being examined by the interviewer (Prof. J.O. Adeoti)
The target users of this technology are mainly persons who use kerosene stoves and gas cookers. The gel stove is intended to reduce and discourage kerosene and gas usage, hence reducing carbon emissions. The by-product of the gel is water and oxygen, i.e. there is no carbon emission. Currently, gas is cheaper than the gel, and kerosene costs approximately the same. yet there are other advantages of using gel over gas or kerosene stoves apart from costs. The advantages include that the wick does not need to be continuously changed as is the case for kerosene stoves and regular cleaning of the pot as a result of carbon accumulation which causes blackening is also no longer necessary. Added to these benefits are health advantages and the safety aspect of gel stoves, since the odds of it being contaminated with an inflammable substance which can result in an explosion are very rare.

149
Although the bio-gel has been produced in sizable quantities, the firm has been faced with the challenge of administration. Poor administration and other logistics have made it difficult to transport the gel from the factory (located in Lekki, Lagos State) to different parts of the country where they are needed. The idea of setting up similar production outlets in strategic areas across the country has been contemplated but yet to be implemented.
A major reason for the spread of this technology is the fact that people no longer want to use kerosene stoves. The search for kerosene and the smoke they generate have discouraged people from using them. One adopter of the gel stove admitted that she is allergic to kerosene, and gas is not always safe in the presence of children. Users of the stove also perceive it as a reliable alternative and better substitute to kerosene stoves, and this largely accounts for why it has continuously received high patronage.
8.2. Kenyan Cases
Case 1: Moto Poa Stove and Ethanol Gel by Consumers’ Choice Limited
Wood fuel is an important source of energy constituting 68 percent of Kenya’s national energy needs82. National reliability on biomass recorded a very small reduction since 1980, when it constituted 71 percent and 68 percent in 2002. 93 percent of rural households derive their energy from biomass in the form of charcoal and firewood83 and charcoal is an important source of fuel particularly for the growing poor urban population. Wood fuel is also used in rural industries such as tea, tobacco, fish and restaurants. Demand of wood fuel has been on the rise due to urbanization and population growth. Growing demand is being driven by population trends and wood fuel use has huge socio-economic costs that far outweigh its limited gains in the form of labour and cheaper fuel availability. For instance, charcoal is produced using traditional kilns at 10 percent efficiency84; the methods and technology of boilers used remain highly inefficient and impact negatively on both human health and the environment, not to mention the time opportunity cost associated with wood collection.
Studies from the 1980s and 1990s revealed that Kenya was experiencing a deficit in wood fuel, potentially causing an increase in demand for kerosene
82 Githiomi & Oduor, Strategies for Sustainable Wood Fuel Production in Kenya International Journal of Applied Science and Technology Vol. 2 No. 10; December 2012.
83 Practical Action, Biomass Energy Use in Kenya. Prepared for the International Institute for Environment and Development, 2010.
84 Ibid.
8. CASE STUDIES OF RET AND EE ADOPTION BY F IRMS

DIFFUSION STRATEGY OF GREEN TECHNOLOGY AND GREEN INDUSTRY IN AFRICA
150
use, the cheaper alternative. A national survey found that kerosene was the most widely used form of energy for lighting, cooking, heating and boiling85. But like wood fuel, kerosene impacts negatively on human health and has, in addition, been associated with frequent incidents of fire owing to poor safety of the stoves available on the market. Renewable energy technology developed and currently deployed by Consumers’ Choice Limited responds to the socio-economic and negative impacts outlined above while providing an alternative to widely used kerosene.
The ordinary kerosene stove & its parts: a jack that holds the wicks and 2 cylinders that form the burner. All parts must be secured in place over a fuel tank for safe use.
Consumers’ Choice Limited started off as a transport firm based in Nairobi and was one of three firms licensed to transport human grade ethanol in Kenya. The use of human grade ethanol is highly regulated as it can be used as an alternative cheap form of alcohol. It was involved in transporting ethanol when CCL realized there was an opportunity to use technical alcohol to produce gel that can be used in place of kerosene with a specially made stove. The gel is produced from technical alcohol, a waste product that results from the production of various grades of sugar-based alcohol ethanol. Previously, ethanol producers had been disposing technical alcohol into the environment until the national environmental agency required them to dispose of it appropriately. This became a major constraint as firms had no use for it. It was therefore stored in large tanks on firms’ premises which soon became full. When Consumers’ Choice Ltd discovered its use, they arranged to purchase the entire stock at low prices and signed agreements for future purchase. This move turned into an important environmental intervention benefitting the sugar industry as well as the country as a whole.
85 According to a survey conducted by the Kenya National Bureau of Statistics (Kenya Integrated Household Budget Survey -KIHBS 2005/2006), kerosene was the most widely used lighting fuel, being a key source of light for 75 percent and a secondary source for 21 percent of households interviewed. About 20 percent of households used kerosene for cooking, boiling and heating.

151
The idea of bio-ethanol gel production was not new. CCL knew a company in Tanzania that produced it with technical alcohol imported from South Africa. The company also had a stove designed to use the gel, but the stove had faults which hampered its marketing. They saw an opportunity to improve the design and produce it under its given name. CCL identified a potential manufacturer in China and sent a representative there to work in designing and testing the stove. The result was an improved version that proved more user friendly, efficient and safer than the earlier model. Its fuel tank is not pressurized and is extinguished by turning a lever to cover the tank, ridding it of oxygen. This makes it highly superior in terms of safety, given the number of reported incidences of fires, particularly in poor households. Consumers’ Choice Limited invested a considerable amount of resources into product development and technical tests for both the gel and stove as required by several local agencies as well as others abroad (which it has passed). Preparations are also underway to conduct a two-month study to ascertain the efficiency and safety of the stove in accordance with local regulations.
Right: Moto Poa stove in extinguished position Left: Right-open gel tank
Production of the ethanol gel could not be carried out in Kenya because of the high alcohol tax imposed on alcohol-based products in the amount of KES 130 per litre. To evade this tax, CCL set up a gel production plant in Arusha, Tanzania, 232 kilometres from Nairobi. Producing the gel in Tanzania allowed CCL to reduce production costs and thus attain some degree of competitiveness against other cheaper and commonly used biomass fuels such as kerosene and charcoal. At the time of reporting, 1 litre of kerosene cost USD 0.92, while a litre of ethanol gel cost USD 2.09.
8. CASE STUDIES OF RET AND EE ADOPTION BY F IRMS

DIFFUSION STRATEGY OF GREEN TECHNOLOGY AND GREEN INDUSTRY IN AFRICA
152
Moto Poa gel in various quantities
Social impact of MotoPoa stove & gel
✓ Lower disease incidences✓ Employment creation✓ Reduced land degradation & related hazards✓ Forest restoration✓ Higher energy efficiency.
Green aspect of Consumers’ Choice Limited industrial production
✓ Environmental integrity ✓ Material reuse (sustainability)✓ Potential for employment creation (social equity).
The Moto Poa stove burns one litre of ethanol gel 4.5 times longer than an equal amount of kerosene, making it more energy efficient and compensating for its higher price. Furthermore, gel is non-smoke, non-spill, non-explosive and is flavoured with lemon grass which emits a pleasant smell that also acts as a mosquito repellent. Although Consumers’ Choice Limited is able to produce the stove at USD 3.3 in China, shipping costs, import duties and retailing costs drive its price up, costing the consumer KES 2,400. The Moto Poa stove and gel are distributed through leading supermarkets, particularly those that target lower segments of the market, and is now patented in Kenya.
Consumers’ Choice Limited is optimistic about the future. It claims that there is demand for a two burner which has already been designed but has not yet been launched. CCL plans to start distributing it later this year. Feedback from the market also indicates an interest in lighting gel fuelled appliances and collaboration with the local university on product development is thus ongoing.

153
Two major obstacles that stand in the way of a fuel switch within the firm’s targeted socio-economic strata are the low price of fuels and the low income level of households. To address the first challenge, the firm is currently asking the government for a waiver of alcohol excise tax, import duty, VAT applicable to its products and related inputs. Current economic growth in the country offers more market opportunities in the future. To date, CCL is the only firm licensed to handle technical alcohol, meaning competition comes largely from substitute products. Attempting to replicate the diffusion dynamics of the communication industry, where owning a mobile phone guarantees a market for network providers, CCL hopes to lower the cost of the stove to the extent possible and to cash in on ethanol gel sales.
Emerging developments in the energy industry, such as increased uptake of renewable energy technologies notably small solar panels, solar lamps and small biogas in rural areas could alter market behaviour in favour of ethanol gel. Ongoing uptake of these cleaner energy technologies may result in users recognizing the dangers associated with wood fuel and kerosene fuels and make a switch. This is the potential market the firm is targeting once it secures tax and duty exemptions. CCL intends to expand its retailing distribution networks and packaging in small quantities to effectively take on the kerosene market by ensuring that the product is available throughout the country.
To secure supply, Consumers’ Choice Limited has an alternative plan, namely the upscale production of sorghum. The future of sugar production in Kenya is uncertain and a lot depends on the government’s policies, which are currently unknown. In anticipation that the sugar market may be adversely affected by the expiry of COMESA safeguards in March 2014, which Kenya enjoys, the firm is exploring possibilities to recruit farmers to produce sorghum which has a high sugar content and thus benefits ethanol production and can also bridge the food security gap. Sorghum can also be cultivated in marginal farmlands that are currently not being used effectively.
Case 2: Afrisol Energy limited
Afrisol Energy limited is a small, young private company that installs biogas digesters around the country. The owner, a former chemistry teacher, spotted business opportunities because of the energy constraints the communities around him were facing. Population growth and land division in recent decades have meant that wood fuel collected earlier by rural and peri-urban households at no cost is now only available commercially. Around 2008, the fuel prices rose dramatically, again restricting access. Nationwide campaigns for environmental
8. CASE STUDIES OF RET AND EE ADOPTION BY F IRMS

DIFFUSION STRATEGY OF GREEN TECHNOLOGY AND GREEN INDUSTRY IN AFRICA
154
and forest conservation also gave Afrisol Energy limited’s business idea further momentum. The owner observed that small-scale biogas plants had the potential to replace the use of kerosene for lighting as well as wood fuel and charcoal widely used for cooking.
The initial target group were small-scale dairy farmers with a sufficient number of animals for the production of biogas for household use. Over time, the firm chose to target institutions as their key market since these can request larger plants and are therefore more lucrative. This market shift resulted in the firm’s income increasing by more than 300 percent between 2011 and 2012. The installations consist of a combination of both local materials, mainly for dome construction, as well as imported appliances and equipment such as gas cookers, generators, etc. from China.
Following the firm’s inception, the owner adopted an outward-looking approach, networking extensively, both formally and informally, and seizing opportunities to travel and acquire knowledge. In addition to a market scoping trip to China, he has travelled to the Netherlands and Germany where he acquired knowledge about different applications of biogas technologies at various scales. The firm owner has participated in technical training sessions organized locally through development aid agencies. The firm’s informal contact with university staff has also proven useful in terms of dominating this integrated digester system. From these interactions, the firm has been able to expand its knowledge and has recently started installing digesters at institutions that use feed stock with varied breakdown periods. The firm can integrate a pre-decomposition phase in the systems installed. This integrated system enables technology users to feed a variety of waste material to the digester.
The firm’s interactions with other biogas digester businesses is more beneficial than it is competitive, since the operators can lend each other appliances, thus coping with import constraints. Afrisol enjoys a healthy collaborative and complementary relationship with biogas digester installers, especially when it comes to implementing large projects as reported by the two experts interviewed. These types of interaction also help pool expertise which is low in less developed industries such as this one. However, such pooled expertise has only proven useful for medium sized projects, mainly at public institutions of learning.
While import is not its core business, the firm supplements its income and only faces competition from four other firms that import biogas appliances. Although the owner visited China to better understand the market and establish

155
contact with Kenyan businessmen exporting to Kenya, importing materials from China entails several challenges. One is the inability to import in large quantities. This means that the retail price compares unfavourably against that of large importers such as LG. Secondly, there is a limit to the number of type of commodities one can import, which is limited to four categories. The supply of necessary appliances such as stoves, lamps, desulphizers, methane content analysers, water heaters and generators is thus constrained. Third, although the government has zero rated import duty and VAT on all renewable energy related materials, products and has even recently included biogas resources in the feed-in-tariff, its definition of technologies excludes imports. For instance, it is not possible to distinguish ordinary gas cookers from those specific to biogas systems.
Other challenges the firm faces include lack of awareness and information of biogas systems among potential users, although this is reducing. Lack of awareness increases risk perception, especially for commercial users. Resource constraints among potential adopters are also a major obstacle and the fact that most installers are small firms implies there is a lack of resources to launch marketing campaigns. Absence of a regulatory policy is also identified as a key constraint in the industry where there is a need for standardization and quality control. Access to existing subsidies is also considered to have potential to promote growth in the industry, especially when it comes to large-scale adoption.
With regard to implementing larger projects, the industry’s pooled resources and expertise are yet to generate sufficient confidence from potential large biogas system users. The firm owner cited cases where discussions with potential commercial adopters of biogas technologies had stalled due to unwillingness to finance projects. Reluctance on the part of these large clients is attributable to mistrust of small business operator capability and lack of awareness of the full potential of the investment by the potential clients. The prospective adopters who include a foreign fruit producer and processor, a multinational leather shoe manufacturer and a leading coffee miller and their failure to take on projects can be seen as evidence of the biogas industry’s inability to reach maturity stage in the absence of support in both technical capacity and finances.
The large potential in domestic, industrial, institutional and municipal waste for biogas generation serves as the key motivator of firms such as Afrisol and there is anticipation that the market will continue to grow at 25 percent per annum. According to the firm, future growth will be attributable to ongoing efforts by the incubation centre CIC which offers both technical and business advisory
8. CASE STUDIES OF RET AND EE ADOPTION BY F IRMS

DIFFUSION STRATEGY OF GREEN TECHNOLOGY AND GREEN INDUSTRY IN AFRICA
156
services, policy formulation and a platform for access to green funds. Ongoing efforts to enter the agricultural sub-industry such as the milk value chain are likely to generate a sizable sustained market. With growth come other long-term opportunities which Afrisol hopes to exploit. These include the production of organic fertilizer from the slurry and collection of carbon dioxide. These two opportunities are currently not economically viable owing to the small scale of biogas systems, but as these grow in size, Afrisol is preparing to exploit them.
Case 3: Kwale International Sugar Company Ltd
Kwale International Sugar Company Ltd (KISCOL) is a new company which came into existence in 2006 after the Government of Kenya approved a bid by a group of investors from Kenya and Mauritius to revive the defunct Ramisi Sugar Factory which was shut down in 1988. The company has the ambitious plan of setting up a USD 295 million sugar factory with the capacity to crush 3,000 tonnes of sugar cane per day to produce sugar, 30,000 litres of ethanol daily and 18 MW electricity of which 12 MW will be sold to the national grid. Apart from producing sugar, the company will be producing ethanol and green electric power. The government’s contribution to this ambitious undertaking came in the form of a repayment of an outstanding loan amounting to KES 0.8 billion offered once the previous factory operator left the country, thus recovering 45,000 hectares in land that were being held by the private bank as collateral. 17,000 hectares of the recovered land has been released to KISCOL for the production of sugar cane, while part of the remainder has been allocated to surrounding communities. A major outcome expected from KISCOL’s large production scale and co-generation is the production of sugar at globally competitive prices, considering that Kenya’s sugar production costs are three times those of regional competitors.
The company operations are situated in Kwale District which has a poverty rate of 74.9 percent (District Poverty Data, KIHBS 2005-2006) raising expectations of socio-economic growth. Recruitment of out-grower contracts is also underway with more than 1,200 farmers contracted. Sugar cane has already been planted on thousands of hectares of land and construction is underway, with processing being scheduled to commence in 2014. The firm plans to incrementally recruit over 1,500 permanent and 2,500 temporary staff. However, given the high poverty rates, which often reflect absence of skilled labour, one can expect that few, if any, of the better paying jobs will be held by the local population.
The majority shareholder of KISCOL, Pabari Investment Ltd, is a successful conglomerate with diverse interests spread in various countries including

157
Kenya, Egypt, the United Arab Emirates, Australia, India and the UK, ranging from pharmaceutical, agribusiness to IT. The other shareholder, Omnicane from Mauritius, has been operating the world’s largest coal-bagasse power plant in the world since 2007. The international orientation and experience of both partners involved in KISCOL has been the driving factor of its success in contracting consultancy firms to provide a widely varied portfolio of technical expertise and technology in the areas of agricultural biotechnology, water and irrigation, engineering and processing.
The experts employed come from at least eight countries where KISCOL has operations. The list of consulting firms involved are not only drawn from all corners of the globe, they also bring their own experience in setting up agro-industrial operations in places such as India, Ethiopia and Latin American countries, thus further strengthening KISCOL’s ability to harness global technological know-how and expertise. The project has immense potential spillover effects that could arise from technology adoption as well as backward and forward linkages, demonstrating the important role of large renewable energy projects in the adoption and diffusion of green technology. Although the conglomerate’s keen interest in technological advancement and its application within its operations has been an underlying factor of its success, its achievements in Kwale District will depend on how it will tackle other non-technological issues. One challenge is the land regulations that affect the coexistence with the immediate communities and that have contributed to the failure of other foreign investors. Another challenge is the implementation of the PPA contractual with the buyer of energy to be generated.
Sugar production in Kenya has predominantly relied on small-scale production by contracted out-grower farmers. Small-scale agricultural production faces numerous challenges when it comes to technology adoption and economies of scale, and this contributes to the high cost of production in Kenya. KISCOL hopes to avoid this problem by opting for large-scale plantation of 17,000 hectares of land owned by the company to supply 75 percent of sugarcane. This will allow it to circumvent small-scale production that acts as an obstacle to the adoption of agricultural technologies. Thereby, KISCOL will be able to use and benefit from the deployment of cane variety, irrigation and mechanized production technologies, which would be beyond its control if it relied heavily on out-growers.
25 percent of sugar production will, however, be provided by recruited out-grower farmers who are seen as supporting local development. By inheriting land previously leased out from the government by Ramisi Sugar Factory, KISCOL
8. CASE STUDIES OF RET AND EE ADOPTION BY F IRMS

DIFFUSION STRATEGY OF GREEN TECHNOLOGY AND GREEN INDUSTRY IN AFRICA
158
inherited a land problem as manifested in the frequent clashes with the local communities. Reliance on own production to a large extent allows the firm to minimize such incidences resulting from unclear land policies, especially the absence of regulations for contractual farming. KISCOL is currently struggling to recruit enough farmers to meet the 25 percent production target. The main obstacle is unclear national land policies which affect the majority of potential out-growers who either do not own land titles or occupy communal lands.
Another issue that needs to be addressed is selling electricity to the Kenya Power & Lighting Co (KPLC), Kenya’s power distribution company. The firm wants to sell it under different conditions than those that apply to Mumias Sugar which had to build a 40 kilometre power line to bring its energy to the grid at its own cost, and pay KPLC for failing to produce power for the agreed amount. Instead of building a new power line, KISCOL will rely on the power line that has already been built by a mining multinational, Base Titanium, whose operations are 20 km away. The partnership of KISCOL with Base Titanium will also act as a power security in case energy generation by KISCOL is affected by bad harvest. In such an event, the multinational would bridge the gap to meet the power wattage contribution to the grid as agreed with KPLC and thus avoid defaulting the contract.
Case 4: Kenya Tea Development Authority-Power (KTDA-Power)
Kenya is the world’s leading exporter and third largest producer of tea after China and India, with tea contributing significantly to the national GDP. Production is carried out by 565,000 smallholder farmers, while processing is carried out in 65 tea factories spread out in the tea growing zones. Each factory has an average production capacity of 4 million kilogrammes per annum and requires between 0.3-0.7 MW of energy. Energy used in processing is normally a combination of electricity, thermal oil and wood fuel, depending on supply and costs. Worthy of note is that as much as 70 percent of all boilers installed at tea factories are designed to use furnace oil and wood fuel with a high frequency to use wood for cost reasons.
Volatility and the unpredictability of costs for petroleum products used to power boilers and generate grid electricity in the country are presently a key problem in the industry, with high prices eroding profits and hampering farmers’ incomes. The higher prices for petroleum products have resulted in a tremendous rise in production costs over the last decade. Between 2001 and 2010, electricity costs for the production of 1 kilogramme of tea increased from KES 5,63 in 2001 to KES 10,10 in 2010 (increase of 79.4 percent). At the time of the interview in

159
May 2013, energy costs, both thermal and electricity, constituted as much as 30 percent of total production costs. Each of the 65 tea factories spends an average of KES 4 million per month on energy.86
To deal with this growing problem, KTDA set up a subsidiary, KTDA-Power, to focus on the issue of energy efficiency with a particular focus on renewable energy use in the industry. The company commissioned studies and made results available to the industry. The numerous feasibility studies that were conducted by the Ministry of Energy in collaboration with UNEP-GEF were particularly helpful. In 2008, when the government introduced a feed-in tariff, Imenti Tea Factory became the first to sign a PPA to sell electricity to the national grid and commenced generation of 1 MW in 2009. The project cost farmers KES 200 million (USD 2.3 million) with a payback period of 6-7 years. The factory uses 0.4 MW to 0.5 MW for its needs and exports the rest to the grid. The factory has been able to reduce energy costs by 60 percent and serves as a model for 10 other factories that are at various development stages to install their own small hydro power plants.
From its experience with Imenti’s power project, KTDA-Power learned that financing small hydro can prove daunting for small-scale holders. To sell the idea to resource-constrained small-scale tea growers who are the actual owners of the tea factories, KTDA-Power formed nine regional power companies87, each made up of several factories, to pool financial resources. The factories collect contributions from farmers’ incomes over several years to reach a designated contribution. KTDA acts as credit guarantor facilitating lending from financial institutions and assisting in obtaining credit from multilateral organizations. An example is the plant Gura Small Hydro 5 MW plant, funded by four tea factories that pooled their resources together. The plant will cost farmers KES 1.3 billion (USD 15 million) and is due for commissioning in 2014. The four tea factories have a combined energy need of 2.8 MW, meaning that 2.2 MW is available for the grid. Under this power development structure, KTDA-Power expects to realize more than 30 MW.
Wind power has also been identified as a possible source of power for the tea factories. A recently concluded wind study reveals that Michimikuru has the potential of generating 24 MW of wind energy. In good wind locations, wind power will prove even more useful than hydro power, as wind is less capital intensive. A third source of energy identified for use is firewood. Here the goal
86 Per kilogramme of tea, the costs of oil, electricity and wood used to power boilers amount to KES25-30, KES 15 and KES7, respectively.
87 Chemuka 2.5MW; Gura 5MW; Settet 3.9MW; Chania 0.6MW; Aberdare 2.1MW; Metumi 5MW; Kirinyaga 3.8MW; Thuci 1.96MW; Greater Meru 2.93MW; Nyakwana 2.3MW; Imenti 1MW
8. CASE STUDIES OF RET AND EE ADOPTION BY F IRMS

DIFFUSION STRATEGY OF GREEN TECHNOLOGY AND GREEN INDUSTRY IN AFRICA
160
is to make more efficient use of firewood, used in more than 50 factories. It seems that tea factories are interested in increasing the use of firewood, since the majority of factories have recently acquired new land for growing wood. Observing that boilers in most of the factories are inefficient, KTDA is looking into efficient gasification technology. The tea industry is involved in modernizing its technologies and business. Factory reports for the past financial year indicate a trend of technological upgrade consisting of renewal of machinery. In addition, tea factories are securing international certifications such as Fairtrade, Rainforest Alliance, ISO 9001:2008 &ISO 22000 and UTZ.
What makes Kenya’s tea industry special is that it has a stable institutional and governance framework where smallholder farmers jointly own the factories and mandate KTDA to manage all factories in the country. The activities of KTDA are paid out of a 2.5 percent commission from farmers. In addition, KTDA has gone into various divestitures by setting up subsidiary companies in insurance, micro finance and banking, processing and packaging warehousing and tea brokerage. KTDA also has a training centre which is perhaps an indication of the value placed on learning and knowledge acquisition.
Boosted by the confidence it enjoys, KTDA now plans to set up a factory to manufacture tea processing equipment such as driers, fermenters, withering troughs and sorters that are currently imported from India88. The local manufacture of equipment can be expected to be beneficial to other companies and the national economy. With the support of KTDA, technical training courses at Farmers Field Schools are being established, enhancing the industry’s good husbandry. The availability of electrical power enables the industry to diversify product activities, such as selling power to other companies. Over the years, the industry has gained credibility in the eyes of local and multilateral financiers, making it possible to implement capital intensive renewable energy projects.
Case 5: Energy efficiency in the maize milling industry: Unga Limited
Unga Limited is the oldest maize milling enterprise. It was established in 1909 and has expanded both the geographic reach of its operations and has diversified its products over the centuries. It has operations in Uganda, Tanzania, Rwanda, DR Congo and South Sudan. The company’s core business is the milling of maize and wheat, but over the years, it has formed subsidiaries with specialized industrial production. Unga Farm Care East Africa specializes in animal feed production, animal health and crop protection supplies. It is
88 Mugambi Mutegi, KTDA to set up tea equipment factory, 2 Business Daily Africa, 7 December, 2012

161
East Africa’s largest animal feed manufacturer. Bullpak Limited, also based in Nairobi, manufactures packaging products.
Of all the companies interviewed, Unga Limited was one of two firms reporting that it implements energy efficiency measures with the potential for significant impact. Its maize milling plant in Nairobi has a capacity of 4,000 bags per day and its key products are maize flour, bran and germ. Monthly electricity consumption costs in the last six months ranged between USD 58,000-70,000 for Unga Limited’s maize milling plant and USD 17,900-21,000 for the animal products plants. The maize processing plant consists of parts that are different ages, some are over 50 years old and others are as new as two years old, depending on function.
According to Unga Ltd, the nature of the maize milling process in comparison to other manufacturing industries offers fewer opportunities for energy efficiency measures to be effectively implemented with significant technological change. This is because all maize millers in Kenya use the dry milling method which requires very minimal heat energy and therefore fewer opportunities for heat and steam recapture and reuse. Furthermore, the fact that all milling plants are locaed in industrial zones of cities eliminates access to both hydro and wind as sources of energy while the viability of solar is eliminated due to the lack of sufficient surface area on which to mount technology. The viability of biomass is limited by the lack of sustainable supply of feed stock, because agricultural production practices are primarily small scale.
The firm has used services of energy experts in the past to conduct energy audits. In addition to regular system maintenance and housekeeping measures, Unga Ltd had various projects lined up to improve energy use and the plant’s overall efficiency. The first audit was a feasibility study on the removal of conventional light bulbs and replacement with LED technology lamps. The findings revealed that this measure would save the firm USD. 3500 per month and only at the maize milling plant.
Having realized that the majority of mechanical engineers lacked electrical knowledge, the next step was to train five engineers in the use of electrical supervision of motorized systems. Training enables them to operate programmable logic controllers (PLCs) which the firm was in the process of procuring at the time of the survey. PLCs make it possible for processing plants to automatically switch sections on and off based on a sensor recognition mechanism. PLC systems have several advantages resulting in reduced energy use. First, the use of this technology will enable the firm to isolate idle sections
8. CASE STUDIES OF RET AND EE ADOPTION BY F IRMS

DIFFUSION STRATEGY OF GREEN TECHNOLOGY AND GREEN INDUSTRY IN AFRICA
162162
of the processing plants and shut them down, thus saving energy costs. Second, it will offer an integrated automation solution which is to be installed in the three main stages of processing, cleaning and conditioning, milling and storage and lastly, packaging. Third, it will include a monitoring panel which will enable engineers to have oversight and control of the system as well as the possibility to generate a graphical representation of processing. This is important for monitoring production processing and identifying areas of improvement. A similar automated solution was also to be installed at their wheat milling plant in Uganda.
The animal feed manufacturing section of Unga Ltd is more energy intensive than maize milling. Unga Farm Care Ltd, the subsidiary that produces animal feed was found to have achieved more progress in energy efficiency. It conducted an energy audit with assistance from the Kenya Association of Manufacturers and also worked with a private energy consultancy firm. Audits indicated the need to improve the condition of boilers and compressors. The company rehauled all their boilers to avoid boiler steam wastage and all compressor leakages were sealed. Technical staff received training from private energy consultants to ensure continuous effective management. The exercise yielded a boiler performance of 28.8 ltr/hour, which is within the range recommended by the KAM energy audit agency, and a 30 percent reduction of the heavy diesel used to power the boiler.
Prior to collaborating with KAM and the private energy consultancy firm, Unga Ltd had attempted to reduce the energy consumption at its plant, but the lack of technical knowledge of its in-house staff meant that the project could not take off. A visit to another firm in the textile industry, which had successfully managed to curb its energy loss, convinced Unga Ltd that energy efficiency measures would be beneficial.
Training was carried out by a local electrical engineering firm, International Energy Technik (IET), which has representations in Eastern African countries for multinational electrical technology firms such as Siemens and Motorola, and more recently, for Epco Ag, OMICRON and A-Eberle. With more than 5 years of experience in the region, IET offers short training courses for engineers from the region and enables them to use foreign technologies more effectively. Thereby, IET bridges the knowledge transfer gap between technology suppliers and the manufacturing industry in the region.

163
9. tECHniCAL CooPErAtion For GrEEn tECHnoLoGy diFFuSion This chapter examines technical cooperation for the transfer of green technologies with an emphasis on how building technological capability in sub-Saharan Africa can promote the diffusion of RE and EE technologies and the greening of industry. There are several models of technical cooperation, some of which are old and others new. Below we describe and discuss six existing models for green technology diffusion: 1) the development aid model, 2) the development finance institution model, 3) the South-South model, 4), the intra-Africa model, 5) going out models, and 6) the enterprises’ initiative model. Combinations of models (described in sections 9.1-9.6) are also possible.
9.1. Development aid model
Development organizations have been involved in technology transfer projects across sub-Saharan Africa (SSA) for decades with varying degrees of success. The Clean Development Mechanism (CDM) under the UNFCCC framework is one of the models of technical cooperation that is relevant for the transfer of green technologies in SSA. It determines existing avenues for technology transfers between the North and the South through trade and foreign investments. However, it has yet to prove successful particularly in the 33 Least Developed Countries (LDCs) in SSA, given that only eight (DR Congo, Ethiopia, Madagascar, Mali, Senegal, Tanzania, Uganda, and Zambia) have projects under the CDM framework89. Both Kenya and Nigeria have benefited from CDM, although its role in the future is expected to diminish since they no longer are LDCs. In Nigeria, the majority of projects relate to greenhouse gas mitigation in the oil industry, although there are some other projects on waste-to-energy, biomass stoves and rehabilitation of an existing hydro plant. In Kenya, the registered projects are largely energy projects for wind, geothermal, cogeneration, hydro and reforestation. It is noteworthy that where opportunities for developing technical
89 http://www.cdmpipeline.org/cdm-projects-region.htm#6, accessed on October 7, 2013

DIFFUSION STRATEGY OF GREEN TECHNOLOGY AND GREEN INDUSTRY IN AFRICA
164
capabilities exist for RE and EE technology uptake, they are not articulated as part of technology transfer options under the CDM framework90.
NGOs tend to promote the use of small technologies in communities while larger development organizations such as UN bodies have a tendency to focus more on offering technical expertise to government agencies and industry as well as supporting technology projects in various industries. NGOs enjoy close social proximity with local communities through which they gain in-depth knowledge of their cultural values and indigenous knowledge. This knowledge can be crucial for the adaptation and diffusion of foreign technologies, thus making them relevant to local contexts, and can be critical in informing policy content. They often lack technical expertise and the necessary financial resources to ensure that technical aspects of the technology introduced are given due attention for sustained use. Projects usually last a few years with no continuity. Where NGOs distribute foreign technologies through their poverty alleviation programmes, they have no mechanisms for manufacturers to provide feedback on the suitability of the technology. The lack of such feedback is a possible reason for why so many of technologies have failed to meet local needs and have been abandoned by users. The failure of domestic biogas systems that were introduced in Kenya in the 1980s-90s is attributed to factors91 that could have been eliminated by the presence of a local champion, especially after the end of the given project92. The projects often lack committed local champions who can be entrusted with continuous support in the diffusion process, which hampers the technology transfer process. Even UN bodies face the continuity challenge, meaning that they are not involved long enough to understand the necessary adaptations and mechanisms behind successful diffusion. The findings of demonstrative projects fail to secure government commitment that translates into corresponding policy actions to support technology adoption.
yet there have been some successes over time, which have resulted in positive outcomes. Success results from various factors such as coincidence with policy changes, formulation of projects and who is involved as well as overall objective. For instance, a project implemented with funding from AfDB and UNEP covering various countries in Eastern Africa and dubbed “Greening the Tea Industry in East Africa Project (GTIEA)”93 can be considered as the first seed for the adoption and use of renewable energy in Kenya’s tea sector. Numerous feasibility studies 90 Byrne, R., Smith, A., Watson, J. & Ockwell, D. (2011) Energy Pathways in Low-Carbon Development:From Technology
Transfer to Socio-Technical Transformation, STEPS Working Paper 46, Brighton: STEPS Centre91 Darkwah et al (2008) find that the absence of follow-ups on technology use, lack of knowledge for repair and
maintenance among adopters, inappropriate design of digesters and lack of government support were to blame for the abandonment of technologies introduced in the period.
92 Ibid. 93 http://www.unep.org/unite/30ways/story.aspx?storyID=19, accessed on October 7, 2013

165
conducted for small hydro projects provided the technical expertise necessary for energy development and reduced the cost burden that would have otherwise been borne by small farmers. The project’s success can be attributed to the industry (East Africa Tea Trade Association, EATTA) being closely involved and being the actual implementing partner. Likewise, the Climate Innovation Centre (CIC) innovation hub is found to offer useful services to small entrepreneurs. For a discussion of what the CIC does, see Section 5.4 of this report. Other examples of small hydro and biomass projects implemented with support from UNIDO in both Nigeria and Kenya are presented in Appendix 9.4.
9.2. Development finance institutions based models
Development finance institutions (DFIs) play an important role in unlocking financing mechanisms, particularly for large energy projects in SSA. They can be classified into two types: those that offer funding on commercial terms with a preference for large private firms (examples include PROPARCO, FMO, CDC) and those that lend on concessionary terms and are more inclined to lending to states such as the AfDB and the World Bank. Those in the first category have enjoyed proximity to bilateral development agencies in their home countries over the years and have benefitted enormously from the extensive knowledge of SSA countries’ social, economic and political contexts94. This has proven crucial since a major factor for the success of a project is being able to correctly match both technological and country risks to the corresponding premium demanded.
Nearly all DFIs active in SSA participate in two ways, namely by offering finance to firms and state agencies and by taking up equity shares in these firms. Indeed, several Independent Power Producer (IPP) firms that have been active in Africa for two to three decades are associated with DFIs. In addition to their potential to objectively appraise risks, other advantages of DFI funding for projects are: 1) involvement of bilateral and multilateral participants to help with contract implementation and with ensuring that the terms are respected by avoiding potential renegotiations; 2) DFIs are better equipped than private investors when it comes to arbitration of disputes and in pushing projects forward when they are stalled by hurdles that can arise from either political or natural events; 3) DFIs are able to offer finance along with other benefits such as the possibility for second round financing and a range of services such as guarantees, letters of credit and insurance. Enhancements are useful, especially in countries where government does not issue sovereign guarantees (e.g. Kenya).
94 Eberhard & Gratwick, IPPs in Sub Saharan Africa : Determinants of Success, Managment Programme in Insfrastructure Reform & Regulation, 2010
9. TECHNICAL COOPERATION FOR GREEN TECHNOLOGY DIFFUSION
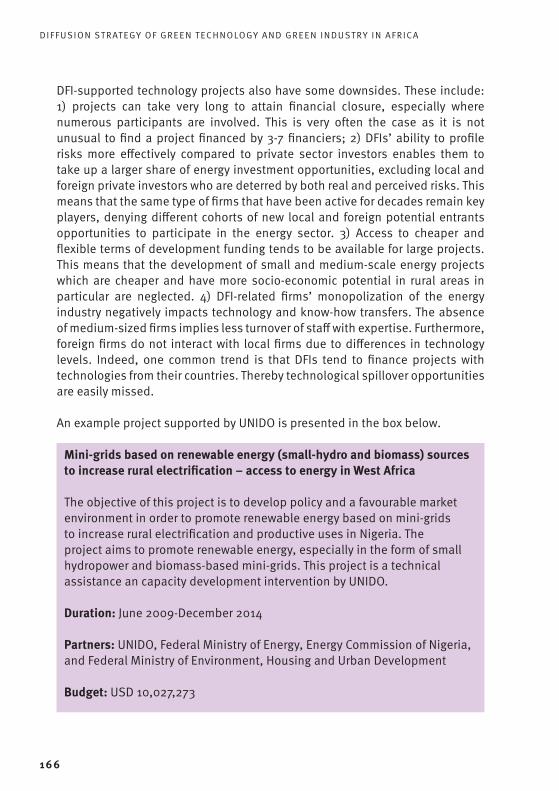
DIFFUSION STRATEGY OF GREEN TECHNOLOGY AND GREEN INDUSTRY IN AFRICA
166
DFI-supported technology projects also have some downsides. These include: 1) projects can take very long to attain financial closure, especially where numerous participants are involved. This is very often the case as it is not unusual to find a project financed by 3-7 financiers; 2) DFIs’ ability to profile risks more effectively compared to private sector investors enables them to take up a larger share of energy investment opportunities, excluding local and foreign private investors who are deterred by both real and perceived risks. This means that the same type of firms that have been active for decades remain key players, denying different cohorts of new local and foreign potential entrants opportunities to participate in the energy sector. 3) Access to cheaper and flexible terms of development funding tends to be available for large projects. This means that the development of small and medium-scale energy projects which are cheaper and have more socio-economic potential in rural areas in particular are neglected. 4) DFI-related firms’ monopolization of the energy industry negatively impacts technology and know-how transfers. The absence of medium-sized firms implies less turnover of staff with expertise. Furthermore, foreign firms do not interact with local firms due to differences in technology levels. Indeed, one common trend is that DFIs tend to finance projects with technologies from their countries. Thereby technological spillover opportunities are easily missed.
An example project supported by UNIDO is presented in the box below.
Mini-grids based on renewable energy (small-hydro and biomass) sources to increase rural electrification – access to energy in West Africa
The objective of this project is to develop policy and a favourable market environment in order to promote renewable energy based on mini-grids to increase rural electrification and productive uses in Nigeria. The project aims to promote renewable energy, especially in the form of small hydropower and biomass-based mini-grids. This project is a technical assistance an capacity development intervention by UNIDO.
Duration: June 2009-December 2014
Partners: UNIDO, Federal Ministry of Energy, Energy Commission of Nigeria, and Federal Ministry of Environment, Housing and Urban Development
Budget: USD 10,027,273

167
9.3 South-South cooperation models
Whereas the former two models often entail North-South cooperation, South-South cooperation is growing. This project has involved Chinese and Indian businesses in the renewable energy sector. The businesses cooperate with importers and marketers in Africa, but the collaboration could be extended to research institutes and governments.
In a report on smart and just grids, one important role is foreseen for companies, researchers and government agencies from the South. The cooperation goes beyond technical learning and comprises a range of issues. In the case of smart
9. TECHNICAL COOPERATION FOR GREEN TECHNOLOGY DIFFUSION
Context: In Nigeria, only 40% of the population has access to electricity; the majority of the population is concentrated in urban areas. In rural areas, less than 20% of households have access to electricity. Though the country has an abundance of energy resources, the supply and demand gap in the electricity industry is considerable – the total installed capacity in Nigeria is below 5,000 MW, but demand is over 15,000 MW. The country has major potential, especially for hydroelectric power and biomass energy. This project is in line with the Federal Government of Nigeria’s policy decisions and national priorities.
Strategy: First, potential biomass and small hydro sites for development will be mapped. Then biomass and and SHP-based mini grids will be established for demonstration. Implementation of pilot projects will be followed by human capacity building, institution building and technology transfers. A rough estimate of the combined potential for SHP and biomass power generation in Nigeria is about 15,734 MW.
Expected Results:•reduceaconsiderableamountofCO2emissionsinNigeriaandimprove
the energy supply in the country, especially in rural areas•povertyreductioninthelong-runthroughsustainableandclean
development.

DIFFUSION STRATEGY OF GREEN TECHNOLOGY AND GREEN INDUSTRY IN AFRICA
168
and just grids95, the following issues are possible areas of cooperation (Welsch et al., 2013, pp. 345-348):
• Analysisofpotentialandroadmapsforsmartandjustgrids.• Countryassessmentsofthepowerindustryandthespecificneedsof
individual customer groups (including households). • Powersystemdesigntoolstailoredtothelocalcontext.Itissaidthatit
is critically important that the system architecture developed enables upgrades of the system without adding significant costs during early implementation stages.
• Pilotprojectstotestthemarket,gainexperiencewithproductofferingsand get to know and work with local actors.
• Fosterenablingenvironments:assistinthecreationofsupportivepolicy, regulatory, institutional, legal and commercial frameworks. Sub-Saharan Africa can profit especially from ongoing efforts in industrialized countries to adjust related network standards
• Capacity-buildinginitiatives:trainkeystakeholdersbasedonskillsassessment. Developing asset management capacities of African utilities and energy entrepreneurs to maintain technical systems and equipment will be crucial to ensure sustainable deployment of smart and just grids.
• Financing:identifyarangeoffinancingsources,fromdonorgrantstoprivate sector loans, and map their potential role in supporting different smart grid options. These funding sources should target interventions covering both power system upgrades and expansions, including mini- and micro-grid solutions. It is said that reliable investment environments will be required that enable a fair way of sharing risks, costs and especially benefits.
It is said that “for a successful transition towards smart and just energy systems, international cooperation will need to be complemented by close engagement with regional and national stakeholders” (Welsch et al., 2013). Such assistance may come from actors from the North and South. Suppliers from the South may be able to provide low-cost solutions which fit with Africa’s need for low-cost and low capital-intensive solutions. The importance of heads of states championing cooperation is key here. Cooperation requires a top-down in addition to a bottom-up element. UNIDO plays a facilitating role in stimulating South-South cooperation. The UNIDO Centre for South-South Industrial Cooperation in India 95 Smart grids are IT-based systems that allow dynamic balancing and optimization of generation, delivery assets and
loads. Benefits include: improved-reliability and resilience, cost-effective integration of variable resources and loads, increased efficiency ofsystem operation, and optimized utilization of generation and grid infrastructure assets (for instance, by shifting loads from peak to off-peak periods) (Welsch et al., 2013, p. 338).

169
(UCSSIC) has been set up to catalyse such cooperation and has been involved in a biomass project in Nigeria as detailed in Appendix 9.4.
9.4 Intra-Africa cooperation
African actors from different countries may also work together on green energy and energy saving projects. An example is the Kenyan energy industry offering expertise in renewable project design and implementation to other countries. Over the years, Kenyan experts in energy agencies have developed capacity in environmental issues and geophysical aspects of geothermal resource exploitation while Ethiopians have strengthened geochemistry aspects. This capacity is being used to support regional geothermal development efforts96. Tanzania, Ethiopia and Eritrea are targeting this expertise in particular and aim to harness it in the future. Kenya’s capacity to manage procurement and financing of large energy projects as well as negotiating power purchase agreements with independent power producers has also grown over time. Kenya’s Geothermal Development Company and Kenya Electricity Generation Company, Kenya Power & Lighting Ltd are offering consultancy expert services in various areas of energy development, ranging from geothermal exploration, feasibility studies to arranging finance for projects97. While some of the services do not entail hard core technology or knowhow exchange, they play a vital facilitating role in the successful implementation of large energy projects, thus enabling technology transfer processes. Another example is South African firms investing in renewable projects in southern African states. Targeting business service industries (to advise on technology choices, funding and implementation issues) can support development processes. Possible policies are tapered subsidies for business services, funding of consultants who offer advice to countries.
96 Mwangi, M.N., The African Rift Geothermal Facility (ArGeo)- Status, United Nations University, 201097 Wairimu I, and Sumba S, The Star Newspaper , Kenya, Tanzania in geothermal project, August 9, 2013
9. TECHNICAL COOPERATION FOR GREEN TECHNOLOGY DIFFUSION

DIFFUSION STRATEGY OF GREEN TECHNOLOGY AND GREEN INDUSTRY IN AFRICA
170
9.5 The Going out model
The fifth model is the going out model, exemplified by the Chinese and Dutch approaches of government assisting businesses to enter foreign markets.
Going out model by China
China started implementing this model as early as 1970, but the model has only gained momentum in the last ten years. After evaluating early attempts of FDI, the Chinese Going Global Strategy was officially announced in 200198. The underlying motivation for this strategy is attributable to various developments. The first relevant event was the 1989 Tiananmen Square revolution, which affected relations between China and some western nations. At the time, relations of several African countries with the West and international institutions were quite tense, and they openly supported China while others adopted a silent but supportive stance99. This provided a basis for an intensification of relations between China and the continent. Africa also came to be considered of strategic use as a source of raw materials. The second development was the opening up of African economies in the 1990s and the subsequent privatization of Africa’s state owned businesses. China saw opportunities that could benefit the commercial interests of its own enterprises100. The third development is China’s sustained economic growth, which has resulted in demand for resources from Africa and a market for its affordable products101. The Asian financial crisis of 1997 was also a compelling factor nudging China to adopt an economic strategy that went beyond the Asian region102.
China’s going out strategy has a number of distinct features. The first and perhaps most notable feature is that it differs from the western ideological system of economics and politics by relying on state-led economic development103. These aspects have been at the centre of discussions, questioning whether resultant intensified FDI portends development impacts, particularly in developing countries. Sauvant (2013) captures three challenges this model currently faces These include addressing criticism of the negative impact of Chinese entities’ activities abroad; the belief that there is a need to limit the financial support
98 Bernasconi-Osterwalder et al. (2013).99 Taylor (2008, p. 13)100 Ibid101 Ibid102 BICCS (2013)103 Dambisa Moyo, http://blog.ted.com/2013/06/13/a-widening-schism-dambisa-moyo-at-tedglobal-2013/

171
extended to its state enterprises104 and China’s future role in shaping the global investments frameworks.
The second feature is state sponsorship, where the state offers support to enterprises in the form of financial resources and political leveraging with governments where the investments are made. Under the Chinese going out model, state owned enterprises (SOEs) play a significant role in strengthening China’s position in the global economy through the acquisition of foreign firms by way of joint ventures, mergers and acquisitions, equity participation and the setting up of enterprises in foreign countries. At the axis of this model is the state’s influential role in the financial sector and through institutions such as the China Exim Bank, the China Construction Bank and Foreign Aid Fund for Joint Ventures and cooperative projects. The first two have been instrumental in dispensing China’s massive capital reserves outside its borders in the form of preferential loans and export credits while the latter has been involved in providing finance to Chinese SMEs to form joint ventures and cooperation mechanisms in developing countries105.
The third feature is the use of joined-up effortsthe customization of packages for the target country and the absence of rules for recipients of aid. The inclusion of joint ventures, use of customized aid packages and its laissez faire character (minimal use of requirements for African or Chinese firms) sets it apart developed countries106. The Chinese development aid model, much like Japan’s, aims to provide assistance with no interference107. This has earned it favour with SSA countries, helping to deepen economic and diplomatic relations with developing countries.
The Chinese going out strategy is the result of many years of economic diplomacy with different countries, pointing to its fourth notable feature: its focus on long-term outcomes as opposed to shorter ones. For instance, with regards to its relations with Africa, China has spent years cultivating Sino-African diplomacy anchored in values of shared solidarity between developing countries against the strong global influence of western countries108. Contrary to the mainstream view that Chinese interests in Africa have commenced recently with its heightened appetite for resources over the last decade, Sino-African relations actually date back to the 1950s.
104 China is not the only country supporting private enterprises financially with operations abroad as we will see in the case of the Netherlands.
105 Bernasconi-Osterwalder et al, Chinese Outward Investment: A compilation of primary sources, IISD, 2012106 Tan-Mullins, et al (2010).107 Ibid108 Taylor, Ian. China’s new role in Africa.
9. TECHNICAL COOPERATION FOR GREEN TECHNOLOGY DIFFUSION

DIFFUSION STRATEGY OF GREEN TECHNOLOGY AND GREEN INDUSTRY IN AFRICA
172
China has been accused of using political patronage to strengthen its relations with SSA countries attracting much retribution from the western community. However, one should keep in mind that similar practices of using personal relations with high-placed officials up to the highest level (including the president) have been applied by developed countries such as France in its diplomatic relations with Francophone Africa109’110. Other mechanisms to exercise non-material influence include debt cancellation not just for African countries but also for countries in other developing regions111 and the setting up of cultural and Chinese language centres and access to Chinese TV channels The UK and France have also established cultural centres, but the building of infrastructure and stadiums is a strategy pursued by China which has thus created physical visibility in SSA.
The fifth feature of the Chinese going out model is the deployment of high level political machinery to promote SOE activities and their economic interests abroad. Between 2000 and 2009, four high profile ministerial Forums on China Africa Cooperation (FOCAC) have brought together African ministers and Chinese officials to discuss mutual interests in economic, political and development cooperation. The 2006 summit in Beijing was attended by 40 African heads of state112, while the first summit in 2000 was attended by 80 ministers from
109 Taylor, Ian. China’s new role in Africa pg 12110 Roy (2012)111 At the end of the years 2009, China had entered into debt relief agreements with about 50 countries from the Caribbean
& Oceania, Latina America, Asia and Africa affecting 280 mature debts and amounting to CNy25.58 billion or over 16 Billion USD (Bernasconi-Osterwalder et al, 2012)
112 According to Roy (2006) The six-day summit attended by 40 African heads of state and government was the largest gathering organized by a foreign power without colonial ties to Africa.
Economic infrastructure
Industry
Energy & Resource development
Agriculture
Public facilities
7%
61%
16%
4%
3%
Figure 9.1: Distribution of Consessional Loans from China by 2009

173
44 African countries113. Other similar summits focusing on development cooperation with other developing regions have also taken place such as the China-Pacific Island Countries Economic Development & Cooperation Forum, and the Forum on Economic and Trade Cooperation, China-ASEAN Leaders Meeting and China-Caribbean Economic & Trade Cooperation Forum114. These summits have been followed by several high level visits to Beijing by leaders from developing regions as discussed below115.
The sixth feature of the going out model is that investments set up outside China primarily focus on commodities (including land and forest) and infrastructure development, with other sectors such as industry and agriculture taking much smaller shares116. Although infrastructural development can have a significant impact on the social economic status of developing countries, the figure below illustrates that crucial sectors in these countries are not getting the attention they deserve.
Going out model by developed countries: The Netherlands
Although China is best known for the use of the going out model, it is also used by other states, such as the BRICS countries, and with good results. The going out model has also been adopted by other nations with each country fashioning their strategy based on their endowments and other contextual factors. The going out model is being increasingly adopted and stepped up because of the economic crisis and the success of China and the BRICS countries
These outward strategies seek economic cooperation with developing countries that are experiencing favourable growth trends. In particular, current economic growth in SSA and its expanding consumption base is casting the region in a new light. Traditionally seen as resource suppliers, SSA countries are now gaining recognition as viable markets for consumption goods and services and a booming labour force. With the economic downturn in rich countries, enterprises are keen to venture into new markets, and governments are stepping in to support these efforts. Cooperation frameworks that previously existed between countries are now becoming instrumental in assisting enterprises from the North to tackle existing and perceived challenges that exist in developing country markets.
113 Roy, Sumit (2012), China and India-the ‘emerging giants-and Africa‘, Global Policy Essay http://www.globalpolicyjournal.com/sites/default/files/pdf/Sumit%20Roy%20-%20China,%20India%20and%20Africa.pdf
114 Bernasconi-Osterwalder et al, Chinese Outward Investment: A compilation of primary sources, IISD, 2012.115 http://allafrica.com/stories/201304011181.html, 116 Bernasconi-Osterwalder et al (2012).
9. TECHNICAL COOPERATION FOR GREEN TECHNOLOGY DIFFUSION

DIFFUSION STRATEGY OF GREEN TECHNOLOGY AND GREEN INDUSTRY IN AFRICA
174
One of the countries using the going out model is the Netherlands, a country which historically has been active in development aid. The approach adopted by the Dutch government has similarities with China’s going out model, but also has some notable differences. One difference is that the Netherlands and other EU states are not yet using state owned enterprises to enhance their economic positioning in the global market. Like other European countries, the Netherlands is following China’s example of dispensing public finance through DFIs. The Dutch government plays an important role in supporting private sector endeavours in various ways.
The first difference is that the Dutch development bank FMO, offers co-financing loans with fairly flexible credit terms for firms investing in developing countries117.
Government co-financing enhances the firms’ profile, portraying them as more reliable creditors to private lenders, thus raising chances of attracting finance. This is a particularly important aspect, especially for firms venturing into more complex economic environments such as developing countries. It also acts as a risk mitigation tool since debt can be written off in case of complete failure of a venture. Another attractive arrangement is the possibility to defer the commencement of debt repayments, among others. Financial services and subsidies target all business sizes with programmes designed to suit firms’ needs.
The second form of support is in form of technical and business advice through the Chamber of Commerce offices. Firms keen to commence operations outside the country can receive advice for a small fee. In addition, workshops and seminars are organized focusing on business development, finance and legal advice. Firms also receive advice on local and business cultures for destination countries. This form of support is important as it enables firms to navigate more smoothly in new business environments.
The third form of support is trade missions. Although trade missions are not new, they have gained prominence as global competition has increased in the past several years. These can be high level missions involving senior government officials such as presidents, prime ministers and ministers often aimed at securing bilateral cooperation for broadly defined economic cooperation strategies between governments. At the time of writing this report (November 2013) the Dutch prime minister was on a similar mission to China118
117 http://www.fmo.nl/fom118 http://www.government.nl/documents-and-publications/speeches/2013/11/15/speech-by-prime-minister-mark-rutte-
at-a-signing-ceremony-and-reception.html

175
to be followed by another to Indonesia119.Trade missions can also be low key and target specific economic sectors of mutual interest between countries.
Under the latter type of missions, government agencies which traditionally supported entrepreneurial innovation at home are used to support firms to access external markets. Under the Dutch approach, Chambers of Commerce play a leading role in organizing Dutch entrepreneurs with shared interests at regional as well as at national level. Such missions organize business actors in various industries (water, energy) helping them aggregate their interests which are then matched with those of actors in destination countries. Trade missions to other countries are organized with the help of commercial attachés in the destination countries who work with local industry and government agencies to arrange trips during which seminars are held, site visits are made and meetings are held with local entrepreneurs. Brokering services are provided by the Netherlands-Africa Business Council, a network organization for the Dutch private sector active in Africa. NABC is a non-governmental private sector organization, driven and funded by its members.120
By offering support to businesses through finance, subsidies, and technical advice coupled with economic diplomacy, the role of the Dutch state very much reflects China’s. The focus is on sectors where the Dutch have comparative advantages and that are important for SSA countries as well, such as agriculture, energy, ICT and water.
The going out economic model entails ample opportunities for technology transfer and adoption, especially in key sectors that have potential to transform SSA economies. Given the focus of the Chinese model on infrastructure improvement and resource excavation, it offers fewer opportunities for enhancing and upgrading Africa’s manufacturing sector. The going out models of Northern countries such as the Netherlands offer slightly more opportunities for technological exchange and development benefits for African businesses when fashioned in a manner benefitting both countries. . Africa could benefit even if it does not “buy and import as much as possible Chinese products and machinery121”. Firms from countries such as the Netherlands and the Republic of Korea could focus on a more complementary exchange of technology and know-how where technology unavailable in SSA countries is imported and locally produced suitable products are utilized to the greatest extent possible to
119 http://www.government.nl/government/members-of-cabinet/mark-rutte/news/2013/11/13/prime-minister-rutte-minister-ploumen-and-minister-dijksma-head-trade-mission-to-indonesia.html
120 www.nabc.nl121 Tan-Mullins et al (2010).
9. TECHNICAL COOPERATION FOR GREEN TECHNOLOGY DIFFUSION

DIFFUSION STRATEGY OF GREEN TECHNOLOGY AND GREEN INDUSTRY IN AFRICA
176
achieve the desired technological upgrading. Trade missions’ ability to facilitate interactions between firms creates a mechanism for learning about possible technical cooperation projects, resulting in the identification of a range of technologies that are suitable for SSA contexts. However, SSA countries have yet to put in place a clear strategy through which they can tap these emerging models. Consequently, although the potential is clear, the outcome of these recent trends as a conduit for technology transfer and diffusion remains unclear.
9.6 Enterprises’ initiatives
A less well-known model which offers potential for technology transfer is enterprise initiatives that aim to minimize the actual and psychological distance between African markets and technology markets. While several initiatives with this objective exist, one key model has emerged in the last decade in which commercial banks in developing countries seek to expand their market by offering non-financial services to the business sector. This recent trend has emerged as a response to a gap in supportive services for small and medium enterprises in import oriented economies such as many SSA countries. According to an IFC study, 21 banks in developing countries cited the need to expand their customer base and to differentiate themselves from other banks as their key motivation to offer this type of service122. One example is the Barclays Business Club which was introduced in Kenya in 2003 and launched similar initiatives in Ghana and Uganda. The Club’s membership has grown rapidly since then and now stands at 14,000, indicating the business sectors’ interest in dealing with economic vulnerabilities and in accessing foreign markets.
A study conducted in Kenya two years after the Club’s formation found that 55 percent of its membership comprised farily small enterprises with an average of five employees, the mean age of owners being 38 years and relatively young enterprises that were mostly engaged in trade and services123. Typical services offered included a suite of business skills offered to entrepreneurs through seminars and workshops as well as the promotion of networking. In fact, Club’s manager stated that the initial idea was to facilitate networking within Kenya and its neighbouring countries
Successful networking locally resulted in an interest to venture into foreign markets. The Club has since organized tours to important trade goods markets
122 International Finance Corporation, Why Banks in Emerging Markets Are Increasingly Providing Non-financial Services to Small and Medium Enterprises, 2010?
123 Wanjumbi M., Banking Small Enterprises, 2005

177
(including renewable energy technology markets) such as India, Dubai, China, and other Asian countries124. The tours have helped alter the image of India and China as “far away” countries to “not so far away” countries. The visa policies of Asian countries are favourable towards such visits. The fact that China’s visa policy is based on reciprocity and that it is fairly loose compared to, say, that of EU states, as well as the low cost for visas similar to the visa costs the Kenyan government charges Chinese nationals has encouraged many small business owners to venture out and scope the technology markets (based on an interview with Amos Nguru of Afrisol and follow-up telephone conversations with him and a marketing director of Chloride Exide).
Reaffirming the influence of immigration regulations in SME participation in international trade is the fact that Barclays Kenya Business Club, one of the most successful clubs, has organized only one trip to the EU (the Netherlands and Germany in 2009). Both the US and UK appear to perform better in this respect with three and four missions, respectively. albeit only in the last four years. While missions to Asian countries involve several hundred participants, including over 700 participants to China twice, such missions to the EU and the US involved only 45-50 members. Asian destinations do not restrict mission participants to identified sectors only, while developed countries are stricter in approving visas. According to the Club Manager, Asian countries appear to understand the characteristics of developing country SMEs better and their need to keep exploring lucrative markets.
This initiative differs from government driven trade missions in two ways: first, it originates from within the private sector and is the result of an absence of support for the private sector, with the government playing only a minor facilitating role through embassies abroad. Secondly, missions organized by the private sector enable small entrepreneurs to participate, which are often excluded from government driven missions because they tend to focus on large enterprises.
Because the objective of these trips continues to be the sourcing of goods, including a variety of machinery, equipment and spare parts for local use, it is an important conduit for technology transfer between countries. Furthermore, since entrepreneurs thereby gain access to technology markets, they are able to learn more about the technology beforehand and are thus able to make an informed decision about the technology. This increases the chances of the technology’s suitability and success. Such trips are therefore crucial as
124 Barclays Bank, Kenya. www.barclays.co.ke Accessed on 25 October, 2013
9. TECHNICAL COOPERATION FOR GREEN TECHNOLOGY DIFFUSION

DIFFUSION STRATEGY OF GREEN TECHNOLOGY AND GREEN INDUSTRY IN AFRICA
178
they do not only facilitate the transfer of technologies, but offer a platform for the exchange of technological know-how, which has always been lacking in traditional technology transfer through trade. Manufacturers of technologies who have remained isolated from developing country markets also have the opportunity to learn more about which technologies are more effective in these markets.
9.7. Outlook for technical cooperation for the diffusion of RE and EE technologies
As the previous sections have shown, several technology collaboration models are already underway in the field of low-carbon technologies. Technology transfer and diffusion of technologies at the commercial stage is frequently funded within the framework of climate change mitigation or adaptation programmes as exemplified by the CDM. We found that the CDM mechanism is a weak framework for technology transfer to SSA countries due to their low technological base, among other reasons. Ongoing RE commercial activities come in the form of projects implemented by firms with funds from various donors. yet R&D and the demonstration of technologies are rarely part of climate change mitigation or adaptation programmes. If technical cooperation is to involve the building of local technological capability, then R&D at the local or technology recipient level is imperative. Thus far, international funding institutions have not been able to financially support country specific clean technology R&D activities. Hence, funding channels should be established under the umbrella of bilateral or multilateral development assistance.
Some multilateral financing activities are emerging. For example, CDM benefits from the multilateral finance instrument of the Global Environmental Facility (GEF). Moreover, GEF supports climate technology transfer centres in Africa through the African Development Bank and the World Bank has already established a Climate Innovation Centre in Kenya125. The Green Climate Fund (GCF), established in 2012, could also become an important channel of financing for technology transfer and R&D activities in developing countries (GCF, 2013). There is thus an emerging combination of development aid cooperation linked with development financing institutional arrangements which could benefit technical cooperation for green technology diffusion in Africa.
Building local technological capability involves technology development and 125 http://kenyacic.org/devs/ (accessed 30.8.2013).

179
demonstration activities that are prone to risks which could also be effectively addressed by multilateral funding activities. UNFCCC recommendations for technology cooperation mechanisms to limit risks are presented in Figure 9.1. They include participation in climate technology networks, supporting R&D, creation of enabling environments, financing technology development and transfer.
Figure 9.2: Technology cooperation mechanisms
Source: UNFCCC (2012)
A common feature of these technology risk mitigation mechanisms is that each of them requires multiple actors’ interaction. It is interesting to note that this is akin to interactive learning that characterize the generation and use of technological knowledge under the innovation system framework applied for this study.
A more comprehensive approach to technology cooperation is the technology mechanism. This vehicle has yet to be created and rooted in the Cancun Agreement. Under the auspices of the UNFCCC, the mechanism will determine mitigation and adaptation-relevant technology needs based on country conditions and accelerate RET adoption and technological capacity building activities along the entire technology cycle.126 Activities will include access to global technology information and the development of national technology roadmaps, ensuring access to RET intellectual property rights, advising on 126 http://unfccc.int/ttclear/templates/render_cms_page?TEM_tcn
9. TECHNICAL COOPERATION FOR GREEN TECHNOLOGY DIFFUSION
Participation inClimate Technology Network
• Participation of a wide range of institutions including private sector and national technological, scientific and academic institutions
Supporting R&D • TM to promote cooperative R&D programmes in North-South, South-South or triangular schemes
Creation ofenabling enviroments
• Take account of systemic nature of innovation• Strengthen both push and pull factors
Financing technologydevelopment & transfer
• Demonstrate the necessity and value of supporting R&D and demonstration activities to donors• Engage with the GCF on a technology funding window

DIFFUSION STRATEGY OF GREEN TECHNOLOGY AND GREEN INDUSTRY IN AFRICA
180
policies that facilitate the uptake of climate technologies and providing customized training and capacity building (TEC, 2012; UNEP, 2013). This mechanism, which has yet to be set up, places emphasis on the acquisition of technological capabilities rather than simply supporting technology transfer through hardware imports. It remains to be seen whether this instrument will be capable of providing country specific recommendations on the adoption of technologies and how to foster climate technology industries.
There is also considerable interest among companies and governments in Africa to engage in technical cooperation. Such cooperation can take many forms such as innovation hubs, like the Climate Innovation Centre in Nairobi, which host firms during their early years after their establishment. The hub acts both as an innovation hub, creating a platform of knowledge exchange and learning, and offers a central point for pooling financial and technical resources for micro and small firms in the RE industry. Firms hosted at the centre have access to training in business development as well as technical aspects of their area of operation. Up to 16 similar innovation hubs exist in Kenya with some hosted by institutions of higher learning. Some are best described as knowledge centres, others as investment hubs, maker business incubation and pre-incubation hubs. Most of them tend to be concentrated in the capital Nairobi and are ICT oriented. Setting up hubs in various locations of the country can be a useful way of enabling technology transfer to rural agricultural and tourism areas with potential for agribusiness development. Kenya is in the process of establishing itself as the ICT and business process outsourcing hub in the region through its Konza City Project.
The second form is through the exchange of academic knowledge which can be exchanged between countries through scholarships and research fellowships in identified areas of national strategic interest. Building knowledge in areas of agro-food processing, for instance, can have a huge impact given the demand for processed foods and the changing consumer habits of populations in SSA. In Kenya, the Jomo Kenyatta University of Agriculture and Technology (JKUAT) would be a suitable partner for implementing agribusiness technology projects. In Nigeria, the Federal University of Agriculture, Abeokuta would likewise be a suitable partner. As discussed in previous chapters, Nigeria has a good technological base within various institutions of higher or technical learning that can make a smooth upgrade possible. Technologies developed here could be deployed through industrial parks and incubation hubs in emerging cities to take advantage of the growing demand for processed goods. The university has adapted its curriculum to emerging needs in agribusiness but there are technological gaps that could be filled by the Republic of Korea and other

181
countries. A third potential form of cooperation could be the training of workers in a given industry through placements in a similar industry in a country with more advanced technological know-how, which can help acquire knowledge that is relevant to sectors in developing countries. Such learning-by-doing programmes could target pre-selected workers for skills and have the potential to ensure that knowledge exchange is maximized. Particularly when coupled with the acquisition of relevant technologies and the targeting of micro to small enterprises can help revitalize industrial sectors.
Technical cooperation can be based on African solutions that are upgraded and non-African technologies adapted to the African context. Cooperation should go beyond the transfer of technology and include the creation of an enabling environment, finance, education and training.
Having reviewed the models of technical cooperation that are currently in place and are applicable in SSA and identifying the areas that could benefit from technological support, the following can be considered approaches with potential impacts:
The models vary widely in applicability as well as what they can be expected to deliver in terms of long-term sustained technological advancement. For instance, supporting industry in accessing technology and know-how through development aid grants has negative effects of distorting markets and creating non-sustainable dependencies on financial support. A more viable approach with the potential for sustainable progress is by fostering and enabling interactions between African and foreign firms with technology expertise relevant to African firms. Various business frameworks can act as conduits for technology exchange. They are partnering for joint service deliveries in fields such as ICT and business support, co-branding, joint R&D, franchises, licensing and joint ventures. These frameworks could be supported by policies that ensure technological cooperation and its impact is sustainable in the future. Trade missions organized by both the government and private sector can, in particular, serve to bridge the gap between firms in two different types of economies.
Current trends call for a shift in the framing of development cooperation frameworks. North-South cooperation often takes the shape of development aid or conventional international trade with the expectation that these will result in technology transfers. As decades of applying these frameworks have demonstrated, North-South differences in technological advancement and production methods have been an obstacle. Furthermore, a more enabling
9. TECHNICAL COOPERATION FOR GREEN TECHNOLOGY DIFFUSION

DIFFUSION STRATEGY OF GREEN TECHNOLOGY AND GREEN INDUSTRY IN AFRICA
182
framework for transfers and the protection of intellectual property rights has not been forthcoming. In the absence of progress and with the recent economic trends, the case for South-South cooperation has become more relevant. Technologies from southern countries tend to be more suitable to address developing countries’ needs. At the same time, businesses in both the North and South are seeking for alternative ways (trade missions) to access technological products. Recent trends have made newer models of cooperation such as business-to-business cooperation and South-South cooperation more relevant, particularly in supporting industry and service sectors.
Development aid and DFI-supported technical cooperation should aim to identify and target areas of economic production where they have higher chances of making an impact. Thereby, they match their contribution with the potential of recipient’s ability and readiness to generate gains. The recipient’s readiness can be manifested in having a functional organizational framework, the ability to self-evaluate needs and identify own solutions. Where such solutions face technological and financial challenges, the case of development aid intervention becomes relevant. The case of Kenya’s tea industry being able to benefit from technical support from the UNEEP-GEF project serves as an instructive example. The fact that the industry is well organized with sound governance structures has been a contributory factor to its ability to utilize technical support from development aid.
Technology transfer and diffusion efforts and supportive policies should adopt a more pragmatic approach. Globalization has brought the world economies closer faster, tossing up problems of adjustment for all. Diverging economic and population trends result in new challenges on both sides. Existing international and national frameworks are becoming more and more ineffective in addressing current challenges. This calls for innovation, pragmatism and foresightedness in planning technological approaches for increasingly more complex technological challenges. None of the models discussed is found to be fully erroneous, but each model suffers from specific weaknesses. To address the issue of technology advancement in developing economies, a combination of technological cooperation models appears appropriate to address various aspects. For instance, development aid could be used to address the quality of education and skills set upgrading. The rest of the models reviewed could be directed towards various parts of the economy to exploit the qualified workforce and to generate supportive services within the economy.

183
The need for mutual learning and adaptation. Technical cooperation can be based on African solutions and non-African technologies which are adapted to the African context. Adaptation success could result in a technological base capable of generating its own local technological innovations.
The need for capacity building at the level of government. Capacity development in education and at company level requires institutional frameworks that facilitate learning and cooperation. It is believed that innovation on the ground requires the following capacities at the level of government: capacities for policymaking and coordination, mechanisms for implementation and enforcement, policy learning (to adapt policies to new circumstances) and an ability to avoid falling prey to special interests, to hypes and short-termism. Low carbon development paths require “analytical and institutional capacities […] to analyse and interpret the data, to organise and participate in meaningful stakeholder involvement, and to translate background information into (policy) action” (van Tilburg et al. 2011, p. 30). Such capacities can only be partially provided by international experts: “if the role of the international experts in the strategy process is too large, this could lead to low legitimacy of the LCDS and lack of ownership” (Ibid). Local expertise is also necessary to take specific circumstances into account and allows for an updating of relevant knowledge for policy measures.


185
10. ConCLuSionS And PoLiCy rECommEndAtionS 10.1. Conclusions
In the past decade, most countries in Africa have continued to grow and a few African economies (e.g., Nigeria, Ghana, Mozambique, Tanzania and Zambia)127 are reckoned to be among the fastest growing countries in the world. The Kenyan economy has also performed commendably well, growing at an average of about 5 percent in the past decade. However, growth remained largely based on traditional commodity exports and agricultural production. African manufacturing is still relatively weak and economic diversification and value addition activities have yet to become significant drivers of growth. Despite these challenges, issues of green growth and the opportunities available through investments in green technologies have gained prominence in strategies for economic diversification and efforts aimed at addressing the critical challenge of inadequate energy infrastructure. The potential of harnessing the enormous renewable energy resources in Africa and the adoption of energy efficiency measures in production activities are regarded as capable of creating new pathways for green growth and green technology investments in Africa. In this respect, African manufacturing, which is currently mainly agro-industry based, provides the platform for green technology investment which can help tackle the energy constraints on production activities. In this study, we have focused on agro-industry in two African countries (Nigeria and Kenya), and have examined the potentials for investments in renewable energy and energy efficiency technologies in these two countries as examples of African economies that are open to international knowledge flows and technical cooperation activities.128
The trends in renewable energy technology deployment and investment presented in this report indicate that Africa is a region with high potential for the diffusion of green technologies. The findings demonstrate that the diffusion of RE and EE technologies in Africa and other developing economies depends
127 Each of these countries has recorded average growth rate in excess of 6 percent from 2004 to 2013. See African Economic Outlook accessed 21 November 2013 at http://www.africaneconomicoutlook.org/en/data-statistics/table-2-real-gdp-growth-rates-2003-2013/
128 Nigeria’s energy industry differs from Kenya’s in that it has much better electrification rates than Kenya though it is highly endowed with petroleum resources, but suffers from the fact that the electric power installed capacity is not in a reasonably functional state.

DIFFUSION STRATEGY OF GREEN TECHNOLOGY AND GREEN INDUSTRY IN AFRICA
186
to a large extent on existing government policies and regulatory conditions. For the two African countries in the study, innovation capability does not support the idea of energy leapfrogging through investment in renewable energy. This confirms the findings of Murphy (2001) which reveal that the expectation of energy leapfrogging in rural areas of eastern Africa through the adoption of solar PVs and biogas is unrealistic given the low income levels and the socio-cultural constraints on technological change. The evidence from this study also confirms the notion that the market for RE and EE technologies in Africa is relatively underdeveloped and that government policies are important because of their capacity to create an enabling environment for the diffusion of green technologies, especially through the mobilization of critical resources, encouragement/incentives for private sector involvement and facilitation of development cooperation activities.
By applying the innovation system framework, our analysis showed that there is a need to strengthen the innovation capacity in the two countries through interactive learning enabled by technical collaboration by actors involved in the supply and marketing of renewable energy technologies. Similarly, evidence of sectoral innovation capacity in the agro-processing sectors studied showed that the diffusion of EE technologies is highly constrained by weak innovation systems which can be strengthened through technical cooperation efforts. Technological learning can be expected to occur from joint investment projects involving local and foreign companies that focus on improving the energy efficiency of agro-industrial production. Considerable gaps often exist between the actors, which obstruct such projects. To bridge such gaps and maximize learning between collaboration partners as well as disseminating lessons learned more widely, intermediary organizations can play an important role. As pointed out by Szogs et al. (2011) in a study of small-sized industries in Tanzania and El Salvador, different types of intermediate organizations have played key roles in linking marginalized economic actors with sources of knowledge and other resources essential for capability upgrading and innovation in both traditional and more differentiated economic activities. In accordance with this proposition, desirable linkages and interactions among actors in the RET markets and EE diffusion in Nigeria and Kenya, foreign companies (e.g. firms from the Republic of Korea) are advised to work with knowledge brokers serving as ‘midwives’ of a new generation of RETs or agro-industry that thrives on foreign EE technologies that are adapted to the African production environment. Examples of knowledge brokers that we have come across in this study are the Centre for Energy Efficiency and Conservation (CEEC) in Kenya and the KTDA.

187
As a scoping study that is based on small samples and a few case studies, it is difficult to draw general conclusions from the findings. The results present sufficient insights that could guide decisions on what should be done to stimulate RET markets and the diffusion of EE measures, especially in Nigeria and Kenya.
In terms of knowledge base, drivers and barriers, sales (expectations), product offerings and users of RETs, the following summarize the study’s major findings:
• In terms of knowledge base, both cassava processing in Nigeria and maize processing in Kenya have utilized hardware technology with local or imported content for decades to varying degrees. Over 85 percent of Nigeria’s cassava processors surveyed used wholly domestic equipment while this proportion was 12.5 percent in Kenya. The foreign components of the equipment in both countries are largely imported from China and India. The EE technologies and measures adopted by Nigeria’s and Kenya’s agricultural sector reflected this same pattern.
• The role of foreign RETs is dominant in both countries, and the technology content of the RETs sold by the respondents has sizeable foreign components. China and India dominate sources of RETs available in both countries, while RETs from developed countries such as Germany, UK, Italy, Netherlands and the US were less widely available. Solar technology emerged as the leading RET in the two countries as manifested by the fact that 60 percent of firms interviewed in Kenya and 100 percent in Nigeria were involved in its distribution. Supply and adoption of RETs was more diversified in Kenya compared to Nigeria; and unlike in Nigeria, several firms were involved in some form of imitation and adaptation of foreign technologies through the fabrication of biogas systems, wind turbines and small hydro.
• RET marketers in both countries offer their products as as “bundles” comprising technology components and services. The reason for bundling is to overcome challenges of market access caused by technical and financial gaps that hamper technology uptake. However, only a few companies offer full packages that offer financing.
• Training and assistance with implementation was part of most RET product offerings, providing for a solution to the problem of lack of technical skills. Technological know-how included in the services comprised installation, maintenance and repair.
10. CONCLUSIONS AND POLICY RECOMMENDATIONS

DIFFUSION STRATEGY OF GREEN TECHNOLOGY AND GREEN INDUSTRY IN AFRICA
188
• China is the main source of RETs currently being sold by the firms in our research sample. 68 percent and 44 percent of the respondents from Nigeria and Kenya, respectively, mentioned China as the origin of the RET they market. India as the origin of RETs distributed was also quite significant among Nigerian firms at 36 percent but much less important among Kenyan firms that appeared to source from a variety of EU states. Other sources of RETs in both countries originate from Japan, the US, Canada, UAE and European countries such as UK, Germany, the Netherlands and Turkey, albeit to a lesser extent, apparently due to the perceived relatively high cost of RETs from these countries.
• The three most important markets for the RETs of our research sample are 1) the government and non-profit organizations (hospitals, schools, community centres, etc.) in both countries, 2) companies that are not engaged in industrial production activities, and 3) households. Manufacturing companies appeared to be quite slow in taking up RETs in both countries. This may be explained by the fact that solar PVs are the main RETs currently dominating the market, and it is known that solar PVs are not able to generate adequate power to support industrial production. Microgrid systems based on solar PV and batteries would be a possible solution, but their diffusion is hampered by a series of problems (low lifetime of batteries and the need for maintenance, proper operations and repair).129 Given today’s technologies and lack of capacity for maintenance, operation contracts may be better than ownership contracts. Under an operation contract, the company that designs and installs the technology is given a license to operate it and receive a guaranteed price for the power it produces; the risk of failure resides with the supplier-operator who will profit only if it can keep costs under control and ensure the grid produces power for the duration of the contract.130
• The majority of respondent RET marketers (81.8 percent in Nigeria and 70.7 percent in Kenya) have not experienced any significant change in the volume of their sales since 2007. However, the majority of firms (63.6 percent and 56 percent in Nigeria and Kenya, respectively) are optimistic that the market will witness a significant change in the next five years (by 2018), though many could not predict the extent to which the market would change.
129 http://www.technologyreview.com/featuredstory/429529/how-solar-based-microgrids-could-bring-power-to-millions/130 Ibid.
189
• ‘Unfavourable business climate/environment for FDI and high tariffs’ and ‘lack of technical competence on the part of potential adopters’ are the two most important barriers to the adoption of RETs as perceived by the respondents in the two countries.
• 72.7 percent of respondents claimed that the major factor facilitating the sale of RETs is the unreliable and epileptic power supply and foreign currency exchange rate volatility in Nigeria. Over half of the respondents identified access to loans from commercial banks as a source of help in their sales. In Kenya, the most important factor driving the uptake of RETs is foreign exchange rate volatility (56 percent). Following closely was access to finance (53.7 percent), NGOs (42 percent) and power outages (39 percent).
• 54.5 percent of RET marketers interviewed in Nigeria were unwilling to declare their revenue for the year 2012, while in Kenya 68 percent declined to share this information. This is probably attributable to the sensitive nature of the question which might lead to estimations of the marketers’ profit. Some marketers thought that exposing the profitability of their business might attract new marketers to the market, and thus stiffen competition. Other factors adduced to the reluctance of disclosure of revenue are security and taxation. It is believed that revenue levels increase potential security hazards and a possibility of increases in and a multiplicity of taxes. Most of the marketers are optimistic (81.8 percent in Nigeria and 78 percent in Kenya) that their revenue from RETs will be at least 25 percent higher in the next 5 years.
• 91 percent of cassava processors interviewed in Nigeria and 87.5 percent of maize processors interviewed in Kenya are willing to cooperate with foreign companies interested in assisting with RET adoption. The perceived barriers to such cooperation in Nigeria include high tariffs on foreign equipment mentioned by 48.4 percent of respondents; lack of technical competence to engage foreign companies was mentioned by 46.8 percent of the respondents and unfavourable business climate/environment for FDI was mentioned by 35.5 percent of respondents. In Kenya, high tariffs on foreign equipment was the only barrier identified by the respondents.
10. CONCLUSIONS AND POLICY RECOMMENDATIONS

DIFFUSION STRATEGY OF GREEN TECHNOLOGY AND GREEN INDUSTRY IN AFRICA
190
• 85.5 percent of cassava processing firms in the Nigerian research sample finance their EE measures with the firm’s own capital, while nearly half of all firms interviewed in Kenya (45 percent) financed EE measures they implemented with their own capital.
• Despite the potential benefits of EE measures only one-fourth of the cassava processing firms interviewed (and 27.5 percent of the maize millers) has an energy auditing programme. The EE project implemented by firms in the two industries is best described in order of importance as a) good housekeeping, b) better process control and c) technological change or acquisition of new equipment. About 58 percent of respondents claimed that the most important organization involved in the success of EE projects is the equipment provider; 43.5 percent claimed it was a government agency while 22.6 percent claimed it was a consulting firm.
• Two-thirds of the cassava processing firms in the research sample offer full EE packages consisting of training, equipment, financing, maintenance and repair. For maize processors, offering a full EE project complete with technology, training, repair and maintenance and finance was only reported by 35 percent. Training is the most accessible component of EE measures used by the firms as claimed by 66.1 percent of cassava processors and 37.5 percent of maize processors.
• The most influential drivers of EE technology adoption were similar in both countries. The key drivers for the adoption of EE measures by cassava and maize processors were in-house knowledge about energy management, the availability of technical expertise and the need to save costs.
• 81 percent of respondents claimed that the initial setup costs are the main barrier to the adoption of EE measures; about 61 percent claimed that it was the lack of support or government incentive, while the lack of information on suitable EE measures was mentioned by 56.5 percent of respondents as an obstacle to EE adoption. Like in Nigeria, the high cost of finance was the leading deterrent factor in Kenya cited by 60 percent of firms interviewed. Although Kenyan firms rarely borrow from banks, the high costs imply that they have to wait to accumulate savings in order to carry out EE projects. Lack of information on what the appropriate technologies or measures are was another deterrent mentioned by 20 percent of firms. Other factors holding back the adoption albeit to a lesser extent include uncertainty about EE projects, lack of government incentives and poor technical capabilities.

191
• Financing of EE measures in both countries derived predominantly from own capital and the reasons commonly cited were high cost of finance and stringent requirements by financial institutions.
From the workshops with policy makers and policy experts, the following conclusions materialized:
• Capacity Building/Strengthening: • ThedevelopmentofendogenouscapacityinR&Dandthe
deployment of R&D outputs for innovation are much needed. This can be achieved bottom-up and in a more strategic way, with the help of technical assistance programmes offered to existing STI capacity building institutions in Africa at regional and national levels in collaboration with international partners.
• Technologyisatwo-foldissue,builtinfacilitiesandpeople.Thecapability to move/adapt across time is important (interaction between people and technology over time).
• Weak policy environment and low enforcement capacity: • Vestedinterestsandweakpolicyenforcementcapacityarea
problem, as is corruption.• Weakinstitutionsthathavefailedtoadequatelyrecognizethe
imperative of greening and environmental protection make policy implementation difficult.
• Market imperfections• Everywhereinthevaluechain,peopletrytomaximizeprofits,which
undermines economic efficiency throughout the economy and the diffusion of RETs.
• Domesticcapabilitiesformanufacturingthenecessaryequipmentare weak
• Therearenowell-functioningmarketsforrepairandservicing
• Poverty and income levels: • RETsperceivedasmoreexpensiveintheshortterm.• ThediffusionofRETsandEEsinAfricaishinderedbylowlevelsof
purchasing power and Africans prefer to buy non-African products for reasons of perceived quality and image.
10. CONCLUSIONS AND POLICY RECOMMENDATIONS
DIFFUSION STRATEGY OF GREEN TECHNOLOGY AND GREEN INDUSTRY IN AFRICA
192
• Data and indicators: • Policiesneedsolid,evidence-basedfoundationsandindicatorsfor
the assessment of progress made. Systematic data collection and collation, e.g. on energy auditing, is a challenge.
• Perceptionsandattitudes:• GTsnotyetpopularamongbusinessesinAfrica.
• Weakgovernanceinstitutions:• GTadoptionisafunctionofgoodpolicies,includingbutnot
exclusive to addressing market failure, efficient and effective pricing, environmental taxation, designing and enforcing property rights and reforming inefficient subsidies. Limited capacities for policy formulation, financing and implementation as well as lack of institutions are also key challenges.
• Cross-ministerialcollaborationandinclusiveness/stakeholderengagement in policy scoping and design stage:• RETpoliciesarecreatedinsilos.• Governmentprogrammesthatdealwithonlyonebarrierareunlikely
to be successful.• Integratedpoliciesarecriticaltoenablepublicandprivatesector
investments required for GT development and diffusion. Political leadership is urgently needed for economic development and the creation of a market for GTs. The Republic of Korea’s experience offers a positive example of managed development through a national plan of action involving the president, ministers, business and development experts, with the president and ministers taking an active stance. Africa has much to learn from this strategy to garner the necessary political will to implement desirable policies.
• Forpolicyownershipandacceptance,interactionwithstakeholdersis desirable.
• Investmenttaxcredit• Aremovalofcustomsdutiesbenefitsmostlyforeignexporterslike
Chinese firms; it is of little benefit to African businesses. • TodevelopaRETmanufacturingindustry,itisbettertousean
investment tax credit rather than customs deductions.
• Finance• CapitalneededforAfrica’sinfrastructuredevelopmentdwarfsthe

193
FDI inflows reflecting the tremendous existing gaps• Itisdifficulttoobtainfundsforrelativelysmallprojectsbetween
EUR 0.5 and 1 million (USD 0.6-1.3 million).• For the poor, micro-financing and social enterprises constitute two
possible ways of RE adoption. In India, the social enterprise Selco Solar is tremendously successful in spreading PV for low income households by combining microfinance, training, a cooperatives model and social enterprises.
• Infrastructure:• In Africa, the formal institutions (such as the government
administration) often do not function effectively. People rely on personal contacts based on personal trust.
• Poor infrastructure in transport and electricity and heavy bureaucracy constitute a problem for green economic development.
• Education• The education system is hardly geared towards RETs.
• RETinnovationincubationcentres:• The creation of special points of interaction with green innovators to
learn about their problems and ideas for policy is considered useful for identifying the actual problems, how they interact with each other (problems) and their root causes.
• Incubator activities appear very useful for start-up companies
• Fiscalpolicyreforms:• Fiscal (tax and subsidy) reforms and charges (including carbon
pricing) such as preferential tax treatment for green technology associated industries, removal of fossil fuel subsidies or earmarking tax revenues to promote green technology objectives;
• Development of favourable legal frameworks and policy environments to foster equal partnerships and collaboration between national private sector actors and foreign investors is key.
• Environmentalpolicies,regulations,standardsandcertification• Regulations, standards and certification such as the enforcement
of building standards that recognize energy efficiency goals, or certification of green technologies for government.
• Green procurement programmes can be used to stimulate RETs, but one of the problems with green procurement is that sellers charge
10. CONCLUSIONS AND POLICY RECOMMENDATIONS

DIFFUSION STRATEGY OF GREEN TECHNOLOGY AND GREEN INDUSTRY IN AFRICA
194
high prices to the government (twice the normal price). Tenders are a possible way to get around this problem.
• Valuechainapproach• The value chain approach is useful for identifying obstacles to
implementation and identifying the weak and inefficient elements and for determining the relevant stakeholders whose perspectives must be aligned.
• Focusing on embodied technologies in discrete links in the chain may lead to failure to identify the real scope for energy efficiency. The main source of inefficiency may be in the logistics part of the chain. Food for instance will go bad if it is not transported.
• To manage change, the actors in charge need to know who the lead drivers and lead actors are. It is important to determine the power of different actors in the value chain and work with them. In South Africa, trade unions blocked the modernization of the textile chain. In the case of Nigeria where benefits from oil subsidies and interests from the petroleum industry appear to prevent RET adoption, policy tools are best designed in such a way to support RET adoption without necessarily eradicating subsidies, as this will prove a long and difficult process.
• Businessservices• Targeting business services industries can support development
processes. A programme in South Africa proved very successful. Possible policies include tapered subsidies for business services and funding of consultants who provide advice to countries.
• Braingain• “Brain gain” is a possible mechanism for (green) development in
Africa. [Brain gain is the mirror image of brain drain and consists of well-educated people returning to their home country] It is occurring in China and referred to as “turtles returning home”. The African Union has made a plea for brain gain.
• Designingeffectivepolicies• To determine effective policies, the following five questions are
helpful: 1) why are stakeholders slow to respond to incentives, is it because of weak and wrong incentives or because of other issues? 2) what are appropriate incentives from the point of view

195
of development? 3) who should provide these incentives? 4) is complementary support needed besides changes in framing the conditions? 5) which specific powers are blocking change and which actors have power to jumpstart new developments?
10.2. Policy recommendations
From the findings of the study, it follows that policy interventions are crucial for the diffusion of green technologies and the greening of African industry. Such interventions should be a major component of strategies to harness opportunities for renewable energy development and marketing and the promotion of the adoption of energy efficiency technologies in the African agro-processing industry. In terms of interventions (to be implemented by African governments and the Republic of Korea as an example country interested in technical cooperation with Africa), the project findings lead us to the following recommendations:
• TechnicalcooperationforthediffusionofREandEEtechnologiesshouldbe organized based on the identified drivers and barriers to the adoption of RETs and EE measures. One way of doing this is through the creation of an interaction point study with innovators to learn about their problems, the effectiveness or ineffectiveness of policies in addressing the problems experienced and for receiving direct help. It is not a substitute for research-based evaluations, but a useful complement.
• Technical collaboration for the diffusion of RETs in the two countriesshould enable both first and second line actors in the sectoral innovation system to advance facilitators of RET adoption and mitigate the major barriers to RET adoption. The major barriers to the adoption of EE measures in the two agro-industry subsectors are initial set-up costs of EE technology and the high cost of maintaining the EE measures. It thus appears that technical cooperation for EE technology diffusion among agro-processors should focus more on addressing issues of access to finance and cost of finance. Technology upgrading is also critical because the findings also indicate that EE technology in use among the agro-processors are mostly low technology, though operated with appreciable local competence. Moreover, both RETs and EE technologies have significant foreign components, mainly of Chinese and Indian origins.
10. CONCLUSIONS AND POLICY RECOMMENDATIONS

DIFFUSION STRATEGY OF GREEN TECHNOLOGY AND GREEN INDUSTRY IN AFRICA
196
• Toachievepositiveresults,technicalcooperationprojectsshouldfocuson areas in which there is (economic) demand for anticipated cooperation outcomes and a capacity for technical collaboration. Areas meeting those requirements are described in Appendices 1 and 2. The details of cooperation projects have to be determined by the parties themselves, but it is desirable for intermediary actors to be involved as well as knowledge brokers for such projects and to encourage broader dissemination of lessons. Companies from the Republic of Korea interested in the African RET market could partner with African RET marketers through Chambers of Commerce and industry with intermediation activities organized by relevant government agencies in Africa and their counterparts in the Republic of Korea. Appendix 3 describes programmes and agencies in Kenya and Nigeria for this purpose.
• Barrierstoenergyefficiencyimprovementcouldbeovercomethroughthecreation of energy advice bureaus in Nigeria and Kenya. These bureaus would be best located within the existing Energy Department, and should be responsible for carrying out subsidized energy audits for micro, small and medium-sized enterprises; and the enforcement of energy efficiency standards across all categories of business enterprises.
• ThefactthatRETsareprimarilyimportedfromChinaandIndiasuggestsanimportant role for South-South cooperation in building local technological capability and strengthening the national system of innovation. The institutions required for adaptation of foreign RET and EE technologies in the two countries can learn from their foreign counterparts in China and India. In addition, many African countries have expressed interest in learning from countries with industrial development experience and medium and high technology. For example, countries like the Republic of Korea could share their industrial development experience and know-how. To avoid disappointing results and stimulate technological learning across a wide range of actors, technical cooperation with foreign actors should not only aim to adapt foreign technologies to the African context, but to also include an upgrade of African solutions.
• For the two industries studied, industrial policy should move awayfrom aid-based models of development to more pro-active innovation systems and value chains promoting intervention mechanisms, which would result in system efficiencies and investments in projects with co-benefits.

197
• The two countries in our study need to re-assess and improve theircapacity for policy development with respect to appropriate interventions required for the diffusion of RE and EE technologies. For interventions to be effective, a new orientation to intervention should perceive policy as a process requiring i) capacities for policymaking and coordination; ii) mechanisms for implementation and enforcement, iii) policy learning (to adapt policies to new conditions), and iv) an ability to avoid falling prey to special interests, hypes and short-termism. Previous experiences from successfully industrializing countries, including the Republic of Korea and other Asian Tigers, show that the policymaking capacity of technocrats was a major success factor in their growth paths. The ability to design industrial development programmes that respond to emerging opportunities and mitigate pitfalls in the policymaking process is crucial. A key dimension of industrial policy management capabilities is the generation and application of solid industrial intelligence.
This study has established that there is considerable interest among companies in Africa and African governments to engage in technical cooperation with foreign companies and research institutes. Such cooperation can assume many forms, education of African students and training of workers, joint research programmes and exchange programmes, technological transfers based on African solutions which are upgraded and non-African technologies that are adapted to the African context. Technical cooperation should, however, go beyond the transfer of technology and include issues of creating an enabling environment for technological acquisition, finance, education and training. Appendices 10.1 and 10.2 provide specific recommendations for technical cooperation projects that a developed country such as the Republic of Korea could adopt in partnership with Nigeria and Kenya.
Finally, based on the suggestions for policy intervention, we present policy recommendation cards for Nigeria and Kenya. The policy recommendation cards include an overview of the policy background and contents, related government agencies, institutions, laws and regulations, an assessment of the political feasibility and possibilities for practical implementation of the recommendations, and additional suggestions for improving the policy process.
10. CONCLUSIONS AND POLICY RECOMMENDATIONS

DIFFUSION STRATEGY OF GREEN TECHNOLOGY AND GREEN INDUSTRY IN AFRICA
198
10.2.1. Policy recommendation card for Nigeria
Subject 1 Building Industrial Policy Capacity for RET
a) Background and contents
Situation and Issues: Nigeria is endowed with sources of renewable energy such as solar, wind, biomass, hydropower, geothermal and ocean waves, which can be transformed to supplement energy derived from fossil fuel sources such as oil and natural gas. However, little investment has been made in renewable energy technology (RET). The results of this study demon-strate that investment in RETs is primarily driven by government institutions and private sector agents using PV solar panels and related accessories for street lighting and powering household equipment. Nigeria’s energy mix is dominated by fossil fuels (that is, oil and gas). Industrial policy accompanied by strong political will is thus required to promote investments in RETs.
Policy recommendations: 1. Government should create an enabling environment to encourage and at-
tract investors and RET project developers to Nigeria. In this regard, the Nigerian diaspora should be an important target of industrial policy. They are potentially willing investors once the enabling environment for invest-ment is sufficiently adequate.
2. Appropriate fiscal terms should be developed to attract global partners and investors for RET development.
3. Nigeria needs to diversify its energy mix with renewable energy. On-going efforts in this respect should be strengthened especially with regards to the provision of off-grid electric power supply to rural communities.
Benefits: • JobcreationasaresultofnewinvestmentsinRETs;• Improvementinforeigndirectinvestment(FDI);• Reductionincarbonemissionsasaresultofanimprovementintheuseof
RETs; • ImproveddiversificationofNigeria’senergymixand,consequently,diver-
sification of the economy.

199
b) Related government agencies and institutions; Related laws and regulations
Related government agencies and institutions:Government at various levels (federal, state and local) deals with industrial policy issues in Nigeria. While the federal and state governments are con-cerned with industrialization strategies, local governments are more con-cerned with issues of land allocation. The federal and state governments are often involved in planning and investment in RETs, while local governments are mainly involved in the implementation stages of RET projects.
Institutions that deal with RET issues in Nigeria include the Council for Re-newable Energy in Nigeria (CREN), the International Centre for Energy, Envi-ronment and Development (ICEED), the Energy Commission of Nigeria (ECN), the Nigerian Electricity Regulatory Commission (NERC), the National Centre for Energy Research and Development (NCERD) at the University of Nigeria, Nsukka, the Sokoto Energy Research Centre (SERC) at the Usmanu Danfodiyo University Sokoto, the National Centre for Energy Efficiency and Conservation (NCEEC) at the University of Lagos, the University of Ilorin National Centre for Hydropower Research and Development (NCHRD), and the National Centre for Petroleum Research and Development (NCPRD) at the Abubakar Tafawa Balewa University Bauchi. The federal ministries that supervise some of these institutions are the Federal Ministry of Environment, the Federal Ministry of Science and Technology, the Federal Ministry of Power and the Federal Minis-try of Industry, Trade and Investment.
Related laws and regulationsIncentives to encourage industrialists and investors in all sectors of the Nige-rian economy include the provision of five-year tax holidays for pioneer prod-ucts and industries; tax holidays for a period of up to three years; a 95 percent capital allowance for replacement investments and the elimination of double taxation.
The government has also launched an Investment Promotion and Protection Agreement (IPPA) which guarantees adequate and prompt payment to inves-tors in the event of expropriation, free transfer of funds and provisions for in-ternational arbitration of disputes.
The National Electric Power Sector Reform Act 2005 stipulates the use of all vi-able energy sources for sustainable national development with the active par-
10. CONCLUSIONS AND POLICY RECOMMENDATIONS

DIFFUSION STRATEGY OF GREEN TECHNOLOGY AND GREEN INDUSTRY IN AFRICA
200
ticipation of the private sector in line with the government’s economic policy. The Renewable Energy Master Plan (REMP) of 2005 and the National Biofuels Policy of 2007 aim at firmly establishing a thriving biofuel industry, utilizing agricultural products as a means of improving the quality of automotive fossil-based fuels in Nigeria.
c) Assessment of political feasibility and possibilities for practical imple-mentation
Diversifying the energy mix is a major objective of the Nigerian Energy Policy and the Renewable Energy Master Plan However, the dependence on fossil fuel remains strong and associated with an unsustainable subsidy regime. Attempts to diversify the energy mix will only succeed if they are independ-ent of the removal of the subsidy on gasoline and other fossil fuel products. Discussions on energy mix diversification should therefore be conducted with clear support for private investments in renewable energy to ensure that no new regime of unsustainable government subsidy is put in place. Policies on the development of renewable energy should clearly specify a phased re-gime of subsidy where necessary. For off-grid rural electrification projects, development partners can play a major role in supporting pilot projects which should be up-scaled through local support mechanisms. Local funding for Millennium Development Goals (MDG) projects can also play a significant role in the up-scaling of pilot renewable energy projects.
An Inter-Ministerial Committee on Renewable Energy and Energy Efficiency (ICREEE) was recently established under the leadership of the Minister of Power to provide a coordinated action plan on investments in RETs and EE. The ICREEE provides policy support to the Energy Commission of Nigeria which has been advocating the establishment of a renewable energy fund by all tiers of govern-ment. The main objective of the fund is to support the development of renew-able energy and energy efficiency projects.
d) Further suggestions
Adequate incentives should be provided to attract private investments in RETs and promote markets for RETs in Nigeria. The provision of fiscal incentives such as import duty exemptions, tax holidays, grants to encourage investments in solar PV and wind power, especially for the generation of off-grid electricity for rural communities is crucial for the diffusion of RETs in Nigeria.

201
10. CONCLUSIONS AND POLICY RECOMMENDATIONS
Awareness of the potential of renewable energy sources should be promoted. The case of the introduction of the bio-gel stove in Nigeria discussed in sec-tion 8 of this report revealed the potential of RETs as sources of cheaper and environmentally friendly energy for households in Nigeria. However, awareness of the gel stove is still low, and only one company is involved in its promotion. Support from government agencies and news media houses would be a great incentive for the diffusion of the bio-gel stove and other RETs being promoted by the same company (i.e., Smeefund Enterprises Limited).
It is also important to note that the findings of our study showed that the execu-tion of demonstration and pilot projects ensure improved awareness of RETs, and thus enable improvements in the markets for RETs, especially solar energy systems.
Subject 2 Building Policy Capacity in Energy Efficiency (EE) and Creation of Energy Advice Bureau
a) Background and contents
Situation and issues: There is currently no energy efficiency policy in Nigeria and the concept of ener-gy efficiency is poorly developed, leading to energy wastage at the household and at the industrial/organizational level and wastage by public utilities gen-erating and supplying electricity. Most agro-processing companies in Nigeria have never carried out a systematic energy audit to determine areas where effi-ciency can be enhanced. This was revealed by the findings of the survey on the energy efficiency (EE) measures being employed by cassava processing firms in Nigeria. Nigeria’s energy policy does not adequately emphasize the benefits of EE in the energy mix. Most companies have no good housekeeping system, resulting in energy wastage. A major gap identified is the absence of policy capacity on EE and the lack of energy advice bureaus that can help companies establish an EE regime at firm level.
Policy recommendations: 1. Policy makers in the Federal Ministry of Power, Federal Ministry of Industry,
Trade and Investment and the Federal Ministry of the Environment should jointly establish guidelines for company energy audit reporting. The guide-lines should include both internal and external energy audit programmes.

DIFFUSION STRATEGY OF GREEN TECHNOLOGY AND GREEN INDUSTRY IN AFRICA
202
2. The monitoring of guidelines for company energy audits should fall under the responsibility of an Energy Advice Bureau. The Energy Advice Bureau should engage in the promotion of EE awareness and advise companies on measures to improve EE and funding possibilities.
3. The Energy Advice Bureau should provide EE training and capacity building programmes for companies.
Benefits: • Productioncostreductionbycompanies.• Carbonemissionsreductionbycompanies.• JobcreationintheEnergyAdviceBureauandthroughcompanygrowth.
b) Related government agencies and institutions; Related laws and regulations
Related government agencies and institutions:The related government institutions include the Federal Ministry of Industry, Trade and Investment, the Federal Ministry of the Environment, the Federal Min-istry of Power, the Federal Ministry of Science and Technology; Energy Commis-sion of Nigeria (ECN), the Standards Organisation of Nigeria (SON), the Federal Institute of Industrial Research Oshodi (FIIRO), the National Centre for Agricul-tural Mechanization and the International Institute of Tropical Agriculture (IITA).
Related laws and regulationsThere are no laws regulating EE in Nigeria.
c) Assessment of political feasibility and possibilities for practical imple-mentation
The Energy Commission of Nigeria (ECN) in collaboration with UNIDO and other stakeholders has engaged in industrial energy efficiency programmes in the past. There is also evidence of the development of EE technologies by some public research institutes such as the National Centre for Agricultural Mecha-nization, Ilorin, the Federal Institute of Industrial Research, Oshodi, Lagos and the International Institute of Tropical Agriculture (IITA), Ibadan. However, the EE technologies are mostly prototypes that have yet to be commercialized.
The above stakeholders and the new Inter-Ministerial Committee on Renew-able Energy and Energy Efficiency (ICREEE) can discuss issues of EE, energy auditing by firms, and the establishment of an Energy Audit Bureau. Though it

203
10. CONCLUSIONS AND POLICY RECOMMENDATIONS
may be difficult to reach a consensus on the modalities for policy implemen-tation, there is a high likelihood that most stakeholders would agree on the rationale for EE, energy auditing, and the establishment of an Energy Audit Bu-reau. Moreover, ICREEE can provide a new opportunity for policy support at a very high level.
d) Further suggestions
Based on the findings of this study, energy policy reform in Nigeria should em-phasize the importance of EE. It should also clearly specify guidelines for EE at the firm and organizational levels. Previous engagements by ECN, UNIDO and some research institutes on industrial EE should be further examined and could form the basis for further reforms in energy policy.
Subject 3 Subsidy Regimes and Tax Incentives for RET
a) Background and contents
Situation and issues: There is no special subsidy or tax incentive for RETs in Nigeria. For example, customs tariffs for solar PVs are the same as for general electrical products/equipment. This results in relatively high tariffs for RETs, which discourage the local market for RETs. None of the RET suppliers/marketers surveyed in Nigeria enjoy exemption of duties on RET imports. Tariffs on RET products (e.g. solar PV equipment and accessories) are considered high compared to those on similar non-RET powered products. About 73 percent of RET suppliers / marketers in-terviewed complained about the unfavourable business climate, while 68 per-cent criticized the high tariffs on solar PVs as major barriers to the adoption of RETs. The Renewable Energy Bill that establishes a system of feed-in-tariffs has also yet to be passed into law in Nigeria.
Policy recommendations:1. The reduction of customs duty and the waiver of value-added tax (VAT) on
RET products is necessary to make the cost of RETs affordable and thus pro-mote widespread adoption of RETs.
2. A feed-in-tariff should be introduced in Nigeria’s energy industry to attract investors into the renewable energy subsector.

DIFFUSION STRATEGY OF GREEN TECHNOLOGY AND GREEN INDUSTRY IN AFRICA
204
3. For duty and tax waivers to be effective, it is important to reduce the admin-istrative process when filing exemptions for RETs.
4. Part of the proceeds from excise duties on fossil fuel products should be used to create a subsidy regime for RETs.
Benefits: • ReductionsinthecostsofRETproductsandimprovedmarketforRETs.• Afeed-in-tariffwouldguaranteeareliable,stablerateofreturn,allowingin-
vestors to forecast revenue and their overall payback period.
b) Related government agencies and institutions; Related laws and regulations
Related government agencies and institutions:The related government institutions include the Federal Ministry of Finance, the Nigerian Customs Service, the Federal Inland Revenue Service, the Federal Ministry of Industry, Trade and Investment, the Nigerian Investment Promotion Commission, the Nigerian Electricity Regulatory Commission, the Energy Com-mission of Nigeria (ECN), and the Renewable Energy Division of the Nigerian National Petroleum Corporation (NNPC).
Related laws and regulationsThere is presently no law or regulation providing for special incentives for dis-tributors, manufacturers and users of RETs in Nigeria. This is in contrast to the huge subsidies granted for conventional energy sources based on fossil fuels. It is, however, noteworthy that there are indications that incentives to stimulate the biofuel subsector will be introduced. The National Biofuel Policy was ap-proved in June 2007. The policy treats the biofuel industry as a pioneer sector attracting a package of customized fiscal incentives, e.g. total tax, tariff and VAT exemption for greenfield investments for 10 years.
c) Assessment of political feasibility and possibilities for practical imple-mentation
As indicated for the case of the bio-fuel industry, investments in the energy industry are generally rated as pioneer initiatives entitled to a tax holiday of 5-7 years. The ECN submitted an “Importation of Renewable Energy Equipment” Bill to the Nigerian Senate in 2002, asking for tax exemptions for the import of PV equipment but the bill has not been processed.

205
10. CONCLUSIONS AND POLICY RECOMMENDATIONS
In 2003, the Federal Government approved the National Energy Policy, devel-oped by the ECN to serve as a blueprint for the sustainable development, sup-ply and utilization of energy resources within the economy, and for the use of such resources in international trade and co-operation.
The Nigerian government is planning to introduce a feed-in-tariff aimed at promoting private sector investment in the development of renewable energy products.
Implicit in this is the willingness of the Nigerian government to provide subsi-dies and tax incentives for investments in RETs. However, advocacy for invest-ments in RETs in Nigeria is not particularly strong, and the unpopularity of the removal of the subsidy on fossil fuels remains a constraint on the government’s capacity to fund RET projects.
d) Further suggestions
Creating a subsidy regime for investments in the local development of RETs is important. However, the local technological capability for the development of RETs is relatively weak. Subsidies for foreign companies willing to cooperate with local RET suppliers/marketers in the development of RETs would be very helpful in promoting technology transfer. The main objective of the subsidy should be to make renewable energy products affordable to the large segment of the Nigerian market. Incentives could also be given to users of RET products through waivers of VAT.
Subject 4 Subsidy Regimes and Tax Incentives for EE
a) Background and contents
Situation and issues: Energy efficiency is important for the competitiveness of companies. However, industrial and energy policies in Nigeria do not emphasize the crucial role of EE. In recent years, investments in industrial production facilities have been driven by the exigencies of value addition to agricultural products, export pro-motion and job creation. Environmental protection agencies have also been established at the federal and state government levels to foster industrial emissions reduction and improve technological applications for pollution pre-vention and control. In the process of encouraging industrial emissions reduc-tion, issues of energy efficiency have been raised in the past, but have never

DIFFUSION STRATEGY OF GREEN TECHNOLOGY AND GREEN INDUSTRY IN AFRICA
206
become a major or direct policy initiative. From the findings of this study, EE of cassava processing firms does not depend on any extant industrial policy or environmental regulation. Companies’ approach to EE was mainly based on energy housekeeping, especially when there are apparent benefits to cost reductions by firms.
Policy recommendations: 1. Industrial policy reform should include specific guidelines on expectations
for energy efficiency for firms. Internal and external energy audits by firms should be an important component of industrial policy.
2. Emissions reduction regulations should include conditions for periodic en-ergy efficiency assessments as part of firm’s annual environment impact audits.
Benefits: • Improved firm performance arising from gains derived from cost reduc-
tions.• Reductionofcarbonemissionsbyfirms.Tendencytowardscleanerproduc-
tion by firms and the possibility of benefitting from the Clean Development Mechanism of the Global Environment Facility.
• Improvedlocaltechnologicalcapabilitythroughimprovedproductionpro-cess.
b) Related government agencies and institutions; Related laws and regulations
Related government agencies and institutions:The related government institutions include the Federal Ministry of the Envi-ronment; Federal Ministry of Industry, Trade and Investment, the Nigerian In-vestment Promotion Commission, the Nigerian Electricity Regulatory Commis-sion, the Energy Commission of Nigeria (ECN), the Renewable Energy Division of the Nigerian National Petroleum Corporation (NNPC), the State Environmen-tal Protection Agencies and the Standards Organisation of Nigeria.
Related laws and regulationsThe National Environmental Protection Regulations of 1991 which ensure in-dustrial effluent limitations through the installation of anti-pollution equip-ment by firms.

207
c) Assessment of political feasibility and possibilities for practical imple-mentation
The response by governments and institutions in Nigeria to EE issues has so far been ad-hoc in nature and non-comprehensive. Advocacy for the promotion of EE measures is also weak, and hence, there is no significant incentive for EE meas-ure applications by firms. Awareness of gains from EE measures is necessary among industrial stakeholders. The ongoing reform in Nigeria’s industrial policy could enable the introduction of specific guidelines on the expectations for en-ergy efficiency for firms. Internal and external energy audits by firms and periodic EE assessments could be important components of the revised industrial policy.
d) Further suggestions
Government policies on industrial development and environmental protection should provide adequate incentives for EE. EE is also critical to a new regime of green growth that can enable the Nigerian economy benefit from new techno-logical opportunities.
Subject 5 Training and Research Capacity in RET
a) Background and contents
Situation and issues: Nigeria’s manufacturing sector is import-dependent and has only contributed 3 to 4 percent of GDP in recent years. The engineering industry is weak and, hence, most of the production equipment and intermediate industrial inputs are imported. Nigeria lags behind many middle-income economies in indus-trial production. This study revealed that RETs are also imported, and there is no significant local R&D in the renewable energy subsector. The relatively weak local manufacturing sector is presently unable to produce RETs. There is, however, evidence of local repairs and coupling of RET components and acces-sories by RET suppliers/marketers. Though the technical skill requirement for such activities is low, there are opportunities for technological learning and reverse engineering. The study also indicates that Nigerian tertiary institutions (universities and polytechnics) have no full course programmes that are aimed at producing RET experts. Some university-based research institutes engage in renewable energy research with demonstrative pilot projects. These institutes’ research programmes are often specialized projects that do not form part of the university curriculum
10. CONCLUSIONS AND POLICY RECOMMENDATIONS
DIFFUSION STRATEGY OF GREEN TECHNOLOGY AND GREEN INDUSTRY IN AFRICA
208
Policy recommendations: 1. The ECN in collaboration with selected tertiary institutions should develop a
comprehensive RETs course programme and their applications.
2. Incentives that guarantee creative employment should be provided for stu-dents who want to pursue a diploma/degree in RETs and their applications. For example, small business loan schemes for young graduates willing to set-up RET installations and maintenance shops, sponsorship of overseas postgraduate training on RETs, etc.
3. Short duration training courses should be organized for technical managers of local RET supply/marketing companies. Foreign companies or agencies could partner with Nigeria in training local technical personnel from the pri-vate and public sectors on various aspects of RET development, deployment and maintenance.
4. Support for RET research and development (R&D) activities at local research institutes should be strengthened, and research activities should be de-mand-driven.
Benefits: •SkillsupgradingbyRETsupply/marketingcompanies.• AvailabilityoflocalskillsforthedevelopmentofRETs.• ImprovedR&Dfundingforlocalresearchinstitutes.•Demand-drivenR&Dwithhighlikelihoodofgeneratinginnovativeproducts
and processes.
b) Related government agencies and institutions; Related laws and regulations
Related government agencies and institutions:The related government institutions include the Federal Ministry of Education, Federal Ministry of the Environment, the Federal Ministry of Industry, Trade and Investment, the Nigerian Investment Promotion Commission; Nigerian Electricity Regulatory Commission, the Energy Commission of Nigeria (ECN), the Renewable Energy Division of the Nigerian National Petroleum Corpora-tion (NNPC), the State Environmental Protection Agencies and the Standards Organisation of Nigeria.
Related laws and regulationsThere is no law or regulation on training and research capacity building in RETs.

209
Any training and research related activities are carried out within the frame-work of extant general policy on science, technology and innovation which was approved in 2011.
c) Assessment of political feasibility and possibilities for practical implementation
The Federal Government has increased investment in R&D through improved funding of public research institutes in recent years. Most of the beneficiary research institutes are in the agricultural sector, while the energy research in-stitutes continue to face dire funding challenges. This suggests that training and building research capacity in RETs are not yet a high priority for government training and research capacity building. Development partners and foreign companies interested in the development of RETs can help promote training and research capacity building activities with energy research institutes and tertiary educational institutions as the entry points.
d) Further suggestions
Local researchers on RETs need assistance in improving their research efforts and meeting the immediate needs of RET suppliers/marketers and the users of RETs. They also need to be assisted through an intellectual property right re-gime that provides support for inventors in the process of patent applications. Grants to encourage investments in solar powered generating plants and local manufacturing of solar PV appliances are important for training and research capacity building programmes in RETs because they can provide a platform for technological learning. Subject 6 Training and Research Capacity in EE
a) Background and contents
Situation and issues: Training and research capacity building are important for firm competitiveness at the national and international levels. It is well known that EE contributes sig-nificantly to a firm’s ability to compete. According to the findings of this study, Nigerian firms are generally not competitive, and incentives to promote compe-tition are practically non-existent. For cassava processing firms, EE is driven by cost reduction and the tendency to engage in energy house-keeping.
10. CONCLUSIONS AND POLICY RECOMMENDATIONS

DIFFUSION STRATEGY OF GREEN TECHNOLOGY AND GREEN INDUSTRY IN AFRICA
210
Policy recommendations: 1. The ECN in collaboration with selected tertiary institutions should develop a
comprehensive course programme in EE and its applications. 2. Incentives should be provided for students who pursue a diploma/degree in
EE and its applications. For example, sponsorship of overseas postgraduate training on EE, etc.
3. Short duration training courses on EE should be organized for technical/production managers of manufacturing firms. Foreign companies or agen-cies could partner with Nigeria in training local technical personnel from the private and public sectors on various aspects of EE measures.
4. Support for EE research and development (R&D) activities at local research institutes should be strengthened, and research activities should be de-mand-driven.
Benefits: •SkillsupgradingonEEbymanufacturingfirms.• AvailabilityoflocalskillsforthedevelopmentofEE.• ImprovedR&Dfundingforlocalresearchinstitutes.•Demand-drivenR&Dwithahigh likelihoodofgenerating innovativeprod-
ucts and processes.
b) Related government agencies and institutions; Related laws and regulations
Related government agencies and institutions:The related government institutions include the Federal Ministry of Education, Federal Ministry of the Environment, the Federal Ministry of Industry, Trade and Investment, the Nigerian Investment Promotion Commission; Nigerian Electricity Regulatory Commission, the Energy Commission of Nigeria (ECN), the Renewable Energy Division of the Nigerian National Petroleum Corporation (NNPC) the State Environmental Protection Agencies and the Standards Organi-sation of Nigeria.
Related laws and regulationsThere is no law or regulation on training and research capacity building in EE. Any training and research related activity is carried out within the framework of the extant general policy on science, technology and innovation which was approved in 2011.

211
c) Assessment of political feasibility and possibilities for practical imple-mentation
The Federal and State Governments have been encouraging investment in the manufacturing sector, especially in agro-processing. Investments in R&D have also increased through improved funding of public research institutes. Most of the beneficiary research institutes are in the agricultural sector, while energy research institutes continue to face dire funding challenges. There is no evi-dence that government has emphasized the importance of EE for R&D expendi-ture. Development partners and foreign companies interested in the develop-ment of EE processes can help promote training and research capacity building activities with energy research institutes and tertiary educational institutions as entry points.
d) Further suggestions
Local research efforts should include issues of EE for firms. Public sector R&D institutes should be assisted in improving their research efforts with reference to energy efficiency of the agro-processing industry. Grants that encourage in-vestments in EE and support for FDI with significant EE components are impor-tant for training and research capacity building programmes in EE because they can provide a platform for technological learning.
10.2.2. Policy recommendation card for Kenya
Subject 1 Building Industrial Policy Capacity in RET
a) Background and contents
Situation and issues: Since pre-independence era, Kenya has relied on its hydro resources to gen-erate electricity. However, increasing climate variability has resulted in more frequent and longer periods of low hydrology leading to generation from pe-troleum products and the use of expensive emergency power facilities. These temporary solutions have exposed the economy to oil price and exchange rate variability with considerable adverse economic impact. Furthermore, current population growth, rapid urbanization and economic growth continue to gen-erate unrelenting demand for electricity. These factors have enabled govern-ment commitment to the development of alternative (i.e. renewable) energy
10. CONCLUSIONS AND POLICY RECOMMENDATIONS

DIFFUSION STRATEGY OF GREEN TECHNOLOGY AND GREEN INDUSTRY IN AFRICA
212
resources aimed at expanding access to electricity. The renewable energy be-ing explored includes solar, geothermal, small hydro and biomass. The efforts have culminated in reduced reliance on large hydro power plants which now supply 60 percent of electricity, and the objective remains to scale this down further, even in the face of power demand requirements for accelerated eco-nomic growth.
Policy recommendations: 1. Introduce competition in the energy industry, as this has the potential to
improve services offered with a positive impact on costs which currently re-main high relative to those of neighbouring countries. Competition in the energy sector remains rather limited, with transmission by a single state agent. For generation, competition is also limited as the state agent pro-duces approximately 80 percent of total electricity.
2. Provide support to the development of off-grid systems, using integrated multiple technologies, particularly for rural institutions and rural commer-cial operations. This can be integrated in major investment projects target-ing the development of arid and semi-arid areas.
3. Take action to create a mechanism to recycle old solar technologies as this is lacking in the country and should be put in place as a matter of urgen-cy. Over the past decade or so, solar technologies have gained foothold in Kenya. However, there is no evidence of a plan to introduce a mechanism to avert environmental damage that may be caused by RET waste once their lifecycle expires. Building a recycling plant for RET waste would be helpful.
Benefits: •Greateraccesstoelectricityamongpoorpopulations• Lowercostsofliving.• ArecyclingplantinKenyacouldhelprecyclenotjustwastesfromsolartech-
nologies but also from other electronics. This could trigger the emergence of an urban industrial waste management subsector with potential for: – Creation of employment for young people,– Averting environmental degradation, and– Technology diffusion opportunities through reverse technology engineering.

213
b) Related government agencies and institutions; Related laws and regulations
Related government agencies and institutions:The related government agencies and institutions include the Ministry of En-ergy, the Ministry of State for Planning, National Development and Vision 2030, the Kenya Power & Lighting Co (KPLC), the Kenya Energy Generation Co. (Ken-Gen), the Energy Regulatory Commission (ERC), the Rural Electrification Author-ity (REA), the Kenya Electricity Transmission Company (KETRACO), the Geother-mal Development Company GDC) and the Energy Tribunal.
Related laws and regulations:The related laws and regulations include:• PowerAct,1996• EnergyAct2006•RetailElectricityTariffsReviewPolicy(ERB,2005)• PublicProcurementandDisposalAct(2005)• KenyaElectricityGridCode2008• LeastCostPowerDevelopmentPlan(LCPDP2011-2031)• Feed-in-tariffpolicyforwind,biomass,smallhydro,geothermal,biogasand
solar, 2012• TheEnergy(solarwaterheating)Regulations,2012• TheEnergy(solarphotovoltaicsystems)Regulations,2012• TheEnergy(improvedbiomasscookstoves)Regulations,2012•NationalEnergyPolicy2013• Registration, licensing&maintenanceofa registerofapprovedsolardis-
tributors/vendors, solar technicians, solar water heating contractors and technicians.
c) Assessment of political feasibility and possibilities for practical implementation
For two decades, a variety of policies have been put in place with the following results: • Reformofnationalenergyutilityandtheenhancementofitsproductivity.• Formationofnewagenciesanddecentralizationoffunctionsandresponsi-
bilities. •OpeningupspaceforparticipationofIPPsinelectricitygeneration.• Provisionofaframeworktosupervisetheindustrywithclearregulationsfor
various sub-sectors.• Reductionofprocurementandcontractualthathamperedeffectiveprivate
sector participation.
10. CONCLUSIONS AND POLICY RECOMMENDATIONS

DIFFUSION STRATEGY OF GREEN TECHNOLOGY AND GREEN INDUSTRY IN AFRICA
214
• EnhancingtheattractivenessofKenya’senergysectorforinvestorsbymini-mizing risk factors and availing risk mitigation instruments to the private sector.
• Promotionofuptakeofrenewableenergytechnologiesbyfirmsandhouse-holds as well as public institutions.
• Expansionofenergyaccessparticularlytotheurbanpoorandruralcommu-nities.
This shows that Kenya is reforming its energy industry with the aim of increas-ing access to energy, diversifying energy sources and increasing renewable en-ergy. An important factor is growing energy demand. The proposed measures correspond to the first two measures proposed (increasing competition and introduction of off-grid energy systems). Attention to recycling and the proper management of obsolete PV is not a government priority and support for it is currently low.
d) Further suggestions
• Regulations such as those in place for vendors and technicians for solartechnologies can be extended to cover biogas and small wind technologies as well as their related services.
•CloseandcontinuousconsultationswithREprivateactorsshouldbemain-tained to keep abreast of new developments and adjust regulations accord-ingly.
• Improve thecountry’s riskprofile for investors toalter theexisting imageof high business risk and find the right balance between FiT and retail tariff policies that can have socio-economic impacts. This should eliminate per-ceived risks and mitigate real ones.
Subject 2 Building Policy Capacity in Energy Efficiency (EE) and Creation of Energy Advice Bureau
Situation and Issues: In view of the prevailing conditions where national utility struggles with de-mand-supply of electricity, high costs and unreliable power supply, Kenyan in-dustries have limited their attention largely to supply and reliability concerns for decades, relegating energy efficiency to a secondary level concern. This is despite the rate of energy loss in the manufacturing sector ranging between 10 percent and 40 percent according to the Kenya Association of Manufacturer Center for Energy Efficiency & Conservation (KAM-CEEC).

215
The past decade has witnessed moderate interest from public-private sec-tor joint efforts as illustrated by the establishment of the Kenya Association of Manufacturer Center for Energy Efficiency & Conservation (KAM-CEEC). The agency has helped bring energy management concerns to the fore through its annual awards. However, one major shortcoming is that participation in the Annual Award is only for association members, and thus creates the percep-tion that EE is a luxury that only large enterprises can afford. This is reflected in the findings of this study which reveals that only two large maize processors engage in energy efficiency management measures, while smaller ones are not even aware of steps being taken by the government.
Policy recommendations: 1. Actors (ERC & KAM-CEEC) currently dealing with EE matters have other core
mandates, leading to some degree of neglect of EE. Therefore, we propose government to set up a new public agency (perhaps CEEC can be separated from KAM and transformed into such an agency) whose sole mandate would be the implementation of energy regulations and all other matters relating to EE in collaboration with other actors. The agency would also look into specific issues that have the potential to increase the adoption of EE tech-nologies: • EEawarenesscampaignsneed tobesteppedupbeyond theKAM-CEEC
Annual Awards currently taking place. Campaigns should include a televi-sion programme series where enterprises of various sizes and industries that have benefited from EE can be used to foster learning by observation.
• The implementation of the new EnergyManagement Act (2012) can bekicked off with government sponsored energy audits using approved li-censed firms and energy auditors. This would help raise awareness and promote compliance.
• EnsurethateffortstoscaleupEEcapacitybuildingarelinkedwithlearninginstitutions that are already offering courses in this area, particularly poly technical schools, Nairobi University and JKUAT University for long-term sustainability.
• Taketheleadtodevelopincentivemechanismsbasedonpreviousworkof KAM-CEEC involving enterprises, tapping into findings of enterprises’ behaviour and perceptions to identify appropriate incentives.
2. Government should include the finance sector in its awareness creation activities to alter the perception that energy efficiency is only important for large enterprises. EE pilot projects implemented by KAM-CEEC in 2009 revealed that the finance sector has a poor understanding of EE project fi-nancing. The same situation is reflected in the findings of our study in 2013,
10. CONCLUSIONS AND POLICY RECOMMENDATIONS
DIFFUSION STRATEGY OF GREEN TECHNOLOGY AND GREEN INDUSTRY IN AFRICA
216
where we found that nearly all firms that implemented EE measures were financed with own capital. The agency can then work with financial institu-tions to engage them in funding of various EE projects in the private sector.
Benefits: •Greaterindustrialproductivityandnationalcompetitiveness.• PotentialtotriggermodernizationofKenya’smanufacturingsector.• PresenceofagovernmentagencycoordinatingEEissueswouldresultinthe
development of efficient Energy Services Companies (ESCO) currently not developed in Kenya.
b) Related government agencies and institutions; Related laws and regulations
Related government agencies and institutions:The related government agencies and institutions include the Ministry of En-ergy, the Kenya Association of Manufacturer Center for Energy Efficiency & Con-servation (KAM-CEEC) and the Energy Regulatory Commission
Related laws and regulationsThe related laws and regulations are:• TheEnergyManagementRegulation2012• TheEnergy(solarwaterheating)Regulations,2012• Registration,licensingandmaintenanceofaregisterofapprovedenergyau-
dit firms and individual energy auditors
c) Assessment of political feasibility and possibilities for practical implementation
Several policies to promote industrial energy efficiency exist but implementa-tion has been weak. In September 2013, the Government Gazette published the Energy Management Regulation 2012. The Energy Regulatory Commission (ERC) commenced licensing and maintenance of an official register of qualified energy audit firms, and individual auditors commenced operations in 2013. But very few of the maize processors interviewed for this study were aware of these developments. This indicates a need for awareness creation in the indus-try, particularly among SMEs. The proposed measures correspond with the gov-ernment goals of increasing industrial energy efficiency and reducing energy costs. The KAM will probably not oppose the creation of an energy efficiency implementation agency, provided that the agency supports a soft implementa-tion approach of the energy efficiency requirements to conduct energy audits and have in-house energy auditors.

217
d) Further suggestions
• For awareness creation, relevant government agencies could collaboratewith KPLC (Kenya Power & Lighting Co) and include promotion materials which should be mailed out with monthly bills to all commercial users.
Subject 3 Subsidy Regimes and Tax Incentives for RETs
a) Background and contents
Situation and issues: In 2011, the Government of Kenya removed all duties and VAT from RE related technologies. More recently, the VAT waiver was removed, leaving duty waivers as the only tax incentive. However, for large RE projects, it is possible to benefit from other subsidies meant to attract investors to the country.
Policy recommendations: 1. To reintroduce VAT exemptions for the reason that they have been a major
driver of RET adoption and consideration.2. To create subsidy regimes adopting RETs as a way of encouraging foreign
investors in other sectors to incorporate RE in their investments. 3. To develop a subsidy programme targeting investors who operate in environ-
ments that allow for RET use instead of conventional grid energy. 4. To create subsidy regimes for RET adoption that target agricultural opera-
tions with the potential of transforming rural economies through the use of small mini-grids.
Benefits: • Technologytransferanddiffusion.• Improvedindustrialproductivityandnationalcompetitiveness.• PotentialtotriggermodernizationofKenya’smanufacturingsector.
b) Related government agencies and institutions; Related laws and regulations
Related government agencies and institutions:Kenya Revenue AuthorityKenya Investment Promotion Authority
10. CONCLUSIONS AND POLICY RECOMMENDATIONS

DIFFUSION STRATEGY OF GREEN TECHNOLOGY AND GREEN INDUSTRY IN AFRICA
218
Related laws and regulationsFeed-in-tariffs policy for wind, biomass, small hydro, geothermal, biogas and solar, 2012
c) Assessment of political feasibility and possibilities for practical implementation
The political feasibility of re-introducing the VAT exemption is low. The pro-posed measures have negative consequences for the government budget and may also not always be needed for investment decisions. Ideally, the tax ex-emptions should only be for technologies and users that require them but this has to be determined on a case by case basis which creates transactions costs and may not always be feasible.
d) Further suggestions
VAT exemption for RETs is a potentially good policy measure to stimulate their diffusion but is best complemented with subsidy regimes or local content re-quirements that encourage the local manufacture of RET components. A subsi-dy for foreign companies willing to cooperate with local RET suppliers/market-ers in the development of RETs would be very helpful in promoting technology transfers. A disadvantage of the tax exemption and subsidy measure is that the deny government revenue opportunities as a negative factor, which should be weighed against the gains. Subject 4 Subsidy Regimes and Tax Incentives for EE
a) Background and contents
Situation and issues: KAM-CEEC offers subsidized energy audits for firms in Kenya. However, even with the subsidies, the costs are still considered high as was reported by one director of a leading maize processing firm that had recently conducted an au-dit. A major barrier for the adoption of EE measures, even for firms with re-sources, was their cost. A second barrier cited by smaller firms was awareness of both the concept of EE as well as where to locate EE services.

219
Currently, there are no subsidy or tax regimes for EE. However, as the issue of EE is gaining ground, especially in the private sector, it is necessary to put in place a clear and consistent policy on energy management. This is crucial for sending positive signals to the financial sector, and nudging them to give EE projects a more positive consideration.
Policy recommendations: • ThegovernmentshouldoffermoreincentivesfortheadoptionofEEmeas-
ures and technologies. Fiscal incentives have been proven to trigger interest in the private sector elsewhere. Examples include:
1. Possibility to deduct costs of EE measures from annual profits before tax.
2. Possibility to deduct training costs incurred by enterprises to train their staff from profits before tax.
3. For larger EE investments, the government could offer loans at very low or no interest repayable over a predetermined period.
4. Co-funding major retrofit projects for strategic industries. The government can also act as a guarantor for such credit.
5. The government can set up an EE fund where it can pool resources, in-cluding from donors. This funding mechanism can be disseminated to the private sector based on maximum impact criteria.
6. As EE remains a relatively new enterprise management concept in Kenya, the government could set up a bureau that helps businesses to design appropriate EE projects that keep project costs and risks low to secure financing from banks.
7. Because financial institutions may be unwilling to finance large EE pro-jects, the government could set up a low or no interest fund to issue fi-nance to industry.
Benefits: • Technologytransferwiththepotentialoffurtherdiffusionandadaptation.•Opportunitiesforknowledgesharingandlearningamongfirms.• Creationofanewservicesectorandcreationofemploymentthatcouldbe
exported to neighbouring countries.
10. CONCLUSIONS AND POLICY RECOMMENDATIONS

DIFFUSION STRATEGY OF GREEN TECHNOLOGY AND GREEN INDUSTRY IN AFRICA
220
b) Related government agencies and institutions; Related laws and regulations
Related government agencies and institutions:•MinistryofEnergy• KenyaAssociationofManufacturer-CenterforEnergyEfficiency&Conserva-
tion (KAM-CEEC)• EnergyRegulatoryCommission• KenyaPower&LightingCompany(KPLC)
Related laws and regulationsThe only related regulation is the Energy Management Regulation 2012
c) Assessment of political feasibility and possibilities for practical implementation
The promotion of EE measures is relatively new in Kenya. The proposed meas-ures will be greeted favourably as far as the outcomes are concerned, but the tax reduction and subsidy measures proposed will cost money which cannot be used for other purposes. This militates against their attractiveness.
d) Further suggestions
Subject 5 Training and Research Capacity in RET
a) Background and contents
Situation and issues: The Jomo Kenyatta University of Agriculture and Technology (JKUAT) offers post-graduate and doctoral courses in energy technology and systems as well as un-dergraduate courses in electrical and mechanical engineering which includes units on solar PV. Over and above this, there are a number of cooperations between Kenyan higher education institutes and foreign businesses and de-velopment agencies: a. Collaboration between JKUAT and the German Solar Academy Nairobi. The
latter brings together three German firms Energiebau Solarstromsysteme GmbH, SCHOTT Solar AG and SMA Solar Technology AG. The collaborative effort offered training in areas of planning, installation, operation and main-tenance of grid-connected, and off-grid photovoltaic systems (PV).
b. The Japanese international development agency (JICA) has also teamed up with JKUAT to implement a training project targeting the training of trainers in RE technologies, including solar PV and hybrid systems.

221
c. The University of Nairobi and Uppsala University have conducted trainings in photovoltaic design, installation and maintenance.
A more centralized approach would help coalescence in a more consistent way to meet technological needs.
Within Kenya, national agencies such as the Kenya Institute of Education (KIE), National Industrial Training Authority (NITA), and Kenya Renewable Energy As-sociation (KEREA) are working together with ERC to develop curriculum and trainer manuals on solar PV technologies; and in conducting tests for and ac-creditation of solar technicians.
Policy recommendations: 1. The government should set up an agency or fund to centralize and coordi-
nate numerous RET capacity building efforts from development agencies, NGOs and the private sector.
2. agency should then carry out a national skill needs assessment in key sec-tors to identify skill sets for development and take a lead in guiding other actors by identifying skill sets that are more important. Preferably, it should have authority over the types and quality of skills these actors offer. This should set the stage for a coherent capacity development strategy.
3. Curriculums at lower and middle level institutions and poly technical schools should be developed and made available for the training of RET technicians.
4. Longer-term curriculums offered by technical institutions should endeavour to equip youths with skills in a variety of technologies, not just RETs, but in other useful areas as well.
5. Promotion of R&D at JKUAT and other institutions with RET training pro-grammes is necessary for the development of local technological capability, especially in the manufacture of RETs.
Benefits: • EquipyouthswithusefulRETrepairandmaintenanceskillsrequiredforthe
sustained diffusion of RETs.•Creationoflinkagesbetweeninstitutionsoflearning,theprivatesectorand
technology users.• Enhancing the county’s competitive position through a labour force with RET
skills.
10. CONCLUSIONS AND POLICY RECOMMENDATIONS
DIFFUSION STRATEGY OF GREEN TECHNOLOGY AND GREEN INDUSTRY IN AFRICA
222
•SkillsupgradingbyRETsupply/marketingcompanies.• AvailabilityoflocalskillsforthedevelopmentofRETs.• ImprovedR&Dfundingforlocalresearchinstitutes.•Demand-drivenR&Dwithahigh likelihoodofgenerating innovativeprod-
ucts and processes.
b) Related government agencies and institutions; Related laws and regulations
Related government agencies and institutions:Ministry of EducationKenya Institute of EducationEnergy Regulatory Commission (ERC)Kenya Institute of Education (KIE) National Industrial Training Authority (NITA) Kenya Renewable Energy Association (KEREA)Public universities – JKUAT, Nairobi University
Related laws and regulations• TheEnergyManagementRegulation2012
Assessment of political feasibility and possibilities for practical implementation A possible obstacle is resistance from aid agencies working in different areas that want to be more visible. There are various training initiatives from the de-velopment sector as well as from public-private partnerships. Some of these are mentioned below.
Further suggestionsThe government could help local RETs researchers improve their research ef-forts and build up capabilities to better meet the immediate need of RET sup-pliers/marketers. Provision for tax deductible R&D expenditures and training grants are particularly important for a programme of training and research ca-pacity building in RETs.

223
Subject 6 Training and Research Capacity in EE
a) Background and contents
Situation and issues: Training in EE has only been offered by KAM-CEEC which claimed to have trained its members and engineering firms in RETs, and to have worked with the Uni-versity of Nairobi (JKUAT) to develop a training curriculum for RETs. Projects implemented by CEEC revealed that there was little appreciation of EE in the private sector. The private sector focused mainly on energy costs and reliabil-ity. Enterprises’ financing of EE projects with ROI were reported to be declining while investing in projects with lower returns. This reflects a lack of familiarity with the concept of EE measures which was noted by the maize processors in-terviewed. The same lack of knowledge is still prevalent in the financial sector. The energy service industry is nearly inexistent as reflected by the fact that very few maize processing firms were aware of the Energy Service Company (ESCO). The register being managed by ERC also reflects the low presence of ESCOs in the country.
Policy recommendations: 1. A dedicated EE public agency should be established to carry out (subsi-
dized) training of electricians and technical professionals.
2. The agency should coordinate with institutions of middle level and higher learning to ensure EE aspects are incorporated into various mechanical and electrical curricula being offered.
3. The government should work with industry to enhance EE capabilities. One method to achieve this would be to allow industry to deduct the costs in-curred in training personnel in EE from profit before tax. This would enable firms with disposable resources to access high level training, which can then circulate in the industry as workers move on.
4. The agency responsible for EE can trace major sourcing destinations of EE technologies and negotiate a knowledge and skill exchange framework.
Benefits: • Improvedprofitabilityforfirms.• SkillsupgradingonEEbymanufacturingfirms.• AvailabilityoflocalskillsforthedevelopmentofEE.•Demand-drivenR&Dwithahigh likelihoodofgenerating innovativeprod-
ucts and processes.
10. CONCLUSIONS AND POLICY RECOMMENDATIONS

DIFFUSION STRATEGy OF GREEN TECHNOLOGy AND GREEN INDUSTRy IN AFRICA
224
b) Related government agencies and institutions; Related laws and regulations
Related government agencies and institutions:• KenyaAssociationofManufacturerCenterforEnergyEfficiency&Conserva-
tion (KAM-CEEC)• EnergyRegulatoryCommission(ERC)• KenyaInstituteofEducation(KIE)•NationalIndustrialTrainingAuthority(NITA)• KenyaRenewableEnergyAssociation(KEREA)
Related laws and regulationsThere is no law or regulation on training and research capacity building in EE.
c) Assessment of political feasibility and possibilities for practical implementation
The Government of Kenya has been encouraging investment in the manufac-turing sector, especially in agro-processing. Investments in R&D have also in-creased through improved funding of public sector research in universities and research institutes. However, the funding has not targeted EE by manufacturing firms. Once the profile of EE in Kenya is raised, it should be possible to intro-duce the proposed measures of training.
Further suggestionsLocal researchers on EE need to be assisted to be able to improve their re-search efforts and meet the immediate need of EE by firms in the maize pro-cessing industry. Provision for tax deductible R&D expenditures and EE training grants are particularly important for a programme of research capacity building in EE by manufacturing firms.
225
rEFErEnCES Acemoglu, D. (2007), Advanced Economic Growth, Lecture notes.
Adeoti, John O. (2002). Building Technological Capability in the Less Developed Countries: The Role of a National System of Innovation; Science and Public Policy, Vol.29, No.2, pp.95-104.
Adeoti, John O. and A.I. Adeoti (2011). “Technological Capability, Innovation Capacity and Agro-industry Development in Nigeria.” African Journal of Science, Technology, Innovation and Development, Vol.3, No.2, pp.80-100.
Adeoti, John O., S.O. Odekunle and F.M. Adeyinka (2010). “Tackling Innovation Deficit: An Analysis of University-Firm Interaction in Nigeria.” Evergreen Publishers, Ibadan, Nigeria.
Adesina A.A and J. Baidu-Forso (1995). “Farmers’ perceptions and adoption of new agricultural technology: Evidence from analysis in Burkina Faso and Guinea, West Africa.” In Agricultural Economics, Iss. 13, pg 1-9.
AfDB (2011). “Fuelling our Strategy Right.” Report on Bio-Energy Consultative Meeting Tunis, April.
AMCEN-AU (2011). “Guidebook-Addressing Climate Change Challenges in Africa”
Arellanes P and D. R. Lee (2003). “The Determinants of Adoption of Sustainable Agriculture Technologies: Evidence from the Hillsides of Honduras.” Paper presented at xxV Conference of International Association of Agricultural Economists; August 2003; Durban, South Africa)
Bernasconi-Osterwalder et al (2013) Chinese Outward Investment: A compilation of primary sources, IISD, 2012.
Besley, T. and A. Case (1993). “Modeling Technology Adoption in Developing Countries”. American Economic Review Papers and Proceedings 83(2) : 396-402.
BICCS, China’s Outward Investment Institutions, Constraints, and Challenges, Asia Paper, Vol. 7 issue no. 4, 2013
Byrne, R., Smith, A., Watson, J. & Ockwell, D. (2011) Energy Pathways in Low-Carbon Development:From Technology Transfer to Socio-Technical Transformation, STEPS Working Paper 46, Brighton: STEPS Centre
Coenen, L, and Lopez, F. (2009). “Comparing systems approaches to innovation and technological change for sustainable and competitive economies: an explorative study into conceptual commonalities, differences and complementarities.” University of Lund.
Darkwah et al, Renewable energy technology, Capacity and R&D in Africa. The Energy Centre, Kumasi National University of Science and Technology. Ghana March 2008
Eberhard & Gratwick, IPPs in Sub Saharan Africa : Determinants of Success, Managment Programme in Insfrastructure Reform & Regulation, 2010
Energy Commission of Nigeria (2005). Renewable Energy Master Plan. Abuja.
Energy Commission of Nigeria, 2009. Renewable Energy Electricity in Nigeria. Retrieved online on 14/7/2013 at http://www.energy.gov.ng/index.php?option=com_docman&task=cat_view&Itemid=&gid=21&orderby=dmdate_published&ascdesc=DESC>
EPIA Global Market Outlook for Photovoltaics 2013-2017
Etim K and A. Oni (2012). “The Energy Regulation and Markets Review: Nigeria.” In Schwartz D. L edition, Published by Law Business Research Ltd, London. Pp. 199 – 358
Eva Dantas (2005). “The System of Innovation Approach, And Its Relevance to Developing Countries.”
FAO/UNIDO (2010). “African Agribusiness and Agro-Industries Development Initiative.” High-level Conference on the development of agribusiness and agro-industries in Africa, 8-10 March, Abuja, Nigeria.
Foundation for Partnership Initiatives in the Niger Delta (PIND) (2011). “A Report on Cassava Value Chain Analysis in the Niger Delta.” 1st Floor St. James Building, 167 Ademola Adetokunbo Crescent, Wuse II, Abuja, Nigeria.

DIFFUSION STRATEGy OF GREEN TECHNOLOGy AND GREEN INDUSTRy IN AFRICA
226
Gikunju & Mosoba (2012). “Massive coal deposits raise hopes and fears for residents.” The Daily Nation Newspaper, 22 September, 2012; The Republic of Kenya, Least Cost Power Development Plan (LCPDP), 2011-2031
Global Wind Statistics (2012). “[GWEC http://www.gwec.net/wp-content/uploads/2013/02/GWEC-PRstats-2012_english.pdf, Accessed 23 July 2013]
Gottesfeld, P. and Cherry C. R (2011) “Lead Emission from Solar PhotoVoltaic Energy Systems in China and India.” Journal of Energy Policy.
Gu, Shulin, J.O. Adeoti, A.C. Castro, J. Orozco and R. Diaz (2012). The Agro-food Sector in Catching-up Countries: A Comparative Study of Four Cases, in Malerba, Franco and R.R. Nelson (eds.). Economic Development as a Learning Process: Variation Across Sectoral Systems, Edward Elgar, Cheltenham UK and Northampton, USA, pp.194-280.
http://dailyfusion.net/2013/04/africas-largest-photovoltaic-plant-opens-6377/ (Accessed on 23 July 2013).
http://www.nrel.gov/csp/solarpaces/by_country.cfm
IEA, (2003). Creating Markets for Energy Technologies.” OECD/IEA, Paris
Ikiara, G.K. (2002) “Rising to the Challenge: Private Sector response in Kenya.” In Seppala, P., Liberalized or Neglected: Food Polices in Eastern Africa, UNU-WIDER, 1998.
International Energy Agency (2010)
International Energy Agency (IEA) (2012)
Jaffe, Adam B., Richard G. Newell, and Robert N. Stavins (2002). “Induced Invention, Innovation, and Diffusion: An Integrated Application to Energy –Saving Technology.” Working paper, Resources for the Future.
Jayne et al (2006). “Stabilizing Food markets in eastern and Southern Africa.” Journal of Food Policy, No. 31 Pages 328–341.
Jayne T.S. et al (2008) “The Effects of NCPB marketing policies on Maize prices in Kenya.” Agricultural Economics Pages 313–325.
Kaplinsky, R., and Mike Morris (2001). “A Handbook for Value Chain Research.” Prepared for the IDRC
Karekezi S., and W. Kithyoma, AFREPREN 2003. “Renewable Energy Development.” Being a paper prepared for a workshop for African Energy Experts on Operationalizing the NEPAD Energy Initiative 2- 4 June, 2003 at Novotel, Dakar, Senegal
Karekezi, S. and W. Kithyoma, 2002. “Renewable Energy Strategies for Rural Africa: is a PV-led renewable energy strategy the right approach for providing modern energy to the rural poor of sub-Saharan Africa?” Energy Policy, 30 (11-12), Special Issue – Africa: Improving Modern Energy Services for the Poor. Oxford: Elsevier Science Limited.
Kemp, R. and M. Volpi (2008). “The diffusion of clean technologies: A review with suggestions for future diffusion analysis.” Journal of Cleaner Production 16 (Supplement 1:): S14-S21.
KenGen 2012 Annual Report
Kenya Industrialization Master Plan Study Report (2007)
Kenya, National Energy Policy (2012)
Kibaara, B. (2005) “Technical Efficiency in Kenya’s Maize Production: The Stochastic Frontier Approach.” Tegemeo Institute of Agricultural Policy and Development.
Kim, Linsu (1997). Imitation to Innovation - The Dynamics of Korea’s Technological Learning, Harvard University Press, Boston MA.
Kiplagat et al (2011) “Renewable Energy in Kenya: Resource Potential and status of exploitation.”
Kirimi et al (2011). “A farm gate-to consumer value chain analysis of Kenya’s maize marketing system.” Department of Agricultural, Food, and Resource Economics, Michigan University, January 2011

227
Lim, S. (2011). “Green Growth: Global Cooperation – The Need for Green Growth in Developing Countries.” National Research Council for Economics, Humanities and Social Sciences, Seoul.
Lundvall, B. (1992). Introduction, in B Lundvall (ed.), National System of Innovation - Towards a Theory of Innovation and Interactive Learning, Pinter Publishers, London.
Malerba, Franco (2002). Sectoral Systems of Innovation and Production, Research Policy, Vol.31, pp.247-264.
Malerba, Franco and R.R. Nelson (eds.) (2012). Economic Development as a Learning Process: Variation Across Sectoral Systems, Edward Elgar, Cheltenham UK and Northampton, USA.
Margaret S. McMillan and Dani Rodrick, National Bureau of Economic Research, June 2011.
Montalvo, C. (2002). Environmental Policy and Technological Innovation. Why Do Firms Adopt or Reject New Technologies? Cheltenham, Northampton, Edward Elgar.
Moser C. M and C. B. Barrett (2003). “The Disappointing Adoption Dynamics of a yield-Increasing, Low External-Input Technology: the Case of SRI in Madagascar.” Agricultural Systems, Vol. 76, pg 1085-1100
Murphy, James T. (2001). Making the energy transition in rural East Africa: Is leapfrogging an alternative? Technological Forecasting & Social Change, Vol. 68, pp. 173–193.
Muyanga et al (2004). “Staple Food Consumption Patterns in Urban Kenya: Trends and Policy Implications.” Working paper 19. Tegemeo Institute of Agricultural Policy and Development, Egerton University.
Mytelka, Lynn K. (1998). Competition, innovation and competitiveness: learning to innovate under conditions of dynamic industrial change, paper for International Conference on The Economics of Industrial Structure and Innovation Dynamics, Centro Cultural de Belem, Lisbon, Portugal, 16-17 October 1998
Neill S.P and D.R Lee (2001). “Explaining the Adoption and Disadoption of Sustainable Agriculture: The Case of Cover Crops in Northern Honduras.” Economic Development of Cultural Change, 49: 793- 820.
Newell S. and Clark P. (1990). “The importance of extra-organizational networks in the diffusion and appropriation of new technologies: The role of professional associations in the USA and UK.” In Knowledge: Creation, Diffusion, Utilization 12–2, pp. 199–212.
Nweke, Felix I., D.S. Spencer, and J.K. Lynam (2001). “The Cassava Transformation: Africa’s Best Kept Secret.” Michigan State University Press, East Lansing.
Nwulu N.I & O.P. Agboola (2011). “Utilizing Renewable Energy Resources to Solve Nigeria’s Electricity Generation Problem.” International Journal of Thermal & Environmental Engineering; 3(1): 15-20
OECD (1989). “The Promotion and Diffusion of Clean Technologies in Industry.”
OECD (1997). “The Measurement of Scientific and Technical activities: Proposed Guidelines for Collecting and Interpreting Technical Innovation data.” (The Oslo Manual), Paris, OECD.
OECD (2011). “OECD Green Growth Studies: Energy” www.oecd.org/greengrowth.
Okoye, J.K.(2007). “Background study on water and energy issues in Nigeria to inform the national consultative conference on dams and development.”
Olwande, J. (2005). “Smallholder maize Production Efficiency in Kenya.” Tegemeo Institute of Agricultural Policy and Development.
REN21 (2011) “Renewables Global Status Report.”
REN21, Renewables, Global Futures Report [taken from REN21]
Renewable Energy Policy Network for the 21st Century (REN21), (2004). “Energy for Development: The Potential Role of Renewable Energy in Meeting the Millennium Development Goals.” Paper prepared for the REN21 Network by The Worldwatch Institute.
Republic of Kenya (2011). “Scaling-up Renewable Energy Programme.” Investment Plan for Kenya.
Republic of Kenya Agricultural Sector Development Strategy Medium-Term Investment Plan: 2010–2015
Rogers, E.M. (1995). “Diffusion of innovations.” (4th ed.). New york: The Free Press.
REFERENCES

DIFFUSION STRATEGy OF GREEN TECHNOLOGy AND GREEN INDUSTRy IN AFRICA
228
Roy, Sumit (2012), China and India-the ‘emerging giants-and Africa‘, Global Policy Essay, http://www.globalpolicyjournal.com/sites/default/files/pdf/Sumit%20Roy%20-%20China,%20India%20and%20Africa.pdf
Sauvant, K.P. (2013) Perspectives on topical foreign direct investment issues by the Vale Columbia Center on Sustainable International Investment No. 106 October 14, 2013.
Sesan T. (2008). “Status of Renewable Energy Policy and Implementation in Nigeria”
Smith, K. (2000). “Innovation as a Systemic Phenomenon: Rethinking the Role of Policy.” Enterprise & Innovation Management Studies, 1 (1), 73-102.
Supe, S.V. (1983). “An introduction to extension education.” New Delhi: Oxford & IBH Publishing Co
Szogs, Astrid, A. Cummings, and C. Chaminade (2011). Building systems of innovation in less developed countries: the role of intermediate organizations supporting interactions in Tanzania and El Salvador, Innovation and Development, Vol.1, No.2, pp. 283–302.
Tadesse, Debay (2010). “The Hydropolitics of the Nile: Climate Change, Water and Food Security in Ethiopia.” In Climate Change and Resource Conflicts in Africa, Institute for Security Studies.
Tan-Mullins, May; Mohan, Giles and Power, Marcus (2010). Redefining ’aid’ in the China–Africa context. Development and Change, 41(5) pp. 857–881.
Taylor, I. (2008) China’s new role in Africa, Lynne Rienner Publishers.
TEC, 2012. Synthesis of submissions received in response to the call for inputs on ways to promote enabling environments and to address barriers to technology development and transfer. United Nations Framework Convention on Climate Change (UNFCCC) - Technology Executive Committee (TEC), Bonn, Germany.
Temel, T., W. Janssel, and F. Karimov (2002). The Agricultural Innovation System of Azerbaijan: An Assessment of Institutional Linkages, ISNAR, The Hague, The Netherlands.
Tessmer, M. (1990). “Environmental analysis: A neglected stage of instructional design.” Educational Technology Research and Development, 38, 1, 55-64.
Tilburg, van, x., Würtenberger L., Coninck H. and Bakker (2011). Paving the way for low-carbon development strategies, ECN.
UNCTAD, (2008). World Investment Report.
UNCTAD (2012). Economic Development in Africa 2012: Structural Transformation and Sustainable Development in Africa.
UNEP, (2010). “Green Economy Developing Countries Success Stories.” www.unep.org/pdf/greenconomy_successstories.
UNEP, 2013. Climate Technology Centre and Network. Online Resource : available http//www.unep.org/climatechange/ctcn/AboutCTCN/tabid/106203/language/en-US/Default.aspx.
UNIDO (2011). “UNIDO Green Industry Policies for supporting Green Industry.” United Nations Industrial Development Organization: Vienna. May.
UNIDO and FAO (2009). “Accelerating Agribusiness and Agro-industries Development in Africa.” Resource Paper for UNIDO/FAO Expert Group Meeting on Agribusiness and Agroindustries Development in Africa. UNIDO: Vienna, 27-29 April 2009.
UNIDO, (2009). “Scaling up Renewable Energy in Africa.” 12th Ordinary Session of Heads of State and Governments of the AFRICAN UNION, Addis Ababa, Ethiopia.
United Nations Environment Programme (2011). “Why a Green Economy Matters for the Least Developed Countries” A joint publication of United Nations Environment Programme (UNEP), United Nations Conference on Trade and Development (UNCTAD), and Office of the High Representative for the Least Developed Countries, Landlocked Developing Countries and Small Island Developing States (UN-OHRLLS) for the LDC-IV Conference in May 2011.
United Nations Framework Convention on Climate Change (UNFCCC), (2008). CDM Statistics. Available at: http://cdm.unfccc.int/Statistics/index.html.

229
United Nations Industrial Development Organization (UNIDO) (2006). “The Presidential Initiative on Cassava.” Ministry of Industry, Trade and Investment.
United Nations Industrial Development Organization (UNIDO), (2009). “Scaling up Renewable Energy in Africa”
United Nations, (2008). “Renewable Energy in Africa: Prospects and Limits) www.un.org
Wangia et al (2002). “Review of Maize marketing in Kenya: Implementation and Impact of Liberalisation, 1989-1999.”
Weick, C.W. (2001). “Agribusiness technology in 2010: directions and challenges.” In Technology in Society, Vol. 23, Issue 1, January 2001, pp. 59–72.
Welsch, M. et al (2013). “Smart and Just Grids for sub-Saharan Africa: Exploring options,” Renewable and Sustainable Energy Reviews 20: 336-352.
Wilkinson, J. & R. Rocha (2009). “Agro-industry trends, patterns and development impacts.” In C. da Silva, D. Baker, A.W. Shepherd, C. Jenane, S. Miranda-da-Cruz (eds.), Agroindustries for Development, Wallingford, UK: CABI for FAO and UNIDO, pp. 46-91.
World Bank, (2007). “Global Economic Prospects – Technology Diffusion in the Developing World.” World Bank, Washington DC.
Wright, H. et al (2013). “Engineering Capacity Needs in SSA.” In Africa Infrastructure Investment Report, Commonwealth Business Council.
www.cgiar.org
www.m-kopa.com/, accessed on 24th September, 2013
Zeller M., Diagne A. and C Mataya (1997). “Market Access by Smallholder Farmers in Malawi: Implications for Technology Adoption, Agricultural Productivity, and Crop Income.” International Food Policy
REFERENCES

DIFFUSION STRATEGY OF GREEN TECHNOLOGY AND GREEN INDUSTRY IN AFRICA
230
APPEndiCESAppendix 3.1: Interview guide for CERD RET experts in Nigeria
• CanyougiveageneraloverviewofRenewableEnergyTechnology(RET)inNigeria?
• WhatpoliciesareongroundonRETinNigeria?
• Whatprogrammesdogovernment,privatesectorandNGOshaveonRETinNigeria?
• WhataretheRETprojectsinthecountry?
• WhatistheRenewableEnergymarketlikeinNigeria–forbiomass,solarPV,andgeothermal?
• WhatisthestateofRETresearchinNigeria?WhatarethescopeandobjectivesofRETresearchinNigeria?
• Aretheresomeimportantbreakthroughs?
• Whatdoesthetotalmarketlooklikebysectors–energycompanies,manufacturingcompanies,private non-industrial companies, government and non-profit organizations, farmers, households and outside of national borders?
• Inthenext5years,whatwilltheRETmarketlooklikeinNigeria?
• WhoandwherearethevariousRETsuppliers?
• WhatarethesourcesofRETinNigeria?Localorforeign?Ifforeign,whichcountriesarethemajorsources and which are the minor?
• ArethereloansandsubsidiesschemesforRETsuppliersinNigeria?
• AredevelopmentpartnersinvolvedinRETdisseminationinNigeria?
• WhataretheprospectsofRETadoptioninNigeriainthevarioussectors?
• WhatarethebarrierstoRETadoptioninNigeria?
• WhatarethepoliciesforthepromotionofRETinNigeria?
• WhataretheinstitutionsestablishedtoencouragetheadoptionofRETinNigeria?
• WhatarethecommonEEmeasuresthatcompaniesadoptinNigeria?
• DowehaveenergyauditingcompaniesinNigeria?Ifyes,wherearethey?
• WhatisthestateofresearchonRETsinNigeria?WhataretheprospectsforlocalinitiativesforRET development?
231
Appendix 4.1: Questionnaire about RET supplier market
KEEI / UNIDO / UNU-MERIT Green Technology in Africa Project
Questionnaire about Renewable Energy Technology (RET) supplier market in Kenya/Nigeria
The broad objective of the study is to analyse the status of awareness and use of energy efficiency measures and renewable energy technologies in cassava value chain in Nigeria (maize value chain in Kenya)
Data/information obtained through this questionnaire would be kept confidential and used only for research purposes
1. The target respondents for this questionnaire are RET suppliers.
2. Only one questionnaire may be administered to a RET company.
3. For each question with options, please tick the appropriate option(s) that fit the respondent’s answer(s).
4. Additional instructions that are specific to questions are provided in parenthesis where appropriate.
Name of Interviewer: Interviewer ID No: Name of Supervisor: Questionnaire ID No:Name of Community: Date of interview:State/region: LGA:Name of respondent:
Designation:
Name and Address of company:
Tel. No.:Email:
REFERENCES

DIFFUSION STRATEGY OF GREEN TECHNOLOGY AND GREEN INDUSTRY IN AFRICA
232
Section 2: General information on your firm
2.1. Please briefly describe your firm’s main industrial or commercial activity. Include examples of your main products, if applicable:
2.2. How many employees did your firm have (full time equivalents) in 2012?
2.3. In what year was your company established?
2.4. Is your firm a subsidiary or part of a parent company? ¨ yes ¨ No
If yes, please give the country of your parent company:
2.5. What was your firm’s sales turnover in 2012?
2.6. What is the nature of the RET business of your company? [tick all options that apply]
¨ Sells RET imported by another company ¨ Imports and sells RET ¨ Imports RETs and distributes to designated projects
Section 3: Types and sources of RETs
3.1. Which of the following technologies are being supplied /offered for sale by your company? (Please tick all that apply)
Solar PV ¨ Wind Power ¨ Biomass ¨ Mini-hydro Others (specify}
3.2. Are you supplying only the technology or an entire package including finance?
¨ We mainly supply the technology ¨ We supply the technology and help with implementation¨ We supply the technology, training and after sales care¨ We supply the technology, training and advise on finance ¨ We provide a complete package, in which finance is arranged for the client
3.3. Is the technology developed with the help of domestic knowledge and technology?
¨ No, it is based on foreign technology only¨ It involves domestic technology to a small degree¨ It involves domestic technology to a large degree¨ It is primarily based on domestic technology
3.4. If the technology is wholly or partially foreign, from which country is the foreign component sourced?

233
3.5. Which country is your most important supplier?
3.6. Has the owner of your company or key personnel previously studied and/or worked abroad? ¨ yes ¨ No
3.7. If yes, to what extent did this assist development of technology, sourcing of inputs, and export sales (if any)?
3.8. Are consultants involved in the development or sourcing of the technology? ¨ yes ¨ No
Is the consulting work done by local people trained in Africa? ¨ yes ¨ No ¨ Partially
3.9. Is the technology a (highly) standardized technology? yes, it is very much standardized It involves a good deal of customization It is highly customized to individual needs (each product we sell is unique)
What does the customization consist of?
3.10. Does your company source the entire product from a foreign supplier? ¨ yes ¨ No If yes, why? (tick all the options that apply)
not available locally due to lack of technological capability available locally but more expensive company policy requires sourcing from foreign supplier
3.11. Does your company source components from foreign suppliers ¨ yes ¨ No If yes, what percentage of the components is of the product (value share)
is sourced from foreign suppliers? _________________ %Has the value ratio changed significantly over the past five years? ¨ yes ¨ NoDo you think it might change significantly over the next five years? ¨ yes ¨ No If yes, by how much? _________________ %
3.12. Does your company source more from foreign suppliers than your local competitors do?
¨ yes, we source more than our competitors do¨ No, most of our competitors source more than we do¨ Our sourcing is about the industry average¨ Don’t know or incapable of the assessmentHas the share of domestic sourcing increased in the last 5 years? ¨ yes ¨ NoIf yes, by what percentage did it increase? from _________________ % to _________________ %
3.13. How does your product compare to that of other companies?
¨ Our product is less expensive than the products of our competitors ¨ Our product is more complex than the products of our competitors ¨ Our product (offering) is special in the following sense:
REFERENCES

DIFFUSION STRATEGY OF GREEN TECHNOLOGY AND GREEN INDUSTRY IN AFRICA
234
Section 4: Clients or users of RETs
4.1. Please provide a breakdown of your sales in 2012 according to the following sectors: % of our sales is to energy companies % of our sales is to manufacturing companies % of our sales is to private non-industrial companies % of our sales is to government and non-profit organizations (hospitals, schools, community centres, etc.) % of our sales is to farmers % of our sales is to households % of our sales is to outside of national borders % of our sales is to _____________________ (state others not mentioned above)
Do you sell to companies in the maize/cassava chain? If yes, which companies are your clients?
4.2. Who is your best client? [here you should ask for the name of the company]
4.3. What percentage of your sales is to companies with less than 50 workers?
4.4. Has this ratio changed significantly over the past five years? ¨ yes ¨ No
4.5. Do you think it might change significantly over the next five years? ¨ yes ¨ No
If yes, by how much? _________________________________________________________________
4.6. Among your clients that have adopted RETs, in what ways do adopters differ from non-adopters? [Please indicate the level of agreement: 1 totally disagree, 2 disagree, 3 agree and 4 totally agree]
¨ Adopters are more technologically sophisticated 1 2 3 4¨ Adopters are faster growing companies 1 2 3 4¨ Adopters have better management and auditing systems 1 2 3 4¨ Adopters are less risk-averse 1 2 3 4¨ Adopters are more green-minded 1 2 3 4¨ Adopters are more internationally oriented 1 2 3 4¨ Adopters are government agencies with interest in RETs 1 2 3 4¨ Adopters are individuals/households requiring stable energy supply 1 2 3 4¨ Others (specify): 1 2 3 4
4.7. Was there a resistance to the adoption of RETs among your clients? (Please tick all that apply)
¨ No - there wasn’t any¨ Some potential adopters were reluctant to buy RETs but later adopted
after appreciating the value of RETs¨ Many companies do not want to buy RETs because they do not appreciate their value¨ Many companies consider RETs inadequate for their energy needs

235
4.8. What are the barriers to adoption of RETs? (Please tick all that apply)
¨ Government’s preference on local equipments¨ High-tariffs on foreign equipments¨ Unfavorable business climate/environment for FDI¨ Lack of technical competence on the part of potential adopters¨ Language / different culture¨ Product offerings from foreign suppliers do not completely fit with needs of African companies¨ Others (specify):
4.9. Is there a resistance to working directly with foreign companies that may assist with RET adoption? (Please tick all that apply)
¨ No - there isn’t any¨ Some companies are reluctant to work directly with foreign companies¨ Many companies do not want to deal directly with foreign companies.
4.10. How may such a resistance be overcome?
4.11. Which government policies act as barriers to assistance on RET adoption from foreign companies?
¨ Import tariffs¨ Subsidy schemes that favour domestic/local technologies¨ Others (specify):
4.12. How important a barrier are these government policies?
¨ Only a minor barrier¨ A major barrier
REFERENCES

DIFFUSION STRATEGY OF GREEN TECHNOLOGY AND GREEN INDUSTRY IN AFRICA
236
Section 5: Technology development
5.1. In the last two years, has your firm collaborated with any of the following organizations? (Please tick all that apply)
¨ Universities ¨ Technology transfer centres ¨ Environmental consultants ¨ Technical institutes ¨ Equipment suppliers ¨ Customers¨ Environmental organisations ¨ Competitors
(Greenpeace, local environmental NGOs, etc)
5.2. Is the collaboration typically provided on an informal basis (without a contract)? ¨ yes ¨ No
5.3. Does your firm engage in research to improve the product?¨ No ¨ yes, occasionally ¨ yes, continuously
If yes, what percentage of sales was spent on product improvement in 2012?
5.4. In the last two years, has the amount spent by your firm on improving your product changed?¨ Increase ¨ No change ¨ Decline
5.5. Which of the following contributed to the development of the RET technology marketed by your company? [tick all options that apply]
¨ Outside supplier or manufacturer of the technology ¨ Our firm’s production workers ¨ Our firm’s technical engineers ¨ Our sales and marketing people¨ Others (Specify)
5.6. Is this technology:
Patented by your firm (or a patent application has been made)? ¨ yes ¨ NoPatented by another firm (or a patent application has been made)? ¨ yes ¨ NoLicensed by your firm to another firm? ¨ yes ¨ No
5.7. How important are the following government programmes to your company?
not used not moderate very important importantResearch and development subsidies ¨ ¨ ¨ ¨ Technology adoption subsidies ¨ ¨ ¨ ¨ Information programmes ¨ ¨ ¨ ¨ Subsidised consultancy ¨ ¨ ¨ ¨
5.8. Please indicate which of the following applies to your firm’s operation:
¨ Maintenance is automatically included in our project offerings ¨ Maintenance is an option for which the client should pay extra¨ It is our policy to recommend a maintenance contract
What percentage of your revenues stems from maintenance?

237
5.9. Do you provide technical support for your clients in the form of training and installation?
¨ yes ¨ No
Is the technical support done by foreign experts ¨ yes ¨ No
If yes, do you expect that in the next 5 to 10 years, local experts from Kenya/Nigeria will be providing the bulk of the technical support? ¨ yes ¨ No
5.10. Do you provide product guarantees? ¨ yes ¨ NoIf yes, what does the guarantee consist of?
Section 6: Finance and markets for RETs
6.1. How helpful to your sales are the following factors?
Feed-in tariff ¨ crucial ¨ helpful ¨ hardly helpful ¨ does not apply (because it does not exist)Exchange rate ¨ crucial ¨ helpful ¨ not helpful ¨ hardly any influenceFossil fuel subsidies ¨ crucial ¨ helpful ¨ not helpful ¨ hardly any influenceOil price volatility ¨ crucial ¨ helpful ¨ not helpful ¨ hardly any influencePower outages ¨ crucial ¨ helpful ¨ not helpful ¨ hardly any influenceAccess to finance ¨ crucial ¨ helpful ¨ not helpful ¨ hardly any influenceNGOs and Aid agencies ¨ crucial ¨ helpful ¨ not helpful ¨ hardly any influence
Subsidies
6.2. Does your product benefit from any of the following subsidies?
Feed-in tariff ¨ yes ¨ No Subsidies from donors ¨ yes ¨ NoClean Development Mechanism ¨ yes ¨ NoImport duty exemptions ¨ yes ¨ NoVAT exemptions ¨ yes ¨ NoSubsidies from World Bank GEF ¨ yes ¨ NoOther subsidies (specify):
6.3. Which of the subsidies is the most important one for your sales?
6.4. Which of the subsidies is the second important one for your sales?
6.5. Which of the subsidies do you expect to change in the coming years? (reduced, eliminated, increased)
REFERENCES

DIFFUSION STRATEGY OF GREEN TECHNOLOGY AND GREEN INDUSTRY IN AFRICA
238
Special financial support provided by your company
6.6. Does your company offer financial support of some sort to your clients? ¨ yes ¨ No
If yes, what does the financial support consist of: ¨ a loan at a normal market price of _______________________________ %¨ a loan at a rate below the normal market rate¨ possibility of payment in various installments
6.7. Do other companies provide similar support? ¨ yes ¨ No
6.8. Do you advise your clients about how to obtain financing from financial institutions or government?
¨ yes ¨ No
6.9. How important to your sales is the loans/special payment arrangement?
¨ extremely important (more than 50% of our deals depends on it)¨ very important (between 25% and 50% of our deals depends on it)¨ fairly important (between 10 and 25% of our deals depends on it)¨ not so important (less than 10 % our deals depends on it)
6.10. With the financial support given by your company and special arrangements (such as micro-finance), does there still exist a finance gap? ¨ yes ¨ No
Market for RET
6.11. In your estimation, what are the total market sales for the product that you are selling (e.g. sales for all solar PV if you are selling solar PV products) in 2012?
6.12. What will be the total expected market sales in 5 years time?
6.13. Do you think the total market sales will be at least 25% higher in 5 years time? ¨ yes ¨ No
6.14. Which positive developments will be responsible for the expected growth?
6.15. Please indicate the expected increase in sales for the following submarkets for the next five years:Expected increase in sales for energy companies: _______________________________ per year Expected increase in sales for manufacturing companies: _________________________ per year Expected increase in sales to government agencies: _____________________________ per year Expected increase in sales for non-profit organizations/NGOs: ____________________ per yearExpected increase in sales to farmers: _________________________________________ per year Expected increase in sales to households: _____________________________________ per year
6.16. In the last two years, have the sales by your firm changed? ¨ yes ¨ No
6.17. If yes, what has been the average annual increase or decrease in sales in the last two years?a) Our sales increased by ___________________ % per year in the last 2 years.
b) Our sales decreased by ___________________ % per year in the last 2 years.
6.18. What are the biggest challenges for the market of your product in the years to come?

239
6.19. What opportunities exist to deal with these challenges?
6.20. Possible government policies Is there a need for technical assistance policies? ¨ yes ¨ No Is there a need for financial aid policies? ¨ yes ¨ No Are there market distortion barriers? ¨ yes ¨ No If yes, how can these be addressed?
6.21. What is the best possible thing that policy makers/government can do to stimulate the market for your product?
6.22. What is the development impact of your product to the local economy? Please indicate the significance of the following impacts (1= little, 5 a great deal):]
Employment creation 1 2 3 4 5Environmental improvement 1 2 3 4 5Spillovers to other sectors 1 2 3 4 5Smaller scale production 1 2 3 4 5Others (specify): 1 2 3 4 5
Other experts with information on renewable energy technology market Which other person can tell us something about the market for the product that you are selling? Name: Company/agency: Tel No.: Email address:
Firms/companies that have adopted renewable energy technology (RET)Which of the firms who has adopted RET would be willing to tell us something about the process of adoption of RET? Name: Company/agency: Tel No.: Email address:
REFERENCES

DIFFUSION STRATEGY OF GREEN TECHNOLOGY AND GREEN INDUSTRY IN AFRICA
240
Appendix 4.2: Questionnaire about adoption of EE and RET in Kenya and Nigeria
KEEI / UNIDO / UNU-MERIT Green Technology in Africa Project
Questionnaire about adoption of energy efficiency measures and RETin agro-industries in Kenya/Nigeria
The broad objective of the study is to analyse the status of awareness and use of energy efficiency measures and renewable energy technologies in cassava value chain in Nigeria (maize value chain in Kenya)
Data/information obtained through this questionnaire would be kept confidential and used only for research purposes
INSTRUCTIONS
1. The target respondents for this questionnaire are cassava/maize processors with on or off-farm cassava/maize processing facility.
2. Where cassava/maize processing firm has more than one plant, this questionnaire should focus on the cassava/maize processing activities within the plant with which the respondent is most familiar.
3. Only one questionnaire may be administered to a cassava/maize processing firm.
4. For each question with options, please tick the appropriate option(s) that fit the respondent’s answer(s).
5. Additional instructions that are specific to questions are provided in parenthesis where appropriate.
Section 1: Identification
Name of Interviewer: Interviewer ID No: Name of Supervisor: Questionnaire ID No:Name of Community: Date of interview:State/region: LGA:Name of respondent:
Designation:
Name and Address of company:
Tel. No.:Email:

241
APPENDICES
Section 2: General information on your firm
2.1. Please briefly describe your firm’s main industrial or commercial activity. Include examples of your main products, if applicable:
2.2. How many employees did your firm have (full time equivalents) in 2012?
2.3. In what year was your company established?
2.4. Current capacity utilisation: …………………………............. %
2.5. Is your firm a subsidiary or part of a parent company? ¨ yes ¨ No
If yes, please give the country of your parent company:
2.6. What was your firm’s sales turnover in 2012?
2.7. What has been the average annual increase or decrease in sales in the last three years?a) Our sales increased by ___________ % per year in the last 3 years.
b) Our sales decreased by ___________ % per year in the last 3 years.
2.8. What were your firm’s average production hours per day in 2012? ___________
2.9. What were your firm’s average production hours per day using power supply from public utilities (PHCN) in 2012?
Section 3: Types of energy efficiency measures adopted
3.1. Did you undertake energy efficiency improvement measures in the last 5 years? ¨ yes ¨ No [If no, Go to Q3.5]
3.2. If yes, did the measures entail purchase of new equipment? ¨ yes ¨ No
3.3. Did the energy efficiency measure(s) benefit from lessons obtained in earlier measure(s)? ¨ yes ¨ NoIf yes, in what way were the earlier measure(s) helpful to others?
3.4. How much higher would your energy consumption be without those measures?
a) Our electricity use would probably be …. higher (as a percentage of total use)b) Our petrol/diesel use would probably be _______ higher (as a percentage of total use)
3.5. What is the share of energy costs in your total costs? _____________________ %

DIFFUSION STRATEGY OF GREEN TECHNOLOGY AND GREEN INDUSTRY IN AFRICA
242
3.6. In what year did your company start to give serious attention to energy efficiency?
3.7. Did you undertake measures to reduce material resource losses? ¨ yes ¨ No 3.8. If yes, what types of measures were introduced?
[here you should anticipate answers such as material recovery system, reducing leakages]
3.9. How much higher is the resource efficiency of your processes? [here they can provide estimates for different materials]
Section 4: Finance of energy efficiency measures
4.1. Did you finance the energy efficiency measures with your own capital? ¨ yes ¨ NoIf yes, what percentage? ______________________________________
4.2. If the energy efficiency measure is not fully financed by your own capital, from which of the following sources did you obtain financial support? [Tick all options that apply]
¨ A commercial bank¨ A development bank with concessionary credit facility ¨ NGOs ¨ Donor organization [which one]: ______________________________________ ¨ World bank/GEF¨ The importer/seller of the energy efficiency technology¨ The consultancy who was involved in the set up/implementation of the energy efficiency measure¨ A financial intermediary ¨ A friend or family relation¨ Others: ______________________________________
4.3. What problems did you encounter in acquiring credit?
4.4. Are projects in energy efficiency and resource efficiency subject to formal investment selection criteria such as maximum payback period or minimum internal rate of return?
¨ No¨ yes, always ¨ yes, but not always (only for high costs projects) ¨ Others:……………………………………………………………………………………..………
4.5. If yes, which is the maximum payback period or minimum internal rate of return that your company uses to evaluate projects? ________________ %
4.6. How important is reducing energy costs for your company?
¨ It is a very important issue for us, which we give attention at the highest level¨ It is something we give attention to ¨ It is of minor importance

243
Section 5: Energy efficiency projects
5.1. Do you have a programme of energy auditing? ¨ yes ¨ No
5.2. Do you have certified energy auditors in your company? ¨ yes ¨ No
5.3. To what extent do you rely on external audits and advice for making energy efficiency (EE) improvements?
¨ We rely primarily on external advice for making energy efficiency improvements ¨ Our internal energy programme is the main source of knowledge for making energy efficiency
improvements ¨ Both sources are used [here you should indicate if they are equally important or whether one is
more important than the other]
5.4. Which of the projects in energy efficiency (EE) that your company has undertaken was the most successful? [please make sure to determine whether this was a new technology project or a process adaptation]
5.5. Which of the following categories describes the project best [Tick all options that apply]:
¨ Good housekeeping ¨ Substitute energy carriers¨ Better process control¨ Equipment modification ¨ Technological change (acquisition of new equipment)¨ On-site reuse and recovery of heat¨ Production of useful by-products (e.g., use of low-grade waste heat)¨ Product diversification
5.6. Is the energy efficiency project specific to your sector, or can they be used across sectors?¨ It is specific to our sector ¨ it can be used in other sectors as well¨ Others:
5.7. Which of the following organizations were involved in the project? [please tick relevant categories and ask for their names]
¨ Equipment provider, namely ¨ Consultancy, namely¨ Energy research centre, namely ¨ A government agency, namely¨ A university/public research institute, namely ¨ Others:
5.8. In what way was the EE project successful?
5.9. Approximately how much energy was being saved: ________ % [here you should ask about the energy source or form of energy which was saved, e.g. petroleum or electricity]
APPENDICES

DIFFUSION STRATEGY OF GREEN TECHNOLOGY AND GREEN INDUSTRY IN AFRICA
244
5.10. How important were the co-benefits of the EE project?
¨ They were the primary reason for doing the project¨ They were equally important as the cost-savings from reduced energy use ¨ They were of secondary importance ¨ Others:
5.11. If a consultancy / external adviser was involved in the project, would you have been able to do the project without their involvement?
¨ yes ¨ No ¨ probably not What services did they provide?
5.12. Were you offered an entire package by someone consisting of training, equipment, financing, maintenance and repair? ¨ yes ¨ NoIf yes, which of the following was included in the deal? ¨ training¨ financing¨ maintenance ¨ repair¨ Others:
5.13. Were people of your company trained by anyone for this project? ¨ yes ¨ NoIf yes, who was providing the training?
5.14. Were there areas of technical expertise that you found difficult to source locally? Which ones?
5.15. Was the technology foreign or Kenyan/Nigerian? ¨ The technology was foreign ¨ The technology was partly Kenyan/Nigerian¨ The technology was wholly Kenyan/Nigerian (designed and produced in Kenya/Nigeria)
5.16. Did any of your staff study or work abroad? ¨ yes ¨ No
5.17. If yes, did this influence the decision to engage in EE? In what way(s)? [multiple answers are possible]
¨ They knew about specific options for improving energy efficiency ¨ The choice of technology was heavily influenced by them¨ Others:
5.18. After the introduction of the technology, did you encounter some problems? ¨ yes ¨ No
5.19. If yes, were the problems solved?
¨ yes they were¨ they occasionally came back ¨ we could not solve them completely
5.20. Did you receive support from donors, agencies and government for the EE project? ¨ yes ¨ No

245
5.21. If yes, what forms of support did you get?
5.22. Which support was most important for doing the EE project?
5.23. Were all forms of support helpful? ¨ yes ¨ No
5.24. If No, which support was unhelpful?
5.25. What suggestions do you have for future support actions?
Section 6: We now ask the same questions as in section 5 for least successful project in energy efficiency
6.1. Which of the projects in energy efficiency that your company has undertaken was the least successful?
6.2. Which of the following categories describes the project best [Tick all options that apply]:
¨ Good housekeeping ¨ Substitute energy carriers¨ Better process control¨ Equipment modification ¨ Technological change (acquisition of new equipment)¨ On-site reuse and recovery of heat¨ Production of useful by-products (e.g., use of low-grade waste heat)¨ Product diversification
Was the project implemented in one go, or phased out?
6.3. In what way was it not successful?
6.4. How would you evaluate the project?
¨ as a total failure and waste of money¨ as a partial failure ¨ as [if none of the above answers applies]
6.5. Was the technology foreign or Kenyan/Nigerian? ¨ The technology was foreign. ¨ The technology was partly Kenyan/Nigerian ¨ The technology was wholly Kenyan/Nigerian If (partly) foreign from which country:
APPENDICES

DIFFUSION STRATEGY OF GREEN TECHNOLOGY AND GREEN INDUSTRY IN AFRICA
246
6.6. Were you offered an entire package by someone consisting of training, equipment, financing, maintenance and repair? ¨ yes ¨ No
Which of the following was included in the deal? ¨ training¨ financing¨ maintenance ¨ repair¨ Others:
6.7 Were people of your company trained for this project? ¨ yes ¨ NoIf yes, who was providing the training?
6.8 Were there areas of technical expertise that you found difficult to source locally? Which ones?
Section 7: Energy efficiency advice
7.1. Do you know of successful new companies that specialize in energy efficiency advice? Can you name examples?
7.2. Are there knowledge spillovers from energy efficiency to resource efficiency within your company? ¨ yes ¨ No
7.3. Did you visit a company who had adopted the innovation prior to the decision to adopt (to learn about their experiences)? ¨ yes ¨ No
7.4. Did other companies visit you to learn about your experiences with a particular project in the field of energy efficiency? ¨ yes ¨ No
If yes, how many companies visited you?
What issues were discussed?
7.5. Did this encourage the adoption of similar measures by the companies that visited you?
¨ Not really ¨ Some companies adopted the projects/technologies we discussed with them ¨ Many companies took similar measures after talking to us

247
Section 8: Factors facilitating or restraining adoption of energy efficiency
8.1. Which of the following factors played a facilitating role for energy efficiency adoption measures? [Tick all options that apply]¨ Our in-house knowledge about energy management¨ Technical expertise locally available ¨ Need for cost savings¨ Requirement by parent company¨ Energy regulatory requirement¨ Environmental regulation¨ EE measure adoption by other firm(s)¨ Government incentives for EE measures¨ Advocacy or campaign by environmental NGOs¨ Support from development partners ¨ Others (specify)
8.2. Which of the EE facilitating factors was the most important one?
8.3. Which of the following factors played a restraining role for the adoption of energy efficiency measures? [Tick all options that apply]
¨ High cost of financing the EE project ¨ Uncertainty about the effectiveness of the EE project¨ Lack of technical capability ¨ Lack of information on appropriate EE measures¨ Available EE measures are too complex for our company¨ Lack of support or government incentive for adopting EE measures¨ Others (specify)
8.4. Which of the EE restraining factors was the most important one?
Section 9: Renewable energy use
9.1. What is the quantity of cassava/maize processed by your firm?
9.2. Do you currently use any renewable energy as source of power in your company/firm?
¨ yes ¨ No [If no, Go to Q9.13]
9.3. If yes, what type of renewable energy technology (RET) is being used by your firm? (tick all that apply)
¨ Solar PV ¨ Wind Power ¨ Biomass ¨ Mini-hydro ¨ Others (specify ___________________________ )
9.4. State the year the RETs were adopted:
Solar PV ________ Wind Power ________ Biomass ________ Mini-hydro ________ Others (specify) ________
9.5. For what purpose is the energy from RET used in your firm?¨ Lighting security lamps ¨ Lighting office blocks ¨ Powering ICT equipment (e.g. computers and sensors) ¨ Supplementary power for production equipment
APPENDICES

DIFFUSION STRATEGY OF GREEN TECHNOLOGY AND GREEN INDUSTRY IN AFRICA
248
9.6. How has the use of RET affected your total energy use?¨ Increased ¨ Reduced ¨ Unchanged
9.7. How has the use of RET affected your total energy costs?¨ Higher costs ¨ Lower costs ¨ No significant change in costs
9.8. What factors have facilitated the adoption of RETs by your firm?[Tick all options that apply]
A ¨ Our in-house knowledge about RETsB ¨ Technical expertise locally available C ¨ Need for cost savingsD ¨ Requirement by parent companyE ¨ Energy regulatory requirementF ¨ Environmental regulationG ¨ RET adoption by other firm(s)H ¨ Government incentives for RET adoptionI ¨ Advocacy or campaign by environmental NGOsJ ¨ Support from development partners K ¨ Others (specify)
9.9. Which is the most important factor? ___________________ (specify letter)
9.10. Where is the source of your renewable energy technology (RET) equipment?[Tick only the option that apply]
¨ Locally fabricated technology¨ Combination of local and foreign technology equipment¨ Completely foreign technology equipment
9.11. Please state the country of origin of the foreign component of the RET equipment:
9.12. Mode of foreign RET equipment (technology) acquisition: ¨ Licensing ¨ Open market
9.13. If you have never employed RET in your firm, why have you been unable to use RET?[Tick all options that apply]
A ¨ Lack of information on RETsB ¨ RETs are expensiveC ¨ Lack of technical skillsD ¨ Lack of support or government incentive for RET adoptionE ¨ Available RETs are incapable of meeting my firm’s energy demands F ¨ Others (specify)
9.14. Which is the most important reason for not adopting RET? _________________ (specify letter)
9.15. Are you willing to work with foreign companies that are willing to assist you with RET adoption? ¨ yes ¨ No
9.16. What are the barriers to working with foreign companies? [Tick all options that apply]
¨ Government’s preference on local equipments¨ High-tariffs on foreign equipments¨ Unfavorable business climate/environment for FDI.¨ Our firm lack of technical competence for engaging foreign companies
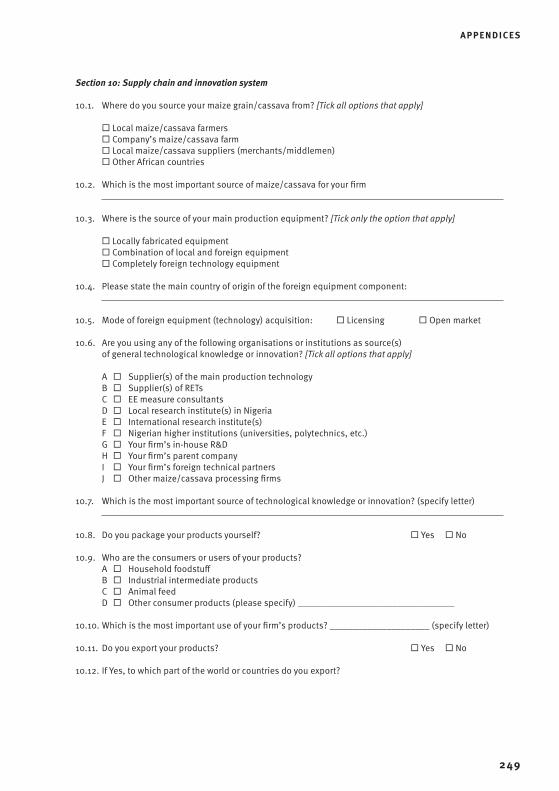
249
Section 10: Supply chain and innovation system
10.1. Where do you source your maize grain/cassava from? [Tick all options that apply]
¨ Local maize/cassava farmers¨ Company’s maize/cassava farm¨ Local maize/cassava suppliers (merchants/middlemen) ¨ Other African countries
10.2. Which is the most important source of maize/cassava for your firm
10.3. Where is the source of your main production equipment? [Tick only the option that apply]
¨ Locally fabricated equipment¨ Combination of local and foreign equipment¨ Completely foreign technology equipment
10.4. Please state the main country of origin of the foreign equipment component:
10.5. Mode of foreign equipment (technology) acquisition: ¨ Licensing ¨ Open market
10.6. Are you using any of the following organisations or institutions as source(s) of general technological knowledge or innovation? [Tick all options that apply]
A ¨ Supplier(s) of the main production technologyB ¨ Supplier(s) of RETsC ¨ EE measure consultantsD ¨ Local research institute(s) in NigeriaE ¨ International research institute(s)F ¨ Nigerian higher institutions (universities, polytechnics, etc.)G ¨ your firm’s in-house R&DH ¨ your firm’s parent companyI ¨ your firm’s foreign technical partnersJ ¨ Other maize/cassava processing firms
10.7. Which is the most important source of technological knowledge or innovation? (specify letter)
10.8. Do you package your products yourself? ¨ yes ¨ No
10.9. Who are the consumers or users of your products?A ¨ Household foodstuff B ¨ Industrial intermediate productsC ¨ Animal feedD ¨ Other consumer products (please specify) _________________________________
10.10. Which is the most important use of your firm’s products? _____________________ (specify letter)
10.11. Do you export your products? ¨ yes ¨ No
10.12. If yes, to which part of the world or countries do you export?
APPENDICES

DIFFUSION STRATEGY OF GREEN TECHNOLOGY AND GREEN INDUSTRY IN AFRICA
250
Appendix 9.1 Potential cooperation projects in Kenya1. Renewable power and energy efficiency investments in the tea industry in Kenya
The tea industry in Kenya is a flourishing industry that is in need of additional power and of reducing the costs of energy for heating. Energy costs constitute 30% of total costs. The industry has 66 factories with a processing capacity of between 4 million to 40 million kilogrammes per annum. Only about 10 have potential for hydro, which is either already constructed or under construction. For the remaining more than 50 factories, KTDA-Power is exploring alternative cost effective sources of REs. Various feasibility studies have already been conducted on wind resources and solar at various factories. REs under consideration: wind, solar and small hydro. Other areas in the tea industry with potential for technology opportunities:
a) Energy efficient wood gasification technologies. According to 2012 annual reports, 38 factories have wood plantations, are in the process of expanding their plantation size or acquiring land for tree planting. Wood is used to provide energy in tea processing, but combustion technologies are largely inefficient. During an interview with KTDA-Power in June 2013, they stated that they were exploring viable wood gasification technologies.
b) Processing equipment factory: KTDA-Power also plans to set up a tea processing equipment factory in Kenya to serve not just Kenya’s industry but the entire eastern Africa region. The factory will also manufacture other agricultural equipment and processing machinery.
c) The following are large private producers of tea that are also in need of similar technologies:ü Unilever Tea Kenya Ltdü James Finlay (Kenya) LtdüWilliamson Tea Kenya Ltdü Eastern Produce Kenya Ltdü 15 other smaller privately owned tea estates with own factories.
Beneficiaries are tea factories that are co-owned by small scale farmers currently facing high energy costs. Excess power sold to the grid would generate income for the factories, easing their financial burden.
1. KTDA publishes out tenders for investment projects in power generation on behalf of its members (tea farmers and producers) across Kenya.
2. Thanks to KTDA and successful projects, the industry has gained credibility in the eyes of local and multilateral financiers, making it possible to implement capital intensive renewable energy projects.
3. From KTDA, vendors of technologies can learn what kind of product offerings the tea industry in different areas are interested in.
4. KTDA is involved in technical training courses and can provide liaison services for training and skills development in electric engineering and gasification.
Key cooperation partner(s) / contactsKTDA-Power is the sectors energy expertise company.KTDA-Power Company LtdKTDA Farmers BuildingMoi Avenue, NairobiTelephone: +254 20 322 7929 or 51www.ktdateas.com

251
APPENDICES
2. LAPSSET Projects (Lamu port South Sudan Ethiopia Transport Corridor Projects)
LAPSSET is a flagship project under Vision 2030 which aims to transform Kenya into a middle income economy by 2030. It is a transport oriented project for airports, roads, rail and oil pipelines connecting not just southern Sudan, Ethiopia and Kenya, but also bridging eastern African countries with the central and western African region. The long term socio-economic impact of the project is considered to be high. The project comprises 7 components, one of which is Resort Cities: Turkana, Isiolo and Lamu at combined investment costs of USD 680 million. The construction of luxury tourist resorts is planned in these cities. To give an idea of the scale of the projects, Isiolo County has been asked by the government to set aside over 6,000 acres for Isiolo Resort City alone (http://allafrica.com/stories/201201060162.html). The gov-ernment has earmarked this project to be developed under the framework of a public-private partnership. The city designs have already been completed and government officials have been selling the project at various investment forums.
Given the locations of these cities, the need for RE technologies is inevitable. Potential RE technologies firms from the Republic of Korea could consider viable opportunities include:
1. Off-grid solar systems – Because these are luxury hospitality establishments, they cannot afford to experience power interruptions from the grid. As such, off-grid solar systems can provide not just reliable energy, but can also be economically viable given the resorts’ economic scale of operations .
2. Biogas systems can be incorporated in the off-grid systems to use waste from kitchens and hotel rooms.
3. Solar water heating systems are another technology that would be required in cases where off-grid systems are considered unattractive for given reasons.
4. Water technologies – these will be vital given that these areas are quite dry. The following water technologies would be crucial:
5. Borehole sinking & purification6. Water recycling technologies
Naturally, it is expected that these resorts will considerably stimulate economic activity in these areas as labour moves in, creating further opportunities for these technologies. See http://www.savelamu.org/wp-content/uploads/2011/08/Lapsset-Executive-Summary.pdf for estimate traffic projections on the corridor, investment estimates and economic analysis of the projects. Investment projects that emerge as opportu-nities created by LAPSSET have been identified. These are:
Beef industry: Communities living in these areas are animal herders and as an attempt to shield them from the dangers of the variable climate that kill huge amounts of animals in dry/flood spells, the government plans to set up a meat plant at Isiolo. The investment will require USD 5.4 million and the plant is expected to be able to process 16,000 heads of cattle in five years’ time.
Mango production and processing plant: The region along the infrastructure corridor is suitable for mango production. A USD 30.2 million mango processing plant is planned within the next five years. The project targets both production and processing.
Sugar factory: Production and processing in the sugar industry at an investment of USD 339 million is planned in the processing of 150,000 MT of sugar annually, generating 30 MW of co-generated electricity.The projects require extensive technological cooperation in areas of:
7. RE generation incorporation in production systems (co-gen, biogas)8. EE technologies9. Large-scale production and processing machinery and equipment.
All three projects are being spearheaded by the Ministry of Agriculture.Beneficiaries: The livelihood of 15 million people who live in the regions to be traversed by the corridor will be improved. These are the coast, eastern region, Rift Valley and northeastern provinces.Benefits: Employment, government revenue, technology transfer and enhancement of Kenya’s technology base, technological spillovers, forward and backward technological and industrial linkages.

DIFFUSION STRATEGY OF GREEN TECHNOLOGY AND GREEN INDUSTRY IN AFRICA
252
Key cooperation partner(s) / contacts : 10. Ministry of Tourism
Utalii House, Off Uhuru Highway, P.O. Box 30027, Nairobi, KENyA Tel: +254-313011, +254-020-313010, +254-020-316849, +254-020-340148 Cellphone: 0710-601103,0735-600444, Email:[email protected], Tweeter: @utaliikenya
11. The Cabinet Secretary, Ministry of Agriculture, Livestock and Fisheries Kilimo House, P.O. Box 30028-00100, NAIROBI, [email protected] http://www.vision2030.go.ke/index.php/pillars/project/macro_enablers/181

253
3. Solar PV panels manufacturing plant
Participation of the private sector in this project is on the basis of Build-Own-Operate (BOO). Its estimated investment is USD 40 million. The location of the plant is to be determined by the investor.
Potential beneficiaries: 1. Kenyan population: employment, deeper technological know-how2. Business community3. Construction industry4. Neighbouring countries.
Key cooperation partner(s) / contactsMinistry of Energy and Petroleum ContactPermanent SecretaryNyayo House 23rd floor, Kenyatta Avenue Nairobi State +254 Kenya [email protected], +254 020 310112, +254 020 2228314, +2540726 993 292 http://www.energy.go.keDetails are available at http://www.energy.go.ke/index.php/more-about-nitrolight
4. Transformer manufacturing factoryThe last several years have seen electricity connectivity in Kenya grow to reach the current 2,000,000 connections. The government aims to maintain this trend over the next 5 years. To attain this objective, an estimated 20,000 transformers are required both for new connections as well as for replacement of old ones over the next 3 years. Similar or larger numbers will be necessary beyond these three years.
To meet this demand for transformers, the government aims to set up a local manufacturing plant. Equally growing demand from neighbouring countries will provide ample market opportunities for the transform-ers. These countries’ connectivity is also projected to rise in coming years.
Participation in this project is on the basis of Build-Own-Operate at a location to be determined by the investor.Its estimated investment is USD 40 million, with a further USD 20 million for production materials within the first year.For details on this project and several others, see http://dosstest.polymita.com/polymitaImages/public/Publications/Investment%20Opportunities/Summary%20of%20Vision%202030%20Investment%20Projects.pdf
Beneficiaries: Kenya and its neighboring countries, electricity agencies and private firmsBenefits: cheaper and reliably energy, employment, government revenue, technology transfer and en-hancement of Kenya’s technology base, technological spillovers, forward and backward technological and industrial linkages
Key cooperation partner(s) / contacts
Ministry of Energy and Petroleum ContactPermanent SecretaryNyayo House 23rd floor, Kenyatta Avenue Nairobi State +254 Kenya [email protected], +254 020 310112, +254 020 2228314, +2540726 993 292, http://www.energy.go.ke
APPENDICES
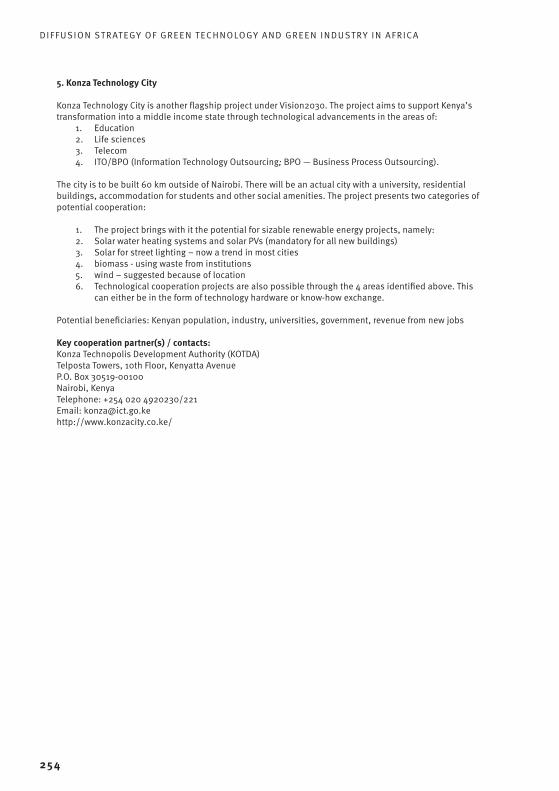
DIFFUSION STRATEGY OF GREEN TECHNOLOGY AND GREEN INDUSTRY IN AFRICA
254
5. Konza Technology City
Konza Technology City is another flagship project under Vision2030. The project aims to support Kenya’s transformation into a middle income state through technological advancements in the areas of:
1. Education2. Life sciences3. Telecom4. ITO/BPO (Information Technology Outsourcing; BPO — Business Process Outsourcing).
The city is to be built 60 km outside of Nairobi. There will be an actual city with a university, residential buildings, accommodation for students and other social amenities. The project presents two categories of potential cooperation:
1. The project brings with it the potential for sizable renewable energy projects, namely:2. Solar water heating systems and solar PVs (mandatory for all new buildings)3. Solar for street lighting – now a trend in most cities4. biomass - using waste from institutions5. wind – suggested because of location6. Technological cooperation projects are also possible through the 4 areas identified above. This
can either be in the form of technology hardware or know-how exchange.
Potential beneficiaries: Kenyan population, industry, universities, government, revenue from new jobs
Key cooperation partner(s) / contacts:Konza Technopolis Development Authority (KOTDA) Telposta Towers, 10th Floor, Kenyatta Avenue P.O. Box 30519-00100 Nairobi, Kenya Telephone: +254 020 4920230/221 Email: [email protected]://www.konzacity.co.ke/
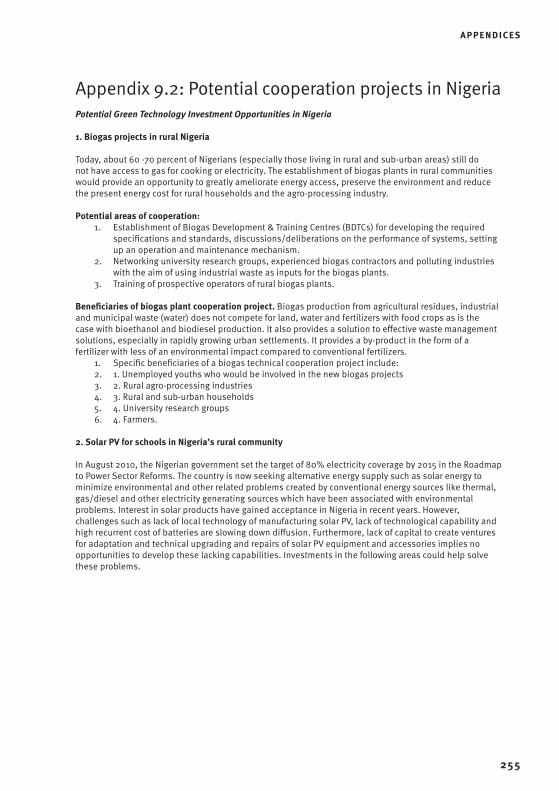
255
Appendix 9.2: Potential cooperation projects in Nigeria Potential Green Technology Investment Opportunities in Nigeria
1. Biogas projects in rural Nigeria
Today, about 60 -70 percent of Nigerians (especially those living in rural and sub-urban areas) still do not have access to gas for cooking or electricity. The establishment of biogas plants in rural communities would provide an opportunity to greatly ameliorate energy access, preserve the environment and reduce the present energy cost for rural households and the agro-processing industry.
Potential areas of cooperation:1. Establishment of Biogas Development & Training Centres (BDTCs) for developing the required
specifications and standards, discussions/deliberations on the performance of systems, setting up an operation and maintenance mechanism.
2. Networking university research groups, experienced biogas contractors and polluting industries with the aim of using industrial waste as inputs for the biogas plants.
3. Training of prospective operators of rural biogas plants.
Beneficiaries of biogas plant cooperation project. Biogas production from agricultural residues, industrial and municipal waste (water) does not compete for land, water and fertilizers with food crops as is the case with bioethanol and biodiesel production. It also provides a solution to effective waste management solutions, especially in rapidly growing urban settlements. It provides a by-product in the form of a fertilizer with less of an environmental impact compared to conventional fertilizers.
1. Specific beneficiaries of a biogas technical cooperation project include:2. 1. Unemployed youths who would be involved in the new biogas projects3. 2. Rural agro-processing industries4. 3. Rural and sub-urban households5. 4. University research groups6. 4. Farmers.
2. Solar PV for schools in Nigeria’s rural community
In August 2010, the Nigerian government set the target of 80% electricity coverage by 2015 in the Roadmap to Power Sector Reforms. The country is now seeking alternative energy supply such as solar energy to minimize environmental and other related problems created by conventional energy sources like thermal, gas/diesel and other electricity generating sources which have been associated with environmental problems. Interest in solar products have gained acceptance in Nigeria in recent years. However, challenges such as lack of local technology of manufacturing solar PV, lack of technological capability and high recurrent cost of batteries are slowing down diffusion. Furthermore, lack of capital to create ventures for adaptation and technical upgrading and repairs of solar PV equipment and accessories implies no opportunities to develop these lacking capabilities. Investments in the following areas could help solve these problems.
APPENDICES
DIFFUSION STRATEGY OF GREEN TECHNOLOGY AND GREEN INDUSTRY IN AFRICA
256
Beneficiaries: General population, public institutions of learning, local industries, RET firms and 60% of rural population with no access to the grid
1. Support for the upgrading of selected RET suppliers to improve local capability for the design and adaptation of solar PV equipment with locally available components in Nigeria. Further research is necessary for the selection criteria and identification of RET suppliers that qualify and possible establishment of technical relationships with foreign solar PV companies. Secondary schools in rural communities could be beneficiaries, especially if public or philanthropic resources are used in the project.
2. Local R&D on the introduction of new technologies into the existing solar power system (e.g. Light Emitting Diode, Solar Portable Lighting (SPL) devices) to assist secondary schools in rural areas.
3. Training and skills upgrading programmes for engineers and technicians from RET companies and public institutions on solar PV and its applications in rural communities. The training programme should also include awareness raising and short-term training for users.
4. Solar panels can be installed by an energy company free of charge and the company will remain the owners of the solar panels for some years. During this period, they will earn income from the government through feed-in-tariff and export tariff initiatives, which currently do not exist in Nigeria.
5. Community based associations can buy the solar panels themselves and get private RET companies to install them or this can also be done by the solar PV supplier.
Key cooperation partner(s) / contacts: 1. State governments.2. Energy Commission of Nigeria (ECN) 3. Energy research institutes4. Nigerian Investment Promotion Council (NIPC)

257
3. Flash dryer project for the cassava processing industry in Nigeria
The use of flash (pneumatic) dryers, mostly manufactured locally, gained prominence in Nigeria’s cassava processing industry immediately after the 2002 Presidential Initiative on Cassava Processing and Export. For instance, an estimated 300,000 metric tonnes of High Quality Cassava Flour (HQCF) is required by flour millers annually in Nigeria to comply with the government’s policy of 10 percent inclusion of cassava flour into wheat flour. Hence, flash dryers have been employed by small, medium and large-sized cassava processing firms to replace the traditional system of open-sun drying. However, a country survey revealed that these dryers are manufactured without serious attention to the issues of energy efficiency and product quality. Exploiting renewable energy in the drying process is also not factored into their fabrication due to the low level of technical know-how in the country.The foregoing issues represent opportunities for adoption and diffusion of energy efficient, cost effective flash dryers with technology levels that fit local contexts. These opportunities can be met by way of techno-logical investments in Nigeria through:
1. Supplying modern energy efficient flash dryers at a subsidized rate to processors – the majority of who are small to medium-sized enterprises.
2. Building the technical skills of local flash dryers’ fabricators to develop their innovative aptitude and reduce the tendency of employing foreign nationals in maintaining imported flash dryers.
3. Encouraging adaptive research and development aimed at upgrading locally manufactured flash dryers.
4. Raising awareness on the need to adopt renewable energy technology and energy efficient mea-sures associated with the use of flash dryers in the cassava processing industry.
Potential beneficiaries: cassava farmers & processors, manufacturers, RET suppliers and EE experts, finan-cial institutions and international donors, universities and research institutes.Key cooperation partner(s) / contacts:
1. Federal Ministry of Agriculture and Rural Development synchronizes agricultural research and approaches its role from a value-chain perspective.
2. National Centre for Agricultural Mechanization provides services such as promotion of adaptive and innovative research towards the development of new machines for local conditions.
3. International Institute of Tropical Agriculture (IITA) has been a major partner in the development of improved flash dryers in the country. A project for an improved flash dryer producing 500 kg/hour of high quality cassava flour did not mature.
4. Universities5. Root and Tuber Expansion Programme (RTEP): This programme is an IFAD-assisted progamme. It
is an off-shoot of the completed Cassava Multiplication Programme whose implementation has placed Nigeria in first position in cassava production worldwide.
6. Federal Institute of Industrial Research (FIIRO): The institute has the broad mandate to acceler-ate industrialization in Nigeria and has developed technologies that have promoted the ideals of entrepreneurship development over the years
7. Deban Faith Agro-Allied Ventures: This firm doubles as a processing and flash dryer manufactur-ing firm.
APPENDICES

DIFFUSION STRATEGY OF GREEN TECHNOLOGY AND GREEN INDUSTRY IN AFRICA
258
Appendix 9.3: Technical cooperation guidelines in Nigeria and Kenya for a technology advanced economy The following section offers general information that can be used to access markets in Africa using exam-ples from Kenya and Nigeria. More specific guidelines are not possible at this stage, as they would depend on the specificities of the investing firm. For instance, guidelines for a firm whose investment requires land acquisition would differ from those of a firm that simply wants to lease out office space or plans to acquire and own premises. Furthermore, land laws differ from country to country. Country regulations differ sig-nificantly from industry to industry. As such, these are best explored once a firm’s investment plans have progressed.
Technical cooperation by technologically advanced economies like the Republic of Korea and its firms could assume any of the forms discussed in Chapter 9, depending on the specific area of cooperation, ca-pacities and specialization of the participants. Whichever approach is adopted, the role of the Republic of Korean Commercial Attaché in the target country is crucial in establishing contact and forging relationships with institutions of learning, the private and public sectors as well as other important bodies, such as regional bodies and development institutions. The Commercial Attaché’s presence in the country enables him/her to keep abreast of economic and political developments, enabling him/her to offer investment guidance to businesses from the Republic of Korea. The Attaché’s office can also rapidly clarify uncertain-ties where necessary prior to the submission of tenders.
Four possible approaches to technical cooperation are discussed below.
1. The national energy agencies
In both countries, the relevant energy agencies publish calls for tenders inviting international bidders to participate. These are evaluated on a competitive basis and are guided by national procurement proce-dures. Calls for tender by these bodies are for government sponsored investment projects and involve cer-tain benefits. For instance, through the government, investors can arrange for risk mitigation instruments from multilateral bodies helping to cushion firms against potential economic, civil and political threats. Another benefit is the possibility to participate in consortia implementing large projects. This is often the case for large projects and allows participating firms to stick to areas they are specialized in. Within a consortium, some negotiations and administration costs could be spread under the umbrella contract.
Firms from the Republic of Korea which have experience with local tendering procedures and project devel-opment could be contacted to share their insights. Examples of such companies are Hyundai Engineering Co in Kenya and HQMC Co in Nigeria. The table below provides a description of national investment and energy agencies as well as their websites.

259
Nigeria
Public Office Description of potential opportunities
1Nigerian Investment Promotion Commission (NIPC)
The Nigerian Investment Promotion Commission (NIPC) encourages, promotes and coordinates investments in the Nigerian economy. The NIPC operates the One Stop Investment Centre (OSIC) which was formal-ly established on 20 March 2006. The Centre was created by the Federal Government in response to the growing interest of investors. The OSIC is an initiative based on an investment facilitation mechanism, where relevant government agencies and ministries are concentrated in one location, coordinated and streamlined to provide efficient and transpar-ent services to investors. http://www.nipc.gov.ng
2. Federal Ministry of Power
The Federal Ministry of Power is the policy making arm of the Federal Government and is responsible for the provision of power in the coun-try. The Ministry is guided by the provisions of the National Electric Power Policy (NEPP) of 2001, the Electric Power Sector Reform (EPSR) Act of 2005, and the Roadmap for Power Sector Reform of August 2010. http://www.power.gov.ng
3.Nigerian National Petroleum Corporation (NNPC)
A Renewable Energy Division (RED) of the NNPC was established in August 2005 to pioneer and coordinate the development of the automo-tive biofuels industry in Nigeria. www.nnpcgroup.com
4.Federal Ministry of Science and Technology
The Ministry supervises research in the areas of biotechnology, space, industrial technology, engineering materials and information technology. http://fmst.gov.ng
5Department of Climate Change – Federal Ministry of Environment
The creation of the department was intended to ensure that environmental matters are adequately mainstreamed into all developmental activities. http://www.climatechange.gov.ng
6Nigerian Electricity Regulatory Commission (NERC)
NERC is an independent regulatory agency which was inaugurated on 31 October 2005 as stipulated in in the Electric Power Sector Reform Act 2005. http://www.nercng.org
APPENDICES

DIFFUSION STRATEGY OF GREEN TECHNOLOGY AND GREEN INDUSTRY IN AFRICA
260
Kenya
1. Kenya Investment Promotion Council (KIPC)
Kenya’s official port of call for all investors providing information on regulations to set up a business in the country.Information on opportunities and investment forums are also available on this site.http://www.investmentkenya.com
2. Ministry of Energy in Kenya
http://www.energy.go.keVarious policy documents relating to the generation of RE can be found on this site. Important documents include the National Energy Policy, Guidelines for Grid Connection of Small Scale Renewables, FiT Policy 2012-Final 14 Dec, FiT Application and Implementation GuidelinesCurrently, there are numerous calls for the supply of RE technologies, including:
1. Wind masts for 100 MW2. Solar technologies for 66 public institutions (schools, hospitals,
government offices in areas with no grid) up to 100 MW3. Natural gas powered plants 700-100 MW
3.
Kenya Electricity Transmission Company (KETRACO), the government agency concerned with expanding the electric grid in the country
Various tenders for the construction of power lines and electrical power stations can be found at
http://www.ketraco.co.ke/tenders/
4.
Kenya Electricity Generation Company (KENGEN), the government agency concerned with power generation in the country. It is partially privatized.
Currently there are various calls for the supply of diverse machinery at geothermal plants.
http://www.kengen.co.ke
2. Local and regional government projects
Both Nigeria and more recently Kenya have decentralized government administration services. This means projects are being implemented at local and regional levels. These are smaller in size and therefore less complex in terms of administration. Potential abounds especially for:
• RE(wastetoenergyprojects,urbanrecyclingwaste,smallhydro),• Communityandindustrialscaleagro-processingprojects• Supporttotechnicalinstitutionsandpolytechniccolleges.
Depending on project size, projects may be suitable for SMEs from the Republic of Korea which are interest-ed in collaborating with local firms. A detailed example from Kenya is available at http://uasingishucounty.org/. The area is Kenya’s grain basket (maize and wheat), produces the country’s world class runners, has its own international airport and more importantly, has ambitious international trade plans.
3. Private sector
Here the opportunities are many, diverse and therefore require different approaches. The approaches include:ü Trade missions that form links with various sectors: In an increasingly globalized world, trade
missions help bridge cultural and psychological distance gaps between countries interested in trade opportunities. The Republic of Korea is currently not very well known in the business circles of SSA countries. One way to change this situation is to organize trade missions that would en-able African business operators to gain insights into what the Republic of Korea can offer in terms
261
of technology and products. The Republic of Korea’s business sector would equally benefit from similar insights and knowledge about business opportunities in SSA. Trade missions (both high level and business-to-business) could therefore help improve the Republic of Korea’s market accessibility and visibility with a high potential to stimulate trade. Technologies, products and expertise from the Republic of Korea need to be matched with the technological needs of African countries, and businesses are best suited to make this match because they know the features of markets well. This can be coupled with a business visa programme that enables entrepreneurs to visit markets without restrictions, particularly major global sourcing destinations popular in SSA such as China, Turkey and Dubai.
ü Businesses’ participation in various public forums and events focusing on energy and other in-vestments. Numerous investment events that focus on Africa take place year round. These forums can prove useful to the Republic of Korea’s business sector since firms can establish contacts and gain deeper insights into the business context on the ground from other investors. Examples are given below:
a. 2nd Annual Africa Investments Summit African investment strategies for Asia’s investors were held on 13 November 2013 in Hong Kong. This provided a good introduction to understand-ing how to invest in Africa, what type of investments are sought, etc. Details are available at http://www.expogr.com/kenyaenergy/
b. This consultancy firm http://www.energynet.co.uk organizes events on energy in Africa where useful contacts can be made.
c. Africa Hotel Investment Forum. . The hotel industry in SSA offers tremendous potential for RET investments given the growing inclination by the hotel industry to adopt environmentally friendly approaches to service production. In Kenya, for instance, new hotels being built must have a RET installation in addition to normal electricity connection. The number and size of tourism projects under development across the continent can be attractive for RETs firms (solar, air conditioning, biogas, water treatment, etc.). Furthermore, those located in game reserves and biodiverse areas are increasingly seeking ways to deal with waste. De-tails of this year’s conference can be accessed at http://www.africa-conference.com/index.php/programme/
d. World investment conferences. Information on a conference that focused on North Africa is accessible at http://www.worldinvestmentconferences.com
e. G20 Africa Infrastructure Investment Conference. The Republic of Korea is a member of the G20. Such an event is useful since it brings together governments and private sector and can provide useful insights into which direction governments are moving and how the private sector is responding or is expected to respond. http://corporate-africa.com/Conference.html
f. Viridis Africa 2013 - clean tech investment summit. This summit brought together investors, researchers, entrepreneurs and governments interested in clean tech development in Africa. Future events are posted at http://www.solarplaza.com/event/viridis-africa-2013-clean-tech-investment-summit
g. EMRC is an international organization whose mission is to promote sustainable economic development in Africa through business partnerships with a specific focus on economic and trade relations with the private sector. They focus on agribusiness which always provides for opportunities for technological upgrade. They hold various events to connect the African private sector with counterparts around the world. Past events can be seen here http://www.emrc.be/en/events/past-events.aspx. The Republic of Korea could explore possibilities of an Africa-Republic of Korea chapter of trade missions.
APPENDICES

DIFFUSION STRATEGY OF GREEN TECHNOLOGY AND GREEN INDUSTRY IN AFRICA
262
h. Nigeria Alternative Energy Expo (NAEE). NAEE is designed to enable participants to stay abreast of developments and highlights issues affecting the energy industry, technologies, strategies and policies covering wind, solar, biofuel, hydrocarbon, geothermal, ocean/tidal/wave, agriculture, environment, finance and hydrogen cells in Nigeria. http://www.nigeriaal-ternativeenergyexpo.org.
i. Nigeria Energy and Power Investment Summit (NEPIS): NEPIS brings together policy makers and industry to explore practical issues impacting the Nigeria energy and power sector. The summit places emphasis on the sectoral reform process, and specific policy issues, invest-ment trends, and developments in traditional and renewable energy. http://www.nigeriae-nergyandpower.com
j. African Biofuels Conference and Expo: this conference covers issues relating to the exploita-tion of biofuels for power generation in Africa. www.africanbiofuelsconference.com
k. Power Electric Africa: this is an international power electric and energy technology exhibition and conference organized by Wisebos Global Resources Limited in collaboration with the Nigerian Electricity Regulatory Commission (NERC).
Sending representatives who are able to identify, explore and network to realize investment opportunities, help identify investment trends and open many doors by gaining an in-depth understanding of Africa’s investment environment. Agriculture offers numerous opportunities for energy efficiency, better processing equipment, refrigeration, packaging, etc. There are also numerous large residential and hospitality estab-lishments springing up across the continent. These offer a number of opportunities for reliable modern energy technologies and are likely to be profitable investments due to their size alone
4. Development sectorDevelopment agencies and NGOs can be a valuable avenue for distributing various types of technologies through different programmes. These bodies often require technologies for pilot studies which have the potential to mature in the market. NGOs can buy technologies to support their work at public facilities. Key technologies sought by the development sector include RETs, agro-processing technologies, ICTs and medical technologies useful at community levels in rural areas. This avenue has the advantage of offer-ing the opportunity to test the utility and adaptability of foreign technologies. Feedback on these aspects can then be incorporated into the technology to enhance its use and facilitate further deployment. Some examples from Nigeria are discussed below.
a) BOI/UNDP Access to Renewable Energy Project: This is an intervention project aimed at catalys-ing, promoting and supporting the expansion of renewable energy services for micro, small and medium-scale enterprises’ (SMMEs) to support private sector-led economic development in Nigeria. http://www.atrenigeria.com
b) CREEDS Energy: established in Abuja-Nigeria in the year of UN Sustainable Energy For All, CREEDS Energy is a renewable energy company dedicated to turning clean energy technologies into main-stream applications in households, businesses and communities. http://creedsenergy.com
c) The Council for Renewable Energy in Nigeria (CREN): this is a not-for-profit multi-stakeholder as-sociation which promotes the appropriate use of renewable energy technology in Nigeria and the reduction of greenhouse gases through reduced consumption of fossil fuels. http://www.renewablenigeria.org

263
Appendix 9.4: Examples of UNIDO technical cooperation – Development Aid ModelDevelopment organizations like UNIDO has been engaged in various green technology transfer projects and promoted adoption of renewable energy technology for sustainable development. Here are examples of some projects that UNIDO has been involved with in Africa:
KENYA
Climate change adaption using REP systems for productive sses
This project is divided into three components, each targeting three different sectors in Kenya – industry, public and the local community – to prepare them for climate changes by adapting renewable energy power systems.
1. Industrial EnergyDuration: 2009 – OngoingPartners: UNDP, UNIDOBeneficiaries: 3,000 households.Budget: UNIDO budget allocation of USD 425,000 for setting up one SHP system
Context: Kenya has over 120 tea factories, most of which use firewood to cure the tea they process. Usually, a typical tea factory consumes about 9,000 kg of firewood daily. However, due to increased government scrutiny and strict regulations to protect forest reserves, many factories face closure due to the lack of firewood. This has a negative impact on the livelihoods of Kenya’s population.
Strategy: Aims to reduce dependency on firewood for drying tea in the tea factory. Wood fuel in tea facto-ries will be substituted with electricity from small hydro power (SHP) and solar thermal energy for drying and heating, together with the Ministry of Environment. Mini and small hydro are run-of-the-river power generation systems which have very little environmental impact.
Expected results:- Improving management of forest, water and energy- Reduction of deforestation, prevention of soil erosion and retention of intact soil nutrients – re-
sulting in re-forestation and agro-forestry- Prevention of further environmental degradation- Reduction of fire-wood will result in the reduction of CO2 emissions. Overall, will have a signifi-
cant positive impact on the larger eco system in the Mount Kenya region- Train local experts/technicians in the setting up, running and maintenance of the small hydro
system.
2. Public Utility Energy
Duration: 2009 – OngoingPartners: UNIDO, UNDP, UNEP, Lake Victoria Water Services Board, Homa Bay Municipal Council, KIRDIBudget: UNIDO budget allocation of USD 260,000 for biogas and water purification plantsContext: currently the Homa Bay sewerage system discharges highly contaminated sewerage into Lake Vic-toria. The locals depend on the same lake water for domestic use, even for drinking water, and as a source of fishing. This has caused diseases like cholera which have caused several deaths in the communities.Strategy: instalment of a biogas plant at Homa Bay Sewerage Treatment Ponds to reduce dumping of un-treated sewage into the lake. A 250m3 biogas digester system will use the waste from the municipal ponds of Homa Bay as feedstockfor its anaerobic treatment and use the rest as organic fertilizer.
APPENDICES

DIFFUSION STRATEGY OF GREEN TECHNOLOGY AND GREEN INDUSTRY IN AFRICA
264
Expected results:- Reduce toxicity of water and improve water quality, which will be safer for human consumption- Cleaner water for domestic consumption- Increasing fish catches- Demonstration of the productive value (energy production) of this pilot will provide the incentive
for water services boards to replicate the technology.
3. Household Energy (Community)
Duration: 2009 – OngoingPartners: UNEP, GNDP, Government of Kenya, KIRDIBudget: UNIDO budget allocation of USD 600,000 for the setting up of three Community Power Centres (CPC)
Context: Most of Kenya’s population lives in rural areas, of which about 90 percent lack access to commer-cial energy. Energy security is a prerequisite for sustainable development. Furthermore, energy security in Kenya faces a major challenge since the ongoing rural electrification programme will take several decades to cover most of its village communities. Currently, 85 percent of rural homes use firewood as their main source for cooking fuel. Most of Kenya’s rural community uses kerosene oil for home lighting, resulting in fires and respiratory illness.
Strategy: Renewable sources of energy (biomass briquettes from agricultural waste) will replace wood fuels. This will reduce deforestation. Moreover, energy centres referred to as Community Power Centres (CPC) or “Energy Kiosks” promote the development of micro and small businesses based on renewable energy for alternative livelihoods. CPC will focus on increasing awareness and capacity on climate change adaption at the household level and introduce climate friendly solutions for cooking, lighting and other energy demands. It aims to promote the production and use of biomass briquettes made from agricultural waste, and the usage of energy saving stoves for high fuel efficiency. Kerosene will be replaced with clean rechargeable LED lamps. LED lamps are highly efficient and require very little energy which is environmen-tally friendly and economic. UNIDO has established an Energy Kiosk (2.5 KW) consisting of pico-hydro and solar PV to energize a remote village in Kenya – the produced energy is used to provide productive, com-munication and community services.
Expected results: - Reduced dependence on firewood, resulting in lower deforestation- Reduced indoor kerosene pollution- Creation of income, new employment and wealth creation opportunities for the local population
which could alleviate poverty- Building capacity for local technicians to install and maintain CPC and further educate/train the
village communities- Develop and implement awareness raising programmes for renewable energy utilization by the
community.
Current results:- Energy Kiosk provides 2.5 KW of power consisting of pico-hydro and solar PV to energize a remote
village
NIGERIA
1. Mini-grids based on renewable energy (small-hydro and biomass) sources to augment rural electrifica-tion – access to energy in West Africa
The objective of this project is to develop policy and a favourable market environment to promote renew-able energy based on mini-grids to increase rural electrification and productive uses in Nigeria. The project aims to promote renewable energy, especially in the form of small hydropower and biomass based mini-grids. This project is a technical assistance and capacity development intervention by UNIDO.
Duration: June 2009-December 2014
265
Partners: UNIDO, Federal Ministry of Energy, Energy Commission of Nigeria, and Federal Ministry of Envi-ronment, Housing and Urban DevelopmentBudget: USD 10,027,273
Context: In Nigeria, only 40 percent of the population has access to electricity and the majority of the popula-tion is concentrated in urban areas. In rural areas, less than 20 percent households have access to electricity. Though the country has an affluence of energy resources, the supply and demand gap in the electricity indus-try is considerable – the total installed capacity in Nigeria is below 5,000 MW, but demand is over 15,000 MW. The country has tremendous potential, especially for hydroelectric power and biomass energy. This project is in line with the Federal Government of Nigeria’s policy decisions and national priorities.
Strategy: First, the potential of biomass and small hydro sites for development will be mapped. Subsequent-ly, biomass and SHP based mini-grids will be established for demonstration. Implementation of the pilot projects will be followed by human capacity building, institution building and technology transfers. A rough estimate of the combined potential of SHP and biomass power generation in Nigeria is about 15,734 MW.
Expected results:- Considerable reduction of CO2 emissions in Nigeria and an increase of the energy supply, espe-
cially in rural area- Poverty reduction in the long-run through sustainable and clean development
2. Achieving Universal Energy Access in Nigeria through Sustainable Biomass Exploitation
Ebonyi State and UNIDO: The case of Ebonyi State – UNIDO 32 kW demonstration gasification power plant in Okwo Ngbo, Abakaliki, Ebonyi State, Nigeria. This project is part of South-South cooperation and a demonstration project of a biomass gasifier for a power generation unit being set up at Abakaliki, Nigeria. This project is primarily sponsored by UNIDO and the UNIDO Centre for South-South Industrial Cooperation in India (UCSSIC).
Duration: The idea of the demonstration plant evolved in November 2002 (Jossy Thomas). Started in June, 2009 for 15 monthsPartners: Ebonyi State Government (Nigeria), UNIDO, and UCSSIC, IndiaBudget: USD 389,000 (in cash) and USD 250,000 (in kind)
Context: About 70 percent of the population of Ebonyi State reside in rural areas. The state government rec-ognized that reliable and clean energy supply is necessary for poverty eradication and sustainable devel-opment. This project sought to provide a steady supply of electricity to artisans who were working without electricity. This project was developed as a South-South initiative in the technology transfer of biomass gasification technology, aimed at providing access to clean, reliable and affordable energy for productive purposes. Gasification energy is green and environmentally friendly.
Strategy: up of biomass gasifiers as a source of electricity in chosen communities. It is the first gasification plant in the region. This project aims to promote biomass gasification technologies to replace fossil fuels for electricity production. This will demonstrate the utilization of the most abundantly available biomass in the area to produce energy in response to the acute power challenges Nigeria and Ebonyi State, in particular, face. The Indian Institute of Science, which has been assigned by UCSSIC to carry out the project and which is responsible for the technology transfer, will provide support for the timely implementation of the project.
Results: - The capacity of this demonstration plant is 30 kW. Aims to expand plant capacity to 250 KW
within two years to provide more power to the cluster, as the present capacity makes load man-agement very difficult.
- Community water scheme powered by the gasifier- UNIDO regional ICT centre- Mini energy efficient mills for producing brown rice, polished rice, rice flour, maize and other
grain flour 2.2KW/300-450kg/hr- Provides energy to the community MDG hospital- Street-lighting and the gasifier micro grid system for 15 homes nearby.
APPENDICES


Vienna International Centre · P.O. Box 300 · 1400 Vienna · Austria Tel.: (+43-1) 26026-o · E-mail: [email protected]