manchester green infrastructure strategy
TRANSCRIPT

Manchester Green Infrastructure Strategy Technical Report
1
Manchester Green Infrastructure Strategy
Technical Report
March 2015

Manchester Green Infrastructure Strategy Technical Report
2
Contents
List of figures ............................................................................................................................... 3
List of tables ................................................................................................................................ 4
1. Introduction ................................................................................................................................. 5
Green infrastructure across Manchester ...................................................................................... 6
Background to the Green Infrastructure Strategy ......................................................................... 9
Purpose of this Technical Report ............................................................................................... 10
Building on existing work ........................................................................................................... 11
2. Policy Context ........................................................................................................................... 13
Introduction ............................................................................................................................... 13
Part One: Green Infrastructure Context ..................................................................................... 14
Part Two: Planning and Development Context .......................................................................... 16
3. Benefits of Green Infrastructure ................................................................................................ 19
Economic growth and investment .............................................................................................. 19
Land and property values .......................................................................................................... 20
Labour productivity .................................................................................................................... 21
Tourism ..................................................................................................................................... 22
Products from the land .............................................................................................................. 23
Health and Wellbeing ................................................................................................................ 24
Recreation and leisure ............................................................................................................... 25
Quality of place.......................................................................................................................... 26
Land and biodiversity................................................................................................................. 27
Flood alleviation and management ............................................................................................ 28
Climate change mitigation and management ............................................................................. 30
4. Green Infrastructure in Manchester ........................................................................................... 31
Manchester landscape context .................................................................................................. 31
Bedrock geology ........................................................................................................................ 31
Superficial geology .................................................................................................................... 31
Landform ................................................................................................................................... 31
Green Infrastructure Typology ................................................................................................... 35
Mapping Typology.................................................................................................................. 35
Open Spaces Assessment ........................................................................................................ 39
Mapping Typology.................................................................................................................. 39
Greater Manchester Tree Audit ................................................................................................. 42
Blue infrastructure ..................................................................................................................... 42
5. Spatial Analysis ......................................................................................................................... 45
Introduction ............................................................................................................................... 45
Analysis unit .............................................................................................................................. 45
6. Economic Analysis .................................................................................................................... 59

Manchester Green Infrastructure Strategy Technical Report
3
Introduction – scope of economic benefits and caveats ............................................................. 59
Caveats ................................................................................................................................. 65
Economic growth and investment .............................................................................................. 65
Increased jobs and wider multiplier effects ............................................................................. 66
Land and Property values .......................................................................................................... 67
Commercial and industrial property ........................................................................................ 67
Residential property ............................................................................................................... 71
Visitor attraction and tourism ..................................................................................................... 73
Health and wellbeing ................................................................................................................. 75
Physical activity ..................................................................................................................... 76
Mental health ......................................................................................................................... 80
Summary ................................................................................................................................... 82
Further research ........................................................................................................................ 86
Appendix 1 – Policy Context ......................................................................................................... 90
Part One: Green Infrastructure Context ..................................................................................... 90
Part Two: Planning and Development Context ........................................................................ 111
List of figures
Figure 1. Incised valleys like Boggart Hole Clough are an important focus for green infrastructure in
Manchester. © Tricia Neal (CC BY-SA 2.0) .............................................................................. 6
Figure 2. Bedrock Geology ........................................................................................................... 32
Figure 3. Superficial geology ......................................................................................................... 33
Figure 4. Landform and relief ........................................................................................................ 34
Figure 5. Green Infrastructure Typology ........................................................................................ 38
Figure 6. Open Space Assessment ............................................................................................... 41
Figure 7. Greater Manchester Tree Audit ...................................................................................... 43
Figure 8. Blue infrastructure and flood zones. ............................................................................... 44
Figure 9 Possible analysis units from left to right: Strategic Regeneration Framework Areas;
Electoral Wards; and Lower Super Output Areas ................................................................... 45
Figure 10. Percentage green infrastructure including all categories of Manchester green
infrastructure typology ............................................................................................................ 49
Figure 11. Percentage tree canopy cover ..................................................................................... 51
Figure 12. Buffer of 720m width around natural and semi-natural open space. ............................. 52
Figure 13. Proportion of land surface classified as water body or watercourse. ............................ 52
Figure 14. Index of Multiple Deprivation 10% bands (deciles). ...................................................... 54
Figure 15. Green infrastructure cover over the Index of Multiple Deprivation with red the most
deprived. ................................................................................................................................ 55
Figure 16. Source data for quality calculation ................................................................................ 56
Figure 17. Area weighted mean quality calculated using 300m buffer around open space,
excluding quality scores of zero. ............................................................................................ 57

Manchester Green Infrastructure Strategy Technical Report
4
Figure 18. City and local parks and natural and semi-natural open space over 2 hectares with
300m buffer............................................................................................................................ 58
Figure 19. Green infrastructure investment and economic impacts logic chains (WTP: Willingness
to Pay) ................................................................................................................................... 60
Figure 20. Green infrastructure included within the Baseline and Decrease scenario analysis. Only
green spaces over 2 hectares are used in the analysis. ......................................................... 63
Figure 21. Green and blue infrastructure areas included within the Increase scenario .................. 64
Figure 22. Commercial and industrial property – annual estimated value attributable to green
space proximity scenario assessment .................................................................................... 70
Figure 23. Physical activity scenario analysis showing potential cost savings, 2014 prices. .......... 80
List of tables
Table 1. Scenarios of change ....................................................................................................... 61
Table 2. Floor space and rateable values for commercial and industrial sites in Manchester City
Council boundary ................................................................................................................... 68
Table 3. Potential property value attributable to close good quality green space proximity –
baseline scenario (80% of all green space) ............................................................................ 69
Table 4. Commercial and industrial property – present value over 10 years attributable to green
space proximity scenario assessment .................................................................................... 69
Table 5. Average useable floor space in England and type of dwelling in Manchester .................. 72
Table 6. Potential value of property attributable to green space, £ 2014 – baseline scenario (80%
of green space is of good quality) .......................................................................................... 72
Table 7. Residential property - value attributable to green space proximity scenario assessment, £
2014 (assumed to be in PV already as a premium within property value) .............................. 73
Table 8. How often local populations visit parks (Manchester and UK) ......................................... 77
Table 9. Potential contribution of a public park to exercise ............................................................ 77
Table 10. Potential annual savings, £ 2014 ................................................................................... 79
Table 11. Physical activity scenario analysis, £ 2014 .................................................................... 79
Table 12. Estimated number and relative annual economic and social cost of MCC population with
mental illness, £ millions 2014 ............................................................................................... 82
Table 13. Summary of analysis, Present Values (PV) ................................................................... 85

Manchester Green Infrastructure Strategy Technical Report
5
1. Introduction
Manchester benefits from many different types of green infrastructure including parks, woodlands,
street trees, rivers and canals. The patterns and types of green infrastructure vary across the city
with areas of urban countryside, leafy suburbs and dense urban landscapes. This report presents
analysis of the extent of green infrastructure and evidence of the value of the benefits it provides to
the people and economy of Manchester.
Green infrastructure is defined in Manchester’s Core Strategy as “a network of multi-functional
greenspace. It includes open space, waterways, woodlands, green corridors, green roofs and
trees.”1 This is supported by the definition in the National Planning Policy Framework that green
infrastructure is “a network of multi-functional green space, urban and rural, which is capable of
delivering a wide range of environmental and quality of life benefits for local communities.”2 Green
infrastructure encompasses areas of land and water. Aquatic features such as rivers, canals and
ponds are sometimes referred to collectively as blue infrastructure. Within this study the term
green infrastructure includes aquatic features in recognition of their importance to Manchester. The
river valleys, including incised valleys and broad flood-plains are particularly important to the green
infrastructure network in the City.
High quality green infrastructure is central to creating an attractive, liveable city, helping current
and future residents to enjoy the quality of life expected in a world class city. It has an important
role to play in the creation of residential and working environments in which people choose to live
and invest. It has a specific role to play in helping to improve the health and wellbeing of
Manchester’s residents, consequently improving productivity and reducing dependency. High
quality green infrastructure is therefore essential to Manchester’s plans for growth.
A particular focus of this study is the economic value of green infrastructure in terms of five
benefits3: economic growth and investment; increasing land and property values; labour and land
productivity; tourism; and health and wellbeing. These benefits were identified in the March 2014
report to the Neighbourhood Scrutiny Committee and formed a key focus of the project brief.
1 Manchester City Council, 2012, Manchester's Local Development Framework. Core Strategy Development
Plan Document. 2 Department for Communities and Local Government, 2012, National Planning Policy Framework 3 Manchester City Council, 2014, Manchester Green Infrastructure Strategy: progress update. Report to
Neighbourhood Scrutiny Committee.

Manchester Green Infrastructure Strategy Technical Report
6
Figure 1. Incised valleys like Boggart Hole Clough are an important focus for green infrastructure in
Manchester. © Tricia Neal (CC BY-SA 2.0)
Other key benefits of green infrastructure include mitigation of climate change and extreme
weather events such as flooding; enhanced ecological connectivity; and car-free transport.
Evidence to support these benefits is also included in this report.
Green infrastructure across Manchester
Manchester has been split into six areas. This section describes the green infrastructure within
each area.
North Manchester
20% of the city’s population lives in North Manchester which has one of the highest levels of green
infrastructure in the city. Heaton Park makes up a large part of the green infrastructure resource
and provides important economic and social functions through holding a range of outdoor public
events. It is one of only nine Country Parks in the North West and provides important health and
social functions as well as being a useful educational and recreational resource with sports
facilities and a small farm. The Irk Valley is another key component of North Manchester’s green
infrastructure. It provides an important resource for recreation, exercise and as a green transport
route (walking/cycling) often used by workers. North Manchester is an important residential
location close to the city centre and sustainable transport for this area is important for linking the
two locations. The Irk Valley is an important biodiversity resource which is at the heart of plans to
manage and improve local green infrastructure through the Irk Valley Local Plan. Boggart Hole
Clough is another important location in North Manchester for green infrastructure providing
biodiversity along with easy access and good recreational opportunities to the local population.
The City Centre
Manchester city centre is the focus of commercial, leisure and retail activity in the city and the most
significant employment centre in the north west of England. Given this key function the amount of

Manchester Green Infrastructure Strategy Technical Report
7
green infrastructure within its boundary is limited – about 14% of land use. Most of this is historical
in terms of being laid out early in the development of the Victorian city. It is represented as small
parks and areas of green space along with the canal network, particularly through Castlefield and
Piccadilly, and connects the city centre with the outlying communities, often providing green
transport opportunities. The urban nature of the area makes it difficult to introduce significant
amounts of new green infrastructure at ground level, especially in respect of the projected growth
increases in residential, commercial and educational (particularly research through the
Universities) developments to keep Manchester as a driver of the North West into the future. This
may put increased pressure on existing areas of green infrastructure in terms of access and quality
but also provide opportunity for innovation. Coupled with this is the challenge that climate change
will create in terms of surface water drainage and the urban heat island effect. However, the rivers
and canals that run through Manchester will provide important flood alleviation resources which
may be a significant benefit in such an urbanised area for managing energetic storms associated
with a changing climate. Opportunities to integrate new green infrastructure into the city centre
may require a creative and small scale approach through opportunities such as the canal network,
street trees, green roofs, pocket parks, green walls and other similar and innovative approaches –
such innovative approaches are in line with the ethos and character of Manchester City Centre.
Central Manchester
The green infrastructure resource of Central Manchester comprises mainly private domestic
gardens with further resource associated with Whitworth Park and Birchfield Park, including its
forest garden. Both of the parks provide valuable resources in terms of mature parkland providing
important environmental resources, particularly in Central Manchester where there is a lower
amount of green infrastructure than the rest of the city. What Central Manchester lacks in physical
resource it makes up for in social activity with both parks having active and inclusive Friends
groups providing support and links to the local communities. The parks are well used providing
opportunity for recreation, education and relaxation. The Hulme Community Garden Centre is
another example of an important social asset in this area, providing opportunity for community
training and involvement in future green infrastructure activities. Development and investment in
the area associated with development opportunities including the two Universities, Central
Manchester Foundation Hospital Trust and Manchester Science Park should provide opportunity to
significantly enhance the green infrastructure of Central Manchester. The success of ‘A Tale of
Two Cities’ an application with Liverpool City to the GrowWild initiative from Big Lottery and Kew
Royal Botanical Gardens will see wildflower seeds planted along Princess Parkway improving
biodiversity, enhancing the Manchester gateway and helping local communities to enjoy and
become more involved.
South Manchester
South Manchester is a diverse area reflecting its development and expansion from a series of
smaller settlements. It is the most sought after residential location in Manchester, housing
approximately a third of the Manchester population within easy commuting distance of the city
centre. The high level of green infrastructure (67%) undoubtedly plays a role in this residential
desirability. The green infrastructure of South Manchester makes up 26% of Manchester’s green
infrastructure resource and has the highest amount of green infrastructure of all of the city’s six

Manchester Green Infrastructure Strategy Technical Report
8
areas. Green infrastructure in South Manchester is as diverse as the area itself. It has the highest
number of private gardens and allotments of all of Manchester. There are a number of parks,
including Fletcher Moss and Platt Fields, and sports facilities which provide important recreation,
exercise and social functions for the local community and wider Manchester population. The
presence of the Mersey Valley provides an important biodiversity asset to the area as well as
providing valuable flood alleviation. This may become increasingly valuable, for both the adjacent
communities as well as those up and downstream, as climate change creates more intense rainfall
events. The Mersey Valley provides an attractive and somewhat iconic sense of place to
residential areas including Chorlton and Didsbury. Opportunities for recreation, leisure and green
transport are provided along the banks of the Mersey where pathways are often easily accessible.
Wythenshawe
Wythenshawe has the highest number of Sites of Biological Importance in Manchester.
Wythenshawe also boasts the broadest types of green infrastructure in Manchester, ranging from
parks to heaths, gardens, street trees and sports pitches. These offer a range of benefits from
enhancing the sense and quality of place to offering opportunities for leisure, recreation and
exercise as well as providing more attractive streets which in turn can foster a sense of local pride
and community. There is a developing community interest in local green infrastructure
opportunities with the Real Food Wythenshawe project providing opportunities to educate and
participate in local food growing and consumption. Such projects not only teach people about
growing food but also about healthy eating. They are important for community development and
individual health, wellbeing and participation.
East Manchester
There are important green infrastructure assets in East Manchester – the River Medlock runs
through the area as do the Ashton and Rochdale Canals. As well as providing important flood
alleviation resources, which may be particularly valuable should storm events occur more often
due to the changing climate, these waterways provide important biodiversity resources. They also
present important recreation and leisure opportunities as well as green transport links. These
green transport links are not only between East Manchester and the city centre, as well as the
Etihad Campus, but they also provide a route to populations beyond Manchester. This marks East
Manchester as an important through route and gateway. The Etihad campus provides an excellent
example of large scale development incorporating high quality and functional green infrastructure,
including 2.5 Km of new hedging, 1500 mature trees and 8000M2 of wildflower planting, along with
a SUDs scheme to recycle 8000 M3 of water. East Manchester is one of the most dynamic areas
of Manchester and because of this represents an exciting opportunity for new green infrastructure
and development to create and shape the sense of place and community. The area has the
highest proportion of brownfield sites in Manchester due to its significant post-industrial legacy and
is currently subject to significant development and regeneration. Green infrastructure has a vital
role to play in creating sustainable communities and place for now and the future in East
Manchester.

Manchester Green Infrastructure Strategy Technical Report
9
Background to the Green Infrastructure Strategy
The Manchester Green Infrastructure Strategy builds on Manchester City Council’s existing
commitment to the improvement of the city’s natural environment and progress made over the last
ten years. It draws together existing and new evidence for action, existing policy commitments, and
activities already underway to set out a coordinated framework for action to drive the further
improvement of the quality and functionality of the city’s green infrastructure (GI).
The Strategy is set within the wider policy framework for the city, in particular the new Manchester
Strategy for 2015-2025. This is currently under development, with a focus on the city’s headline
priorities of growth, people and place.
Growth More jobs in Manchester
Growth in key sectors
New homes
Skilled labour market
Improved connectivity and infrastructure
People Fewer people out of work
Improved educational attainment
Health improvements
Fewer Looked After Children
Better early years experience
Place Clean and safe neighbourhoods
Quality green space
Vibrant local areas
Major attractors – sport, culture and shopping
The ability for green infrastructure to deliver multiple social, economic and environmental benefits
to the city is the basis of the green infrastructure policy in the Core Strategy, the key document in
Manchester’s Local Plan. This document also sets out the commitment to produce a Green
Infrastructure Strategy, in order that the full potential of the city’s green infrastructure can be
realised, and that a targeted approach can be developed in support of the city’s wider plans for
growth and regeneration.
The creation of a Green Infrastructure Strategy, based on the value of green infrastructure, and its
importance in contributing to a broad range of social, economic and environmental objectives will
place Manchester among a small but growing number of European and North American cities who
are recognising the value of green infrastructure to:
∂ the creation of economically powerful and liveable cities
∂ the improvement in residents’ health and social wellbeing with the potential for consequent
reductions in dependency

Manchester Green Infrastructure Strategy Technical Report
10
Understanding financial value of green infrastructure will enable the city to develop new models for
investment, based on the ability to quantify added value to planned developments, and the return
on investment that green infrastructure can deliver in its own right.
The strategy can also be used as a tool to secure grant funding and private investment, providing a
firm commitment to improve the city’s green infrastructure, and making clear where resources are
most needed.
Realising the city’s potential for high quality GI will require not only a robust Green Infrastructure
Strategy document in its own right, but the embedding of green infrastructure policies in a range of
other documents: the planned refresh of the Manchester Community Strategy and future reviews
of the Core Strategy and neighbourhood plans.
Implementation will need to be effectively monitored and managed at strategic and neighbourhood
levels, both in order to take advantage of opportunities as they arise and also to ensure that
existing key green infrastructure assets are of the quality needed for a world class, liveable city. A
range of stakeholders – from businesses through to individual residents – all have a key role to
play in continuing to enhance the city’s green infrastructure, as they have been doing successfully
for a number of years. Bringing this activity together within a robust framework, with existing and
new investment mechanisms will ensure that needs and opportunities for new and improved green
infrastructure can be fully realised.
Purpose of this Technical Report
The Manchester Green Infrastructure Strategy consists of the following three documents:
∂ Technical Report
∂ Strategy
∂ Implementation Plan
This Technical Report details the spatial analysis and economic evidence of the benefits of green
infrastructure in Manchester. These have been used to inform the Strategy.
An assessment at the city scale has been made for each of the benefits that form the focus of the
study: Economic growth and investment; Increasing land and property values; Labour and land
productivity; Tourism; Health and wellbeing. This assessment has been based on the available
published evidence, discussion with the Project Steering Group and stakeholder engagement. As
part of this stage of the work, priorities for quantitative assessment and monetary assessment
were identified based on the availability of robust evidence.
Using the Manchester Green Infrastructure Typology, Open Spaces Audit, supplemented with
other published datasets, simple maps have been developed to show the best available data of

Manchester Green Infrastructure Strategy Technical Report
11
current green infrastructure provision. These have provided a baseline against which strategic
options can be tested.
The economic assessment has utilised published evidence to prepare an evidence based for the
socio-economic benefits of green infrastructure in Manchester. Where possible, the assessment
has utilised local evidence to determine the economic value within Manchester. Where local
evidence has not been available, other relevant published evidence has been utilised.
Building on existing work
The Green Infrastructure Strategy does not mark the start of action on green infrastructure in the
city. It does, however, provide the basis for a refreshed approach, one where the economic and
social, as well as environmental benefits, of a quality green infrastructure offer within the city is
fully understood. This section provides a summary of the work to date in the development of a
Manchester Green Infrastructure Strategy by the City Council and key partners.
The city has much experience of investing in its green infrastructure, driven through a range of
initiatives. These include the Biodiversity and Tree Strategies, launched in 2005 and 2006
respectively, the management and delivery of new green infrastructure as part of wider
regeneration plans, and ongoing investment in parks and green spaces, resulting in the highest
number of Green Flag Parks for any local authority area in 2012.
This investment has been built on recognition of the importance of high quality environments in
creating neighbourhoods of choice for the city’s residents, and for attracting new businesses and
investment to the city. A strong understanding has been developed of the biodiversity value of the
city’s green infrastructure over the last decade, but there has not been the same understanding of
the value that this same green infrastructure gives to the economic growth of the City. The need to
increase this understanding is starting to be addressed as part of the preparation of the Strategy.
Local Nature Partnerships (LNP) were introduced in England and Wales, based on the
commitment made in the Natural Environment White Paper. Recognising the importance of LNPs
in terms of their ability to develop and influence local policy and delivery, the City Council
supported the establishment of the Greater Manchester LNP (or Natural Capital Group),, leading to
its formal establishment in December 2012.
During 2012 and into early-2013, the city’s climate change action plan Manchester – A Certain
Future (MACF) was reviewed and updated by the MACF Steering Group. This resulted in the
production of a Manchester Green Infrastructure Strategy being identified as a priority for 2013-15.
During 2013 the City Council undertook further consultation and engagement activity with a wide
range of stakeholders including academics, statutory bodies, special interest groups, and land and
waterways managers. This collaboration established a series of key findings, which the City

Manchester Green Infrastructure Strategy Technical Report
12
Council and partners agreed should be core aspects of the strategy’s content and development. It
was agreed the strategy should:
∂ Support the embedding of green infrastructure into Manchester’s wider policy framework and
strategic planning activities
∂ Begin to establish the business case and mechanisms for investment in green infrastructure
∂ Deliver existing priority projects, and identify new opportunities where green infrastructure can
deliver multiple benefits to the city’s communities
∂ Building on existing structures, develop an expandable network of partners and stakeholders
that will support and enable the delivery of the Green Infrastructure Strategy and associated
action plan
∂ Communicate and engage with the city’s stakeholders on the value of green infrastructure,
developing case studies of best practice from other cities
∂ Establish a robust local evidence base; setting out the range of benefits that green infrastructure
provides in Manchester, including the role that it has to play in supporting Manchester’s wide
range of priorities

Manchester Green Infrastructure Strategy Technical Report
13
2. Policy Context
Introduction
The Policy Context to the Manchester Green Infrastructure Strategy is important in terms of
understanding the policies and strategies that influence green infrastructure internationally/
nationally and sub-regionally; but also to identify at the Manchester and neighbourhood area, the
issues and opportunities for green infrastructure.
Embedding green infrastructure as part of a wider policy framework is key to ensuring that it can
deliver maximum added value to planned activities. The City Council already recognises the critical
role that green infrastructure has to play in contributing to the city’s objectives for growth and
regeneration. The objectives for the Green Infrastructure Strategy include the need to support the
further embedding of green infrastructure into Manchester’s wider policy framework and strategic
planning activities.
The Core Strategy describes the importance of green infrastructure and the need for developers,
the City Council and partners to protect and enhance existing resources, wherever possible. The
five neighbourhood areas that cover the areas outside of the city centre all include recognition of
key green infrastructure assets and their importance in supporting regeneration objectives for their
area. In some areas more detailed plans and projects have also been developed, including the Irk
Valley Local Plan in north Manchester, and the Medlock Valley Project in east Manchester.
The production of a Green Infrastructure Strategy for the city will bolster these existing
commitments and provide more detailed evidence and mechanisms to enable the Council and
partners to translate existing and future policies into delivery.
This chapter of the Technical Report is split into two parts, and is supported by an Appendix. Part
One relates to the Green Infrastructure Context and Part Two identifies the Planning and
Development Context. Whilst there is some overlap between the two, the green infrastructure
context provides directly relevant documents and strategies to green infrastructure, identifying
green infrastructure issues, opportunities and actions. An overarching summary of the implications
of the documents is provided within this report and Appendix 1 provides a summary of the relevant
parts of the documents / strategies themselves and should be read in conjunction with this chapter.
The Planning and Development Context (Part Two) is about understanding the development
context which affects green infrastructure provision. This is through opportunities for new green
infrastructure provision associated with new development but also identifying where new
development is going to be located and therefore where future green infrastructure needs may be
or where existing deficiencies may be exacerbated.

Manchester Green Infrastructure Strategy Technical Report
14
Part One: Green Infrastructure Context
National Context
The principal national documents of relevance to the Green Infrastructure Strategy for Manchester
are:
∂ National Ecosystem Assessment
∂ Natural Environment White Paper (2011)
∂ The Biodiversity Strategy for England
∂ Healthy Lives, Health People White Paper
∂ The EU Water Framework Directive
∂ Report of the Habitats and Wild Birds Directives Implementation Review March 2012
Summary and Manchester green infrastructure Implications
The National Ecosystem Assessment and Natural Environment White Paper combined, represent
a new approach to green infrastructure and in realising its value. This approach of recognising the
values and services that nature provides to society and how this should influence decision making
is an underlying theme influencing the Manchester Green Infrastructure Strategy.
Potential actions to be considered for the Manchester Green Infrastructure Strategy / Action Plan:
∂ Results of the Biodiversity Offset pilots
∂ Role of the Local Nature Partnership in supporting Green Infrastructure provision in Manchester
∂ Consideration of the Payments for Ecosystem Services approach developed as a result of the
White Paper, which identifies that an increased understanding of nature’s value to society and
the economy can help to identify new opportunities to protect and enhance those services cost-
effectively. It is complementary to other approaches rather than replacing other approaches.
The documents considered within this section, including the Biodiversity Strategy and Healthy
Lives, Healthy People White Paper also serve to increase the importance of green infrastructure
within the national policy context. It sets a strong policy context in which to set recommendations
for local action.
Sub-Regional – Greater Manchester
The principal sub-regional documents which impact on green infrastructure provision in
Manchester are:
∂ The Greater Manchester Climate Change Strategy 2011 – 2020
∂ Green Infrastructure Framework (Final Report March 2011). Report Prepared by AGMA for the
Planning and Housing Commission.
Summary and Manchester green infrastructure Implications
The Greater Manchester green infrastructure context is very important as it has three critical
influences on the Manchester Green Infrastructure Strategy:

Manchester Green Infrastructure Strategy Technical Report
15
∂ Provides data, information and analysis that informs the Manchester Green Infrastructure
Strategy
∂ Identifies strategic issues and actions that take the combined impact of Manchester and the
nine other Local Authorities in Greater Manchester but which still may need to be identified and
addressed at the Manchester only level
∂ Identifies potential cross boundary issues, where green infrastructure crosses local authority
boundaries.
Some of the key actions identified at the Greater Manchester scale are:
∂ Protection of carbon sinks
∂ Well co-ordinated green and blue infrastructure network
∂ Integration of green infrastructure into the strategies and programmes of all organisations
working in the growth, sustainability and well-being sectors
∂ Addressing the risk that people and places facing poverty and disadvantage are likely to be
disproportionately affected by climate change
∂ Embedding action on climate change within the Greater Manchester Spatial Framework
∂ Strategic priorities for investment in green infrastructure which have most relevance in Greater
Manchester:
∂ Strategic Green Infrastructure Network with returns on investment in health, access amenity,
biodiversity and tourism
∂ Economic centres and growth points – the quality of the public realm is vital to economic
success, health and well-being and image
∂ Regeneration priority areas with investment being again vital to economic success, health
and well-being and image.
∂ An active travel network – effective management of green infrastructure can support transport
objectives relating to climate change, public health and sustainable neighbourhoods and
public spaces.
∂ Aligning green infrastructure plans with Greater Manchester Surface Water Management
Plans and Flood Risk Plans to manage floods and water quality
Potential approaches to green infrastructure funding identified within the Greater Manchester
Green Infrastructure Framework will also need to be considered in the Manchester Green
Infrastructure Strategy / Implementation Plan. This includes the potential for Greater Manchester to
take forward investment in green infrastructure utilising funding available through the Greater
Manchester Investment Framework.
Manchester
The principal green infrastructure documents and strategies in Manchester are:
∂ Manchester Climate Change Strategy – Manchester: A Certain Future (M:ACF) – Update 2013
∂ Manchester City Council Climate Change Delivery Plan 2010 – 2020
∂ Manchester Biodiversity Strategy (2005)
∂ Manchester Open Space and Recreation Study

Manchester Green Infrastructure Strategy Technical Report
16
∂ Manchester Tree Strategy (2006)
Summary and Manchester green infrastructure Implications
∂ The importance of green infrastructure is clearly embedded in the Climate Change Strategy for
Manchester and there are a number of existing initiatives and successes in protecting and
enhancing the city’s green infrastructure. It is important that the Manchester Green
Infrastructure Strategy references and where appropriate builds on existing initiatives and
partnerships. This includes tree planting, the River Valley projects and research including the
EcoCities, GRABS and i-Trees projects.
∂ The Climate Change Strategy identifies actions for 2013 – 2015 which are directly relevant to
the Green Infrastructure Strategy, informing the brief for the commission, in terms of a better
understanding of the value of the city’s green infrastructure and ensuring the city’s green
infrastructure provides optimal benefits in terms of quality of life, climate change adaptation and
wider social, economic and environmental benefits.
∂ Actions are also identified by regeneration area which should directly feed into actions within the
Manchester Green Infrastructure Strategy and where appropriate, be explored further e.g. the
continued delivery of the Irk Valley Local Plan providing the potential for new development to
incorporate climate change adaptation including provision for growing local food and routes for
walking and cycling.
∂ The City Council has its own Climate Change Action Plan which sets Council priorities and
actions. This includes a commitment to the production of a Green Infrastructure Strategy and
through this, to work with partners to maximise the benefits of the city’s green infrastructure
asset. Other actions include identifying best practice in managing green infrastructure in
response to climate change, supporting the EcoCities project and identifying sustainable and
innovative options to increase the coverage of public green infrastructure in the City, including
supporting the Piccadilly and Oxford Road Corridor public realm developments.
There is a detailed understanding of some of the green infrastructure assets and opportunities in
Manchester through the existing green infrastructure audit and mapping by typology and
documents such as the Biodiversity Strategy, Tree Strategy and Citywide Sport, Open Space and
Recreation Study. The production of the Green Infrastructure Strategy is underpinned by existing
published evidence and an initial assessment of socio-economic value in Manchester. At this stage
it is not the intention to establish a full evaluation or ‘ecosystem services’ assessment, rather
establish a baseline position from which further research and analysis can be undertaken
throughout the life of the strategy.
Part Two: Planning and Development Context
The relevant documents relating to the development context affecting green infrastructure
provision in Manchester are:
∂ National Planning Policy Framework
∂ The devolution context for Greater Manchester
∂ Greater Manchester Growth and Reform Plan (March 2014)

Manchester Green Infrastructure Strategy Technical Report
17
∂ Greater Manchester Strategy (Stronger Together)
∂ Manchester Community Strategy Refresh (2012 – 2015) and emerging Manchester Strategy
2015-2025
∂ Greater Manchester Spatial Framework (emerging)
∂ Manchester Core Strategy
∂ Strategic Regeneration Frameworks
The brief for this project clearly states that the priorities for green infrastructure should be in the
context of the National Planning Policy Framework (NPPF). This is the national planning document
which sets out the Government’s planning policies. There is clear support within the NPPF for the
creation, protection, enhancement and management of networks of biodiversity and green
infrastructure. The NPPF recognises the role of GI in climate change adaptation and minimising
impacts on biodiversity including providing net gains.
The recent announcement of devolution for Greater Manchester has the potential for significant
decision making and funding changes at the Greater Manchester level. This in turn could impact
on some of the ways in which green infrastructure is delivered. Setting green infrastructure in
Manchester within an economic context and value is likely to be helpful in this respect.
The Greater Manchester Spatial Framework also represents a potential change in the way in which
green infrastructure policy is implemented. Whilst green infrastructure is not currently considered
within the scope, it may be widened to include it. Furthermore, the Spatial Framework will
determine the location of future housing and employment land which will have a significant impact
on existing green infrastructure and its deficiencies and opportunities.
The Manchester Core Strategy is a critical document to the Green Infrastructure Strategy for
Manchester for the following reasons:
∂ The Manchester Green Infrastructure Strategy needs to be set within the policy context of the
Core Strategy and assist in the implementation of relevant green infrastructure policies
∂ It identifies where future development is to be located within the city and therefore where
opportunities for future green infrastructure provision are or where new development may
exacerbate existing deficiencies in provision
Policy EN9 of the Core Strategy is the principal Green Infrastructure Policy which includes that
new development should maintain existing green infrastructure and where the opportunity arises,
enhance green infrastructure in accordance with current green infrastructure strategies. The
Manchester Green Infrastructure Strategy will therefore provide detail to how the Policy will be
implemented.
Policy EN8 recognises the role of green infrastructure in addressing climate change and adds
further strength to the requirement for green infrastructure provision. EN11 may be a principal
mechanism for the delivery of new green infrastructure associated with new housing development.
This will be in association with Policy PA1 which relates to planning obligations.

Manchester Green Infrastructure Strategy Technical Report
18
There are a number of policies which set out the expected housing, employment, retail and other
development in the City. This is summarised in Appendix 1, according to each regeneration area
and the City Centre. Key headlines for the Plan Period are:
Housing Employment Retail
City Centre (and
fringe)
16,500 units 33ha (25ha) 70,000m2
comparison
4,500m2
convenience
North
Manchester
11,840 units (20%) 14ha 1,000m2
convenience,
4,000m2 comparison
East
Manchester
18,280 units (30%) 65ha 4,000m2
convenience
1,000m2 comparison
Central
Manchester
8,200 units (14%) 14ha 3,000m2
convenience,
1,500 m2 comparison
South
Manchester
3,240 units (5%) Not expected to
make a significant
contribution to
employment
provision within the
City.
8,000m2
convenience
4,500m2 comparison
Wythenshawe 1,830 units (3%) 55ha 5,000m2
convenience
3,000m2 comparison
The Strategic Regeneration Frameworks for Manchester clearly identify green infrastructure as an
important element of proposals for the future regeneration and improvement of these areas. The
identified green infrastructure proposals and other relevant proposals will directly inform actions
identified within the Strategy.

Manchester Green Infrastructure Strategy Technical Report
19
3. Benefits of Green Infrastructure
Green infrastructure provides economic, social and environmental benefits to people. It can
promote economic growth and encourage investment; increase land and property values; improve
the productivity of the labour force; attract tourists; provides vital products such as food; promotes
healthy active lifestyles; provides opportunities for recreation; enhances the quality of place;
enhance biodiversity; contributes to flood alleviation; and can help to mitigate and adapt to climate
change.
This section of the report summarises a range of key evidence that helps to demonstrate the
benefits of green infrastructure to Manchester. Robust published evidence from regional, national
or international sources have been used to help establish new evidence as to the local benefits of
green infrastructure. Where it has been possible to identify robust local evidence and examples,
this has been used in the summary. A series of local case studies has also been prepared and
forms part of the Strategy document. At this early stage of socio-economic analysis of green
infrastructure at a city scale, this section should be seen as providing a strong base to underpin the
development of the strategy, and the start of the process to develop further evidence and analysis
throughout the life of the strategy.
Economic growth and investment
Green infrastructure is already having an economic impact across Greater
Manchester and there is opportunity to gain further funding to develop this
impact in Manchester
The Natural Economy North West Investment Forum (2013) highlights that 15,000 jobs are directly
linked to, or depend upon, green infrastructure in Greater Manchester. These generate £470m of
GVA for Greater Manchester, £31,000 GVA/ Full Time Equivalent job. The Forum also states that
approximately 60% of the LEP area is green infrastructure; which is a significant asset that cannot
be ignored when looking at developing strategies for growth. It states that green infrastructure
provides a sound business case for investment and wide basis for collaborative working which can
provide additional impact for EU investment.4
Moston Vale, in Harpurhey, North Manchester, is located next to the Central Park business
complex. Formerly the Moston Brook amenity landfill site, the area has been transformed into a
valuable green space with opportunities for sport and informal recreation that enhances the
investment appeal of the area. Initial funding of over £1.7million invested through the Regional
Development Agency’s Newlands programme in 2008 attracted additional grant funding from
Biffaward. It is now managed by the Forestry Commission and creates a quality setting for new
investment.5
4 Natural Economy North West Investment Forum, 2013, The New EU Green Growth Opportunity: Greater Manchester
briefing. p5.
5 Manchester City Council, 2014, Report to Neighbourhoods Scrutiny Committee, 4th March 2014

Manchester Green Infrastructure Strategy Technical Report
20
Green infrastructure encourages economic growth in a number of ways and
at different scales
Investments in green space are thought to improve a region’s image, helping to attract and retain
high value industries, new business start-ups, entrepreneurs and workers. This in turn increases
the scope for levering in private sector investment, reducing unemployment and increasing GVA.
There is evidence (case study specific) that investments in green space have a positive impact on
such constituent components of economic growth and investments as job creation, new business
start-up, and amount of private investments levered in. Investment in green infrastructure in
Manchester should consequently increase local GVA.6
Opportunities for employment and training directly linked to green
infrastructure development are not limited to the environmental sector
Investing in active transport options is also likely to provide employment. Using Baltimore, USA as
a case study, Garrett-Peltier (2010) found that twice as many jobs are created in footpath or cycle
repair or development projects, compared to less labour intensive road repairs or resurfacing
projects. Jobs are likely to be created in a variety of industries benefiting from the development of
footpaths and cycle lanes including construction, engineering, architectural, retail, food and drink
and employment services.7 Such an approach in Manchester, whereby green infrastructure
projects are associated with active travel, could therefore help to increase local job opportunities.
Land and property values
Proximity of green space has a positive impact on property values
Each hectare of green space within 1 km of housing has been estimated to increase house prices
by 0.08%. Moreover, a regional or metropolitan park within 600 m increases total house value
between 1.9 and 2.9%.8 An analysis of all the relevant research (listed) shows that the estimates of
the size of the premium to residential properties vary between under 1% and 19%, though the
majority of estimates fall within the 5% to 10% range (Garrod and Willis, 1992; Garrod, 2002;
Luttik, 2000; Dunse et al., 2007; Luther and Gruehn, 2001; GLA Economics, 2003; CABE, 2004;
2005; Prastholm et al. 2002). Such research demonstrates the potential value of green
infrastructure both to developers and to home owners in Manchester.
Investing in green infrastructure creates a more valuable urban environment
In Berlin in 2000, proximity to playgrounds in residential areas was found to increase land values
by up to 16 per cent. In the same study, a high number of street trees resulted in an increase of 17
per cent in land values.9 In Ancoats in Manchester, the developers, Urban Splash, recognise the
6 Forestry Commission, 2012, Economic Benefits of Green space.
7 Centre for Public Health, 2012, Sustainable Ventures in Public Health – the Economic Benefits of Green Infrastructure
in the North West of England, p11.
8 Forestry Commission, 2012, The Economic Value of Green Space. p10. 9 CABE Space, 2003, The Value of Public Space. p5.

Manchester Green Infrastructure Strategy Technical Report
21
importance of green infrastructure for attracting investment into a long term residential project. The
New Islington development includes the bold creation of a brand new water park; a new arm of
water to link the Rochdale and Ashton Canals. It is a key asset to the local area and has major
social, environmental and economic benefits.10
Increasing property value through green infrastructure investment creates
tax increase returns
By helping to increase the value of homes in this way, parks and other public spaces bring wider
benefits in terms of increased taxes paid to central and local governments for example when
properties are bought and sold.11
Labour productivity
Green space can improve labour productivity through workforce health and
wellbeing
Green working environments have been shown to reduce stress amongst workforces and to
stimulate higher productivity. In addition, higher quality work environments attract and retain higher
calibre staff. Business and commercial areas can be designed or 'retro-fitted' to incorporate strong
green infrastructure – for example, green spaces for employees to take exercise, enjoy fresh air
and a pleasant environment outside of the workplace. Additionally, the health and wellbeing
benefits of access to green infrastructure are well evidenced, with benefits to employees in terms
of personal health and benefits to employers in terms of reduced absenteeism and consequent
costs.12 Such evidence demonstrates the value to Manchester businesses and employers in
investing in green infrastructure around the workplace.
Green infrastructure can develop inclusivity and opportunity in the labour
market
The Natural Economy North West Investment Forum (2013) explains that green infrastructure
projects have a good track record in supporting excluded groups back to work through skills
development, training and practical activity. There are a wide variety of skills and levels of
knowledge needed across the sector, providing opportunities for individuals to find the level that
suits their capabilities. Many organisations in the sector have specialist skills and the support
infrastructure to manage groups such as ex-offenders or those still in prison; long term
unemployed; and those with low or no academic qualifications. Many individuals within these
organisations have moved onto full time jobs, or in many cases, have stayed and progressed
within the organisation, with additional training and personal development.13
10 Manchester City Council, 2014, Report to Neighbourhoods Scrutiny Committee, 4th March 2014 11 CABE Space, 2003, The Value of Public Space. p5. 12 Natural Economy North West, 2009, The Economic Benefits of Green Infrastructure. p25.
13 Natural Economy North West Investment Forum, 2013, The New EU Green Growth Opportunity: Greater Manchester
briefing. p7

Manchester Green Infrastructure Strategy Technical Report
22
Green infrastructure has long term benefits and helps create the workforce of
the future
Natural Economy North West (2009) explains that green infrastructure has been used as a
valuable education resource, and has the potential to improve educational achievement. This will
eventually help to create a better-qualified and more highly skilled workforce, and to bring higher
salaries and more valuable business investment into the region.14
Tourism
Green space can provide unique opportunities to attract new visitors to the
city
A huge range of events take place in public parks and green space, from small local community-
based events, through to those of national importance. The smaller events often assist community
organisations to raise valuable money to support their charitable work. They also generate
localised involvement, with the potential to stimulate interest in community improvement and
cohesion, as well as promoting volunteering opportunities. Larger events generate substantial
sums for the event organisers, releasing huge secondary spend within the host town. Manchester’s
Parks, such as Heaton Park Wythenshawe Park, are attracting tourists and secondary spend to
Manchester, through hosting a number of high profile events, including festivals and theatre
productions.
Manchester’s ‘Dig the City’, a collaboration between Manchester City Council, CityCo and
Manchester Cathedral, delivers a week-long series of gardening events in the city centre. In 2012 it
was calculated that for every pound that was spent to organise the events, ‘Dig the City’ attracted
an additional £2.10 in revenue.15
14 Natural Economy North West, 2009, The Economic Value of Green Infrastructure. p9.
15 Manchester City Council, 2014, Report to Neighbourhoods Scrutiny Committee, 4th March 2014

Manchester Green Infrastructure Strategy Technical Report
23
Urban parks and green spaces can encourage tourism
One recent survey, the London Visitor Survey, conducted annually between 2006 and 2010 across
London, provides strong evidence of the role that London’s green spaces play in attracting both UK
and overseas tourists to London. Data collected from 4,587 visitors to London in 2008 showed that
80% of overseas tourists, 74% of UK staying visitors, 70% of UK day visitors and 77% of London
residents ranked “parks and gardens” as “important” or “very important” in their decision to visit or
take a day trip to London. Indeed, visitors frequently ranked “parks and gardens” as more
important than other options such as “theatre/ music/ arts performances” or “shopping/ markets”.
Satisfaction rates were also generally high, with an average across all groups of 3.92 (with five
equalling ‘excellent’).16 This demonstrates the importance of green infrastructure as part of the
tourism offer in a busy urban environment.
Products from the land
Opportunities to grow food can have health and wellbeing benefits for
communities
Growing Health (2014) describes how regular involvement in gardening or community food
growing projects, or formal horticultural therapy can improve physical health. It can:
∂ Increase overall levels of physical activity and fitness, burn more calories and hence contribute
to healthy weight management and reducing the risk of obesity.
∂ Increase healthy fruit and vegetable consumption, for adults that grow food, and among
schoolchildren participating in food-growing activities at school – as well as improving young
people’s attitudes to healthy eating.
∂ Reduce physical pain, and help with rehabilitation or recovery from surgery or other medical
interventions.
∂ Help people cope with physically challenging circumstances, such as intensive cancer treatment
or learning how to live with chronic conditions such as asthma or severe allergies.17
Using green infrastructure as a place for communities to grow crops can
provide health and education benefits whilst supporting community cohesion
Baguley Buds is a food growing initiative that forms part of the varied activities at Baguley Sure
Start Centre. Located in Manchester’s original garden city, Wythenshawe, the Sure Start centre
had access to underused green space around the building perimeter. It is located in an area of
high multiple deprivation and poor health. Survey data indicates that 21% of the ward’s population
is not in good health (Manchester average 17%; national average 7%) and consumption of at least
5 portions of fruit and vegetables per day was at 19% (Manchester average 21%; national average
30%) (NHS Manchester and Manchester City Council 2011). Baguley has particularly poor access
to shops selling fresh fruit and vegetables within walking distance to people’s homes.18
16 City of London Corporation, 2013, Green Spaces: The benefits for London. p18. 17 Growing Health, 2014, The benefits of gardening and food growing for health and wellbeing. p4. 18 CURE, 2013, Growing Manchester Programme, Final Evaluation Report, p51.

Manchester Green Infrastructure Strategy Technical Report
24
Food growing brings numerous environmental and health benefits. Locally
grown foods can help to reduce carbon emissions and prevent health
problems
A typical allotment plot for growing soft fruits, root vegetables, legumes, leafy greens and alliums
provides a saving of approximately 1.5kg CO2/m2 (Elbourne, 2009). Involvement in growing food
can contribute towards well-being directly, through improving access to and knowledge of food,
increasing physical activity and providing contact with green space, and indirectly, through
developing new skills and aiding inclusion in society. By promoting physical exercise and healthy
eating, community food growing can help prevent problems such as diabetes, heart disease,
obesity, cancer and strokes (NT, 2009).19 Such research demonstrates the value of green
infrastructure to individuals and for public health resources locally.
Health and Wellbeing
Green Infrastructure can provide much needed opportunity and motivation to
increase activity and exercise in the Manchester population
75% of people in our major cities who do not meet recommended levels of exercise say they could
be encouraged to walk more each week. Streets and parks designed to be safer and more
attractive were the most common changes people reported would encourage them to walk more.
Manchester has the highest level of self-reported inactivity, with 66% of respondents failing to
meet recommended levels of exercise. It performs better in comparison to other cities in the
PHO (Public Heath Observatories) data on physical exercise coming in at a similar level to the
national average. Levels of adults with diabetes and obese children were also similar to the
national average, although life expectancy in Manchester was lower than the English average.
In a RIBA Health Check survey Manchester residents showed a preference for safer and more
attractive designs for streets to encourage them to walk more each week. Aesthetics are the
most important for everyone surveyed in Manchester, giving local authorities a clear mandate
to encourage design that is proven to appeal to the local communities.20
Green infrastructure is an essential component in changing people’s
attitudes and enabling a healthier lifestyle
Regular physical activity contributes to the prevention of more than 20 health conditions. People
who are physically active reduce their risk of developing major chronic diseases (heart disease,
stroke, some cancers and type II diabetes) and the risk of premature death. Increasing
participation relies on changing personal attitudes towards physical activity and this will involve
making our environments more conducive for active living. A study from the British Medical Journal
found that residents were three times more active and 40% less obese in areas with higher levels
19 CURE, 2013, Growing Manchester Programme, Final Evaluation Report, p14-15.
20 RIBA, 2013, City Health Check.

Manchester Green Infrastructure Strategy Technical Report
25
of greenery.21 This demonstrates the value of green infrastructure particularly in areas of
Manchester where there are higher levels of inactivity and health problems.
Urban green space quality has a significant impact on the wellbeing of users
The higher the level of species richness that visitors to urban green spaces believe they are
surrounded by, the higher the visitors’ level of perceived wellbeing.22 Improving the quality of
existing green infrastructure in Manchester could therefore have a positive impact on the perceived
wellbeing of local people.
Green Infrastructure can provide essential health infrastructure for the people
of Manchester
A study in Australia has illustrated that parks and other natural environments are a fundamental
health resource, particularly in terms of disease prevention. The initial evidence documenting the
positive effects of nature on blood pressure, cholesterol, outlook on life and stress-reduction has
been sufficient to warrant its incorporation into strategies for the Australian National Health Priority
Areas of ‘mental health’ and ‘cardiovascular disease’.23 Such evidence demonstrating the
importance of green infrastructure in disease prevention can help to inform public health services
in Manchester.
Recreation and leisure
Providing green infrastructure that enables active travel has huge health and
healthcare cost benefits associated with it
In 2007, Cycling England calculated that if by 2015 the number of cycling trips increased by 20%
(returning to 1995 levels), over £500 million could be saved by preventing ill-health, reducing levels
of pollution and decreasing congestion. When looking at the savings made through active travel’s
ability to improve health:
∂ £107 million could be saved by reducing premature deaths
∂ £52 million could be saved by lowered NHS costs
∂ £87 million could be saved by reducing absences from work24
Although national figures, this data does illustrate that cost savings could be made on a more local
scale.
21 CIWEM, 2010, Multi-functional Urban Green Infrastructure – A CIWEM Briefing Paper. p13. 22 Convention on Biological Diversity and Stockholm University, date unknown, 100 Facts about Urban Nature. p2.
23 Deakin University, 2008, Healthy parks, healthy people - The health benefits of contact with nature in a park context. A
review of relevant literature. p2. 24 British Heart Foundation, 2013, The Economic Cost of Physical Inactivity. p7.

Manchester Green Infrastructure Strategy Technical Report
26
Providing people with easy exercise locally can have positive health benefits
and beneficial impacts on life expectancy
While the usual recommendation for physical activity for adults is 30 minutes at least five times a
week, the health benefits of brisk walking begin to be seen at levels well below this level. For
example, a recent study of 400,000 people found that just 15 minutes a day of moderate exercise
(which includes brisk walking) can have significant health benefits, adding up to three years to life
expectancy. Every additional 15 minutes of daily exercise reduced all-cause death rates by a
further 4 per cent.25 Encouraging walking in Manchester through improved, safer green routes
could therefore have significant health benefits for local people.
Small interventions in the built environment can motivate people to exercise
A survey of people in London in 2011 specifically asked what factors would encourage them to
walk more. Responses included new and improved walks for pleasure (74 per cent), knowing that
walking was as quick as the bus for short distances (73 per cent), and if there were more facilities
in the local area (61 per cent).26
Green infrastructure can help to provide children with the opportunity for
leisure time and experiences involving nature
Over recent years, a significant decline in young peoples’ understanding of the natural
environment has been widely reported, particularly in urban areas of industrialised communities
such as Manchester. The culmination of this phenomenon has been described as the ‘extinction of
experience’, whereby children are experiencing nature far less than ever before in history.27
Providing children with green space they can play in is important to their
physical and mental wellbeing and development
Play that involves contact with nature appears to have a positive effect on recovery from stress
and attention fatigue and on mood, concentration, self-discipline and physiological stress (HC
Netherlands 2004). Some preliminary research has also shown that woodland can provide a
sanctuary for both rural and urban children and reduce self-reported stress. Spending time in the
natural environment is important in creating a sense of belonging and identity, which in turn
improves mental health.28
Quality of place
25 C3 Collaborating for Health, 2012, The benefits of regular walking for health, well-being and the environment. p4.
26 C3 Collaborating for Health, 2012, The benefits of regular walking for health, well-being and the environment. p11. 27 RSPB, 2012, Every Child Outdoors – Summary Report. p10.
28 Play England, 2012, A World Without Play: A literature review. p10.

Manchester Green Infrastructure Strategy Technical Report
27
Improving the quality of place is polled as an important factor in motivating
the local population to enjoy and exercise in their local area
The top three changes in Manchester to encourage walking as noted by the RIBA Health Check
public survey are:
∂ More attractive streets and pathways (26%)
∂ More attractive public parks and green spaces (19%)
∂ Safer design of pathways (24%)29
A high quality local environment has social and community benefits which in
turn help to support that environment
High quality green spaces help promote a sense of pride and belonging amongst local residents,
as well as connecting communities by providing places for people to meet and develop informal
support networks. They also help to develop a sense of local ownership which can lead to reduced
anti-social behaviour, such as graffiti and vandalism, creating a safer environment to live in.30
In Manchester, there are a number of examples of green infrastructure projects that have had
social and community benefits. For example, alleyway gating schemes have brought residents
together to ‘green’ their alleyways and help to create safe and attractive environments where
residents can socialise.
Land and biodiversity
Land and biodiversity are fundamental, underpinning the local economy and
green infrastructure
It is important to recognise the value of the natural environment in planning for our future, not least
because of the crucial role it plays in sustaining human life. The natural environment delivers
essential ‘ecosystem services’ (life-support systems) such as the recycling of air and water;
capturing and storing carbon in peat, woodland and soil; flood protection; and waste purification –
along with many others.
The natural environment underpins our economy, providing an enormous range of products and
services worth many billions of pounds to local, regional and national economies. In addition, a
well-planned and managed natural environment is key in shaping the character and quality of
places in which people live and work.31
29 RIBA, 2013, City Health Check.
30 Scottish Environmental Protection Agency, Making the Case for the Environment -green is the new grey.
http://www.sepa.org.uk/making_the_case/air/green_infrastructure.aspx
31 Town and Country Planning Association, 2012, A Good Practice Guide for Green Infrastructure and Biodiversity, p4-5.

Manchester Green Infrastructure Strategy Technical Report
28
Managing biodiversity through green infrastructure is supported by policy
and funding at the European scale
The development of an EU strategy for green infrastructure figures prominently in the EU’s new
post-2010 biodiversity policy. This is because green infrastructure is viewed as being one of the
main tools to tackle threats on biodiversity resulting from habitat fragmentation, land use change
and loss of habitats.
Green Infrastructure will play a decisive role in integrating biodiversity into other policies, such as
agriculture, forestry, water, marine and fisheries, regional and cohesion policy, climate change
mitigation and adaptation, transport, energy and land use policy. It is also an important tool for
existing Directives such as the Water Framework Directive, the Marine Framework Directive,
Environmental Impact Assessment and Strategic Environment Assessment Directives.
In addition, particular attention will be given to strengthening the integration of green infrastructure
aspects in the EU’s various funding programmes (e.g. structural and cohesion funds, CAP, LIFE)
over the current and future financial programming period starting in 2013 and to improving the
ecological coherence of the Natura 2000 Network.32
Valuable biodiversity already exists in our urban landscape, creating the
building blocks for green infrastructure
Back gardens can harbour significant biodiversity: a study of 61 gardens in the city of Sheffield
found 4,000 species of invertebrates, 80 species of lichen, and more than 1,000 species of
plants.33 This shows the importance of gardens as part of Manchester’s green infrastructure
network and the need to consider how high biodiversity gardens can be incorporated within
conversions or new development.
Flood alleviation and management
Green space is a valuable tool to reduce surface run-off and help prevent
flooding in urban areas
Increasing the green space cover in urban areas by 10 per cent reduces surface run-off by almost
5 per cent. Increasing tree cover in urban areas by 10 per cent reduces surface water run-off by
almost 6 per cent. Adding green roofs to all the buildings in town centres can reduce surface water
run-off by almost 20 per cent.34
32 European Commission, 2010, Green Infrastructure Factsheet. p4.
33 Convention on Biological Diversity and Stockholm University, date unknown, 100 Facts about Urban Nature. p1. 34 www.cabe.org.uk/sustainable-places/advice/green-infrastructure-and-flood-risk

Manchester Green Infrastructure Strategy Technical Report
29
Using green infrastructure for flood alleviation and management has
economic as well as environmental value
In Beijing, the water stored in one hectare of urban green area reduces the water runoff and stores
enough water to create an economic benefit equivalent to three-quarters of the maintenance cost
of the city’s green space. 35 In East London the Mayesbrook Climate Change Park Project is
transforming a rundown 48 hectare park into a showcase of how public greenspace can help a
community to adapt to the impacts from climate change. The project was initiated following an
assessment of ecosystems services delivered by the park, and their value, which found that £7 of
benefits will be provided for every £1 invested in restoration of the park. A new 1.5 hectare
floodplain has been created, along with riverside wetlands and woodland planting, and improved
park entrances and facilities. Funding sources for the restoration included an insurance
company36.
The restoration of the River Medlock in East Manchester is the result of an innovative Water
Framework Directive driven collaboration between the City Council, Environment Agency and
Groundwork Trust. The project aims to breathe new life into around 1km of neglected watercourse
and multiple benefits including improved flood defence, water quality and biodiversity value, at the
same time as improving the sense of place and opportunities for communities to engage with the
river.37
Using urban green space to store water helps to manage vegetation on site
reducing irrigation costs
In highly modified catchments, natural ground percolation in the system can be mimicked by
artificially storing large volumes of water in the upper parts of a catchment or in urban green
spaces. This approach also provides more resilience to droughts, as water is conserved on site
where it will sustain vegetation rather than being removed.38
Green infrastructure can mitigate flood risk by slowing and reducing run-off
and storm water discharges.
Increasing green cover by 10% in urban residential areas can reduce run-off from a 28mm rainfall
by almost 5%. Increasing the tree cover by 10% reduces the run-off by almost 6%.39 As
communities develop and grow and climate patterns shift, flood risk mitigation is becoming a
central concern in urban community planning. These mitigating properties of green infrastructure
may therefore represent a key benefit from investment, and can be researched further on both a
site-level and city-wide basis.
35 Convention on Biological Diversity and Stockholm University, date unknown, 100 Facts about Urban Nature. p2
36 ecosystemsknowledge.net/resources/examples/mayesbrook/ 37 Manchester City Council, 2014, Report to Neighbourhoods Scrutiny Committee, 4th March 2014 38 Landscape Institute, 2013, Green Infrastructure Position Statement. p8.
39 Gill, S., Handley, J., Ennos, A. and Pauleit, S. (2007) Adapting cities for climate change: the role of green
infrastructure, Built Environment, 33 (1), 115–133.

Manchester Green Infrastructure Strategy Technical Report
30
Climate change mitigation and management
Well managed green infrastructure is a vital tool in managing air quality
standards
Urban forest and green space management can provide a viable means to naturally ensure good
air quality and help meet clean air standards as required by legislation. For instance, for many
cities in the European Union, the accepted levels of exposure to particulate matter included in the
European Union Ambient Air Quality Directive have proven extremely difficult to comply with.
Improved green infrastructure in urban areas like Manchester can contribute to lower exposure
levels and help meet the standards.40
Interconnected green infrastructure is vital for managing a range of climatic
changes in the city centre and wider urban area
The ASCCUE Project by Manchester University has found that an increase in green areas of 10%
will keep temperatures at or below current temperatures up until the 2080s. GIS and physical
models are being used to plan and designate areas for increasing green space. The ASCCUE
Project recommends that patches of green space are the best matrix to achieve urban cooling.
However, for infiltration and shading a smaller matrix including domestic gardens is more effective,
and for flood prevention linear corridors are best. To help adapt cities like Manchester to climate
change, there needs to be a mix of green space types within the green infrastructure network.41
40 The URBes project, date unknown, Biodiversity and Ecosystem Services: the foundation for human health
and wellbeing. p2. 41 CIWEN, 2010, Multi-functional Urban Green Infrastructure – A CIWEN Briefing Paper. p9.

Manchester Green Infrastructure Strategy Technical Report
31
4. Green Infrastructure in Manchester
This chapter includes maps showing the distribution of green infrastructure across Manchester
Manchester landscape context
Although Manchester is a largely urban landscape it is important to consider the natural character
when planning and designing green infrastructure. The following maps illustrate the geology and
landform that are the primary influences on this character.
Bedrock geology
Figure 2 shows the bedrock geology. The oldest exposed rocks in Manchester are of Westphalian
age (305 to 298 million years old) and these are found in the north-eastern part of the city. The
Carboniferous coal-bearing strata of the South Lancashire Coalfield consist of a succession of
sandstones, siltstones and coal seams. Lower Triassic rocks (248 to 205 million years old) underlie
much of central and southern Manchester. These consist largely of red, yellow and brown
sandstones and mudstones.
Superficial geology
The surface geology in Manchester is dominated by thick deposits of glacial till (Figure 3). The till
was deposited directly by glaciers and includes unsorted mixtures of clay, sand, gravel, and
boulders. There are also pockets of sand and gravel that were deposited in channels beneath the
ice sheets. Around 12,000 years ago the ice sheets melted, releasing large amounts of gravel and
sand. These deposits are mainly concentrated in the river valleys. Glacial meltwater deepened a
number of the river valleys that flow into Manchester and deposited river terraces from the glacial
sediment.
Landform
Manchester is generally a low-lying landscape. (Figure 4) shows an exaggerated view of the
landform that highlights the differences across the city. The main structure of the landform is
defined by the river valleys. In north and east Manchester the valleys are particularly incised and
the resulting sloping land is often associated with woodland. Even in the city centre there are
noticeable slopes leading down to the river valleys. The broad expanse of the River Mersey
floodplain and associated river terraces is a dominant feature between South Manchester and
Wythenshawe.

Manchester Green Infrastructure Strategy Technical Report
32
Figure 2. Bedrock Geology

Manchester Green Infrastructure Strategy Technical Report
33
Figure 3. Superficial geology

Manchester Green Infrastructure Strategy Technical Report
34
Figure 4. Landform and relief

Manchester Green Infrastructure Strategy Technical Report
35
Green Infrastructure Typology
The Green Infrastructure Typology was produced by Manchester City Council in 2013, based upon
a methodology developed by The Mersey Forest. It was produced by processing of Ordnance
Survey MasterMap alongside other datasets, including the Open Space Assessment and the Local
Land and Property Gazetteer (LLPG). Each MasterMap polygon was assigned to one Green
Infrastructure Type.
The main advantage of this dataset is that it gives a broad indication of green infrastructure types
across the whole city. It also includes a very wide range of GI types including gardens associated
with private residences and flats. A key consideration in using the dataset is the over-estimate on
the extent of green infrastructure. For example, all land that is within private property boundaries
not recorded as buildings has been recorded as ‘Private domestic garden’. In most properties
some of the land within the property boundary will be hard surface including parking spaces, patios
and sheds. Further research is needed to estimate the actual percentage of green infrastructure
represented by each of the categories.
Mapping Typology
The definition of the green infrastructure types are shown below. A map of the typology is shown in
Figure 5.
1. Allotment, community garden or urban farm
Allotments are small plots which collectively make up a larger green space. These plots are
available for members of the public to rent for the cultivation of fruit, vegetables and flowers.
Community gardens and urban farms are community-managed projects ranging from wildlife
gardens, to fruit and vegetable plots on housing estates, community polytunnels, to large city
farms. They exist predominantly in urban areas and are often community led projects, created in
response to a lack of access to green space. They combine a desire to encourage strong
community relationships and an awareness of gardening and farming. Most projects provide food-
growing activities, training courses, school visits, community allotments and community
businesses. Dedicated orchards are classified separately.
2. Cemetery, churchyard or burial ground
Land used as burial grounds, including cemeteries and churchyards, usually grass covered with
occasional shrubs and trees.
3. Derelict land
Land which has been disturbed by previous development or land use but is now disused,
underused or abandoned. Waste or derelict land is often re-colonised by processes of natural
succession. Land is classed as derelict whist it is in the early stages of natural succession. As
succession proceeds land that may be officially classified as derelict land by the local authority, will

Manchester Green Infrastructure Strategy Technical Report
36
have a different green infrastructure type e.g. grassland or woodland (or will fall under non green
infrastructure).
4. General amenity space
Usually publicly owned and managed, and always accessible for public enjoyment. Their function
is usually as a green ”landscape backdrop” but their landscape value can sometimes be minimal
because of poor design. They include the ”left over” green spaces within housing and other forms
of development, as well as most road verges. Most commonly, but not exclusively in housing areas
- including informal recreation spaces, green spaces in and around housing, and village greens.
5. Grassland/ heathland/ moorland or scrubland
Grassland which is not agriculturally improved. This could include established vegetation on
reclaimed derelict land which is not part of a formal recreation green space; downlands, commons
and meadows; areas of moorland and heathland vegetation consisting mainly of ericaceous
species, and including moorland grass, shrub moor, shrub heath and bracken. It is likely to include
some commons within urban areas and scrubland areas predominantly consisting of shrubs, with
grasses and herbs also present.
6. Institutional grounds
Green space in the grounds of institutions such as schools, universities and colleges, hospitals and
nursing homes, and associated with commercial and industrial premises. Land usually consists of
expanses of grass, scattered trees, hedgerows and shrubs. Outdoor sports facilities are not
included.
7. Orchard
Areas populated with fruit bearing trees, can be publicly or privately owned, could be for
commercial selling or local community use.
8. Outdoor sports facility
Includes sports pitches, school and other institutional playing fields, golf courses and other outdoor
activities, usually consisting of vegetated sports surface and boundary shrubbery, trees and
hedges, publicly or privately owned and often located within parks.
9. Park or public garden
Includes urban parks, country parks and formal gardens (including ones where you may have to
pay for access). Generally designed for public access and enjoyment, combining a variety of
landscape and horticultural elements. Extraneous facilities for the public may be present onsite
which enhance visitor attraction.

Manchester Green Infrastructure Strategy Technical Report
37
10. Private domestic garden
Privately owned green space within the curtilage of individual dwellings, which is generally not
publicly accessible. These plots of private land vary in size but often make up a significant part of
the green fabric of urban areas. Land may include trees, shrubs, grass and flowering plants.
11. Street trees
Generally in urban areas, a row/collection of individual trees along the side of a road. Trees will
vary in size and species depending on location and size of street. Usually located on the pavement
edge in tree pits, requires reasonably wide pavements. Tree pits may be planted with small
flowering plants.
12. Water body
Expanses of open water, including large lakes, small ponds, reservoirs and harbours and the sea.
13. Water course
All areas of running water, including large rivers, small streams, canals and aqueducts.
14. Wetland
Land dominated by wet habitats, including fen, marsh, bog and wet flush vegetation.
15. Woodland
All forms of woodland including deciduous woodland (both ancient semi-natural and woodlands of
more recent origin) and mixed and coniferous woodland (including plantations and shelterbelts).
Includes newly planted woodland. Small clusters of trees will be classed as woodlands.

Manchester Green Infrastructure Strategy Technical Report
38
Figure 5. Green Infrastructure Typology

Manchester Green Infrastructure Strategy Technical Report
39
Open Spaces Assessment
The Open Spaces Assessment was published in 2009. It was carried out by consultants PMP who
were commissioned by Manchester City Council to undertake an assessment of open spaces,
sport and recreation facilities within the City Council boundaries in accordance with the
requirements of Planning Policy Guidance Note 17 (PPG17) and its Companion Guide published in
September 2002. The study provides a valuable evidence base to understand the provision of
green space across the city.
Mapping Typology
The definition of the green infrastructure types are shown below. A map of the typology is shown in
Figure 6
City parks
City parks are large, regionally significant facilities that contain a variety of facilities and may have
one or more of the other types of open space within them, for example, Heaton Park,
Wythenshawe Park.
Neighbourhood / local parks
Includes urban parks and formal gardens. Neighbourhood parks serve the local community and
are smaller in size than City parks. Parks usually contain a variety of facilities, and may have one
of more of the other types of open space within them, for example, Didsbury Park.
Natural and semi- natural green spaces
Includes publicly accessible woodlands, urban forestry, scrub, grasslands (for example,
downlands, commons, meadows), wetlands and wastelands, for example, Medlock Valley.
Amenity green space
Most commonly but not exclusively found in housing areas, amenity green space includes informal
recreation green spaces and village greens.
Provision for children
Areas designed primarily for play and social interaction involving children below aged 12. While it
is recognised that a wide variety of opportunities for children exist (including play schemes and
open spaces not specifically designed for this purpose), as per PPG17, this typology considers
only those spaces specifically designed as equipped play facilities.

Manchester Green Infrastructure Strategy Technical Report
40
Provision for young people
Areas designed primarily for play and social interaction involving young people aged 12 and
above. While it is recognised that a wide variety of opportunities for young people exist (including
youth clubs and open spaces not specifically designed for this purpose, as per PPG17, this
typology considers only those spaces specifically designed for use by young people for example,
teenage shelters, skateboard parks, BMX tracks and multi-use games areas
Outdoor sports facilities
Natural or artificial surfaces either publicly or privately owned used for sport and recreation. These
include outdoor sports pitches, tennis courts, bowls greens, golf courses, athletics tracks, playing
fields (including school playing fields) and water sports
Allotments
Opportunities for those people who wish to do so to grow their own produce as part of the long-
term promotion of sustainability, health and social inclusion. This typology may also include urban
farms but does not include private gardens.
Cemeteries & churchyards
Cemeteries and churchyards including disused churchyards and other burial grounds.
Green corridors
Includes towpaths along canals and riverbanks, cycleways, rights of way and disused railway lines.
Civic spaces
Hard surfaced areas located within town or city centres for example Albert Square.

Manchester Green Infrastructure Strategy Technical Report
41
Figure 6. Open Space Assessment

Manchester Green Infrastructure Strategy Technical Report
42
Greater Manchester Tree Audit
The Greater Manchester Tree Audit was produced from remote sensing data. ProximiTREE is a
digital map layer accurately showing the location and extent of trees and their proximity to
buildings. Aerial photos are used to identify the height of all crowns and canopies visible within
each photo. Once the highest point of each tree’s crown has been measured, actual tree heights
are determined using an existing Digital Terrain Model. The resulting dataset (Figure 7) includes
modelled outlines of individual trees and the outlines of woodlands.
Blue infrastructure
Figure 8 shows the pattern of blue infrastructure across Manchester, including rivers, streams,
canals and open water bodies. There is a strong network of blue infrastructure associated with the
major valleys although the many breaks in the network highlight the prevalence of culverting and
consequent opportunities for further initiatives to restore river function. Modelled flood zones are
shown including areas with a 1 in 100 and 1 in 1000 chance of flooding each year.

Manchester Green Infrastructure Strategy Technical Report
43
Figure 7. Greater Manchester Tree Audit

Manchester Green Infrastructure Strategy Technical Report
44
Figure 8. Blue infrastructure and flood zones.

Manchester Green Infrastructure Strategy Technical Report
45
5. Spatial Analysis
Introduction
The source green and blue infrastructure datasets have been analysed to give a measure of the
spatial distribution of green infrastructure across the city. Several different measures have been
carried out using the different datasets to give an insight into the patterns of different types of
green infrastructure.
Analysis unit
Previous analysis of the extent of green infrastructure across Manchester had been carried out by
Manchester City Council at the Strategic Regeneration Framework Area level. This relates well to
the current operations at the Council but for this study a more detailed picture of the variation
across Manchester was required. The Electoral Ward was a possible analysis unit but a review of
the evidence showed that there was considerable variation in the pattern of green infrastructure in
some Wards.
Figure 9 Possible analysis units from left to right: Strategic Regeneration Framework Areas; Electoral Wards;
and Lower Super Output Areas
Manchester Green Infrastructure Strategy Technical Report
46
The chosen analysis unit was the Lower Super Output Areas (LSOA), produced by the Office for
National Statistics42. The LSOAs are homogenous small areas of relatively even size. There are
32,482 LSOAs for the 2011 census across England. 282 of these areas cover Manchester. The
LSOAs nest within the Electoral Wards. They also relate to a wide range of census and other
socio-economic data, which makes it possible to relate these to statistics on green infrastructure.
Some socio-economic statistics e.g. labour market statistics are prepared for the Lower Super
Output Areas for the 2001 census so analyses have been prepared for these areas to allow
comparisons to be made
Figure 10 shows an analysis of the total GI cover in Lower Super Output Areas across the city
based upon the Manchester Green Infrastructure Typology. The analysis includes all of the green
infrastructure types across the city. There is an over-estimate in the total figures of GI cover due
the hard surfaces included with private domestic gardens. However, the proportional over-
estimates are likely to be similar across the city so the overall spatial pattern is instructive.
The highest percentage cover of green infrastructure is associated with the river valleys of the Irk,
Irwell, Medlock and Mersey. The major city parks of Heaton Park and Wythenshawe Park also
increase the percentage cover in the surrounding areas. The lowest percentage cover of green
infrastructure is found in the city centre and parts of Central and East Manchester areas also have
a below-average percentage cover of green infrastructure. North Manchester and Wythenshawe
have the highest overall percentage cover.
As well as its quality, the proximity of areas of green infrastructure is critical to its delivery of
benefits. Therefore several analyses of distance thresholds have been carried out. Figure 12
shows an example analysis of proximity to natural green space. This analysis uses a spatial buffer
of 720m around patches of semi-natural green space, as defined by the Open Spaces
Assessment. This distance threshold is derived from the distance band in the Manchester Core
Strategy, which represents a 15 minute walk.
There is a strong variation in the accessibility of semi-natural open space across the city. The most
important areas for semi-natural green space are the river valleys, particularly along the more
incised river valleys of the Irwell, Irk and Medlock, where steep slopes support important areas of
semi-natural broadleaved woodland. There are also extensive areas of broadleaved woodland and
semi-natural grassland along the Mersey Valley. Wythenshawe is characterised by a higher
proportion of broadleaved woodland.
There is no accessible semi-natural green space within 720m of the city centre. There are also
significant areas of Central and South Manchester and parts of East Manchester that do not have
accessible semi-natural green space. This highlights the importance of linear routes to increase
connectivity and the need to take opportunities presented by new development to enhance
biodiversity through the provision of semi-natural green space. There is also potential to enhance
42 http://www.ons.gov.uk/ons/guide-method/geography/products/census/spatial/2011/index.html

Manchester Green Infrastructure Strategy Technical Report
47
the biodiversity of existing open spaces by changing management practices, which will improve
access to semi-natural green space.
The pattern of blue infrastructure across the city is shown in Figure 13. The proportion of each
LSOA that is classified as either ‘Water Body’ or ‘Watercourse’ in the Green Infrastructure
Typology is shown. Reference to Figure 8 shows the strong influence of the river valleys and of the
major reservoirs on this pattern. It is notable that the City Centre has a high proportion cover of
blue infrastructure, including rivers, canals and with a particular focus at the Piccadilly and
Castlefield canal basins. This highlights the considerable potential to enhance the biodiversity and
aesthetic value of blue infrastructure to improve ecosystem function and to use these blue
corridors to improve access to semi-natural green space.
Figure 14 shows the Index of Multiple deprivation, showing those LSOAs that fall within the 10%
and 20% most deprived LSOAs nationally. This map highlights the high levels of deprivation
across Manchester. This provides context for Figure 15 which shows the Index of Multiple
Deprivation in rank order with red showing the most deprived LSOAs. Superimposed over the
measure of deprivation is a measure of the total cover of the Green Infrastructure Typology. A
Pearson test of correlation between these measures does not show a significant relationship
between these measures. In other words there are areas of high deprivation in areas characterised
by high and low percentage cover of green infrastructure.
The Open Space Audit includes a measure of quality for some open spaces so an analysis was
carried out of this information. Figure 16 shows the data used to calculate a summary statistic,
which includes those areas of city and local parks and natural and semi-natural open space. Each
area was buffered by 300m to take account of the influence of open space on its surrounding area.
Figure 17 shows a measure of the area weighted mean of the buffered open spaces in each
LSOA. This summary statistic shows great variation in most SRFs. The notable exception is the
City Centre SRF, which has a higher overall quality score – although this is for a small number of
sites. A Pearson test of correlation between the quantity and quality of green infrastructure did not
show a significant relationship, nor did the relationship between quality of green infrastructure and
deprivation. This analysis highlights the potential across Manchester to enhance the quality of
green and blue infrastructure to improve the overall provision of benefits.
Figure 18 shows the data that was used for the economic analysis. This incudes only those areas
of over 2 hectares, which relates to the published evidence and allows greater confidence in the
resulting economic values. Comparison with Figure 16 shows that the actual benefits of green
infrastructure are likely to be higher than the estimated values arising from the economic analysis.
Figure 20 shows an analysis of green space that has been used in the baseline scenario of green
infrastructure. It maps city and local parks and natural green space, including those over 2
hectares in size. A 300m buffer has been applied to these open spaces. Figure 21 shows a
scenario of enhancement to the canal network and a corresponding 300m buffer. These maps
highlight that only a subset of Manchester’s green infrastructure has been included in the
economic analysis. The total value when considering other forms of green infrastructure is likely to

Manchester Green Infrastructure Strategy Technical Report
48
be higher. This analysis also highlights that there is potential to enhance other forms of green
infrastructure to increase the overall benefits provided, for example the provision of green roofs
and pocket parks. There are particular opportunities to enhance linear routes to provide high
quality routes to improve the connectivity and accessibility of existing open space.

Manchester Green Infrastructure Strategy Technical Report
49
Figure 10. Percentage green infrastructure including all categories of Manchester green infrastructure
typology

Manchester Green Infrastructure Strategy Technical Report
50
The percentage tree canopy cover is shown in Figure 11, which shows data from the Greater
Manchester Tree Audit, including all trees over 3m in height together with the outline of woodlands.
Considerable variation across the city can be observed, with the highest percentage tree cover
associated with the incised river valleys in North Manchester and in the Medlock Valley in East
Manchester. Higher percentage tree cover is also associated with the major city parks including
Heaton Park and Wythenshawe Park, as well as Alexandra Park and Platt Fields Park. The lowest
percentage tree cover is found in the city centre and in parts of East and Central Manchester. It is
notable that South Manchester has a high level of tree cover, despite a lower extent of public open
spaces. This highlights the importance of street and garden trees in these areas.
The definition of woodland in the National Forest Inventory is “a minimum area of 0.5 hectares
under stands of trees with, or with the potential to achieve, tree crown cover of more than 20% of
the ground”. This shows that in a very real sense, large parts of the city can be considered as a
forest ecosystem and management of the tree canopy is essential to maximise the benefits.

Manchester Green Infrastructure Strategy Technical Report
51
Figure 11. Percentage tree canopy cover

Manchester Green Infrastructure Strategy Technical Report
52
Figure 12. Buffer of 720m width around natural and semi-natural open space.
Figure 13. Proportion of land surface classified as water body or watercourse.

Manchester Green Infrastructure Strategy Technical Report
53

Manchester Green Infrastructure Strategy Technical Report
54
Figure 14. Index of Multiple Deprivation 10% bands (deciles).

Manchester Green Infrastructure Strategy Technical Report
55
Figure 15. Green infrastructure cover over the Index of Multiple Deprivation with red the most deprived.

Manchester Green Infrastructure Strategy Technical Report
56
Figure 16. Source data for quality calculation

Manchester Green Infrastructure Strategy Technical Report
57
Figure 17. Area weighted mean quality calculated using 300m buffer around open space, excluding quality
scores of zero.

Manchester Green Infrastructure Strategy Technical Report
58
Figure 18. City and local parks and natural and semi-natural open space over 2 hectares with 300m buffer.

Manchester Green Infrastructure Strategy Technical Report
59
6. Economic Analysis
Introduction – scope of economic benefits and caveats
Within this economic analysis, the benefits provided by green infrastructure in MCC are framed in
the context of their contribution to the city’s strategic priorities. In particular, the economic value of
benefits is linked to the following benefits (also included as part of the ten benefits covered in the
March 2014 report to Neighbourhoods Scrutiny Committee):
1. Economic growth and investment;
2. Increasing land and property values;
3. Labour and land productivity43;
4. Tourism, and
5. Health and wellbeing.
Manchester’s green infrastructure provides other important benefits to the city. The five benefits
above were prioritised by the City Council on the basis of their fit with the city’s existing socio-
economic priorities and the lower availability of collated evidence, relative to other benefits,
including biodiversity and flood risk management.
Economic benefits are estimated based on a three-step process. The first step is to establish the
understanding of how investments in green infrastructure lead to economic benefits. This
understanding is presented in the form of a series of 'logic chains'. These link the investment in
green infrastructure to particular goods and services it provides, and then to the economic
outcomes.
In this context ‘green infrastructure’ is primarily measured as availability of green space of at least
2ha in size. This space should be accessible, and be semi-natural in nature, which means having
a diversity of plant species present. However, data on accessibility and types of vegetation are
not always available, so analysis is only able to use data on the spatial extent of green space.
The most local ANGST (Accessible Natural Green space Standard) criteria is used, that benefits
are obtained from the 2 ha green space within a distance of 300m. This criteria is used because it
relates to published research results. However, a variety of benefits are likely to be gained from
different sizes of green space. For example, a small green space of 0.5ha may provide stress-
relief health benefits for a short-period, whilst larger sites that are of poor quality may not provide
the benefits expected. Additionally some larger sites or those with specific features, may attract
people (and therefore provide benefits) over a greater distance than 300m.
43 Changes to productivity are assumed to be covered under other headings: labour productivity in health and
wellbeing and land productivity in increasing land and property values.

Manchester Green Infrastructure Strategy Technical Report
60
This analysis considered four logic chains supported by the available literature relating to the
benefits provided by green infrastructure: inward investment and property development, land and
property values, tourism, and health and wellbeing. Figure 19 shows these logic chains and their
relationship to benefits provided by green infrastructure.
Figure 19. Green infrastructure investment and economic impacts logic chains (WTP: Willingness to Pay)
The second step in economic benefit assessment is quantifying the benefits in units appropriate
to the type of benefit. The units could be number of people or properties, frequency of physical
activity undertaken in green infrastructure etc. Discussion of each benefit below identifies the
relevant units used.
The key principle here is that economic benefit is measured in terms of a positive change. It is not
a statement of an absolute value, but value of a change. As the analysis here is to input to the
development of future strategy, three scenarios for future change have been considered. The
definition of each scenario of change is shown in Table 1. Scenarios of change. The scenarios
and assumptions that link the changes in investment to benefits are necessarily a simplification.
They are created to show large, but plausible change in green infrastructure against a baseline of
maintaining the current resource. Impacts are assessed against this baseline for: ‘Decrease’ in
which all the benefits from green infrastructure are gradually lost over 10 years, and ‘Increase’ in
which the quality of currently available green infrastructure and the role of the canal network in
providing ‘green’ (and ‘blue’) infrastructure is improved. An increase in the area of green
infrastructure in Manchester is not considered, rather the enhancement to the canal network
provides a realistic scenario. In practice the enhancement could also apply to other linear features
such as river valleys,off-road cycle and pedestrian routes, and others.

Manchester Green Infrastructure Strategy Technical Report
61
Table 1. Scenarios of change
Scenario Baseline Decrease Increase
Area of GIa As is currently No change No change
Benefits
provided by
the area of good
quality GI alone
the area of good
quality GI alone
the area of good quality GI
alone
Time horizon 10 years 10 years 10 years
% of good
quality GIb
80% remains
constant over the
time horizon
Decreases to 0%
over the time
horizon
Increases to 100% over the
time horizon
Change from
baseline
Current investment
is maintained to
ensure 80% of
current area of GI
remains to be ‘good
quality’
Current investment
declines with the
result that good
quality GI area is
lost
Current investment is
increased to maintain the
baseline case plus improve
the quality of the remaining
20% to ‘good’
AND
Further benefits are
realised from blue
infrastructure through
investment in canal
restoration
Implications
for benefits
Benefits provided
by 80% of the
current total area of
GI
Benefits provided in
baseline scenario
are lost
Benefits increase as 100%
of the current total area of
GI is now capable of
providing benefits
AND
Full benefits to those within
300 meters of the canal
network
Rate of
change of
benefits from
baseline
- Linear (10% lost
per year over 10
years)
Linear (10% gained per
year over 10 years) – same
assumption for green and
blue infrastructure
Figures
presented in
the tables
and text refer
to
Present Value of
benefits of green
space which is
‘good’ quality over
10 years
Present Value of
benefits of green
space which is
‘good’ quality
(declining linearly to
zero) over 10 years
Present Value of benefits of
green space improved to
‘good’ quality and benefits
of blue infrastructure over
10 years
a. Only city and local parks and natural and semi-natural open space over 2 hectares are used in the analysis.

Manchester Green Infrastructure Strategy Technical Report
62
b. An average of the local (69%) and City (92%) green space considered ‘good’ quality as per the Manchester
Open Space and Recreational needs Assessment 2009 (MCC, 2009). Good quality green space is defined as
that which is ‘fit for purpose’, meaning that it is readily accessible, safe, inclusive, welcoming, well
maintained, well managed and performing an identified function (Land Use Consultants, 2008).
Figure 20 presents a map of the area of green infrastructure used in the Baseline and Decrease
scenarios. Figure 21 shows the green and blue infrastructure areas included in the Increase
scenario.
Following this introductory section, this report presents the benefit analysis in the following
structure:
I. Economic growth and investment
II. Property values (also links to land productivity)
a. Commercial and industrial
b. Residential
III. Visitor attraction and tourism
IV. Health and wellbeing (also links to land productivity)
a. Physical activity
b. Mental health

Manchester Green Infrastructure Strategy Technical Report
63
Figure 20. Green infrastructure included within the Baseline and Decrease scenario analysis. Only green
spaces over 2 hectares are used in the analysis.

Manchester Green Infrastructure Strategy Technical Report
64
Figure 21. Green and blue infrastructure areas included within the Increase scenario

Manchester Green Infrastructure Strategy Technical Report
65
Caveats
The benefit estimates are approximate figures only. They are based on the best available
assumptions required to provide relative values for changes in green infrastructure relative to
current levels. In addition, each benefit type is analysed in isolation. Positive or negative
synergies between different logic chain elements and double-counting between benefits are not
eliminated within this method. Therefore, the different benefits must not be added together and
must not be used in the appraisal of any specific green infrastructure investment.
Additionality and displacement are not taken into account. Additionality is a net measurement of
the impact of a project or policy after making allowances for what would have happened in the
absence of the project or intervention. In other words, it is the additional benefit(s) gained from
implementing an activity that is above the dynamic baseline conditions/what would have
happened anyway. The baseline for the analysis is static, as a dynamic baseline for green
infrastructure would be very hard to construct.
Economic displacement is the degree to which a promoted activity will be offset by reductions in
activity elsewhere. For example, improvements to a park could increase the number of visitors. But
this is not a net benefit for the city if visitors are coming to the improved park instead of going to
another park (or doing something else) in the same city.
Finally, while there is site-specific evidence on various elements of the logic chains, it is not always
possible to trace the whole chains either in general or specifically for Manchester, due to lack of
data. Therefore, in some of the analysis below, some general assumptions are necessary to show
the magnitude of current costs or benefits (e.g. in the case of property value increases and
improvements to mental health). It is not possible to link these directly to improvements in green
infrastructure in Manchester, therefore the estimates reported here should not directly be used in
designing or appraising specific investments without further research.
Economic growth and investment
Green infrastructure can contribute to economic growth and investment in several ways.
Increased access or exposure to green space for existing property and for developable land can,
if well designed, improve their image, aesthetics from the property, and/or its utility to users (e.g.
residents). This improvement will increase users willingness to pay (WTP) (i.e. demand) to utilize
the property (e.g. to buy/rent for residential or commercial purposes, or to obtain for
development). This increased demand for existing and/or developable property would be
expected to increase investment in them, contributing to economic growth.
There are several examples that show increased economic activity in an area following the
announcement and/or completion of a green infrastructure project. For example, in the area in the
vicinity of the New York’s High Line Park, new building permits doubled after changing the zoning
of the area from manufacturing to residential and commercial, and the start of the park’s
construction in 2006. This led to more than 29 major development projects accounting for more

Manchester Green Infrastructure Strategy Technical Report
66
than US$2 billion in private investment (CoNY, 2011). Another example comes from the Glasgow
Green Renewal Project (1998 – 2006) which is credited with attracting 500 net new residential
units and 16% increase in businesses in the area, and £22.7m in sales from visitors (GEN
Consulting, 2006). This serves as an example of how green infrastructure investment (the park)
coordinated with development and planning policies (in this case, re-zoning) can help in realizing
substantial economic impacts.
However, it is not possible to be prescriptive about the causal relationship between the green
infrastructure investment and the economic growth benefits. For example, the net impact overall
could be neutral due to the displaced activity elsewhere. Where the new activity is displaced from
outside national borders, it can increase national economic growth. For a city, analysis could be
limited to the city boundaries (any activity displaced from outside the city leads to a net increase
in the benefits to the city). However, this does not result in a new benefit at a national level. In
addition, it is often difficult to explicitly establish the contribution of green infrastructure when it is
included as part of a larger regeneration scheme. The impacts of green infrastructure projects and
investment are dependent on multiple factors including size, location, and the characteristics of
the beneficiary population. Therefore, at this level of strategic scenario based analysis, without
knowing the details of planned investments, it is not currently possible to isolate the benefits due
to green infrastructure alone.
A detailed analysis of increased investment can include assessing the number and value (£) of
business start-up / growth, the number of new development applications as well as income /
spending and 'wealth' in the area (GHK, 2007; GEN Consulting, 2006). This can be assessed
further within the Manchester case studies where impacts on investments can be estimated with
more detailed project information as well as via comparison to other similar projects through case
studies available in the literature.
Increased jobs and wider multiplier effects
Green infrastructure projects have also been demonstrated to support local jobs (e.g. construction
jobs) throughout the life of a project; from implementation through to completion and maintenance
of the structure/space. Application of an employment multiplier is the typical way in which direct,
indirect and induced jobs created or lost in an area are evaluated due to a project or policy (The
National Regeneration Agency, 2008; HMT, 2011). Direct jobs are related to the specific industry,
while indirect jobs are those that support the industry. Induced jobs are those that are a result of
direct / indirect employee spending in the community, such as jobs in local retail outlets. As an
example, GHK (2007) estimated that the increased visitor spend resulting from a canal-side re-
development in Birmingham city centre supported between 76 – 96 (full-time equivalent) jobs in the
local community. There are therefore detailed ways of calculating the direct/indirect impacts of
green infrastructure investment projects within MCC. Some of the wider impacts for MCC are
reflected in the quantitative analysis provided in the following sections of this report.

Manchester Green Infrastructure Strategy Technical Report
67
Land and Property values
Green infrastructure can positively impact land and property values. The rationale being that well-
designed and maintained green space or infrastructure, can add to the aesthetic setting of an
area, which can impact its attractiveness to prospective residents and businesses. Properties in
close proximity to green space will therefore benefit from this improved setting. This improvement
will increase users willingness to pay (i.e. demand) to utilize the property (e.g. to buy/rent for
residential or commercial purposes, or to obtain for development). This increased demand for
existing and/or developable property would be expected to increase investment in them,
contributing to economic growth. This section discusses the potential impacts that proximity to
green space may have on commercial and residential properties in the MCC boundary.
Analysis of the economic impacts associated with green infrastructure focuses on the benefits
that can arise from its visual impacts and transformative properties – i.e. the ability to significantly
change the way people use and perceive a space. This can result in an increase in the number of
people and/or businesses and investors who want to live, visit and operate in the area, and can
therefore increase inward investment (eftec and CRESR, 2013; Heckert and Mennis, 2012;
CABE, 2010; Jones et al., 2009; Alberini, 2004). This is a key reason why green infrastructure is
frequently a component of regeneration projects, both in the UK and internationally.
The enhanced attractiveness of an area because of green infrastructure is expressed in
individuals’ willingness to pay higher amounts for property with ready access to green spaces.
These higher amounts reflect the scale of the competition for this access (limited green space,
increasing demand for it), which is reflected in higher residential and commercial property values
(eftec and CRESR,2013) and commercial asking rents near accessible green space of good
quality generally exceed rents in surrounding submarkets (Ernst & Young, 2003; CABE, 2005;
Gensler and ULI, 2011).
Property value premiums resulting from close proximity to green space can be applied to the
number of properties currently in close proximity to green space, therefore representing the
potential proportion of property value that may be attributable to green space proximity. Proximity
is defined as having a good quality green space of at least 2 ha no more than 300 meters from
home (this is the most local criteria with the Accessible Natural Green space Standard (ANGSt),
Natural England, 2010).
Commercial and industrial property
Value premium
Evidence suggests that developers are willing to pay a premium for land in close proximity to
good quality open space (compared to similar sites without such proximity), with some putting the
premium as high as 15-20% (Gensler and ULI, 2011; CABE, 2005; Ernst and Young, 2003).

Manchester Green Infrastructure Strategy Technical Report
68
However, as mentioned above, disentangling the impacts of green infrastructure on property
values is notoriously difficult. In addition, projects and investment are dependent on multiple
factors including size, location, and the characteristics of the beneficiary population. The following
assessment of value provided to the commercial and industrial market from proximity to green
space should therefore be read keeping these factors in consideration.
The Valuation Office Agency (VOA) reports data regarding the type, number and rateable value44
(RV) (a proxy for rent) of commercial and industrial real estate within the UK and subsets,
including Manchester City Council area.
As shown in Table 2. Floor space and rateable values for commercial and industrial sites in
Manchester City Council boundary was estimated to total around 6.2 million m2. The total rateable
value of £651 million for this floorspace can be seen as an estimate of the value of the
commercial real estate within Manchester. In order to more accurately evaluate the impact of
green infrastructure, to allow for the density of commercial and industrial space, it is necessary to
distinguish the proportion of this rateable value that is within the City Centre compared with
outside the City Centre. This is because there is a significantly lower level of green infrastructure
in the City Centre. Using a database of VOA values for MCC, these values are around £ 447
million (within City Centre) and £203 million (outside City Centre) respectively.
Table 2. Floor space and rateable values for commercial and industrial sites in Manchester City Council
boundary
Floor space 2012
(thousands m2)
Rateable Value
(£ 2014 millions)
Rateable Value
(£/m2)
Retail 1,426 250 175
Offices 2,002 276 139
Industrial 2,312 80 34
Other 481 45 93
Total 6,221 651 -
Source: Data available within VOA, 2012. Values were converted from £ 2012 to £ 2014 using the CPI index (ONS,
2014), however were not adjusted for other property market factors which may have impacted costs.
A survey conducted by Gensler and the Urban Land Institute (ULI) (2011) exploring the
preferences of real estate developers, investors, consultants and public sector workers across
Europe found that 93% of respondents are prepared to pay at least 3% more to be within close
proximity of open green space. From those, 32% would be willing to pay between 5% - 10%
more, another 35% would be prepared to pay between 10% - 15% more, and 16% would pay in
excess of 10% more.
44 Every non-domestic property has a rateable value which is set by the VOA and broadly represents the yearly rent the
property could have been let for on the open market on a particular date.

Manchester Green Infrastructure Strategy Technical Report
69
Number of properties in close proximity to green space
Using data on the type and size of green infrastructure in each LSOA it is estimated that around
7% of the area within the City-Centre and 52% of the area outside of the City Centre boundaries
has a 2ha green space within 300m. Using the 3% rent premium and 80% of green space being
of good quality assumptions detailed above, the rent premium in the baseline scenario for City
Centre and outside City Centre areas is estimated to account for around £3.3 million per year, or
£28.8 million in Present Value over ten years (PV 10, discounted at 3.5%). These results are
shown in Table 3.
Table 3. Potential property value attributable to close good quality green space proximity – baseline scenario
(80% of all green space)
Assumptions & calculations Values
Rateable value £651 million
% of commercial and industrial properties within close proximity to
green space
7% City Centre,
52% outside
City Centre
Rateable value in close proximity £139 million
Assumed percentage of good quality green space 80%
Premium for close proximity 3%
Potential annual value attributable to green space proximity (£ 2014) £3.3 million
Present value over 10 years (£ 2014) £28.8 million
Table 4 and Figure 22 present the scenario assessment for the change in property value
attributable to the proximity to good quality green space. As shown, in the Decrease scenario, the
present value over 10 years decreases from around £28.8 million in the Baseline to around £16.7
million, as the quality of green space decreases.
Within the Increase scenario for improving GI, the present value of benefits increases to £55.8
million, an increase of £27 million. This reflects a return to investments to improve the quality of all
green space to ‘good’ (from 80% of area to 100% of area) and also improving the quality of
canals. After 10 years, the additional annual property values are worth over £6 million per year.
Table 4. Commercial and industrial property – present value over 10 years attributable to green space
proximity scenario assessment
Scenario PV 10
Baseline £28.8 million
Decrease £16.7 million
Net impact of Decrease - £11 million
Increase £55.8 million
Net impact of Increase £27 million

Manchester Green Infrastructure Strategy Technical Report
70
Figure 22. Commercial and industrial property – annual estimated value attributable to green space proximity
scenario assessment
The values in Figure 22 represent estimates for the MCC boundary area. A more detailed
analysis of a smaller spatial area could be undertaken if data regarding the type, total area and
rateable value could be used in conjunction with the location of commercial properties, green
space and the surrounding area (including residential property location and type).
Untapped rent premiums
The above analysis is for the percentage of commercial properties that are in close proximity to
good quality green space larger than 2 hectares. Further rent premium can be gained, by
increasing the amount of green space in the city. Assuming that the addition of further green
space puts the remaining (not in close proximity) commercial properties in close proximity to good
quality green space larger than 2 hectares, and also assuming that these properties now achieve
a 3% rent premium. This would return a benefit of £18.5 million per year or £160 million over 10
years. While it unlikely to be practical to ensure all commercial properties are in close proximity to
good quality green space, if they were, some diminishing returns to investment would be
experienced lowering the rent premium. Nevertheless, these numbers demonstrate the size of
potential increase to property values. They can be useful in conversations with developers about
the size and location of new green spaces – priority being near the commercial properties not
currently near green space.
The increase in rents chargeable (i.e. property values) would also translate to increased revenue
for the MCC. Estimating this direct value to MCC depends on the property tax processes.

Manchester Green Infrastructure Strategy Technical Report
71
Residential property
Although the fact that nearby green space has the potential to increase property values is well
documented, in general the downstream economic implications of these increases receive little
attention in the literature (eftec and CRESR, 2013). One exception relates to the increase in
taxation revenue that results. However, such analysis has largely been confined to the US, where
local property taxes are based on annually updated 'fair market' values (Trust for Public Land,
2009a, 2009b, 2010a, 2010b, 2011a, 2011c; Harnik and Welle, 2009). Apart from small amounts
of Inheritance Tax and Stamp Duty in the UK, any capture of increased house values is likely to
be limited because of the infrequency of revaluation in relation to setting Council Tax bands. The
main way in which such revenue streams are likely to increase is via the stimulation of new
development in the surrounding area.
Most studies in this area assume that higher residential property values are automatically
beneficial, representing a 'boost' to the local economy. Where they indicate the improved
attractiveness of a previously rundown area, the associated population growth is likely to lead to
increased local expenditure on goods and services and some associated revival in the local
economy, as well as an increase in property-based taxation revenue, including Council Tax
receipts (eftec and CRESR, 2013; GEN Consulting, 2006). However, increasing property values
can indicate demand exceeding supply, and the economic impact of this is less clear.
Value premium
The estimates of the size of the premium to residential properties as a result of proximity to green
space vary between under 1% and 19%, though the majority of estimates fall within the 5% to
10% range (Garrod and Willis, 1992; Garrod, 2002; Luttik, 2000; Dunse et al., 2007; Luther and
Gruehn, 2001; GLA Economics, 2003; CABE, 2004; 2005; Prastholm et al. 2002).
Number of properties in close proximity to green space
This range of premiums can be applied to the market value of residential property within MCC,
which can be calculated by taking the estimated area of residential dwellings (m2) in Manchester
and applying the average value (£/m2) of those dwellings. The area of residential dwellings in
Manchester is not known and hence had to be estimated based on the number of households
(assumed to be equal to number of properties) and the average size of each property. In addition,
because private and social properties differ in average size (area), the estimate was adjusted to
reflect the relative proportion of each within the total housing stock.
The number of households within each MCC LSOA is provided by the ONS (2011a). Table 5
presents the average floor space for England and the proportion of private versus social housing
within the MCC area. According to the DCLG’s English Housing Stock Report 2012 – 2013
(2013), the average useable floor space (area in m2) of private and social dwellings in England
are 97.6 m2 and 62.6 m2 respectively. Applying the estimated breakdown of housing for each
LSOA within MCC (i.e. 66% private, 34% public/social as estimated in Association of Greater

Manchester Green Infrastructure Strategy Technical Report
72
Manchester Authorities, 2011) to the total number of households in each LSOA, an estimate of
136,099 social and 68,870 private dwellings is reached. This represents a spatial density
adjustment, allowing for the fact that populations, and therefore housing, are not evenly
distributed within the MCC area.
Table 5. Average useable floor space in England and type of dwelling in Manchester
All private sector All public/public sector
Average useable floor space in
England 2012 - 2013 (DCLG,2013) 97.6 m2 62.6 m2
Dwelling stock by tenure in MCC
2010 (AGMA,2011) 66.4% 33.6%
A more detailed approximation of the total residential floor space in MCC can be reached by
taking into consideration how many dwellings fall above or below area estimates for each type of
property. For example, in the public sector, 66% of dwellings had an area of less than 70m2, while
in the private sector 70% had an area of at least 70 m2 (DCLG, 2013). It is therefore assumed that
66% of social housing in MCC are the England average of 62.6 m2, with the remaining 34% being
70m2. Similarly, it has been assumed that 70% of private dwellings in MCC are the England
average of 97.6 m2, while the remaining 30% are 70 m2. This allows for an estimated total
residential area of 12,156,361m2 within MCC; 9,304,234m2 of private sector dwellings and
2,852,127 m2 of social housing.
Finally, if we apply the average value of residential property in the MCC boundary, as provided by
the VOA (2011), of £402/m2 to this total area47, the resulting predicted value for MCC residential
properties is over £4.8 billion.
As discussed in the context of commercial property premiums, the area of each LSOA within the
MCC boundaries with a 2ha accessible green space within 300m was calculated and applied to
the number of residential properties in each LSOA in order to estimate those in close proximity to
green space. Table 6 takes the total estimated value of MCC residential property, and applies the
premium range supported by literature of between 5% and 10% to the 48% of residential
properties currently in close proximity to green space. The premium is only assumed to be
realised for the 80% of green space in Manchester which is of good quality, so in total it is applied
to 38% of residential property.
Table 6. Potential value of property attributable to green space, £ 2014 – baseline scenario (80% of green
space is of good quality)
Value
Total estimated value of MCC residential property 4,882,618,833
Total value of the 48% in close proximity to good quality green space (with spatial density
adjustmenta) 1,587,252,797
47 The VOA (2011) estimate of £375/m2 was updated to £ 2014 using the CPI as provided by the ONS
(2014).
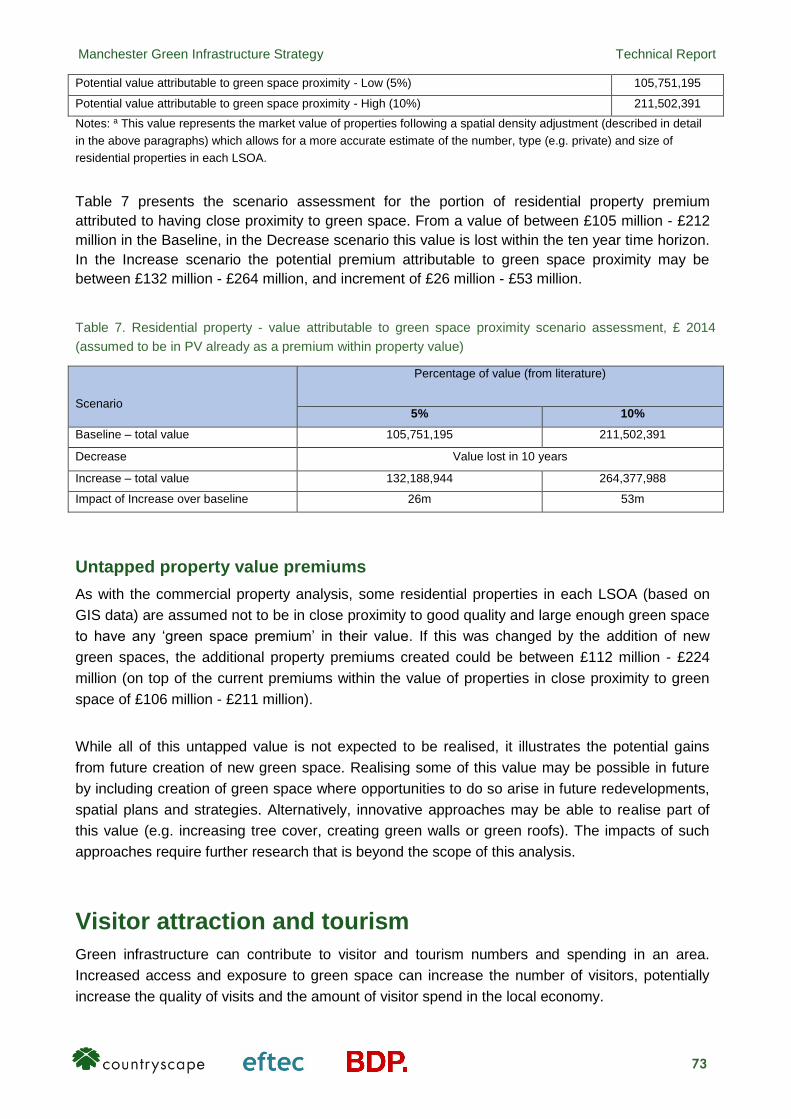
Manchester Green Infrastructure Strategy Technical Report
73
Potential value attributable to green space proximity - Low (5%) 105,751,195
Potential value attributable to green space proximity - High (10%) 211,502,391
Notes: a This value represents the market value of properties following a spatial density adjustment (described in detail
in the above paragraphs) which allows for a more accurate estimate of the number, type (e.g. private) and size of
residential properties in each LSOA.
Table 7 presents the scenario assessment for the portion of residential property premium
attributed to having close proximity to green space. From a value of between £105 million - £212
million in the Baseline, in the Decrease scenario this value is lost within the ten year time horizon.
In the Increase scenario the potential premium attributable to green space proximity may be
between £132 million - £264 million, and increment of £26 million - £53 million.
Table 7. Residential property - value attributable to green space proximity scenario assessment, £ 2014
(assumed to be in PV already as a premium within property value)
Scenario
Percentage of value (from literature)
5% 10%
Baseline – total value 105,751,195 211,502,391
Decrease Value lost in 10 years
Increase – total value 132,188,944 264,377,988
Impact of Increase over baseline 26m 53m
Untapped property value premiums
As with the commercial property analysis, some residential properties in each LSOA (based on
GIS data) are assumed not to be in close proximity to good quality and large enough green space
to have any ‘green space premium’ in their value. If this was changed by the addition of new
green spaces, the additional property premiums created could be between £112 million - £224
million (on top of the current premiums within the value of properties in close proximity to green
space of £106 million - £211 million).
While all of this untapped value is not expected to be realised, it illustrates the potential gains
from future creation of new green space. Realising some of this value may be possible in future
by including creation of green space where opportunities to do so arise in future redevelopments,
spatial plans and strategies. Alternatively, innovative approaches may be able to realise part of
this value (e.g. increasing tree cover, creating green walls or green roofs). The impacts of such
approaches require further research that is beyond the scope of this analysis.
Visitor attraction and tourism
Green infrastructure can contribute to visitor and tourism numbers and spending in an area.
Increased access and exposure to green space can increase the number of visitors, potentially
increase the quality of visits and the amount of visitor spend in the local economy.
Manchester Green Infrastructure Strategy Technical Report
74
Natural Economy Northwest et al (2010) explains that the relevant types of green spaces and
features - the types of green infrastructure assets or projects that give rise to tourism benefits
include:
∂ Woodlands;
∂ Access to mountain or moorland;
∂ Water courses, and
∂ Green corridors.
The protection and enhancement of green infrastructure can help an area maintain its existing
tourism economy and attract new visitors. The establishment or development of a site offering a
range of tourist activities can be a significant attractor of economic activity. Investing in quality
green space is vital to the health of a sustainable tourism industry. Green space adds value to
tourism destinations and services, improving the quality of the experience for tourists and
increasing income and employment. For example:
∂ The National Trust has estimated that 40% of tourism-related employment is dependent on a
high quality environment;
∂ The environmental economy sustains 26% - or £2.8 billion – of the North West region’s tourism
sector, and also supports 190,000 jobs;
∂ Across England over 33 million people make over 2.5 billion trips to urban green spaces, and
∂ US research highlights that parks play an important part in a city’s tourism economy, although
often the number of tourists is not recorded.
The types of green infrastructure likely to contribute most to the growth of the tourism economy by
attracting visitors in their own right are those that provide:
∂ A unique appeal in terms of the quality of the environment, and
∂ A range or critical mass of activities on site, increasing value-added and on-site expenditure.
However, green infrastructure can also be a supporting factor to a main visitor attraction in an
urban area, persuading more people to visit a location, and/or to stay in that location for longer
than otherwise. Projects that attract people from outside the region and overnight visitors will
generate greater off-site expenditure in the local economy. There are numerous examples of sites
that have developed strong tourism offerings based around the quality of their green infrastructure
(e.g. eftec, 2006; National Trust (1998); Natural Economy Northwest et al., 2010; Regeneris
Consulting, 2009) These examples are mainly from rural areas and as such are not directly
transferable to MCC.
However, city parks have also been shown to benefit from considerably higher numbers of tourists
than traditional visitor destinations. For example Clissold Park in London enjoys the same number
of visitors as the National Portrait Gallery and considerably more than St. Paul’s Cathedral (2.1m,
2.1m and 1.8m respectively). Quality parks have also been shown to boost the tourist economy.

Manchester Green Infrastructure Strategy Technical Report
75
Visit Britain (2013) has found that of the 31 million tourists visiting Britain over a third enjoy visiting
a park or garden, making it one of the most popular activities ranking above visiting a museum,
castle, historic house or art gallery. A study on the spending of tourists who visited San Diego
(TPL, 2009) specifically because of its parks was calculated to generate around $114m in
additional visitor spending per year and over $8m in tax revenue for the city (2006). Millennium
Park in Chicago has 5m visitors annually and it has been projected that gross sales from visitor
spending is between £1.9-2.6bn (ten year estimate to 2015) (Urban Land Institute, 2008).
It is likely of course that a high proportion of visitors to city parks will be local residents. However,
the numbers of local and non-local visitors may both be significant. In terms of contribution of parks
to the local economy, indirect income generated by vendors in a park or from adjacent businesses
such as gift shops, restaurants, cafes and bars is particularly important. For example, New York’s
Central Park is estimated to have generated $135.5m in 2007 through the concessions and other
businesses and organizations in the park. Using employment data supplied by the businesses and
other organizations that operate in the park, it was estimated that this directly generated $6.2m in
New York City income, sales, and business taxes. It was also calculated that the Department of
Parks and Recreation collected $8.7m in concession permits and $1.1m in special events permits
(Appleseed, 2009).
Provided that visitor type (day versus overnight) numbers can be estimated and supplied,
relatively detailed assumptions can be applied to estimate values associated with visitors and
tourism, taking into account issues of additionality (i.e. the substitution of spending from other
areas of Manchester) and employment multiplier effects (i.e. the local employment supported by
the tourism generated / supported by a site).
As a theoretical example, using the Green Infrastructure Valuation Toolkit (2010, in progress), a
park in Manchester that has:
∂ 200,000 out of town visitors a year (half of which being day visitors and half of which overnight
visitors)
∂ Visitors spending the North West average expenditure per day visitor of £20 and the average
expenditure per overnight visitor of £72.40 (Natural Economy North West et al., 2010)
can generate / support total direct and indirect tourism expenditure of over £5.5 million per year
(or over £46 million over 10 years). In addition, it may support 185 full time equivalent (FTE) jobs
(139 direct and 46 indirect and induced jobs) generating GVA of over £3.6 million (or over £31.8
million over 10 years) by the employment supported.
Health and wellbeing
Green infrastructure can contribute to the improved health and wellbeing of those who access it, or
are exposed (e.g. through a view from a window) to it. An increase in access and exposure to
green space can increase physical and mental wellbeing, and can even influence uptake in
physical activity, leading to a reduction in health costs/spending and/or workforce productivity. This
in turn can lead to a reduction in the pressure on public services and spending. This section

Manchester Green Infrastructure Strategy Technical Report
76
examines the potential impacts that green infrastructure may have on physical and mental health
in the MCC area.
Physical activity
Access to local, safe and natural green space can help individuals sustain higher levels of
physical activity. The motivation to continue physical activity schemes is more likely to be
sustained through the natural environment. Activities in which exercise becomes secondary to
environmental or social benefits (e.g. Gardening, Green Gym or walking in green space) appear
to be more sustainable than activities in which exercise remains the primary driver (Bird, 2004).
Green space may also act as a catalyst for physical activity, as a number of studies have noted
that people living in areas in close proximity to green space have a higher propensity to exercise
(eftec and CRESR, 2013; Jones et al. 2009; Nielsen and Hansen, 2007; Pretty et al. 2003).
There is also an emerging body of evidence linking improved mental and physical health to
economic impacts. Mourato et al. (2010) identified three main types of economic benefits arising
from improved health: cost savings to the National Health Service (NHS); increased economic
output due to a reduction in ill health (morbidity), stress and absence from work; and increased
economic output due to a reduction in the incidence of premature death (mortality) (eftec and
CRESR, 2013).
This section provides estimates of the contribution of local parks in Manchester to supporting the
local population’s physical exercise in terms of the avoided direct and indirect costs of ill health.
The methodology of calculating these benefits is based on Bird, 2004 and utilises the existing
evidence base.
Parks are the most frequently used and visited open spaces in Manchester, with 14% of
respondents to the household survey using Local Parks daily and a further 32% using them
weekly. City parks are also popular, with 32% visiting these sites at least once a week
(Manchester Open Space and Recreational needs Assessment, 2009).
Table 8. How often local populations visit parks (Manchester and UK) shows the local populations
frequency of use of parks in Manchester. The recommended physical activity guidelines are for 30
minutes of moderate exercise 5 times a week (Bull and the Expert Working Groups, 2010). Based
on this, an estimate of the number of days of exercise a local park could provide to the local
population can be reached, as shown in Table 9. Potential contribution of a public park to
exercise.

Manchester Green Infrastructure Strategy Technical Report
77
Table 8. How often local populations visit parks (Manchester and UK)
Almost
every
day
At least
once a
week
About
once a
month
Within
the last
6
months
Within
the last
year
Longer
ago
Never
used
Don't
know
Manchester Open
Space and
Recreational Needs
Assessment (MCC,
2009).
14% 32% 15% 9% 4% 7% 18% 0%
State of UK Parks
(HLF, 2014) (UK data,
n =1037).
12% 23% 18% 11% 5% 8% 22% 0%
Notes: A breakdown of values for Manchester were only provided for ‘Almost every day’ and ‘At least one a week’
categories. Other category percentages were calculated using the relative proportions of the UK data.
Table 9. Potential contribution of a public park to exercise
Frequency of visits % of
population
No. of
visits
per
week
% of
exercise
days
required
% of total
population's
required
exercise days
Almost every day 14% 5 100% 14%
At least once a week 32% 3 60% 19%
About once a month 15% 0.25 5% 1%
Within the last 6 months 9% 0.0416 1% 0%
Within the last year 4% 0 0% 0%
Longer ago 7% 0 0% 0%
Never used 18% 0 0% 0%
Don't know 0% 0 0% 0%
Total - - - 34%
Based on MCC, 2009
A local park might therefore contribute around 34% of the recommended days of exercise for the
local population. However, not all of the visits to the park will involve exercise fulfilling the
recommended 30 minutes of moderate exercise. Bird (2004) estimates around 80% of visitors to
parks use them for exercise, and from this it is assumed that around 80% will have had the full
benefit of 30 minutes of physical activity.
Therefore the estimated total amount of physical activity for the local population supported by a
local park is:
= 21.77% of recommended physical activity
In order to evaluate the population receiving these benefits, certain assumptions regarding the
spatial boundaries, or catchment, of the physical activity impacts provided by each urban park

Manchester Green Infrastructure Strategy Technical Report
78
must be made. For smaller parks (Approx 2ha) this is assumed to be 300m in line with lower
Angst criteria used elsewhere.
The average size of parks in the MCC boundary is, however, much larger, around 7.9ha, so we
assume they are accessed from further, up to 0.77km on average, and thus that whole population
in each LSOA containing a park of 2ha or more will potentially gain physical activity benefits by
accessing the park. This assumptions is within the same order of magnitude as Accessible
Natural Green space Standard (ANGSt)45 recommendations that everyone should have an
accessible natural green space of at least 2 ha no more than 300 metres from home (Natural
England, 2010).
It is therefore assumed that for each LSOA containing at least 2 ha of parkland (around 36% of
LSOAs), 21.77% of the population’s physical activity is supported by the parkland. Using ONS
population densities for Manchester of 4,351 people per km2 (ONS, 2011) this translates to over
21.77% of 89,336 people’s physical exercise being supported by the parkland within this subset of
LSOAs.
To calculate the cost of inactivity to the economy, we need to calculate the proportion of the
population who are inactive. In 2012, 67% of men and 55% of women aged 16 and over reported
that they met the recommendations for aerobic activity while 26% of women and 19% of men
were classed as inactive (Health and Social Care Information Centre, 2014). This translates to
roughly 61% of the population meeting the recommendations, 17% being active but not achieving
standards and 23% of the population being totally inactive. This data is self-reported and
therefore subjective.
It should be noted however that in comparison to these estimates where respondents provide
information based on their own opinions, objective measures of physical activity reveal much
lower levels of adults achieving the recommended amount of physical activity, as presented by
the Health and Social Care Information Centre (2014). For example, Bird (2004) used objective
measurements, provided by the Department of Health, which estimated the inactive population of
the UK at 56%. In order to mitigate the potential inaccuracy of subjective figures, this analysis
presents estimates of the avoided direct and indirect costs of inactivity using both subjective
(23%) and objective (56%) inactivity estimates. For analysis, these percentages have been
applied to England’s population of 53,012,456 (ONS, 2011).
Estimates of the annual direct and indirect costs of inactivity in England are around £1.45 billion
and £10.03 billion (respectively) (Bird, 2004; Davis, 2010; Ukactive, 2014). Since the subjective
45 ANGSt is a range of accessibility standards for natural sites and areas within easy reach of people’s homes.
The standards were developed by Natural England to address the variation in access and proximity to green
space of the population. It recommends that everyone, wherever they live, should have an accessible natural
green space of: at least 2 ha in size no more than 300 meters from home; at least one accessible 20 ha site within 5 km from home; one accessible 100 ha site within 5 km of home; one accessible 500 ha site within 10
km of home; and a minimum of one ha of statutory Local Nature Reserves per thousand population.

Manchester Green Infrastructure Strategy Technical Report
79
estimates of inactivity (23%) are lower, they result in proportionately higher costs per inactive
person - a cost of £84 to the NHS and £582 in indirect costs per inactive person per year – and
represent the ‘High’ scenario. The ‘Low’ scenario is provided by objective estimates of inactivity
(56%) which result in a proportionately lower cost per inactive person - a cost of £49 to the NHS
and £338 in indirect costs per inactive person per year.
Table 10 presents the estimated value of physical activity supported by local parks in terms of the
estimated annual cost savings. These figures can be interpreted as the value of physical activity
obtained within local parks assuming 80% are of ‘good’ quality and providing benefits. They are
an approximate estimate, because the costs of physical inactivity vary across the population – for
example with age. Therefore, to the extent the characteristics such as age of the active population
differ from the inactive population, the costs of inactivity may misrepresent the true impact.
Table 10. Potential annual savings, £ 2014
Potential annual savings
to NHS
(£ per year)
Potential annual savings
to economy Total annual savings
Low High Low High Low High
LSOA with over 2 ha
of parkland 760,167 1,309,826 5,258,969 9,061,608 6,019,136 10,371,434
Low: lower cost per inactive person due to assuming higher number of inactive people in a given population (based on
official statistics).
High: higher cost per inactive person due to assuming lower number of inactive people in a given population (based on
personal reports of activity rates).
It is likely that all visitors to green spaces, not only those exercising, are also gaining mental
health benefits through exposure to the outdoors, as well as due to any increase in physical
activity, whether by walking to the park or exercising within it. Mental health benefits are
discussed in the next section.
Table 11 presents the scenario assessment for physical activity supported by local parks. For this
scenario assessment, it is assumed within the Increase scenario that the same levels of physical
activity is supported to those within 300 meters of the improved canal systems as would be
supported by a park. As shown, the present value of benefits under each scenario ranges from
over £41 million to over £71 million in the baseline over ten years, with this value being decreased
across the time horizon in the Decrease scenario. The net benefits of the Increase scenario are
found to be between £6.5 million to £9.6 million over ten years.
Table 11. Physical activity scenario analysis, £ 2014
PV 10 Potential savings to economy
Low High

Manchester Green Infrastructure Strategy Technical Report
80
Baseline 41,448,666 71,419,240
Decrease 23,970,791 41,303,517
Net decrease -17,477,875 -30,115,723
Total Increase 47,940,751 81,070,790
Net benefit Increase 6,492,085 9,651,547
Low: lower cost per inactive person due to assuming higher number of inactive people in a given population (based on
official statistics).
High: higher cost per inactive person due to assuming lower number of inactive people in a given population (based on
personal reports of activity rates).
In the Increase scenario the benefits of improved canal systems are added to the benefits of
increased quality of local parks46. In Figure 23, the addition of benefits from canal improvements
in 2015 resulting in a sharp increase of benefits can be seen.
Figure 23. Physical activity scenario analysis showing potential cost savings, 2014 prices.
Mental health
There is strong evidence from a large number of studies spanning several years that green space
alleviates stress, fatigue and other mental health issues, with positive effects on mood,
concentration, self-discipline, and physiological stress (see, for example, Health Council of the
Netherlands, 2004; Kaplan and Kaplan, 1989; Berman et al. 2008; Ulrich, 1984; Ulrich et al. 1991;
Grahn and Stigsdottir, 2003). This effect is found to be especially marked for residents in large
46 One tenth (or 10%) of benefits are added each year, so as to equally divide the stream of benefits

Manchester Green Infrastructure Strategy Technical Report
81
urban areas, and in particular for children and young people (Kaplan, 1995; Taylor et al., 2001).
Similar effects can be found when people have contact with nature in work, as revealed by a
study by Largo-Wright et al. (2011) of university staff in the South-Eastern US.
Much of the research analysing the positive effects of urban green spaces on mental wellbeing
has drawn on cross-sectional evidence, without taking into account the prior psychological health
of the survey sample. A recent paper by White et al. (2013) sought to advance understanding
beyond this by using British Household Panel Survey data from over 10,000 individuals living in
English urban areas to explore the relationship between green space and wellbeing (indexed by
ratings of life satisfaction) and between green space and mental distress (indexed by General
Health Questionnaire scores) for the same people over an 18 year period. The amount of green
space available to each person was assessed at LSOA level, using data from the Generalised
Land Use Database. Their analysis was based on a 'fixed effects' approach that allowed the
influence of a range of changes in people's circumstances to be compared, including moving to
areas with greater or lesser amounts of green space. The study found that individuals had both
lower mental distress and higher wellbeing when living in urban areas with more green space.
While the effect at the level of the individual was relatively small, the cumulative benefit for urban
populations is likely to be significant, given that much of the green space is accessible to
everyone.
In 2010, the total economic and social cost of mental health47 in England was estimated to be
between £70 - £105 billion, which is (assuming the national average of 16.67% of the population
with mental illness) between £7,923 - £11,884 per afflicted person. Sickness absence from work
as a result of poor mental health accounted for around £8 billion of this, or around £905 per
person with mental illness, based on the 70 - 113 million working days missed, which is
equivalent to 2.8 days per UK employee (The King’s Fund, 2012; Mental Health Foundation,
2010).
In the Northwest of England, it is estimated that around 20.3% of the population suffer from
mental health problems (MCC and NHS Manchester, 2014). The positive impacts on wellbeing
resulting from the exposure to green space have the potential to alleviate some of the associated
(large) medical and social costs. Applying some of the national mental illness cost averages to the
regional (Northwest) population suffering from mental health issues can shed light on these costs
that proximity to safe, accessible green space may help to alleviate within the MCC area.
MCC and NHS Manchester (2014) provide an estimate of MCC’s adult population suffering from
mental illness of between 75,600 – 77,900. Applying the costs per person in England48, the
estimated economic and social costs to MCC may be around £670 million - £1 billion each year,
with around £76 -£78 million of this resulting from days off work. According to NHS Manchester
47 This range includes the costs of medical and/or social care, production output losses, and a monetary valuation of the intangible human costs of disability, suffering and distress (Mental health Foundation, 2010). 48 For this analysis costs per person were converted from 2010 prices to 2014 prices using the CPI as provided by the
ONS (2014).

Manchester Green Infrastructure Strategy Technical Report
82
and MCC (2013), direct costs to NHS Manchester in 2011-2012 were £71.3 million, meaning the
remaining £599 million - £959 million represents the indirect costs of mental illness.
Using GIS data, an estimate of the number of people in each LSOA suffering from a mental health
illness was produced. The number of those afflicted and not in close proximity to green space was
estimated based on the percentage area of each LSOA with 2ha of green space within 300m.
Table 12 presents estimates for the relative annual costs of illness represented by these
populations. The values provide an illustration of the scale of costs that good quality green
infrastructure can help to mitigate.
Table 12. Estimated number and relative annual economic and social cost of MCC population with mental
illness, £ millions 2014
No. of people with
mental illness
Annual costs - £ millions, 2014
Low High
Not in close proximity
(Aggregation of each LSOA) 57,644 £ 511 £ 766
Notes: For this analysis costs per person were converted from £ 2010 to £ 2014 using the CPI as provided by the ONS
(2014). The Low and High range represent the costs associated with the low and high range of costs provided by MCC
and NHS Manchester (2014).
Mental health is also linked to physical health, higher educational achievement, better
employment opportunities, increased social inclusion, reduced criminality and reduced health
inequalities (Department of Health, 2009). These costs are not included above.
The site-specific evidence strongly suggests that, at their best, green spaces can help reduce
health inequalities and improve mental health directly and indirectly through supporting increase in
physical exercise and social inclusion (Forestry Commission, 2010). It could be surmised that
those within close proximity to green space may be receiving some of the associated mental health
benefits, and that increased investment aimed at providing green space exposure have the
potential to mitigate the costs associated with those not currently in close proximity. However, at
the level of a city, it is not possible to accurately estimate what the impact of being in close
proximity to green space would be on mental health. A detailed analysis could be completed for a
smaller defined area with more specific mental health data, including that regarding costs and a
proxy for number of people with mental illness.
Summary
A range of studies examining the impacts from green infrastructure cover its economic, social,
and environmental benefits. They suggest that green infrastructure can contribute to economic
growth and investment in several ways. The analysis within this report has utilised logic chains
supported by the literature relating to the benefits provided by green infrastructure: inward
investment and property development, land and property values, tourism, and health and

Manchester Green Infrastructure Strategy Technical Report
83
wellbeing. The impacts were assessed for Baseline, Decrease and Increase scenarios,
corresponding to different options of green infrastructure investment.
Increased access or exposure to green space for existing property and for developable land will
improve the image of a site/property, aesthetics of the property, and/or its utility to users (e.g.
residents). This improvement will increase users willingness to pay (i.e. demand) to use the
property (e.g. to buy/rent, or to obtain for development). This increased demand for existing
and/or developable property/land would be expected to increase investment in them, contributing
to economic growth. Within Manchester, premiums for commercial and industrial property within
close proximity to good quality green space are estimated to be over £3.3 million per year, with a
present value of £28.8 million over 10 years.
Green infrastructure can also contribute to visitor and tourism numbers and spending in an area.
Increased access and exposure to green space can increase the number of visitors, potentially
increasing the quality and length of visits and the amount of visitor spend in the local economy.
Green infrastructure can contribute to the improved health and wellbeing of those who access, or
are exposed to it (e.g. through a view from a window).. An increase in access and exposure to
green space can increase physical and mental wellbeing, and can influence uptake in physical
activity, leading to a reduction in health costs/spending and/or productivity. This in turn can lead to
a reduction in the pressure on public budgets. Within Manchester, the physical activity supported
by parks may be responsible for costs savings (avoided health care spending) of £6million – £10
million per year. In addition, improving access or exposure to green infrastructure for the
estimated 57,644 people in MCC who suffer from mental illness but do not live within close
proximity to green space could help to mitigate the annual healthcare costs which range from
£500million - £766 million.
Positive or negative synergies between different logic chain elements and double-counting
between benefits have not been eliminated within the methods used for this analysis. Therefore,
the different benefits should not be added together and are not recommended in the appraisal of a
specific green infrastructure investment. For example, people may value a property near a park
because they know it will allow them to live more healthily, meaning the health and residential
property values double-count benefits.
Table 13 summarises the estimated costs/benefits of the impacts of green infrastructure within
Manchester for the Baseline, Decrease and Increase scenarios, where monetised. It also includes
a description of the impact being valued. Under the Decrease scenario, the values in the baseline
are lost over a period of ten years. Because this loss is gradual, this scenario still has a positive
present value, but the losses associated with ceasing maintenance and management of green
space within Manchester would be significant: they are estimated as £10’s or £100’s of millions
over 10 years.

Manchester Green Infrastructure Strategy Technical Report
84
Under the Increase scenario ensuring all existing green spaces and the canal network function as
good quality green space results in significant gains in value. The present values (over 10 years) of
the benefits are estimated as: commercial property premiums of £27 million; residential property
premiums of £26m - £53m; and physical activity benefits (cost savings) of £6m - £10m.
It has previously been noted that the increase scenario uses improvements to the canal network
to demonstrate the benefits of this specific intervention but also more broadly to demonstrate the
benefits of increased access to green infrastructure in general. In practice the use of all linear
features such as river valleys, off-road cycle and pedestrian routes and others to improve
connectivity and accessibility , could further increase the potential benefits.

Manchester Green Infrastructure Strategy Technical Report
Table 13. Summary of analysis, Present Values (PV)
Land and property values
Commercial and industrial property premium
Impact description Scenario PV (10 years) commercial property premium
This analysis included the estimation of the potential rent
premiums attributable to (good quality) green space proximity.
This was estimated using the rent premium of 3% as provided by
literature.
Baseline £28.8 million
Decrease £16.7 million
Net impact of Decrease - £11 million
Increase £55.8 million
Net impact of Increase £27 million
Residential property premium
Impact description PV (10 years) residential property premium
This analysis included the estimation of the potential residential
property value attributable to proximity to (good quality) green
space. This was estimated using a range of 5% and 10% value
premiums as provided within the literature.
% of value premium 5% (Low) 10% (High)
Baseline £ 105 m £ 211 m
Decrease Value lost in 10 years
Increase total £ 132 m £ 264 m
Net Increase £ 26 m £ 53 m
Health and wellbeing
Physical health
Impact description PV (10 years) Potential savings to the economy, £
This analysis included the valuation of the physical activity
supported by local parks within MCC. The results indicate the
potential costs savings to the economy (from avoided inactivity)
of this activity supported by parks.
Low High
Baseline £ 41 m £ 71 m
Decrease £ 24 m £ 41 m
Net decrease - £ 17 m - £ 30 m
Total Increase £ 48 m £81 m
Net benefit Increase Low £ 6 m £ 10 m
Mental health
Impact description No. of people with mental
illness Annual costs - 2014
This analysis included an estimate of the number of people
suffering from mental illness who do not live in close proximity to
green space. The results indicate the magnitude of health costs
which the enhancement of green space has the potential to
mitigate.
Low High
Not in close proximity
(aggregation of each LSOA) 57,644 £ 511 m £ 766 m

Manchester Green Infrastructure Strategy Technical Report
86
In addition to the primarily economic analysis, the case studies used to understand the benefits of
GI have also demonstrated the following more general points worth summarising:
Partnerships with numerous community and civic groups and other stakeholders have an
important role for GI to be built and maintained and used to its full potential. As evidenced,
community involvement has been an important aspect of existing, successful city GI strategies
(e.g. New York City GI Strategy). It is therefore a recommendation that community engagement
is encouraged to ensure that GI investments are tailored to individual community needs. This
may be funded through the third sector and external funding, but consideration could also be
given to linking funding of community engagement, with targets to increase its use to support
health outcomes.
This involvement may also be linked to the success of GI investments meeting objectives and
delivering its full potential in terms of the benefits of increased exposure and access to green
space. For example, the full physical health benefits of existing or newly established parks are
more likely to be reached if coupled with a ‘campaign’ informing/involving the local communities
and encouraging physical exercise. Neighbourhood acceptance of GI options is very important,
and some GI strategies have found that pilot testing to show effectiveness can be critical for
widespread community support.
Pilot testing can also be a useful way of measuring the impacts of GI interventions. This will
allow for more realistic estimates of benefits for future projects, as well as a comprehensive
understanding of what works, where and why. This data will be useful in informing future GI
investment projects and ultimately help to construct a strong evidence base for GI investments.
It is therefore recommended that pilot testing be considered in GI investment projects going
forward
There are opportunities to further analyse the capacity for cost savings that can be realised by
GI compared to conventional/grey infrastructure (where relevant). For example, in order to gain
wide-reaching support for the establishment of a ‘Department of Green Infrastructure’ within
New York City’s Government, modelling was developed that showed that the GI strategy would
reduce more combined sewer overflows (CSOs) at significantly less cost to tax payers than the
all-grey alternative (NYC Department of Environmental Protection, 2010).
There may be an opportunity to develop a mechanism to incentivise developers to work with
planning authorities to explicitly consider the role of GI in creating value from development. The
first step to achieving this could be to undertake an appraisal of a development plan that does
not provide adequate GI exposure (e.g. measured through 2ha/300m objective or comparable
standards) together with a comparator scenario of a development plan that met the standard.
The purpose being to analyse how GI options could be more fully considered in property
development, and to challenge developers to be innovative in respect to GI provision.
Further research
Further research could be considered on the following topics:
∂ Innovative investment options in GI provision within city centre where there are spatial
constraints (e.g. green walls along spatially constrained linear features like canals to
complement other investments)

Manchester Green Infrastructure Strategy Technical Report
87
∂ A cost benefit analysis of specific options to increase GI provision could be carried out (e.g.
comparing the impacts of creating GI through enhancing linear waterways or creating it on
derelict land.)
∂ Manchester specific research into the mental health benefits of green infrastructure
∂ Green Business Improvement Districts could be trialled to cover management costs of GI,
particularly in higher value commercial locations (See Box 1).
∂ Fund pooling could be investigated if new public sector funding approaches are needed (See
Box 2).

Manchester Green Infrastructure Strategy Technical Report
88
Box 1 Green Business Improvements Districts
Improvements in GI can bring benefits to local businesses through more visitors and businesses
being attracted to, and spending time in, the local area. This can in turn increase the turnover for
existing businesses and encourage new ones to open or relocate to the area. This is an objective
of the Department for Business, Innovation and Skills - thus generating increased tax revenues.
Some of these revenues are likely to be displaced from elsewhere, but still constitute an
improvement for the given local area. Initiatives such as Green Business Improvements Districts
can be established to pool small contributions from individual private sector businesses, to invest
in local green infrastructure.
Box 2 Fund pooling
A system of ‘Fund pooling’ could be used to cut across departmental funding silos, encouraging or
requiring them to co-manage spending to achieve their objectives through cross-cutting GI
projects. Where management of GI involves multiple impacts on society, which are of interest to
and managed by different parts of the public sector, coordination between the groups may lead to
efficiency savings as well as increased funds and resources. These situations provide an
opportunity to adopt fund-pooling in order to improve the coordination of spending to deliver
multiple objectives.
There are different options for structuring a pooled-fund arrangement. The structures adopted will
depend on the actors involved and whose purse the budget is pooled from. The different
approaches include, but are not limited to:
A joint expenditure agreement can be established between local agencies and public bodies. The
partners must first identify existing or announced budgets that are assigned to fund interventions
that will be provided by the pool. They must then agree a level of contribution, which is managed
and used for the services specified in the agreement;
A scheme with an assigned budget can be imposed by a central authority. A secretariat may be
needed to manage the fund independently of offices from contributing departments. These
departments can then collaborate to develop project proposals to the secretariat, which acts as a
filter for determining strategic allocations, and
Cross-agency funding, a more controversial alternative, would involve one public spending agency
(e.g. a public health body) requesting funds from other spending bodies (e.g. benefits agencies) on
the basis of a spending intervention with significant pay-back to both (such as public health
interventions).
In any case, the pooled fund can benefit from a framework that defines the objectives of the fund,
and indicators of intended outputs and outcomes. This should aim to ensure that individual projects
contribute to program level strategic goals, shared by all different funders.
Fund-pooling approaches could be implemented at different geographical scales. Previous
examples (e.g. national security) are clearly suited to a national level, but for local green
infrastructure and health, the appropriate scale may be the local level at which public health or with
workforce or employment areas is managed (i.e. large towns or cities for the latter two).

Manchester Green Infrastructure Strategy Technical Report
89

Manchester Green Infrastructure Strategy Technical Report
90
Appendix 1 – Policy Context
Part One: Green Infrastructure Context
National Context
National Ecosystem Assessment
The National Ecosystem Assessment (June 2011) provided a comprehensive view of the state of
our environment as well as its critical economic and social value. The many ways in which the
environment supports us and provides for our needs is now being regarded by Government
agencies in terms of ‘ecosystem services’. Defra splits ecosystem services into the following
categories:
∂ Supporting Services: the services that are necessary for the production of all other ecosystem
services including soil formation, photosynthesis, primary production, nutrient cycling and water
cycling;
∂ Provisioning Services: The products obtained from ecosystems, including food, fibre, fuel,
genetic resources, biochemicals, natural medicines, pharmaceuticals, ornamental resources
and fresh water;
∂ Regulating Services: the benefits obtained from the regulation of ecosystem processes,
including air quality regulation, climate regulation, water regulation, erosion regulation, water
purification, disease regulation, pest regulation, pollination, natural hazard regulation;
∂ Cultural services: the non-material benefits people obtain from ecosystems through spiritual
enrichment, cognitive development, reflection, recreation and aesthetic experiences, thereby
taking account of landscape values.
The Natural Environment White Paper (2011)
The Government recognises the functions that green infrastructure delivers and its role in
underpinning individual and community health and well-being. These functions include: conserving
and enhancing the natural environment; providing wildlife corridors; reducing noise and air
pollution; providing access routes and providing a wide range of opportunities for engagement and
active citizenship, sport, recreation and children’ s play.
The Government’s Natural Environment White Paper, ‘The Natural Choice: Securing the Value of
Nature’, identifies the benefits of a healthy, functioning, natural environment and supports putting
nature at the heart of decision making.
The White Paper is informed by the findings of the National Ecosystem Assessment, which
showed that over 30% of the services provided by the natural environment are in decline along
with a reduction in the quality and quantity of urban greenspaces. The White Paper supports the
need for ecological networks in an approach that aims to halt biodiversity loss; and refers to green
infrastructure as completing ‘the links in our national ecological network’ and ‘one of the most
effective tools available to us in managing environmental risks such as flooding and heat waves’.

Manchester Green Infrastructure Strategy Technical Report
91
The White Paper introduced a number of policies and initiatives, including:
∂ Local Nature Partnerships (LNPs) work at a strategic scale for a better natural environment. The
LNPs are encouraged to work closely with Local Enterprise Partnerships (LEPs) and Health and
Well-being Boards to, among other things, contribute to local plan- and decision-making.
∂ Nature Improvement Areas (NIAs) are intended to enhance and reconnect nature on a
significant scale, where the opportunities and benefits justify such action. They provide bigger,
more connected places for nature to live in and adapt to climate change with a fund of £7.5
million to support the first 12 areas.
∂ NIAs are established through partnerships of local authorities, local communities, landowners,
the private sector and conservation organisations, based on a local assessment of opportunities
for restoring and connecting nature. The White Paper states that ‘local authorities will be able to
use local planning to support Nature Improvement Areas, including identifying them in their local
plans where they choose, while not deterring sustainable development’.
∂ Biodiversity Offsets are designed to deliver biodiversity benefits in compensation for losses
arising from development, through compensatory habitat expansion or restoration elsewhere.
The Biodiversity Strategy for England
The Biodiversity Strategy for England, ‘Biodiversity 2020: A Strategy for England’s Wildlife and
Ecosystem Services’, published by the Government in August 2011, builds on the Natural
Environment White Paper. It sets out how international and European Union commitments are to
be implemented and achieved. The reform of the planning system is identified as key to reducing
environmental pressure from planning and development, by taking ‘a strategic approach to
planning for nature’ and by retaining ‘the protection and improvement of the natural environment as
core objectives of the planning system ’. Priority action 3.4 of the Biodiversity Strategy sets out
how the approach of the planning system will guide development to the best location, encourage
greener design and enhance natural networks.
The UK is a signatory to the Convention on Biological Diversity (CBD) and is committed to the new
biodiversity goals and targets ‘the Aichi Targets’ agreed in 2010 and set out in the Strategic Plan
for Biodiversity 2011-2020.6 The UK is committed to developing and using a set of indicators to
report on progress towards these international goals and targets. The Aichi Targets are:
∂ Address the underlying causes of biodiversity loss by mainstreaming biodiversity across
government and society
∂ Reduce the direct pressures on biodiversity and promote sustainable use
∂ To improve the status of biodiversity by safeguarding ecosystems, species and genetic diversity
∂ Enhance the benefits to all from biodiversity and ecosystem services
∂ Enhance implementation through participatory planning, knowledge management and capacity
building

Manchester Green Infrastructure Strategy Technical Report
92
Healthy Lives, Healthy People White Paper
The White Paper, ‘Healthy Lives, Healthy People (2010): Our strategy for public health in England’,
also recognises that the quality of the environment, including the availability of greenspace and the
influence of poor air quality and noise, affects health and well-being. The “utilisation of greenspace
for exercise and health reasons” is referenced as an indicator in the Department of Health’s, ‘A
public health outcomes framework for England, 2013-2016’.
The EU Water Framework Directive
The EU Water Framework Directive was transposed into UK legislation by The Water Environment
(Water Framework Directive) (England and Wales) Regulations 2003 with a target for all inland
and coastal waters to meet ‘good ecological status’ by 2027. This includes rivers, streams, lakes,
estuaries, coastal waters and groundwater. In England, only 27% of waterbodies in England are
currently classes as being of ‘good status’. River Basin Management Plans have been developed
for all 11 river basin districts in England and Wales. These plans set out the status of water bodies
and the actions that are needed to meet European obligations and all public bodies have a duty to
have regard for these management plans and any supplementary plans in the exercise of their
functions.
Report of the Habitats and Wild Birds Directives Implementation Review March 2012
The Government strongly supports the aims of the Habitats and Wild Birds Directives to protect our
rarest and most threatened habitats and species, which contribute to the economic value of our
natural environment. This Government review aims to reduce burdens on business while
maintaining the integrity of the purpose of the Directives.
Sub-Regional – Greater Manchester
The Greater Manchester Climate Change Strategy 2011 – 2020
The ten Districts of Greater Manchester each have climate change plans approved or are in the
process of being developed, each with their own timescales, baselines and objectives. The
purpose of the Greater Manchester Climate Change Strategy is to work with each of these, with
the objective of trying to align and combine all these plans into a single, Greater Manchester-wide
plan.
The vision which is taken from the Greater Manchester Strategy is that ‘by 2020, the Manchester
city region will have pioneered a new model for sustainable economic growth based around a more
connected, talented and greener city region where the prosperity secured is enjoyed by the many
and not the few.’
The Strategy is based around four objectives, a series of priority actions and a set of indicators to
measure overall progress. The four objectives are:-
1. To make a rapid transition to a low carbon economy.
2. To reduce collective carbon emissions by 48% on 1990 levels.

Manchester Green Infrastructure Strategy Technical Report
93
3. To be prepared for and actively adapt to a rapidly changing climate.
4. To embed ‘Carbon literacy’ into the culture of organisations, lifestyles and behaviours.
Each objective is measured annually against two indicators. Objective 3 is measured through ‘the
extent, quality and productivity of green spaces and tree cover’.
Cities consume over two-thirds of the world’s energy and account for more than 70% of global
CO2 emissions. Manchester is one of 2,600 signatories in Europe that has signed up to the
Covenant of Mayors, committing themselves to exceed the EU’s 20% target for CO2 reductions.
There is some focus on the three themes of buildings, energy generation and transport, where
direct emissions arise. There is a fourth theme, the capacity of the environment to support delivery
of our objectives, expressed as ‘ecosystem services’, our green spaces and waterways (also
known as green and blue infrastructure). The fifth theme is sustainable consumption.
The Climate Change Strategy reports on programmes of activity that have commenced,
establishing a renewables-powered light rail system in Metrolink, creating new low carbon
buildings at the heart of regeneration, putting in place a sustainable solution to an annual 1.1 m
tonnes of municipal waste and valuing green spaces.
The University of Manchester’s EcoCities project highlights increases in high temperature and
heavy precipitation events that will increase the incidence of floods, droughts and heatwaves for
Greater Manchester. Managing these risks is critical to developing and maintaining future
economic resilience, raising the prospect of substantial future costs to the local economy. Much of
this can be avoided or mitigated by planned adaptation strategies that anticipate risks, protect
infrastructure and enhance resilience. Steps are already being taken to implement programmes
that maximise the opportunity cost of early action – protecting the future of our energy and
watercourse infrastructures, ensuring habitat connectivity to maximise species adaptation in local
biodiversity and through civil contingency planning.
Green and Blue Infrastructure is a key theme within the Strategy. It includes a commitment to
growth and a vision of a vibrant, modern economy, with communities enjoying a high quality of life
which is dependent upon a healthy, accessible natural environment.
Key outcomes for green and blue infrastructure by 2020 will be:-
∂ Carbon sinks will be protected, managed and enhanced as part of our carbon management
strategy; carbon sinks include the extensive peat and mossland areas of GM which are also
important biodiversity assets.
∂ A well coordinated green and blue infrastructure network that delivers cooling, shelter, resilience
and flood management, increasing urban tree cover, local biomass production and food
production within strategies that protect biodiversity and provide for local habitat adaptation.

Manchester Green Infrastructure Strategy Technical Report
94
∂ Integration of green infrastructure into the strategies and work programmes of all organisations
working in the growth, sustainability and wellbeing sectors including dissemination of research
into costs, levies, standards and benefits.
To achieve these outcomes, the Strategy includes a commitment to:
∂ Deliver better management of our green infrastructure
∂ Deliver improved management arrangements to develop and extend the scope, capacity and
use of our green infrastructure to maximise a full range of ‘ecosystem services’ – food, fuel,
shelter, recreation, resilience – across Greater Manchester and with neighbours across the
North West and beyond.
∂ Deliver work to identify, protect and enhance green and blue infrastructure to increase the
carbon sink, reduce emissions and generate energy.
∂ The GM Energy Plan will provide a basis for further work on energy potential from green
infrastructure and hydro related energies
∂ Influence, promote and identify sub-regional investment opportunities in green infrastructure, to
better shape the natural environment to enhance its ecosystems and fulfil growth support
functions and multifunctional use of land.
Other particular relevant areas of the GM Climate Change Strategy to Green Infrastructure include:
∂ The theme of recognising inequality, health and wellbeing – addressing the risk that people and
places facing poverty and disadvantage are likely to be disproportionately affected by climate
change, and ensuring that plans maximise their access to low carbon solutions. A targeted
outcome to 2020 is to have targeted flood risk management programmes in deprived
neighbourhoods.
∂ The Greater Manchester Spatial Framework is identified as a key mechanism for embedding
action on climate change within the spatial strategy – this includes the key outcomes of
developing the cross boundary frameworks for spatial and infrastructure planning both within
Greater Manchester and its neighbours, in order to accommodate all the opportunities and
challenges presented by climate change into future development priorities. Key outcomes
include identifying and protecting carbon sinks and high biodiversity areas.
Green Infrastructure Framework – Final Report – March 2011
Report Prepared by AGMA for the Planning and Housing Commission
The report is intended to summarise the GI priorities (assets, needs and opportunities) at a
strategic level with a focus on spatial and investment priorities and to draw together the significant
amount of work that has been done in Greater Manchester to promote Green Infrastructure and to
provide an evidence base to inform that investment. It identifies the value of a sub-regional
approach in informing how to use scarce funding resources and prioritises those interventions to
benefit GM as a whole. It also recognises that each of the 10 Local Authorities in GM are
responsible for delivering sustainable growth throughout GM and for driving forward local priorities.
To reflect the need for local delivery of GI, an Action Plan is also to be developed. The GM GI
Framework report was approved by both AGMA's Planning and Housing Commission and the
Environment Commission. So the document is an informal framework based on evidence.

Manchester Green Infrastructure Strategy Technical Report
95
This is a critical document in providing the Greater Manchester green infrastructure context and in
identifying priorities for action.
The Framework identifies that the challenge for Green Infrastructure in Greater Manchester is to:
∂ Contribute to reversing the legacy of past decline and to creating a setting for growth;
∂ Ensure that GM’s natural environment is resilient to meet the demands of economic and
population growth;
∂ Use existing and future GI assets in mitigation / adaptation and management of climatic risks, in
particular flood risk mitigation;
∂ Sub-regional priorities should respond to and inform local responses within GM communities,
delivery of GI should be a mix of top down and bottom up activity.
It further considers that Greater Manchester is working towards a ‘third generation’ GI strategy,
which integrates the concept of ecosystem services and considers the role of GI in sustaining a
low-carbon society which lives within environmental limits. In essence, where the city region grows
sustainably and manages the ecosystems on which it depends and where there is a prospering
population in combination with an urban area noted for quality of life and quality of place.
The Framework identifies that a positive approach to green infrastructure in the City Region is
essential if growth is to be sustained. There are six primary reasons:
1. It is an imperative of national and city-regional policy regarding sustainable development;
2. It brings economic and health benefits
3. It contributes to climate change mitigation and adaptation
4. It can offset the negative environmental and social effects of development and reverse the
legacy of poor environmental quality left from the 19th and 20th centuries
5. It meets the City’s twin aspirations of quality of life and quality of place; and
6. It is consistent with the City-Region’s intended ‘brand’ as an ambitious, green and vibrant
place.
Four areas of Manchester’s economy are identified where GI can contribute to the delivery of
sustainable growth and to economic development of the sub-region.
1. Enabling good quality housing and economic growth – referencing the case studies of New
East Manchester, Irwell River Park and the Oxford Road Corridor where the quality of the
public realm and the natural environment catalyses economic success and social
regeneration, as well as flood risk mitigation / managing climatic risks.
2. Improving health and well-being – low productivity is currently contributing to the
underperformance of GM in economic terms and low productivity is directly related to high
levels of poor health amongst residents. In GM many of the main outdoor destinations and
principal river valleys are close to the more economically and health deprived communities.
Investment in GI will yield health benefits and contribute to counteracting low productivity
levels.

Manchester Green Infrastructure Strategy Technical Report
96
3. Improving Manchester’s image as a place to visit and relocate to – Manchester’s GI is
already important in this but there is considerable scope to expand the visibility and range
of outdoor destinations, In parallel, the image of the City-Region is affected by its public
realm and quality of GI is a strong driver for the retention of families.
4. Contributing to a low carbon economy – attracting low-carbon economy businesses and an
opportunity to develop an exemplar of low-carbon urban planning.
GI assets have been mapped at the Greater Manchester level according to four clusters. For
Manchester, this cluster is Manchester, Salford and Trafford. The following assets were mapped:
∂ Urban, civic and green spaces, and waterways
∂ Wildlife corridors, stepping stones and greenways
∂ Sustainable movement network (Green routes for commuting and leisure)
∂ Landscapes of highly distinctive character
∂ Tracts of urban green i.e. built up areas characterised by high proportions of greenspace,
gardens and tree canopy.
The following map shows the green infrastructure provision across Greater Manchester. At this
scale, a lack of green infrastructure is clearly identified at the core of the conurbation, and at the
south of the conurbation.
Figure 1: Green Infrastructure Network: Green Infrastructure Assets (source: GI Network,
TEP, Natural England and AGMA)

Manchester Green Infrastructure Strategy Technical Report
97
GI opportunities are identified as areas that have policy or market priority for Economic Growth and
Transformation. Most of the investment identified within the Greater Manchester Strategy and
emerging Greater Manchester Spatial Framework is being made in areas which:
∂ Have important green infrastructure assets
∂ Are vulnerable to future environmental stresses
∂ Will support a growing number and/or ageing population which requires access to high quality
open space on the doorstep
∂ Already suffer from health deprivation or
∂ Are essential drivers for the economy by virtue of their location and accessibility.
The Oxford Road Corridor is identified where the major landowners (Universities, City Teaching
Hospital, City Council and Private developers) expect to make £2.5bn investment in new facilities
over the next 15 years. This context is mapped as follows, identifying areas of need (need and
environmental stress) and areas of economic investment at the GM scale.
For Manchester, areas of need are particularly prominent around the City Centre of Manchester
and its immediate hinterland. The areas of growth and investment identified include the Regional
Centre, New East Manchester, the Airport, Wythenshawe and South Manchester and Manchester
City Centre Piccadilly Basin / Oxford Road.
Eight GI growth support functions are identified:
1. Facilitating a low carbon society in a changing climate
2. An ecological framework
3. An active travel network
4. A sense of place and positive image and setting for growth
5. River, canal corridor and flood risk management
6. Supporting urban regeneration
7. Community health and enjoyment
8. Employment and skills development.
Where these are spatial, they have been mapped, as follows:

Manchester Green Infrastructure Strategy Technical Report
98
Figure 2: Green Infrastructure in a Changing Climate (source: GI Network, TEP, Natural
England and AGMA)
Figure 3: Green Infrastructure for Sustainable Movement (source: GI Network, TEP, Natural
England and AGMA)

Manchester Green Infrastructure Strategy Technical Report
99
Figure 4: Green Infrastructure and Distinctive Places (source: GI Network, TEP, Natural
England and AGMA)
Figure 5: Green Infrastructure and Urban Renaissance (source: GI Network, TEP, Natural
England and AGMA)

Manchester Green Infrastructure Strategy Technical Report
100
GI objectives have been developed and used to identify a series of investment priorities, which are
as follows. Relevant current investment initiatives are also provided in italics:
1. Strategic green infrastructure network – multifunctional areas of open land and water. The
returns on investment will be in health, access, amenity, biodiversity and tourism. Such
investment will sustain jobs in the visitor and natural economies.
The EA has led a project to assess future environmental infrastructure needs arising
through housing growth across Greater Manchester. Further to the report, the EA is keen to
assess and understand GI needs as part of an integrated understanding of environmental
infrastructure to ensure that investment supports growth.
2. Economic centres and growth points – an important component of AGMA’s ambition for
growth is the importance of revitalising the Greater Manchester town centres. Quality of
public realm is vital to economic success and image.
3. Regeneration priority areas – GI can help remediate brownfield land and create a better
setting for new development building investor confidence. Quality of public realm is vital to
economic success and image.
AGMA and the Homes and Communities Agency have agreed the second Local
Investment Plan which demonstrates the need for GI planning to be integrated into the
broader planning process at a local level. Other regeneration initiatives include GI
alongside housing renewal.
4. Destination parks, landmarks and trails – important GI destinations, as well as being valuable
in creating a sense of place, civic pride, stimulating health lifestyles and sustaining jobs in
tourism, leisure and recreation industries
5. An active travel network – effective management of GI can support the achievement of the
objectives set out in LTP3, particularly those in relation to climate change, public health and
sustainable neighbourhoods and public spaces.
6. Greening the urban environment – a strategy for ‘fine-grained’ GI
7. Community activism
Flood risk and water management are also current priorities in Greater Manchester and includes
the development of a GM Surface Water Management Plan and GM Flood Risk Capacity. It is
essential that GI plans are aligned with these plans to manage floods and water quality and it is
critical to economic growth to ensure continued water quality and supply and to reduce the risk of
flooding to households and businesses.
Of these seven investment priorities, it is suggested that the following four are key sub-regional
investment opportunities which are of most relevance to the current sub-regional spatial planning
agenda and are thematic priorities that link to the GMS Strategic Priorities. These are:
1. Strategic Green Infrastructure Network
2. Economic centres and growth points
3. Regeneration priority areas
4. An active travel network.

Manchester Green Infrastructure Strategy Technical Report
101
Challenges for spatial planning and GI are identified as:
∂ Identify and allocate land which is / could be performing critical GI functions
∂ Direct more resources from development gain into management of existing GI
∂ Increase the multi-functionality of open land
∂ Enhance GI functions across tracts of land, whether urban, open or rural
∂ Set empirical and qualitative standards for GI in terms of its functions
∂ Create new GI where it is needed to address deficiencies in quantity, quality, accessibility
and/or functionality.
Figure 6: Green Infrastructure Support Network (Source: TEP, Natural England and AGMA)

Manchester Green Infrastructure Strategy Technical Report
102
At the Greater Manchester level, an innovative approach is being taken in the face of budget
constraints to maximising the resources available. Approaches include:
∂ Establishment of a GM Community budget – including developing new approaches to
evaluating the costs and benefits of different interventions
∂ Bids to the Regional Growth Fund
∂ Development of Evergreen – a new investment model for property, business, low carbon and
housing, which seeks to match inherently viable schemes with available market funding. The
returns will be recycled into new regeneration schemes with the aim of optimising economic and
regeneration benefits
∂ Tax increment financing which allows Local Authorities to borrow against predicted growth in
their locally raised business rates and use that borrowing to fund key infrastructure and other
capital projects
This makes it clear that the investment decisions taken by AGMA will increasingly be informed by
consideration of the likely impact that such investment will have in economic, social and
environmental terms. If investment in green infrastructure is to be secured, investment proposals
will need to clearly demonstrate the economic, social and environmental benefits that will be
achieved and may need to be promoted as part of wider strategic investment proposals.
Delivery of the GI Action Plan will be through a combination of:
∂ The planning system
∂ Strategic environmental initiatives
∂ Greenspace and countryside management by local authorities’ open space teams
∂ Environmental activity by providers and managers of other civic infrastructure such as roads,
rivers, canals, flood defences, educations and health facilities
∂ Actions by community groups and corporate bodies and personal actions by individuals
∂ Community and neighbourhood planning.
Other Greater Manchester Authorities
In the context of the Greater Manchester Climate Change Strategy and Green Infrastructure
Network, it is useful to understand what green infrastructure strategies and documents are in place
for each local authority within Greater Manchester. There are significant opportunities for cross-
boundary working in relation to Green Infrastructure, which may offer significant benefits to GI.
Other documents in Greater Manchester include:
∂ Bury’s Green Infrastructure: Advice on Strategy and Implementation 2010
∂ Rochdale Township Green Infrastructure Action Plan 2013
∂ Trafford Greenspace Strategy 2009.
Manchester

Manchester Green Infrastructure Strategy Technical Report
103
Manchester Climate Change Strategy – Manchester: A Certain Future (M:ACF) –
Update 2013
This document represents the first full review of the Manchester Climate Change Strategy.
It identifies that an estimated 61% of the city is made up of parks, woodlands, river valleys, fields,
verges, canals and rivers, allotments and private gardens, which provides ‘green and blue
infrastructure’ provides the city’s residents with places to play and relax, routes to work, and
contributes to the quality of the city’s appearance for visitors and residents. Less obviously it
increases property values and contributes significantly to air quality and health and wellbeing. It
also provides a resource for urban wildlife, for climate-change adaptation and – particularly in the
city centre – for urban cooling and surface water management.
By 2009 Manchester had established a track record of partnership working to protect and enhance
the city’s green and blue infrastructure. Since then the city has increased its number of formally
designated Local Nature Reserves (LNRs) to eight, covering almost 400 hectares, and the
Medlock Valley project has been awarded the national waterways renaissance award for urban
regeneration.
∂ Tree planting – since 2009, more than 26,600 trees have been planted on known schemes,
including 26 new community orchards and fruit tree groves. Ensuring that these and other
existing trees thrive and can be protected in a changing climate remains a challenge.
∂ Third Sector – Red Rose Forest and Groundwork have continued to green the city, delivering
schemes ranging from city centre tree planting, the ongoing regeneration of the Irk and Medlock
river valleys, to delivering the city’s first ‘Meanwhile’ community food growing projects.
∂ Research – The EcoCities, GRABS, i-Trees and other projects have highlighted and detailed
the multifunctional benefits of GI across the city.
∂ Baseline data – a detailed baseline of the city’s green and blue infrastructure has now been
established: this will be used to produce the city-wide Green and Blue Infrastructure Strategy .
Other key actions noted are in relation to adaptation where research and co-ordination on the
importance of the city centre’s green infrastructure in terms of resilience and urban cooling has
been progressed by CityCo, EcoCities, AGMA and the Council.
Forthcoming actions identified for 2013 – 2015 are:
∂ The distribution of green infrastructure doesn’t necessarily currently meet all the city’s needs,
and its value may be underestimated. Protecting, promoting and developing our understanding
of the multi-functionality of our green and blue spaces will continue as a priority during 2013 to
2015.
∂ Ensuring that the ‘ecosystem services’ this infrastructure provides are maintained will be a
priority, as we will need to make more of these green and blue assets in the future, more fully
realising their scope and value in developing Manchester as a low carbon and climate-adapted
city.
∂ Headline aim: to ensure the city’s green and blue infrastructure is providing the optimal benefits
for the city in terms of quality of life, climate change adaptation, and wider social, economic and
environmental benefits.

Manchester Green Infrastructure Strategy Technical Report
104
∂ Headlines from 2015:
∂ A Green and Blue Infrastructure Strategy will be published and used in all parts of the city,
providing a framework for ensuring that natural environment benefits become and remain
embedded in our plans for neighbourhoods and the city centre.
∂ A programme of tree planting will have continued in the city, with an increase in street trees,
green roofs and green walls delivered or planned in the city centre.
∂ Investment in the quality and use of the city’s waterways will be better aligned with other
priorities so that flood-risk management, improved water quality, property values, recreational
and urban cooling benefits are linked with urban development and refurbishment.
∂ Community and friends groups, businesses and schools will be more actively involved in the
city’s green and blue spaces, and learn about the many benefits they can provide, including
health, recreation, climate change adaptation and mitigation.
∂ Data held on all the city’s green and blue infrastructure will have been improved and updated
and made publicly available, growing a shared understanding of its value for climate-change
adaptation, biodiversity, health and wellbeing, education and recreation.
A number of actions are identified by location. This includes sustainable development opportunities
that may incorporate green infrastructure and more explicit green infrastructure actions.
North Manchester
Example actions will include:
∂ The continued delivery of the Irk Valley Local Plan will be maximising the potential to adapt the
local area to climate change through growing local food and providing routes for walking and
cycling.
East Manchester
Example actions will include:
∂ Re-naturalisation of sections of the River Medlock will be delivered to reduce flood risk, improve
water quality, and create a valuable asset for residents, businesses and wildlife.
City Centre
Example actions will include:
∂ Completing the first phase of the NOMA development will establish this as the city’s new
sustainable business district, including its own low-carbon energy centre.
Central Manchester
Example actions will include:
∂ The University of Manchester’s ambitious £1billion programme of rationalisation and
redevelopment will be underway, helping to establish a low-carbon estate fit for the 21st
century, on track to achieve 40% CO2 reduction targets by 2020.

Manchester Green Infrastructure Strategy Technical Report
105
∂ Manchester Metropolitan University will deliver its Birley Fields campus to exemplary low-
carbon standards and will continue to deliver a range of energy efficiency improvements to
reduce CO2 emissions by 35% by 2015/16.
∂ The delivery of the cross-city bus package will significantly improve bus, pedestrian and cycling
access along the Oxford Road Corridor.
South
Example actions will include:
∂ The regeneration of Alexandra Park will be completed; this will provide a resource at the heart
of the community for sustainable travel, recreation and help to adapt Whalley Range and Moss
Side to climate change.
∂ The Mersey Valley will be managed to maximise its value to the local community and to
manage flood risk in this part of the city.
Wythenshawe
Example actions will include:
∂ Residents and organisations will benefit from healthy, sustainable food through the £1million
Wythenshawe Real Food project, and the Garden City Festival will continue to showcase
‘green’ activity across the area.
Manchester City Council Climate Change Delivery Plan 2010 – 2020
This City Council’s Delivery Plan sets out the organisation’s commitment to contribute to the
delivery of MACF. With regards Green Infrastructure, the Delivery Plan identifies that the Council
manages 138 parks, 40 areas of allotments, 2 Local Nature Reserves, 15 sites of biological
importance as well as street trees, gardens, verges, and other areas of woodland, grassland and
open space.
The Council has a long-standing track record of maximising the benefits of the city’s green spaces
and has begun to develop an understanding of the city’s green infrastructure as a whole. The large
number of Green Flags in parks (30) and the Biodiversity, Tree and Waterways Strategies
evidence this work and recent support of the Eco–Cities Project, work on green roofs and I-trees
reflects the links to climate change monitoring and adaptation.
Headline Actions include:
∂ The Council will produce a comprehensive Green Infrastructure Plan. Based on the Green
Infrastructure Plan, the Council will work with partners to develop and establish programmes for
maximising the benefits of the city’s green infrastructure assets in the realisation of a ‘greener
city’. This will include developing green spaces and green roofs in the city centre, developing
food production both by community groups and by enterprise, realising the capacity of the
landscape to alleviate the effects of extreme weather events and provide amenity, biodiversity,
urban cooling and small scale biomass production. It will also involve applying the principles of

Manchester Green Infrastructure Strategy Technical Report
106
sustainable land management to all the green and vacant land in the city, and maximising the
productive use of all land including that in a cycle of neglect or awaiting development.
∂ The Council will further develop its understanding of the direct and indirect impacts of a
changed climate and the need for buildings, spaces and services to be adapted accordingly.
Work on the conservation of natural resources, particularly water, changing biodiversity and
managing increased incidence of extreme weather conditions will be incorporated into the
planning and design of open spaces.
∂ The Council will work with partners to promote the visual amenity of the city as a green city and
develop understanding and appreciation of the value and benefits of green spaces and green
infrastructure in the functionality of a low carbon economy. This will include operating at a
neighbourhood level, through support of campaigns and school and community programmes
and at a city-wide level, using marketing, the arts and partnership activity to raise awareness.
Key green infrastructure actions to be undertaken by Manchester City Council
∂ Carry out a co-ordinated Land Audit of the city region to assess current and potential future land
use.
∂ Install ‘cool pavement’ materials to increase surface reflectivity and rainfall permeability to
combat the urban heat island effect and help to reduce the risk of localised flooding.
∂ Identify sustainable and innovative options to increase the coverage of public green
infrastructure in the city, including supporting the Piccadilly and Oxford Road Corridor public
realm developments
∂ Identify best practice in managing GI in response to climate change – using international
research as well as local planning and ecology experts.
∂ Support the Eco Cities project and other research into GI and spatial planning
∂ Research and identify species and habitats that are suited to predicted future climates, including
identification of species/habitats that are likely to decline
∂ Identify and implement best practice in soil management.
∂ Explore development of trial bio-fuel and biomass planting and timber waste fuel production to
progress alternative and sustainable energy production.
∂ Review and improve methods of green space master planning in development, including setting
standards for the quality, accessibility and quantity of open space.
∂ Increase tree coverage in Manchester – including street trees and woodland cover – and
remediate derelict, underused and neglected land and brown field spaces into maintained green
space.
∂ Work towards the completion and implementation of management plans for Council-owned
woodland, parks and river valleys
∂ Seek to retain and improve existing open spaces, sport and recreation facilities, and provide a
network of diverse, multi-functional open spaces.
∂ Develop guidance to ensure GI based adaptation measures are considered as part of any new
development, and are supported by policies in the Local Development Framework where
possible.
∂ Increase installation of green roofs within the city, both on new developments and retrofitted to
existing buildings

Manchester Green Infrastructure Strategy Technical Report
107
∂ Encourage zero net external water requirements of external landscapes in new developments.
∂ Identify and develop good practice in resolving legislation for private gardens, including
enforcement and regulation to assist in sustainable use of land by individual private owners.
∂ Maximise the contribution of gardens and individual/household space to green infrastructure,
including advice and training on sustainable garden management, domestic composting and
grow-your-own schemes.
Manchester Biodiversity Strategy (2005)
The key objectives within the Biodiversity Strategy are:
∂ To create a full species and habitat audit to establish a baseline of biodiversity in the city.
∂ To use a best practice approach when managing for biodiversity.
∂ Promote biodiversity in Manchester.
∂ Promote biodiversity through environmental education.
∂ Integrate biodiversity into the wider sustainable development agenda.
It identifies priority habitats in Manchester:
Manchester Priority Habitat Best Examples in Manchester of Priority Habitats
Acid Grassland Bailey’s Wood
Alconbury Flushes
Blackley Forest
Ancient and/or species-rich
hedgerows
Stenner Lane near Fletcher Moss
Sunbank Lane
Wet Woodlands Nan Nook Wood
Stenner Woods
Blackley Forest
Lowland broadleaved
woodland
Baileys Wood
Rosehill Wood
Heaton Park
Cotteril Clough
Lowland heathland Alconbury Flushes
Moston Fairway
Boggart Hole Clough
Blackley Forest
Lowland meadows Chorlton Ees
Unimproved neutral grassland Chorlton Water Park
Castle Hill Farm nr Manchester Airport
Marshy grassland Broadhurst Clough
Moston Fairway
Managed greenspace All Manchester parks

Manchester Green Infrastructure Strategy Technical Report
108
Reedbed Chorlton Ees
Harpurhey Reservoirs
Clayton Vale
Rivers River Mersey
River Medlock
River Irk
Canals Rochdale Canal
Ashton Canal
Bridgewater Canal
Ponds and Lodges Near to the Manchester Airport Runway and adjacent to
Cotteril Clough
The current priority species that occur in Manchester:
Great Crested Newt Tree sparrow
∂ Water Vole ∂ Grey partridge
∂ Brown Hare ∂ Bullfinch
∂ Pipistrelle bat ∂ Song thrush
∂ Skylark ∂ Floating water plantain
∂ Linnet ∂ Grass-wrack pondweed
∂ Reed bunting ∂ Manchester poplar
∂ Spotted fly-catcher
Actions identified for biodiversity in Manchester include:
∂ To ensure that biodiversity is managed sensitively in Manchester’s parks and open spaces
∂ Inclusion of biodiversity into the review of the Local Development Plan and other key strategies
∂ To encourage environmentally friendly development
∂ Promote the importance of biodiversity in the development process
∂ Investigate funding to support projects
Citywide Sport, Open Space and Recreation Study
The Open Space and Recreational Needs Assessment for Manchester identifies nine types of
outdoor open space. These are: parks and gardens, natural and semi-natural open space, amenity
greenspace, provision for children, provision for young people, outdoor sports facilities, allotments
and community gardens, green corridors, churchyards and cemeteries.
The Study included an audit of the existing provision of open space using the nine typologies and a
quality assessment of the sites. Sites were also assessed against their accessibility and wider
benefits. This audit and assessment, along with consultations carried out with stakeholders and the
public to identify open space needs and benchmarking of standards, were all analysed to develop
appropriate local standards for open space provision. These are as follows:

Manchester Green Infrastructure Strategy Technical Report
109
Typology Quantity Standard
(ha per 1000
population)
Accessibility
Standard
Quality Percentage
Score required
City Parks 0.20 – equivalent to
existing provision
15 minute drive 85%
Local Parks 0.49 – equivalent to
existing provision
10 minute drive 81%
Natural and Semi
Natural Open Space
1.90 – equivalent to
existing provision
15 minute walk time
15 minute drive time
(City Centre)
85%
Amenity Green
Space
0.40 – equivalent to
existing provision
10 minute walk 85%
Provision for
Children
0.027 – above
existing provision
10 minute walk 86%
Provision for Young
People
0.034 – above
existing provision
15 minute walk 81%
Outdoor sports
facilities
0.98 – equivalent to
existing provision
15 minute walk time
30 minute drive to
golf courses only
90%
The Assessment provides key findings for each open space typology, with key conclusions as
follows:
∂ Parks and Gardens - There is an even distribution across Manchester and the focus should be
on enhancing the quality of existing parks and gardens. The accessibility standard indicates
some gaps in provision in East Manchester, South Manchester and Wythenshawe.
∂ Natural and semi-natural open space – the lowest levels of provision are in Central Manchester
and the City Centre and the highest levels in North Manchester and East Manchester.
Improvements to access and quality are recommended.
∂ Amenity green space – there is an inconsistent level of amenity green space across the City.
The lowest quantitative levels are in South Manchester.
∂ Provision for children and young people – the consultation identified a shortfall in equipped
children’s play and the recommendation is for enhanced quality and increased provision where
needed.
∂ Outdoor sports facilities – key issues identified were of quality and access and the standards
identify some deficiencies, although a demand related study is needed to quantify requirements
more accurately (e.g. Playing Pitch Strategy)
∂ Allotments – application of the accessibility standard indicates a sporadic distribution but overall
accessibility is good. There are waiting lists for a number of sites and quality improvements
have been undertaken. Recommendations include changes to the management of sites to
maximise the number of residents that are able to rent plots.

Manchester Green Infrastructure Strategy Technical Report
110
∂ Cemeteries and churchyards – the focus should be placed on enhancing the quality of existing
sites, promoting nature conservation value and investigating the implementation of ecological
management.
∂ Green Corridors – these have not been audited as part of the study but their protection and
development is of high priority and they are an important part of the linked open space network.
Issues are also identified for each Strategic Regeneration Area. Both the city-wide and area issues
are addressed through a series of recommendations. In particular, this includes:
Parks and
Gardens
∂ Protect all existing parks
∂ Investigate the potential for new park provision in the Whalley
Range / Chorlton Park area and the City Centre
Natural and Semi-
Natural Open
Space
∂ Protect natural and semi-natural open spaces
∂ In South and Central Manchester, integrate natural and semi-natural
open spaces with other types of open space, for example, ensure
that parks contain an area of natural space
Amenity Green
Space
∂ Provision of new amenity space associated with new development,
where it falls outside of the catchment for an existing amenity space
and the quantity of provision is below the minimum standard
∂ In South Manchester, consider opportunities to provide new amenity
space and / or local park in areas currently devoid of provision
∂ Consider the provision of new amenity space where opportunities
arise in the City Centre or through alternative solutions such as roof
gardens
Provision for
children and young
people
∂ In Wythenshawe, provide new children and young people facilities
where there are deficiencies, e.g. Northenden / Sharston and
Brooklands.
∂ Provide up to seven new facilities for children in North Manchester
∂ Provide new facilities in South Manchester, particularly in Whalley
Range
∂ Provide new facilities for young people across South Manchester,
particularly in West Didsbury and Chorlton Park
∂ Provide new facilities for children in Ardwick and Longsight
∂ Provide new facilities for children in the Miles Platting / Newton
Heath Area of the city
∂ Provide a new facility for young people in the Gorton area
∂ Provide one or two new facilities for children in the city centre
∂ Provide at least two dedicated facilities for young people in the City
Centre to cater for residents and visitors
Outdoor sports
facilities
∂ Protect all outdoor sports facilities from development
∂ Seek to improve the quality of outdoor sports facilities
Manchester Green Infrastructure Strategy Technical Report
111
Allotments ∂ Protect all existing allotment sites
∂ Consider policies for the management and usage of allotment plots
including the provision of half plots
Green Corridors ∂ Investigate the feasibility of a green infrastructure study to help
maximise the linkages of open spaces with green corridors and help
to create a network of multi-functional greenspace in Manchester.
Manchester Tree Strategy
The Tree Strategy aims to secure a long-term future for our trees and woodlands, providing the
right management and strong protection for generations to come.
Trees in Manchester are mainly found as street trees, woodlands including semi-natural woodland,
young self-seeded woodland and green corridors, hedgerows, parks, open spaces and allotments,
trees in private ownership including University grounds, railway sidings and residential gardens,
schools and churchyards and cemeteries.
Practical actions include:
∂ The preparation of management plans and biodiversity assessments for all Council owned
Woodlands by 2010.
∂ The development of a single system approach for tree data recording in 2008.
∂ The review of all tree related polices as part of the Local Development Framework by 2008.
∂ The establishment of Voluntary Tree Wardens by 2007.
∂ The delivery of over 50 tree related events and activities annually.
∂ Campaigns in schools and communities to promote the value of trees.
∂ The planting of over 16,000 trees by 2010.
Part Two: Planning and Development Context
National
The National Planning Policy Framework
The National Policy Framework (NPPF) sets out the Government’s planning policies for England
and how these are expected to be applied. The importance of green infrastructure is firmly
embedded in the NPPF and states: ‘Local planning authorities should: set out a strategic approach
in their Local Plans, planning positively for the creation, protection, enhancement and management
of networks of biodiversity and green infrastructure’ (paragraph 114).
The role of GI in addressing climate change is also embedded within the NPPF which states that
‘Where new development is brought forward in areas which are vulnerable, care should be taken
to ensure that risks can be managed through suitable adaptation measures, including through the
planning of green infrastructure’.

Manchester Green Infrastructure Strategy Technical Report
112
The NPPF clearly supports the objectives set out in the Natural Environment White Paper by
stressing a proactive and strategic approach to planning for the natural environment. The NPPF
requires local authorities to ‘plan for biodiversity at a landscape scale across local authority
boundaries’ and ‘identify and map components of the local ecological networks, including the
hierarchy of international, national and locally designated sites of importance for biodiversity,
wildlife corridors and stepping stones that connect them and areas identified by local partnerships
for habitat restoration or creation’.
The NPPF makes it clear that ‘Plans should allocate land with the least environmental or amenity
value’ when practical and while having regard to other policies in the NPPF.
The NPPF also states that local planning authorities should develop criteria-based polices setting
out how developments on, or affecting, protected wildlife sites should be judged, making
distinctions between the hierarchy of international, national and locally designated sites. Planning
policies and decision-making should seek to protect and enhance natural and heritage assets
appropriate to their significance. Policies and decisions should also encourage multiple benefits
from land use, recognising benefits such as wildlife, recreation, flood risk mitigation, carbon
storage and food production.
The NPPF also states that the planning system should contribute to and enhance the natural and
local environment by: ‘Minimising impacts on biodiversity and providing net gains in biodiversity
where possible, contributing to the Government’s commitment to halt the overall decline in
biodiversity, including by establishing coherent ecological networks that are more resilient to
current and future pressures’.
The NPPF identifies sustainable development as the purpose of the planning system and
conserving and enhancing the natural environment as a ‘core planning principle’. While specific
policies on conserving and enhancing the natural environment are addressed in the NPPF, these
should not be considered in isolation, as other natural environment related policies and their
consideration in plan- and decision-making, can be found throughout the document, specifically in
relation to GI and evidence-gathering. The objectives for the natural environment within the
planning system are set out and state that the ‘planning system should contribute to and enhance
the natural and local environment by’:
∂ Protecting and enhancing valued landscapes, geological conservation interests and soils;
∂ Recognising the wider benefits of ecosystem services;
∂ Minimising impacts on biodiversity and providing net gains in biodiversity where possible,
contributing to the Government’s commitment to halt the overall decline in biodiversity, including
by establishing coherent ecological networks that are more resilient to current and future
pressures;
∂ Preventing both new and existing development from contributing to or being put at unacceptable
risk from, or being adversely affected by unacceptable levels of soil, air, water or noise pollution
or land instability;

Manchester Green Infrastructure Strategy Technical Report
113
∂ Remediating and mitigating despoiled, degraded, derelict, contaminated and unstable land,
where appropriate.
Greater Manchester
Devolution
There is a long history of collaboration through the Association of Greater Manchester Authorities
(AGMA) strengthened further by the establishment of the Greater Manchester Combined Authority
(GMCA), the Greater Manchester Local Enterprise Partnership (LEP) and Transport for Greater
Manchester (TfGM).
This has been strengthened further by the recent announcement for devolution in Manchester
(November 2014). This has the potential for greater decision making and funding power within
Greater Manchester which could have an impact on a wide range of development and
infrastructure in Manchester, including Green Infrastructure. The details of how this may work in
Manchester are not fully defined at present.
Greater Manchester Growth and Reform Plan, March 2014, GMCA, Greater
Manchester LEP and AGMA
This Growth and Reform Plan is a proposal to work with Government to design and deliver growth
and reform at a new level. The vision is for Greater Manchester to become a financially self-
sustaining city, closing the gap between the tax that is generated through growth and the cost of
delivering public services.
The plan outlines several financial proposals specifically designed to support the transport and
connectivity requirements of Greater Manchester; further develop our business support and skills
capacity to meet the needs of employers; and fill gaps in the region's Life Science offer and the
eco-system associated with Graphene. The document also outlines several proposals to address
business support, apprenticeships and transport. Although the document describes the
overarching or strategic context for growth in Greater Manchester, the proposals are not relevant
for the purpose of studying green infrastructure.
Greater Manchester Strategy (Stronger Together)
The Greater Manchester Strategy sets an overarching vision for Greater Manchester which is: By
2020, the Manchester city region will have pioneered a new model for sustainable economic
growth based around a more connected, talented and greener city region where all our residents
are able to contribute to and benefit from sustained prosperity and enjoy a good quality of life.
The natural environment in GM brings great benefits and it must be protected and enhanced to
improve the quality of life for its residents. The natural environment can also contribute significantly
to economic growth, creating attractive places where people want to invest and work, through its
role in the visitor economy and through the creation of jobs and businesses that support our green

Manchester Green Infrastructure Strategy Technical Report
114
and blue assets. Fundamental to the approach to growth must be a successful transition to a low
carbon economy.
Manchester Community Strategy Refresh 2012 – 2015
The vision is of Manchester as a world-class city as competitive as the best international cities:
∂ that stands out as enterprising, creative and industrious
∂ with highly skilled and motivated people
∂ with successful neighbourhoods whose prosperity is environmentally sustainable
∂ where all our residents can meet their full potential, are valued and secure.
Greater Manchester Spatial Framework
A joint plan is in production to manage the supply of land to support jobs and new homes in
Greater Manchester. It will be an overarching Development Plan Document within which the ten
local planning authorities identify and manage the supply of land for jobs and new homes in
Greater Manchester. The document is at the initial evidence gathering stage and has been subject
to initial consultation between September 26th and November 7th 2014.
The key focus of the document is on identifying Greater Manchester’s housing and employment
land requirements, strategic locations for development and key infrastructure proposals required to
deliver the scale of development envisaged. This scope is not formally defined and this is part of
the consultation process. It could therefore be widened to cover issues such as strategic green
infrastructure.
Greater Manchester Authorities – GI Supplementary Planning Documents
The following table identifies the Supplementary Planning Documents produced across Greater
Manchester which support GI provision. This principally relates to policies for new open space
provision in new housing development but also documents which require approaches to new
development that address biodiversity and climate change issues through new development. This
is a useful context, along with a national review for approaches that could be adopted in
Manchester. This research will inform the development of the Green Infrastructure Strategy and
Action Plan.
Authority Planning Documents
Stockport ∂ Recreational Open Space Provision and Commuted Payments
Tameside ∂ Trees and Landscaping on Development Sites
∂ Developer Contributions
Oldham ∂ Open Space Interim Planning Position Paper – sets out how the council will
deal with open space contributions for the borough when determining
planning applications for relevant development that may impact on open
spaces
Rochdale ∂ Biodiversity and Development Supplementary Planning Document - The
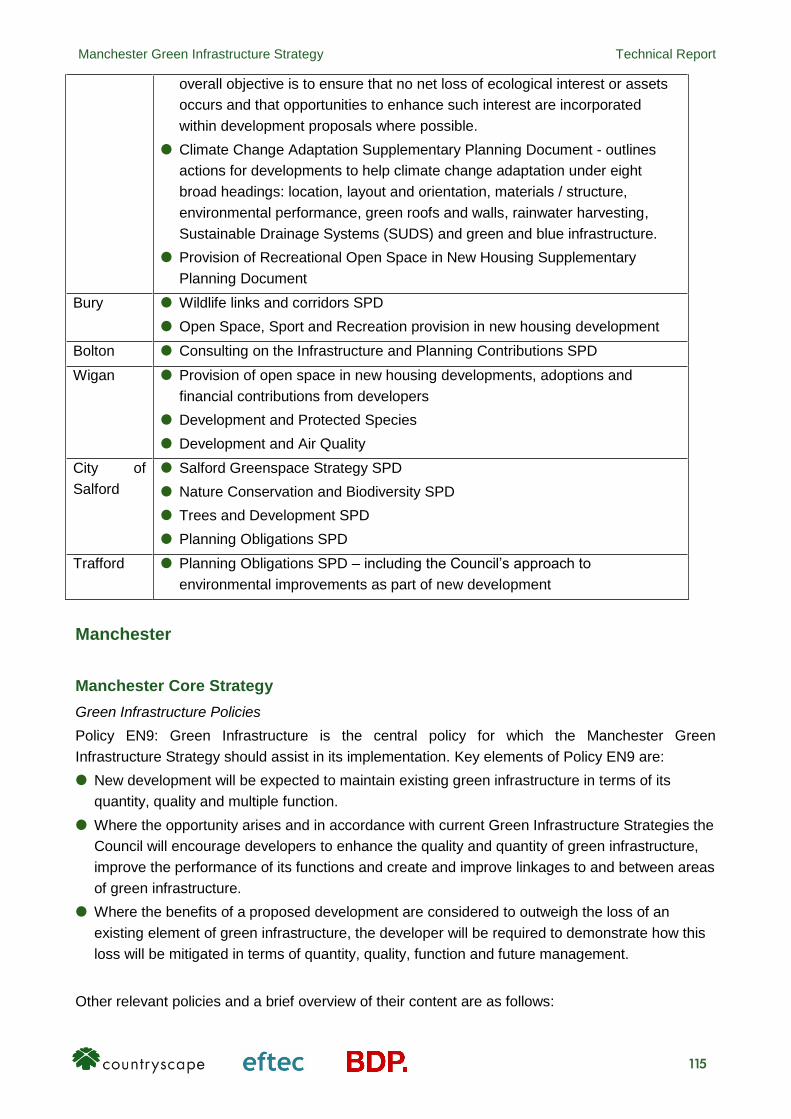
Manchester Green Infrastructure Strategy Technical Report
115
overall objective is to ensure that no net loss of ecological interest or assets
occurs and that opportunities to enhance such interest are incorporated
within development proposals where possible.
∂ Climate Change Adaptation Supplementary Planning Document - outlines
actions for developments to help climate change adaptation under eight
broad headings: location, layout and orientation, materials / structure,
environmental performance, green roofs and walls, rainwater harvesting,
Sustainable Drainage Systems (SUDS) and green and blue infrastructure.
∂ Provision of Recreational Open Space in New Housing Supplementary
Planning Document
Bury ∂ Wildlife links and corridors SPD
∂ Open Space, Sport and Recreation provision in new housing development
Bolton ∂ Consulting on the Infrastructure and Planning Contributions SPD
Wigan ∂ Provision of open space in new housing developments, adoptions and
financial contributions from developers
∂ Development and Protected Species
∂ Development and Air Quality
City of
Salford
∂ Salford Greenspace Strategy SPD
∂ Nature Conservation and Biodiversity SPD
∂ Trees and Development SPD
∂ Planning Obligations SPD
Trafford ∂ Planning Obligations SPD – including the Council’s approach to
environmental improvements as part of new development
Manchester
Manchester Core Strategy
Green Infrastructure Policies
Policy EN9: Green Infrastructure is the central policy for which the Manchester Green
Infrastructure Strategy should assist in its implementation. Key elements of Policy EN9 are:
∂ New development will be expected to maintain existing green infrastructure in terms of its
quantity, quality and multiple function.
∂ Where the opportunity arises and in accordance with current Green Infrastructure Strategies the
Council will encourage developers to enhance the quality and quantity of green infrastructure,
improve the performance of its functions and create and improve linkages to and between areas
of green infrastructure.
∂ Where the benefits of a proposed development are considered to outweigh the loss of an
existing element of green infrastructure, the developer will be required to demonstrate how this
loss will be mitigated in terms of quantity, quality, function and future management.
Other relevant policies and a brief overview of their content are as follows:

Manchester Green Infrastructure Strategy Technical Report
116
Policy Overview
SP1: Spatial Principles The City’s network of open spaces will provide all residents with good
access to recreation opportunities. The River Valleys (the Irk,
Medlock and Mersey) and City Parks are particularly important, and
access to these resources will be improved.
EN1: Design Principles
and Strategic Character
Areas
Identifies a number of characters of which GI is likely to play an
important part of the character of the majority of identified areas. This
includes the City Centre, The Corridor, Heaton Park, Northern, Irk
Valley, Central Arc, Medlock Valley, Southern, Mersey Valley, Wider
Wythenshawe and Airport / Urban Fringe.
EN8: Adaptation to
Climate Change
In achieving developments which are adaptable to climate change,
developers should have regard to minimisation of flood risk, reduction
in the urban heat island effect through GI and the opportunity to
provide linked and diverse green space. GI such as green roofs,
green walls, street trees and waterways will accepted as contributing
to complying with CO2 mitigation under Policy EN6, subject to
sufficient evidence to quantify this contribution.
EN10: Safeguarding Open
Space, Sport and
Recreation Facilities
The Council will seek to retain and improve existing open spaces,
sport and recreation facilities to the standards set out below this table
and provide a network of diverse, multi-functional open spaces.
Proposals will be supported that:
∂ improve the quality and quantity of accessible open space, sport
and recreation in the local area
∂ provide innovative solutions to improving the network of existing
open spaces, increase accessibility to green corridors, and
enhance biodiversity
∂ improve access to open space for disabled people
EN11: Quantity of Open
Space, Sport and
Recreation
The Council will seek the provision of new open space, sport and
recreation facilities, in particular where:
∂ a quantitative shortage of a particular use per head of
population, including any expected increase of population
created by the new development, based on the findings of the
Open Space, Sport and Recreation study and Playing Pitch
Strategy, is identified in the local area;
∂ where significant levels of development are proposed including
within the Strategic Housing Location.
EN12: Area priorities for
Open Space, Sport and
Recreation
∂ The priorities for open space, sport and recreation in the City set
out in Manchester's Strategic Open Space, Sport and
Recreation Study and within the regeneration areas include the
following:-
∂ North area: ensure that new development will deliver
improvements to the quality of existing provision.

Manchester Green Infrastructure Strategy Technical Report
117
∂ East Manchester: enhance existing facilities and provide new
spaces and facilities in accessible locations.
∂ City Centre: enhance quality of existing areas and integrate new
facilities within the character of the area.
∂ Central area: improve accessibility to nearby open space and
facilities as well as address deficiencies where possible.
∂ South area: enhance the quality of existing provision and using
opportunities to address deficiencies.
∂ Wythenshawe: improve existing facilities and sites.
EN14: Flood Risk ∂ All new development should minimise surface water run-off,
including through Sustainable Drainage Systems (SUDS) and
the appropriate use of Green Infrastructure. Developers should
have regard to the surface water run-off rates in the SFRA Use
Guide.
∂ Where feasible and appropriate development should seek to
open up culverted/hidden rivers to reduce the associated flood
risk and danger of collapse, taking advantage of opportunities to
enhance biodiversity and Green Infrastructure.
EN15: Biodiversity and
Geological Conservation
∂ The Council will seek to maintain or enhance sites of biodiversity
and geological value throughout the City. Particular
consideration is afforded to recognised biodiversity sites.
∂ Developers will be expected to identify and implement
reasonable opportunities to enhance, restore or create new
biodiversity, either on-site or adjacent to the site, contributing to
linkages between valuable or potentially valuable habitat areas
where appropriate.
EN17: Water Quality Similar to policy EN14, the key areas in which GI can play a role are
in the promotion of SUDs (policy requires that the use of appropriate
SUDs is maximised) and opening up culverted watercourses to
enhance ecological value (where feasible and appropriate with
development).
DM1: Development
Management
All development should have regards to a range of issues for
including Green Infrastructure including open space, both public and
private.
Standards for Open Space, Sport and Recreation Provision (Policy EN10)

Manchester Green Infrastructure Strategy Technical Report
118
Manchester City Council has a Development Contributions Policy PA1. The Council intends to
continue to use S106 Planning Obligations during a transitional period when consideration will be
given to the introduction of a standard tariff or Community Infrastructure Levy system.
Policy PA1 states that through such obligations (planning obligations, Community Infrastructure
Levy regulations or successor regulations/ guidance), the Council may seek contributions for a list
of items including provision for green infrastructure including open space, as well as, health and
wellbeing facilities, public realm improvements, protection and enhancement of environmental
value and climate change mitigation / adaptation. This is to be considered on a site by site basis.
Where appropriate, any such provision will be required to be provided on site. Where this is not
possible, a commuted sum payment is likely to be sought.
In determining the nature and scale of any planning obligation, specific site conditions and other
material considerations including viability, redevelopment of previously developed land or
mitigation of contamination may be taken into account.
Future Development in the City
Policies within the Core Strategy identify the following provision of new development in each of the
Regeneration Areas as follows and summarised on the key diagram.

Manchester Green Infrastructure Strategy Technical Report
119
Figure 7: Manchester Core Strategy Key Diagram

Manchester Green Infrastructure Strategy Technical Report
120
City Centre
∂ Manchester City Centre 33ha employment land (2010-2017) focus for B1a development
will be:
∂ Civic Quarter
∂ Mayfield
∂ Spinningfields and Granada lands
∂ The Corridor (Oxford Road Corridor, Great Jackson Street and First Street)
∂ Piccadilly
∂ Health, education, retailing, cultural and tourism facilities, and other employment
generating uses mainly in the City Centre and Eastlands.
∂ Approximately 70,000 square metres net of new comparison retail floorspace will be
provided in the City Centre over the plan period.
∂ 2010-2017 – 27,000sqm
∂ 2017-2022 – 16,000sqm
∂ 2022-2027 – 27,000sqm
Concentrated within the Primary Shopping Area (PSA), followed by accessible locations on
the edge of the PSA
∂ A minimum of 4,500 square metres net of convenience floorspace will be provided in the
City Centre over the plan period.
∂ The City Centre will see the most intensive development of housing in the City. It is
expected that a minimum of 16,500 new units will be provided from 2010-2027.
∂ 170 p/a 2011-2016
∂ 1,310 p/a 2016-2021
∂ 1,480 p/a 2021-2027
North Manchester
∂ City Centre Fringe (including Strangeways, Collyhurst, Ancoats, New Islington and
Manchester Science Park) 25ha of employment land (2010-2017) (includes areas outside
of North Manchester)
∂ 14ha of employment land by 2027 (1ha per annum)
∂ Office B1a led mixed use development at:
∂ Strangeways
∂ Collyhurst
∂ Significant existing employment and economic development is found in:
∂ Strangeways Employment Area north of the City Centre fringe, suitable for retention
and growth of general industry, warehousing and distribution
∂ Collyhurst, north of City Centre Fringe, an area with a number of major employers
∂ Cheetham offering cultural facilities, such as museums
∂ Manchester Fort Retail Park
∂ North Manchester Business Park

Manchester Green Infrastructure Strategy Technical Report
121
∂ The district centres of Harpurhey and Cheetham offer opportunities for mixed use
proposals for small businesses providing local employment opportunities.
∂ 11,840 new dwellings from 2010-2027
∂ March 2011–2016: 610 units
∂ March 2016-2021: 870 units
∂ March 2021-2027: 710 units
∂ Over the lifetime of the Core Strategy, North Manchester will accommodate 20% of new
residential development. Priority will be given to family housing. High Density will be
permitted in areas that fall within the Regional Centre (Strangeways and Collyhurst area)
and within Cheetham Hill and Harpurhey District Centres.
∂ 2 District Centres: Cheetham Hill and Harpurhey.
∂ North Manchester has capacity for 1,000sqm convenience and 4,000sqm comparison
retail up to 2027. The focus for additional floorspace should be Harpurhey.
∂ 6 Local Centres: Victoria Avenue/Rochdale Road (Charlestown), Hollinwood
Ave/Greengate (Moston), Landsdowne Rd/Crumpsall Lane (Crumpsall), Worsley
Ave/Kenyon Lane (Lightbowne), Moston Lane (Harpurhey) and Collyhurst (as part of
redevelopment).
East Manchester
∂ Central Park and Eastlands 65ha employment land (2010-2017)
∂ Health, education, retailing, cultural and tourism facilities, and other employment
generating uses mainly in the City Centre and Eastlands.
∂ Approximately 80-85ha of employment land. The majority of this provision will be within
the Regional Centre, specifically (including areas outside of East Manchester):
∂ Central Park: B1, B2
∂ Eastlands: a major leisure visitor destination with ancillary retail and offices.
∂ City Centre Fringe along Great Ancoats Street, providing an extension to City Centre
employment opportunities;
∂ Development will also be supported in existing employment and economic development
areas, including Alan Turing Way, along key radial routes and Ardwick Goods Yards.
∂ The district centres of Newton Heath, Eastlands, Gorton and Openshaw offer
opportunities for small scale mixed use local employment opportunities. Larger scale
proposals will be considered if good transport links exist to the City Centre/Regional
Centre.
∂ Central Park - suitable for 60ha of employment uses (2010-2027). A range of employment
types will be encouraged across the whole of the Central Park area including B1 (b) and
(c), B2, B8 and sui generis employment uses, with ancillary commercial services
supporting the creation of a sustainable employment destination. The key sectors will be
within creative and media and manufacturing. B1 (a) offices will also be acceptable on the
part of the site located to the north of Oldham Road alongside other employment uses. It
can accommodate training and incubator facilities, spin-off businesses associated with
the higher education sector and offers opportunities in digital and creative media

Manchester Green Infrastructure Strategy Technical Report
122
businesses
∂ Eastlands Strategic Employment Location – will accommodate 40-45 hectares of new
development, comprising 5-10ha of B1a employment land, 6ha leisure, entertainment,
30ha of sports facilities. This location is suitable for a major sports and leisure visitor
destination with complementary commercial, retail and hotels.
∂ Land around the City of Manchester Stadium, including the "Collar Site" to the east and
further land to the north and west. The "Collar Site" provides an opportunity for a leisure,
recreation and entertainment visitor attraction of national significance. On development
sites to the north and west of the stadium, development of complementary commercial
uses will be supported, particularly to accommodate economic activities associated with
the growth of Manchester City Football Club.
∂ Openshaw West site is suitable for the development of a large facility incorporating
football and community uses, linked to the operation of Manchester City Football Club. It
could also include some ancillary commercial activity, the location of which should create
links with the surrounding Eastlands location.
∂ 18,280 new dwellings from 2010-2027
∂ March 2011–2016: 750 units
∂ March 2016-2021: 1370 units
∂ March 2021-2027: 1240 units
∂ Over the lifetime of the Core Strategy, East Manchester will accommodate 30% of new
residential development. Priority will be given to family housing. High Density will be
permitted in areas that fall within the Regional Centre which are adjacent to the City
Centre. These neighbourhoods include Ancoats, New Islington, Holt Town and
Chancellor’s Place, to the west of Alan Turing Way, and within Eastlands, Newton Heath,
Openshaw and Gorton district centres as part of mixed-use schemes.
∂ 4 District Centres: Eastlands, Gorton, Newton Heath and Openshaw
∂ East Manchester has capacity for 4,000sqm convenience and 1,000sqm comparison
retail up to 2027. The focus for improved provision should be Newton Heath. Newton
Heath has additional capacity for a medium sized supermarket.
∂ Eastlands – priorities are to promote wider range of commercial and community uses.
Development of residential also supported.
∂ Gorton and Openshaw – support for schemes which improve the environment,
particularly in terms of access and movement.
∂ 2 Local Centres: Ashton New Road/Manchester Road (Beswick and Clayton) and Hyde
Rd/Reddish Lane (Gorton North)
Central Manchester
∂ Central Manchester is expected to provide approximately 14ha of employment land. The
majority of this provision will be provided within:
1. The Corridor (Manchester) within the Central Manchester Regeneration Area is
suitable for office, research and development, light industrial, general industrial,
education and health. This area overlaps with the City Centre boundary and should

Manchester Green Infrastructure Strategy Technical Report
123
be in line with CC1 and C1.
2. Existing employment and economic development areas:
- Princess Parkway suitable for office development adjacent to the City Centre;
- Along Stockport Road and Hyde Road suitable for employment as part of a mix of
uses;
3. District centres of Hulme, Rusholme and Longsight all located on major radial routes
through Central Manchester. These will be suitable for mixed use development
providing local employment.
∂ 8,200 new dwellings from 2010-2027
∂ March 2011–2016: 590 units
∂ March 2016-2021: 570 units
∂ March 2021-2027: 280 units
∂ Over the lifetime of the Core Strategy, Central Manchester will accommodate 14% of new
residential development. Priority will be given to family housing. High Density will be
permitted in areas that fall within or adjacent to the Regional Centre (Hulme and the
Higher Education Precinct) as well as within Hulme, Longsight and Rusholme district
centres as part of mixed-use schemes.
∂ 3 District Centres: Hulme, Longsight and Rusholme
∂ Central Manchester has capacity for 3,000sqm convenience and 1,500sqm comparison
retail up to 2027. The focus for additional floorspace should be Hulme and Longsight.
∂ 5 Local Centres: Princess Rd/Claremont Rd (Moss Side), Precinct Centre, Oxford Road
(Ardwick/Hulme), Withington Rd/Yarburgh St (Whalley Range), Claremont Rd (Moss
Side) and Dickenson Rd/Anson Rd (Longsight/Rusholme)
South Manchester
∂ South Manchester is not expected to make a significant contribution to employment
provision within the City. New development is expected to mainly comprise office
development, although proposals for high technology industry and research will also be
supported.
∂ Employment and economic development provision will be within:
1. Existing employment locations, such as
∂ Business Parks, such as, Towers, Didsbury Point, Christie Fields and Parkway;
∂ Christies Hospital;
∂ Along Princess Parkway;
2. District Centres of Chorlton, Didsbury, Fallowfield, Levenshulme and Withington.
These will be suitable for mixed use development providing local needs and services
∂ 3,240 new dwellings from 2010-2027
∂ March 2011–2016: 260 units
∂ March 2016-2021: 190 units
∂ March 2021-2027: 90 units
∂ Over the lifetime of the Core Strategy, South Manchester will accommodate 5% of new

Manchester Green Infrastructure Strategy Technical Report
124
residential development. High density development in South Manchester will generally
only be appropriate within the district centres of Chorlton, Didsbury, Fallowfield,
Levenshulme, and Withington, as part of mixed-use schemes.
∂ 5 District Centres: Chorlton, Didsbury, Fallowfield, Levenshulme and Withington
∂ South Manchester has capacity for 8,000sqm convenience and 4,500sqm comparison
retail up to 2027. Identified capacity will be directed to Chorlton, with enhanced
provision in Levenshulme.
∂ Didsbury - development should enhance the range and quality of retail and dining
∂ Fallowfield and Withington – development which creates more diverse centres will be
supported.
∂ Levenshulme – appropriate location for additional convenience development.
∂ Independent retail sector will be supported in Chorlton, Didsbury and Levenshulme.
∂ 11 Local Centres: Manchester Rd/Upper Chorlton Rd (Whalley Range), Lloyd St
South/Platt Lane/Hart Rd (Fallowfield), Kingsway/Slade Lane (Levenshulme), Beech
Rd/Stockton Rd/Chorlton Green (Chorlton), Barlow Moor Rd/Mauldeth Rd West (Chorlton
Park), Merseybank Ave (Chorlton Park), Mauldeth Rd (Withington), Kingsway/Mauldeth
Rd (Burnage), Burnage Lane (Burnage), Burton Road/Cavendish Road/Lapwing Lane
(West Didsbury) and Fog Lane/Lane End/Burnage Lane (Burnage)
Wythenshawe
∂ Manchester Airport and the surrounding area 50ha employment land (2010-2017)
∂ Wythenshawe is expected to provide 55ha of employment land within B1a offices, B1b/c
research and development and light industry and B8 logistics and distribution. The
majority of economic development will be focused on:
1. Manchester Airport and specifically Manchester Airport Strategic Site and Airport City
Strategic Employment Location are suitable for aviation related development and a
mix of economic development uses including offices, high technology industries,
logistics, warehousing and airport hotels.
2. University Hospital South Manchester suitable for growth related to the healthcare and
biosciences and ancillary offices.
3. Existing employment sites along:
∂ West Wythenshawe Development Corridor - Oaks Business Park (B1) and
∂ Roundthorn Industrial Estate (B8);
∂ East Wythenshawe Development Corridor - Sharston Industrial Estate (B8), Atlas
and Concord Business Parks (B1) and Ringway Trading Estate (B8).
4. The district centres of Wythenshawe, Northenden and the proposed centre at Baguley
will all be suitable for mixed use local employment provision serving their catchment
area.
∂ Airport City Strategic Employment Location (30ha of mixed use economic development) -
the area is suitable for high technology industries, logistics, offices, warehousing and
ancillary commercial facilities which will support further the business destination role at
Airport City.

Manchester Green Infrastructure Strategy Technical Report
125
∂ 2010-2017 – 17ha
∂ 2017-2027 – 13ha
∂ University Hospital South Manchester Strategic Employment Location (1.3ha of
employment land) - University Hospital South Manchester has plans to expand its
operation, emphasising its role in key health care areas, bio-science and
pharmaceuticals. Hospital expansion will include a mix of education and conference
facilities, clinical trial labs, fitness/wellbeing centre, an innovation centre, incubator units,
a hotel and ancillary offices.
∂ Manchester Airport Strategic Site - the growth of Manchester Airport to 2030 will be
supported, and it is designated as a Strategic Site. This will involve the expansion of the
developed Airport area.
∂ 1,830 new dwellings from 2010-2027
∂ March 2011–2016: 160 units
∂ March 2016-2021: 90 units
∂ March 2021-2027: 50 units
∂ Over the lifetime of the Core Strategy, Wythenshawe will accommodate 3% of new
residential development. New high quality high density development will be encouraged
within the district centres of Northenden, Baguley and Wythenshawe and upon small infill
sites where it contributes to the stock of affordable housing.
∂ 3 District Centres: Northenden, Wythenshawe and Baguley (West Wythenshawe).
∂ Wythenshawe has capacity for 5,000sqm convenience and 3,000sqm comparison retail
up to 2027.
∂ Additional food retail at Baguley
∂ Further retail and commercial development will be supported in Wythenshawe Town
Centre, particularly comparison retail.
∂ Northenden – additional food retail will be supported within the boundaries of the
existing centre.
Manchester Residential Growth Prospectus
The Residential Development Prospectus has been developed in the context of population and
household forecasts which suggest that by 2031 there will be a need for some 47,000 households
across Greater Manchester.
The prospectus sets out how housing growth can be accelerated at the same time as delivering
attractive and successful neighbourhoods where increasing numbers of people will choose to live,
close to employment opportunities and all the other attractions of a successful and growing city.
The housing position and projected growth is as follows:
∂ The number of new homes being delivered in the city has reduced from over 5,000 in 2007/8 to
fewer than 1,000 in 2011/12.
∂ There are roughly 20,000 working households privately renting property in the city centre and
fringe alone.

Manchester Green Infrastructure Strategy Technical Report
126
∂ Manchester’s population has grown to over 500,000 people making it the fastest growing city in
the UK.
∂ While the pace of house sales has fallen since the banking crisis and economic slowdown, the
demand for rented accommodation has remained very strong, particularly in the city centre, its
fringe and other key markets.
∂ Manchester’s adopted Core Strategy sets out very ambitious plans for growth. The document
plans for 55,000 new homes by 2027 at an average of 3,700 new homes per year.
∂ At Greater Manchester level the target in the emerging refreshed Greater Manchester Strategy
is to deliver an average of 9,200 new homes per year over the next decade.
As a key input to the prospectus, a detailed assessment of available housing sites has been
undertaken. This has assessed the sites that it will be possible to bring forward in the 1 to 3, 4 to 6
and 7 year plus time horizons. The analysis indicates that, assuming a constrained, gradually
improving market an estimated 5,000 additional dwellings are likely to be delivered over the
coming three years with 8,000 coming forward in years 4 to 6.
The portfolio of sites across the city means that a mix of housing types will be delivered including
accommodation for working families, accommodation suited to the needs of elderly people and
apartments built in sustainable locations close to jobs.
The focus of new housing at the heart of the City: high density apartments in the City Centre and
fringe with lower density family homes in the surrounding areas, particularly to the north and east,
but also the immediate south.
Key areas of housing development include:
∂ Ancoats and New Islington - An established city living neighbourhood with major scope for
expansion, primarily with apartments for rent. The range of sites has the potential to include
units targeted at the cheaper, middle and premium ends of the market. This is critical to the
efficient functioning of the labour market to ensure that new build units are accessible to all
income bands in the City.
∂ Collyhurst and the Lower Irk Valley - A leading opportunity for new house building, at sites with
significant critical mass, some of which are publicly owned. One of only a minority of areas
capable of accommodating housing growth at the required scale to keep pace with population
and employment forecasts in GM, at a collection of well connected sites close to jobs and
investment in the city centre.
∂ Beswick – A headline fringe location where addressing the development impasse has the
potential to deliver a significant number of new homes on a significant site next to the Etihad
Campus. This area initially led the residential repopulation of the eastern fringe and with
coordinated management amongst partners (including Government support to unblock activity),
has the potential to do so again in the post-recession 1-3 year period.
∂ The Lower Medlock Valley and Holt Town – A major opportunity which needs to be repositioned
in light of the changing market and demand. This area represents a chance to deliver new well

Manchester Green Infrastructure Strategy Technical Report
127
managed private rented sector accommodation, at scale and close to Metrolink which has the
potential to reignite interest in these large scale opportunities once again.
∂ Piccadilly Basin has the potential to be a signature residential location close to Piccadilly Station
and the proposed High Speed 2 Terminal. Within the HS2 bid this area is earmarked for 3000
units on a collection of exceptionally well connected sites with a strong track record of
supporting high quality apartment development at density and at scale.
∂ Wythenshawe – Sites linked to the Enterprise Zone, town centre and Metrolink. The sites
around Wythenshawe Hospital provide a collection of strong opportunities along with the
collection of former school sites, provided the DFES is happy to release these opportunities for
development.
Strategic Regeneration Areas / Neighbourhood Areas
Strategic Regeneration Areas
Manchester has identified five regeneration areas that, along with the City Centre, cover the entire
City. A Strategic Regeneration Area has been produced for each of these areas identifying issues,
opportunities and future actions and proposals.
The following provides a summary of future proposals and aspirations identified for GI and other
relevant proposals e.g. where major new housing or commercial development is proposed and in
particular where this is identified as requiring an attractive high quality environment to support this
growth.
East Manchester Strategic Regeneration Framework (2008)
GI Proposals:
∂ Long-term tree canopy target of 30%.
∂ Tree planting will be implemented along the area’s major corridors: Alan Turing Way,
Oldham Road, Ashton New Road, Ashton Old Road, Hyde Road and Great Ancoats
Street.
∂ Natural corridor created by the Medlock Valley will continue to be reinforced
∂ North-south connection along the former Stockport Branch Canal will be formalised as a
landscaped recreational trail to link the Gorton Reservoirs with the Ashton Canal and
Medlock Valley.
∂ Linkage of open space with natural corridors, most notably in south Gorton where new
corridors can be established and strengthened, linking east to the reservoirs and north to
the Medlock Valley.
Other Relevant Proposals:
∂ Provide a range of attractive housing choices that are of comparable quality to what is
available elsewhere in the region
∂ Establish a series of neighbourhoods each with a high-quality environment
∂ Provide safe, secure and well managed neighbourhoods where people choose to live

Manchester Green Infrastructure Strategy Technical Report
128
∂ Seek to increase the quantum of investment in East Manchester securing a further 7000
square m of new business development by 2018
∂ Establish Clayton Hall as a regional tourism destination
∂ Improvements to green routes such as along canals will encourage outdoor exercise
∂ Significant improvements to the cycling and trail network
∂ Secure by Design is a key factor in all new development
Wythenshawe Strategic Regeneration Framework (2004)
GI Proposals:
∂ Strengthening cycling and pedestrian links across and around Wythenshawe
∂ Improve access to green open space and woodland
Other Relevant Proposals:
∂ New sustainable neighbourhood clusters providing retail, pubs etc. Providing services at
a walkable distance
∂ Strengthening cycling links
∂ Improve access to services and improve the fitness and wellbeing of Wythenshawe
residents
∂ Strengthen foot and cycle ways as a contribution to sustainable transport and healthy
living
∂ Design and layout of neighbourhoods and the provision of key support services tackle
crime more effectively
South Manchester Strategic Regeneration Framework (2008)
GI Proposals:
∂ Establish a successful network of high quality parks and open spaces
∂ Ensure that all outstanding country parks and MCC key parks will achieve Green Flag
status
∂ Enhancement of green linkages
Other Relevant Proposals:
∂ Create two enhanced single-sex schools on a single campus in Levenshulme
∂ Enhancement of green linkages to promote walking and cycling
∂ Promote activity across the community, with priority being given to the update of low-cost
activities such as walking and cycling which can be facilitated by green transport routes
∂ Measures will be implemented including environmental improvements, alleygating and
lighting to address crime

Manchester Green Infrastructure Strategy Technical Report
129
North Manchester Strategic Regeneration Framework (2004)
GI Proposals:
∂ Greened Irk Valley will form the main link in a set of restored parks
∂ Creating new communities around public parks
∂ Co-ordinate the approach to the development of creative cultural and recreational activity
within existing cultural and community centres
∂ Support local sports and athletics clubs
∂ Creative approach to the public realm of North Manchester including arts, heritage and
fitness trails as examples of activities that can animate river valleys
∂ Focus on improving North Manchester’s image for which green and blue infrastructure
could have a role – reinforce areas of special character, celebrating places of activity,
creating gateways and highlighting landmarks. Also includes improving the appearance of
neighbourhoods and identifying innovative interim uses for vacant land
∂ High quality design and quality in all aspects of management are important
Other Relevant Proposals:
∂ Residential neighbourhoods and housing choice at heart of vision for area
∂ Plans for a new 6th Form Centre on the site of the old Harpurhey Baths
∂ Need to align new housing with education provision
∂ Potential need for a new secondary school in North Manchester- could serve North
Manchester, New East Manchester and the city centre
∂ Health Strategy includes:
∂ Create attractive and safe recreational and leisure infrastructure – a wide range of ‘free’
opportunities
∂ Raise the level of awareness of mental health issues and the multiplicity of factors
which impact on mental health
∂ Re-invigorate local sport and athletics club. Continued improvement to the parks and
recreation venues of North Manchester will underpin this strategy
∂ Ensure quality public transport and pedestrian environment
∂ Deliver a safe and welcoming public realm and secure built environment
Manchester Central Regeneration Framework (2014)
GI Proposals:
∂ The transport and travel strategies will include measures to improve health by promoting
cycling and walking.
∂ Velocity 2025 – an integrated and strategically planned GM wide network of newly built or
enhanced cycling routes that will connect employment centres, schools and leisure
opportunities.
∂ One of the aims of the Central SRF Delivery Group will be to promote initiatives, which
increase access to open space and community venues and encourage their use, as well
as participation in sports and other outdoor activities as one way to improve the physical

Manchester Green Infrastructure Strategy Technical Report
130
and mental health of Central Manchester residents.
Other Relevant Proposals:
∂ The Manchester Carbon Literacy Project
∂ Bus Priority Package - a £54.5m investment which will significantly improve bus travel
into, and across, Manchester city centre.
∂ Northern Hub Schemes -which will improve links to a number of Northern locations,
including Leeds, Sheffield, Liverpool and Preston.