developmental social welfare: who … study occurs in the sixth year of the south african women’s...
TRANSCRIPT

DEVELOPMENTAL SOCIAL WELFARE:WHO BENEFITS AND WHO BEARS THE COSTS?
Researchers: Fairuz Mullagee and Roseline NymanEditors: Debbie Budlender and Neil Newman
1. IntroductionThis study occurs in the sixth year of the South AfricanWomen’s Budget Initiative (WBI). The chapter on welfare in thefirst Women’s Budget (Lund, 1996) was written two years intoSouth Africa’s new democracy. Then, as now, the overwhelmingmajority of the Department of Welfare’s budget was allocatedfor social security - for grants such as old age pensions,disability pensions, and state maintenance grants (SMGs).That chapter and most other writing on welfare policy andbudgets to date have concentrated overwhelmingly on socialsecurity. Writing from a gender perspective has focusedlargely on the shift from the SMG to the child support grant(CSG).
This study focuses on another component of the welfaredepartment’s policy on budgeting. It provides a snapshot, froma gender perspective, of the implementation of the concept of‘developmental social welfare’ (DSW). This concept wasformally introduced into the South African policy arena in the1997 White Paper on Social Welfare, of which it formed thecentral theme. Even before this, the department had initiatedthe Flagship programme for unemployed women with childrenunder five years in each of the nine provinces. This programmewas seen as a pilot for DSW and, as can be seen from the name,had an explicit gender bias.
DSW has since become the basis for the poverty relief fundswhich were first introduced in the 1997 budget. Today themoney for the programme, as well as money for otherinitiatives, comes out of the poverty relief funds. While allthe poverty relief funds do not target solely women, mostdescriptions of the initiatives note the differentialexperience of poverty by gender, location and other factors.Many of the relief funds attempt to use these differentials intheir targeting. The topic is an important one for the WBIboth because of this explicit gender focus, and because of theWBI’s more general interest in focusing on the needs of poorpeople, particularly women.
Four years after its formal introduction, we need to considerwhether DSW is indeed serving to ‘teach women to fish’, ratherthan giving them fish through grants. The Department ofWelfare seems to be a good place to start. While otherdepartments now accept the concept of DSW, welfare remains the‘lead agency’ for this approach. We also need to look beyondthe initial concern about non-utilisation of poverty fundallocations to see what happens during implementation afterthe funds are allocated.

2
The report is structured into the following sections: methodology background policy overview finance and budgets project implementation programme monitoring development social welfare: the way forward.
2. MethodologyThe case studies for this project are two examples from theDepartment of Welfare’s Flagship programme. The nationaldepartment has changed its name to Social Development (DSD)while the provinces have retained various permutations of‘welfare’ in the names of their departments. The two names areused interchangeably in this study. This study compares theFlagship examples with a third project, Working for Water, apublic works project in the Department of Water Affairs andForestry (DWAF). Working for Water is also funded throughpoverty relief funds but it is not seen as necessarily fallingwithin the DSW framework.
The case studies for the Flagship programme were chosen fromtwo provinces: KwaZulu-Natal as the most populous province, one of thepoorest and currently the most affected by HIV/AIDS
Western Cape as a relatively wealthy province, which hashistorically provided more welfare services than most.
The projects in these provinces differ in other ways. ThePhilani project in the Western Cape was one of the very firstpilots for the Flagship, initiated in 1997. The Impendleflagship in KwaZulu-Natal was only started in 2000, whenpoverty relief funds became available. Table 1 summarisesimportant characteristics of the two cases.
Table 1: Profile of Flagship project case studiesProjectInformation
Philani FlagshipProject
ImpendleFlagshipProject
Province Western Cape KwaZulu NatalUrban/rural Urban:
Crossroads andKhayelitshatownships inCape Town
Rural: Inzingadistrict ofImpendleVillage
Economicactivities
SecondaryActivities e.g.production ofprinted fabricand relatedactivities
Primaryactivities likevegetable andpoultry farming
Projectstarted
April 1997 April 2000
Number ofparticipants
33 73

3
The data for the Flagship research was collected over a periodof six months through in-depth interviews with relevant staffmembers in the provincial Department of Welfare, Flagshipproject staff and Flagship project participants. Relevantdocuments were studied. The Working for Water case study isbased largely on secondary research.
In trying to get a peek at government’s developmentinitiatives for one of the most vulnerable sectors of society,namely poor, unemployed, black women, we got a good sense ofthe power of the bureaucracy. Some departmental officialsshowed great interest in the research and its potentialbenefits and willingly shared information with the researchteam. Others were less co-operative. They acted as gatekeepersto information that should be widely available for use instrengthening the cause of poor, marginalised, black women.These officials made it difficult for the research team togain access to the relevant people and information.
The WBI is a collaborative venture of two policy research non-governmental organisations (NGOs) - the Community Agency forSocial Enquiry and the Institute for Democracy in South Africa– who work with the Parliamentary Committee on the Quality ofLife and Status of Women. Not even the parliamentary linkcould facilitate access to information in some cases.
The main question for the research project was: who benefitsand who bears the cost of developmental social welfare?
3. Background3.1 InternationalThe DSW model is also known in international circles as thesocial development approach. The approach emerged in WestAfrica in the 1940s at a time when the British government wasincreasing investment and expanding infrastructure in itscolonies. Colonial welfare administrators were criticised forconsuming scarce resources in providing remedial social workservices to the urban destitute. So they sought new socialwelfare interventions that would go beyond the remedialapproach and contribute positively to economic growth. In1954, the British government formally adopted the term socialdevelopment for the combination of traditional social welfareand community development (Midgeley, 1996).
Subsequently, the United Nations (UN) and other internationalagencies expanded the meaning of the term. Central to the UN’sconception of social development was the idea that policiesfor economic growth needed to be closely integrated withsocial welfare policies. Following the adoption of numerous UNresolutions in the 1960s and 1970s, developing countriesincreasingly saw social programmes in the context of economicdevelopment (Midgeley, 1996). One example was UN resolution42/125 of 1987 that endorsed the Guiding Principles forDevelopmental Social Welfare Policies and Programmes in theNear Future. Two years later, however, the UN General Assemblyexpressed concern about the lack of follow-up in many regions.

4
The UN was not the only body to show an interest in DSW. Inthe 1970s the World Bank also expressed an interest in socialdevelopment issues. At the same time, the International LabourOrganisation (ILO) urged its member states to adopt socialdevelopment to deal with the problems of unemployment andunder-employment in the third world. The World Bank and theILO emphasised different strategic approaches to socialdevelopment. However, they all sought to enhance socialwelfare within the context of a dynamic economic developmentprocess (Midgeley, 1996).
The DSW approach emphasises that social development cannottake place without economic development. It also stresses thateconomic development is meaningless unless it is accompaniedby improvements in social welfare (Midgeley, 1996). DSW isseen as promoting a preventive rather than a curativeapproach. It is concerned with long-term, sustainabledevelopment. It is understood to be implementing theexpression that it is better to teach a person (usually statedas a ‘man’) to fish rather than giving them a fish. Inpractical terms this means involving poor people in economicdevelopment projects rather than giving them grants.
3.2 The local context
3.2.1 GovernmentIn South Africa, the DSW approach was incorporated intogovernment policy in the 1997 White Paper for Social Welfare.Three years later, the government implicitly acknowledged thatDSW has not yet been achieved. However, it remains a goal thatgovernment is moving towards. The most recent annual report ofthe national department confirms this commitment:
Transformation of social welfare services in our countryrequires moving away from a traditional approach towardsdesigning and providing services that lead to self-sufficiency and sustainability. The central theme to thisapproach is social development and a critical aspect ofthis approach is the recognition that while there is aneed to address the symptoms of problems through materialrelief grants, sustainable development strategies arethose that focus on building institutional capacity.(Department of Social Welfare and Population Development,1999/00:1).
Nevertheless, the idea behind DSW is not new in South Africa.Even before 1994, projects were established both by theapartheid government and by organisations of civil society.During 1990, the apartheid government established theIndependent Development Trust (IDT) as a financialintermediary organisation with a founding grant of R2 billion.Its mission was to promote rapid delivery to the poorest ofthe poor. Between 1991 and 1997 the IDT funded 8 800 projectsfor which it disbursed R2,43 billion. The projects had animpact on about 8 million people. They covered the fields ofeducation, urban development, health, welfare, ruraldevelopment and micro-enterprise development. Welfare

5
organisations were also funded to promote developmentalwelfare, land and agricultural development, communityemployment and micro-enterprises (Patel & Stewart, 1998).
One of the criticisms of the IDT programme was that there wasno national developmental policy framework in place when theprojects were launched. The IDT was criticised as a small sopto the poor at the same time as allowing other governmentprogrammes to continue to favour the rich and white sectors ofthe population. With the election of a new government in 1994,IDT funding was phased out. However, no clear transitionalmechanisms were put in place for the projects which it hadfunded. (Patel & Stewart, 2000).
3.2.2 Civil societyAs early as the 1980s, some organisations of civil societyinitiated community based projects in response to theapartheid government’s exclusion of black people from economicactivities. The projects were loosely referred to as co-operatives. A co-operative was defined as ‘a productiveenterprise or service collectively owned and controlled by itsmembers, who are also the workers in the enterprise’ (Jaffee,1988).
The co-operative movement was largely driven by the tradeunion movement as a form of job creation for retrenchedworkers. The most well-known co-operatives were the SarmcolWorkers Co-operative initiated by the National Union ofMetalworkers of South Africa, and the Phalaborwa Co-operativeset up by the National Union of Mineworkers (Jaffee, 1988).
Other co-operatives were established by black business. Theseincluded the African Council of Hawkers and Informal Businessand the National Stokvel Association of South Africa. Unlikethe union co-operatives, these were not productive co-operatives. The productive co-operatives established by NGOsand CBOs included sewing, brickmaking, fencing construction,t-shirt making, furniture production, weaving, auto mechanics,repair works, toy making, jewellery making and panel beatinginitiatives. There was an average of 11 people in each co-operative. The majority of these co-operatives were notsustainable without outside funding. Few of their membersearned a living wage (Jaffee, 1988).
While these pre-1994 projects did not fall within a coherentnational framework of DSW, the micro-aspects are similar toSouth Africa’s current developmental project.
4. Policy overviewTo date, South Africa’s social welfare has focused primarilyon social security in the form of social grants for pensions,maintenance, child-support, disability and ill health. Thisfocus is evident in budget, policy development and researchpriorities.

6
4.1 White Paper for Social WelfareThe policy shift towards DSW was first officially reflected inthe Ministry for Welfare and Population Development’s WhitePaper for Social Welfare (Government Gazette No. 18166, Notice1108 of 1997). The White Paper did not provide a definition ofDSW. It referred to social welfare ‘as one of the dimensionsof social development’ and DSW as guiding ‘the vision,mission, goals, principles and agenda for action’ (Departmentof Welfare and Population Development, 1997:93).
The White Paper states that the goal of DSW is:
a humane, peaceful, just and caring society which willuphold welfare rights, facilitate the meeting of basicneeds, release people’s creative energies, help themachieve their aspirations, build human capacity and self-reliance, and participate fully in all spheres of social,economic and political life. (Department of Welfare andPopulation Development, 1997:7).
A key national goal of the strategy outlined in the WhitePaper is ‘to facilitate the provision of appropriatedevelopmental social welfare services to all South Africans,especially those living in poverty, those who are vulnerableand those who have special needs’ (Department of Welfare andPopulation Development, 1997:15). As such, social welfarepolicies and programmes target ‘poverty prevention,alleviation and reduction’.
Guiding principles for social welfare policies and programmesinclude: equitable distribution of resources to address racial,gender, geographic, urban/rural and sectoral disparities;
participation of the public and welfare constituencies indecision making pertaining to welfare policies andprogrammes. Participation should include consultation withrole players, including beneficiaries and service providers;
the welfare system should raise the quality of life ofpeople, especially disadvantaged and vulnerable people;
the programmes should be based on respect for human rightsand fundamental freedoms as stated in the South AfricanConstitution;
programmes should be financially viable, cost efficient andeffective (Department of Welfare and Population Development,1997: Ch. 2).
The White Paper envisaged that social welfare programmes couldoccur through contractual arrangements between government andorganisations able to deliver an efficient and effectiveservice. It also envisaged that these programmes could bepartially government-financed. The financing of social welfareprogrammes was to be based on approved business plans, in aformat developed by the national department. Vulnerable groupsthat would be selected for special assistance includedfamilies and households living below the poverty line,especially female-headed households and pre-school children

7
(Department of Welfare and Population Development, 1997:Ch. 6:Section 24).
4.2 Consultation with civil societyThe White Paper was developed through a long consultativeapproach that involved a discussion paper, a Green Paper, andonly then the White Paper. The final policy had the broadbacking of those involved in the social welfare sector.However, there were some concerns as to whether there was animplicit agenda to limit the amounts given to the socialsecurity system. Social benefits were well spread across race,location, gender and poverty, but they by no means reached allthose in need.
Government won the explicit support of organisations of civilsociety for the DSW approach through its War on PovertyDeclaration of July 1998. The South African NGO Coalition(Sangoco), Congress of South African Trade Unions (Cosatu) andthe Homeless People’s Federation were among the organisationsthat signed the declaration. The Declaration referred to theWorld Summit for Social Development of 1995 where governmentcommitted itself to enhance social development. It emphasisedthat ‘all of society needs to be involved in the struggle forsocial development’.
Despite this broad commitment to social development, mostcivil society organisations have not engaged much with the newapproach either at policy or organisational level. At theMinistry of Social Welfare’s national consultative conferencesheld in 1999 and 2001, the majority of civil societyparticipants focused on the restructuring of the socialsecurity system rather than on social development. NGOs whichwork in the field of welfare and human rights have engaged inextensive parliamentary and governmental lobbying in relationto the implementation of an efficient social grant system.Organisations such as Sangoco, the Black Sash, the New Women’sMovement, the Human Rights Research and Advocacy Project ofthe National Association of Democratic Lawyers (Nadel) and theLegal Resources Centre have been at the forefront of lobbyingfor change.
Several organisations have focused on grants for women andchildren. Campaigns around the cut in state maintenance andreform of the child support grant have been characterised bymass action such as marches and pickets. Litigation againstthe provincial departments in the Eastern Cape and KwaZulu-Natal concerning pensions has also been ongoing. Some of thedemands relate to the need for a more efficient deliverysystem, while others seek changes in the department’sbudgeting. The latter include an increase in the eligible agefor the child support grant from seven to 18 years and anincrease in the monthly amount to R250. Many organisationshave also called for a basic income grant.
To some extent, the focus on social security reflects aninterest in the immediate day-to-day needs of theorganisations’ constituents. The early problems with thepoverty relief fund raised serious questions about the

8
capacity of government departments, and especially Welfare, tomanage projects of a developmental nature.
One exception to the apparent lack of interest in DSW is asubmission made by the disability economic empowerment thinktank, a socio-economic research and policy consortium led byDisabled People South Africa in 1999. The disability thinktank submitted that ‘because the cash grant system creates adependency syndrome’, this money should be invested so thatthe funds yield ‘long-term social, economic and developmentreturns for people with disability’ (Ministry for Welfare,1999:30). The welfare department was urged to create anenabling environment for disabled people to move from schoolto work or to start their own businesses.
5. Finance and budgets5.1 Holding welfare spending in checkAlready before 1994, the apartheid government started movingtowards a system of racial parity in social security grants.By the early 1990s, the old age pension was well targeted atblack people, rural people and women. Other grants, especiallythe SMG, were less well targeted and reached far fewer Africanwomen and children than were eligible. The post-apartheidgovernment was aware that extending the same grants to alleligible beneficiaries would place huge pressure on thefiscus, the funds collected through taxes. For example, it wasestimated that achieving racial parity in respect of the SMGwould have cost an additional R13,7 billion per year (Zain,1999).
Government’s fiscal framework, and in particular the Growth,Employment and Redistribution (GEAR) policy, did not allow forsuch an increase. The SMG was replaced with the child supportgrant. The CSG was more equitably targeted but the amountallocated was smaller and the target group more limited. Therisk of increasing the child and family grant expenditure wascontained by the CSG.
If we take inflation into account, we see a proportionaldecline in the national welfare budget from 1997/98 to2001/02. The decline is even greater if population growth istaken into account. Table 2 shows the amounts allocatednationally for welfare and the percentage this constitutes ofthe total budget. The table shows the budget as a more or lessconstant percentage of the total over the period despiteongoing high levels of poverty.
Table 2: Department of Welfare national budget (R bn)1997/98
1999/00
2001/02
2002/03
Welfare 23,6 27,2 31,6 34,0% of nationalbudget
12,4 12,7 12,2 12,3
Source: Fairshare, 2001: 8

9
Much of welfare spending happens in the provincial rather thanthe national sphere. The Intergovernmental Fiscal Review of2000 (National Treasury, 2000: 46) adds together the spendingof all provinces and thus complements the table above.
The government’s hope is that social security allocations becontained at a maximum of 80% of the department’s total budgetat provincial level. It proposes that the rest of the budgetbe allocated for more developmental purposes. The allocationsto the Flagship are located within the social developmentprogramme. The Intergovernmental Fiscal Review shows theoverall provincial pattern for the social developmentprogramme and total welfare budget presented in table 3. Thefuture years are estimates according to medium-termexpenditure framework (MTEF).
Table 3: Consolidated provincial welfare budgets1998/99
1999/00
2000/01
2001/02
2002/03
Socialdevelopment
54 66 72 86 100
Total Welfare 18365 19273 20336 20847 21536% Socialdevelopment
0.3% 0.3% 0.4% 0.4% 0.5%
The table confirms that the bulk of funds for socialdevelopment programmes originate in the national budget. Upuntil 1997, the Flagship money came through an allocation ofthe national department’s budget. Since 1997, the money hascome through the national poverty relief fund.
The National Estimates of Expenditure for 2001 (Treasury,2001) discuss the Flagship programme and other poverty reliefexpenditures under the Development Implementation SupportProgramme. This is the new name for the programme since SocialDevelopment became the name for the national department as awhole. For 2001/02 this programme is allocated R167 036m ofthe total of R383 265m i.e. 43,5% of the total nationaldepartmental budget.
5.2 Poverty relief fundsThe Special Allocation for poverty relief, infrastructureinvestment and job summit projects (poverty relief fund) ismade up of special allocations and conditional grants. Thetotal amount is announced each year on budget day, but thedepartmental allocations are decided subsequently by Cabinet.When the fund was started in 1997/98, the global amount wasannounced on budget day and the Cabinet decided ondepartmental allocations later in the financial year. InNovember 2000, departments were given three allocations toenable better planning of projects. In 1997/8 the money wascalled the poverty relief fund. It was used primarily forcommunity-based public works involved in buildinginfrastructure. In 1998/9 this fund was renamed the Povertyrelief and infrastructure investment allocation. In 1999/2000,in response to the job summit, it was called the Special
10
Allocation for poverty relief, infrastructure investment andjob summit projects.
The process for the distribution of the poverty funds betweendepartments is as follows: The selected national departments, which include Welfare,submit business plans to the National Treasury indicatingthe types of projects that they would like to fund and thecosts;
A selection committee examines the business plans and makesproposals to the Ministers Committee on the Budget. This isa special Cabinet Committee chaired by the Minister ofFinance.
The Ministers’ Committee on the Budget refines the proposalsand makes recommendations to Cabinet.
Recommendations are discussed at Cabinet and finalallocations are made to national departments.
Each national department then consults with provinces andlocal authorities on the actual projects that will beundertaken in line with the approved business plan in thatfinancial year.
Actual implementation of the projects takes place through avariety of agencies and includes national departments,provincial departments, local authorities, public entities,NGOs, CBOs and the private sector.
The Department of Welfare allocation of poverty relief fundswas R50 million for 1997/98, and R203 million for 1998/99(Department of Welfare, 1999). The 1999 National ExpenditureReview warned that due to ‘time constraints, under-spending onthis programme could be substantial and no allocation forpoverty alleviation has yet been made for 1999/00’ (Departmentof Finance, 1999: 59). The National Estimates of expenditurefor 2001 notes that the ‘fluctuating expenditure up to 2000/01is the result of delays in disbursing money and implementingprojects’. The Treasury decided to reduce the poverty reliefallocation over the medium term ‘in order to focus limitedcapacity on increasing the impact of projects and onmonitoring expenditure and impact more closely’ (NationalTreasury, 2001: 369). The projected allocations for 2002/03and 2003/04 are thus R100m and R71m respectively.
Table 4 shows the provincial and national breakdown of welfareallocations from the 2000/01 poverty relief fund. It shows aset amount for each province for management, administrationand capacity building, with varying amounts for projects. Thelatter allocations are calculated according to the populationsize as well as poverty levels. Thus KwaZulu-Natal and EasternCape receive the largest amounts. But Gauteng, the richestprovince, receives more than Northern Province, one of thepoorest.

11
Table 4: Allocation of Welfare’s 2000/01 poverty relief fundsManagement,Administration andCapacityBuilding
Projects Project %ofprovinces
Total
Eastern Cape 1 390 000 14 888900
15% 16 278 900
Free State 1 390 000 7 814600
8% 9 204 600
Gauteng 1 390 000 13 655500
14% 15 045 500
KwaZulu-Natal
1 390 000 18 148600
19% 19 538 600
Mpumalanga 1 390 000 8 343200
9% 9 733 200
NorthernCape
1 390 000 6 114400
6% 7 504 400
Northern 1 390 000 11 981600
12% 13 371 600
North West 1 390 000 7 312300
8% 8 702 300
Western Cape 1 390 000 7 840900
8% 9 230 900
Totalprovinces
12 510 000 96 100 000
100% 108 610 000
National 1 390 000 16 000000
17 390 000
Overalltotal
13 900 000 112 100000
126 000 000
Source: Adapted from Department of Social Welfare, 2000
In the first one or two years of the poverty relief funds,government - and especially the Department of Welfare - failedmiserably in disbursing funds. In the wake of the subsequentoutcry, the department acknowledged that it lacked thecapacity to manage the funds and in March 1999 appointed theIndependent Development Trust (IDT) as a disbursing agency. Asat 1 April 2000, about one year into its contract with thedepartment, the IDT had disbursed R147,2 million of the R203mpoverty relief allocation to the department.
In the August 2000 mid-year departmental programme report tothe Minister of Welfare, reference is made to a mid-termreview of the poverty relief programme that had just beencompleted by the national and provincial departments with theassistance of the IDT. The review, which was conducted on1 683 projects, found that: 72% of projects were in rural areas, 26% in urban areas and2% in informal settlements;
A total of 25 956 people were employed in projects funded bythe poverty relief money. Women accounted for 65% of jobs,men for 11% and youth (with unspecified sex) for 24%;
Of the 1 683 projects assessed, 94,5% were found to beactive, 5% were inactive and 0,5% terminated (Department ofWelfare, 2001:7).

12
These overall findings are encouraging. They show effectivetargeting of location, gender, poverty and sustainability. Ourfindings at a micro-level were less encouraging.
5.3 The Flagship programmeFunding for the Flagship programme originally came from thenational department’s budget. Now it comes from the povertyrelief fund. Table 5 shows allocations for the Flagshipprogramme over the period 1996/97 to 2001/02. Unfortunately,the figures for 1999/00 are omitted in the source document.
Table 5: Allocations for Flagship Programme (Rm)1996/97 1997/98 1998/99 2000/01 2001/02R3,0 R1,6 R2,7
millionR1,6million
R0,55
Source: Department of Social Welfare, 2000
The Department of Welfare issued the guidelines for theimplementation of a Flagship developmental programme forunemployed women with children under five years on 16 June1996. The decision to implement the programme was taken at ameeting of the Departmental Committee on developmental socialservices on 7 November 1995, before the finalisation of theWhite Paper. The guidelines explain that women and childrenare targeted because the majority of female-headed householdsface extreme poverty. They also note that the majority ofchildren under six live in rural communities where they arelikely to be exposed to conditions of poverty.
The guidelines recommended that an estimated 20 projects beimplemented across the nine provinces. Projects were not toexceed a budget of R400 000 for the three-year duration of thepilot.
Some provinces moved faster than others and not all initiatedtwo projects. At the time of the research (first half of2001), there were 15 projects with a total of 867 womenparticipating. A simple calculation yields an annual cost ofapproximately R1 845 per woman in 2000/01 if the number ofwomen remained constant. The sharp decline in the allocationfor 2001/02 is in keeping with the objective that the projectsmust be financially supported for a period of three years. Itis expected that they should be able to generate sufficientincome to be self-sustaining after this period.
Government Gazette No 19888 of 1999 provides details of thefinancing policy implied by the White Paper. The policy wasissued well after the Flagship programme was initiated. Thenotice states that a grant should only be paid if it is linkedto a service. For example, no child support grant should bedelivered in isolation of services to the family. The Flagshipproject contradicted this policy to some extent as thedepartment stated that grant recipients should be excludedfrom the programme.

13
5.4 Comparing the Flagship programme with grantsTable 6 shows the number of social grant recipients on theDepartment of Social Development’s records as at August 2000.It shows a total of 3 102 909 beneficiaries, and 376 135 inrespect of the CSG. It is clear that a far larger number ofpeople currently benefit from grants than from developmentprojects. This is true whether we contrast CSG recipients withFlagship participants, or compare total recipients with the 25956 people employed through poverty relief projectsadministered by the department.
Table 6: State grant beneficiaries, 2000Grant type Number of
recipientsOld age grant 1 864 711War veterans 6 837Disability grants 600 712Institutionalgrants
105
State maintenancegrant
175 437
Foster care 50 162Care dependencygrant
25 362
Child supportgrant
376 135
Combination grants 1 067TOTAL 3 102 909Department of Social Development, 2000:5
For the CSG, the amount in this period was R100 per month - orR1 200 per annum - a smaller amount than the rough calculationfor the Flagship Project above. One can argue that developmentproject participants benefit through the empowerment aspectsof the projects. On the other hand, one can point out that notonly the direct beneficiary, but also their family, benefitsfrom the grant.
6. Project implementation - who, what and how6.1 Structure of the Flagship pilot projectThe implementation guidelines for the Flagship programmeenvisaged the structure depicted in figure 1.

14
Figure 1: Programme structure for Flagship ProgrammeSource: Flagship Programme guidelines for implementation,1996.
The national welfare department (the DSD) was identified asthe overall project manager. It was to be responsible forfunding co-ordination, evaluation of provincial andoperational structure and effectiveness. At the provinciallevel, the process was to be led by the provincial departmentof welfare, which was to appoint a provincial facilitator. Aprovincial consortium comprising government departments andNGOs active in the identified sector (women with childrenunder five years) was to be responsible for the implementationof the programme. The provincial facilitator would beresponsible for the day-to-day management of the projects.
Three phases were suggested for implementation, namely: planning; implementation; and monitoring.
6.2 Case study one: Philani Flagship project.
6.2.1 BackgroundThe Philani flagship project is an income-generating projectthat targets unemployed women who have children under the ageof six years. It differs from the 1996 programme guidelinesthat stipulate children under five years. Philani was set upin 1997 and is thus one of the earliest projects. It is basedin Khayelitsha and Crossroads, two impoverished working classareas with high unemployment rates in the Western Cape. Theprojects produce African designed-fabrics, garments and paperfor sale to tourists and local consumers. Products producedinclude cards, wrapping paper, tablecloths, wall hangings,cushion covers, duvets, pillowcases and garments. Womengenerate an income through the sale of their goods. Thirty-five women were participating in the project in 2000 (PhilaniFlagship Project, Progress Report, December 2000).

15
The project is a joint venture between the Western CapeDepartment of Social Services and the Philani NutritionCentre. The centre, is a welfare organisation that ispartially funded by the Department of Health. It was set up in1980 and its primary objective is the rehabilitation ofmalnourished children. The Flagship project was welcomed as anatural development to extend the scope of beneficiaries tounemployed mothers of the targeted children. The PhilaniNutrition Centre established the project and provides ongoingsupport in the form of additional fundraising, management andthe marketing and sale of project goods.
The project employs an administrator, supervisor and co-ordinator on a full-time basis. The 35 project women aredivided into three independent business units called PhambiliPrinting, Phumalanga Printing and Siyazama Printing.Participants from Phambili and Siyazama business units wereinterviewed during the research for this report and arereferred to as Group 1 and 2 respectively. Two of the threebusiness units produce the same products, namely Africandesigned fabrics, garments and paper. They work in Crossroadsin the same building in production rooms adjacent to oneanother. The third unit produces woven goods and operates inKhayelitsha. The co-ordinator works in Khayelitsha, while thesupervisor and administrator works in Crossroads at the samepremises as the first two business units.
6.2.2 Community participationThe Philani project was initiated without any prior communityconsultation or participation regarding its feasibility ordesirability. The Philani Nutrition Centre applied for thefunds from the Department of Welfare and initiated theproject. The women who applied to participate during April1997 heard about the project on community radio and wereaccepted on the basis of set criteria.
A survey conducted during 2001 revealed that only 18% of womeninterviewed at the Khulani Nutrition Centre and PhilaniFlagship programme preferred their current income generatingactivity. The others expressed a need for a different income-generation activity. For example, of the 84 women weavers,only eight wanted to continue as weavers. While only 3% wereengaged in sewing, 30% indicated their preference for sewing.
Of those who would have preferred a different income-generating activity to their current one, 59% gave a reasonrelated to job satisfaction. For example, they said they likedthe alternative job more, had skills or talent for it, had acertificate, or preferred the independence that went with thealternative work. A further 25% felt that the preferred jobwould provide income more easily than their current jobs.Unhappiness with current activity was confirmed by groupinterviews conducted with the two business units.
6.2.3 Project implementationSome difficulties have been encountered in implementing thenational guidelines of the Flagship programme. While the

16
guidelines provided for provincial consortiums, the WesternCape consortium met only once after the launch of the projectin July 1997. It was subsequently disbanded because of poorattendance (Philani Flagship Programme Report, October-December 1998:6). It seems that other provisions might havechanged since the original guidelines were formulated.
The current project co-ordinator said that communicationbetween the national and provincial departments, and betweenprovincial department and project was poor. Guidelines andprocedures with regard to funding proposals and allocationswere constantly changing and not communicated effectivelythrough the hierarchy. The examples below demonstrate some ofthe difficulties that the project has had to deal with.
There were numerous difficulties with funding procedure: Although a two-year funding document was submitted to thenational department during 1999, no funding had beenreceived by the time the project co-ordinator was employedin July 2000.
The national department had at times changed policy withoutinforming the project co-ordinator. For example, she wasfirst informed that the national office would provide thefunding to the project. When no funding was forthcoming, shemade enquiries and was informed by the national office thatthe provincial department would provide the funds.
Funds were not provided timeously. The first allocation offunds for 2000 was made in December 2000 and the secondpayment only in March 2001. The second allocation had to bespent within one week. Salaries could not be paid to staffand they could not pay the milk bills for the food scheme.The project barely survived and loans had to be secured fromthe Nutrition Centre.
The 2000/01 grant agreement was signed by the project andthe national department without a funding amount indicated.The project had applied for R300 000 for this fundingperiod, but in fact received R600 000.
At the time of the interview, no funding had been confirmedfor 2001.
The change in the method of payment to the electronic systemwas not communicated to the project.
Prior to 2000, the national department disbursed the fullfunding amount directly to the project. This system waschanged without notifying the project. The IDT became thedisbursing agent. They disburse money on a quarterly basisrather than in one tranche as happened previously.
There were also problems with reporting systems: The provincial department did not have a copy of astandardised business plan. Instead, the provincial co-ordinator gave the project co-ordinator a copy of a businessplan that was submitted by another grant applicant.
The national co-ordinator of the project only sent theformat for the monthly report to the project co-ordinator on15 January 2001. Prior to this, the co-ordinator did notknow the report format, to whom the report had to be sent,and how often it had to be sent.

17
An interview with the provincial co-ordinator confirmed thepoor procedures and processes. The difficulties areexacerbated by the lengthy procedure and the many actorsinvolved. The first step is the submission of a fundingapplication by the project co-ordinator to the provincialoffice. The provincial co-ordinator then determines theviability of the project and recommends it for approval to thenational director-general of welfare. Obtaining this approvalcan take a long time. When this stage has been successfullycompleted, a business plan must be submitted and go through asimilar process. During this period, both the provincialoffice and the national office gives feedback to the projectco-ordinator, who revises the documents and resubmits them.Once the director-general gives the final approval for therelease of funding, the IDT is instructed to disburse thefunds directly to the project.
6.2.4 Governance and management structureFigure 2 shows the management structure of the Philani projectas described in the business plan for 2000/02. The head of thestructure is the Philani Nutrition Centre board of trustees,which is meant to meet once a quarter. Below the board is thePhilani Nutrition Centre committee, which is meant to meetonce a month. The Philani Flagship management committeemanages the Flagship project and should meet on a weeklybasis. It is made up of the management staff of the NutritionCentre, the project co-ordinator, the project administratorand one representative from each business unit. At the bottomof the governance structure is another management committee,made up of three project staff members and the 35 projectwomen.
Figure 2: Philani management structure
Despite this formal description, the women interviewed claimedthat the three business units were not adequately represented
Philani Flagship Project Governance Structure
Phambili PrintingFlagship Business Unit
8 Women
Siyazama PrintingFlagship Business Unit
12 Women
Phumalanga PrintingFlagship Business Unit
11 Women
Philani Flagship ProjectManagement Committee:Flagship staff andBusiness Unit Women
Philani Flagship ProjectManagement
Staff committee
Philani Nutrition CentreCommittee
Philani Nutrition CentreBoard of Trustees

18
in the management structure. They said that regular meetingswith management had taken place for the first two years butwere no longer held so frequently. Group 1 reported that onerepresentative attended a weekly production meeting withmanagement. At the meeting they discussed how many productswere sold and how much money each worker would receive. Thefocus of the meetings appears to be entirely on the businessoperation.
There is unhappiness about how the operation is managed. Theprogramme co-ordinator reported that 30% of the income thewomen generated was used to buy raw material such as cloth,paper and ink. However, Group 2 complained that they did notunderstand the arrangement. They stated that they had been‘fighting’ with management for a long time to retain the 30%.They complained that for the past four years they had beendemanding to see the invoices to ascertain how the 30% wasspent but this information was never forthcoming. Anadditional complaint was that the Philani Nutrition Centre,the ‘mother body’, deducts a further 10% from the sale ofgoods sold at the centre’s shop in Khayelitsha. They did notsee why this money should be deducted from the incomegenerated from the sale of goods when the project budget makesprovision for marketing costs.
It was evident that the women did not feel that they owned theproject. They saw the Philani Nutrition Centre board andtrustees as the decision-makers. The division of labour wassimilar to that of a manufacturing plant. The workers producedthe goods while ‘management’ provided the plant, bought theraw material, marketed and sold the goods. Although theFlagship project was linked to the wider Philani healthproject, the women had major concerns in relation to their lowincome and health. They also felt that they did not have thepower to change their conditions. They felt that they hadlimited knowledge and no control over funding arrangements,budgets, marketing decisions and to whom their goods are sold.Management dealt with the women’s grievance regarding the 30%deduction for raw materials as a demand for higher wages.
6.2.5 Funding and income-generating arrangementsFunding for the Flagship project comes from two sources. Thefirst source is the Department of Social Development as perthe funding agreement. The second source is income generatedfrom the sale of project goods. The funding agreement budgetfor the period March 2000 to February 2001 makes provision forthe salaries of the three staff members, rent, officeconsumables, transport, telephone, cleaning, teas, outreach,training, bookkeeping and accounting, auditing, productdevelopment, promotional material and marketing. The PhilaniNutrition Centre pays for project management; administrationand co-ordination support, transport, pensions andunemployment benefits for the staff.
Staff salaries constitute the largest proportion of the budgetreceived from the department. The co-ordinator receives aboutR4 500 per month, and the supervisor and administrator aboutR2 500 each. Staff salaries are supplemented by Philani

19
Nutrition Centre’s payment of pensions and unemploymentbenefits. Together with bookkeeping and auditing, rent andoffice expenses, staff salaries consume more than half of thebudget. All of these are administrative and management costs.None can be construed as direct or indirect income for thewomen who work in the business units.
The income of the women in the three business units isgenerated from the sale of their products. The 70% remainingafter the deduction for raw material is divided equally amongthe women in each business unit. Deductions are made forabsenteeism and late coming.
Each worker in Group 1 earns an income of between R450 andR1 000 per month while the earnings for Group 2 are betweenR400 and R800. Comparison of these figures with those of staffreflects a significant gap. The project’s budget for theperiod March 2001 to February 2002 reflects a 20% salaryincrease for the supervisor and administrator and an 11%increase for the co-ordinator. These increases widen theearnings gap between staff and business unit members. Thereare other discrepancies between staff and workers. While staffmembers enjoy fixed monthly salaries, the incomes of the womenworkers are subject to the ravages of the market. If looked atsimply in monetary terms, at present levels of income, theDepartment of Social Development’s money would have beenbetter spent and the women participants would have been betteroff if the R320 000 allocated for 2000/01 was paid to themdirectly.
6.2.6 Working conditionsThe women interviewed were in agreement that the ‘wages’ weretoo low. They especially suffered during the winter ‘down’season when earnings went down to R400 per month. They couldnot live on this amount. However, they also expressedgratitude ‘as they would be unemployed without the job’. Whilethey were unhappy, they felt that they did ‘not have achoice’. All of the women interviewed had been with theproject since its inception, and none indicated that theywould be leaving to start their own businesses.
The project co-ordinator confirmed the absence of alternativesand the poor sense of job satisfaction among the members. Shereported that ‘The women who come through the centre aredesperate. They are forced together into groups to worktogether and do things, like weaving and fabric printing thatthey do not really enjoy. But because they are desperate, theyare obliged to accept what is on offer.’ The women’s sensethat they had no choice created problems for the project.‘Those women who have no interest in weaving or printing donot give their best and this in turn impacts negatively on theoutputs of the programme.’
However, expressions of job satisfaction did vary. Generally,women in group one were happier. One woman stated that‘Printing is a good thing. It is a way to express us throughdesign. We want to explain how life is in rural areas.’ Women

20
in group two complained that ‘This is not a very nice job todo.’
When asked how they would want their working conditions to bechanged, a woman in group one replied that ‘Group two alsosaid that they wanted a basic wage. However, they reportedthat when they made this demand to management, it was turneddown. The co-ordinator confirmed that management was aware ofthe grievance and indicated that they wanted to ensure amonthly income of R800. They are also contemplating conductingresearch on what constitutes a living wage.’
The project’s business plan for 2000/02 states that astrategic objective for phase 1 (March 2000-February 2001) isto empower women so that ‘they can earn a basic monthly incomeable to meet their basic needs by having successfully andlegally organised themselves into income generation projects’.The plan envisages that at the end of phase one, women wouldhave achieved the goal of an increased income throughcommercialisation of processes, skills training and greaterparticipation. As the first funding was only received towardsthe end of the funding period, it was not possible to achievethese goals. Even with funding, the goals might have beenunattainable.
In addition to income, there are serious health and safetyproblems. During the interviews, it was clear that themajority of women experienced respiratory and other healthproblems. The two working halls had cement floors. The smellof chemicals was so overwhelming that after an hour theresearchers experienced breathing problems. There was poorventilation in hall one, and no ventilation at all in hall twoas all the windows were closed. Most of the women looked ill.One of the women was bent forward and coughed uncontrollably.
Management, provincial and national departments are aware ofthese problems. In December 2000, the project reported that‘over the past four years since the project began, ten womenhave passed away through mainly lung-related diseases.’(2000:3). During the group interviews, women in the Phambiliprinting group verified the recent death of one woman.
Both groups of women complained about the working environment.Since 1997, they had been requesting a carpet because thehalls became bitterly cold during winter. Group two statedthat they suffered from backache. They needed medical checksbut could not afford to pay medical costs. Group two said theyhad repeatedly lodged this grievance with management, to noavail. The poor conditions are particularly distressing sincethe Philani Flagship project exists within the ambit of thebroader Philani Nutrition project whose major concern ishealth.
6.2.7 Skills trainingOne of the ways in which projects in the Flagship programmecould be seen as benefiting participants is through theprovision of skills.
21
Research conducted during 2001 (Masu, 2001) found that 15 ofthe 35 women had formal education only at a foundation leveland would benefit from a literacy, numeracy and BusinessEnglish programme. A further ten or 11 had achieved functionalliteracy or Adult Basic Education (ABE) level three. Theremainder had achieved matric or level four of the NationalQualifications Framework (NQF).
All the women participated in a technical skills trainingprogramme in paper and textile silkscreen printing and design.The training programme ran for three months after theirrecruitment in April 1997. A follow-up training programme tookplace in the period October-December 1998. It consisted of:
formal workshops and on-the-job training in paper, textilesilkscreen printing and design;
papermaking and printing techniques; the enhancement of design skills; supplementary courses in sewing and pattern making; leadership empowerment workshops; and literacy and numeracy classes (October-December 1998programme report).
Later, five women underwent a business skills training course.These women indicated the need for further training inbusiness skills (Masu: 2001).
The project’s business plan for 2000/02 envisages that womenwould have participated in further training during the fundingperiod March 2000-February 2001. This course will coverfurther training in their current skills (paper and textileprinting and weaving) and business management skills trainingsupported by on-the-job training.
The Philani project seems to have taken training seriously.Nevertheless, difficulties were encountered. The co-ordinatorpointed out that because most women had such a low literacyrate that they could not attend formal bookkeeping classes.Instead, they were taught financial skills on a day-to-daybasis. Also, while the women attended training, they did notreceive an income. A problem identified during 2000 was thattraining programmes did not provide the learners with food sothey were hungry all day.
6.3 Case study 2: Impendle Flagship project.
6.3.1 BackgroundThe Impendle Flagship project is one of the two originalFlagship projects earmarked for development in KwaZulu-Natal.However, it only got off the ground once poverty relief moneybecame available. Four traditional leaders govern the ImpendleDistrict. The Inzinga area was chosen to be part of theFlagship programme on the basis that it is the poorest part ofImpendle. The local leader was approached and gave hisblessing to the project.

22
The project was set up during April 2000. The acting projectco-ordinator is a Department of Welfare social worker for theImpendle district, doubling up as the Flagship co-ordinator.In the initial stages of the project, prospectiveparticipants, with guidance and assistance from the projectco-ordinator, collected information about what the communitydoes, opportunities for income generation and the type ofbusinesses in the area. They also went to the Department ofAgriculture to establish what resources are available in thearea.
Guidelines for drafting a business plan were obtained from theregional office of the Department of Welfare. The businessplan was drawn up together with prospective participants andsubmitted to the regional office. The regional office providedfurther assistance with the business plan before submitting itto the national office. The provincial office of theDepartment of Welfare later organised a meeting at regionallevel to inform applicants about which projects had beenapproved.
To qualify to be part of the project, participants had to besingle mothers with children under the age of seven years.Here we see a digression from the guidelines that stipulatechildren under five years old. Participants also had to pay aR10 joining fee, an amount they agreed to. This money was usedto open bank accounts for each of the participants. It wasalso used for minor expenses such as transport before theproject funding became available.
Before joining the project, the women were involved in thefollowing productive activities: household chores such as fetching water from nearby river,gathering wood for fuel;
sewing groups; domestic gardening such as planting mealies and vegetables; selling sweets at the school; cutting grass for thatching roofs or making mud bricks; making grass mats to sell at pension pay points; and looking for jobs.
6.3.2 Management structureThe management structure has six levels of decision-making, asshown in figure 3.

23
Figure 3: Impendle management structure
The regional convenor is a social worker who complained thatshe had to take on the Flagship co-ordinating function inaddition to her day-to-day social work functions. She had alsonot received any training in developmental social welfare.
Monitoring and evaluation occurs through: site visits by the co-ordinators; monthly progress reports; monthly meetings with district co-ordinators; district meetings held every two months; weekly meetings with women from the project.Guidelines for reports come from national office.
Unlike the Philani project, the Impendle community wasextensively involved from the beginning through the projectfeasibility process. The provincial Flagship district co-ordinator introduced the Flagship idea to the community byconvening meetings in the local community hall. The communityidentified the need for a working area. The inkosi(traditional leader) subsequently granted a site.
The regional office then held further community meetings tointroduce the project, which was accepted by the community.The national department and Transnet had an arrangement at a
Poultry Communications Creche Catering Gardening Business Aids Drop-In Centre ABET
Sub-committeeConvenors
Responsible for Sub-committee activities
Project CommitteeChair, Secretariat, Treasurer
Submits monthly reports to District ConvenorCommittee consists of Sub-committee convenors
District ConvenorMeets weekly with Project committee
Submits monthly reports to Regional Convenor
Regional Convenor
Provincial Convenor

24
national level regarding the supply of containers to be usedas workshops. These were donated during September 2000 for useas an administration office. The women took ownership of theproject from its inception. They drafted a projectconstitution. They also formed groups to look after thecontainers to prevent damage.
6.3.3 BudgetThe provincial department refused to disclose information onthe budget of either the programme as a whole, or the Impendleproject in particular. It was not possible to obtain thisinformation from the participants in a big group, particularlysince departmental officials were present.
6.3.4 ImplementationThe project has nine planned business units. At present onlythe gardening business unit is functioning well. At the timeof the interviews, only 72 of the 174 who joined during April2000 were part of the project. The reason for the high drop-out rate is not clear, but the fact that no income wasgenerated for the year is clearly a contributory factor. Thewomen who dropped out forfeited their R10 joining fee despitethe fact that they worked in the project without gaining acent.
The Impendle community garden site was previously used by theDepartment of Agriculture for a community gardening project.The Department of Agriculture provided training to the newproject’s participants in community gardening. The localcommunity was used to fence the garden. The first crops -cabbage and beans - were planned to be harvested in June 2001.The crops were to be harvested on a single day in the hopethat this would prevent theft. The first crop was to be soldon the local market. Other crops, such as beetroot, would haveto be marketed elsewhere since there was not much demand forthe crop in the local market. The district co-ordinator isresponsible for marketing. At this stage, none of theparticipants has been identified for training in marketing.
In addition to the gardening training, participants havereceived training in arts and crafts, catering, caring forchildren, and home-based care for victims of HIV/AIDS. Atpresent, the child care skills are not utilised and thechildren do not accompany their mothers to the project. Thispresents difficulties for the women who feel that a crèchewould help ease their burden.
Weaknesses in the area’s infrastructure to some extent accountfor the lack of progress in development work, including theestablishment of a creche. Most households in the Impendledistrict have access to electricity through the card system,but the project itself, it is perceived by participants, willneed more than this. The water source for the garden unit isthe Inzinga River. Currently water is carried from the nearbyschool to the gardens. There are irrigation pipes at the sitebut these will only be functional once the provision of watercommences.

25
The project’s development committee is responsible fornegotiating the water supply which is to be funded by theDepartment of Water Affairs and Forestry. Local governmentreadily authorised provision of the service. The provision ofwater was meant to start in May 2001, but was postponed. Thecommunity development process around water provision wasintended to help the community manage service provision in thearea. The process itself slowed down progress in the actualprovision of water. Unfortunately the reservoir was vandalisedin the meantime.
The application for provision of electricity for the projectwas submitted to Eskom in January 2001 and the project hasalready paid the installation fee. A telephone service wasseen as fundamental for the project. An application wassubmitted to Telkom but service provision was delayed. In themeantime, the cables were vandalised.
When available, the water and electricity supplies will enablethe installation of the infrastructure for broiler and eggproduction. This was planned to be completed by the end ofJuly. The first income from sales of the vegetable andpoultry farming produce was planned for August 2001.
While the Impendle project is still in its start-up phase, notall the women are expected to be at the site every day. Thereis a rotation system and those who are not at the project on aparticular day continue with activities that they wereinvolved in prior to joining the project.
6.3.5 Information about participantsThe average age of the women participants is between 21 and 30years. Sixty of the women are single while 13 are married.Fifty-five of the 91 children of the participants are of apre-school age while 36 attend school. The project hasdeviated somewhat from the selection criteria in theguidelines by admitting married women, as well as women withno pre-school children.
Table 7 shows that a significant percentage (40%) of the womeninvolved in the project have five years or less of formaleducation. However, 22% have completed Grade 12. This highlevel of literacy bodes well for the women who seek skillstraining in financial management and marketing. Theirsimilarity in background and collective working ethic willalso enable managers to transfer skills to other women in theproject.
Table 7: Education levels of participantsGr.0-5
Gr. 6 Gr. 7 Gr. 8 Gr. 9 Gr.10
Gr.11
Gr.12
29 1 6 5 5 4 7 1640% 1% 8% 7% 7% 6% 10% 22%
The main reasons why the women joined the project wereunemployment, the opportunity to obtain starting capitalwithout having to repay it, and the possibility of earning an

26
income to maintain their families. However, it should be notedthat women have not earned any income since the start of theproject a year ago.
Other reasons given for joining the project included: women need to be together and share ideas because it isbetter to struggle together;
women can learn from each other and learn skills such as howto make grass mats jointly;
it is better to market products together than sellingindividually from home;
the project broadens minds. Participants can start somethingcollectively, sell products and generate an income. This isbetter than doing housework.
participants are exposed to courses offered by the projectsuch as skills relating to poultry and starting a business;
the home gardens are not fenced, while the Flagship gardenis fenced and protected.
Participants also indicated how their lives had changed sincethey joined the project. They felt that they had learntpersonal skills such as how to work with communities, how tobe friendly and accommodate others, how to persevere and dealwith people, how to be committed to things. They had acquiredskills such as gardening, how to grow new crops and how tomake grass mats. They also learnt from other women inmeetings. They learnt that when they are at the project theymust work rather than sit around idling. They said that therewas no longer a need for gossip as there was purpose in life.They felt that they were doing real work and they learnt theneed to work.
6.3.6 Concluding analysisUnlike the Philani project, women at Impendle felt happy andhopeful despite the fact that they were not generating anincome and had experienced setbacks in the project. Theoptimism can be attributed to several factors. The project wasstill young and women were aware of the fact that it takestime to generate an income. They believed that they controlledthe project. They connected as a group and felt a sense ofcamaraderie. Their empowerment was real to them as they couldlist clearly defined reasons why they preferred to work in theproject than to sit ‘idle’ at home. They did not regardhousehold work as a real job as it did not generate an income.
It is doubtful whether the women’s enthusiasm will last iftheir efforts do not yield a profitable return relativelysoon. All indicated that their biggest problem was money.
6.4 Case study 3: Working for Water
6.4.1 IntroductionProf. Kader Asmal, as Minister of Water Affairs and Forestry,initiated the Working for Water (WFW) programme in 1995. Heargued that the only way to achieve sustainable living isthrough equity, efficiency and sustainability in the supplyand use of resources. The WFW programme is a multi-

27
departmental public works initiative to remove invading alienplants. This activity increases available land and improvesthe water security of the country. The programme is seen asdemonstrating government commitment to both job creation andpoverty eradication, particularly in rural areas. It hasbecome one of the country’s most successful training andemployment programmes, with 42 000 workers employed at itspeak. 54% of these workers were women.
This description is based on the April-December 2000 ProgressReport of the Department of Water Affairs and Forestry. Aninterview was conducted with the WFW social development co-ordinator who confirmed the contents of the progress reportand identified key concerns with the programme.
Unlike the Flagship programme, WFW is a public works project.It entails the short-term employment of large numbers ofmainly unskilled workers, most of whom are employed indirectlythrough small contractors. The objective of public worksprogrammes is not to make a profit, but rather to deliverpublic services while at the same time providing short-termemployment and training.
6.4.2 ImplementationThe WFW programme is a multi-departmental developmentalinitiative. A board of twelve national ministers providesstrategic leadership. Administratively and financially, WFW ismanaged by its lead agency, the Department of Water Affairsand Forestry (DWAF), through their Chief Directorate: WaterUse and Conservation. WFW implements its programmes throughagents such as the Parks Board and local authorities. Trainingis provided through service providers. A range of furtherpartnerships has been developed with government departmentsand non-governmental agencies.
Funding is derived from the Poverty Relief Fund, Department ofWater Affairs and Forestry, Department of Education andTraining and the Department of Agriculture and Land Affairs.The poverty relief fund currently provides 90% of theprogramme’s allocations. WFW has spent 95% of its budget overthe past five years.
Funds are disbursed either directly to contractors or throughimplementing agents who manage the project and disburse fundson behalf of WFW. At the lowest level, every project has asteering committee on which workers are represented that meetsat least quarterly.
6.4.3 Programme description and objectivesThe focus of the programme is on the clearing of invasivealien plants. The work is undertaken for six principaldevelopmental reasons: water security; environmental conservation; productive use of land; prevention of fires and flooding; promotion of secondary industries; and
28
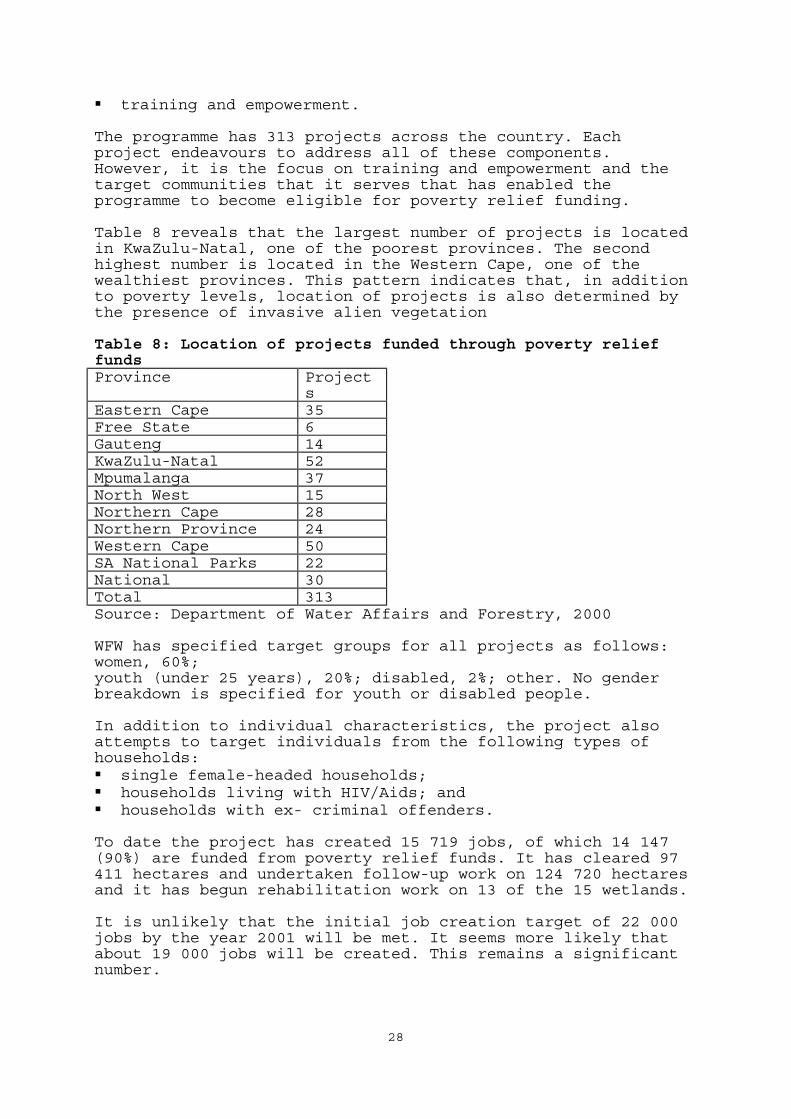
training and empowerment.
The programme has 313 projects across the country. Eachproject endeavours to address all of these components.However, it is the focus on training and empowerment and thetarget communities that it serves that has enabled theprogramme to become eligible for poverty relief funding.
Table 8 reveals that the largest number of projects is locatedin KwaZulu-Natal, one of the poorest provinces. The secondhighest number is located in the Western Cape, one of thewealthiest provinces. This pattern indicates that, in additionto poverty levels, location of projects is also determined bythe presence of invasive alien vegetation
Table 8: Location of projects funded through poverty relieffundsProvince Project
sEastern Cape 35Free State 6Gauteng 14KwaZulu-Natal 52Mpumalanga 37North West 15Northern Cape 28Northern Province 24Western Cape 50SA National Parks 22National 30Total 313Source: Department of Water Affairs and Forestry, 2000
WFW has specified target groups for all projects as follows:women, 60%;youth (under 25 years), 20%; disabled, 2%; other. No genderbreakdown is specified for youth or disabled people.
In addition to individual characteristics, the project alsoattempts to target individuals from the following types ofhouseholds: single female-headed households; households living with HIV/Aids; and households with ex- criminal offenders.
To date the project has created 15 719 jobs, of which 14 147(90%) are funded from poverty relief funds. It has cleared 97411 hectares and undertaken follow-up work on 124 720 hectaresand it has begun rehabilitation work on 13 of the 15 wetlands.
It is unlikely that the initial job creation target of 22 000jobs by the year 2001 will be met. It seems more likely thatabout 19 000 jobs will be created. This remains a significantnumber.

29
Table 9 shows the number of people employed by type of job, aswell as daily payment. Labourers account for the highestnumber of person days in employment (724 004), while semi-skilled workers account for the second largest category(223 216). Women make up more than half (6 151) of peopleemployed as labourers. 54% of wages in this job category werepaid to women who account for a smaller proportion of thesemi-skilled, supervisory and managerial positions, where thedaily wages are higher. Women are particularly rare in thesemi-skilled category.
Table 9: Working for Water: Breakdown of employmentType Person
daysDailypayment(R)
%wagespaid towomen
Number of people as at 31 December 2000
Parttime
Fulltime
Total Women
Youth Disabled
Labourer 724 004 30 54 11 224 11 224 6 151 1 834 58Semi-skilled
223 216 34–44 15 3 473 11 224 1 181 347 0
Supervisor 53 293 60–80 5 813 813 268 73 4Managerial 36 624 285-860 40 210 210 84 17 2Total 1 037 137 15 510 210 23 471 7 684 2 271 65Source: Department of Water Affairs and Forestry, 2000
In addition to jobs, WFW aims to provide a minimum average oftwo days of training every month to workers. It also providesat least one hour of HIV/Aids awareness training everyquarter. The programme attempts to facilitate access tochildcare for workers. The Department of Social Developmenthas provided funding and support for 3 000 children so far.
6.4.4 Budget and other resourcesThe Department of Water Affairs and Forestry obtained R290m infunding from the poverty relief funds in 2001/02 and R330m hasbeen allocated for each of the periods 2002/03 and 2003/04.
Table 10 shows that the programme also benefits fromsignificant funding and resources such as staff time fromother government departments, the private sector and NGOs.
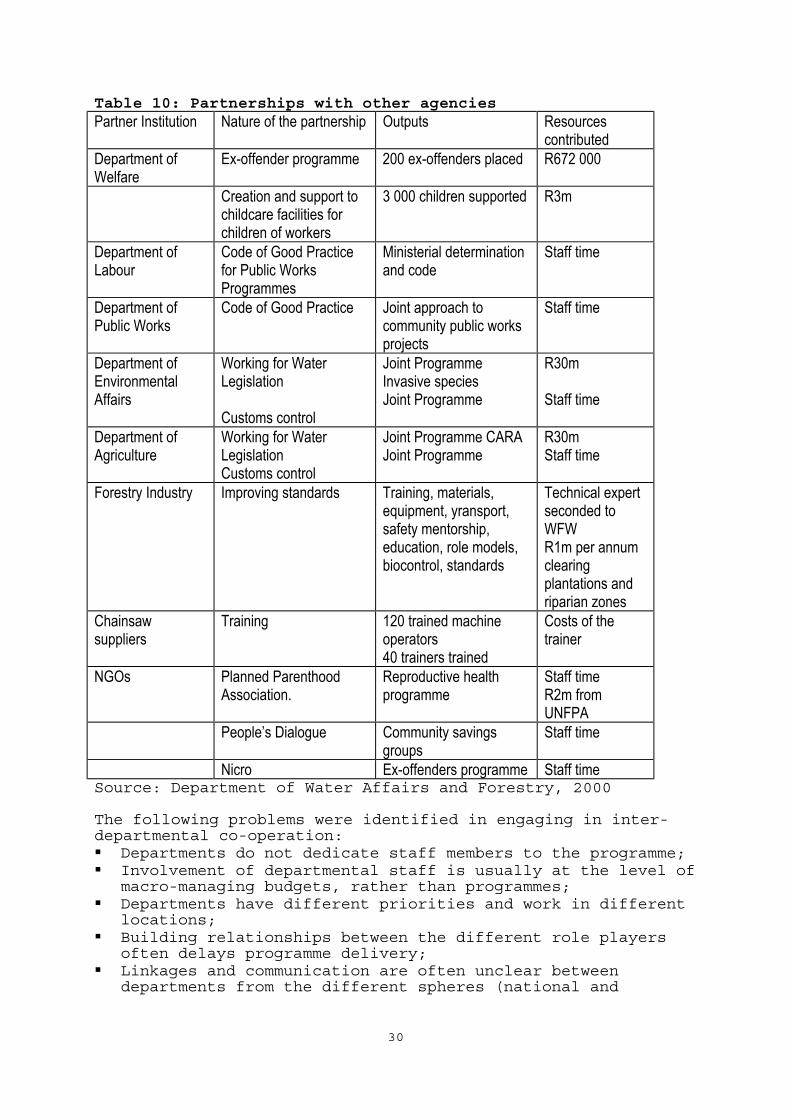
30
Table 10: Partnerships with other agenciesPartner Institution Nature of the partnership Outputs Resources
contributedDepartment ofWelfare
Ex-offender programme 200 ex-offenders placed R672 000
Creation and support tochildcare facilities forchildren of workers
3 000 children supported R3m
Department ofLabour
Code of Good Practicefor Public WorksProgrammes
Ministerial determinationand code
Staff time
Department ofPublic Works
Code of Good Practice Joint approach tocommunity public worksprojects
Staff time
Department ofEnvironmentalAffairs
Working for WaterLegislation
Customs control
Joint ProgrammeInvasive speciesJoint Programme
R30m
Staff time
Department ofAgriculture
Working for WaterLegislationCustoms control
Joint Programme CARAJoint Programme
R30mStaff time
Forestry Industry Improving standards Training, materials,equipment, yransport,safety mentorship,education, role models,biocontrol, standards
Technical expertseconded toWFWR1m per annumclearingplantations andriparian zones
Chainsawsuppliers
Training 120 trained machineoperators40 trainers trained
Costs of thetrainer
NGOs Planned ParenthoodAssociation.
Reproductive healthprogramme
Staff timeR2m fromUNFPA
People’s Dialogue Community savingsgroups
Staff time
Nicro Ex-offenders programme Staff timeSource: Department of Water Affairs and Forestry, 2000
The following problems were identified in engaging in inter-departmental co-operation: Departments do not dedicate staff members to the programme; Involvement of departmental staff is usually at the level ofmacro-managing budgets, rather than programmes;
Departments have different priorities and work in differentlocations;
Building relationships between the different role playersoften delays programme delivery;
Linkages and communication are often unclear betweendepartments from the different spheres (national and

31
provincial) and projects. This results in funding gettingstuck which, in turn, delays implementation.
Institutional dysfunctionality continues to remain a majorhindrance to development.
7. Programme monitoringAcknowledgement of the importance of programme monitoring is acontinuous strand in government policies, white papers, bills,budget votes and legislation. In 1998/99, the Department ofWelfare declared that the Flagship programme requiredcomputerised monitoring. The department declared itscommitment to developing such a programme and evaluationsystem ‘to ensure quantitative and qualitative measurement ofthe development impact throughout the life of the programme’(Department of Social Welfare, 1998/1999:4).
A year later, the department’s annual report states that itwas ‘enhancing the ability to monitor and evaluate the povertyrelief programme.’ The Minister of Social Development addedthat the department ‘also intends evaluating the impact of thevarious community development initiatives implemented over thepast two years, for example, the Flagship programme for women’(Department of Finance, 2000, p. 16).
The 1999/00 annual report notes that the United NationsDevelopment Programme made a consultant available from itsdevelopment support facility to address monitoring andevaluation among other concerns. The department hasestablished a task team comprising of senior management atboth national and provincial departmental level to workclosely with the consultant.
Despite these repeated assertions of the intention to monitor,very little monitoring activity has been undertaken.
The 1999/00 report nevertheless makes the assertion that inrespect of the Flagship Programme:
The projects demonstrate that the developmental approachto social welfare can be made a reality as they combineincome-generation skills training and early childhooddevelopment programmes. Some of the projects have beenremarkably successful and participating women earn two orthree times more than they would receive from a stategrant. An example is the pilot project in Bekkersdal,Gauteng, which received the Masakhane Presidential Award.
The receipt of an award does not substitute for detailedmonitoring. Other awards were also made without propermonitoring of the projects. For example, in 1998, the PhilaniFlagship Project received the Ithembi Award and the FirstNational Bank Vita Now Craft Awards. These awards obscure thefact that the department has not monitored the projects whichhave many obvious failings. They are not successful inbusiness terms. They violate basic human rights and labourstandards pertaining to a healthy environment. These failingscould have been avoided. A proper monitoring system could have

32
ensured that preventative and curative measures were takenfrom the outset. Moreover, the projects have repeatedlyrequested government monitoring.
Those who are meant to benefit from the new deal experiencethe impact of the failure of government to monitor projects.In the Philani progress report of December 2000, a plea ismade to the national department to monitor the project. Thisrequest is made within the context of the business plan, whichrecommends that representatives of the Department of SocialWelfare attend a management meeting. Further, the progressreport highlights a crisis in the project. It speaks of a‘severe breakdown in communication’ between the project staff,the project participants, the provincial department and thePhilani committee. This crisis was so severe that a task teamwas established to mediate.
Research conducted on the Philani project highlighted themistrust between staff and project women, which focusedprimarily around money (Duwe, 2000). While Duwe’s researchdoes not constitute a project evaluation, it highlights thevalue of external monitoring and evaluation, especiallyregarding a pilot project.
Our own experience with the KwaZulu-Natal provincialdepartment revealed an embargo on research. Because theprovincial office failed to disclose any official documents,including the budget for the project, it was not possible toascertain how effectively developmental social welfare wasbeing implemented. It was also not possible to find outadequately how the target beneficiaries, namely poor ruralwomen, benefit from the government’s new vision. It is beyondthe scope of the research to comment on the workingenvironment of government officials. However, it is cause forconcern that while certain social development officialsregularly live in hotels and commute from Pietermaritzburg andDurban to Ulundi, workers in the project have not yet earned acent after a full year of work.
7.1 WFW monitoring of expenditure and project implementationEvery WFW project is required to submit a monthly keyperformance indicator report detailing the number of peopleemployed per target group, number of hectares cleared andexpenditure.
Working for Water has set up a technical, operational andsocial monitoring and evaluation audit framework withaccompanying standards. In addition to quarterly internalevaluations, projects are externally evaluated against thesestandards annually. Follow-up corrective evaluation measuresare taken where necessary. This detailed monitoring processwith clear key performance indicators and outputs, makes iteasier to assess the success of the projects on an ongoingbasis.

33
8. Developmental social welfare: the way forwardThis report provides a snapshot of progress in implementingthe developmental social welfare model. Government’scommitment to eradicating poverty is evidenced firstly by itssigning of the War against Poverty with organisations of civilsociety and secondly by its budgetary injections into thepoverty relief fund. However, the case studies suggest thatdevelopmental projects cannot be regarded as a primaryapproach to addressing unemployment and poverty. Given thefindings of this report, it is worrying that the Department ofWelfare relies so heavily on the Flagship programme todemonstrate the success of the developmental social welfareapproach. This study shows that at least two of these projectsare struggling to survive. One of these has received awards.The case studies suggest that it is questionable whether theseprojects can become sustainable and provide women participantswith a living income.
Much planning around developmental social welfare has takenplace within the national department. The white papers onSocial Welfare and Financing Policy for Developmental SocialWelfare Services provide evidence of the planning. However,our investigation suggests a large gap between policy andimplementation. In 1996/97, at the time when the Philaniproject was set up, many of the systems were not yet in place.But by the time the Impendle project was established, it seemsthat those responsible in the provincial and nationaldepartment as well as project co-ordinators still were notclear as to what the proper procedures were. They were unableto get money to projects speedily.
It is questionable whether government agencies are theappropriate institutions to manage developmental projects.Without adequate experience and training, welfare officialsare not equipped for this work. Some NGOs and community-basedorganisations (CBOs) have a wealth of experience in managingprojects. However, it may not be the optimal approach forgovernment to manage projects through them. The NGOs’ uneasyfunding relationship with government could place them in adependency relationship without the power to question theapproach or viability of projects. This relationship isexacerbated by the ongoing financial crisis in the NGO and CBOmovement.
It is also open to question whether the budgetary allocationsultimately benefit the targeted groups as much as they could.The description of the Philani project reveals that the bulkof government allocation benefits the programme managers andnot poor women. The managers are people with experience inproject management. In most instances, the participants’ lowformal education levels are a major obstacle to their abilityto take control and ownership of projects. Training helps, butit does not seem to overcome all obstacles.
The department itself poses critical questions in its 1999/00annual report. In particular, it raises concerns about thehigh number of projects that are losing funds due to

34
administrative problems and poor capacity building. Itsuggests that development workers should be drawn frombeneficiary communities as a means of addressing this problem.
Even if training is provided, and local people employed, thequestion remains as to whether the projects can beeconomically viable in the sense of competing on the openmarket. A situation of high levels of unemployment and povertyis not the ideal environment for struggling community-basedinitiatives to survive, let alone to become sustainable.Research reveals that the majority of private small businessesdo not survive (Wesgro, 1998).
It seems that government’s money would be better spent on amassive public works programme. The Working for WaterProgramme shows that a substantial number of poor people, andin particular women, have benefited from the programmes(Aliber, 2001). Because the participants remain employees,public works programmes ensure the employment of a substantialnumber of workers who enjoy a fixed income. This is differentfrom development projects, where participants rely on theuncertain income generated by the project. Already thedepartment is recommending a shift from small unsustainableprojects to programmes (Department of Social Welfare, 2000).However, the department does not provide sufficient detailsregarding the nature of these programmes and how the shiftwill address the problems.
In light of these problems, it is recommended that governmentincrease social grants in line with the demands fromorganisations of civil society. The phasing out of the SMG iscontinuing to have a ripple effect in poor communities andhouseholds who were dependent on the grant. Other symptoms ofpoverty are well-documented in the report on the PovertyHearings convened by Sangoco, the Human Rights Commission, theCommission on Gender Equality and others (Budlender, 1998). Itis ironic that government gives with the one hand and takesaway with the other in relation to female-headed households.
9. AcknowledgementsDesiree Manicom for assisting with the research in KwaZulu-Natal, the Department of Social Welfare officials in theWestern Cape and KwaZulu Natal for their co-operation, and,finally, the project participants for their invaluable input.
10. ReferencesAliber M. 2001. An overview of the incidence and nature ofchronic poverty in South Africa. Research Report. Programmefor Land and Agrarian Studies (PLAAS). University of theWestern Cape, Cape Town.
Budlender D (ed). 1998. The People’s Voices. National SpeakOut on Poverty Hearings, March to June 1998. Convened by theCommission on Gender Equality, South African Human RightsCommission, and South African NGO Coalition. Johannesburg.

35
Department of Finance. 1999. National Expenditure Survey.Pretoria.
Department of Finance. 2001. The 2001 Budget Review. Pretoria.
Department of Social Welfare. 1996. Flagship programme:Developmental programmes for unemployed women under fiveyears. Pretoria.
Department of Social Welfare. 1999a. Financing Policy –Developmental Social Welfare Services, Government Gazette No.19888, Notice 463.
Department of Social Welfare. 1999b. Annual Report 1998-1999.
Department of Social Welfare. 2000. Annual Report 1999-2000.
Department of Social Welfare. 31 August 2000. Mid-yeardepartmental programme report to Minister Zola Skweyiya fromthe Director-General of the Department of Social Development(DSD).
Department of Social Welfare. 2001. Estimates of Expenditurefor 2001 – key objectives, policy developments, spendingtrends, outputs and service delivery indicators. Pretoria.
Department of Water Affairs and Forestry (DWAF). 2001. Workingfor Water Progress Report on allocation for povertyalleviation, infrastructure and job summit projects, April-December 2000. Cape Town.
Department of Water Affairs and Forestry. Website – http://www-dwaf.pwv.gov.za/Projects/WFW/
Disability Economic Empowerment Think Tank. 1999. Submissionto the Department of Welfare’s National Consultative Process,Pretoria.
Duwe A. 2000. Women’s economic development: Self-employmentand co-operation, Research Report .
Fairshare. 2001. National Budget Handbook 2001/1. School ofGovernment, University of Western Cape.
Jaffee G (ed). 1988. Building Worker Co-operatives in SouthAfrica. Labour Economic Research Centre. Johannesburg.
Lund F, Ardington S & Harber M. 1996. ‘Welfare’ in D Budlender(ed) The Women’s Budget. Cape Town: Institute for Democracy inSouth Africa.
Masu L. 2000. Education levels of Philani participants.Research Report. Compiled for Philani.
Midgley J. 1996. ‘The developmental perspective in socialwelfare: Transcending residual and institutional models’ inSocial Work Practice, March 1996.

36
Ministry for Welfare, Population and Development. 1999.National Consultative Process. Summary report of submissionsmade.
Mrwati S. 2001. Survey on factors influencing choice ofsettlement area. Tabasa Projects cc on behalf of PhilaniProject. Cape Town.
National Treasury. 2000. Intergovernmental Fiscal Review 2000.Pretoria.
National Treasury, 2001. Estimates of National Expenditure.Pretoria.
Patel L and Stewart M. 1998. Working towards developmentalwelfare: lessons from the IDT’s strategy to promotedevelopmental social welfare. IDT Research Report
Philani. 2000a. Philani Flagship Programme Report.
Philani. 2000b. Philani Flagship Project Business Plan 2002-2002.
Philani. 1998. Philani Flagship Programme Report.
South African Government. 1998. War on Poverty Declaration.
Wesgro. 1998. Lwandle-Nomzamo: Labour, Employment and LocalBusiness.
Zain P. 1999. The Impact of the cancellation of the statemaintenance grant. Nadel Human Rights Research and AdvocacyProject Research Report.