development studies (pids). he holds a ph.d. in … · development studies (pids). he holds a ph.d....
TRANSCRIPT


The author is a Senior Research Fellow at the Philippine Institute forDevelopment Studies (PIDS). He holds a Ph.D. in Economics from ClarkUniversity. His areas of expertise include applied general equilibriummodelling, total factor productivity estimation, and trade and poverty.
This paper was prepared for the PIDS Perspective Paper SymposiumSeries and presented on September 5, 2002 as part of the Institute’scelebration of its silver founding anniversary.

Caesar B. Cororaton
PERSPECTIVE PAPER SERIES NO. 10
PHILIPPINE INSTITUTE FOR DEVELOPMENT STUDIESSurian sa mga Pag-aaral Pangkaunlaran ng Pilipinas
Research and Developmentand Technology in the Philippines

Copyright 2003Philippine Institute for Development Studies
Printed in the Philippines. All rights reserved.
The views expressed in this paper are those of the author and do notnecessarily reflect the views of any individual or organization. Please do notquote without permission from the author nor PIDS.
Please address all inquiries to:
Philippine Institute for Development StudiesNEDA sa Makati Building, 106 Amorsolo StreetLegaspi Village, 1229 Makati City, PhilippinesTel: (63-2) 893-5705 / 892-4059Fax: (63-2) 893-9589 / 816-1091E-mail: [email protected]: http://www.pids.gov.ph
ISBN 971-564-072-9RP 12-03-500
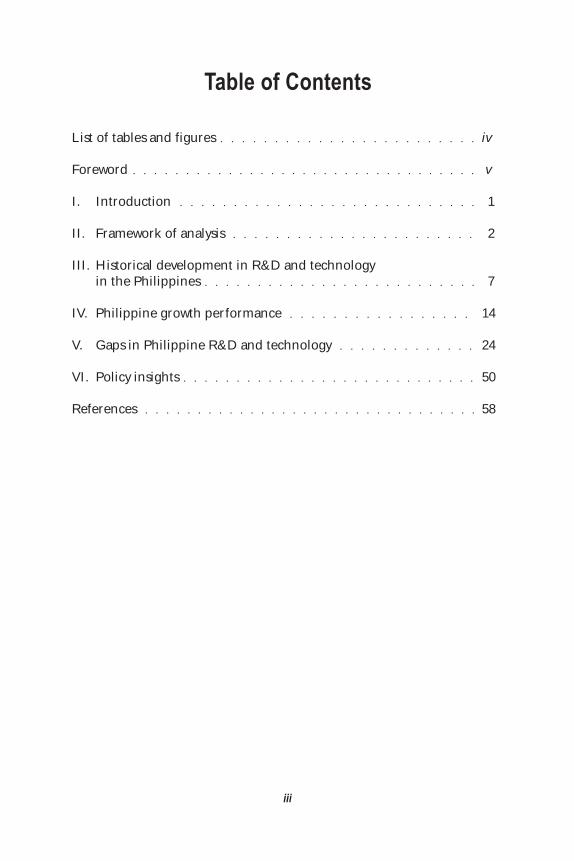
Table of Contents
List of tables and figures ○ ○ ○ ○ ○ ○ ○ ○ ○ ○ ○ ○ ○ ○ ○ ○ ○ ○ ○ ○ ○ ○ ○ ○ iv
Foreword ○ ○ ○ ○ ○ ○ ○ ○ ○ ○ ○ ○ ○ ○ ○ ○ ○ ○ ○ ○ ○ ○ ○ ○ ○ ○ ○ ○ ○ ○ ○ ○ ○ v
I. Introduction ○ ○ ○ ○ ○ ○ ○ ○ ○ ○ ○ ○ ○ ○ ○ ○ ○ ○ ○ ○ ○ ○ ○ ○ ○ ○ ○ ○ 1
II. Framework of analysis ○ ○ ○ ○ ○ ○ ○ ○ ○ ○ ○ ○ ○ ○ ○ ○ ○ ○ ○ ○ ○ ○ ○ 2
III. Historical development in R&D and technologyin the Philippines ○ ○ ○ ○ ○ ○ ○ ○ ○ ○ ○ ○ ○ ○ ○ ○ ○ ○ ○ ○ ○ ○ ○ ○ ○ ○ 7
IV. Philippine growth performance ○ ○ ○ ○ ○ ○ ○ ○ ○ ○ ○ ○ ○ ○ ○ ○ ○ 14
V. Gaps in Philippine R&D and technology ○ ○ ○ ○ ○ ○ ○ ○ ○ ○ ○ ○ ○ 24
VI. Policy insights ○ ○ ○ ○ ○ ○ ○ ○ ○ ○ ○ ○ ○ ○ ○ ○ ○ ○ ○ ○ ○ ○ ○ ○ ○ ○ ○ ○ 50
References ○ ○ ○ ○ ○ ○ ○ ○ ○ ○ ○ ○ ○ ○ ○ ○ ○ ○ ○ ○ ○ ○ ○ ○ ○ ○ ○ ○ ○ ○ ○ ○ 58
iii

List of Tables and FiguresTables1 DOST councils ○ ○ ○ ○ ○ ○ ○ ○ ○ ○ ○ ○ ○ ○ ○ ○ ○ ○ ○ ○ ○ ○ ○ ○ ○ ○ ○ 82 Summary of science and technology policies by strategy ○ ○ ○ ○ ○ 113 Summary of S&T policy programs in the Philippines ○ ○ ○ ○ ○ ○ ○ 124 The Philippine economy ○ ○ ○ ○ ○ ○ ○ ○ ○ ○ ○ ○ ○ ○ ○ ○ ○ ○ ○ ○ ○ ○ 145 Production structure ○ ○ ○ ○ ○ ○ ○ ○ ○ ○ ○ ○ ○ ○ ○ ○ ○ ○ ○ ○ ○ ○ ○ ○ 156 Estimated Philippine total factor productivity ○ ○ ○ ○ ○ ○ ○ ○ ○ ○ 187 Effects of labor quality on TFP ○ ○ ○ ○ ○ ○ ○ ○ ○ ○ ○ ○ ○ ○ ○ ○ ○ ○ 208 Effects of sectoral labor movement on TFP ○ ○ ○ ○ ○ ○ ○ ○ ○ ○ ○ ○ 219 Determinants of total factor productivity ○ ○ ○ ○ ○ ○ ○ ○ ○ ○ ○ ○ ○ 2210 PCGNP, SE/MP, and GERD/GNP (in 91 countries of the world) 2511 Agricultural research intensity ratios of selected countries ○ ○ ○ 2812 Distribution of public expenditures for agriculture and natural
resources by policy instruments, 1987-1994 ○ ○ ○ ○ ○ ○ ○ ○ ○ ○ ○ ○ 2913 Public expenditures for research and development in agriculture
and natural resources, gross value-added in agriculture includingfishery and forestry, and research intensity ratios (RIR), 1992-1996 ○ ○ ○ 34
14 Public expenditures for research and development in agriculture,natural resources, and related environmental issues ○ ○ ○ ○ ○ ○ ○ 35
15 Agency-funded fisheries R&D projects of NARRDS institutions ○ ○ ○ 3616 Agency-funded fisheries R&D projects of NARRDS, 1996 ○ ○ ○ ○ 3717 R&D expenditures for fisheries by sector and source of funds,
1988-1994 ○ ○ ○ ○ ○ ○ ○ ○ ○ ○ ○ ○ ○ ○ ○ ○ ○ ○ ○ ○ ○ ○ ○ ○ ○ ○ ○ ○ ○ ○ 3818 R&D expenditures for fisheries of selected NARRDS institutions
by source of external grants, 1992-1996 ○ ○ ○ ○ ○ ○ ○ ○ ○ ○ ○ ○ ○ ○ 3919 Distribution of manpower for fishery R&D ○ ○ ○ ○ ○ ○ ○ ○ ○ ○ ○ ○ 4020 Distribution of the NARRDS R&D program budget ○ ○ ○ ○ ○ ○ ○ 4021 Manpower for fisheries R&D of selected NARRDS institutions,
1998 ○ ○ ○ ○ ○ ○ ○ ○ ○ ○ ○ ○ ○ ○ ○ ○ ○ ○ ○ ○ ○ ○ ○ ○ ○ ○ ○ ○ ○ ○ ○ ○ ○ 4122 Comparison of the number of R&D personnel in selected
NARRDS and NARRDN institutions, 1995-1996 ○ ○ ○ ○ ○ ○ ○ ○ ○ ○ 4223 R&D expenditures for fisheries ○ ○ ○ ○ ○ ○ ○ ○ ○ ○ ○ ○ ○ ○ ○ ○ ○ ○ 4324 Tertiary education across selected Pacific Rim countries ○ ○ ○ ○ ○ 46
Figures1 Production function ○ ○ ○ ○ ○ ○ ○ ○ ○ ○ ○ ○ ○ ○ ○ ○ ○ ○ ○ ○ ○ ○ ○ ○ 32 Technological innovation process ○ ○ ○ ○ ○ ○ ○ ○ ○ ○ ○ ○ ○ ○ ○ ○ ○ 53 Three-year moving average business-fluctuation-adjusted
TFP growth ○ ○ ○ ○ ○ ○ ○ ○ ○ ○ ○ ○ ○ ○ ○ ○ ○ ○ ○ ○ ○ ○ ○ ○ ○ ○ ○ ○ ○ 194 Decomposition of output growth ○ ○ ○ ○ ○ ○ ○ ○ ○ ○ ○ ○ ○ ○ ○ ○ ○ 195 Types of labor ○ ○ ○ ○ ○ ○ ○ ○ ○ ○ ○ ○ ○ ○ ○ ○ ○ ○ ○ ○ ○ ○ ○ ○ ○ ○ ○ ○ 196 Contribution of labor quality to TFP growth ○ ○ ○ ○ ○ ○ ○ ○ ○ ○ ○ 207 Contribution of sectoral labor movement to TFP growth ○ ○ ○ ○ ○ 21
iv

v
Foreword
The Philippine Institute for Development Studies (PIDS) celebrated itssilver founding anniversary in 2002. In this connection, various activitieswere held to highlight the contribution and significance of policy researchin governance as well as to commemorate more than two decades ofproviding competent research.
One of these activities is the Perspective Paper Symposium Series wherethe PIDS research fellows presented a perspective of the development andevolution of issues and concerns over the past 25 years in their respectivefields of specialization such as infrastructure, banking and finance, scienceand technology, human resources development and labor markets,competition policy, poverty analysis and housing development. The 11papers covered most of the themes in the PIDS research agenda andpresented reviews of specific policy issues from where policy debates canproceed with greater focus.
Such outputs, however, are best disseminated in book formats so as towiden the reach of the excellent observations, analyses and recommen-dations put forward by the Institute’s inhouse pool of researchers. Thus,the Institute presents 11 commendable titles under the Perspective PaperSeries as its contribution to Philippine policy research.
It is with confident expectation that this Series will provide the essentialanswers to the concerns and gaps in various policy issues which the Institutehas been trying to address in the last 25 years.
Economic growth is determined by how well a country mobilizes itsresources to improve productivity in order to increase production of goodsand services. Generally, resources include labor and human skills, capital,land and natural resources, while major factors affecting productivity aretechnology, research and development. The latter is the focus of this book.
MARIO B. LAMBERTE, Ph.D.President, PIDS

1
1Introduction
This paper analyzes research and development (R&D) and technology fromthe perspective of Philippine economic growth. It examines the productivityperformance of the economy and analyzes how it has been affected bydevelopments in R&D and technology. It also assesses general R&D andtechnology policies alongside institutional structure and arrangements.National as well as specific sectoral gaps are identified, while weaknesses ininstitutional arrangements are highlighted. Insights for policy are derivedfrom the analysis.
The paper has six sections. The next section focuses on the frameworkof analysis. The third section gives a brief discussion of some of the majorhistorical developments in Philippine R&D and technology. The fourthsection analyzes Philippine growth performance in terms of changes instructure and productivity. The fifth section identifies major gaps in R&Dand technology in the country. The sixth and final section derives insightsfor policymaking.
2 Research and Development and Technology in the Philippines
Economic growth is determined by how well a country mobilizes its resourcesto improve productivity in order to increase production of goods andservices. Generally, resources include labor and human skills, capital, landand natural resources, while major factors affecting productivity aretechnology, research and development. The latter is the focus of the paper.
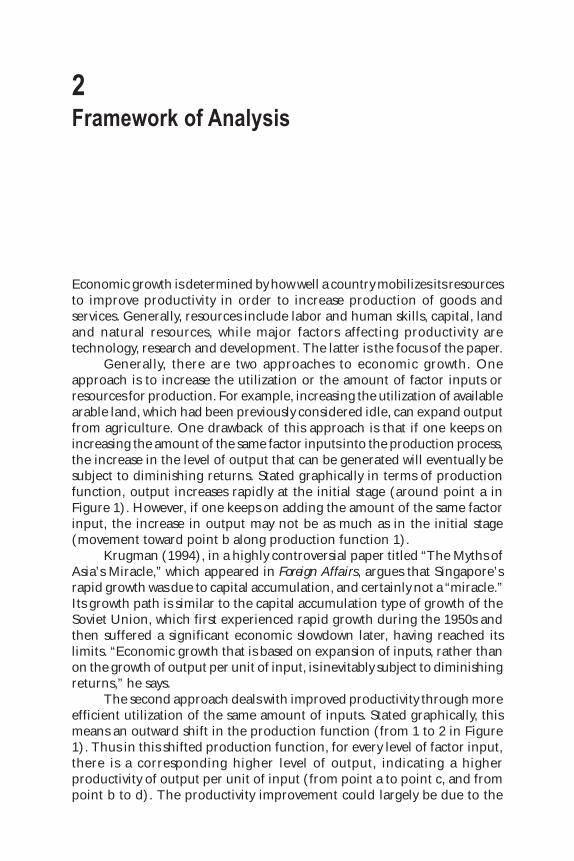
Generally, there are two approaches to economic growth. Oneapproach is to increase the utilization or the amount of factor inputs orresources for production. For example, increasing the utilization of availablearable land, which had been previously considered idle, can expand outputfrom agriculture. One drawback of this approach is that if one keeps onincreasing the amount of the same factor inputs into the production process,the increase in the level of output that can be generated will eventually besubject to diminishing returns. Stated graphically in terms of productionfunction, output increases rapidly at the initial stage (around point a inFigure 1). However, if one keeps on adding the amount of the same factorinput, the increase in output may not be as much as in the initial stage(movement toward point b along production function 1).
Krugman (1994), in a highly controversial paper titled “The Myths ofAsia’s Miracle,” which appeared in Foreign Affairs, argues that Singapore’srapid growth was due to capital accumulation, and certainly not a “miracle.”Its growth path is similar to the capital accumulation type of growth of theSoviet Union, which first experienced rapid growth during the 1950s andthen suffered a significant economic slowdown later, having reached itslimits. “Economic growth that is based on expansion of inputs, rather thanon the growth of output per unit of input, is inevitably subject to diminishingreturns,” he says.
The second approach deals with improved productivity through moreefficient utilization of the same amount of inputs. Stated graphically, thismeans an outward shift in the production function (from 1 to 2 in Figure1). Thus in this shifted production function, for every level of factor input,there is a corresponding higher level of output, indicating a higherproductivity of output per unit of input (from point a to point c, and frompoint b to d). The productivity improvement could largely be due to the
2Framework of Analysis

3
introduction of the process of technological innovation in production. Theprocess of technological innovation could involve a range of activities suchas the utilization of better machinery, use of better production managementand methods, and the application of best practices, whether in factories orin offices.
Technological innovation and economic growth are mutuallyreinforcing (Hirono 1985). That is, higher rate of growth tends to generateproductivity improvement through technology innovation through researchand development, and vice versa. This is especially true when there areincreasing returns to scale. In such cases, the outward shift of the productionfunction would have no boundaries, implying the absence of limits togrowth.
Historically, the whole idea of technology affecting economic growthdates back to the 18th and 19th centuries when scientific principles, whichhad accumulated since the start of modern science in 16th and 17th centuries,were turned into technologies and applied to the process of productionduring the Industrial Revolution in Western Europe. The steam engine,for example, which triggered the start of the Revolution, was the result ofthe accumulation of knowledge through scientific discoveries and theapplication to the process of production.
Framework of Analysis
2
1
d
b c
a
Figure 1. Production function
Output
Q2’
Q1’
Q2
Q1
x1 x2 Input

4 Research and Development and Technology in the Philippines
However, the relationships between technological innovation andeconomic growth were made evident by the remarkable experience of Japanafter the World War II and South Korea after the Korea War in 1960s.Through technological development policies that started to turn the wheelof technological innovation process, these countries were able to achieverapid economic growth in a sustained manner. In a significantly shorterperiod of time compared to Western Europe, these countries were able totransform their economies from almost completely devastated right afterthe war into highly advanced industrial economies at present.
The process of technological innovation referred to here (Figure 2)was conceptualized by Yamada (1964) and later cited by Choi (1983). Asshown in the figure, it is a dynamic process of progressive technologicaladvances and economic growth, each one reinforcing the other. The processcontinues in a sustained manner, and in each round growth improves.
Generally, technological innovation involves two major parts—researchand innovation. The innovation part consists of two phases. In the firstpart, the introduction of new technology leads to new products and reducesthe cost of production. These new products have better quality than before.Because of the reduction in cost per unit, for the same total cost ofproduction, the quantity of output that could be produced would increase.Better quality products and greater volume of production result in massproduction that could attract entrepreneurs to increase their marketingeffort and could further reduce cost because of economies of scale. Massproduction and lower cost could result in mass consumption. These wholeset of activities could lead to improved income for the general public.Increased income could lead to changes in taste, which in turn could resultin higher demand for more quality products. This impulse could triggerpressure to improve the existing technology. Thus, the entire process repeatsitself and continues in this cycle toward economic prosperity.
The outstanding performance of Japan and South Korea is worthnoting. They have been able to close their technological gap with highlyadvanced industrial countries in so short a period of time. From theperspective of developing countries, the question to ask is: Can this fastcatching-up process generally hold for the rest of technologically backwardcountries? There are two schools of thought on this issue that ought to bereviewed briefly because of their implications on the Philippine case.
The first school of thought,1 which started with Gerschenkron’s (1962)discussion of the advantageous backwardness, deals with the issue ofconvergence (Barro and Sala-i-Martin 1995). The convergence school statesthat technologically backward countries benefit from the technology createdby advanced countries. One of the strongest postulates of this schoolcategorically states that the “... catch-up growth is proportional to thedifference in technological capabilities between a follower and the leaders.
1The paper of Evenson and Westphal (1995) provides a good survey of literature on this issue.

� 5
Framew
ork of Analysis
Figure 2. Technological innovation process
Source: Quoted from Choi (1983) but original source is Yamada (1964).

6 Research and Development and Technology in the Philippines
This predicts an inverse relationship between technological capabilities atany point in time and subsequent productivity (as well as economic) growth”(Evenson and Westphal 1995).
Through technology transfer, backward countries can catch up withadvanced nations. With appropriate policies and investments on education,physical capital, general management capability, research and development(R&D), backward countries can learn the technology developed in advancednations. Along with these developments is a convergence of income andproductivity levels.
The other school argues that the process may not be that easy andstraightforward. Although newly industrialized countries (NICs)2 have grownrapidly in recent times and have in fact converged to the leading countriesin terms of income and productivity, most developing countries are not ona similar path of convergence toward advanced nations. In fact, there is adivergence (Easterly 1981; Williamson 1991). A whole range of factors maybe responsible for the divergence and the widening gap between mostdeveloping countries and advanced nations. These factors can includeadverse institutions and deficient policy regimes. Choi (1983) includes anumber of factors like the vicious circle of poverty in which most developingcountries are trapped. He cites other factors:
Developing countries are weak in policy formulation for scientificand technological development. In these countries, public interest in scienceand development is low. Their traditional cultures are hostile and can posehindrances to the creation of viable science policy.
There is lack of viable institutional setups and inadequate R&Dsystems in these countries. Often, research equipment is inadequate,research budgets are nil, and research budget allocation is extremelyinefficient.
There is very limited scientific manpower in these countries.Most of these countries rely heavily on imported technology.
However, there are no clear-cut policies and programs to develop domesticcapability to modify and improve these imported technologies for domesticapplications. There are no policies to address technology dependence.
There is lack of participation of relevant sectors in these economiesin the development of science and technology, particularly in the industrialsector to which most of the applied research and development efforts aredirected.
2Generally known to include South Korea, Hong Kong, Singapore, and Taiwan.

7Problems in the Natural Resources and Environment Sector
3Historical Development in R&Dand Technology in the Philippines3
Philippine science and technology (S&T) has a long history, dating back tothe early American colonial period during which the Bureau of Sciencewas created. The American government, through this Bureau, formed thePhilippine S&T. However, the coverage was very limited. It mainly focusedon agriculture, health and food processing. Thus, because of the colonialeconomic policy, the development of industrial technology was largelyneglected.
Moreover, the public school system was created at about the sameperiod. Through the creation of the University of the Philippines (UP)system and the various S&T-related agencies and laboratories, the Bureaubecame effectively the training ground for Filipino scientists.
Major shifts in the direction of Philippine S&T took place right afterthe proclamation of independence in 1946. It was reorganized into anInstitute of Science and was put under the Office of the President of thePhilippines. Despite these changes the real effects in terms of its impact onthe economy were marginal. The Institute suffered from lack of support,planning and coordination. In fact, the Bell Mission’s Recommendationmentioned that the Institute had no capability to support S&T developmentfor lack of basic information, neglect of experimentation, and small budgetfor R&D activities.
There were also major shifts in the 1950s and 1960s that focused onS&T institutional capacity building. This was done through the establishmentof infrastructure-support facilities like new research agencies and manpowerdevelopment. Again, the effects were not significant. The usual problemsof lack of coordination and planning, especially technology planning,prevented the system from effectively performing its functions. This wasmanifested in the unplanned activities of the researchers within the agencies.Most areas of research were left to the researchers to define under theassumption that they were attuned to the interests of the country. Theywere expected to look for technologies and scientific breakthroughs with
3Partly based on Eclar (1991) and K-Soo (1996).

8 Research and Development and Technology in the Philippines
good commercialization potential. Without clear research directions,researches were done for their own sake, leaving to chance thecommercialization of the output.
In response to these problems and to the need for S&T to generateproducts and processes that were supposed to have greater beneficial impacton the country, focus was re-directed toward applied research in the 1970s.Furthermore, in the 1980s, research utilization was given stronger emphasis.This led to a reorganization and creation of the National Science andTechnology Authority (NSTA) in 1982. One rationale for the reorganizationwas the need for an effective and efficient utilization of the results of R&Dactivities through greater commercialization of outputs. A significantinnovation under the reorganization was the creation of the S&T CouncilSystem, which became responsible for the sectoral formulation of policyand strategies for its specific field and allocation of funds. There were fourcouncils under the system: PCHRD, PCIERD, PCARRD and NRCP (Table 1for the exact names of the councils and institutes under the DOST). Later,the NRCP was replaced by PCAMRD and PCASTRD. The NSTA, for itspart, had eight research and development institutes and support agenciesunder it. In the mid-1980s, regional offices for S&T promotion and extensionwere established to further hasten the development of S&T. There was alsoa conscious effort to assist and encourage creative local inventors throughinstitution building and support measures. A national center for excellencefor the basic sciences was established in the UP campus. A scientific careersystem was also created to attract scientists to a career path that wouldprofessionalize and upgrade their status. Furthermore, linkage betweenthe academe and the private sector was strengthened with the creation ofinstitutional networks.
The creation of the councils and research institutes under the NSTAshowed a clear shift in science policy from one of a technology push to ademand-pull strategy. In this strategy, user and market demand serve as thebasis for conducting R&D/S&T programs. Thus, scientists and researcherswere placed in R&D programs whose results were supposed to have highdemand potentials.
After the EDSA Revolution in 1986, the NSTA was reorganized intowhat is now called the Department of Science and Technology (DOST) by
Table 1. DOST councils
PCARRD Philippine Council for Agriculture, Forestry and Natural Resources Researchand Development
PCAMRD Philippine Council for Aquatic and Marine Research and DevelopmentPCIERD Philippine Council for Industry and Energy Research and DevelopmentPCHRD Philippine Council for Health Research and DevelopmentPCASTRD Philippine Council for Advanced Science and Technology Research
and DevelopmentNRCP National Research Council of the Philippines

9Historical Development in R&D and Technology
virtue of Executive Order 128. The DOST, being headed by a Cabinetsecretary, was mandated to continue providing central direction, leadershipand coordination of S&T efforts and formulation and implementation ofpolicies, plans, programs and projects for S&T development.
For a more effective delivery of certain functions, the DOST was furtherrestructured, resulting in the establishment of the Technology Applicationand Promotion Institute (TAPI). This institute was created to serve as theimplementing arm of the DOST in pushing for the commercialization oftechnologies and marketing the technology services of other operatingagencies of the Department. In addition, the Science Education Institute(SEI) was created to undertake and formulate plans for the developmentof S&T education and training in the country. Moreover, the Science andTechnology Information Institute (STII) was established to serve as theinformation arm of the Department through the development andmaintenance of an S&T databank and information networks.
The National Institute of Science and Technology was reorganizedinto the present Industrial Technology Development Institute, which willundertake applied R&D, transfer R&D results to end-users, and providetechnical, advisory, and consultancy services in the fields of industrialmanufacturing, mineral processing, and energy. Entry into the advancedtechnology areas was formalized with the creation of the Advanced Scienceand Technology Institute (ASTI). In line with this, additional S&T councils,namely, the PCASTRD and the PCAMRD, were created to further strengthenthe Council system.
Furthermore, the leadership of DOST placed greater emphasis onmassive technology transfer activities. It also initiated specific interventionsthrough various programs such as the Comprehensive Technology Transferand Commercialization (CTTC). The CTTC was intended to serve as amechanism for identifying and pushing concrete results of R&D towardproductive application and utilization. The initial phase of the programthat covered the period 1989-1992 included a number of technologies whoseutilization was envisioned to create substantial impact on the nationalsocioeconomic development process and on the lives of many Filipinos, ingeneral. The program covered areas such as financing, technology packagesand training centers.
In most R&D institutes technology transfer units were established tocarry out the added responsibility of transferring completed researches.Provincial S&T centers were set up to help ensure the efficient and effectivetransfer of technologies in the provinces.
S&T services were also provided to supplement R&D and technologytransfer. Such services included the upgrading of testing, standardizationand quality control services and various forms of technical assistance andconsulting services. Assistance to investors was also provided. This consistedof patenting assistance for inventions with commercial potentials; assistancein the availment of financing for commercially viable inventions; marketingassistance; support to pilot plant operations for selected top-priority

10 Research and Development and Technology in the Philippines
technologies for commercialization; and support to the upgrading ofinventions, expertise and capabilities.
R&D institutes undertook contract researches to foster thecollaboration among the institutes, the private sector and the academe.Furthermore, they initiated funding assistance to technology developersand acceptors through tie-ups with financing institutions such as theDevelopment Bank of the Philippines, Technology Livelihood ResourceCenter, LandBank, and Private Development Corporation of the Philippines.
Incentives were provided under the Omnibus Investment Law for theconduct of certain R&D and S&T activities in the private sector. The majorincentives included income tax holiday, duty-free importation of capitalequipment, deduction from taxable income for the necessary and majorinfrastructure and facilities in less developed areas, access to bondedmanufacturing/trading warehouse system and employment of foreignnationals.
To facilitate the transfer of foreign technology, science parks were setup. These parks were also intended to a) serve as vehicles for universityinteraction with private industry; b) develop new knowledge-based industriesand strengthen existing ones; and c) provide a propitious environment forinnovation and contract research. Moreover, technology business incubatorswere initiated in certain areas to assist the transfer and commercializationof technologies by helping ensure the survival and successful growth ofnew technology firms by providing them with appropriate marketing,financial, technical, and management assistance.
In 1998 a presidential task force on S&T was formed to deal with theoverall problems confronting R&D and S&T development in the country,and to formulate an S&T development plan that would support the nationaldevelopment goal of attaining a newly industrialized country status by theyear 2000. The task force was composed of DOST, DA, DTI, DOTC,4 as wellas the presidential adviser on public resources and three academicinstitutions directly involved in S&T. The task force submitted a report tothe President in March 1989, embodying the development of 15 leadingedges to steer the country toward industrial development. These 15 leadingedges were: (1) aquaculture and (2) marine fisheries, (3) forestry and (4)natural resources, (5) process industry, (6) food and (7) feed industry, (8)energy, (9) transportation, (10) construction industry, (11) informationtechnology, (12) electronics, (13) instrumentation and control, (14)emerging technologies, and (15) pharmaceuticals.
To attain the objectives set in the S&T Master Plan (STMP), thefollowing strategies were pursued: modernize the production sectorsthrough massive technology transfer from domestic and foreign sources;upgrade the R&D capability through intensified activities in high priority
4DA – Department of Agriculture; DTI – Department of Trade and Industry; DOTC – Department of Transportationand Communication.

11
sector and S&T infrastructure development such as manpower development;and develop information networks, institutional building and S&T culturedevelopment (Tables 2 to 3).
During the Ramos administration, the DOST initiated a Science andTechnology Agenda for National Development (STAND Philippines 2000),which embodied the country’s technology development plan in the mediumterm, in particular, for the period 1993-1998. The STAND identified sevenexport winners, 11 domestic needs, three other supporting industries, andcoconut industry as priority investment areas. The seven identified exportwinners were computer software; fashion accessories; gifts, toys, andhouseware; marine products; metals fabrications; furniture; and dried fruits.The domestic needs included food, housing, health, clothing,transportation, communication, disaster mitigation, defense, environment,manpower development and energy. Because of their linkages with the abovesectors, three additional support industries were included in the list ofpriority sectors, namely, packaging, chemicals and metals. Lastly, becauseof its strategic importance, the coconut industry was included in the list.
The very recent S&T framework plan is entitled “Competence,Competitiveness, Conscience: The Medium-Term Plan of the Departmentof Science and Technology (1999-2004).” Although this plan has not yetbeen fully analyzed because it has not been subjected to any critical
Historical Development in R&D and Technology
Table 2. Summary of science and technology policies by strategy
1. Modernization of production sectorsa. Generation and active diffusion of employment-oriented and high value-added
technologiesb. Emphasis on developmental R&D toward commercializationc. Proper selection and acquisition of essential and appropriate technologiesd. Adaptation, absorption and mastery of imported technologiese. Dissemination of appropriate technologyf. Technologies with increasing accessibility to S&T information and servicesg. Reducing environmental degradation and mitigating adverse impacts of natural hazards
2. Upgrading of R&D activitiesa. Establishing R&D prioritiesb. Development of local materials and indigenous technologiesc. Stimulation of private sector participationd. Reducing environmental degradation and mitigating adverse impacts of natural hazards
3. Development of S&T infrastructurea. Development of high-quality S&T manpower in growth areasb. Expansion of S&T education and trainingc. Development of S&T institutionsd. Development of an S&T culture
Source: Eclar (1991)

12 Research and Development and Technology in the Philippines
Table 3. Summary of S&T policy programs in the Philippines
Policy and Program Brief Description
1 Modernization of the Production SectorsA Comprehensive Technology Transfer The CTTC serves as a mechanism to link
and Commercialization Program (CTTC) technology generators and users. It aims to hastenthe process of industrialization throughcommercialization of technologies whoseutilization is envisioned.
B Support programs to the CTTCB-1 Production of technology packages Provision of info and economic feasibility studiesB-2 Investors fora Venues for technology generatorsB-3 National and regional technology fairs Organized to showcase new technologies
for transferB-4 Technology financing programs Funding assistance to technologyB-5 Information services Info packages on mature technologiesB-6 DOST training centers Conduct technology trainingB-7 Regional and provincial S&T centers Ensure the transfer of technologiesB-8 DOST Academy Technology Business Link between DOST and the academe for
Entrepreneurship Development Program technology commercializationC Technology business incubators Assists new technology firms through technical,
financial, and marketing assistanceD Science and technology parks Facilitates the transfer of university-industry
interaction in advanced technologyE Global search for technology Search and acquisition of commerciable
technologies abroadF Program of assistance to investors Assistance to patenting, financing and marketing
2 Upgrading of R&D ActivitiesA R&D priority plan (export winners, basic Indication of preferred areas of R&D domestic
needs, and coconut industry)B Grant-in-aids program Support of R&D activitiesC Contract Research Program Sponsored research with other agenciesD R&D Incentive Programs Incentives for the conduct of R&D activities
3 Development of R&D InfrastructureA Manpower Development Program in Graduate and undergrad scholarship program
Science and Engineering in priority areasB Grade school and secondary school level Development of the grade school network serving
as feeder schools for HS and technical schoolsC Vocational and Technical Education Development of vocational and technical schools
in the industrializing areasD Scientific Career System (SCS) Career path for scientists that will develop their
technical expertiseE Utilization of Filipino exports Employment of Filipino expatriatesF Recognition of S&T efforts Conferment of the rank and title of National
ScientistsG Balik Scientists Program Taking advantage of trained Filipino scientists and
engineers thru information exchangeH Development of S&T culture Promotion of science consciousness and
innovativenessI Organizing and strengthening of S&T Strengthening of S&T sectoral network
and establishment of new S&T institutionsand mechanisms

13
discussion, its six flagship programs are worth mentioning here:comprehensive program to enhance technology enterprises; integratedprogram on clean technologies; establishment of a packaging R&D center;expansion of regional metrology centers; S&T intervention program forthe poor, vulnerable and disabled; and comprehensive S&T program forMindanao. Although the vision and direction of the plan is novel, there areno specific implementation rules and guidelines.
Historical Development in R&D and Technology

14 Research and Development and Technology in the Philippines
4Philippine Growth Performance
Philippine growth and structural changeThe last 35 years have seen a “roller-coaster” Philippine economic growthperformance. Growth was highest during the 1973-82 period, averaging 5.5percent per year (Table 4). This was the peak period of the Marcos regime,which was not sustained, however, as dissatisfaction among Filipinos withthe military regime mounted. This situation eventually led to a politicaluprising in the period 1983-85. The political crisis triggered an economiccrisis that resulted in an economic collapse. The economy contracted by–4.1 percent per year during this period.
The Marcos administration was finally forced out of power in the early1986, which gave way to Aquino government. Thus, in the following period,1986-90, the euphoria brought about economic recovery under the newgovernment. Growth was averaging 4.5 percent per annum during thisperiod. However, toward the end of the Aquino administration, a politicaltug-of-war led to a series of military coup attempts. Although the attemptsfailed, they created political uncertainties and instability. This, togetherwith the series of natural calamities and energy crisis, brought the economyto a halt in the 1991-93 period. The economy contracted again by –0.1percent per year during the period.
Table 4. The Philippine economy (in percent)
GDP Growth Employment Growth Export/GDP Import/GDP
1967-72 4.8 3.3 13.6 17.41973-82 5.5 3.1 16.0 22.81983-85 -4.1 3.2 15.4 20.41986-90 4.5 2.1 17.4 23.01991-93 -0.1 3.7 19.5 30.21994-97 4.9 3.3 24.5 39.31998-2000 3.5 -0.3 45.8 43.2
Sources: National Income Accounts, Philippine Statistical Yearbook, and Selected Philippine EconomicIndicators
15Philippine Growth Performance
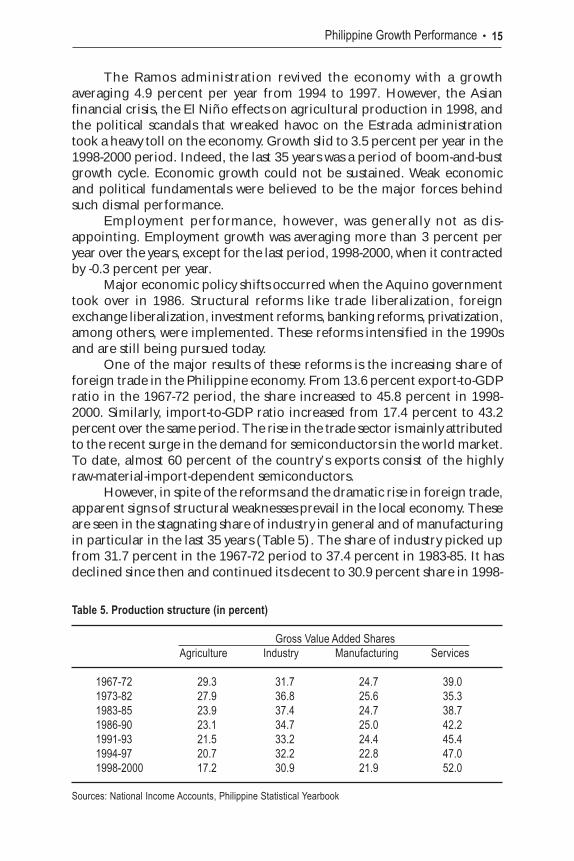
The Ramos administration revived the economy with a growthaveraging 4.9 percent per year from 1994 to 1997. However, the Asianfinancial crisis, the El Niño effects on agricultural production in 1998, andthe political scandals that wreaked havoc on the Estrada administrationtook a heavy toll on the economy. Growth slid to 3.5 percent per year in the1998-2000 period. Indeed, the last 35 years was a period of boom-and-bustgrowth cycle. Economic growth could not be sustained. Weak economicand political fundamentals were believed to be the major forces behindsuch dismal performance.
Employment performance, however, was generally not as dis-appointing. Employment growth was averaging more than 3 percent peryear over the years, except for the last period, 1998-2000, when it contractedby -0.3 percent per year.
Major economic policy shifts occurred when the Aquino governmenttook over in 1986. Structural reforms like trade liberalization, foreignexchange liberalization, investment reforms, banking reforms, privatization,among others, were implemented. These reforms intensified in the 1990sand are still being pursued today.
One of the major results of these reforms is the increasing share offoreign trade in the Philippine economy. From 13.6 percent export-to-GDPratio in the 1967-72 period, the share increased to 45.8 percent in 1998-2000. Similarly, import-to-GDP ratio increased from 17.4 percent to 43.2percent over the same period. The rise in the trade sector is mainly attributedto the recent surge in the demand for semiconductors in the world market.To date, almost 60 percent of the country’s exports consist of the highlyraw-material-import-dependent semiconductors.
However, in spite of the reforms and the dramatic rise in foreign trade,apparent signs of structural weaknesses prevail in the local economy. Theseare seen in the stagnating share of industry in general and of manufacturingin particular in the last 35 years (Table 5). The share of industry picked upfrom 31.7 percent in the 1967-72 period to 37.4 percent in 1983-85. It hasdeclined since then and continued its decent to 30.9 percent share in 1998-
Table 5. Production structure (in percent)
Gross Value Added SharesAgriculture Industry Manufacturing Services
1967-72 29.3 31.7 24.7 39.01973-82 27.9 36.8 25.6 35.31983-85 23.9 37.4 24.7 38.71986-90 23.1 34.7 25.0 42.21991-93 21.5 33.2 24.4 45.41994-97 20.7 32.2 22.8 47.01998-2000 17.2 30.9 21.9 52.0
Sources: National Income Accounts, Philippine Statistical Yearbook

16 Research and Development and Technology in the Philippines
2000. A similarly dismal record for the manufacturing sector is observedover the same period. The drop in the share of agriculture showed up inthe increasing share of the service sector.
The disappointing and stagnating share of industry and manufacturingsectors is also observed in the structure of employment. Employment sharein industry is about 15 percent and 10 percent in manufacturing. Theseshares have practically stagnated as compared to the rising employmentshare in the service sector.
The contrasting performance of the foreign trade sector and theindustrial sector in general and the manufacturing subsector in particularin terms of output and employment generation in the midst of policyreforms indicate the absence of “trickle-down” effects. Considering thatthese policy reforms have been pursued for quite some time, the lack ofconcrete trickle-down effects strongly implies a high degree of dualityexisting between the local and foreign sectors.
Total factor productivityProductivity indicators that are available in Philippine literature show poorperformance. In fact, estimates suggest negative TFP5 growth, indicatingthat it has not been a source of economic growth.
Cororaton and Cuenca (2001) have updated the TFP estimates ofCororaton and Caparas (1998) from 1980-1996 to 1980-1998, using growthaccounting method in translog form at the level and major sectors of theeconomy. Some insights were drawn from the estimates. At the sectorallevel, the results are mixed. Some sectors showed improving TFP in the1990s, while others have declining TFP, especially the nontradable servicesectors, like real estate. Because of this the economy as a whole saw a declinein TFP in 1990s. The decline may be due to capital movement toward thenontradable sectors during the period when foreign capital inflow surged,which in turn was aggravated by the prolonged real appreciation of thelocal currency.
De Silva (2001) has applied growth accounting method to estimateTFP. Her estimation period was much longer, from 1971 to 1998. Of hermajor findings, she says, “From 1990 to 1997, the average TFP growth isestimated at –0.8 percent, only a slight improvement from the average rateestimated for the 1980s.” On the whole, “The movements of total factorproductivity (TFP) indicate that it did not drive the growth of real outputduring the past 25 years.”
Austria (1998), using a macrodynamic model with output and inflationinteraction, showed that the TFP for an extended period of time, 1967 to1997, declined by -0.47 percent. Lim (1998), using a Cobb-Douglas
5Total factor productivity (TFP) growth takes into account labor and capital inputs together in productivitycomputation.

17
production function, showed negative TFP for industry and services, sectorsthat account for 75 percent of GDP.
However, Cororaton and Abdula (1997) showed slightly positive TFPfor the manufacturing sector. However, in the TFP study they conductedon specific industries within the manufacturing sector, Cororaton et al.(1996) observed that the number of manufacturing industries with negativeTFP increased from 1956 to 1992, while the above average TFP for theentire manufacturing sector was slightly above zero.
In a very recent TFP research, Cororaton (2002) attempted to extendthe estimation period from 1967 to 2000; decompose the contribution oflabor types; decompose the effects of sectoral movement of labor; andanalyze the factors determining TFP. The major findings of the paper areas follows:
TFP estimate and sources of growth. Annual TFP estimates from 1967to 2000 are presented in Table 6, while the three-year moving average ofthe business-fluctuation-adjusted TFP is shown in Figure 3. In most of theyears in the last 35 years, TFP fell below zero. Positive estimates are seen inthe second half of the 1980s and toward 2000.
Interesting results may be observed in the analysis of thedecomposition of output growth in Figure 4 in which TFP is considered asone of the contributing factors during the different critical subperiods overthe past 35 years. While it may be true that the contribution of TFP to theoverall economic growth has been negative, in terms of trend in an extendedperiod it has improved. For example, from –4.26 percentage points in GDPgrowth in the subperiod 1983-85, it improved through the years to reach acontribution of +0.93 in the last subperiod, 1998-2000. This may be due tothe effects of various economic policy reforms pursued in the last decade.
Through the years, capital is the largest contributor to growth.Decomposition of TFP growth. There have been sizeable changes in
the structure of labor quality over the years. The share of skilled workers,loosely defined as those who have at least finished high school, increasedfrom 19 percent in 1967-72 to 45 percent in 1998-2000 (Figure 5).
There are, however, noticeable labor movements across sectors.Agriculture, which used to employ 56 percent of labor in 1967-72, hasdeclining employment share. In 1998-2000, its employment share droppedto 38 percent. Labor moved to the service sector and not to the industrysector. The share of service sector employment increased from 29 percentin 1967-72 to 45 percent in 1998-2000. Employment share in industry hoversaround 16 percent.
What are the effects of these factor changes on TFP? Table 7 presentsthe results of decomposing the effects of labor quality on TFP. The resultsare presented per subperiod. The second column is the unadjusted TFP,which are period averages of the same estimates that appeared in Table 6.The third column presents the results for TFP growth adjusted for qualityof labor. The last two columns compare the estimates by taking the differenceand the ratio. A higher difference will imply a bigger contribution of labor
Philippine Growth Performance

18 Research and Development and Technology in the Philippines
quality to TFP growth. In terms of ratio, the further it deviates from 1 thebigger its TFP contribution becomes.
In spite of the increasing share of skilled labor to total employment,its contribution to TFP has declined. The drop is quite evident in Figure 6.From 2.11 percentage point contribution to TFP growth, it declined to0.16 in 1991-93. It started to recover, however, in the succeeding subperiods,but still way below its contribution in the earlier periods.
This decline may imply a number of things. First, it may be true thatskilled labor, as loosely defined in terms of level of schooling, may not have
Table 6. Estimated Philippine total factor productivity
Year Unadjusted Business Fluctuation Business Fluctuation 3-Year Moving AverageTFP Adjustment Factor Adjusted TFP Adjusted TFP
1967 -5.11 -3.8206 -1.2931968 1.13 1.1588 -0.032 0.2801969 6.79 4.6197 2.166 0.6701970 0.67 0.7964 -0.125 0.0331971 -4.71 -2.7647 -1.943 -0.9761972 -0.15 0.7088 -0.859 -0.8841973 5.53 5.3769 0.151 -0.2171974 -1.95 -2.0102 0.056 -0.0211975 -4.32 -4.0452 -0.272 0.5351976 7.07 5.2500 1.822 0.8591977 1.01 -0.0134 1.027 0.3311978 -7.45 -5.5928 -1.855 -0.1701979 0.98 0.6572 0.318 -0.4851980 3.72 3.6401 0.083 -0.1461981 -1.69 -0.8533 -0.840 -0.3731982 -0.76 -0.3997 -0.360 -0.7011983 -4.20 -3.3004 -0.902 -0.8751984 -8.77 -7.4009 -1.364 -5.9011985 -8.36 7.0756 -15.438 -6.0141986 1.78 3.0208 -1.239 -5.9381987 1.23 2.3696 -1.136 3.4101988 6.28 -6.3261 12.606 3.4441989 1.51 2.6487 -1.138 3.5171990 0.69 1.6101 -0.916 -1.1041991 -4.92 -3.6642 -1.258 -3.1031992 -3.50 3.6341 -7.134 -3.1601993 -1.22 -0.1330 -1.089 -1.1471994 0.56 -4.2166 4.781 0.8691995 1.35 2.4392 -1.086 0.8271996 1.60 2.8100 -1.214 -1.0851997 1.06 2.0206 -0.956 -1.0411998 -1.36 -0.4103 -0.954 -0.9541999 2.50 3.4493 -0.951 2.8182000 4.74 -5.6227 10.360

19Philippine Growth Performance
-80%
-60%
-40%
-20%
0%
20%
40%
60%
80%
100%
Bus Fluc 0.88 -0.05 -1.34 0.58 0.08 0.90 0.41
TFP -0.18 -0.04 -4.26 0.67 -2.47 -0.11 0.93
labor 1.06 1.93 1.46 0.94 1.28 1.31 0.08
capital 3.07 3.33 1.38 1.18 1.73 2.22 1.71
1967-72 1973-82 1983-85 1986-90 1991-93 1994-97 1998-2000
Figure 4. Decomposition of output growth
-8.000
-6.000
-4.000
-2.000
0.000
2.000
4.000
year/valueSeries1 0.280 0.670 0.033 -0.976 -0.884 -0.217 -0.021 0.535 0.859 0.331 -0.170 -0.485 -0.146 -0.373 -0.701-0.875 -5.901 -6.014 -5.938 3.410 3.444 3.517 -1.104 -3.103 -3.160 -1.147 0.869 0.827 -1.085 -1.041 -0.954 2.818
1968 1969 1970 1971 1972 1973 1974 1975 1976 1977 1978 1979 1980 1981 1982 1983 1984 1985 1986 1987 1988 1989 1990 1991 1992 1993 1994 1995 1996 1997 1998 1999
Figure 3. Three-year moving average business-fluctuation-adjusted TFP growth
0 %
1 0 %
2 0 %
3 0 %
4 0 %
5 0 %
6 0 %
7 0 %
8 0 %
9 0 %
1 0 0 %
s k il l e d 0 . 1 9 0 .2 8 0 .3 1 0 . 3 6 0 . 3 9 0 . 4 2 0 . 4 5u n s k il le d 0 . 8 1 0 .7 2 0 .6 9 0 . 6 4 0 . 6 1 0 . 5 8 0 . 5 5
1 9 6 7 - 7 2 1 9 7 3 - 8 2 1 9 8 3 - 8 5 1 9 8 6 - 9 0 1 9 9 1 - 9 3 1 9 9 4 - 9 7 1 9 9 8 - 2 0 0 0
Figure 5. Types of labor
perc
ent g
row
th

20 Research and Development and Technology in the Philippines
captured the actual skill development of labor. Second, the quality ofeducation that could have produced the necessary skills to improveproductivity may have declined through time. Some facts that may supportthis. Cororaton (1999), for instance, has observed that while the Philippinesis one of the countries that has produced one of the highest numbers ofcollege graduates in the region, it has produced one of the lowest numbersof graduates specializing in science and technology and engineering.6 Third,the marginal productivity of workers with higher education, as well as theefficiency of education itself, may have deteriorated. Fourth, the massivenumber of Filipinos working abroad may have created brain drain, resultingin loses in productivity in the local economy.
The results imply a number of things; the crucial ones are: (1) thatthe drive to improve education in the country should somehow be reflectedin productivity improvement, otherwise the whole exercise could becomefrustrating if trained Filipinos will end up seeking employment elsewhere;and (2) that the structure of incentives, particularly labor incentives, wouldhave to be examined quite closely. The structure of incentives could include
6Discussed further in the next section.
Table 7. Effects of labor quality on TFP
Period Unadjusted TFP Adjusted Difference: Ratio:TFP for Labor Quality (Unadjusted -Adjusted) (Unadjusted/Adjusted)
1967-72 (0.23) (2.34) 2.11 0.101973-82 0.21 (0.89) 1.10 (0.24)1983-85 (7.11) (7.57) 0.46 0.941986-90 2.30 1.66 0.64 1.391991-93 (3.21) (3.38) 0.16 0.951994-97 1.14 0.71 0.44 1.611998-2000 1.96 1.44 0.52 1.36
-
0.50
1.00
1.50
2.00
2.50
period/ value
Series1 2.11 1.10 0.46 0.64 0.16 0.44 0.52
1967-72 1973-82 1983-85 1986-90 1991-93 1994-97 1998-2000
Figure 6. Contribution of labor quality to TFP growth
perc
enta
ge p
oint
s

21
the structure of relative factor wages to address the problems related to thegraduates specializing in science and technology. The efficiency of theeducational system, including the curricula, books and manuals, trainingof teachers and professors, has to be examined closely.
The effects of movement of labor across sectors on TFP have improvedthrough the years, indicating efficiency effects, however small, from labormovement out of agriculture (Table 8). Except for the subperiod 1991-93,the effect on TFP has increased through time, as shown in Figure 7. Onewonders whether labor movement to industry, or to the manufacturingsector in particular, instead of the service sector could have contributed tohigher TFP growth or not.
Determining factors of TFP. A number of regression experiments wereconducted on the computed TFP and the various determining factors listedearlier. Of the experiments, only two regression specifications resulted inbetter test results (Table 9). Trade indicators, exports and imports lumpedtogether, are positive determinants of TFP growth. This is because the
Philippine Growth Performance
Table 8. Effects of sectoral labor movement on TFP
Period Unadjusted TFP Adjusted Difference: Ratio:TFP for Sectoral (Unadjusted - (Unadjusted/
Labor Movement Adjusted) Adjusted)
1967-72 (0.23) (0.48) 0.25 0.481973-82 0.21 0.16 0.05 1.311983-85 (7.11) (7.51) 0.40 0.951986-90 2.30 1.85 0.45 1.251991-93 (3.21) (3.04) (0.18) 1.061994-97 1.14 0.57 0.58 2.021998-2000 1.96 1.40 0.55 1.40
(0.30)
(0.20)
(0.10)
-
0.10
0.20
0.30
0.40
0.50
0.60
0.70
period/value
perc
enta
ge p
oint
s
Series1 0.25 0.05 0.40 0.45 (0.18) 0.58 0.55
1967-72 1973-82 1983-85 1986-90 1991-93 1994-97 1998-2000
Figure 7. Contribution of sectoral labor movement to TFP growth

22 Research and Development and Technology in the Philippines
country’s exports are highly import-dependent. The coefficient of thecombined trade indicator is statistically significant. The positive effect ofexports on TFP implies that exports can bring about economies of scalewith larger export market. It can also expose local producers to internationalbest practices in production. Furthermore, foreign competition in theexport market can translate into improved efficiency in the productionoperations of local producers. On the other hand, the positive effect ofimports on TFP indicates transfer of modern technology into the localeconomy, since imports is one major vehicle for moving in appropriate
Table 9. Determinants of total factor productivity (Dependent variable: 3-year movingaverage of TFP)
Regression No. 1 Regression No. 2OLS OLS
1975-1999 1976-1999Coefficient Standard t-Statistic Coefficient Standard t-Statistic
Error Error
Variables:Constant -89.4 17.1 -5.2 -86.3 16.6 -5.2
Exports 26.2 6.9 3.8Imports(-1) 8.7 8.1 1.1Exports+imports 18.7 4.9 3.8Foreign direct investment (-1) 304.8 54.3 5.6 325.0 53.8 6.0Research and development (2) 1943.2 766.4 2.5 2193.8 754.5 2.9Price changes -6.7 3.1 -2.2 -7.8 3.0 -2.6Share of manufacturing 300.0 61.0 4.9 289.9 58.9 4.9D83 9.0 2.2 4.1 8.9 2.1 4.3D87 7.1 1.4 5.0 6.8 1.4 5.0D91 -4.7 1.4 -3.3 -4.5 1.4 -3.2
R-squared 0.849 0.870Adjusted R-squared 0.769 0.787DW 2.122 2.226F-Statistics 10.576 10.447
Definition of variablesExports : exports/GDPImports(-1) : one year lag of imports/GDPExports+imports : (exports+imports)/GDPForeign direct investment (-1) : one year lag of foreign direct investment/GDPShare of manufacturing : manufacturing GVA/GDPResearch and Development(-2) : two year lag of Research and Development Expenditure/GDPPrice changes : annual change in GDP deflatorD83, D87, D91 : dummy variables

23
foreign technology. Therefore, a higher volume of imports necessarilydecreases the technological gap between local and foreign technology interms of modern equipment, production processes and management.
That foreign direct investments (FDI) have lagged one year is notonly positively affecting TFP growth but also highly statistically significant.FDI is another major vehicle for transferring foreign technology.
Price changes, an indicator of economic stability and fundamentals,is negatively related to TFP growth. This means high and unstable pricescreate a lot of economic uncertainties that discourage investors frominvesting in productivity-improving projects.
The share of gross value-added of manufacturing to total grossdomestic product was included to capture externalities and spillover effectsof production technology to the rest of the economy. The share ofagriculture and service sectors turned out to be statistically insignificant.The positive and highly statistically significant coefficient of the share ofmanufacturing indicates that this sector has far greater spillover effects onthe rest of the economy than other sectors. Its development therefore is animportant factor affecting TFP growth.
Expenditure on research and development lagged two years is positiveand statistically significant, indicating that it is also another important factordetermining TFP growth.
In sum, the major conclusions of the paper are:Although the last 35 years saw mostly negative TFP growth in the
Philippines, the underlying trend is encouraging: the contribution of TFPgrowth to the overall economic growth consistently improved from –4.26percentage points in the middle of 1980s to +0.93 in 1998-2000. During thisperiod major economic policy reforms were pursued.
In spite of the increasing share of skilled labor to the total, looselydefined as those who have at least finished high school, its contribution toTFP growth is observed to have declined through time. This could imply anumber of things, including: (a) the deterioration in the quality of educationnecessary for productivity improvement, (b) the deterioration in themarginal productivity of workers with higher education and in the efficiencyof education itself, and (c) brain drain due to the surge in the number ofFilipinos working abroad. These are critical issues in the Philippines thatneed to be examined quite closely.
Efficiency improvements seem to have been gained from themovement of labor out of agriculture.
Sound macroeconomic fundamentals, price stability, and openingup of the economy to foreign trade and investments are critical factorsaffecting TFP growth. Spillover effects on TFP from manufacturing seemto be far significant than from service and agriculture sectors. Expenditureon research and development is also another important factor affectingTFP.
Philippine Growth Performance

24 Research and Development and Technology in the Philippines
5Gaps in Philippine R&D and Technology
The poor productivity performance in the Philippines can largely be dueto R&D gaps. There are national as well as sectoral gaps in terms ofexpenditure, budget, manpower, and inefficiency in institutionalarrangement.
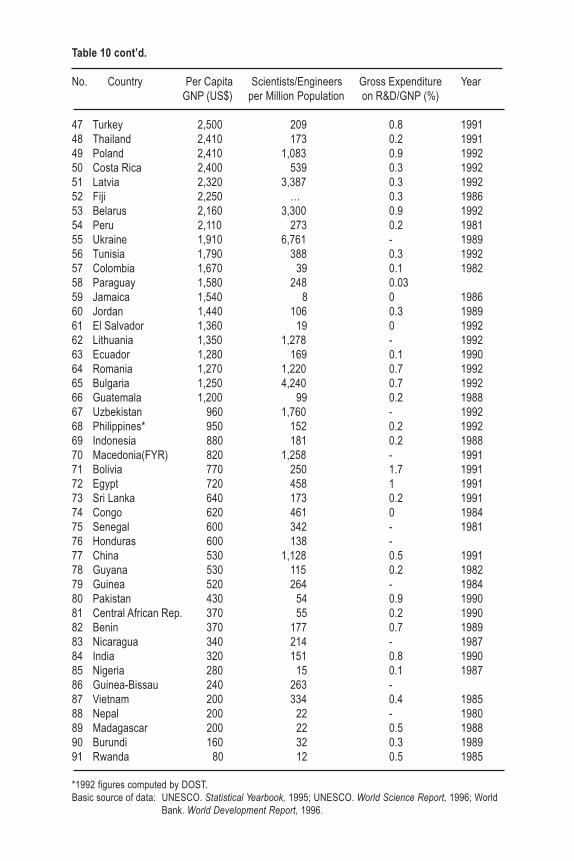
Local vs. internationalCororaton (1999) surveyed a UNESCO-based data on R&D indicators for91 countries and found that the Philippines ranks very low in terms of R&Deffort. Table 10 shows that out of 91 countries the Philippines placed 73rd
place in terms of the number of scientists and engineers per millionpopulation. It has only 152 scientists and engineers per million population.This number is far below the maximum of 6,736 scientists and engineersper million population. In terms of R&D expenditure to GNP ratio, thePhilippines is at the 60th place with a ratio of 0.2 percent in 1992. This is farbelow the maximum of three percent.
Gaps at the national levelBased on an econometric study, Cororaton (1999) provides some estimatesof the magnitude of the gaps in R&D at the national level. R&D gaps aredefined as those factors that have prevented the economy from operatingat its full potential in terms of productivity. These factors could be either inthe form of (a) low R&D investments and inadequate R&D manpower; (b)institutional weaknesses as a result of poor system, management andleadership; (c) policy lapses and failures; or d) all three combined. But inthe estimation only the first two have been considered because of limiteddata.
The results indicate that the resulting R&D expenditure gap is 0.5778.This means that R&D expenditure-GNP ratio would have to increase by0.5778 for the Philippine TFP to reach the TFP frontier. The average R&Dexpenditure–GNP ratio during the 1980s was 0.1667 percent. Thus the totalR&D expenditure-GNP ratio needed to reach the frontier is 0.1667 + 0.5778= 0.7445. This is a sizeable increase from the current level but lower than whathas been proposed for S&T in House Bill no. 2214 at one percent of GNP.

25Gaps in Philippine R&D and TechnologyTable 10. PCGNP, SE/MP, and GERD/GNP (in 91 countries of the world)
No. Country Per Capita Scientists/Engineers Gross Expenditure YearGNP (US$) per Million Population on R&D/GNP (%)
1 Switzerland 37,930 2,409 1.8 19892 Japan 34,630 5,677 3 19923 Denmark 27,970 2,341 1.8 19914 Norway 26,390 3,159 1.9 19915 United States 25,880 3,873 2.9 19896 Germany (Federal) 25,580 2,882 2.8 19897 Iceland 24,630 3,067 1.1 19918 Austria 24,630 1,146 1.4 19899 Sweden 23,530 3,081 2.9 1991
10 France 23,420 2,267 2.4 199111 Belgium 22,870 1,856 1.7 199012 Singapore 22,500 1,284 0.9 198413 Netherlands 22,010 2,656 1.9 199114 Canada 19,510 2,322 1.6 199115 Kuwait 19,420 924 0.9 198416 Italy 19,300 1,366 1.3 199017 Finland 18,850 2,282 2.1 199118 United Kingdom 18,350 2,334 2.1 199119 Australia 18,000 2,477 1.4 199020 Israel 14,530 4,836 2.1 198421 Brunei Darusalam 14,240 91 0.1 198422 Ireland 13,530 1,801 0.9 198823 Spain 13,440 956 0.9 199024 New Zealand 13,350 1,555 0.9 199025 Qatar 12,820 593 0 198626 Cyprus 10,260 205 0.2 199227 Portugal 9,320 599 0.6 199028 Korea, Republic 8,260 1,990 2.1 199229 Argentina 8,110 350 0.3 198830 Greece 7,700 53 0.3 198631 Slovenia 7,040 2,998 1.5 199232 Seychelles 6,680 281 1.3 198333 Uruguay 4,660 686 -34 Mexico 4,180 226 0.2 198435 Gabon 3,880 189 0 198736 Hungary 3,840 1,200 1.1 199237 Trinidad and Tobago 3,740 240 0.8 198438 Chile 3,520 364 0.7 198839 Malaysia 3,480 326 0.1 199240 Czechoslovakia 3,200 3,247 1.8
a. Former 4,190 3.3 1989b. Czech Republic 3,248 1.8 1992
41 Mauritius 3,150 361 0.4 199242 South Africa 3,040 319 1 199143 Brazil 2,970 391 0.4 198544 Venezuela 2,760 208 0.5 199245 Russian Federation 2,650 5,930 1.8 199146 Croatia 2,560 1,977 - 1992
26 Research and Development and Technology in the PhilippinesTable 10 cont’d.
No. Country Per Capita Scientists/Engineers Gross Expenditure YearGNP (US$) per Million Population on R&D/GNP (%)
47 Turkey 2,500 209 0.8 199148 Thailand 2,410 173 0.2 199149 Poland 2,410 1,083 0.9 199250 Costa Rica 2,400 539 0.3 199251 Latvia 2,320 3,387 0.3 199252 Fiji 2,250 … 0.3 198653 Belarus 2,160 3,300 0.9 199254 Peru 2,110 273 0.2 198155 Ukraine 1,910 6,761 - 198956 Tunisia 1,790 388 0.3 199257 Colombia 1,670 39 0.1 198258 Paraguay 1,580 248 0.0359 Jamaica 1,540 8 0 198660 Jordan 1,440 106 0.3 198961 El Salvador 1,360 19 0 199262 Lithuania 1,350 1,278 - 199263 Ecuador 1,280 169 0.1 199064 Romania 1,270 1,220 0.7 199265 Bulgaria 1,250 4,240 0.7 199266 Guatemala 1,200 99 0.2 198867 Uzbekistan 960 1,760 - 199268 Philippines* 950 152 0.2 199269 Indonesia 880 181 0.2 198870 Macedonia(FYR) 820 1,258 - 199171 Bolivia 770 250 1.7 199172 Egypt 720 458 1 199173 Sri Lanka 640 173 0.2 199174 Congo 620 461 0 198475 Senegal 600 342 - 198176 Honduras 600 138 -77 China 530 1,128 0.5 199178 Guyana 530 115 0.2 198279 Guinea 520 264 - 198480 Pakistan 430 54 0.9 199081 Central African Rep. 370 55 0.2 199082 Benin 370 177 0.7 198983 Nicaragua 340 214 - 198784 India 320 151 0.8 199085 Nigeria 280 15 0.1 198786 Guinea-Bissau 240 263 -87 Vietnam 200 334 0.4 198588 Nepal 200 22 - 198089 Madagascar 200 22 0.5 198890 Burundi 160 32 0.3 198991 Rwanda 80 12 0.5 1985
*1992 figures computed by DOST.Basic source of data: UNESCO. Statistical Yearbook, 1995; UNESCO. World Science Report, 1996; World
Bank. World Development Report, 1996.
27
Applying this ratio to the 1997 GNP of P2,527 billion will result in atotal R&D expenditure of roughly P18.8 billion. This R&D investment gapis substantial considering that the present level of R&D spending isapproximately P3 billion. While this is a significant gap, for all intents andpurposes, this could not be feasibly financed by the national governmentbecause it will result in significant budgetary impact. The government hasother equally important and pressing needs, especially in the area of basicinfrastructure like market roads, bridges and port; and in the social sectorlike education and health. Furthermore, it may be totally ineffective andinefficient to reallocate existing limited government resources in favor ofR&D activities because of the institutional inefficiencies in the R&D system,as well as in the S&T structure. David et al. (1999), for example, argue thatwhile agricultural research continues to be underfunded, efficiency of publicsector research funding has been significantly lowered by the misallocationof limited budgetary resources, as well as by institutional weaknesses of theagricultural research system. Thus, unless these institutional weaknessesare addressed, additional government funding for R&D will only go to waste.
In other progressive countries, the bulk of R&D investment comesfrom the private sector. The challenge therefore is how to encourage theprivate sector to participate in R&D activities. It is also important to identifythe necessary infrastructure, incentive system and investment safeguardsthat will enable the said sector to do its own R&D.
In terms of manpower, it was observed that the manpower gap isaround 197 scientists and engineers per million population. The averageratio for the decade of the 1980s was only 108. For the Philippine TFP tobridge the gap it needs R&D manpower of 108 + 197 = 305 per millionpopulation.
Sectoral gaps and problemsTechnology-related issues and problems are generally similar across sectors.They largely focus on four major problems: (a) underinvestment in R&D;(b) lack of adequate and technically capable R&D manpower; (c)institutional weaknesses; and (d) policy failures. Below is a brief discussionon the following sectors: agriculture, fishery, manufacturing, education,and health.
Agriculture7
Underfunded research in agricultureThe agricultural sector has been performing poorly since the 1980s. Davidet al. (1999) attribute this poor performance to a number of factors, oneof which is the inadequate public support service, particularly in agriculturalresearch and development. The agricultural research system has beenseverely underfunded, with public expenditures in the early 1980srepresenting only 0.3 percent of agriculture gross value-added, in contrast
Gaps in Philippine R&D and Technology
7Largely based on the paper of David et al. 1999.

28 Research and Development and Technology in the Philippines
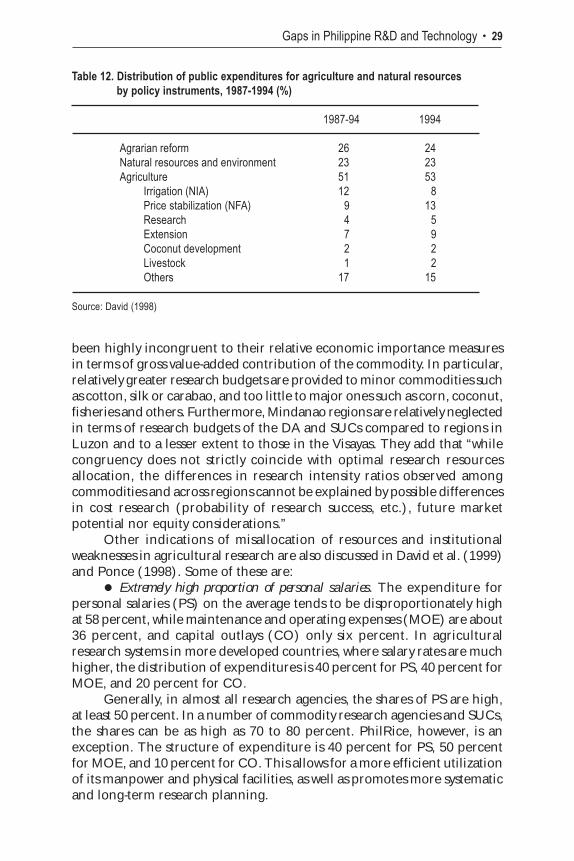
to an average of one percent among developing countries and two to threepercent among developed countries (Table 11). In fact, only five percentof the total public expenditure for agriculture has been allocated foragriculture research; whereas the ratio of budgetary outlay for pricestabilization programs alone was in the range of 10 percent over the pastdecade (Table 12).
Apart from the problem of inadequate funding for research, thereare other equally, if note more, important gaps in agricultural research.David et al. (1999) identify them as: (a) inefficiencies caused by themisallocation of research resources within the sector (e.g., across researchprogram areas and ecological regions); and (b) weaknesses in theinstitutional framework of the research system, including the organizationalstructure, lack of accountability, fragmentation of research, incentiveproblems, instability in leadership, and weak linkage between research andextension.
Misallocation of research resourcesUsing the congruence rule, which defines the optimal research resourceallocation across commodity program areas as proportional to the respectivecommodity value-added or value of production shares (in other words, givena total budget for agricultural research, the research intensity ratio, i.e.,research expenditure as a ratio of the value-added should be equal acrosscommodity research program areas), David et al. (1999) find that theallocation of research expenditures across commodities and regions has
Table 11. Agricultural research intensity ratios of selected countries
Country RIR Reference(%) Year
Philippines 0.33 1992Thailand 1.40 1992Indonesia 0.27 1990Malaysia 1.06 1992China 0.43 1993Taiwan 4.65 1992Australia 3.54 1992India 0.52 1990Pakistan 0.47 1992Bangladesh 0.25 1992Sri Lanka 0.36 1993South Korea 0.56 1993Japan 3.36 1992Developing countries 1.00Developed countries 2-3
Source: David (1998)
29
been highly incongruent to their relative economic importance measuresin terms of gross value-added contribution of the commodity. In particular,relatively greater research budgets are provided to minor commodities suchas cotton, silk or carabao, and too little to major ones such as corn, coconut,fisheries and others. Furthermore, Mindanao regions are relatively neglectedin terms of research budgets of the DA and SUCs compared to regions inLuzon and to a lesser extent to those in the Visayas. They add that “whilecongruency does not strictly coincide with optimal research resourcesallocation, the differences in research intensity ratios observed amongcommodities and across regions cannot be explained by possible differencesin cost research (probability of research success, etc.), future marketpotential nor equity considerations.”
Other indications of misallocation of resources and institutionalweaknesses in agricultural research are also discussed in David et al. (1999)and Ponce (1998). Some of these are:
Extremely high proportion of personal salaries. The expenditure forpersonal salaries (PS) on the average tends to be disproportionately highat 58 percent, while maintenance and operating expenses (MOE) are about36 percent, and capital outlays (CO) only six percent. In agriculturalresearch systems in more developed countries, where salary rates are muchhigher, the distribution of expenditures is 40 percent for PS, 40 percent forMOE, and 20 percent for CO.
Generally, in almost all research agencies, the shares of PS are high,at least 50 percent. In a number of commodity research agencies and SUCs,the shares can be as high as 70 to 80 percent. PhilRice, however, is anexception. The structure of expenditure is 40 percent for PS, 50 percentfor MOE, and 10 percent for CO. This allows for a more efficient utilizationof its manpower and physical facilities, as well as promotes more systematicand long-term research planning.
Gaps in Philippine R&D and Technology
Table 12. Distribution of public expenditures for agriculture and natural resourcesby policy instruments, 1987-1994 (%)
1987-94 1994
Agrarian reform 26 24Natural resources and environment 23 23Agriculture 51 53
Irrigation (NIA) 12 8Price stabilization (NFA) 9 13Research 4 5Extension 7 9Coconut development 2 2Livestock 1 2Others 17 15
Source: David (1998)

30 Research and Development and Technology in the Philippines
UPLB, which undertakes the bulk of research in agriculture, has alsothe same expenditure structure with PS share as high as 70 percent.Moreover, research projects under the different institutes, centers, andresearch units of the university are primarily driven by priorities of externaldonors, which contribute about half of the research funding. As such, theeffectiveness of research is constrained by uncertain and short-term natureof funding, even though the university may have the most competentscientists in the country in different fields of agriculture.
The expenditure pattern in the different research agencies inagriculture in the Philippines shows that the extremely high share of PSmay reflect overstaffing, bureaucratic rigidities, and poor planning.
Unfocused projects. An analysis of the work and financial plans andprojects completed indicate that research projects are highly fragmentedand short-term in nature. Research findings and outputs are neither carriedover to future researches nor used for extension to benefit the clientele.This is because there is no adequate system or clear mechanism wherebyresearch findings are fully transferred to the targeted end-users. Also, thereare no systems where researches are continued on a long-term andcontinuous basis. Thus, the analysis of the profile of the researches indicatesthat, generally, research projects do not reflect a sense of problemorientation.
Lack of a clear network among SUCs. Ponce (1998) argues that SUCsare basically independent from each other despite their hierarchicaldesignations as national multi-commodity research centers, regionalresearch stations, and cooperating stations. The national multi-commodityresearch center’s (UPLB, CLSU, VISCA and USM) linkage to the regionaland cooperating stations are ad hoc in character and project-related. Thereexists no institutionalized linkage resulting from clearly definedcomplementary functions.
Lack of a clear network between DA and attached agencies. Ponce (1998)also argues that the DA research system consists of national experimentstations operated by (a) various bureaus such as BPI, BAI, BFAR and BSWM;(b) attached agencies such as PhilRice, PCC, PCA, SRA and FIDA; (c)Regional Integrated Centers under the regional offices of the DA; and (d)Regional Outreach Stations. Similar to the network among the SUCs, thereexists no clear functional delineation between the national stations andthe regional experiment stations and between the region and the provisionalstations. Each station, even within the DA proper, exists independently ofothers in terms of programs. Thus, national centers do not exactlyorchestrate the national research and development programs of theirassigned commodities.
Lack of clear link with the private sector. Ponce (1998) cites the weaklink between the private sector and the larger community of researchstations. Most private research centers exist principally to meet the needsof the companies that established them. As such, they do not interact withthe rest of the research community dominated essentially by the government

31
sector, except for a few privately operated research centers that performpublic services such as the Twin Rivers Research Center. There is also amechanism whereby this link could be fostered and developed.
Other institutional gaps. Ponce (1998) cites other institutionalweaknesses, namely, (a) the lack of a well defined and institutionalizedmechanism for collaboration among R&D subsystems; and (b) an inefficientfunding system and lack of accountability. The present funding system isstill very much like the old project approach, where the research outputsare essentially in the forms of research reports. This weakens the system ofprogram approach and leads to a distortion of national priorities.Furthermore, the present funding approach gives rise to a much-diffusedstructure of research implementation that makes it difficult to pinpointresponsibility.
Manpower gaps. In terms of R&D manpower profile in agriculture,the authors find that the problem has nothing to do with number but liesin the relatively low level of scientific qualification of the agriculture researchsystem. This is particularly true in both the DA and DENR research agencies.The very low ratios of technical manpower resources with advanced degreesat the DA and DENR compare quite unfavorably with similar institutions insome Asian countries like Malaysia, Indonesia and Bangladesh.
On the other hand, the qualities of research manpower in Sacs arenot uniformly nor always significantly better. Although the share ofmanpower may be higher in SUCs than in agencies, there is a big andworsening problem of inbreeding. Furthermore, local scientists who weretrained and educated abroad are generally not attuned to recentdevelopments or frontier international knowledge. Also, there is a big gapin the quality of faculties and researchers in UPLB and other SUCs.
Fisheries sector8
One of the sectors included in the R&D study is the fisheries sector. Thissector is important not only because it has direct impact on national healthand nutrition (that is, fish is the source of about 75 percent of the totalanimal protein requirement of the country, in fact more than poultry andlivestock combined) but also because its structure, particularly supply, isdirectly affected by the state of the environment. To a certain extent, thefisheries sector can be one output indicator of what has been happening inthe environment.
Israel (1999) points out that the weak performance of the fisheriessector has been the result of several interrelated problems, the top three ofwhich are (a) resource depletion in coastal waters due to overfishing anddestructive fishing, as manifested by the deterioration of important fishstocks and species and the degradation of ecosystems; (b) large-scaleenvironmental damage, as evidenced by the destruction of coral reefs and
Gaps in Philippine R&D and Technology
8Based on the paper of Israel (1999).

32 Research and Development and Technology in the Philippines
mangroves in marine areas and pollution of major river lakes; and (c)proliferation of industrial, agricultural, commercial, and domestic activities,which discharge pollutants into marine waters, contributing to thedeterioration of ecosystems and rendering marine food potentially harmfulfor consumption.
R&D is important to the development of the fisheries sector,particularly to its long-term survival. Primarily, R&D is crucial to generatingnew information and technologies that can increase output above thecurrent low and dwindling levels.
The responsibility of managing and coordinating fisheries R&D inthe Philippines has been the task of the Philippine Council for Aquatic andMarine Research and Development (PCAMRD). The Council, which isunder the DOST, is tasked to plan, monitor, as well as evaluate fisheriesR&D. Israel (1999) discusses the R&D structure of the fisheries sector.
Furthermore, PCAMRD interacts with two government agencies whoseR&D scope covers the fisheries sector. These agencies are the Bureau ofAgricultural Research (BAR) of the Department of Agriculture (DA) andthe Ecosystem Research and Development Bureau (ERDB) of theDepartment of Environment and Natural Resources (DENR). Theseagencies are mandated to coordinate all researches of the regional officesand line agencies within their respective departments. The BAR coversfisheries research because fisheries are administratively classified under theagricultural sector. The ERDB does so since aquatic resources form part ofthe natural resource base and therefore falls under DENR.
Institutional gaps and issuesIsrael (1999) finds one of the biggest gaps resulting from the presentinstitutional arrangement is the weak coordination and poor collaborationamong government agencies. PCAMRD is the agency tasked to manageand coordinate overall fisheries R&D while the BAR and the ERDBcoordinate fisheries research of the regional offices and line agencies oftheir respective departments. Because of the similarity in functions andconstituency, potential overlapping existed among the three agencies. Toaddress this problem, they have delineated their functions through existingMemoranda of Agreements (MOAs). Implementation of these agreements,however, has been hampered by poor collaboration. In particular, inviolation of the MOAs, the agencies do not actually jointly review all researchproposals submitted for funding. Furthermore, collaboration is weak ordoes not exist in several activities, and strong only in one aspect.
Another crucial institutional problem deals with a possible duplicationof functions between PCAMRD and the Bureau of Fisheries and AquaticResources (BFAR), arising from the existing Fisheries Code. The Code hasreconstituted the BFAR from a staff to a line bureau under the DA andassigned it the function of formulating and implementing a ComprehensiveFishery Research and Development Program. To effect this program, thelaw created a new agency within BFAR, the National Fisheries Research
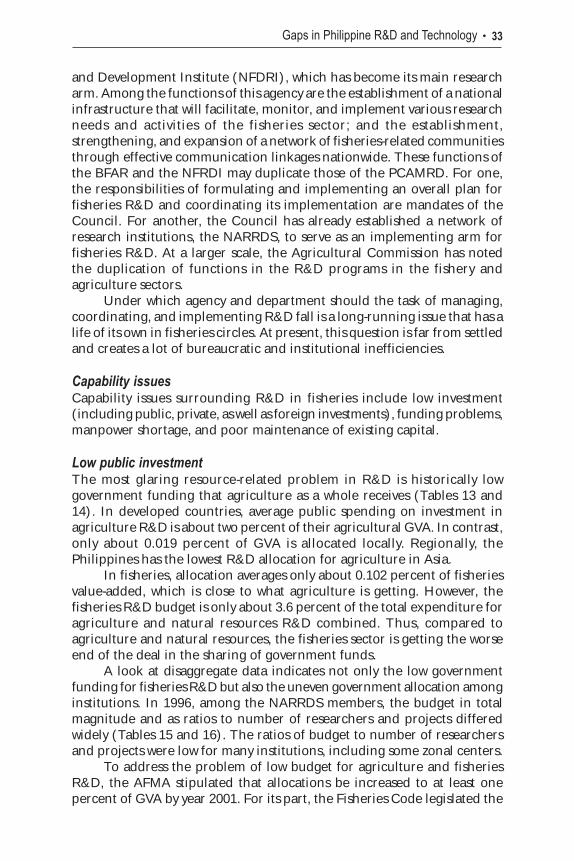
33
and Development Institute (NFDRI), which has become its main researcharm. Among the functions of this agency are the establishment of a nationalinfrastructure that will facilitate, monitor, and implement various researchneeds and activities of the fisheries sector; and the establishment,strengthening, and expansion of a network of fisheries-related communitiesthrough effective communication linkages nationwide. These functions ofthe BFAR and the NFRDI may duplicate those of the PCAMRD. For one,the responsibilities of formulating and implementing an overall plan forfisheries R&D and coordinating its implementation are mandates of theCouncil. For another, the Council has already established a network ofresearch institutions, the NARRDS, to serve as an implementing arm forfisheries R&D. At a larger scale, the Agricultural Commission has notedthe duplication of functions in the R&D programs in the fishery andagriculture sectors.
Under which agency and department should the task of managing,coordinating, and implementing R&D fall is a long-running issue that has alife of its own in fisheries circles. At present, this question is far from settledand creates a lot of bureaucratic and institutional inefficiencies.
Capability issuesCapability issues surrounding R&D in fisheries include low investment(including public, private, as well as foreign investments), funding problems,manpower shortage, and poor maintenance of existing capital.
Low public investmentThe most glaring resource-related problem in R&D is historically lowgovernment funding that agriculture as a whole receives (Tables 13 and14). In developed countries, average public spending on investment inagriculture R&D is about two percent of their agricultural GVA. In contrast,only about 0.019 percent of GVA is allocated locally. Regionally, thePhilippines has the lowest R&D allocation for agriculture in Asia.
In fisheries, allocation averages only about 0.102 percent of fisheriesvalue-added, which is close to what agriculture is getting. However, thefisheries R&D budget is only about 3.6 percent of the total expenditure foragriculture and natural resources R&D combined. Thus, compared toagriculture and natural resources, the fisheries sector is getting the worseend of the deal in the sharing of government funds.
A look at disaggregate data indicates not only the low governmentfunding for fisheries R&D but also the uneven government allocation amonginstitutions. In 1996, among the NARRDS members, the budget in totalmagnitude and as ratios to number of researchers and projects differedwidely (Tables 15 and 16). The ratios of budget to number of researchersand projects were low for many institutions, including some zonal centers.
To address the problem of low budget for agriculture and fisheriesR&D, the AFMA stipulated that allocations be increased to at least onepercent of GVA by year 2001. For its part, the Fisheries Code legislated the
Gaps in Philippine R&D and Technology
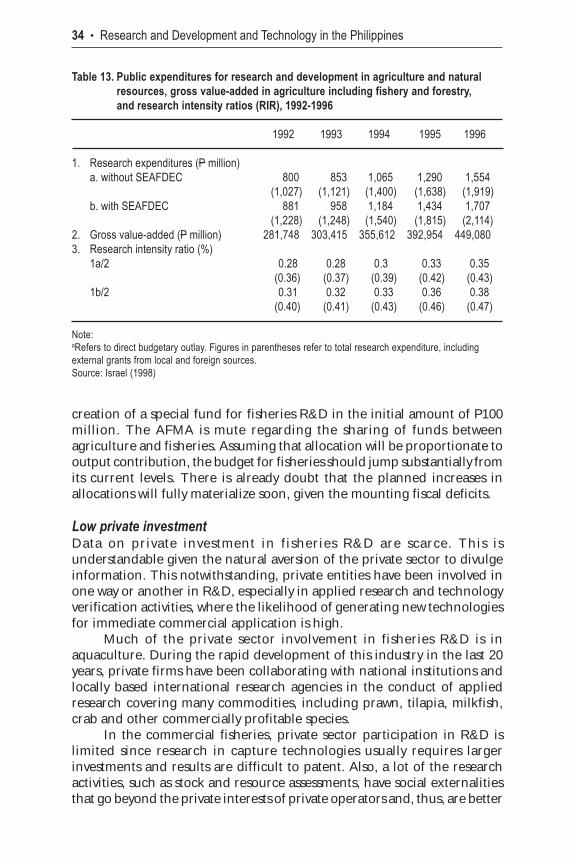
34 Research and Development and Technology in the Philippines
creation of a special fund for fisheries R&D in the initial amount of P100million. The AFMA is mute regarding the sharing of funds betweenagriculture and fisheries. Assuming that allocation will be proportionate tooutput contribution, the budget for fisheries should jump substantially fromits current levels. There is already doubt that the planned increases inallocations will fully materialize soon, given the mounting fiscal deficits.
Low private investmentData on private investment in fisheries R&D are scarce. This isunderstandable given the natural aversion of the private sector to divulgeinformation. This notwithstanding, private entities have been involved inone way or another in R&D, especially in applied research and technologyverification activities, where the likelihood of generating new technologiesfor immediate commercial application is high.
Much of the private sector involvement in fisheries R&D is inaquaculture. During the rapid development of this industry in the last 20years, private firms have been collaborating with national institutions andlocally based international research agencies in the conduct of appliedresearch covering many commodities, including prawn, tilapia, milkfish,crab and other commercially profitable species.
In the commercial fisheries, private sector participation in R&D islimited since research in capture technologies usually requires largerinvestments and results are difficult to patent. Also, a lot of the researchactivities, such as stock and resource assessments, have social externalitiesthat go beyond the private interests of private operators and, thus, are better
Table 13. Public expenditures for research and development in agriculture and naturalresources, gross value-added in agriculture including fishery and forestry,and research intensity ratios (RIR), 1992-1996
1992 1993 1994 1995 1996
1. Research expenditures (P million)a. without SEAFDEC 800 853 1,065 1,290 1,554
(1,027) (1,121) (1,400) (1,638) (1,919)b. with SEAFDEC 881 958 1,184 1,434 1,707
(1,228) (1,248) (1,540) (1,815) (2,114)2. Gross value-added (P million) 281,748 303,415 355,612 392,954 449,0803. Research intensity ratio (%)
1a/2 0.28 0.28 0.3 0.33 0.35(0.36) (0.37) (0.39) (0.42) (0.43)
1b/2 0.31 0.32 0.33 0.36 0.38(0.40) (0.41) (0.43) (0.46) (0.47)
Note:aRefers to direct budgetary outlay. Figures in parentheses refer to total research expenditure, includingexternal grants from local and foreign sources.Source: Israel (1998)
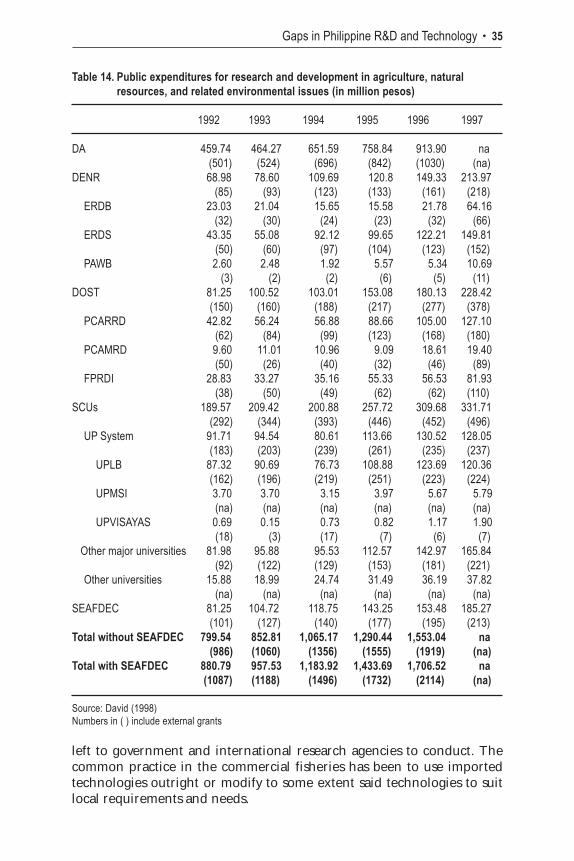
35Gaps in Philippine R&D and Technology
left to government and international research agencies to conduct. Thecommon practice in the commercial fisheries has been to use importedtechnologies outright or modify to some extent said technologies to suitlocal requirements and needs.
Table 14. Public expenditures for research and development in agriculture, naturalresources, and related environmental issues (in million pesos)
1992 1993 1994 1995 1996 1997
DA 459.74 464.27 651.59 758.84 913.90 na (501) (524) (696) (842) (1030) (na)
DENR 68.98 78.60 109.69 120.8 149.33 213.97 (85) (93) (123) (133) (161) (218)
ERDB 23.03 21.04 15.65 15.58 21.78 64.16 (32) (30) (24) (23) (32) (66)
ERDS 43.35 55.08 92.12 99.65 122.21 149.81 (50) (60) (97) (104) (123) (152)
PAWB 2.60 2.48 1.92 5.57 5.34 10.69 (3) (2) (2) (6) (5) (11)
DOST 81.25 100.52 103.01 153.08 180.13 228.42(150) (160) (188) (217) (277) (378)
PCARRD 42.82 56.24 56.88 88.66 105.00 127.10 (62) (84) (99) (123) (168) (180)
PCAMRD 9.60 11.01 10.96 9.09 18.61 19.40 (50) (26) (40) (32) (46) (89)
FPRDI 28.83 33.27 35.16 55.33 56.53 81.93 (38) (50) (49) (62) (62) (110)
SCUs 189.57 209.42 200.88 257.72 309.68 331.71(292) (344) (393) (446) (452) (496)
UP System 91.71 94.54 80.61 113.66 130.52 128.05(183) (203) (239) (261) (235) (237)
UPLB 87.32 90.69 76.73 108.88 123.69 120.36(162) (196) (219) (251) (223) (224)
UPMSI 3.70 3.70 3.15 3.97 5.67 5.79 (na) (na) (na) (na) (na) (na)
UPVISAYAS 0.69 0.15 0.73 0.82 1.17 1.90 (18) (3) (17) (7) (6) (7)
Other major universities 81.98 95.88 95.53 112.57 142.97 165.84 (92) (122) (129) (153) (181) (221)
Other universities 15.88 18.99 24.74 31.49 36.19 37.82 (na) (na) (na) (na) (na) (na)
SEAFDEC 81.25 104.72 118.75 143.25 153.48 185.27(101) (127) (140) (177) (195) (213)
Total without SEAFDEC 799.54 852.81 1,065.17 1,290.44 1,553.04 na(986) (1060) (1356) (1555) (1919) (na)
Total with SEAFDEC 880.79 957.53 1,183.92 1,433.69 1,706.52 na(1087) (1188) (1496) (1732) (2114) (na)
Source: David (1998)Numbers in ( ) include external grants

36 Research and Development and Technology in the Philippines
In the municipal fisheries, private investment in monetary terms islow because the poor economic position of the municipal fishermenpractically prevents them from making such investment. However,manpower involvement in R&D is substantial among fishermen and their
Table 15. Agency-funded fisheries R&D projects of NARRDS institutions
Institution Number of Budget (P) Budget: ResearcherResearchers Ratio
DA-BFAR 61 3,754,000 61,541DMMMSU 13 1,072,903 82,531UPLB 9 3,373,580 374,842UPV 44 2,193,075 49,843MSU-Naawan 25 1,257,125 50,285ZSCMST 15 790,000 52,667DA-CAR - 230,100 -DA-Region 1 2 1,007,000 503,500DA-Region 2 10 889,000 88,900DA-Region 4 - 4,572,000 -DA-Region 5 - 2,180,046 -DA-Region 6 - 785,000 -DA-Region 8 - 415,000 -DA-Region 11 - 902,044 -DA-Region 13 - 310,000 -DA-ARMM - 87,000 -DENR-Region 10 - 4,165,000 -BU - 543,000 -CMU 2 11,000 5,500CSC - 341,000 -CSU 18 548,040 30,447CCSPC - 1,461,033 -CVPC - 244,000 -DOSCST - 972,500 -ISCOF 19 2,425,000 127,632MMSU 17 100,000 5,882MSU-SULU - 590,488 -MSU-TCTO 21 1,330,000 63,333NIPSC 3 5,450,248 1,816,749NMP - 64,564 -NVSIT 5 136,000 27,200PALSU - 1,110,000 -PIT - 308,000 -PSPC 12 25,000 2,083PSU 8 321,000 40,125TONC - 60,000 -UEP - 496,370 -UPMSI 25 3,579,400 143,176Average 17 1,265,777 195,902
- means no dataSource: Israel (1998)

37Gaps in Philippine R&D and Technology
families by way of participation in the conduct of numerous coastal resourcemanagement and similar projects undertaken by government andinternational agencies.
Available data show that the share of private investment in fisheriesR&D is low (Table 17). To promote this type of investment, the AFMAencourages government research agencies to go into cofinancing
Table 16. Agency-funded fisheries R&D projects of NARRDS, 1996
Institution Number of Projects Budget (P) Budget: Project Ratio
DA-BFAR 11 3,754,000 341,273DMMMSU 30 1,072,903 35,763UPLB 9 3,373,580 374,842UPV 8 2,193,075 274,134MSU-Naawan 7 1,257,125 179,589ZSCMST 7 790,000 112,857DA-CAR 4 230,100 57,525DA-Region 1 10 1,007,000 100,700DA-Region 2 8 889,000 111,125DA-Region 3 41 4,572,000 111,512DA-Region 4 12 2,180,046 181,671DA-Region 5 12 785,000 65,417DA-Region 6 8 415,000 51,875DA-Region 8 8 902,044 112,756DA-Region 11 10 310,000 31,000DA-Region 13 3 87,000 29,000DA-ARMM 1 4,165,000 4,165,000BU 3 543,000 181,000CMU 1 11,000 11,000CSC 4 341,000 85,250CSU 6 548,040 91,340CCSPC 4 1,461,033 365,258CVPC 2 244,000 122,000DOSCST 3 972,500 324,167ISCOF 9 2,425,000 269,444MMSU 12 100,000 8,333MSU-SULU 1 590,488 590,488MSU-TCTO 8 1,330,000 166,250NIPSC 13 5,450,248 419,250NMP 3 64,564 21,521NVSIT 2 136,000 68,000PALSU 4 1,110,000 277,500PIT 3 308,000 102,667PSPC 1 25,000 25,000PSU 6 321,000 53,500TONC 1 60,000 60,000UEP 3 496,370 165,457UPMSI 31 3,579,400 115,465Total 309 48,099,516 155,662
Source: Israel (1998)

38 Research and Development and Technology in the Philippines
agreements with the private sector, provided that the terms and conditionsof the agreements are beneficial to the country. For reasons already cited,the possibility of these agreements actually happening will be higher inaquaculture than in the commercial and fisheries subsectors.
Low foreign investmentFigures show that the contribution of foreign funding for fisheries R&Dwas more than half of total funding (Table 17). In recent years, however,this share has gone down (Tables 18 and 19). By 1996, only seven percentof the total funds of NARRDS institutions came from foreign sources (Table20). Furthermore, funding was concentrated only in a few concerns, mostlythe environment and OPAs.
Foreign funding is important because it is essentially a signalingmechanism. Low outside investment for domestic R&D could mean thatlocal research institutions and their programs are not internationallycompetitive and vice versa. Furthermore, in this time of economic crisis,foreign money may be the only viable way of increasing allocations. It isinteresting to note that the AFMA and Fisheries Code did not address theissue of international funding for R&D.
Untimely release of fundsAside from low allocations, a commonly cited fund-related problem infisheries R&D is the untimely release of government funds to institutions,programs and projects. In fact, this constraint is true not only for R&D butalso for other activities depending on government support. In fisheries, itis acute because of the importance that time and season play in the conductof activities. Although no data can be used to validate this, research activitiesare reported to be cancelled or haphazardly conducted because of the delayin the release of funds. A review of the FSP pointed out other problemsrelated to the management of government funds (PRIMEX and ANZDEC1996). These include the excessive control by the Department of Budgetand Management (DBM) over a large proportion of program funds; thediversion of some funds to other activities not necessarily directly related
Table 17. R&D expenditures for fisheries by sector and source of funds, 1988-1994(in million pesos)
Sector Foreign % Government % Private % GrandSector Total
Marine fisheries 218.45 73.48 75.78 25.49 3.08 1.04 297.31Inland aquatic resources 60.73 37.96 98.08 61.31 1.17 0.73 159.98Socioeconomics 4.67 18.65 20.35 81.35 - - 25.02
Total 283.85 58.85 194.21 40.37 4.25 0.88 482.31
Source: Israel (1998)
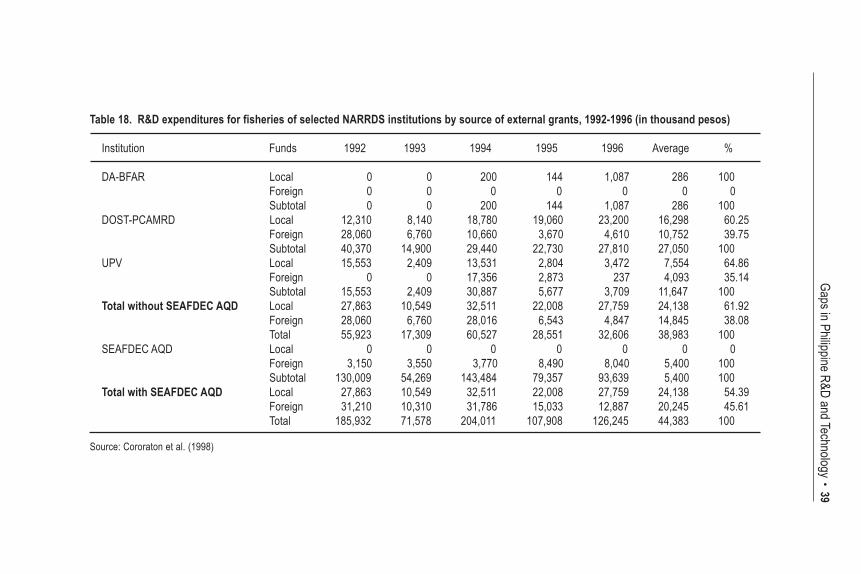
39Gaps in Philippine R&D and Technology
Table 18. R&D expenditures for fisheries of selected NARRDS institutions by source of external grants, 1992-1996 (in thousand pesos)
Institution Funds 1992 1993 1994 1995 1996 Average %
DA-BFAR Local 0 0 200 144 1,087 286 100Foreign 0 0 0 0 0 0 0Subtotal 0 0 200 144 1,087 286 100
DOST-PCAMRD Local 12,310 8,140 18,780 19,060 23,200 16,298 60.25Foreign 28,060 6,760 10,660 3,670 4,610 10,752 39.75Subtotal 40,370 14,900 29,440 22,730 27,810 27,050 100
UPV Local 15,553 2,409 13,531 2,804 3,472 7,554 64.86Foreign 0 0 17,356 2,873 237 4,093 35.14Subtotal 15,553 2,409 30,887 5,677 3,709 11,647 100
Total without SEAFDEC AQD Local 27,863 10,549 32,511 22,008 27,759 24,138 61.92Foreign 28,060 6,760 28,016 6,543 4,847 14,845 38.08Total 55,923 17,309 60,527 28,551 32,606 38,983 100
SEAFDEC AQD Local 0 0 0 0 0 0 0Foreign 3,150 3,550 3,770 8,490 8,040 5,400 100Subtotal 130,009 54,269 143,484 79,357 93,639 5,400 100
Total with SEAFDEC AQD Local 27,863 10,549 32,511 22,008 27,759 24,138 54.39Foreign 31,210 10,310 31,786 15,033 12,887 20,245 45.61Total 185,932 71,578 204,011 107,908 126,245 44,383 100
Source: Cororaton et al. (1998)

40 Research and Development and Technology in the Philippines
to the program; the lack of coordination between the DBM and programadministrators regarding fund utilization; and the lack of a financialmonitoring system for the funds.
Manpower shortageEarlier figures show that the NARRDS institutions relatively have limitedR&D manpower at all levels (Table 18). They also indicate that personnel
Table 19. Distribution of manpower for fishery R&D
Agency PhD MS BS ASSOC Total %
Zonal area for Northern Luzon(Regions I, II, III and CAR) 11 57 25 - 93 12.33
Zonal area for Southern Luzon(Regions NCR, IV and V) 20 45 131 12 208 27.59
Zonal area for Visayas(Regions VI, VII and VIII) 31 117 166 6 320 42.44
Zonal area for Northern Mindanao (Regions X, XI, and Caraga ) 2 19 53 - 74 9.81Zonal area for Southern Mindanao (Regions IX and XII) 3 21 35 - 59 7.82
Total 67 259 410 18 754 100% 8.89 34.35 54.38 2.39 100
Source: Israel (1998)
Table 20. Distribution of the NARRDS R&D program budget
Commodity Source of Funds TotalLocal (P) Foreign (P) Budget
Export winnersSeaweed 7,236,997 0 7,236,997Crab 2,613,727 842,677 3,456,404Tuna 225,000 0 225,000Shrimp 1,605,739 0 1,605,739
Basic domestic needsTilapia 2,664,975 0 2,664,975Milkfish 80,903 0 80,903Small pelagics 2,257,428 0 2,257,428Environment 29,000,173 2,262,513 31,262,686
Other priority areas 14,837,104 1,500,000 16,337,104
Total 60,522,046 4,605,190 65,127,236
Source: Israel (1998)

41
capability varies greatly between regions and programs and senior personnel,especially those with doctorate degrees, are concentrated only in a fewinstitutions (Table 21). Masteral degree holders have offset the limitednumber of doctorate degree holders, in limited cases. While this is so, itcannot be denied that more doctorate degree holders are required inNARRDS institutions to provide organizational and research leadership.
A comparison of selected NARRDS and NARRDN institutions suggeststhat the manpower in fisheries R&D is no more than 10 percent of that inagriculture although the percentage of Ph.D. holders is a bit higher (Table22). This proportion is highly uneven and not reflective of the higher ratioof fisheries output to total agricultural production (Table 23). The graduate-to-undergraduate ratio of fisheries R&D staff appears to be significantlylower compared to that of agriculture.
The problem of limited manpower in fisheries R&D, especially ininstitutions located in the provinces, deserves attention because of the ruralnature of many fishing activities. Researchers working in the countrysideare more exposed to the actual problems in fisheries and are in a betterposition to correctly identify priority research areas for implementation.More of them should be recruited then to enhance the capability of thesector to conduct hands-on and meaningful, instead of “ivory tower,”research.
Gaps in Philippine R&D and Technology
Table 21. Manpower for fisheries R&D of selected NARRDS institutions, 1998
Institution PhD MS BS NI Total
DA-BFAR 2 21 42 1 66DOST-PCAMRD 4 11 10 0 25DMMMSU 1 6 15 0 22UPLB 1 1 0 0 2UPV 0 12 13 1 26MSU-Naawan 4 19 13 0 36MSU-Marawi 1 15 10 1 27CLSU 1 7 2 0 10UPMSI 3 2 20 0 25BU 4 9 2 0 15MMSU 1 2 4 0 7PSU 0 3 1 0 4
Average without SEAFDEC AQD 2 10 13 0 25
SEAFDEC 21 43 1 0 65
Average with SEAFDEC AQD 1 7 7 0 15
Note: NI means not indicatedSource: Cororaton et al. (1998)

42 Research and Development and Technology in the Philippines
The Fisheries Code did not address the problem of limited R&Dmanpower in fisheries. The AFMA, on the other hand, stipulated thecreation of a science fund to sustain career development. Since themanpower problem is directly related to funding, the planned increases inthe total R&D allotment, should they materialize, will go a long way towardaddressing it.
Low level and poor maintenance of capital assetsWhile the data presented here concentrate only on funding and personnelresources, capital resources, in particular, buildings, facilities and equipmentalso help determine the success or failure of R&D. In fisheries, the capitalresources for R&D have been wanting, more so in provincial institutionswhich receive smaller shares of the research budget. The problem ofinadequate capital assets is worsened further by poor maintenance. Therehave been reports that proper maintenance is sometimes sacrificed byinstitutions to meet more immediate expenses, such as salaries and wages.In sites close to the sea, the faster deterioration of capital assets broughtabout by salt makes the problem of poor maintenance very serious.
Table 22. Comparison of the number of R&D personnel in selected NARRDSand NARRDN institutions, 1995-1996
Institution PhD MS BS Total Graduate:Undergraduate
NARRDSUPLB 4 3 2 9 3.50DMMMSU 1 9 3 13 3.33UPV 15 13 16 44 1.75MSU-NAAWAN 2 14 9 25 1.78CLSU 1 10 0 11 0UPMSI 15 6 4 25 5.25ZSCMST 3 7 5 15 2Average 5 9 6 18 2.52
NARRDNUPLB 53 206 225 484 1.15USM 37 72 8 117 13.63ViSCA 39 69 24 132 4.50BSU 15 36 36 87 1.42CMU 43 135 139 317 1.28ISU 17 61 13 91 6CSSAC 19 40 30 89 1.97Average 32 88 68 188 4.28
Note: NARRDN stands for National Agriculture and Natural Resources Research andDevelopment Network, the counterpart of NARRDS. NARRDS data are for 1996while NARRDN data are for 1995. NARRDS data are specifically for fisheries R&Dmanpower only.
Source: Israel (1998)
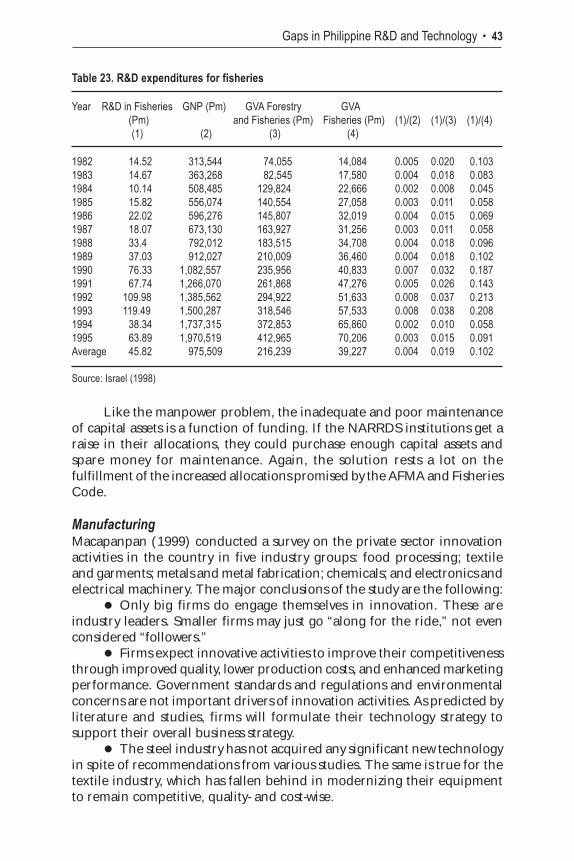
43
Like the manpower problem, the inadequate and poor maintenanceof capital assets is a function of funding. If the NARRDS institutions get araise in their allocations, they could purchase enough capital assets andspare money for maintenance. Again, the solution rests a lot on thefulfillment of the increased allocations promised by the AFMA and FisheriesCode.
ManufacturingMacapanpan (1999) conducted a survey on the private sector innovationactivities in the country in five industry groups: food processing; textileand garments; metals and metal fabrication; chemicals; and electronics andelectrical machinery. The major conclusions of the study are the following:
Only big firms do engage themselves in innovation. These areindustry leaders. Smaller firms may just go “along for the ride,” not evenconsidered “followers.”
Firms expect innovative activities to improve their competitivenessthrough improved quality, lower production costs, and enhanced marketingperformance. Government standards and regulations and environmentalconcerns are not important drivers of innovation activities. As predicted byliterature and studies, firms will formulate their technology strategy tosupport their overall business strategy.
The steel industry has not acquired any significant new technologyin spite of recommendations from various studies. The same is true for thetextile industry, which has fallen behind in modernizing their equipmentto remain competitive, quality- and cost-wise.
Gaps in Philippine R&D and Technology
Table 23. R&D expenditures for fisheries
Year R&D in Fisheries GNP (Pm) GVA Forestry GVA(Pm) and Fisheries (Pm) Fisheries (Pm) (1)/(2) (1)/(3) (1)/(4)(1) (2) (3) (4)
1982 14.52 313,544 74,055 14,084 0.005 0.020 0.1031983 14.67 363,268 82,545 17,580 0.004 0.018 0.0831984 10.14 508,485 129,824 22,666 0.002 0.008 0.0451985 15.82 556,074 140,554 27,058 0.003 0.011 0.0581986 22.02 596,276 145,807 32,019 0.004 0.015 0.0691987 18.07 673,130 163,927 31,256 0.003 0.011 0.0581988 33.4 792,012 183,515 34,708 0.004 0.018 0.0961989 37.03 912,027 210,009 36,460 0.004 0.018 0.1021990 76.33 1,082,557 235,956 40,833 0.007 0.032 0.1871991 67.74 1,266,070 261,868 47,276 0.005 0.026 0.1431992 109.98 1,385,562 294,922 51,633 0.008 0.037 0.2131993 119.49 1,500,287 318,546 57,533 0.008 0.038 0.2081994 38.34 1,737,315 372,853 65,860 0.002 0.010 0.0581995 63.89 1,970,519 412,965 70,206 0.003 0.015 0.091Average 45.82 975,509 216,239 39,227 0.004 0.019 0.102
Source: Israel (1998)

44 Research and Development and Technology in the Philippines
Of the total respondent firms (more than 60), only seven firmsemploy Ph.D.s and only about 20 have masteral degree performing anyinnovation activity. A majority employ only college graduates or lower intheir innovation activities, implying a very low level of innovation activity.
Government research institutions rank very low as a source ofinnovation ideas. From interviews, the perception of the firms is that theseresearch institutions lag even in monitoring technology developments intheir respective fields. Internal R&D is not relied upon, except by the firmsin the electronics and electrical industry. Ideas for innovation activities areusually sourced from the outside in the form of consultancy services,information on competitor activity generated by monitoring, purchase oftechnology, tangible and intangible, and the recruitment of manpower withthe required skills.
Financial constraints such as risk and rate of return, lack offinancing, and taxation are the major hindrances to innovation. Technicalconstraints such as lack of information on new technologies, deficiency inexternal technical services, innovation costs, and uncertainty rank next asbarriers to innovations. Others mentioned include difficulty in obtainingpatents, low technological standards, lack of skilled personnel, and lack ofopportunities for cooperation with other companies.
Philippine firms are deficient in experience and organization tofully exploit technology as a source of competitive advantage. This situationis not helped by the lack of government assistance and support. Governmenthas been remiss in aligning the educational system toward a globally andtechnologically competitive economy. The Philippine schools do not providethe requisite technical and technological skills and knowledge. Governmentresearch institutions have not diffused their findings to the private sector.
In addition, Nolasco (1999) identifies other gaps and major loopholesin the system:
The overall system is loose and chaotic in the sense that differentgovernment agencies do have different sets of priority sectors. Furthermore,some of the goals are unaligned. For example, NEDA, DTI and BOI havedifferent sets of strategic sectors. DFA and NEDA have conflicting interestswith the BOI industry planners, especially in terms of granting incentives.In particular, the Department of Energy is looking into the possibility ofdeveloping wind energy while DOST is eyeing the solar energy.
Government, with such limited amount of budget alloted to R&D,limits the amount of expenditure on R&D.
Support facilities like testing centers, either government-run orgovernment-subsidized, standardization institution and support industrieslike casing and others are lacking or nonexistent. Access to recent andstate-of-the-art technologies is lacking due to poor databases.
The system only reaches out to a handful of firms, usually the largerones. Small- and medium-scale firms have minimum access to the system.
People and staff in the incentive promotion desk are not fully

45
familiar with the system of incentives. For example, some of them are noteven aware of (1) the contents of the R&D incentives scheme LOPA; and(2) the fact that R&D incentives have existed for more than six years. Mostof them think that R&D has been integrated into the IPP LOPA only in thepast two years, when in fact it has been there since early 1991.
Government and private sector linkages are very weak. Thus,commercialization of developed technologies has not been well been.
As a result of these gaps and problems, only 11 companies, or a totalof 13 projects, were granted incentives during the period 1991-1997.Meanwhile, the results of Halos (1999) on the survey and interview withprivate firms in the chemical industries indicate that there has been aconsiderable reduction in R&D investments. The exceptions are in the sugarand coconut industries where research funds have been mandated bygovernment. In fact, the intensity of research activities by the private sector,except sugarcane and coconut, appears to have declined from the level inthe 1980s. Information on R&D is scarce and hard to come by, but thereare clear indications of this slowdown. For example, a number ofmultinational pesticide companies used to maintain research groups distinctfrom marketing group, but only two have continue to do so at present. Theregional research station of a multinational agrichemical firm has reducednot only the number (from five to three) but also the rank of its researchstaff (from two senior and two junior level).
Another observation of Halos (1999) deals with government policy.To be sure, the government has adopted a policy of promoting localinnovations and R&D activities. This is manifested in a major legislation,RA 7459, which was signed into law in April 1992. The law provides multi-incentives package to encourage the development of inventions andfacilitate their commercial application. For example, the law provides forpresidential awards, tax/duty exemptions, loan assistance, and inventionassistance development in prototyping, piloting, training, study tours,attendance to conferences/seminars and laboratory tests and analyses.Various councils of the DOST provide counterpart R&D funds to privatecompanies. Although respondents agreed that tax exemption for R&Dequipment is conducive to their R&D initiatives, interviewees found theprocedures too cumbersome. Similarly, they found the availment procedures andequity requirements for technology-commercialization loans cumbersome and too steepfor small entrepreneurs.” In fact, producers of organic fertilizers bewail thedata required for FPA registration.
Patalinghug (1999) argues that small- and medium-size enterprisesface several problems to acquire technology or to engage in R&D. “Amongthese problems are (1) lack of funds, (2) insufficient information, (3) lackof skills in evaluating alternative technologies, (4) lack of technical knowhowto shift to more advanced technologies, (5) inadequate mechanism fortransfer of technologies, and (6) inertia of entrepreneurs because of noperceived or actual need for technology.”
Gaps in Philippine R&D and Technology

46 Research and Development and Technology in the Philippines
EducationTable 24 shows that while the Philippine educational system produces avery high number of tertiary graduates, the post-baccalaureate science andengineering students, as a percent of post-baccalaureate students, is low. Incolumn 6 of the table, the Philippines ranks the lowest in the list with aratio of only 8.65. This is far from the second lowest of 20.76 percent, whichis for New Zealand. The highest is China with a ratio of 74.26 percent.
The low number of scientists and engineers is reflective of the generaltendency of the educational system in the Philippines to producenontechnical graduates. There is in fact a dilemma in the present educationsystem because of the educational “mismatch”: while there is a great demandfor technical and engineering-related graduates by local industries, privatetertiary schools continue to produce nontechnical graduates. This is, indeed,a big policy area problem. One of the factors that would explain this is thatprivate schools prefer not to go into these technical-related courses becauseof their high laboratory requirement that is capital intensive. Nontechnicalcourses are less laboratory-intensive and therefore less capital-intensive.
The pool of R&D manpower is dominated by people with basic collegedegrees and generally have very limited advanced technical training. Thisin itself presents a big stumbling block because new technologies availableare already in advanced state and require special technical skills. Thus, thelack of adequate R&D manpower places the country in a very disadvantagedposition because it does not have enough technical capability to adopt,through R&D, developed technologies in the market. In other words, withinadequate technological capability, the Philippine may find it difficult to
Table 24. Tertiary education across selected Pacific Rim countries
Country (1) (2) (3) (4) (5) (6)
China (1991) 2,124,121 0.17 80,459 3.79 59,748 74.26Japan (1989) 2,683,035 2.13 85,263 3.18 54,167 63.53South Korea (1991) 1,723,886 3.83 92,599 5.37 28,479 30.76Australia (1991) 534,538 2.92 92,903 17.38 26,876 28.93Singapore (1983) 35,192 1.13 1,869 5.31 532 28.46Malaysia (1990) 121,412 0.58 4,981 4.10 1,251 25.12Thailand (1989) 765,395 1.24 21,044 2.75 4,928 23.42New Zealand (1991) 136,332 3.78 13,792 10.12 2,863 20.76Philippines (1991) 1,656,815 2.39 63,794 3.85 5,520 8.65
Column definition:(1) Number of students at tertiary level(2) Number tertiary students as percent of population(3) Number of post-baccalaureate students(4) Post-baccalaureate as % of tertiary students(5) Number of post-baccalaureate science and engineering students(6) Post-baccalaureate science and engineering as percent of post-baccalaureate studentsBasic source of data: UNESCO World Science Report (1996).

47
catch up in terms of access to and mastery of the key emerging or leading-edge technologies. This, in turn, negatively affects future growth andinternational competitiveness.
This inadequacy of supply of R&D manpower can be traced back tothe problem in basic education that is at the moment in a poor state. Thisproblem is rooted in the teacher training policy of the country and thestatus of teaching profession (Magpantay 1995). He says:
To be able to teach in high schools, teachers must have BSE with amajor and minor field. This degree program is short on content and heavyon methodology of teaching. In the end, teachers are knowledgeable inthe standard way of teaching but do not know how to teach. Worse, studentswho enter . . . college are generally not very creative and imaginative dueto the low status afforded the profession. In any family, the intelligentamong the children are encouraged to take up medicine, law, and, ifmathematically inclined, engineering while the least academically capableare asked to take up BSE or BSEE programs. It is no wonder then thatscience and math educations in the primary and secondary levels are inbad shape. Students are taught by the least academically inclined peoplewho went through a program that emphasizes more on the form than onthe content.
The poor S&T educational system results in low supply of skilledmanpower (Sachs 1998). Says Sachs:
In particular, there is a severe shortage of science teachers at theschool level. The quality of science education at the college level is alsopoor. A substantial fraction of high school science teachers have no trainingin science and mathematics (but rather have degrees in education). Highschool math and physics curricula are badly in need of reform. A WorldBank-funded engineering and science education project has providedscholarship for masters and doctoral training in science and engineering,but the scope of the project is limited. In general, there is a lack of capacityto do research, which will become particularly problematic in the futurewhen forms will have greater demand for adopting and innovating existingtechnologies. Increasing the supply of science and technology educationis probably the most crucial investment in science and technology thatneeds to be made now.
HealthThe Center for Economic Policy Research (CEPR) conducted an analysisof the fund flow for health research and development in the Philippines.Among the major objectives of the analysis were to: trace the flow of healthR&D resources; assess the system for setting health R&D priorities; anddetermine if health R&D funds match the priorities of the research agenda.
Some of the major insights derived from the CEPR-DOH findings,which are relevant to the present R&D gaps analysis in this section, include:
Of the P394 billion government budget for 1996, health resources
Gaps in Philippine R&D and Technology

48 Research and Development and Technology in the Philippines
accounted for P75 billion, or 19 percent, while R&D resources had a meagershare of P3 billion or less than one percent.
Resources for health R&D amounted to P421 million. This wasequivalent to 17 percent of R&D resources and one percent of healthresources. The latter is below two percent of the national healthexpenditures, the proportion recommended by the Commission for HealthResearch and Development for health R&D.
Other important gapsEclar (1991) examines the long history of S&T and R&D in the Philippines.In fact, he says, its beginnings can be traced back to the American colonialperiod. There have been significant changes since then, including changesin the structure, system, leadership and administration. Recently, programsand plans have been launched like the Science and Technology MasterPlan (STMP) in 1990 and the Science and Technology Agenda for NationalDevelopment (STAND) in 1993. However, there are no successes that canbe cited. But there are clear indications of failure (Patalinghug 1999). Forexample, the S&T sector faces the following major problems: under-utilization of S&T for development, as reflected in the low quality andproductivity of the production sector and heavy dependence on imports;underinvestment in S&T developments in terms of manpower training,technological services, R&D facilities, and financial resources; weak linkagesbetween technology generation, adaptation, and utilization; and slowcommercialization of technologies because of very weak delivery system,which in turn is the result of weak linkages, especially between governmentresearch institutes and the end-users.
Patalinghug (1999) further says that there has been a general failureto use technology to gain competitive advantage. Resource-based exports(timber, copper) are basically in raw material or unprocessed form.Traditional agricultural exports (coconut, sugar and banana) are alsoexported without infusing technology-based processing in the value-addedchain. The shift from primary exports (coconut, sugar) to manufacturedexports (garments, electronics) has simply reflected the changing factorcomposition of exports (that is, from resource-intensive to labor-intensive).The shift from labor-intensive to skill-intensive or technology-intensivemanufactured exports has not yet occurred.
Furthermore, there are a number of clear institutional gaps as well.Among the crucial ones are:
Failure in execution and implementation. Patalinghug (1999) comparedthe S&T systems in the Philippines and in South Korea. One of hisobservations was that, “basically, in form and intent, the Philippine S&Tdevelopment plan is comparable to that of Korea. Thus, the basic weaknessof the Philippine experience is in its execution and implementation.Although there are some weaknesses in the plan-formulation process inthe Philippines because the planning exercise is detached from the

49
budgeting exercise, the more decisive factor is the weakness andorganization arrangement to ensure timely and correct implementation.”
There are substantial defects within the existing intragovernmentcoordination system. In particular, the system of performance monitoringand evaluation is lacking or defective. In fact, the government’s InvestmentCoordination Committee (ICC, chaired by NEDA) has been lengthilyreviewing projects intended to address the adverse effect of the financialcrisis. But basing on the ICC’s inefficiency in evaluating developmentprojects, it is more likely that these projects will be approved at a timewhen the economic conditions they are supposed to address are no longerthere. The ideal institutional arrangement is definitely to establish acoordination mechanism between S&T plan, the budget plan and theMedium–Term Philippine Development Plan. Unfortunately, prospects ofestablishing this linkage in the Philippine bureaucracy, in the short run,are not promising.
Other causes of institutional failure. Some argue that Korean leadershiphas the political will and the ability to generate consensus among itsstakeholder to give top priority to S&T development in the allocation ofresources. Magpantay (1995), on the other hand, claims that the DOST is ahighly inefficient structure largely because it “is doing too many S&Tactivities, charged with too many functions, operating in a bureaucracy withtoo many constraints and given too little support.” This is manifested inthe DOST's STMP 15 leading edges and STAND 22 R&D priority areas.These areas are all-inclusive and practically cover all industries and alltechnologies with too little financial resources. This kind of situation is aclear example of poor planning and poor budgeting. Patalinghug (1999)in fact concludes, “the most reasonable conclusion that can be made is thatboth STMP and STAND cannot be implemented. Their defects are thefollowing: (1) budgeting and planning were not harmonized in the draftingof the S&T plan; (2) capabilities of implementing agencies were ignored;(3) solid support from various stakeholders was lacking; and (4) thereforeresources for S&T development were insufficient. By any standards, theamount actually used for R&D in the DOST budget is absolutely too little.”
Failure of industrial policy. There are renewed attempts to formulateindustrial policy (Patalinghug 1999). This is a reiteration of the vital role ofindustrial progress to sustain future economic growth in the country.“However, ad hoc or de facto industrial policies (as formulated by EDC,IDC and SMEDC) have not stressed the need for active promotion oftechnology to build a strong foundation for industrialization.” The STANDhas identified what is called “export winners” or “industry/product winners.”Patalinghug argues that identifying these winners without technology islike a vehicle without an engine. Twelve priority sectors have been implicitlyidentified in the recent polevaulting strategy. However, the technologies insupport of these “must-do” programs have yet to be identified.
Gaps in Philippine R&D and Technology

50 Research and Development and Technology in the Philippines
6Policy Insights
R&D investmentsThere are convincing pieces of evidence showing significant under-investment in R&D in the Philippines. This is true at the national as well asthe various sectoral levels. For example, Cororaton (1999) estimates a gapin R&D expenditure of 0.5778 percent of GNP at the national level. Davidet al. (1999) have also observed significant underinvestment in agriculture.Israel (1999) also finds the same thing in the fisheries sector. Under-investment in R&D is also very apparent in the private manufacturing sectoras observed by Macapanpan (1999) and Halos (1999). The recentlycompleted study on the flow of R&D funds in the health sector by CEPR-DOH (1998) also found significant underinvestment in R&D.
There are also equally convincing set of facts indicating high rates ofreturn on R&D investments. This being the case, underinvestment in R&Dand high rates of return may imply high opportunity cost. While it isextremely difficult to compute this opportunity cost because of lack ofinformation, it is manifested in other indicators like productivity. Productivityperformance in the Philippines has been very poor. In fact, this has beenthe major factor behind its unsustainable growth path. In principle, R&Dactivities lead to innovation, technological progress, and finally economicgrowth and prosperity. A huge body of literature can support this.
The biggest issue at hand is: Who would fill the gap? Rough calculationsindicate that there is a gap of about P14 billion at current prices. For sure,the government sector cannot fill in this gap because of financial constraints.Furthermore, the government has other equally important concerns suchas basic infrastructure and other social sector needs. Naturally, it has to bethe private sector (either local or foreign). However, the private sectorresponds to proper incentives. (Further discussion on this is given later inthe section.)
Part of the gap can be attributed to the inefficiency of allocation ofresources. In fact, in agriculture, David et al. (1999) argue, misallocationof public sector research funding is an equally important consideration asunderinvestment. They cite specific examples. Using the congruence rule,

51
they find that “relatively greater research budgets are provided for minorcommodities such as cotton, silk, or carabao, and too little on major onessuch as corn, coconut, fisheries and others. Furthermore, Mindanao regionsare relatively neglected in terms of research budgets of the DA and SUCscompared to Luzon and to a lesser extent to the Visayas. While congruencydoes not strictly coincide with optimal research resource allocation, thedifferences in research intensity ratios observed among commodities andacross regions cannot be explained by possible differences in cost of research(probability of research success, etc.), future market potential, or equityconsiderations.
Another manifestation of misallocation of resources lies in theallocation of budgetary resources by type of expenditure. David et al. (1999)also observe that “too little resources are available to perform researchactivities and to properly maintain the physical facilities, after the salariesof personnel have been paid. Indeed, the average share of personal servicesto direct budgetary outlays is close to 60 percent and as high as 70 to 80percent in many cases. Consequently, either the research manpower isunderutilized or the research agenda is driven by donors’ priorities.”
Due to lack of information because of extremely poor databases onR&D activities, misallocation of research resources in other sectors like themanufacturing cannot be conducted. However, given the nature and theextent of problems in the R&D system in the Philippines, the issues onagriculture seem generic to all sectors of the economy.
Aside from underinvestment and misallocation of research resources,there is another big problem of untimely release of funds to institutions,programs and projects. In fact, this is true not only in R&D but also inother activities that are dependent upon government funding and support.Israel (1999) mentions this as one of the major concerns in the fisheriessector. He says, “In fisheries, it is acute because of the importance that timeand season play in the conduct of activities. Although there are no datawhich can be used to validate this, research activities are reported to becancelled or haphazardly conducted because of the delay in the release offunds.”
Patalinghug (1999) has recommended that DBM be involved withDOST in the S&T and R&D planning formulation stage so that S&T andR&D resources are made available to implement such plan without delays.This issue will also be touched upon later in the discussion on institutionalarrangement.
R&D manpowerThe issues surrounding R&D manpower are equally, if not more,problematic. This is because the problems in this area can be traced backto the educational system which is not only difficult to reform, but takes along time for reforms to bear fruit. Lag time would usually take about 15 to20 years—the required time to properly educate and equip the childrenwith the necessary skills and talents before they enter the workforce.
Policy Insights
52 Research and Development and Technology in the Philippines
Cororaton (1999) estimates that the gap in the R&D manpower isabout 197 scientists and engineers per million population. In agriculture,David et al. (1999) observe that the R&D manpower is not so much interms of the number as in relatively low level of scientific qualification ofagriculture research. They, in fact, gave a warning that there is an urgentneed to strengthen manpower capability in DA and DENR research agencies.Israel (1999) also observed a severe shortage of qualified personnel in thefisheries sector. The same is true in the private manufacturing sector(Macapanpan 1999; Halos 1999). In fact, in the recent PIDS survey(Cororaton et al. 1999), it was observed that the majority of R&D personnelhave only basic college degrees. A small percentage has doctoral degreesmostly in social sciences. A very tiny percentage of Ph.D. holders are inengineering and technology.
While the Philippine educational system produces one of the biggestnumbers of college graduates, compared to other countries, it generatesone of the smallest numbers of graduates with science and engineeringskills (Cororaton 1999). A host of factors are behind this issue. At the tertiarylevel there is a dilemma in the present educational system because of theeducational “mismatch.” While there is a great demand for technical andengineering-related graduates by local industries, private tertiary schoolscontinue to produce nontechnical graduates. One of the factors that wouldexplain this is that private schools, which dominate the tertiary level, prefernot to go into these technical courses because of their high laboratoryrequirement that is capital-intensive. Nontechnical courses are lesslaboratory-intensive and therefore less capital-intensive.
At the secondary level, a substantial fraction of high school scienceteachers have no formal training in science and mathematics (Magpantay1995; Sachs et al. 1998). Rather, they have degrees in education. There is,therefore, an urgent need to reform high school math and physics curricula.This problem also holds true at the primary level.
In almost all sectors, the lack of adequate manpower surfaces. Thus,for the country to sustain a long-term growth there is an urgent need toreform the science and technology education system. In fact, investment inscience and technology education is the most crucial investment that needsto be made now (Sachs et al. 1998). Otherwise, it would be too late sincereturns to this investment have usually very long gestation period or timelag.
Patalinghug (1999) offers specific recommendations: (1) strengthenS&T education at the elementary and secondary school levels. The quantityand quality of elementary and secondary teachers of science andmathematics must be addressed in the Medium-Term PhilippineDevelopment Plan (MTPDP) for 1999-2004; (2) a strong science andengineering program is also needed to support an expansion of scienceand engineering enrollment at the tertiary level. Expand the facilities ofscience and engineering institutions. Encourage the hiring of qualifiedfaculty from abroad; (3) intensify the effective recruitment of Filipino

53
scientists and engineers working abroad by designing an incentive programthat matches the cost of ESEP;9 and (4) expand the Philippine ScienceHigh School system.
Incentive systemPeople, especially the private sector, respond to incentives. Incentives thatare deemed particularly important to R&D activities include a stableeconomy; institutional protection; access to capital and financing, especiallyby the SMEs; good R&D infrastructure; and fiscal incentives.
Normally, there are high risks involved in R&D activities. In particular,there are uncertainties in the outcome of an R&D undertaking. Positiveand favorable results of an R&D undertaking will not emerge 100 percentor with certainty. In fact, there are great possibilities of failure. Furthermore,there is high incidence of spillover or externality that is hard to appropriate.In this regard, government intervention is critically needed.
There is ample literature and empirical evidence that support thefact that a stable macroeconomy helps encourage productivity-enhancingactivities like R&D, especially by the private sector. Therefore, conducivemacroeconomy is one of the major incentives that can be offered to privateinvestors. The role of the government is particularly important in beingable to manage the economy so that inflation rate, interest rates, riskpremiums, among others, are kept at a minimum.
There are also clear indications from the literature that institutionalprotection is critically needed. Institutional protection comes in the formof patents and intellectual property rights. These issues have not beenaddressed in detail in the present paper, but certainly there are problemareas that need to be ironed out here. To be sure, there are indicationsthat the number of patents granted declined through time.
Macapanpan (1999), Halos (1999), and Nolasco (1999) observethrough company interviews and surveys that one of the major constraintspreventing some of the firms, especially the SMEs, from conducting andpursuing R&D activities and plans is the lack of access to cheap capital andfinancing. The cost of capital in the Philippines is traditionally high becauseof distortions in the financial system.
R&D and S&T infrastructure is also one crucial incentive that couldattract the private sector to pursue technology-related activities. Properinfrastructure could come in the form of a strengthened educational system,which can produce a workforce with adequate R&D capabilities, good andupdated databases and information system; wide and easy-to-access networkon technology developments; a mechanism whereby Filipino scientists andengineers working abroad can come home to work; and a mechanismwhereby research results and output of research institutions and universitiescan be delivered to the endusers, among others.
Policy Insights
9South Korea did this in the early 1960s with great success.

54 Research and Development and Technology in the Philippines
Macapanpan (1999), Halos (1999), and Nolasco (1999) also note thatfiscal incentives are important in attracting the private sector to go intoR&D activities. Cororaton (1999) lists down some of the major fiscalincentives in the Philippines and notes that these are generally similar tothe ones offered in other countries. However, fiscal incentives have to behandled properly, as these would have significant budgetary implications.Furthermore, although fiscal incentives are important, results would indicatethat there are major inefficiencies in the granting of incentive in the BOI.For example, Nolasco (1999) states that from 1991 to 1997, only 11companies or a total of 13 projects were granted incentives. Patalinghug(1999) therefore suggests the need to “design an incentive package, withstrict qualifying requirements on what constitutes R&D activities, toencourage private sector R&D. An external peer review committee isrecommended to act as the screening mechanism.” The granting of fiscalincentives may be conducted on a competitive basis through a set ofperformance criteria that may be defined by the government.
Israel (1999) discusses other important incentive issues that needattention. He notes, in particular, that in most cases, researchers conductingresearch using the funds of their own agencies get minimal financialincentives. Remunerations from projects funded by other governmentsources have been uncompetitively low. As a result, many researchers tendto do odd jobs not related to research, or consulting work for the privateand international organizations. The results of the PIDS survey on R&Dmanpower, particularly on R&D personnel with Ph.D. degrees, validate thistrend (Cororaton et al. 1999).
The Magna Carta for the Government Science and TechnologyPersonnel (RA 8439) was recently passed to address the problem of lowincentives, but it remains to be seen whether this will solve the problem. Inparticular, the law allows for the provision of honoraria, share of royalties,hazard allowance, and other benefits to science and technology workers.
Patalinghug (1999) offers other recommendations to improve the S&Tincentives. These include: (1) allocation of an annual funding for theimplementation of the Scientific Career System (SCS); and (2)implementation of a competitive bidding, strictly based on merit, in theawarding of research projects by pooling a major portion of the country’sR&D resources to be administered by an NSF-type agency. With regard tothe first, entry into SCS should be limited by giving top priority to the targetgroups, natural scientists, and engineers.
Institutional arrangement and S&T coordination mechanismThere is no doubt that the entire R&D system, as well as the general S&Tsystem, is in a state of disarray because of lack of leadership, direction, andcoordination. There are systems, as well as administrative failures, that resultin wrong implementation of the plans, projects, and programs. There arealso policy failures due to the lack of focus on technology in the overall

55
development strategy. To address these problems, Patalinghug (1999)recommends the following reforms:
DBM must be involved with DOST in the S&T plan formulationstage so that S&T resources are available to implement the plan;
STCC must draft a Medium-Term Science and TechnologyDevelopment Plan (MTSTDP) a year before the drafting by NEDA of thenext MTPDP. An interagency joint committee must integrate the MTSTDPinto the MTPDP by decomposing them into annual budget plan, annualS&T plan, and annual economic plan, and then harmonizing its goals,projects, programs, strategies, resource requirements, and timetables;
DOST must establish a Project and Program Monitoring Unit staffedby at most three persons whose main job is to coordinate the selection,through competitive bidding, of external evaluators and reviewers for thedifferent projects and programs implemented under the S & T plan; and
an STCC chaired by the President must meet at least once everythree months to address current problems that pose obstacles to theimplementation of the S&T plan. An MOT unit attached to DOST (justlike PIDS is attached to NEDA) will act as the technical secretariat of STCCunder the direct supervision of the DOST secretary.
R&D delivery systemEclar (1991) has noted that there is very slow commercialization oftechnologies in the Philippines. This is largely due to the very weak deliverysystem and poor linkages of S&T organizations with industry and othergovernment agencies. To improve the linkages Patalinghug (1999) has anumber of recommendations:
Reorganize the government-supported R&D institutes into a newcorporate structure that gives them flexibility as well as responsibility togradually develop its fiscal autonomy.
Establish funding schemes through DOST and CHED to support aconsortium or network of schools to maximize use of resources.
Focus funding support for developing core competence on targetedregional universities. For instance, University of San Carlos can specializein chemistry and chemical engineering; MSU-IIT in mechanicalengineering, and Xavier University in biochemistry and agriculturalengineering.
Promotion of S&T culture by giving Presidential awards tooutstanding science and engineering projects selected through a nationwidecompetitive search. Encouragement of science TV and radio programs, fairs,plant tours, and apprenticeship.
Install a scanning and monitoring scheme of world technologicaltrends for dissemination to local industries, research institutes, anduniversities.
Eclar (1991) conducted a comprehensive analysis of factors affectingcommercialization of technologies. Her study identified user participation.
Policy Insights

56 Research and Development and Technology in the Philippines
Her findings: Successful commercialization is promoted when a user with aspecific need has been identified at the start of the project. The usergenerally maintains an interest in the progress of the research and takes onthe commercialization of the results at the completion of the researchproject to meet his earlier expressed need. This is reinforced when theuser’s interest in the project is translated into support or costsharing.
Another important factor is pilot testing. Demonstration of thetechnical viability of the technology in a semicommercial scale helpsconvince an industry user to start off the commercialization process.Commercial success is promoted when the user himself has providedmaterial inputs to the pilot test.
Industrial strategyThe market of technology is highly imperfect and the economicenvironment within which these developing countries are operating isadverse to technology-based institutions. The Philippines is undergoingmarket-based reforms10 in line with globalization. While these are extremelyimportant and necessary to overhaul the inefficient production structureof the economy, it lacks focus and provides no clear direction fortechnological innovation. The recent S&T plan of the government listsdown 23 industries as priority areas. The list is simply too long since theproduction lines of these industries are totally unrelated. The case of Japan,and to a great extent the South Korea, is very clear: the technologicalinnovation strategy was attuned, synchronized, and consistent with theoverall industrial strategy. This is a very important lesson for the Philippinesduring this period of economic reform. The process of technologicalinnovation cannot start and gain momentum unless some kind of anindustrial strategy is adopted. Activities in technology area are simply toorisky and to a great extent capital-intensive. Unless clear directions are set,the private sector may be unwilling or hesitant to come in and participateno matter how attractive government incentives are. In the Philippines,incentives are being offered to R&D-related activities, but there are veryfew takers.
Here’s a word of caution in letting the government take an active rolein industrial strategy. To prevent the policy failure of the past from recurring,the strategy has to be market-friendly. That is, it should not go against themarket, but instead assist in its development. If, for example, market signalsindicate that it is the semiconductor industry that is the leading sector bothin the domestic and export markets,11 then government effort should bedirected toward supporting the industry in terms of infrastructure,manpower development, incentives, research institution, etc. The
10Economic reforms include trade reforms, financial reforms, fiscal reforms, exchange rate reforms, investmentreforms, and other market reforms through privatization and liberalization.11At present, almost 60 percent of the country’s export consists of semiconductors.

57
technological innovation strategy that is consistent with this is thedevelopment of a system whereby the economy is able to move up theproduction ladder from the present assembly-type activities to activities withhigher value added. Manpower development and research institutions arekey to the development of this system.
Statistical information and accounting systemGood and accurate analysis of R&D opportunities is one of the major factorsthat would help encourage private, as well as public, investment into R&Dand S&T-related activities. This is because there are normally high risksinvolved in R&D investments (particularly the uncertainty in the outcomeof an R&D undertaking) couple with high incidence of spillover orexternality that is hard to appropriate. These uncertainties and other marketfailures can be minimized if the statistical information and accounting systemis well established. A good information system leads to good analysis on thestructure and nature of R&D activities. If there are significant market failures,with good analysis, then appropriate and correct policy measures can easilybe formulated to correct these market kinks. However, the present statisticalinformation and accounting system is extremely poor. It generates veryinaccurate information of the variables of particular interest in policy. Thisassessment is based on the recent R&D survey conducted by PIDS(Cororaton et al. 1999). Thus, there is an urgent need to overhaul thestatistical information and accounting system on R&D and S&T activities.The first major step involves making the survey questionnaire consistentwith the accounting system of the institutions so that information can flowimmediately from the information system of the respective institutions intoR&D database. The next major step involves reconciling the variables inthe questionnaire consistent with the NSO-PSIC sectoral breakdown. Thethird recommendation deals with institutionalizing the data system in NSO,because of its expertise in gathering information and extensive nationwidenetwork, both of which will help ensure that regular information isgenerated and regular monitoring and analysis are conducted.
Policy Insights

58 Research and Development and Technology in the Philippines
References
Austria, M. 1998. Productivity growth in the Philippines after the industrialreforms.” PIDS Discussion Paper Series No. 1998-26. Makati City, Philippines:Philippine Institute for Development Studies.
Barro, R. and X. Sala-i-Martin. 1995. Economic growth. New York: MacGraw-HillCo.
Choi, H.S. 1983. Bases for science and technology promotion in developing countries.Tokyo: Asian Productivity Organization.
Cororaton, C. 2002. Total factor productivity in the Philippines. PIDS DiscussionPaper Series No. 2002-01. Makati City, Philippines: Philippine Institute forDevelopment Studies.
______. 1999. Research and development: a review of literature. PIDS DiscussionPaper Series No. 1999-25. Makati City, Philippines: Philippine Institute forDevelopment Studies.
______. 1999. Rates of return to R&D investment. PIDS Discussion Paper SeriesNo. 1999-24. Makati City, Philippines: Philippine Institute for DevelopmentStudies.
______. 1999. R&D gaps in the Philippines. PIDS Discussion Paper No. 1999-16.Makati City, Philippines: Philippine Institute for Development Studies.
______. 1999. Study on public and private expenditures on research anddevelopment: an integrative report. PIDS Discussion Paper Series No. 1999-15. Makati City, Philippines: Philippine Institute for Development Studies.
Cororaton, C. and R. Abdula. 1999. Productivity of Philippine manufacturing. PIDSDiscussion Paper Series No. 1999-21. Makati City, Philippines: PhilippineInstitute for Development Studies.
Cororaton, C. and J. Cuenca. 2001. Estimates of total factor productivity in thePhilippines. PIDS Discussion Paper Series No. 2001-02. Makati City,Philippines: Philippine Institute for Development Studies.
Cororaton, C. and M.T. Caparas. 1999. Total factor productivity estimates for thePhilippine economy. PIDS Discussion Paper Series No. 1999-06. Makati City,Philippines: Philippine Institute for Development Studies.
Cororaton, C., B. Endriga, D. Orneda and C. Chua. 1995. Estimation of total factorproductivity of Philippine manufacturing industries: the estimates. PIDSDiscussion Paper Series No. 1995-32. Makati City, Philippines: PhilippineInstitute for Development Studies.
Cororaton, C., M.T. Dueñas, R. Yacat, J. Cuenca, R. Casas and M. Galvan. 1998.Survey of activities in research and development. Unpublished. Makati City,Philippines: Philippine Institute for Development Studies.
David, C., E. Ponce, S. Halos and C. Lamug. 1999. Philippine national agricultureand natural resources research system: resource allocation issues and directionsfor reforms. PIDS Discussion Paper Series No. 1999-33. Makati City: PhilippineInstitute for Development Studies.
Department of Science and Technology. Competence, competitiveness, conscience: theMedium-Term Plan of the Department of Science and Technology (1999-2004).Manila: DOST.

59
De Silva, M.A.D. 2001. Measuring total factor productivity: the Philippines. Tokyo,Japan: Asian Productivity Organization.
Eclar, V. 1991. Analysis of policies and factors affecting successful commercializationof technologies. Ph.D. Dissertation, College of Public Administration,University of the Philippines.
Evenson, R. and L. Westphal. 1995. Technological change and technology strategy.In Handbook of Development Economics, edited by J. Berhman and T. Srinivasan.
Halos, S. 1999. Agricultural technology acquisition, development and disseminationin the private sector. PIDS Discussion Paper Series No. 1999-18. Makati City:Philippine Institute for Development Studies.
Hirono, R. 1985. Macro-micro linkages for productivity improvement throughtechnological innovations: case of Japan. Chapter 12: Improving productivitythrough macro-micro linkage. Tokyo: Asian Productivity Organization.
Israel, D.C. 1999. Research and development in the Philippine fisheries sector. PIDSDiscussion Paper Series No. 1999-17. Makati City: Philippine Institute forDevelopment Studies.
Krugman, P. 1994. The myth of Asia’s miracle. Foreign Affairs 73(6).K-Soo. 1996. Science and technology development policy in Korea and the
Philippines. Masteral thesis. College of Public Administration, University ofthe Philippines.
Lim, Joseph. 1998. Annual macroeconometric model with social sector block.National Economic and Development Authority.
Macapanpan, T. 1999. Private sector activities on research and development. PIDSDiscussion Paper Series No. 1999-19. Makati City, Philippines: PhilippineInstitute for Development Studies.
Magpantay, J. 1995. Streamlining the science and technology sector for the country’sdevelopment goals. Unpublished. Philippine Institute for Development Studies,Makati City, Philippines.
Nolasco, L. 1999. Identifying areas of support in research and development for themanufacturing sector. PIDS Discussion Paper Series No. 1999-27. Makati City:Philippine Institute for Development Studies.
Pack, H. and L. Westphal. 1986. Industrial strategy and technological change: theoryvs. reality. Journal of Development Economics 22:87-128.
Patalinghug, E. 1999. An institutional analysis of R&D expenditures in the publicand private sectors. PIDS Discussion Paper Series No. 1999-26. Makati City,Philippines: Philippine Institute for Development Studies.
______. 1984. Labor quality and growth accounting: the Philippines. PhilippineReview of Economics and Business 21(3-4):201-217.
Ponce, E. 1998. Research extension linkage and the Philippine agriculture and fisheryresearch and extension systems. Unpublished.
Sachs, J., R. Goldman and N. Gokgur. 1998. Science and technology policy: linkingindustrial strategy with educational and technological development. Promotionof broad-based economic growth in the Philippines. Pasig City, Philippines: NationalEconomic and Development Authority.
Yamada, K. 1964. Modern technology. Tokyo: Asakura Shoten.Williamson, J. 1991. Productivity and American leadership. Journal of Economic
Literature 19:51-68.
References

1 A Perspective on Macroeconomic and Economy-wide Quantitative
Models of the Philippines: 1990-2002 (Josef T. Yap)
2 The Poverty Fight: Has It Made an Impact? (Celia M. Reyes)
3 The Philippines in the Global Trading Environment (Myrna S. Austria)
4 Philippine Competition Policy in Perspective (Erlinda M. Medalla)
5 Central Banking in the Philippines: Then, Now and the Future
(Mario B. Lamberte)
6 Financial Services Integration and Consolidated Supervision:
Some Issues to Consider for the Philippines (Melanie R.S. Milo)
7 Infrastructure Development: Experience and Policy Options
for the Future (Gilberto M. Llanto)
8 The Quest for a Better Environment: Past Experiences
and Future Challenges (Danilo C. Israel)
9 Education, Labor Market and Development: A Review of the Trends
and Issues in the Philippines for the Past 25 Years (Aniceto C. Orbeta Jr.)
10 Research and Development and Technology in the Philippines
(Caesar B. Cororaton)
11 Rethinking Institutional Reforms in the Philippine Housing Sector
(Marife M. Ballesteros)
List of Titlesunder the Perspective Paper Series
Photo taken at the Philippine Coconut Research and Development Foundation,Pasig City.