pids 7th annual public policy conference
TRANSCRIPT
Webinar #4Robust and Healthy Workforce
Srinivas Tata, DirectorSocial Development Division, ESCAP
23 September 2021
PIDS 7th Annual Public Policy Conference

Challenge 1
Too many people are trapped in poverty

Asia-Pacific is home to a quarter of the world’s extreme poor
Africa66%
Rest of the World4%
Asia and the Pacific26%
Latin America andthe Caribbean
4%
Share of global population living on less than $1.90 per day, by region
Source: ESCAP elaboration based on PovCalNet, 2018.

Poverty in Asia-Pacific is concentrated in South Asia
Share of global population living on less than $1.90 per day, by subregion
Source: ESCAP elaboration based on PovCalNet, 2018.
South and South-West Asia , 83%
North and Central Asia, 4%
South-East Asia, 10%
East and North-East Asia, 3%
Pacific island developing States, 1%
Challenge 2
Inequalities to basic opportunities remain high

Access to Internet, Philippines
0%
10%
20%
30%
40%
50%
60%
70%
80%
90%
100% Richer individuals with higher education between 15-34 years of age
Rate: 97%
Richer individuals with lower or secondary education between 15-34
years of ageRate: 87%
Richer individuals over 35 years of age
Rate: 66%
Poorer individuals between 15-24 years of ageRate: 68%
Poorer individuals between 25-34 years of ageRate: 40%
Poorer individuals over 35+ years of ageRate: 13%
Source: ESCAP elaboration based on latest DHS Philippines 2017.

Gaps in access to clean fuels, Asia-Pacific
Source: ESCAP elaboration based on DHS and MICS data, latest year.
0
20
40
60
80
100
%
Group access rate (highest) Average access level Group access rate (lowest)

Challenge 3
Labour market informality is a huge barrier

Too many workers are trapped in informal jobs
0
20
40
60
80
100
Ban
glad
esh
Cam
bo
dia
Ind
ia
Lao
PD
R
Pak
ista
n
Nep
al
Ind
on
esia
Mya
nm
ar
Ton
ga
Kyr
gyzs
tan
Tim
or-
Lest
e
Sri L
anka
Vie
t N
am
Thai
lan
d
Mal
div
es
Geo
rgia
Arm
en
ia Fiji
Mo
ngo
lia
Sam
oa
Bru
nei
…
Co
ok
Isla
nd
s
info
rmal
em
plo
yme
nt
as s
har
e o
f to
tal e
mp
loym
en
t (i
n
%)
Total Female

Challenge 4
Investment in people is insufficient
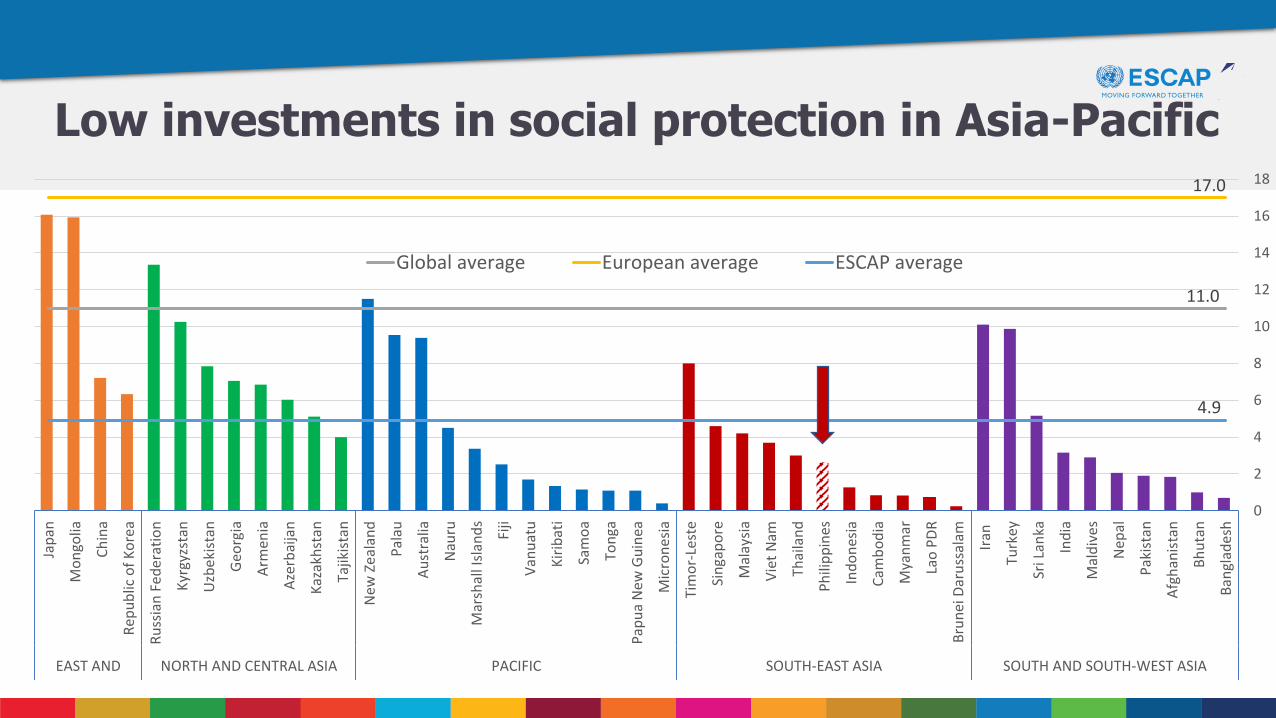
Low investments in social protection in Asia-Pacific
11.0
17.0
4.9
0
2
4
6
8
10
12
14
16
18
Ban
glad
esh
Bh
uta
n
Afg
han
ista
n
Pak
ista
n
Nep
al
Mal
div
es
Ind
ia
Sri L
anka
Turk
ey
Iran
Bru
nei
Dar
uss
alam
Lao
PD
R
Mya
nm
ar
Cam
bo
dia
Ind
on
esia
Ph
ilip
pin
es
Thai
lan
d
Vie
t N
am
Mal
aysi
a
Sin
gap
ore
Tim
or-
Lest
e
Mic
ron
esia
Pap
ua
New
Gu
inea
Ton
ga
Sam
oa
Kir
ibat
i
Van
uat
u
Fiji
Mar
shal
l Isl
and
s
Nau
ru
Au
stra
lia
Pal
au
New
Ze
alan
d
Tajik
ista
n
Kaz
akh
stan
Aze
rbai
jan
Arm
enia
Geo
rgia
Uzb
ekis
tan
Kyr
gyzs
tan
Ru
ssia
n F
eder
atio
n
Rep
ub
lic o
f K
ore
a
Ch
ina
Mo
ngo
lia
Jap
an
SOUTH AND SOUTH-WEST ASIASOUTH-EAST ASIAPACIFICNORTH AND CENTRAL ASIAEAST ANDNORTH-EAST
Global average European average ESCAP average

Less than half of the region’s population is covered by at least one social protection scheme
0
10
20
30
40
50
60
70
80
90
100
Mo
ngo
lia
Kaz
akh
stan
Au
stra
lia
New
Ze
alan
d
Jap
an
Geo
rgia
Ru
ssia
Turk
ey
Ko
rea
Ch
ina
Thai
lan
d
Fiji
Van
uat
u
Arm
enia
Ave
rage
Nau
ru
Kyr
gyz
Rep
ub
lic
Aze
rbai
jan
Vie
tnam
Ph
ilip
pin
es
Sri L
anka
Pal
au
Bru
nei
Dar
uss
alam
Ave
rage
, exc
lud
ing…
Tim
or-
Lest
e
Ban
glad
esh
Ind
on
esia
Isla
mic
Rep
ub
lic o
f…
Mal
aysi
a
Tajik
ista
n
Mar
shal
l Isl
and
s
Ton
ga
Ind
ia
Mal
div
es
Sam
oa
Kir
ibat
i
Mic
ron
esia
Nep
al
Lao
P.D
.R.
Bh
uta
n
Pak
ista
n
Afg
han
ista
n
Mya
nm
ar
Cam
bo
dia
Pap
ua
New
Gu
inea

The harsh wake-up call from the pandemic

The pandemic is aggravating these challenges and ongoing trends
Inequality, poverty and unemployment are increasing
Population ageing, migration and urbanization are on the rise
Technological progress will change labour markets
Disasters and climate change pose disproportionate pressure on vulnerable people
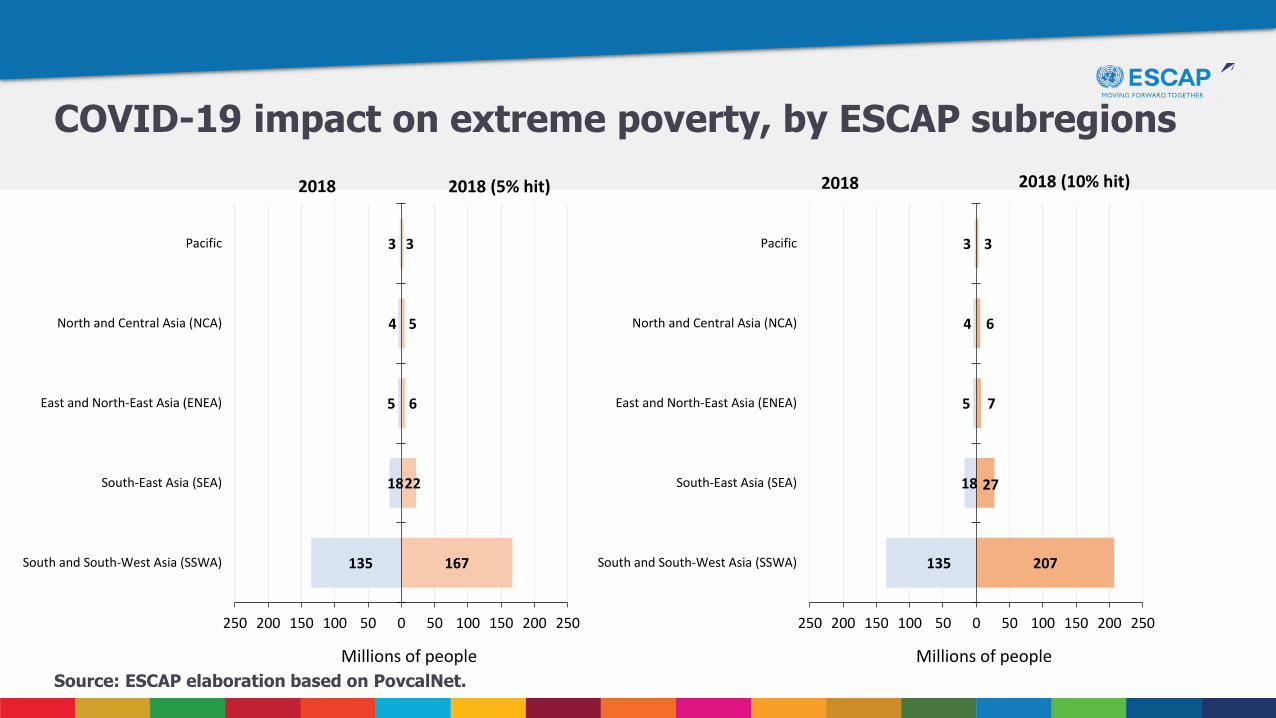
COVID-19 impact on extreme poverty, by ESCAP subregions
135
18
5
4
3
167
22
6
5
3
250 200 150 100 50 0 50 100 150 200 250
South and South-West Asia (SSWA)
South-East Asia (SEA)
East and North-East Asia (ENEA)
North and Central Asia (NCA)
Pacific
Millions of people
2018 2018 (5% hit)
135
18
5
4
3
207
27
7
6
3
250 200 150 100 50 0 50 100 150 200 250
South and South-West Asia (SSWA)
South-East Asia (SEA)
East and North-East Asia (ENEA)
North and Central Asia (NCA)
Pacific
Millions of people
2018 2018 (10% hit)
Source: ESCAP elaboration based on PovcalNet.

Estimated reduction in poverty for households receiving a universal child benefit, Mongolia, at $3.2
7.2
4.7
2.9
0.4
0.0
1.0
2.0
3.0
4.0
5.0
6.0
7.0
8.0
0 20,000 40,000 100,000
Po
vert
y R
ate
(%
)
Benefit Level (MNT)

What’s the price of a basic social protection package?
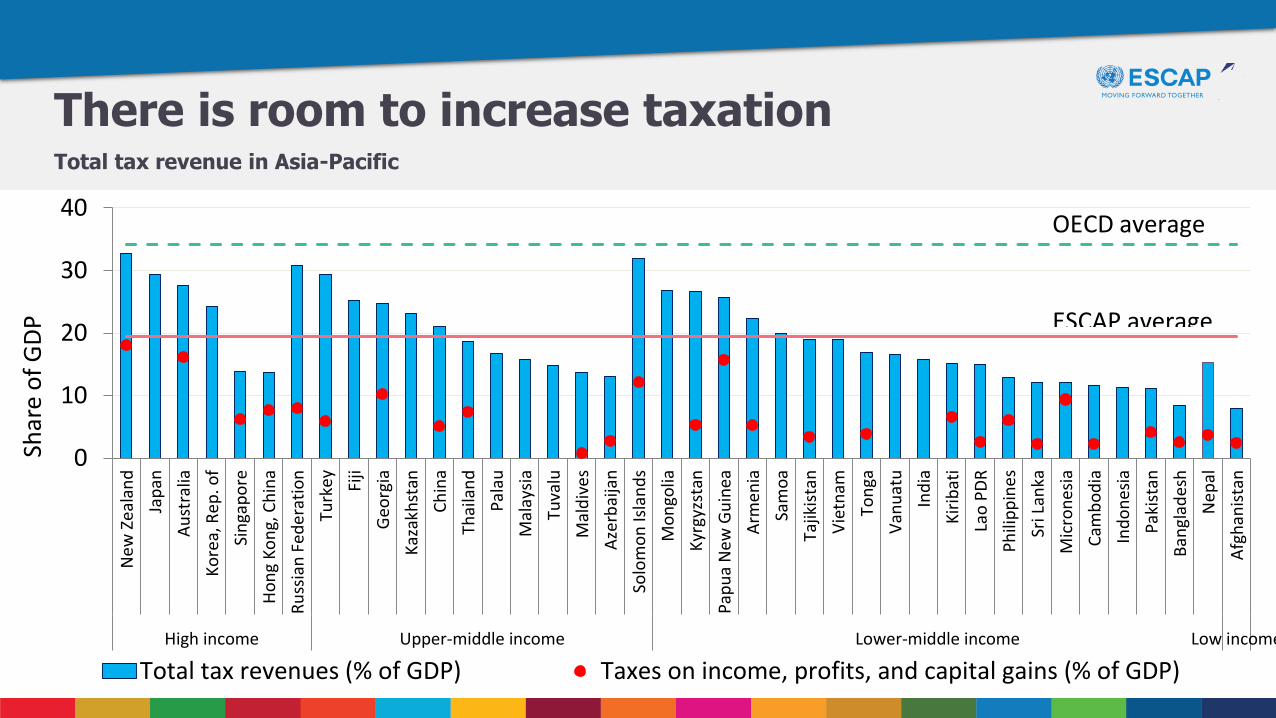
There is room to increase taxationTotal tax revenue in Asia-Pacific
0
10
20
30
40
New
Zea
lan
d
Jap
an
Au
stra
lia
Ko
rea,
Rep
. of
Sin
gap
ore
Ho
ng
Ko
ng,
Ch
ina
Ru
ssia
n F
eder
atio
n
Turk
ey Fiji
Geo
rgia
Kaz
akh
stan
Ch
ina
Thai
lan
d
Pal
au
Mal
aysi
a
Tuva
lu
Mal
div
es
Aze
rbai
jan
Solo
mo
n Is
lan
ds
Mo
ngo
lia
Kyr
gyzs
tan
Pap
ua
New
Gu
inea
Arm
enia
Sam
oa
Tajik
ista
n
Vie
tnam
Ton
ga
Van
uat
u
Ind
ia
Kir
ibat
i
Lao
PD
R
Ph
ilip
pin
es
Sri L
anka
Mic
ron
esia
Cam
bo
dia
Ind
on
esia
Pak
ista
n
Ban
glad
esh
Nep
al
Afg
han
ista
n
High income Upper-middle income Lower-middle income Low income
Shar
e o
f G
DP
Total tax revenues (% of GDP) Taxes on income, profits, and capital gains (% of GDP)
ESCAP average
OECD average

What could countries do to build back better?

Recommendations
• Embed social protection in national development agendas
• Allocate more resources
• Build universal social protection systems
• Provide adequate social protection to women
• Expand social protection to informal workers
• Cover the ”missing middle”
• Improve efficiency by using emerging technologies
The importance of technologies for social protection
Facilitates identification and registration
Improve integration of schemes
Reduce risks of errors
Increase efficiency


THANK YOU !
Follow us
www.unescap.org unitednationescap
unitednationescap
unescap
unescap unescap