development of process to manufacture glass/glass-ceramic products from...
TRANSCRIPT


DEVELOPMENT OF PROCESS TO MANUFACTURE GLASS/GLASS-CERAMIC PRODUCTS FROM PHOSPHOGYPSUM
FINAL REPORT
Chris Chapman, Bogdan Wojak, and Richard Peters Principal Investigators
with
P.K. Bhattacharjee
VITRIFICATION INTERNATIONAL TECHNOLOGIES INC. 414 Sailfish Ct.
Richland, Washington 99354
Prepared for
FLORIDA INSTITUTE OF PHOSPHATE RESEARCH 1855 West Main Street
Bartow, Florida 33830 USA
Contract Manager: G. Michael Lloyd, Jr. FIPR Project Number: 98-01-153
April 2006

DISCLAIMER
The contents of this report are reproduced herein as received from the contractor. The report may have been edited as to format in conformance with the FIPR Style Manual. The opinions, findings and conclusions expressed herein are not necessarily those of the Florida Institute of Phosphate Research, nor does mention of company names or products constitute endorsement by the Florida Institute of Phosphate Research. © 2006, Florida Institute of Phosphate Research.
iii
PERSPECTIVE Using phosphogypsum as a raw material for the production of glass/ceramic type materials has much merit. Ceramic materials made from phosphogypsum have almost no radon emissions and reduced radiation of all kinds, making them well suited for use as building materials. The original concept of charging phosphogypsum directly to the glass furnace meant that the sulfur dioxide emissions would have to be recovered as sulfuric acid or some other product. In order to avoid these problems, it was decided to investigate the application of older proven technology to convert the phosphogypsum to calcium carbonate to be used in the glass furnace and in other sulfur-containing materials. Wet chemical conversion of phosphogypsum to calcium carbonate opens the door to a number of processing alternatives that offer opportunities to produce a wide variety of secondary products. G. Michael Lloyd, Jr. Research Director, Chemical Processing

v
ABSTRACT About 30 million tons of phosphogypsum are being placed on piles or gyp stacks each year. It has been proposed that this phosphogypsum and tailings sand, also associated with the phosphate mining operations, be used to produce high value glass or glass-ceramics products while returning the sulfuric acid back to the mining operations. Phase one successfully demonstrated feasibility of making glass from these materials. The second phase researched the marketing of a product made from these materials and completed an initial risk assessment. Glass-ceramics made with high concentrations of calcia or gypsum appear attractive for making a variety of products that are strong, abrasion and corrosion resistant. Wall, floor and roof tile were selected as the target products. The method for identifying and selecting the product was reported. A preliminary risk assessment indicated that radon exposure attributable to these tile are much lower than for other construction materials. Annual gamma dose from maximal use of tile, all floors and roof, and conservatively exposure times was less than 50 mrem/yr. With a more realistic tile use, limited to the kitchen, bathroom and entry way, the estimated exposures were less than 10 mrem/yr. This compares favorably with the average United States annual dose from all sources of about 360 mrem/yr. This final phase completed a conceptual design and cost estimate after selecting the preferred unit operations for a specific plant site. Laboratory scale confirmation of the product and general process was used to confirm the feasibility of the preferred approach and to make representative samples. A significant effort was expended on determining the preferred process. Many alternatives were considered. The decision made was made to transform the phosphogypsum into calcium carbonate using an aqueous process and produce sodium sulfate. Sodium sulfate could then be used as a marketable product or be used as a feed material to produce other products. The calcium carbonate resulting from the aqueous process together with the other insolubles found in phosphogypsum was to be used as a feedstock to a ceramic tile manufacturing process. Laboratory tests were used to assess the feasibility of the aqueous process and the ceramic tile process. Both sets of laboratory experiments yielded positive results. Subsequent to these laboratory confirmations, capital and operating cost estimates for the respective facilities were completed and are reported.

vi
ACKNOWLEDGMENTS We would like to thank Dr. G. Michael Lloyd of the Florida Institute of Phosphate Research for his knowledgeable and experienced responses to our inquiries.

vii
TABLE OF CONTENTS PERSPECTIVE.................................................................................................................. iii ABSTRACT.........................................................................................................................v ACKNOWLEDGMENTS ................................................................................................. vi EXECUTIVE SUMMARY .................................................................................................1 INTRODUCTION AND BACKGROUND ........................................................................3 METHODOLOGY AND APPROACH ..............................................................................5 Identification of PCS Phosphate Corporation’s Constraints, Opportunities and Compatibility with Process Alternatives ............................................................5 Land Leasing Covenants and Other Requirements......................................5 Location ...........................................................................................5 Land Use Constraints.......................................................................6 Utilities, Availability, Costs and Characteristics .........................................6 Water................................................................................................6 Electric Power..................................................................................6 Natural Gas or Coal .........................................................................6 Transportation ..............................................................................................7 Waterways........................................................................................7 Rail...................................................................................................7 Road .................................................................................................7 Effluent and Environmental Constraints......................................................7 Permitting.....................................................................................................7 Non-Disclosure Agreements, Requirements................................................7 Summary ......................................................................................................8 Alternatives for Transforming Phosphogypsum into Products................................8 Flue Gas SO2 Conversion to Sulfuric Acid.................................................9 Scrubbing with Lime....................................................................................9 Flue Gas SO2 Capture and Purification.....................................................10 Flue Gas SO2 Conversion to Magnesium Sulfate .....................................11 Flue Gas SO2 Conversion to Ammonium Sulfate.....................................12

viii
TABLE OF CONTENTS (CONT.) Aqueous Conversion of Gypsum to Inorganic Products........................................14 Ammonium Sulfate Using Ammonium Carbonate....................................14 Conversion to Potassium Sulfate Using Potassium Carbonate..................16 Conversion to Potassium Sulfate Using Potassium Chloride ....................16 Conversion to Sodium Sulfate Using Sodium Carbonate..........................17 Selection of Pretreatment Option...............................................................17 Bench-/Pilot-Scale Testing of Aqueous Process....................................................18 Estimated Costs for Aqueous Processing Facility .................................................21 Phosphogypsum Aqueous Conversion Mass Balance ...............................21 Simplified Process Flow Diagrams............................................................22 Equipment Cost and Capital Investment Estimate.....................................24 Phosphogypsum Conversion Operating Cost Estimate .........................................27 Selection of Ceramic Processing Preference .........................................................28 Ceramic Tile Production: Process and Equipment Description............................30 Production Cycle for Single-Fired Glazed Tile .....................................................34 Preparation of Raw Materials ....................................................................35 Spray-Drying..............................................................................................37 Pressing......................................................................................................38 Powder Loading .............................................................................39 First Pressing..................................................................................41 Deaeration ......................................................................................41 Second Pressing .............................................................................41 Tile Extraction ...............................................................................42 Drying ........................................................................................................42 Glazing.......................................................................................................43 Application of Uniform Layers......................................................43 Glaze Fall Application ...................................................................43 Firing..........................................................................................................44 Roller Kilns for Firing Floor and Wall Tiles .................................44 Rollers ............................................................................................47 The Kiln .........................................................................................47 The Combustion System................................................................47 The Sorting and Packaging Line................................................................47

ix
TABLE OF CONTENTS (CONT.) Laboratory Selection of Products and Product-Forming Technologies.................48 Testing, Assessment, and Selection of Promising Compositions and Heat Treatments .............................................................................49 Ceramic Slip...................................................................................49 Dry Powder Mixing, Pressing and Firing ......................................51 Estimated Turnkey Capital Cost ............................................................................55 Utilities.......................................................................................................57 Capital and Operating Cost for a Large Ceramic Tile Manufacturing Plant ......................................................................................................58 CONCLUSIONS AND RECOMMENDATIONS ............................................................61 REFERENCES ..................................................................................................................63

xi
LIST OF FIGURES Figure Page 1. Cansolv Technology ........................................................................................10 2. Flow Diagram for SO2 Capture and Conversion to MgSO4 ............................12 3. SO2 Flue Gas Conversion to Ammonium Sulfate............................................13 4. Diagram for Conversion of Gypsum to Ammonium Sulfate...........................15 5. Beaker Test Arrangement ................................................................................20 6. Conversion Material Balance (500 TPD) ........................................................21 7. Simplified Block Flow Diagram......................................................................22 8. Process Flow Diagram – Materials Balance (500 TPD)..................................23 9. Process Flow Diagram – Water Balance (500 TPD) .......................................24 10. Schematic of Alternatives Considered.............................................................29 11. Block Diagram of the Ceramic Tile Process....................................................31 12. Pictorial Process Flow Diagram for the Ceramic Tile Process........................32 13. Pictorial Process Flow Diagram for the Ceramic Tile Process, Isometric.......33 14. Photograph of a Large Ceramic Tile Manufacturing Facility..........................34 15. Schematic and Pictorial Representation of the Raw Materials Preparation Steps............................................................................................................35 16. Drum-Ball Mill ................................................................................................36 17. Working Principle of the Spray-Dryer.............................................................38 18. Schematic of Granulate Input Cycle to the Press.............................................40 19a. Schematic Representation of Press Body Dryer ..............................................42 19b. Pictorial Representation of Press Body Dryer .................................................43

xii
LIST OF FIGURES (CONT.) Figure Page 20. The Glaze Cycle with Bell Application ...........................................................44 21a. Schematic of a Ceramic Roller Firing Kiln .....................................................45 21b. Pictorial Representation of a Ceramic Roller Firing Kiln ...............................46 22. Schematic of an Automatic Sorting Line.........................................................48 23. Trials Using Slurry Mixing, Drying, and Firing..............................................50 24. Samples of Dry-Mixed, Pressed, and Fired Buttons of Pretreated Phosphogypsum, Silica, and Additives.......................................................52 25. Sample Buttons Made During April 16 and 25, 2004 .....................................53 26. Ramp Soak Thermal Schedule Used for Test Buttons.....................................54 27. Correlation of Ceramic Test Plant Capital Cost with Capacity .......................56

xiii
LIST OF TABLES Table Page 1. Capital Investment Estimate ............................................................................25 2. Phosphogypsum Conversion Process TIC Estimate – (t 30%) Date 5/11/04................................................................................................26 3. Estimated Operating Costs for 500 TPD PG Conversion Plant.......................27 4. Compositions Identified for Pilot Testing........................................................49 5. Chemical Composition of Dry Powder Mixed, Pressed and Fired Buttons Shown in Figure 24.....................................................................................51 6. Composition of Substrate for Buttons Shown in Figure 25.............................53 7. Ceramic Tile Capital Cost Investment and Plant Capacity..............................55 8. Utilities Consumption per Square Foot of Ceramic Tile .................................57 9. Normalized Material Consumption..................................................................57 10. Ceramic Tile Production Costs ........................................................................58 11. Estimated Costs and Consumption for a 100,000,000 Ft.² Ceramic Tile Plant ............................................................................................................59

1
EXECUTIVE SUMMARY About 30 million tons of phosphogypsum are being placed on piles, or gyp stacks, each year. Some productive use for this potential resource would be desirable. It has been proposed that this phosphogypsum and tailings sand associated with the phosphate mining operations, be used to produce high value glass or glass-ceramics products while returning the sulfur back to the chemical operations or discover some other productive use. Phase one successfully demonstrated the feasibility of making glass from these materials. The second phase researched the market for a glass or glass–ceramic product made from these otherwise waste materials and completed an initial risk assessment. Glass-ceramics made with high concentrations of calcia or gypsum appeared attractive for making a variety of materials that resulted in strong, abrasion and corrosion resistant products. Wall, floor and roof tile were selected as the target products. The method for identifying and selecting the products has been reported (Chapman 1999). A preliminary risk assessment indicated that radon exposure attributable to these tile are lower than for other construction materials. Annual gamma dose from maximal use of tile, all floors and roof, and conservative exposure times was less than 50 mrem/yr. With a more realistic tile use, limited to the kitchen, bathroom and entry way, the estimated exposures were less than 10 mrem/yr. This compares favorably with the average United States annual dose from all sources of about 360 mrem/yr. This phase of the research was to complete a conceptual design and cost estimate after selecting the preferred unit operations for a specific plant site. Laboratory scale confirmation of the product and the general process was used to confirm the feasibility of the preferred approach and to make representative samples. A significant effort was expended on determining the preferred process. Many alternatives were considered. The decision made was made to transform the phosphogypsum into calcium carbonate using an aqueous process and produce sodium sulfate. Sodium sulfate could then be used as a marketable product or be used as a feed material to produce some other products. One promising use of the sodium sulfate using cyclic sub processes ultimately yields elemental sulfur and hydrogen. If this approach is realized the sulfur can replace the current purchase of sulfur and be used directly in the phosphate chemical process. Hydrogen has many applications ranging from energy production, transportation and for the manufacturing of other products such as ammonia. The calcium carbonate resulting from the aqueous process together with the other insolubles found in phosphogypsum was to be used as a feedstock to a ceramic tile manufacturing process. Laboratory tests were used to assess the feasibility of the selected aqueous process and the ceramic tile process. Both sets of laboratory experiments yielded positive results. The results of these laboratory tests are reported. After repeated laboratory tests, the aqueous pretreatment laboratory experiments indicated the technology is reliable and ready for commercial use. The laboratory scale

2
test runs achieved maximum conversion efficiency (99%) as well as higher filtration efficiency by utilizing a continuous stirred tank reactor that develops well defined crystals with a suitable size distribution. This, in effect results in calcium carbonate cake samples with a moisture content of 23% without any washing and a solids-free, clear sodium sulfate filtrate. The filtrate samples had a concentration of 19 – 20% Na2SO4 by weight. Sodium sulfate can be obtained in higher concentration or solid form by separating the precipitated calcium carbonate in a thickener, filter, centrifuge, or other known separations device. The sodium sulfate liquor could then be evaporated to crystallize out sodium sulfate. Without washing the filtered cake, x-ray diffraction analyses indicated the chemical composition of the cake to be approximately 50% CaCO3, 30% acid insolubles (silica), about 15% Na2SO4, and 5% other insoluble impurities. Residual phosphogypsum was 3 of the 5% other insoluble impurities. Subsequent to these laboratory confirmations, capital and operating cost estimates for the respective facilities were developed and are reported. For a plant that would convert 500 tons of phosphogypsum into sodium sulfate and calcium carbonate, the capital cost was estimated to be $20 million. The annual operating costs were estimated to be $14.1 million per year. The unit cost for the conversion was estimated to be about $83 per ton of phosphogypsum. For a ceramic tile manufacturing plant that makes 100,000,000 ft.² of tile per year and uses the calcium carbonate from the pretreated phosphogypsum, the capital cost was estimated to be $67 million with an annual operating cost estimated to be $111.7 million. With additional development work that exploits and optimizes the use of sodium sulfate or products derived from sodium sulfate, the integrated conversion of phosphogypsum to useful products should be a profitable use of materials that would otherwise be waste.

3
INTRODUCTION AND BACKGROUND About 30 million tons of phosphogypsum are being placed on piles, or gyp stacks, each year. Some productive use for this potential resource would be desirable. It has been proposed that this phosphogypsum and tailings sand associated with the phosphate mining operations, be used to produce high value glass or glass-ceramics products while returning the sulfur back to the chemical operations or discover some other productive use. Phase one successfully demonstrated the feasibility of making glass from these materials. The second phase researched the market for a glass or glass–ceramic product made from these otherwise waste materials and completed an initial risk assessment. Glass-ceramics made with high concentrations of calcia or gypsum appeared attractive for making a variety of materials that resulted in strong, abrasion and corrosion resistant products. Wall, floor and roof tile were selected as the target products. The method for identifying and selecting the products has been reported (Chapman 1999). A preliminary risk assessment indicated that radon exposure attributable to these tile are lower than for other construction materials. Annual gamma dose from maximal use of tile, all floors and roof, and conservative exposure times was less than 50 mrem/yr. With a more realistic tile use, limited to the kitchen, bathroom and entry way, the estimated exposures were less than 10 mrem/yr. This compares favorably with the average United States annual dose from all sources of about 360 mrem/yr. This current report is the final stage of the research for converting phosphogypsum into profitable and marketable materials. The contents of this report include a review of alternatives for pretreating the phosphogypsum, if any, prior to introduction into a ceramic manufacturing facility. Based on the output of any pretreatment of the phosphogypsum, alternatives for the ceramic manufacturing facility unit operations were examined and the preferred alternatives were selected. Next the feasibility of the selected process for pretreatment and the ceramic manufacturing process were verified in laboratory experiments. The results of these experiments are presented. Finally, capital and operating cost estimates were completed and reported. To select the pretreatment product and operations investigation of the various product values and processing complexity of the unit operations were completed using conventional literature and patent reviews. Cost estimates were determined through review of available information in the literature and from vendors. A number of alternatives for converting phosphogypsum (PG) into useful products were identified. This work is a follow-on to earlier tasks by VIT Inc that showed it is possible to utilize the calcium in PG for manufacture of glass/ceramic products. The economic incentives for PG processing that were identified in earlier studies are (1) the availability of PG and tailings sand as raw materials for essentially no cost, (2) opportunity to manufacture a high-value glass-ceramic product near the consuming market, (3) opportunity to recover the sulfur as a marketable by-product and, (4) opportunities for cooperation and use of existing infrastructure (roads, rail, utilities ties, etc.) with phosphate fertilizer manufacturer(s) in Florida.
5
METHODOLOGY AND APPROACH Alternatives for processing of phosphogypsum in two useful and profitable products were conceptualized. This was followed by literature and patent searches that would support the potential feasibility of the conceptual process. After the unit operations and resulting products were identified, the feasibility of the approaches were verified in laboratory tests. Once the feasibility was demonstrated in laboratory tests, capital and operating cost estimates were made for the aqueous conversion of phosphogypsum to sodium sulfate and the use of calcium carbonate were completed. IDENTIFICATION OF PCS PHOSPHATE CORPORATION’S CONSTRAINTS, OPPORTUNITIES AND COMPATIBILITY WITH PROCESS ALTERNATIVES To assure that a selection of a preferred overall process for transforming phosphogypsum into products, incorporation of constraints by the interfacing phosphate mining company must be included as a fundamental design criteria. To this end the following factors were discussed with a potential hosting corporation. The process that is selected must be compatible with the constraints of the owner’s operations and their requirements. This subtask was completed to establish a communications link with owner to discover the constraints and potential opportunities at their site. At a minimum there are environmental and Corporate standards that must be known and reflected in the selected designs. This task was completed to identify and define these general design requirements. Many of the requirements and agreements are embodied in a letter of understanding between the parties and are business sensitive / proprietary. Thus, they can not be disclosed. Land Leasing Covenants and Other Requirements Sale of land to the operators of a phosphogypsum to products plant by the owner is unlikely and perhaps inappropriate because it is in the middle of owner’s property, but it is not precluded. However, the functional equivalent, a long-term lease, can be adequately agreed that protects both parties. Because this land is on a mine site, not on a chemical plant site, there are few limitations. Greater specifics will be negotiated in good faith. No leasing or use constraints were identified during discussions that represent special design or business requirements. Location Three of the owner’s major facilities are within a 6-kilometer (4-mile) radius and comprise most of the owner's operations. The proposed plant site is located on a mining

6
site at a facility for rock beneficiating. This facility is not currently in use. There are roads, concrete paving, all utilities, a rail line and all essential infrastructure for the pretreatment and ceramic processing of phosphogypsum (PG). The PG can be delivered as a slurry by pipe, as solid by a belt conveyor or by trucks using the owner’s (not public) roads. For the reference design approach, trucking of the PG to an interim storage facility at the new plant will be assumed. The tailing sand will also be delivered by trucks. Land Use Constraints The processes to be used in the manufacture of products from phosphogypsum should not include interactions with the existing plant nor its operations, except ties to existing utilities. Both the existing plant and the new ceramic processing plant will be capable of operating autonomously. Thus, if one or the other facility halts operations for any reason, it does not have direct impact upon the others production schedule nor activities. Once the PG is delivered to the sulfur recovery-ceramic processing plant, no land disposal of by-products are allowed, except for interim storage of the products. The products must be shipped and used off site. Utilities, Availability, Costs and Characteristics All necessary utilities are available for the PG sulfur recovery and vitrification operations. Water Depending upon the minimum purity requirements, processing water can be obtained from the plant (slightly corrosive or non-corrosive). More pure water can be obtained from the owner’s deep wells or by drilling a deep well for the phosphogypsum conversion plant. Electric Power Power is available at the site with a nominal cost of ~ $52/MKWH. Natural Gas or Coal Natural gas is available at the site with a nominal cost of between $3-7/MCF (circa 2002).

7
If it is advantageous, coal can be shipped via truck or rail to the site at prevailing costs. Transportation Waterways Export shipments from White Springs are loaded at the PCS Phosphate terminal at Jacksonville, FL. Rail White Springs is serviced by the Norfolk Southern railroad directly, and by the CSX railroad via a PCS- owned rail-truck transload facility in Lake City, FL, about 45 km (28 miles) away by truck. Road All types of trucks meeting DOT regulations are accommodated, 24 hours a day, seven days a week. Trucks can be loaded with either liquid or dry product. Effluent and Environmental Constraints Use of PG is assumed to be achieved through exemption or be used as with the regulations defined by fertilizer applications for PG. The planned conversion process (tile manufacture), is similar to the publicly available environmental permit issued to the Lakeland Ceramic Tile Manufacturing Facility, these requirements are explained in this revised permit but will not be summarized here. Permitting No unusual permitting requirements were identified. Following the OSPREY (One Stop Permit Registry System at (http://tlhora6.dep.state.fl.us/oraosprey/ ) and the associated requirements, the requirements for permitting are defined. Non-Disclosure Agreements, Requirements A non disclosure agreement between the parties was agreed upon and signed.
8
For subsequent activities of this project, the material properties for PG and tailing sand found in the report by Chang and Mantell (Chang and Mantell 1990) will be used. Site specific materials characteristics will be obtained from the specific site if this is required. Summary The infrastructure and capacities for this site are quite attractive for placement of a new manufacturing facility. No unusual, unanticipated nor unrealistic constraints on the design and selection of the phosphogypsum to products facility were identified. ALTERNATIVES FOR TRANSFORMING PHOSPHOGYPSUM INTO PRODUCTS This section identifies all credible process alternatives that might be appropriate for transforming PG into useful glass – ceramic products. The preferred alternatives were based upon qualitative assessments of the costs, simplicity of the approaches and constraints obtained from a future potential phosphate mining company with which we would team. Laboratory confirmation of the selected alternative was part of the final confirmation. The initial concept that appeared to have cost advantages for this ceramic manufacturing process was to link the effluent to an existing sulfuric acid production facility. It was believed that this arrangement could be attractive to the sulfuric acid producer by adding more sulfuric acid in their production while the ceramic manufacturing process could avoid a significant capital investment for the flue gas cleanup. After discussions with the sulfuric acid manufacturing facilities, it was discovered that this approach would not be acceptable primarily due to the complexity of coordinating the two operations without adversely impacting the operational efficiency of the other. For example, should the sulfuric acid plant halt operations for any reason the ceramic processing facility would by necessity need to halt operations. In view of this constraint the obvious alternative was to construct a sulfuric acid manufacturing plant to the ceramic manufacturing facility and produce both ceramic products and sulfuric acid that could be sold to the phosphate mining industry. Discussions with the phosphate industry, survey of chemical process literature, patent searches, and internet searches revealed four credible options for sulfur recovery. These are: (1) capture of SO2 in flue gas from thermal process with conversion to sulfuric acid, (2) capture of SO2 from flue gas and purification to yield SO2 chemical product, (3) capture of SO2 in flue gas and scrubbing with ammonia to produce ammonium sulfate, and (4) wet chemical conversion of gypsum to ammonium sulfate and calcium carbonate using ammonium carbonate. The first three options involve feeding gypsum to a thermal process with decomposition to SO2 and a solid phase that would be used for

9
glass/ceramic production. For the purposes of this segment of the report, the glass/ceramic process (GCP) is unspecified, only that it yields a flue gas with SO2 and fossil-fuel combustion gases. In the fourth option, the gypsum is desulfurized and the feedstock to the thermal process is calcium carbonate. These options are described and evaluated in the following sections. Flue Gas SO2 Conversion to Sulfuric Acid The glass-ceramic process that uses gypsum as a feed material will yield a flue gas containing SO2. It is possible for some of the sulfur to oxidize up to SO3 depending on process conditions, however for the purposes of this study, it is assumed that the predominant form is SO2. To produce sulfuric acid requires conversion of the SO2 to SO3. Once in this state, the SO3 is absorbed by water to yield H2SO4. Industrial production of sulfuric acid typically occurs by burning sulfur. Older installations used a single absorption process which exhausted a stack gas with a significant loading of SO2. To meet more stringent air pollution constraints, many older facilities have been fitted with tail gas clean-up units such as ammonia absorption or some other SO2 abatement technology. Newer sulfuric acid plants utilize a double-absorption process. These can achieve SO2 stack emissions to the required limit of 2 kg/ metric ton of 100% acid. Two suppliers of this technology are Monsanto Enviro-Chem and Haldor Topsoe. One possible deployment of this process would be in conjunction with an existing phosphate plant which includes a sulfuric acid process. The flue gas from the glass-ceramic process could, in theory, be diverted to the existing sulfuric acid operation thus avoiding the cost of a dedicated, stand-alone process. One problem with this approach is that the flue gas would contain water from gypsum’s hydration water and from fossil fuel combustion. Sulfuric acid processes are challenged by wet gas because of mist generation and corrosion problems. The flue gas could require drying and if a gas drying operation does not exist at the site then this would need to be installed for the GCP. If there is no available sulfuric acid plant, then the glass-ceramic process would require a stand-alone gas treatment. There are three alternatives: (1) a single absorption process with tail gas SO2 abatement and glass-ceramic process flue gas drying, (2) a double-absorption process with glass-ceramic process flue gas drying, or (3) a wet gas catalysis process. Between options 1 and 2, it would seem that 2 is preferred because the double-absorption approach has been the trend for large-scale sulfuric acid production over the last decade. Option 3 appears to be least complicated because it does not require flue gas drying. Scrubbing with Lime Lime scrubbing is the cheapest way to capture SO2. Slaked lime, Ca(OH)2, can be purchased for about $55/ton. Scrubbing with slaked lime yields a byproduct of gypsum. The difference between this and phosphogypsum is that the scrubber byproduct

10
gypsum would be free of radium and theoretically not subject to EPA impoundment. It has low commercial value, however, with a price of about $7/ton according to US Government statistics. If lime were purchased and were converted into gypsum via SO2 scrubbing, there would be a gross material loss of about $17 for every ton of scrubber-derived gypsum sold. Thus, this conventional approach is not attractive Flue Gas SO2 Capture and Purification The SO2 in the glass-ceramic process flue gas can be recovered and sold as a purified material. Cansolv of Montreal, Canada markets an absorption system by that name that can accept SO2-laden gas with concentrations ranging from trace contamination up to 100% SO2. It is also able to use wet gas feed. The technology is described in Figure 1.
Source: http://www.cansolv.com. Figure 1. Cansolv Technology.

11
The process, as described at the Cansolv website (www.cansolv.com) is:
1. The prescrubber cools, saturates and removes particulates from the feed gas with a water spray, if required.
2. SO2 is removed from the feed in a countercurrent absorber by the CANSOLV® System absorbent.
3. SO2 is recovered from the rich absorbent in a steam heated regenerator as a pure, water saturated gas. The byproduct SO2 can be used as such or converted to sulfur or sulfuric acid in conventional process units.
4. A small slipstream of absorbent is purified by patented technology to prevent accumulation of impurities.
The major advantage of this process is its ability to use wet gas, which is generated by the GCP. A possible disadvantage is that the SO2 product is not directly usable in phosphate plants as would be sulfuric acid. It would require further conversion to sulfuric acid and in this case it would be more efficient to use a sulfuric acid process in the first place. Therefore, for Cansolv process to be effective, it is necessary to find markets for the SO2. Assuming the glass-ceramic process is not co-located with the SO2 user, then it would be necessary to compress and store the SO2 as a liquid, then ship it to users. The capital cost for such equipment may be prohibitive. Also there are significant safety issues associated with storing and shipping SO2. Thus, this alternative does not appear to be of interest. Flue Gas SO2 Conversion to Magnesium Sulfate This process is shown in Figure 2. SO2 gas is collected using a Mg(OH)2 slurry in an absorption tower. Oxidation yields magnesium sulfate. The following reactions take place: (1) Mg(OH)2 + SO2 -> MgSO3 + H2O (2) MgSO3 + SO2 + H2O -> Mg(HSO3)2 (3) Mg(HSO3)2 + Mg(OH)2 -> 2 MgSO3 + H2O (4) MgSO3 + (1/2)O2 -> MgSO4

12
Figure 2. Flow Diagram for SO2 Capture and Conversion to MgSO4. For typical FGD applications, this process has advantages over lime scrubbing in that the final product of MgSO4 is soluble thus preventing some solids accumulation problems. The scrubbing agent, Mg(OH)2 is also cheaper than caustic. The price for Mg(OH)2 is about $210/ton and the price for MgSO4-7H2O is 360 $/ton. In principle, magnesium hydroxide could be purchased and converted into epsom salt with a gross revenue of about $300/ton of epsom salt sold. However this could not be deployed on a massive scale because the U.S. consumption of epsom salt is low, being about 50,000 tons per year (tpa). Flue Gas SO2 Conversion to Ammonium Sulfate In this process, SO2 generated by the glass-ceramic process is captured from the flue gas using ammonia solutions and converted into ammonium sulfate, a useful agricultural product. There is at least one firm, Marsulex, that sells systems for this, however the application is flue gas desulfurization for coal-fired power plants. Several patents were found that also describe the process and are aimed at power plant application because this is the dominant source of SO2 pollution. The difference between power plants and the phosphogypsum glass-ceramic process is flue gas volume and SO2 concentration. The Marsulex FGD systems, for example, are applied to fossil fuel fired generating stations with large gas volumes (>500,000 acfm) and with SO2 concentrations in the range of 1,000 to 4,000 ppm of SO2. The envisioned glass-ceramic process would be 50,000 to 100,000 acfm with SO2 concentrations in excess of 100,000 ppm. Conversation with a Marsulex representative

13
indicated that they are uncomfortable with this change in conditions and would likely be unwilling to warrant their process. Nonetheless, it should still be technically feasible to accomplish SO2 removal under the conditions of the glass-ceramic process because the fundamental reactions are the same. The process is simple, being a gas contacting column (such as a packed bed) with flue gas running counter-current to a scrub liquor consisting of ammonia water. The SO2 is absorbed by the solution to yield ammonium sulfite. A slip of this circulating liquor is taken off and contacted with oxygen in a second step to produce ammonium sulfate. This solution must then be evaporated in order to recover crystals of ammonium sulfate. Recent patents issued to Lurgi (Risse and Ferro 2000), a German company and Marsulex (Brown and Mengel 2001) offer refinements to the technology. In the Lurgi patent, a portion of the ammonium sulfate produced in the oxidation step is recycled back to the SO2 absorber to enhance efficiency and minimize aerosol formation. In the Marsulex patent, ammonia slip is minimized by controlling the levels of ammonium sulfate in the scrub solution. The ammonium sulfate process is the major competitor to the sulfuric acid process in this evaluation. The ammonium sulfate process would appear to be simpler and involving fewer steps. However, in order to sell the ammonium sulfate to the broadest possible market, it needs to be recovered from a solution and packaged as a dry, granulated material. This requires drying and solids-handling equipment which is more expensive than liquid handling as in the case of sulfuric acid production.
Figure 3. SO2 Flue Gas Conversion to Ammonium Sulfate.
14
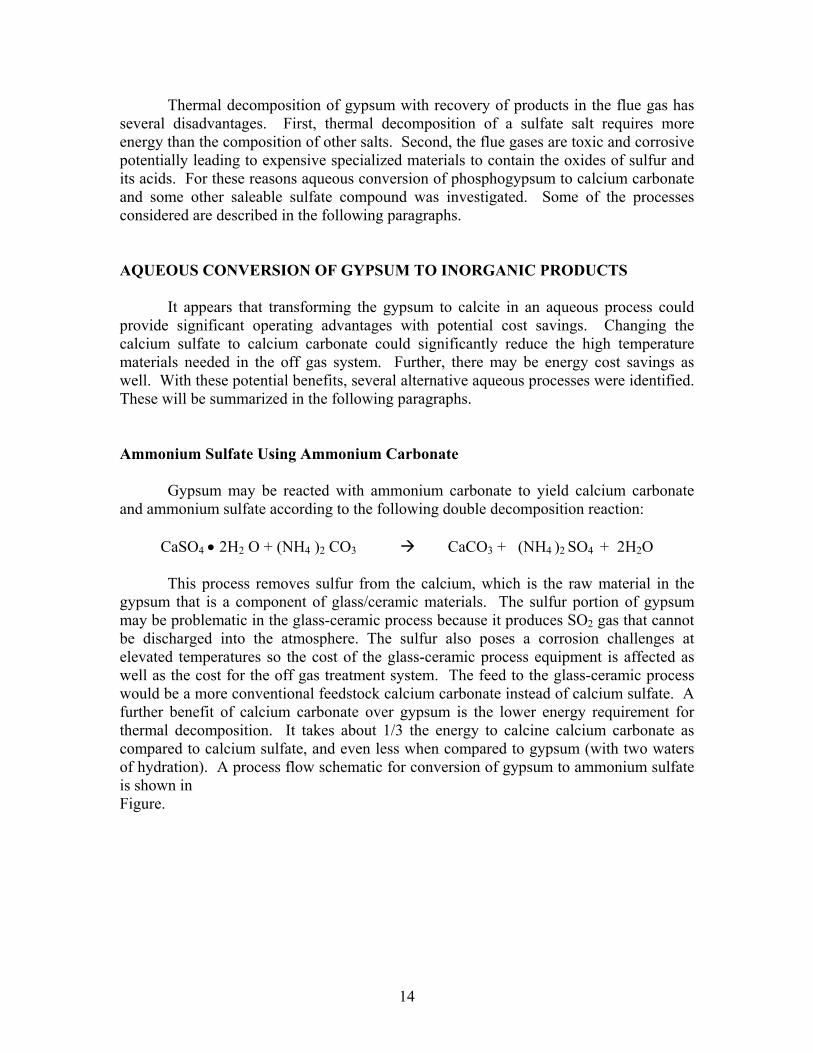
Thermal decomposition of gypsum with recovery of products in the flue gas has several disadvantages. First, thermal decomposition of a sulfate salt requires more energy than the composition of other salts. Second, the flue gases are toxic and corrosive potentially leading to expensive specialized materials to contain the oxides of sulfur and its acids. For these reasons aqueous conversion of phosphogypsum to calcium carbonate and some other saleable sulfate compound was investigated. Some of the processes considered are described in the following paragraphs. AQUEOUS CONVERSION OF GYPSUM TO INORGANIC PRODUCTS It appears that transforming the gypsum to calcite in an aqueous process could provide significant operating advantages with potential cost savings. Changing the calcium sulfate to calcium carbonate could significantly reduce the high temperature materials needed in the off gas system. Further, there may be energy cost savings as well. With these potential benefits, several alternative aqueous processes were identified. These will be summarized in the following paragraphs. Ammonium Sulfate Using Ammonium Carbonate Gypsum may be reacted with ammonium carbonate to yield calcium carbonate and ammonium sulfate according to the following double decomposition reaction:
CaSO4 • 2H2 O + (NH4 )2 CO3 CaCO3 + (NH4 )2 SO4 + 2H2O This process removes sulfur from the calcium, which is the raw material in the gypsum that is a component of glass/ceramic materials. The sulfur portion of gypsum may be problematic in the glass-ceramic process because it produces SO2 gas that cannot be discharged into the atmosphere. The sulfur also poses a corrosion challenges at elevated temperatures so the cost of the glass-ceramic process equipment is affected as well as the cost for the off gas treatment system. The feed to the glass-ceramic process would be a more conventional feedstock calcium carbonate instead of calcium sulfate. A further benefit of calcium carbonate over gypsum is the lower energy requirement for thermal decomposition. It takes about 1/3 the energy to calcine calcium carbonate as compared to calcium sulfate, and even less when compared to gypsum (with two waters of hydration). A process flow schematic for conversion of gypsum to ammonium sulfate is shown in Figure.

15
Agitator, Turbine
Absorber
H2O
CO2NH3
RecycleTank
CarbonateTank
Cooler
WashTank
PhosphogypsumWater Filtrate
Filter
(NH
4)2*
CO
3S
olut
ion
FeedTank
H2SO4
CaCO3
(NH4)2*SO4To Screen &
Storage
Phosphogypsum
Dryer
Cooler
Figure 4. Diagram for Conversion of Gypsum to Ammonium Sulfate. The ammonium carbonate reagent may not be readily available in bulk quantities in which case it would be produced on site. Ammonia and carbon dioxide are introduced into an absorption tower in which a circulating flow of ammonium carbonate is maintained by pumping from the bottom tower through a cooler to dissipate reaction heat and then back into the top of the tower. Wash liquor from the subsequent carbonate filtering step is continuously fed to the tower to control ammonium carbonate dilution and to save ammonia values in the calcium carbonate filter cake. Re-pulped gypsum from a wet process phosphoric acid plant is pumped to wet cyclones for de-sliming. The cyclone underflow is collected in a filter feed tank from which it is pumped to the filter. The gypsum is washed on the filter, then dewatered and removed to the reaction station for processing. In this section of the plant, gypsum and ammonium carbonate are reacted in a large agitated vessel where the double decomposition reaction occurs. The reaction tank continuously overflows to a filter surge tank which in turn supplies the calcium carbonate-ammonium sulfate slurry to the filter. The filter separates the calcium carbonate by-product from the ammonium sulfate and a subsequent wash cycle removes water-soluble ammonia from the cake. The filter

16
wash liquor returns to the ammonium carbonate preparation section and the ammonium carbonate solution is delivered to one or more end uses as a 38-40% (NH4 )2 SO4 solution. Alternately, the solution may require evaporation to remove water before final use. The 38-40% ammonium sulfate solution from the reaction-filtration section is delivered to the crystallizer feed tank which also receives mother liquor from the centrifuge. Solution from the crystallizer feed tank is pumped to the crystallizers operating in multiple effect. Material discharges from the crystallizers to the centrifuge tank. Crystals from the centrifuge are subsequently dried in a fluid bed drier-cooler to give a finished crystalline ammonium sulfate product. For production of one short ton of ammonium sulfate, the following raw material and utilities are required:
Ammonia 0.3 ton Gypsum 1.6 ton Carbon dioxide 0.4 ton Sulfuric acid 0.005 ton Cooling water (make-up) 1,700 gal Power 75 kW-hr Coal 0.17 ton Process water 770 gal Steam 1.25 ton
Preliminary cost analysis indicates that the ammonium sulfate crystals can be produced using this process for less than $100/ton, a cost which includes all raw materials, operating and plant capital. October 2001 pricing for ammonium sulfate is in the range of $105-$145 per ton, depending on region in the US, so this process may be economically viable. Also, there is at least one group developing this process for conversion of scrubber blowdown sludge from flue gas desulfurization of coal-fired power plants (Chou and others 1998). Conversion to Potassium Sulfate Using Potassium Carbonate Gypsum may be reacted with potassium carbonate to yield the corresponding potassium sulfate. This direct route is not economic because the cost for potassium carbonate is about $800/ton whereas potassium sulfate can only be sold for about $200/ton. Based on materials alone, this results in a net loss of about $400/ton of potassium sulfate sold. Conversion to Potassium Sulfate Using Potassium Chloride Gypsum can be converted into potassium sulfate and calcium products by reaction with KCl, which is a waste material. US Patent 6,334,990 (Phinney 2002) describes a

17
flowsheet where a solution of KCl and NaCl brine (a byproduct of potash manufacture) is blended with gypsum and sodium sulfate. Through a series of steps and recycles, the products of this scheme are potassium sulfate, sodium bicarbonate, calcium sulfate and calcium chloride. These calcium compounds are not any better than using gypsum as glass/ceramic feedstock. At one point in the process, CaO is produced, which is well-suited for glass-making, however it is used in the patented process as feedstock for another step in which ammonia is reclaimed from ammonium chloride. If this CaO is instead used as glass /ceramic feedstock, then there would be a byproduct of ammonium chloride and there would be ammonia consumption. Therefore, this potash brine conversion scheme does not fit readily into an overall process for glass/ceramic manufacture. Conversion to Sodium Sulfate Using Sodium Carbonate Gypsum may be reacted with sodium carbonate to yield the corresponding alkali sulfate as indicated in the following reaction:
CaSO4.2H2O + Na2CO3 → CaCO3 + Na2SO4 + 2H2O Sodium sulfate was selected as the product because it is the main starting compound in the processes proposed in several papers and patents that yields a variety of desirable end products. Selection of Pretreatment Option The processing of PG involved two general alternatives. These are: (1) whether or not to remove the sulfur prior to thermal processing (pretreatment), and (2) whether to melt the material to form glass/ceramics or whether to form the raw material and fire shapes into finished products (such as tile manufacturing). The preferred alternative is to remove sulfate from the phosphogypsum using a wet chemical process that yields useful chemical products, specifically sodium sulfate and any subsequent additional materials and calcium carbonate including the inerts, primarily silica, in phosphogypsum. The sulfur in PG is used to form sulfate-containing chemicals. The calcium from PG is extracted in the chemical processing as a precipitated calcium carbonate. The calcium carbonate is then to be used in a ceramic process. There are several advantages of the carbonate precipitation and sulfate removal pretreatment step. The thermal process is more energy efficient and the materials of construction should cost less because high temperature acid gases and conditions are not present as they would be with direct gypsum processing. High levels of sulfate in a melting process can result in separate sodium and mixed alkali sulfate phases that may make operations problematic. Gypsum in a direct ceramic firing process evolves higher amounts of gas per unit ceramic product compared to calcium carbonate.

18
Conversion of phosphogypsum into calcium carbonate and sodium sulfate is theoretically possible. However, reaction kinetics and the extent to which the reactions go to completion was not known. To resolve these uncertainties bench-scale testing was completed and is described in the next section. BENCH-/PILOT-SCALE TESTING OF AQUEOUS PROCESS During the alternatives evaluation for production of useful products from phosphogypsum, it was concluded that pretreatment of the phosphogypsum would need to be done at break even or possibly at a profit. With this challenge several alternatives for making saleable products that utilized the sulfur in phosphogypsum were identified. Sulfur has limited solubility in nearly all ceramic products. A conceptually simple method for transforming the phosphogypsum into calcium carbonate that would be used by the ceramic manufacturing process and sodium sulfate with many potential for subsequent products was identified. The promise of this approach did not have a commercial operations that indicated this was a viable alternative. The basis for this research was to assess the industrial practicality of the proposed transformation. The chemical conversion process study was based on solubility and thermo-dynamic properties of both raw material and reagent, namely phosphogypsum and sodium hydroxide/carbonate according to the following reaction:
CaSO42H2O + Na2CO3 → CaCO3 + Na2SO4 + 2H2O P. K. Bhattacharjee was tasked with the laboratory testing of the aqueous process. Most of experimental test runs were conducted at the laboratory of Florida Institute of Phosphate Research (FIPR) in Bartow, FL and a few were performed at Forsythe and Long Engineering laboratory in Florence, AL. Pertinent laboratory test information, which was obtained from the report Phosphogypsum Conversion Process--An Alternative Profit-Making Business, prepared by P. K. Bhattacharjee in May 2004, are: A typical phosphogypsum sample from PCS White Springs, FL contains 60% gypsum as dihydrate, 22 % acid insolubles, 13 % free moisture and 5 % other impurities. Common impurities included un-reacted and partially reacted phosphates, calcium fluoride, organic matters, chukhrovite, Fe2O3, Al2O3, MgO etc. PH of phosphogypsum sample was less than 3.0 that could be raised to 6.0 or less by two stage washes with tap water. Variation in gypsum as well as acid insoluble content was significant and led to an increase or decrease of calcium carbonate content in cake product after conversion. No other impact in either physical or chemical quality of cake samples was noticeable.
19
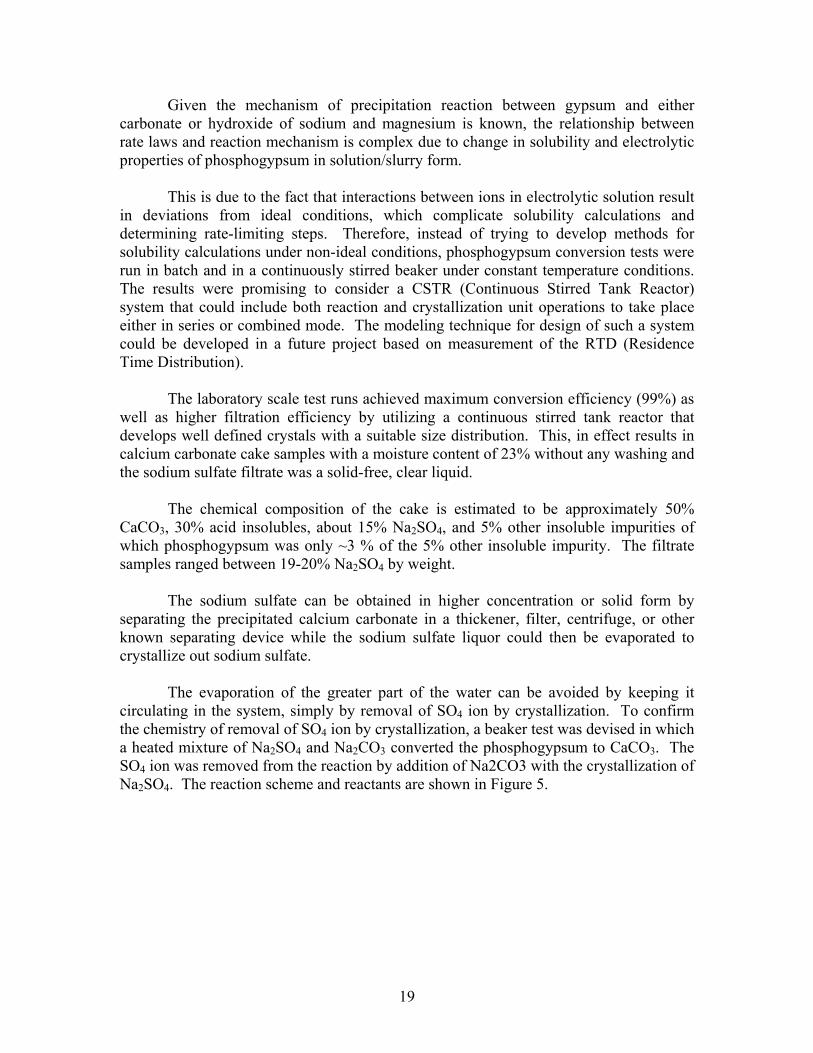
Given the mechanism of precipitation reaction between gypsum and either carbonate or hydroxide of sodium and magnesium is known, the relationship between rate laws and reaction mechanism is complex due to change in solubility and electrolytic properties of phosphogypsum in solution/slurry form. This is due to the fact that interactions between ions in electrolytic solution result in deviations from ideal conditions, which complicate solubility calculations and determining rate-limiting steps. Therefore, instead of trying to develop methods for solubility calculations under non-ideal conditions, phosphogypsum conversion tests were run in batch and in a continuously stirred beaker under constant temperature conditions. The results were promising to consider a CSTR (Continuous Stirred Tank Reactor) system that could include both reaction and crystallization unit operations to take place either in series or combined mode. The modeling technique for design of such a system could be developed in a future project based on measurement of the RTD (Residence Time Distribution). The laboratory scale test runs achieved maximum conversion efficiency (99%) as well as higher filtration efficiency by utilizing a continuous stirred tank reactor that develops well defined crystals with a suitable size distribution. This, in effect results in calcium carbonate cake samples with a moisture content of 23% without any washing and the sodium sulfate filtrate was a solid-free, clear liquid. The chemical composition of the cake is estimated to be approximately 50% CaCO3, 30% acid insolubles, about 15% Na2SO4, and 5% other insoluble impurities of which phosphogypsum was only ~3 % of the 5% other insoluble impurity. The filtrate samples ranged between 19-20% Na2SO4 by weight. The sodium sulfate can be obtained in higher concentration or solid form by separating the precipitated calcium carbonate in a thickener, filter, centrifuge, or other known separating device while the sodium sulfate liquor could then be evaporated to crystallize out sodium sulfate. The evaporation of the greater part of the water can be avoided by keeping it circulating in the system, simply by removal of SO4 ion by crystallization. To confirm the chemistry of removal of SO4 ion by crystallization, a beaker test was devised in which a heated mixture of Na2SO4 and Na2CO3 converted the phosphogypsum to CaCO3. The SO4 ion was removed from the reaction by addition of Na2CO3 with the crystallization of Na2SO4. The reaction scheme and reactants are shown in Figure 5.
20
Figure 5. Beaker Test Arrangement. Beaker 1 contained 100 ml. of aqueous solution with 24 g of Na2SO4, and 11 g of Na2CO3 dissolved in it. The solution was warmed to 40° C. Twenty-three g of solid phosphogypsum was added to the solution and the suspension was stirred for 20 minutes. The solid formed in Beaker 1 was allowed to settle by gravity before the aqueous phase was decanted into Beaker 2. The solid was confirmed to be CaCO3 by polarized light microscopy. A pre-warmed beaker received the decantate (75 ml of aqueous phase) and the solution was maintained at 40° C. Solid Na2CO3 was added in two steps. The first addition (7 g of Na2CO3) caused the solution to cloud with very fine CaCO3. The second addition (4 g of Na2CO3) precipitated crystalline Na2SO4. All solid products were evaluated by the use of polarized light microscopy techniques. Identification was made from the solid’s optical activity, birefringence, crystal habit and refractive index. The Na2SO4 was Fisher reagent-grade material, the Na2CO3 was OCI Chemical Corp. Dense Soda Ash, and the phosphogypsum was supplied by PCS Phosphate. With the positive test results from the bench-scale testing of that process and the confirmation of its practicality, a capital cost and operating cost estimate was needed to assess the economic feasibility of this approach. These estimates are provided in the next section.
21
ESTIMATED COSTS FOR AQUEOUS PROCESSING FACILITY Pertinent information was obtained from the report Phosphogypsum Conversion Process--An Alternative Profit-Making Business, prepared by P. K. Bhattacharjee in May, 2004. The purpose of this work was to estimate the approximate capital cost of a plant for producing calcite and sodium sulfate from phosphogypsum. A further objective was to predict the approximate manufacturing costs for this plant. This includes operating labor, maintenance, utilities, raw materials, reagents, fixed costs, and plant overhead. The process technology for chemical conversion of phosphogypsum is selectively chosen from the following aspects:
• Minimization of energy use. • Minimization of handling high temperature of gasses, liquids and effluents. • Simple process flow sheet and design that includes standard proven unit
operations cg. reaction, filtration, etc. • Elimination of proprietary equipment and machinery. • Environmentally safe and user friendly. • Utilization of product and co-product for a potential of hydrogen and sulfur
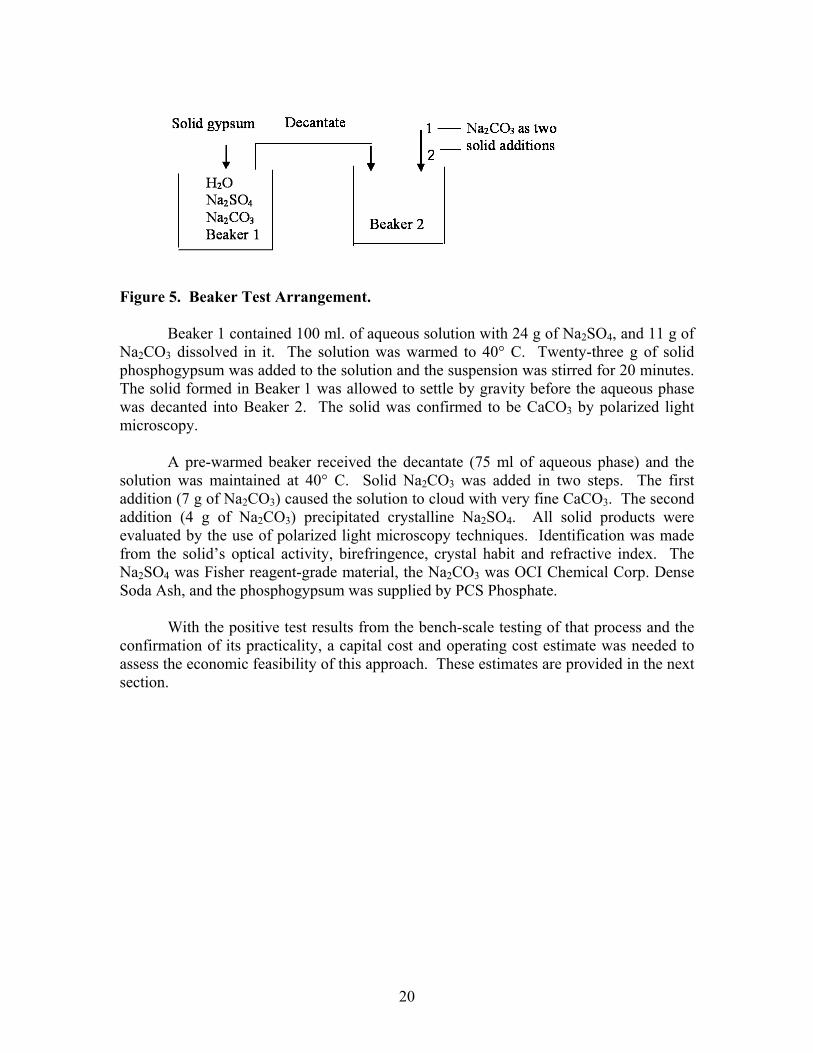
recovery in the future. Phosphogypsum Aqueous Conversion Mass Balance As a basis for estimating operating costs and for a sizing equipment, the general mass balance for 500 tons per day (TPD) is presented in Figure 6.
PG Conversion
CaSO4.2H2O 289 57.8%SiO2 108 21.7%Insoluble 28 5.6%H2O 75 15.0%PG (as is) 500 TPD
178 TPD Soda Ash
CaCO3 67 49.67% SiO2 108 32.10% Insoluble 28 8.30% H2O 34 10.00% Calcite (as is) 338 TPD
Molten Na2SO4
CO2 73 TPD
CaO 94 T 40.8% SiO2 108 T 47.1% Insoluble 28 T 12.1% Glass 230 TPD
H2O 34 TPD
Figure 6. Conversion Material Balance (500 TPD).

22
Simplified Process Flow Diagrams A simplified process block flow diagram of the phosphogypsum conversion process is depicted by Figure 7. The process involves the following primary unit operations:
1. Reaction 2. Filtration 3. Evaporation 4. Scrubbing/Condensation
Figure 7. Simplified Block Flow Diagram. Figure 8 presents the materials flow while Figure 9 provides the process water flow diagram. This is similar to a wet process phosphoric acid manufacturing (without phosphate rock grinding) process. It further utilizes conventional equipment and processes under normal atmospheric pressure and vacuum at a temperature lower than 180° F. Energy uses is, therefore, expected to be low with a conservative estimate of 100 kWh per ton of phosphogypsum conversion. The process also limits use of fresh water by recycling of scrubber water as available from the reactor/filter and evaporation processes. Overall, the process is considered to be simple, safe and easy to operate. It is ready for commercial use.

23
Figure 8. Process Flow Diagram—Materials Balance (500 TPD).

24
Figure 9. Process Flow Diagram-Water Balance (500 TPD). Equipment Cost and Capital Investment Estimate A preliminary cost estimate for a 500 TPD phosphogypsum plant was developed by Mustang, Tampa (May 11, 2004). Table 1 below shows the highlights.

25
Table 1. Capital Investment Estimate.
Elements of Estimate $ MillionsTotal Capital Investment $20.175 Fixed Capital (Equipment) Investment $9.622 Direct Field Cost $4.148 Indirect Field Cost $1.372 Engineering, Construction and Contractor’s Fee
$3.286
Contingency $1.747 The estimate included a filter building along with all associated equipment necessary for filtration purpose only. Cake transfer and a covered storage area were considered as a part of battery limit. Most of the other equipment would be installed outside of the filter building, including a product storage area for filtrate and concentrated sodium sulfate solution. A detailed identification of estimated costs is provided in Table 2.

Table 2. Phosphogypsum Conversion Process TIC Estimate – (t 30%) Date 05/11/04.
ACCT DESCRIPTION MANHOURS LABOR MATERIAL SUBS TOTAL % Costs % Equip. 1000-2900
PROCESS EQUIPMENT 11,325 $521,290 $3,750,840 $5,350,000 $9,622,130 55.1 100.0
3000 U/G PIPE, SEWERS 1,500 $62,040 $30,000 $0 $92,040 0.5 1.0 3100 PROTECTIVE COATINGS & LININGS $0 0.0 0.0 3200 PIPING 22,000 $909,899 $600,000 $0 $1,509,899 8.6 15.7 3300 PAINTING 0 $0 $0 $75,000 $75,000 0.4 0.8 3400 INSULATION 0 $0 $0 $150,000 $150,000 0.9 1.6 3500 ELECTRICAL 8,000 $361,660 $500,000 $0 $861,660 4.9 9.0 3600 INSTRUMENTATION 4,000 $175,390 $450,000 $0 $625,390 3.6 6.5 3700 GENERAL FACILITIES $0 0.0 0.0 4000 SITE PREPARATION & DEMOLITION 1,000 $36,510 $10,000 $50,000 $96,510 0.6 1.0 4100 PILING & SOIL STABILIZATION $0 0.0 0.0 4200 CONCRETE 7,200 $261,780 $99,000 $0 $360,780 2.1 3.7 4300 STRUCTURAL STEEL 2,500 $110,510 $230,000 $0 $340,510 1.9 3.5 4400 ROOFING & SIDING 420 $18,570 $17,500 $0 $36,070 0.2 0.4 4500-4700
BUILDINGS $0 0.0 0.0
DIRECT FIELD COST 57,945 $2,457,649 $5,687,340 $5,625,000 $13,769,989 78.8 143.1 5000 SALES & USE TAX 9% $511,900 $511,900 2.9 5.3 6100 TEMPORARY FACILITIES w/Labor Rate 0.0 0.0 6200-6300
SMALL TOOLS, CONSUMABLE SUPPLIES w/Labor Rate 0.0 0.0
6400 CONSTRUCTION EQUIPMENT $614,400 $614,400 3.5 6.4 6500 FIELD OFFICE EXPENSE w/Labor Rate 0.0 0.0 7400 NON-PRODUCTIVE, SHOW-UP, PREMIUM
TIME $0 0.0 0.0
7500 PRT & I, BENEFITS (Craft) w/Labor Rate 0.0 0.0 7600 FIELD SUPERVISION $245,800 $245,800 1.4 2.6
INDIRECT FIELD COST 0 $245,800 $1,126,300 $0 $1,372,100 7.9 14.3 TOTAL FIELD COST 57,945 $2,703,449 $6,813,640 $5,625,000 $15,142,089 86.1 157.4
8000 HOME OFFICE ENGINEERING AND SERVICES $1,750,000 10.0 18.2 7100 STARTUP, TESTING AND TRAINING $0 0.0 0.0 8700 CONSTRUCTION MANAGEMENT $575,000 3.3 6.0
PROFESSIONAL SERVICES $2,325,000 13.3 24.2 7800 BUILDING |PERMIT, LICENSES, CONSTRUCTION BONDS By Others 0.0 9800 CONTINGENCY (Undefined Cost Item – 10%) $1,747,000 18.2
CONTRACTOR’S FEE – 5% $961,000 10.0 TOTAL – TIC Estimate (±30%) $20,175,089 209.7
26

27
PHOSPHOGYPSUM CONVERSION OPERATING COST ESTIMATE The estimated operating costs for a 500 TPD phosphogypsum conversion plant is provided in Table 3. Table 3. Estimated Operating Costs for 500 TPD PG Conversion Plant. Basic: Annual Phosphogypsum consumption in tons 170,000 (Daily) (500) Total Capital Investment (CI), $MM 20.00 Working Capital (WC) 3.00 1.0
Raw Material/ Chemical/Reagent
Cost
Unit Consumption per Ton of
Phosphogypsum
Unit Cost, $ millions
Annual Cost,
$ millions 1.1 Phosphogypsum, Ton 1.0 1.0 0.170 1.2 Soda Ash, Ton 0.4 120.0 8.160 Subtotal 1.0 8.330 2.0 Utilities 2.1 Electricity, kWh 100.0 0.05 0.850 2.2 Steam, mlbs 1.0 1.50 0.260 2.3 Water, M gals 10.0 0.10 0.170 Subtotal 2.0 1.280 3.0 Operating Supplies 3.1 Labor + Overhead
@ 3% of CI
0.610 3.2 Maintenance
@ 3% of CI
0.610 3.3
Supervision @ 1% of CI
0.200
Subtotal 3.0 1.420 4.0 Fixed Cost 4.1 Depreciation
@ 10% of CI
2.000 4.2 Insurance
@ 0.5 %CI
0.100 4.3 Interest @ 6%
[WC + 2/3 of CI]
0.990 Subtotal 4.0 3.090 Total Phosphogypsum
Conversion Cost ($/Ton)
14.120 (83.06)
With the technical and economic feasibility of converting phosphogypsum to calcium carbonate with acid insolubles and sodium sulfate, the feed material for the

28
ceramic manufacturing process was defined so the preferred approach for processing could be selected. This is discussed in the following sections. SELECTION OF CERAMIC PROCESSING PREFERENCE A large number of alternatives for transforming phosphogypsum into sellable products were considered. A simplified alternatives diagram that also shows the preferred approach is presented in Figure 10. In the previous sections the issue of pretreatment of phosphogypsum before processing the residual calcium constituent in a ceramic process was thoroughly considered. It was decided that the phosphogypsum would undergo aqueous processing to extract the sulfate anion for use in a variety of potential products derived from sodium sulfate. As a result of this decision, the compound of the phosphogypsum to be used in ceramic processing was calcium carbonate plus other acid insolubles of the phosphogypsum, which is dominantly silica. Taking this decision allowed the ceramic processing task to evaluate the preferred processing unit operations for making a product. From the earlier marketing evaluation the preferred product was ceramic tile that could be used for floor, wall, or roof coverings. The remaining decision was whether a conventional ceramic powdered technology or a melting technology would be used to make ceramic tiles. The decision was to proceed using conventional powdered ceramics to make these products.

Products
N
weigh, add, mill,mix, fire
Package Calcium silicateWollastonite nubs
N
Ceramic forming?
Melt SourceMaterials?
Y weigh, add,mill-mix, form,
Glaze, fire,cool Package Tile (roof, floor, wall)
Nheat treat,
millPackage Wollastonite
Abrasive
N
Final Product?
N
Frit, flakeCeramic forming?
YPackage
Abrasive
Y
weigh, feed,MELT
Hot forming?
YMill, ceramicforming, firing
Package Specialized, formed piecesTile (roof, floor, wall) Brick
N
anneal & coolPackage Glass tile, Privacy glass
glass plate, Flat ware
Y
Heat treat?
YCeraming: make glass-ceramic
coolingPackage Flat ware
Tile (roof, floor, wall)Brick
N
PGPretreatment?
PG + (NH3)2CO3 * H2O (NH4)2SO4
Y
PG + Na2CO3 Na2SO4PG + K2CO3 K2SO4
PG + MgCO3 MgSO4
CaCO3
(NH3)Na2CO3K2CO3MgCO3
SO2(NH4)2 HPO4
(NH4)2SO4
K2SO4MgSO4
Na2SO4
Liquid SO2(NH4)2SO4
Flue gasscrubbing
Start here
+
First preferenceSecond preference
Not preferred Figure 10. Schematic of Alternatives Considered.
29

30
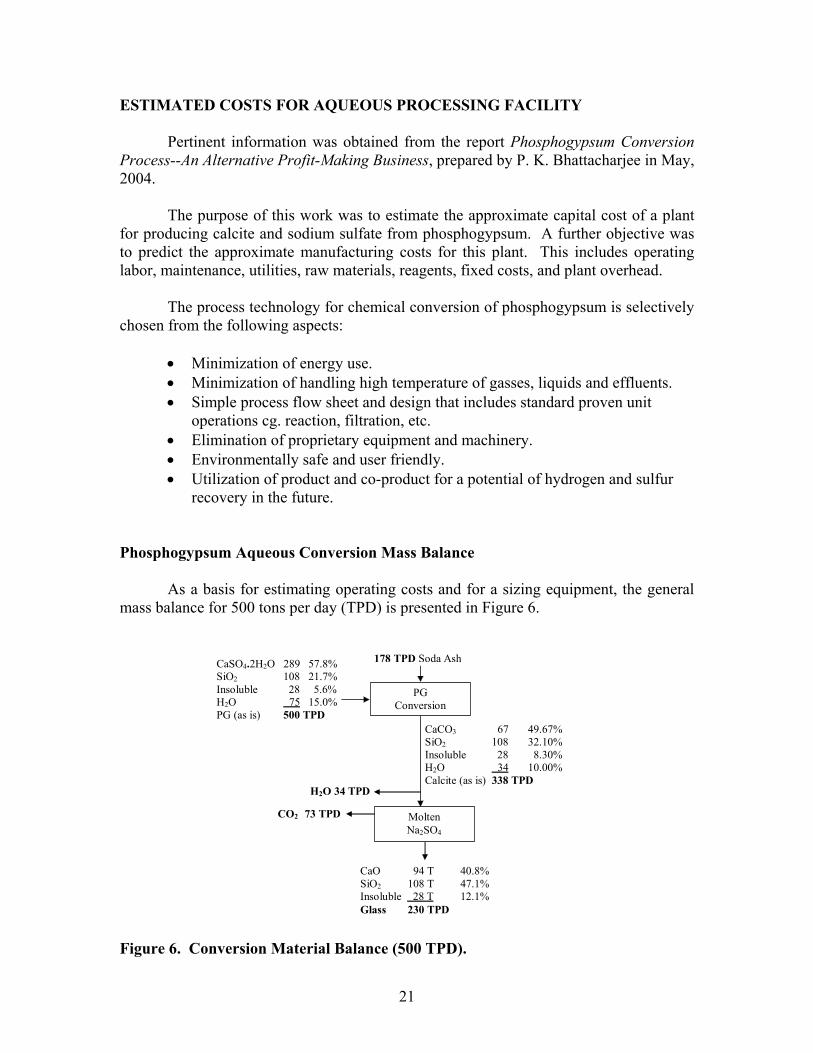
CERAMIC TILE PRODUCTION: PROCESS AND EQUIPMENT DESCRIPTION The decision was made earlier in the project to pursue manufacturing ceramic tile from the phosphogypsum after the preprocessing described above. Ceramic tile has been made by man for nearly 3000 years. Current worldwide production has been estimated to be about 60 billion ft.² per year. This represents about 10 ft.² for every man woman and child on this planet. Sales of ceramic tiles in the United States is in excess of 2.3 billion square feet. The growth rate between 1990 and the year 2000 was over 130%. Thus the popularity of this product in the U. S. construction industry has been demonstrated to be increasing rapidly. The generalized flowsheet has changed modestly over the years, but significant improvements in technology, automation, equipment and control have been introduced. Although there are several variations of the generalized process flow diagram, tiles produced by being glazed using a single firing will be the primary tile product described below. To describe the process and equipment, a simplified and generalized perspective is introduced first and is followed by a more detailed description of the process and the equipment. The following schematic shows the simplified flow of raw materials being metered into a milling step. The milling operation is used to both mix the raw materials and to size reduce the particles to below 100 µ and typically averaging about 63 µ in size. The rotating drum uses ceramic balls to size reduce the raw materials in conjunction with water. The slurry of the milled raw materials is defined as slip. This ceramic slip is transferred to a vessel with agitation. The agitation maintains the slip in a homogeneous state. From the storage vessel the slip is aspirated into a spray dryer and is dried to between five and 12 weight percent water. The most desirable moisture content is between five and six weight percent. The collected dried material is defined as a granulate. This powder which is fed to a hydraulic press where the green body is formed through pressing. Subsequent to be pressing operation the green body is dried to about one weight percent moisture. Following the drying operation, the tiles are glazed. This is the operation of covering the top surface of the green body with a slurry of the glass or frit to make the aesthetic color after being fired. The next step is firing the green body into a vitrified ceramic tile. Subsequent to this operation the tiles are sorted by quality, packaged and stored ready for product delivery. These general steps are shown in a simplified block diagram in Figure 11 and pictorially in Figures 12 and 13.

31
Figure 11. Block Diagram of the Ceramic Tile Process.
Bulk storageof raw materials Mixing and milling
Slip storage
SprayDrier
Granulate storage PressVertical drier
Glazingpreparation
Glaze material storage
Glazemilling
Glaze slipstorage
Glazing line
Figure 12. Pictorial Process Flow Diagram for the Ceramic Tile Process.
32

Figure 13. Pictorial Process Flow Diagram for the Ceramic Tile Process, Isometric.
33

34
Large ceramic tile manufacturing plants represent a large capital investment. The Florim USA plant located near Clarksville, Tennessee that has a ceramic tile production capacity of 40,000,000 ft.² per year is shown in Figure 14. At the time of this photograph the floor area of the manufacturing facility was about 665,000 ft.²
Figure 14. Photograph of a Large Ceramic Tile Manufacturing Facility. Ceramic tile manufacturing involves several significant and sophisticated sequence of operations. The following sections describe, in some detail, both the equipment and operations involved in the production of single fired glazed ceramic tile. PRODUCTION CYCLE FOR SINGLE-FIRED GLAZED TILE The generalized steps in the manufacturer of ceramic tiles are as follows:
• Preparation of the mix for single-fired whiteware is carried out by wet grinding followed by spray drying
• Shaping is obtained by dry pressing with hydraulic presses • Drying is carried out in fast hot-air dryers • Glazing—in the single-firing production cycle this operation is carried out
before firing and also consists of prior operations: preparation of the glaze: achieved by wet grinding the glaze mix formed by various components (frit, kaolin, additives)

35
• Firing is carried out in roller kilns. The firing temperature differs slightly depending on the type of mix and the desired porosity of the finished product: for single-fired whiteware firing temperature is typically between 1150 to 1200° C
Preparation of Raw Materials The bulk raw materials are staged in bunkers or in raw material silos. The raw materials are obtained and apportioned to the formulation of the base ceramic tile. These bulk raw materials are then input into the milling system where mixing and comminution take place. These steps are shown schematically and pictorially in Figure 15.
Bulk raw materials, bunker storageRaw material silo storage,metering system with transfer to millto make the charge
Charge milling and mixing
Figure 15. Schematic and Pictorial Representation of the Raw Materials
Preparation Steps. Raw materials preparation has as its objective to obtain a material (the ceramic mix) with:
1. a homogeneous composition, 2. an appropriate particle size distribution and grain morphology, and 3. a water content suitable for the shaping system to be used (dry pressing for
which ceramic powders with a 5-7% moisture content are required). A fine particle size assures the development of a specific surface suitable for the drying and firing processes. The shape of the grains and the moisture content make it possible to obtain a uniformly pressed semi-finished product such that the successive phases of the production cycle can be carried out without undue difficulties.

36
The operations making up this phase of production are the following: Grinding, which has two purposes:
4. comminution, i.e. the reduction in size of the material in such a way as to develop a specific surface suitable for the drying and firing processes, and
5. mixing-homogenization. Wet grinding can be used for a wide range of raw materials. Very fine grinding is achieved and the resulting powders have excellent flow characteristics, thus assuring optimum filling of the moulds and highest compactability in pressing. In addition, wet grinding also leads to the elimination, or at least significant reduction in quantities, of any impurities that may be present in the mix. The machinery and equipment used are discontinuous ball mills, also known as tumbling mills or Alsing mills, with grinding media in the form of spheres of ceramic material typically of high alumina content. A drum-ball mill consists of a cylinder of steel, internally lined with different materials (silica bricks, high alumina ceramic, rubber), which rotates around its own axis. The mill is connected to an electric motor through V-belts. The capacity of a drum-ball mill for grinding ceramic mixes ranges from 30,000 to 38,000 liters; the diameter ranges from 2.8 to 3.2 meters. A schematic of the side and end views of a drum ball mill is presented in Figure 16.
Figure 16. Drum-Ball Mill. The raw materials, the grinding media, water, and deflocculant, are defined as the charge, are loaded into the mill. The deflocculant is typically sodium polyphosphates and serves to keep the slip as a liquid to avoid the flocculation of the slip, thus reducing the moisture content. After being filled, the mill is operated for a given time to reach a value of grinding residue that is suitable for the production process used for the specific type of product. At the end of the grinding process, a slip is obtained consisting of an aqueous suspension of finely ground raw material, the water content of which varies from 30 to 40% depending on the type of raw material. The slip is conveyed to a vibrating screen, after which it passes through an iron removal system and is then stored in a tank, where it is stirred continuously by means of a blade stirrer to prevent flocculation of the slip (a thixotropic fluid).
37
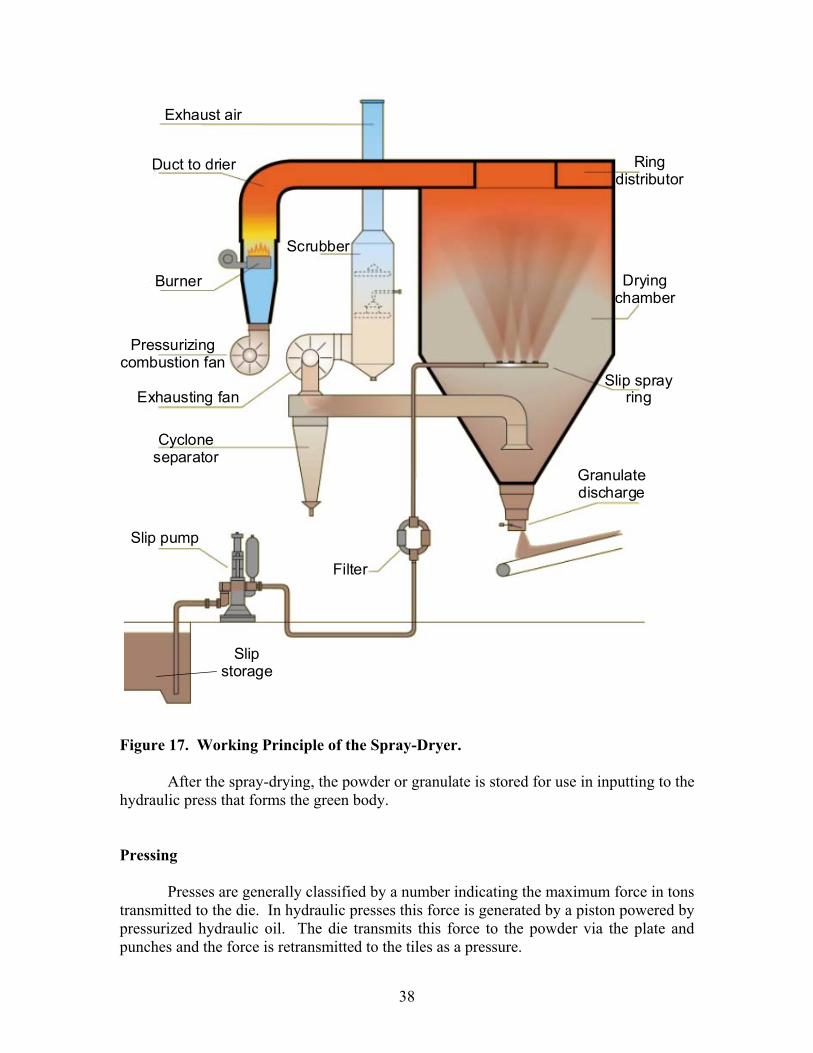
Spray-Drying To obtain powders suitable for pressing, the excess water must be removed by spray drying. The slip is injected at high pressure,~400 psi, and suitably nebulized within a drying chamber where it comes into contact with hot air (500-600° C). More or less instantaneous evaporation of the water occurs given the high coefficient of heat exchange due to the swirling motion and the high specific surface of the drops and the considerable difference in temperature between the air and the slip. This produces rounded granules, largely due to the rubbing of the grains against the walls of the spray drier. The granules produced have a water content and particle size distribution that are suitable for pressing. They are collected in the lower part of the drying chamber and then sent to bins for storage. The spray dryer (Figure 17) consists of a very large cone surmounted by a cylinder with a closed end. Inside the cylinder there is an annulus of nozzles that atomize the slip under pressure, thus reducing the slip to tiny drops which are sprayed countercurrent against a hot air stream. When the droplets come into contact with the air they lose their water and the finely ground particles contained inside the droplets are agglomerate in a grain. Subsequent falling and rubbing of the grains against the walls of the spray drier allow an almost spherical shape to be produced. This guarantees optimum powder flowability and hence good mould filling in the subsequent pressing phase. The wet process is employed with optimum results for the production of vitrified whiteware tile fired using fast firing cycles and for the production of porcelain stoneware tile. The advantages of the wet process is that it is the only feasible technology for use in the production of large-size single-fired tile. However, the process of wet grinding followed by spray drying also has the disadvantages of high machinery and operating costs as well as high energy costs due to the need to evaporate considerable quantities of grinding water to obtain powders suitable for the dry pressing operation.
38
Pressurizingcombustion fan
Burner
Duct to drier
Exhaust air
Exhausting fan
Cycloneseparator
Slip pump
Slipstorage
Filter
Scrubber
Granulatedischarge
Slip sprayring
Dryingchamber
Ringdistributor
Figure 17. Working Principle of the Spray-Dryer. After the spray-drying, the powder or granulate is stored for use in inputting to the hydraulic press that forms the green body. Pressing Presses are generally classified by a number indicating the maximum force in tons transmitted to the die. In hydraulic presses this force is generated by a piston powered by pressurized hydraulic oil. The die transmits this force to the powder via the plate and punches and the force is retransmitted to the tiles as a pressure.
39
The pressing cycle consists of the following sequence of operations: powder transfer from the hopper under the storage silo to the die; first pressing; deaeration; second pressing; second deaeration; extraction of the tile and return to the starting point. A detailed review of the normal cycle with pressing, consists of five stages, each of which involves transformations of the powder. The technical parameters of each of these phases affect the technological characteristics of the product. Pressing phases:
• powder loading • first pressing • de-aeration • second pressing • extraction of the tile
Powder Loading The powder is transported from the hopper to the die by a feeder drawer with a cavity, which at rest is positioned under the powder hopper and is filled with powder. Starting out from this position, the feeder drawer moves to the die and positions the cavity containing the powder above the lower punches, which in the meantime have lowered to create an empty cavity into which the powder falls. After reaching this position (maximum forward travel), the feeder drawer stops and returns backwards, then comes to rest in its original position. These stages are shown schematically in Figure 18.

40
Filler box moves forward, die lowers 1"
Fill skimming
Die lower 2" making ready for press Figure 18. Schematic of Granulate Input Cycle to the Press.
41
First Pressing The upper crosspiece lowers and the upper punch begins to enter the die cavity. Normally the lower die descends slightly, coming to rest against a block to transmit the pressing force through to the base and not to the mechanical system (columns, etc.). As a result, a small empty space is created inside the die between the surface of the powder and the upper edge of the liners. When the upper punch enters the die, it first eliminates the air from this space, then begins to compress the powder. This continues until the end of the first pressing when the oil supply to the cylinder stops. Due to this compression, the air contained in the powder is initially partially ejected, then the pressing force brings the powder particles closer and forces them to bond together. If, for example, the density of the powder is 1 kg / liter and the real density of the solid part of the mixture is 1.9 kg / liter, the powder contains 1.0/1.9 = 52.6% solid and 47.4% air. Given that 10% of the air is expelled during the initial approach phase, the remaining 37.4% is trapped in the internal pores. This occurs because only a small part of the air is able to escape through the opening between the punch and the die during the initial approach phase. Deaeration At the end of the first pressing, the tile contains a considerable quantity of air. When the upper punches stop applying a pressure, the tile forms layers inside the die, freeing the compressed air. The deaeration time only lasts a few tenths of a second. At the end of the deaeration phase, a tile consisting of a series of separate layers separated by very narrow spaces. Second Pressing The deaeration phase is followed by rapid compression until the maximum programmed pressure in the cylinder is reached. The maximum pressure must be maintained for a short time to allow the system to transmit the force to the punches and then on to the tiles inside the various die cavities. When the maximum pressure is exerted (in the region of 1,400 to 7,000 psi), the particles of powder are forced to mould themselves to each other and are deformed slightly due to plasticity deriving from the presence of moisture, and bond together. This creates the internal structure that gives the tile its green mechanical characteristics. In a similar way to the first pressing, the air between the layers is expelled through the space between the punch and the lining, although some air remains trapped inside the residual pores between the particles.
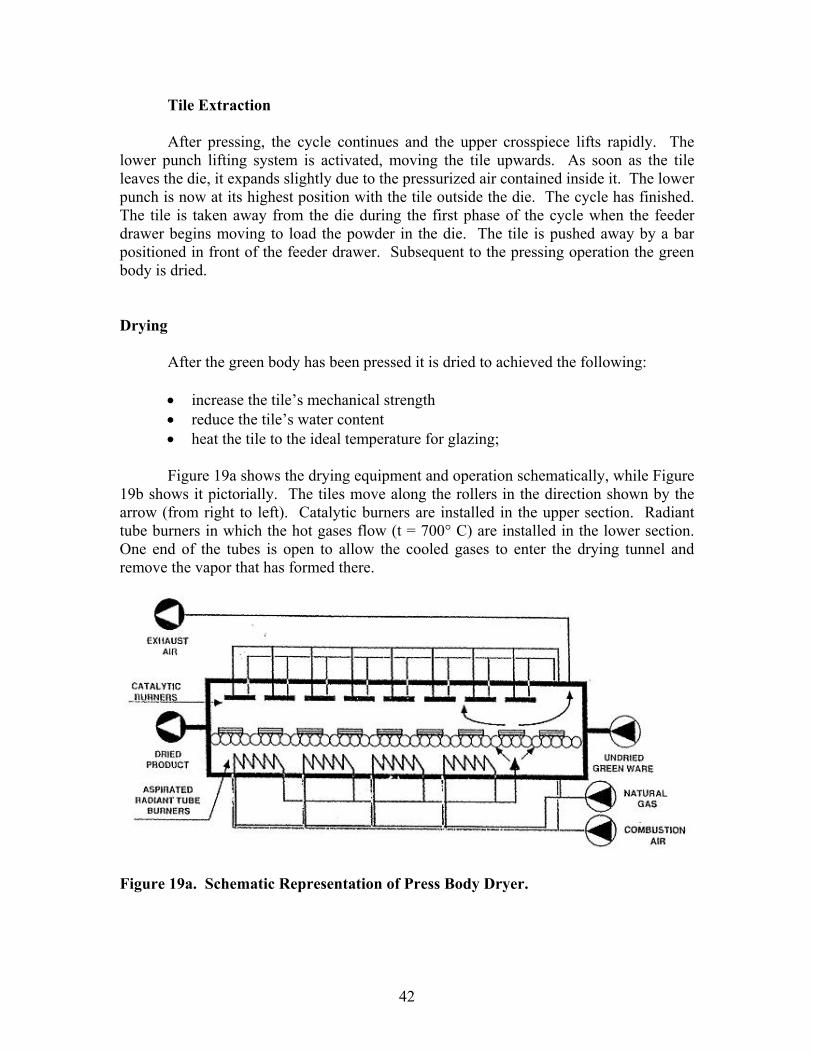
42
Tile Extraction After pressing, the cycle continues and the upper crosspiece lifts rapidly. The lower punch lifting system is activated, moving the tile upwards. As soon as the tile leaves the die, it expands slightly due to the pressurized air contained inside it. The lower punch is now at its highest position with the tile outside the die. The cycle has finished. The tile is taken away from the die during the first phase of the cycle when the feeder drawer begins moving to load the powder in the die. The tile is pushed away by a bar positioned in front of the feeder drawer. Subsequent to the pressing operation the green body is dried. Drying After the green body has been pressed it is dried to achieved the following:
• increase the tile’s mechanical strength • reduce the tile’s water content • heat the tile to the ideal temperature for glazing;
Figure 19a shows the drying equipment and operation schematically, while Figure 19b shows it pictorially. The tiles move along the rollers in the direction shown by the arrow (from right to left). Catalytic burners are installed in the upper section. Radiant tube burners in which the hot gases flow (t = 700° C) are installed in the lower section. One end of the tubes is open to allow the cooled gases to enter the drying tunnel and remove the vapor that has formed there.
Figure 19a. Schematic Representation of Press Body Dryer.

43
Figure 19b. Pictorial Representation of Press Body Dryer. Glazing Glaze is an aqueous suspension of materials that when fired produce the desired surface color and texture. Before covering the outside surface of the green body with the glaze, grinding is carried out in ball mills like the ones used for raw materials but smaller since smaller quantities of glaze are prepared. When the glaze comes out of the mill it is fairly warm (40-50° C), so it is good practice to leave it in the tank and to stir gently for at least 24 hours before use in order to allow it to cool to ambient temperature and to allow air entrapped during grinding to escape. Application of Uniform Layers There are several approaches for application of glaze to the dried green tile and include glaze fall application (waterfall, bell), disk application and spray gun application. Only the glaze fall bell application will be described here. Glaze Fall Application The appliances used for this application is bells (Figure 20). The glaze is fed in through an upper tank with an overflow outlet. From here it flows down a pipe fitted with a flow rate control valve and enters the “cup”. It overflows from the top edge and covers the bell with a uniform film of glaze. As the tiles move forward on the belts they pass through the curtain of glaze falling from the bell.

44
1
23
4
567
8 9
main container vibrating sieve feed tank anti-bubble cone collector vibrating sieve collection tank glaze supply pipe overflow pipe recycle pipe
(1) is the main glaze container. From here the glaze passes through a vibrating screen and (2) fills the tank with agitator. (3) The glaze is then sent to the applicator by a pump. (4) The excess glaze (i.e., the quantity not left on the tile) is collected in another tank below the bell and returned to the feed tank. Figure 20. The Glaze Cycle with Bell Application. Firing In the ceramic production process the purpose of firing is to make all the geometric, aesthetic and functional characteristics of the finished product permanent and lasting. These technical characteristics include water absorption, mechanical strength,
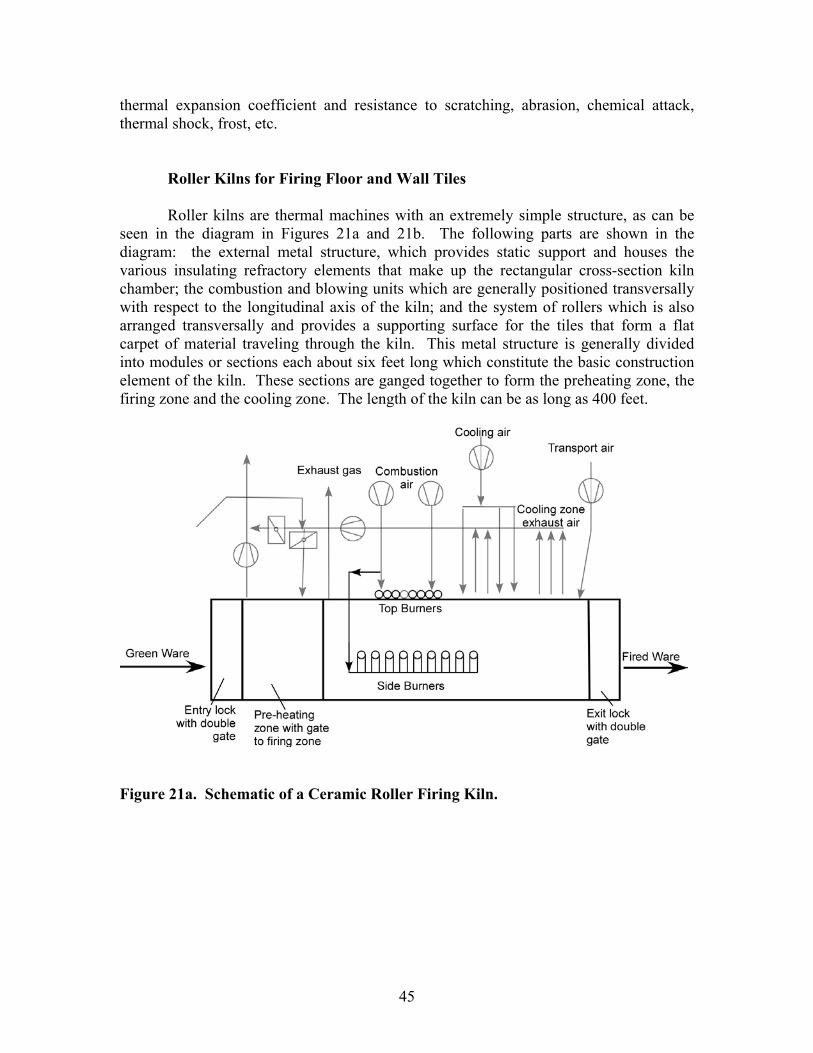
45
thermal expansion coefficient and resistance to scratching, abrasion, chemical attack, thermal shock, frost, etc. Roller Kilns for Firing Floor and Wall Tiles Roller kilns are thermal machines with an extremely simple structure, as can be seen in the diagram in Figures 21a and 21b. The following parts are shown in the diagram: the external metal structure, which provides static support and houses the various insulating refractory elements that make up the rectangular cross-section kiln chamber; the combustion and blowing units which are generally positioned transversally with respect to the longitudinal axis of the kiln; and the system of rollers which is also arranged transversally and provides a supporting surface for the tiles that form a flat carpet of material traveling through the kiln. This metal structure is generally divided into modules or sections each about six feet long which constitute the basic construction element of the kiln. These sections are ganged together to form the preheating zone, the firing zone and the cooling zone. The length of the kiln can be as long as 400 feet.
Figure 21a. Schematic of a Ceramic Roller Firing Kiln.
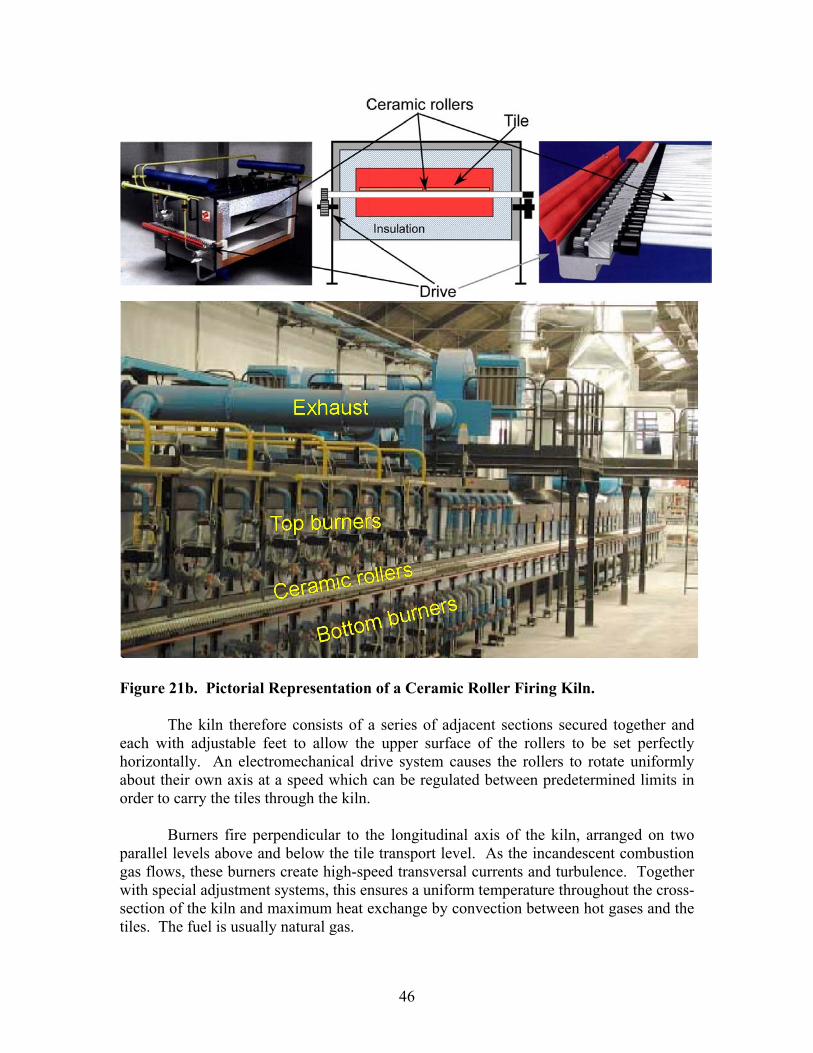
46
Figure 21b. Pictorial Representation of a Ceramic Roller Firing Kiln. The kiln therefore consists of a series of adjacent sections secured together and each with adjustable feet to allow the upper surface of the rollers to be set perfectly horizontally. An electromechanical drive system causes the rollers to rotate uniformly about their own axis at a speed which can be regulated between predetermined limits in order to carry the tiles through the kiln. Burners fire perpendicular to the longitudinal axis of the kiln, arranged on two parallel levels above and below the tile transport level. As the incandescent combustion gas flows, these burners create high-speed transversal currents and turbulence. Together with special adjustment systems, this ensures a uniform temperature throughout the cross-section of the kiln and maximum heat exchange by convection between hot gases and the tiles. The fuel is usually natural gas.

47
A system of pipes, circuits and ducting with blower and/or suction fans of various kinds according to the flow rates provide the following functions:
1. remove the excess exhaust gases from the zones near the kiln entrance using suction fans and send them to the exhaust,
2. provide the quantity of combustion air required, 3. inject cooling air, both for rapid cooling.
Rollers The rollers are an essential component of the kiln since their upper surfaces form a supporting surface for the tiles and constitute the system that actually moves the tiles. The most commonly used diameters vary from 1.3 to 2.4 inches. The total lengths have gradually increased in step with developments in manufacturing technology up to 15 feet. The Kiln The roller kiln has proved to be the most suitable for firing ceramic tiles and it is now used universally for this product. It performs a firing cycle determined according to a temperature/time diagram, with the tiles moving forward along motor-driven rollers at constant speed. The kiln is effectively a heat exchanger divided into a number of different parts: in the first part the tiles are heated and in the second they are cooled. Heating and cooling must be modulated to allow the scheduled firing cycle to be carried out for the given type of product. The Combustion System Heat is produced by burning fuel, which is typically natural gas. If an impurity-free fuel is used, the combustion products can be sent directly into contact with the tiles. This is the case with natural gas. Clearly this situation makes for simple construction and a high thermal efficiency and makes the kiln extremely flexible. This explains why natural gas is so widely used for firing ceramic tiles. The Sorting and Packaging Line The tiles are conveyed onto the visual sorting table where they are assigned a code identifying their class (first, second, third, reject) according to their defects, and possibly the shade group. This code can be marked on the surface of the tile using a pen that leaves a trace which can be read with an optical system (normally UV) or a magnetic code. The tiles then transit underneath electronic devices which check their dimensions and shape, automatically assigning them to both a manufacturing size group and a sorting
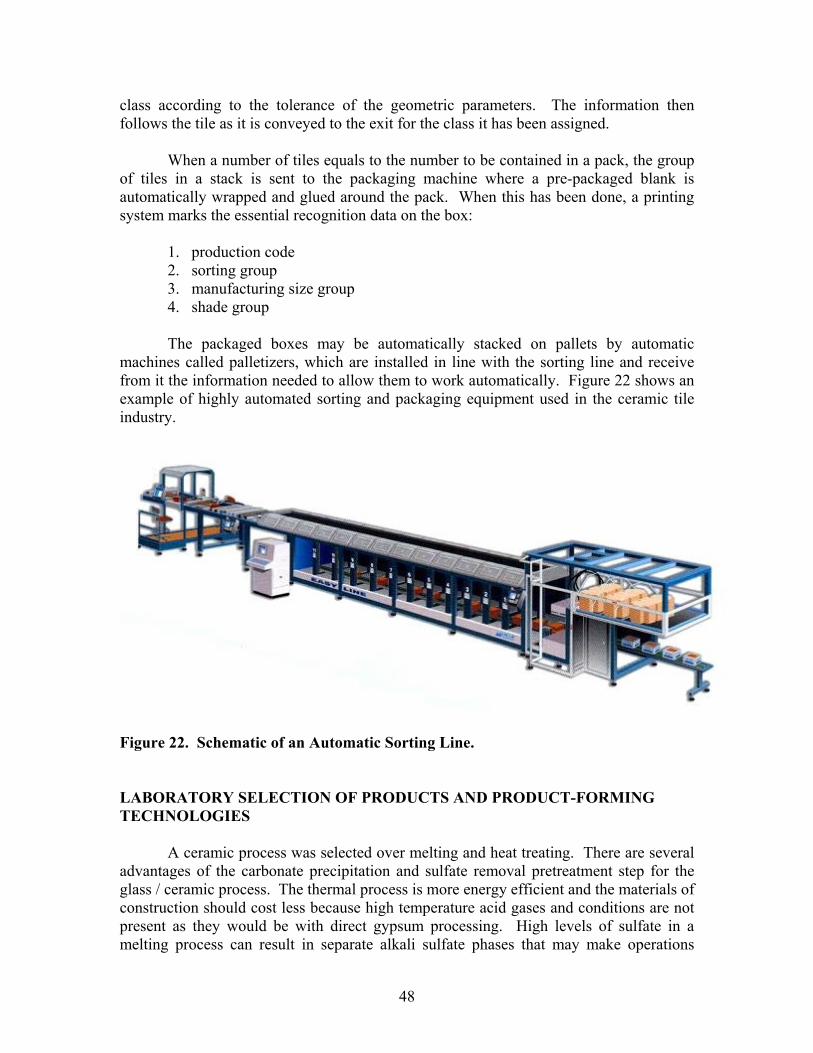
48
class according to the tolerance of the geometric parameters. The information then follows the tile as it is conveyed to the exit for the class it has been assigned. When a number of tiles equals to the number to be contained in a pack, the group of tiles in a stack is sent to the packaging machine where a pre-packaged blank is automatically wrapped and glued around the pack. When this has been done, a printing system marks the essential recognition data on the box:
1. production code 2. sorting group 3. manufacturing size group 4. shade group
The packaged boxes may be automatically stacked on pallets by automatic machines called palletizers, which are installed in line with the sorting line and receive from it the information needed to allow them to work automatically. Figure 22 shows an example of highly automated sorting and packaging equipment used in the ceramic tile industry.
Figure 22. Schematic of an Automatic Sorting Line. LABORATORY SELECTION OF PRODUCTS AND PRODUCT-FORMING TECHNOLOGIES A ceramic process was selected over melting and heat treating. There are several advantages of the carbonate precipitation and sulfate removal pretreatment step for the glass / ceramic process. The thermal process is more energy efficient and the materials of construction should cost less because high temperature acid gases and conditions are not present as they would be with direct gypsum processing. High levels of sulfate in a melting process can result in separate alkali sulfate phases that may make operations

49
problematic. Gypsum in a direct ceramic firing process evolves higher amounts of gas per unit ceramic product when compared to calcium carbonate. Although additional changes should be anticipated for the pretreatment process, proceeding with the assumption that the ceramic process has calcium carbonate as a feed stock was judged to be appropriate. Testing, Assessment and Selection of Promising Compositions and Heat Treatments An earlier effort for this project (Chapman and others 1999) identified several compositions that appeared attractive for proceeding to pilot testing. However most of these compositions were developed with the assumption that the feed would be melted not sintered as the alternative selection subtask recommended. The only sintered product identified was column F, “Sintered ceramic body with excellent refractories (heat resistance) and machinability and method of manufacture of the same” (Goto and others 1990) in Table 4 below. Table 4. Compositions Identified for Pilot Testing.
Reference Footnote > A B C D E F G H J K SiO2 59 53.2 32 44 41.5 53 50.6 37 55.5 59CaO 19.1 31 28 49.3 36 40.9 27.8 28 24.8 23MgO 9.3 19.9 13 2.9 -- 2.2 1.5BaO 4.2
Al2O3 6.8 0.5 1.9 -- 4.25 8.3 8 Na2O 1.7 6.1 1.3 7.5 5.4 4.5K2O 1.6 0.1 5.7 0.6
Fe2O3 0.2 26 0.3 0.2B2O3 0.6 1 -- 4 P2O5 15.6 6.5 8.5 3 ZnO 6.8
Cr2O3 0.75 ZrO2 4
F2 0.5 0.2 5.3 Ceramic Slip Early efforts to make this material and several fluxed alternatives were frustrated by the high sintering temperature (~ 1350° C or 2460° F). This temperature was higher than could be easily achieved with the VIT furnaces even with the addition of fluxes. Attempts to slurry mix, dry and fire the simulated, pretreated phosphogypsum (calcium carbonate) with silica and other chemicals failed to make strong fired bodies. The fired bodies were light weight with significant porosity and had low strength. Only
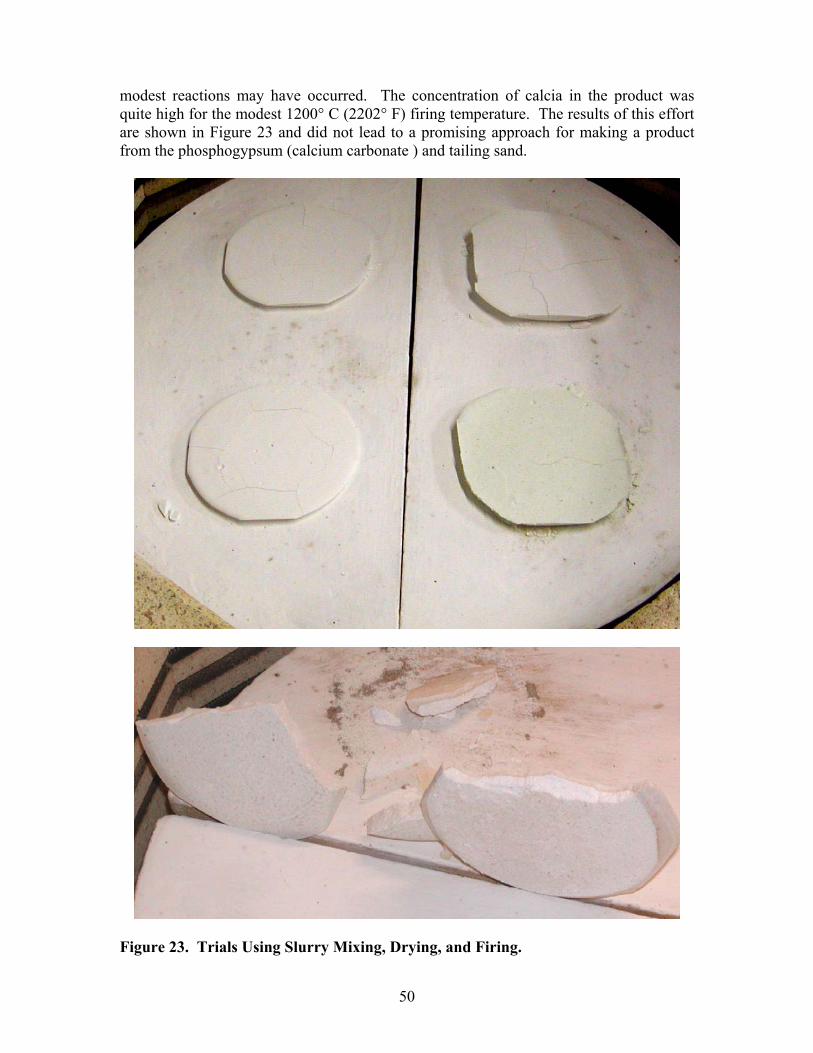
50
modest reactions may have occurred. The concentration of calcia in the product was quite high for the modest 1200° C (2202° F) firing temperature. The results of this effort are shown in Figure 23 and did not lead to a promising approach for making a product from the phosphogypsum (calcium carbonate ) and tailing sand.
Figure 23. Trials Using Slurry Mixing, Drying, and Firing.
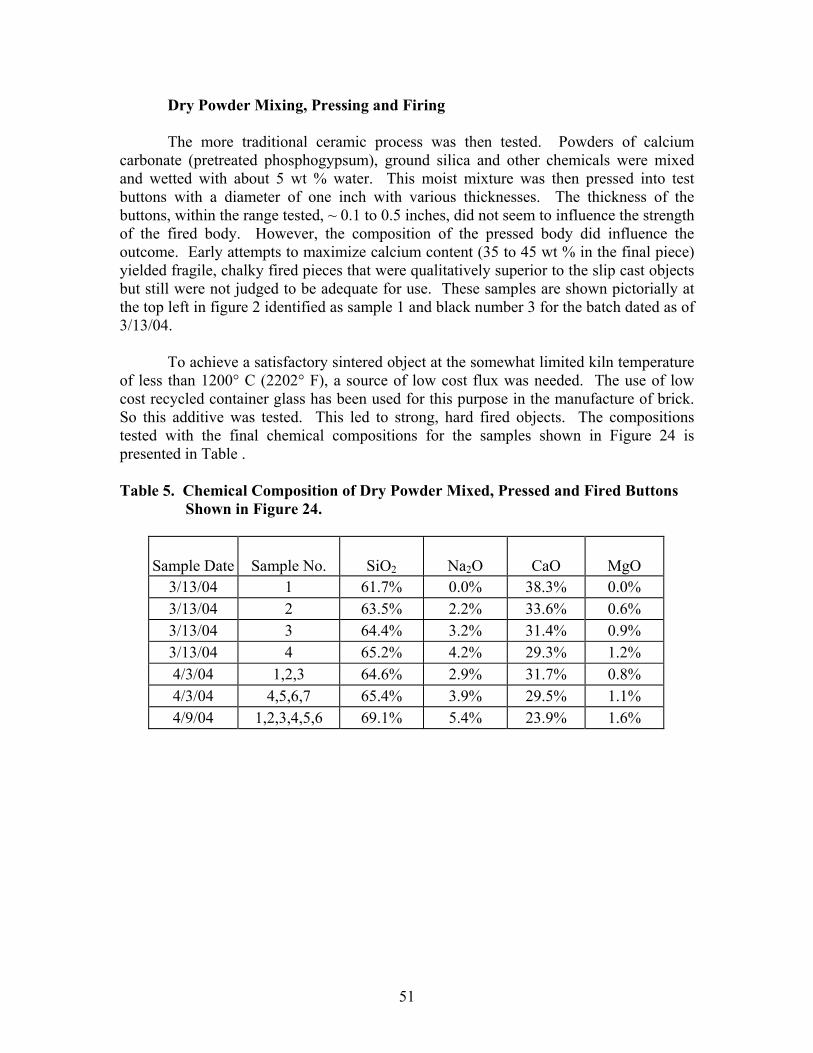
51
Dry Powder Mixing, Pressing and Firing The more traditional ceramic process was then tested. Powders of calcium carbonate (pretreated phosphogypsum), ground silica and other chemicals were mixed and wetted with about 5 wt % water. This moist mixture was then pressed into test buttons with a diameter of one inch with various thicknesses. The thickness of the buttons, within the range tested, ~ 0.1 to 0.5 inches, did not seem to influence the strength of the fired body. However, the composition of the pressed body did influence the outcome. Early attempts to maximize calcium content (35 to 45 wt % in the final piece) yielded fragile, chalky fired pieces that were qualitatively superior to the slip cast objects but still were not judged to be adequate for use. These samples are shown pictorially at the top left in figure 2 identified as sample 1 and black number 3 for the batch dated as of 3/13/04. To achieve a satisfactory sintered object at the somewhat limited kiln temperature of less than 1200° C (2202° F), a source of low cost flux was needed. The use of low cost recycled container glass has been used for this purpose in the manufacture of brick. So this additive was tested. This led to strong, hard fired objects. The compositions tested with the final chemical compositions for the samples shown in Figure 24 is presented in Table . Table 5. Chemical Composition of Dry Powder Mixed, Pressed and Fired Buttons
Shown in Figure 24.
Sample Date
Sample No.
SiO2
Na2O
CaO
MgO
3/13/04 1 61.7% 0.0% 38.3% 0.0% 3/13/04 2 63.5% 2.2% 33.6% 0.6% 3/13/04 3 64.4% 3.2% 31.4% 0.9% 3/13/04 4 65.2% 4.2% 29.3% 1.2% 4/3/04 1,2,3 64.6% 2.9% 31.7% 0.8% 4/3/04 4,5,6,7 65.4% 3.9% 29.5% 1.1% 4/9/04 1,2,3,4,5,6 69.1% 5.4% 23.9% 1.6%

52
Figure 24. Samples of Dry-Mixed, Pressed, and Fired Buttons of Pretreated
Phosphogypsum, Silica, and Additives. For the test buttons made on 3/13/04, the buttons in Cell 1 were made without the addition of container glass powder. These samples were chalky and not suitable for making products. The hardness and strength increased but were not adequate until sample 3. The modest tinge of green in the pieces was due to the use of ground green container glass. Samples 1,2,3 and 4,5,6,7 made on 4/3/04 had the approximate composition of the prior samples 3 and 4. Chips of container glass with different colors were placed on the buttons prior to firing to illustrate the potential for adding a glaze of desired color to a product such as floor or roof tile. Although difficult to see clearly, sample 6 shows a crack indicating that the fired substrate had a much lower coefficient of expansion than does the container glass. For production, a glaze with a similar coefficient of expansion would be used to avoid glaze cracking. To explore other alternatives, a clay was used to replace the silica. The composition of the fired buttons is provided in Table 6 and a photo of the corresponding samples are presented in Figure 25. Not all samples used a clay additive. Samples 4 and 5 made on 4/16/04, and Samples 2 and 3 made on 4/25/04, used sand and more container glass.
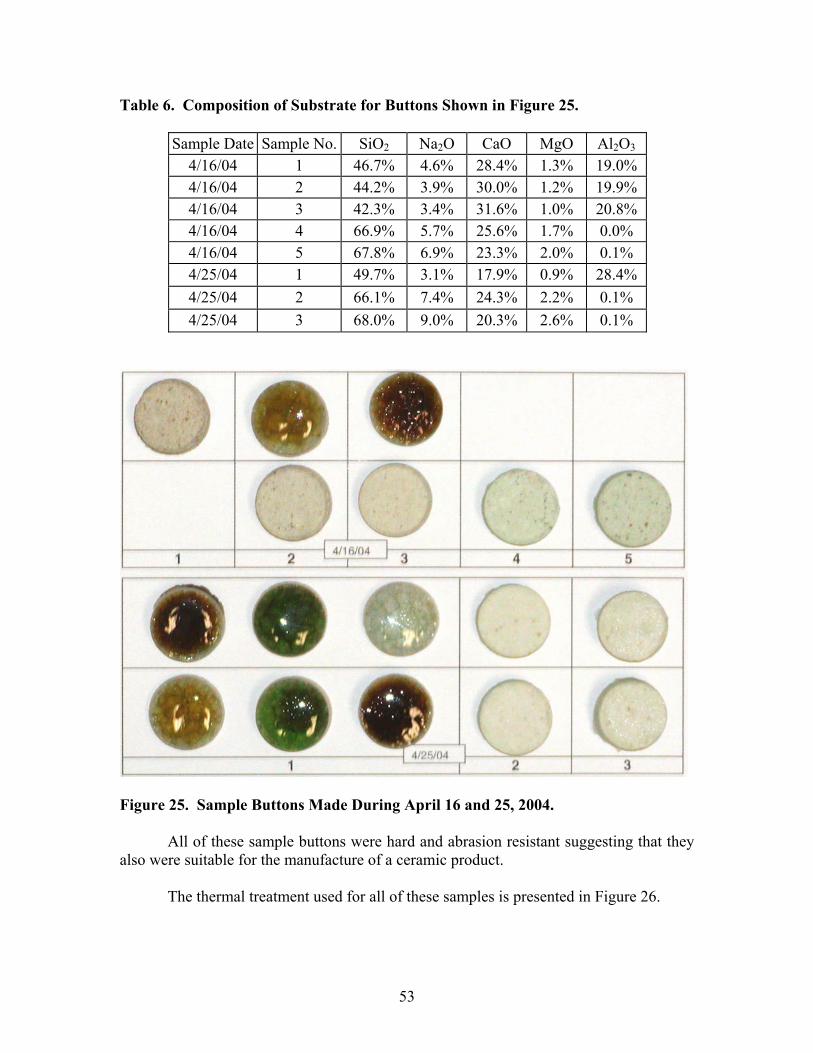
53
Table 6. Composition of Substrate for Buttons Shown in Figure 25.
Sample Date Sample No. SiO2 Na2O CaO MgO Al2O3 4/16/04 1 46.7% 4.6% 28.4% 1.3% 19.0% 4/16/04 2 44.2% 3.9% 30.0% 1.2% 19.9% 4/16/04 3 42.3% 3.4% 31.6% 1.0% 20.8% 4/16/04 4 66.9% 5.7% 25.6% 1.7% 0.0% 4/16/04 5 67.8% 6.9% 23.3% 2.0% 0.1% 4/25/04 1 49.7% 3.1% 17.9% 0.9% 28.4% 4/25/04 2 66.1% 7.4% 24.3% 2.2% 0.1% 4/25/04 3 68.0% 9.0% 20.3% 2.6% 0.1%
Figure 25. Sample Buttons Made During April 16 and 25, 2004. All of these sample buttons were hard and abrasion resistant suggesting that they also were suitable for the manufacture of a ceramic product. The thermal treatment used for all of these samples is presented in Figure 26.

54
0
500
1000
1500
2000
2500
0 5 10 15 20 25
Time, hrs
Tem
pera
ture
, C
Figure 26. Ramp Soak Thermal Schedule Used for Test Buttons. Representative formulations and techniques were discovered to manufacture ceramic products from pretreated phosphogypsum (calcium carbonate) and additives. The use of low cost recycle glass as an additive with indigenous tailing sands supports the goal of enabling the productive use of existing and future phosphogypsum. Although not optimized, this effort demonstrated a product that can effectively use from 25 to nearly 32 wt % calcium oxide. Thus, for each ton of ceramic product produced nearly a ton of phosphogypsum would be consumed.

55
ESTIMATED TURNKEY CAPITAL COST To estimate the capital cost of a ceramic tile manufacturing facility two approaches could be used. A bottoms up estimate would be to identify all of the elements that would contribute to the capital cost of a new operating facility. The second approach would be to discover the overall costs for already constructed ceramic tile manufacturing facilities over a range of capacities. The second approach was used here since the author is not intimately familiar with every piece of equipment it's sizing and associated costs. It was believed that a more accurate indication of the capital cost could be derived from a correlation of available information discovered since the reported capital costs for the plants would be inclusive. Extensive internet searches worldwide were completed to identify capital costs for installed capacities. The results of this investigation is presented in Table 7. Table 7. Ceramic Tile Capital Cost Investment and Plant Capacity.
1 2 3 4 5 6 7
Facility ID Cos
t, M
illio
ns o
f $
Cap
acity
, mill
ions
of
ft2/ y
r,
Cos
t/ ft2
Yea
rs si
nce
com
plet
ed
Esca
latio
n fa
ctor
Adj
uste
d C
ost /
ft2
VitrA Ireland 9.8 7.0 1.40 0 1.000 1.40 Vinastone ceramic Vietnam's Ha Tay province 15.0 10.8 1.39 2 1.082 1.51 Murudeshwar Ceramics Ltd.- India 15.5 19.6 0.79 1 1.040 0.82 Vitromex, Grupo Industrial Saltillo-Chihuahua, Mexico 42.0 38.0 1.11 3 1.125 1.24 Exel tiles (India) 33.3 46.3 0.72 5 1.217 0.88 Interceramic-Chihuahua, Mexico 25.0 47.6 0.53 0 1.000 0.53 Graniti Fiandre - Crossville, Tennessee 50.0 66.0 0.76 0.5 1.020 0.77 Florim USA-Clarksville, Tennessee 60.0 150.0 0.40 3.5 1.147 0.46
The information found in the table by column is defined as follows:
1.0 Facility ID; this is an identification of the plant discovered and typically includes the country in which it was constructed.
2.0 Total cost for the facility in millions of dollars 3.0 Capacity, millions of square feet per year

56
4.0 Normalized capital cost: capital cost per foot squared per year capacity found by dividing column 2 by column 3.
5.0 Years since completed; as indicated this is the number of years since the published completion of the facility. This value will be used to escalate the capital cost of older plants to the current costs.
6.0 Escalation factor; this is the factor to multiply column 4 to adjust the costs to current value.
7.0 Adjusted capital cost per foot squared per year. The capital cost data and was plotted as a function of total plant capacity and a correlation completed. This is presented in Figure 27.
y = 2.6553x-0.3097
0.00
0.20
0.40
0.60
0.80
1.00
1.20
1.40
1.60
0.00 50.00 100.00 150.00 200.00
Million square feet per year
Plan
t Cap
ital C
ost p
er ft
2/yr
Figure 27. Correlation of Ceramic Tile Plant Capital Cost with Capacity. Although the discovered data is limited and represents significant variance, the correlation of capital cost versus plant capacity is deemed acceptable for the purposes of this investigation. The data does conform with the concept that higher plant capacity yields lower normalized capital cost. With the exception of outliers at 40 to 50,000,000 ft.² per year both high and low, the results are typically with in 25% between predicted and reported costs. This was somewhat surprising since the locations for the different plants ranged from Asia, northern Europe and North America. In contrast to a bottoms up cost estimate with a fixed capacity, this correlation can allow the decision maker an estimate cost for a potential production facilities with differing capacities.

57
Utilities Key utility demands normalized on a per square foot production were extracted from (Bakopanos 2003). With these normalized utility demands, cost estimates for an operating facility in central Florida can be obtained using local costs and after the scale of the facility capacity has been decided (Table 8). These normalized utility requirements are useful for the preliminary design. Table 8. Utilities Consumption per Square Foot of Ceramic Tile.
Electricity 318 w-hr / ft2 Natural gas 5,664 BTU / ft2 Fresh water 0.22 gallon / ft2
In a similar fashion, materials consumption, defined in Table 9, can be used to estimate the materials needed to produce a square foot of ceramic tile. Table 9. Normalized Material Consumption.
Material Pounds / ft2 Cost, $ / # Cost, $ / ft2
Recycle glass / cullet 1.55 0.0200 0.031 Calcite, pretreatment 1.45 0.0025 0.004 Tailings sand 1.34 0.0025 0.003 matt glaze 0.013 0.50 0.006 Engobe A slip coating applied to a ceramic body for imparting color 0.015 0.50 0.008 Albuit, high alumina milling balls 0.012 1.00 0.012
Since the production of ceramic tiles involves the consumption of other materials not readily obtained from literature searches, industrial averages, as reported by United States Department of Commerce,( US Census Bureau 2005), was used to determine total normalized costs for the North American Industry Classification System (NAICS) code number 327122, Ceramic wall and floor tile manufacturing. These values are reported in Table 10. The last row in the table provides the normalized cost per square foot of ceramic tile by the various categories. These results can also be used to estimate operating costs once the scale of the ceramic tile plant is selected.
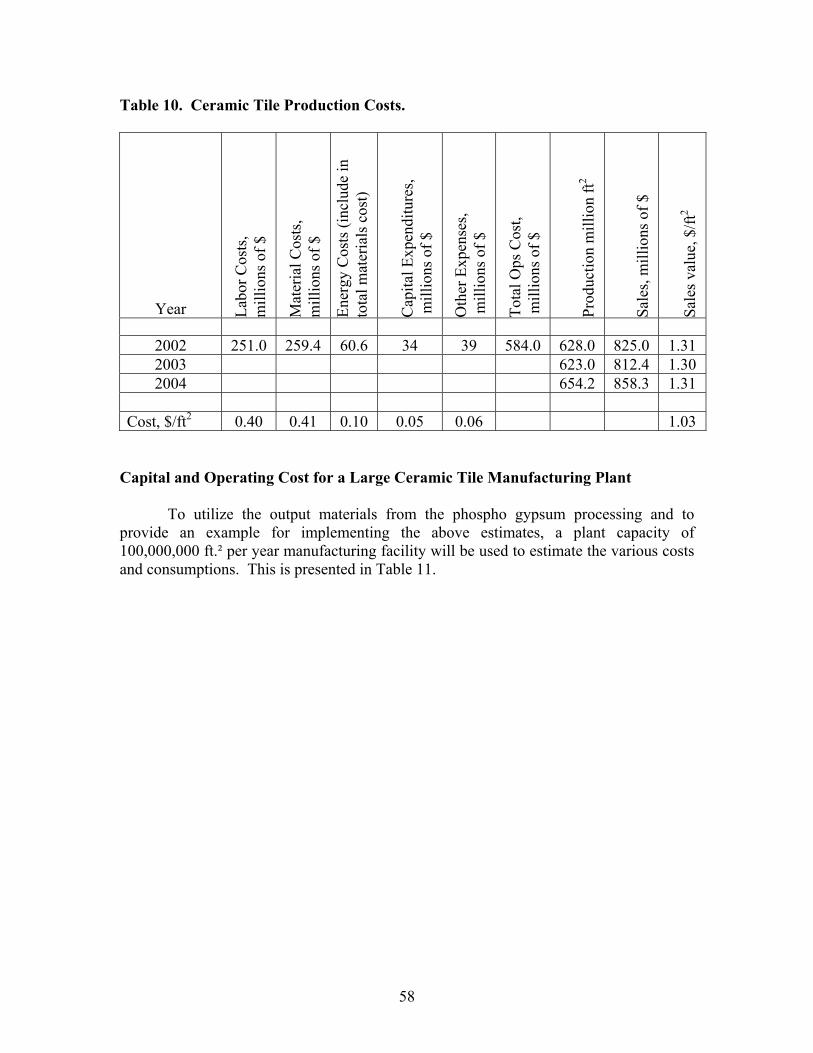
58
Table 10. Ceramic Tile Production Costs.
Year Labo
r Cos
ts,
mill
ions
of $
Mat
eria
l Cos
ts,
mill
ions
of $
Ener
gy C
osts
(inc
lude
in
tota
l mat
eria
ls c
ost)
Cap
ital E
xpen
ditu
res,
mill
ions
of $
Oth
er E
xpen
ses,
mill
ions
of $
Tota
l Ops
Cos
t, m
illio
ns o
f $
Prod
uctio
n m
illio
n ft2
Sale
s, m
illio
ns o
f $
Sale
s val
ue, $
/ft2
2002 251.0 259.4 60.6 34 39 584.0 628.0 825.0 1.31 2003 623.0 812.4 1.30 2004 654.2 858.3 1.31
Cost, $/ft2 0.40 0.41 0.10 0.05 0.06 1.03
Capital and Operating Cost for a Large Ceramic Tile Manufacturing Plant To utilize the output materials from the phospho gypsum processing and to provide an example for implementing the above estimates, a plant capacity of 100,000,000 ft.² per year manufacturing facility will be used to estimate the various costs and consumptions. This is presented in Table 11.

59
Table 11. Estimated Costs and Consumption for a 100,000,000 Ft.² Ceramic Tile Plant.
Capital Cost $67,000,000
Utilities Electricity 32,000,000 (kw-hr. / yr.) Natural gas 5,700,000 (therms / yr.) Water 22,000,000 (gallons / yr.)
Raw Materials (tpa) Recycle glass/cullet 78,000 Calcite, pretreatment 73,000 Tailing sand 67,000 Matte glaze 640 Engobe 760 Printing powder 480 Albuit, high alumina milling balls 590
Operating Costs ($/Yr.) Labor costs $ 46,000,000 Material costs $ 47,500,000 Energy costs $ 11,000,000 Other expenses $ 7,200,000 Total Operations Cost $ 111,700,000

61
CONCLUSIONS AND RECOMMENDATIONS The overall objective of this research was to attempt to develop a new and economical manufacturing industry that exploited and consumed the phosphate mining industry’s waste, phosphogypsum. Initially, the basic material envisioned to be manufactured was glass and glass products. After further detailed investigations, glass-ceramics that were able to incorporate higher concentrations of calcia were identified that could further exploit this mining waste. Exhausting the oxides of sulfur from a ceramic manufacturing plant to an existing sulfuric acid production plant was not acceptable to the industry due to the likely lowering of operating efficiency. This constraint compelled this project to pursue a process that would recovered the sulfur from phosphogypsum without an economic penalty since glass and ceramics can utilize a limited quantity of sulfur. Pursuit of this objective led to the discovery of processes that did reclaim the sulfate that are apparently economically attractive by themselves. Additional extensions of this approach appear to make this pretreatment process economically capable of essentially recycling phosphogypsum that is produced from the ongoing mining operations and potentially working off the back log from the gyp stacks. If this vision is realized in practice, the results of this project could be profound for the phosphate mining industry. Pursuit of a tile manufacturing facility with the calcium carbonate generated from the aqueous processing together with the balance of the phosphogypsum inerts appears to be economically attractive but is not likely, at least initially, to meet the current generation rate of phosphogypsum. Tile manufacturing plants are capital cost intensive and face significant market challenges from foreign producers. For example, in the past 10 years the United States market for ceramic tile has grown on an average of 10% per year. In spite of this large growth rate, the market share by US producers has declined from 41% to 21%. Additional research, not within the scope of this project, is needed to better define the actual composition of the calcium carbonate cake that includes the inerts from phosphogypsum generated from the aqueous processing. Finally, additional testing with this composition is needed. Conventional powder ceramic tile production was initially selected based on widespread industrial applications of this technology. The early perception was that powdered ceramic processing would result in lower capital and operating cost. However, after detailed investigation of the powdered ceramic tile processing has been completed this is no longer clear. The use of a melting technology with subsequent forming and heat treating of the formed product could provide significant reductions in capital and operating costs. Using the melting technology would eliminate the capital costs of ball milling, the somewhat energy intensive operation of spray drying and the capital cost of the powder pressing operation. For these general reasons, the melting technology should be reconsidered for a ceramic tile production facility.

62
The capital cost needed for tile production facilities with the capacity sufficient to exceed the phosphate mining industry’s generation of pretreated phosphogypsum is too high to achieve rapidly. In the interim while the ceramic tile manufacturing facilities build up to the desired capacity, production of lime could make up the difference and should be considered.

63
REFERENCES Bakopanos J (Department of Urban and Transport Planning). 2003 Report on the assessment of development application no. Da-449-12-2002-i pursuant to section 80 of the environmental planning and assessment act, 1979 proposal by National Ceramic Industries Australia pty ltd for a ceramic tile manufacturing plant at Rutherford, Maitland local government area. 62 p. Brown GN, Mengel ML, inventors; Marsulex Environmental Technologies, LLC, assignee. 2001 April 24. Process for controlling ammonia slip in the reduction of sulfur dioxide emission. US patent 6,221,325. Chang WF, Mantell MI. 1990. Engineering properties and construction applications of phosphogypsum. Phosphate Research Institute, University of Miami. Coral Gables (FL): University of Miami Press. p 4-9. Chapman CC, Peters RD, Wojak B (VIT Inc.). 1999. Development of process to manufacture glass products from phosphogypsum. Bartow (FL): Florida Institute of Phosphate Research. Project nr 01-153-163. 83 p. Chou M-IM, Lytle JM, Luo M, Bruinius J, Chou SJ, Hoeft BG, Wright D. 1998. Final Technical Report: September 1, 1997 through September 30, 1998, Marketable Ammonium Sulfate Fertilizer and Fine Calcium Carbonate from FGD-Gypsum, Illinois State Geological Survey (ISGS) ICCI Project Number: 97-1/3.2A-6. Goto K, Shin H, Ishida H, Goto Y, Iwahashi A. 1990 October 16. Sintered ceramic body with excellent refractories (heat resistance) and machinability and method of manufacture of the same. US patent 4,963,517. Peters RD, Chapman CC (VIT Inc.). 1998. Development and evaluation of glass made from phosphate industry wastes. Bartow (FL) Florida Institute of Phosphate Research Project Number 97-01-143, 49 p. Phinney R, inventor; Airborne Industrial Minerals Inc. assignee. 2002 January 1. Formulation of potassium sulfate, sodium carbonate and sodium bicarbonate from potash brine. US patent 6,334,990. Risse T, Ferro LCO, inventors; Lurgi Lenties Bischoff GmbH, assignee. 2000 May 16. Method of removing sulfur dioxide from flue gases, especially power plant flue gases and flue gases from garbage incinerator plants. US patent 6,063,352. US Census Bureau. (U.S. Department of Commerce, Economics and Statistics Administration). 2005. Ceramic Wall and Floor Tile Manufacturing: 2002. EC02-31I-327122 (RV). 10 p.