development of a health index of indian states - india (oppi files/development... · health index...
TRANSCRIPT
i
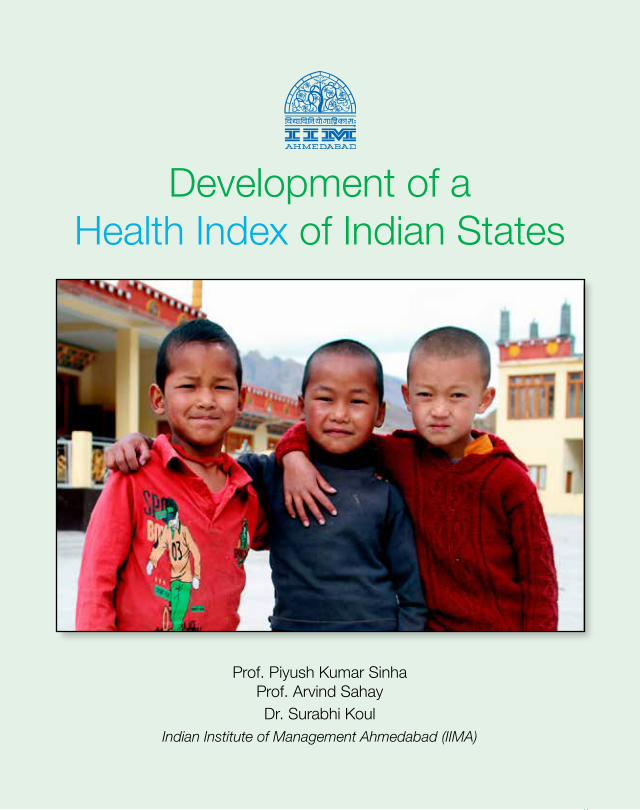
Development of a Health Index of Indian States
Prof. Piyush Kumar Sinha Prof. Arvind Sahay Dr. Surabhi Koul
Indian Institute of Management Ahmedabad (IIMA)

Development of a Health Index of Indian States
Prof. Piyush Kumar Sinha Prof. Arvind Sahay Dr. Surabhi Koul
Indian Institute of Management Ahmedabad (IIMA)
Facilitated by

01
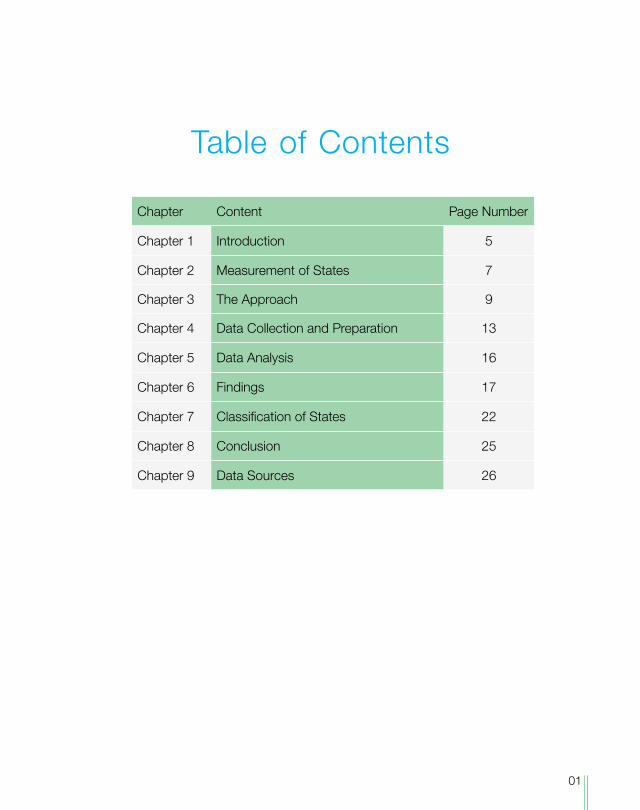
Table of Contents
Chapter Content Page Number
Chapter 1 Introduction 5
Chapter 2 Measurement of States 7
Chapter 3 The Approach 9
Chapter 4 Data Collection and Preparation 13
Chapter 5 Data Analysis 16
Chapter 6 Findings 17
Chapter 7 Classification of States 22
Chapter 8 Conclusion 25
Chapter 9 Data Sources 26
02
Acknowledgments
This report has been made possible with inputs and support from members of Organisation of Pharmaceutical Producers of India (OPPI). We would like to acknowledge the extensive contributions received from Dr. Ajay Sharma, Mr. Sudarshan Jain, Ms. Ranjana Smetacek, Mr. Rajiv Shukla, Mr. Pushpak Khare and Ms. Kanchana T. K.
We would like to specially acknowledge the insights received from Mr. D. G. Shah, Secretary General, IPA and Prof. Dileep Mavlankar, Director, IIPH, Gandhinagar.
03
AbstractDevelopment of a Health Index of Indian States
The current study analyses the performance of India states with regard to health of their populace. It constructs an index for the health performance using multiple parameters. The variables selected for the study were divided under outcome and input measures. Using factor analysis weights were attached to each of the parameters for arriving at a summated score for outcome and input dimensions. Using these scores the states were ranked. The results showed that the states performed very differently on the two dimensions. The analysis showed very low correlation between outcome and input variables. Assuming orthogonality between them an Outcome – Input matrix was plotted. Based on median score of the two dimensions, the four quadrants were identified. Maharashtra and Tamil Nadu were found amongst the best performers while Assam, Uttaranchal and Uttar Pradesh were lowest performers. States like Kerala, Himachal Pradesh, Delhi and J&K performed well. The study brought out clearly that besides building the resources and infrastructure for delivery of healthcare services, there is a need to develop innovative and participative approached to achieve the objectives by building dynamic capabilities using people, systems, infrastructure and technology.
Keywords: Factor Analysis, Health Index, Input Measure, Outcome Measure, Sates of India

04

05
1. Introduction
A country or state’s performance depends a lot on the heath of its populace. Not only does it improve efficiency but it is also an indicator of an all-round performance of the nation. Policy makers cannot ignore its importance in economic development as well as happiness and human development of the nation. Health has been made one of the most important dimensions of the millennium development goals set for country. Four of the eighteen development goals adopted by the General assembly of the United Nations in September 2000 relate to health and well-being of the population of the country. The focus of the Indian government to develop ‘a holistic care system that is universally accessible, affordable and effective’ is an indication of a national focus aligned to the UN goals. The country and the states have injected resources into institutions, hospitals, partnerships and initiatives to progress in this domain. Leading pharmaceutical and healthcare companies have
06
also played a significant role by collaborating with the global health community to address the needs of the country.
IIMA was approached by OPPI to study this phenomenon and explore the possibility of looking at the states based on their performance of the health of their populace. The study involved collecting and purifying the data from reliable sources and developing an index which could capture the variances in the state and also give direction for a developing policies, strategies and action plans for each of the states.
07
2. Measurement of the Status of Health
Measuring the status of health of a country or a state is a complex process. It is a multi – faceted phenomenon which has been difficult to model and estimate. It becomes further complicated due to disparities among various states of India. There are many studies conducted by private as well as government agencies to study issues at state level.1 Most of these have used the outcome variable as the indicators. While important these are negative indicators in the sense that reduction in these indicates better health status.2 One such study has tried to bring in some of the initiatives into determining the score and a ranking of states based on these scores.3Comparison of countries with regard to health is also presented in WHO report which considers largely outcome variables only. It is also noted that different countries have used different dimensions
1Gudwani A, Mitra P, Puri A and Vaidya Mandar (2012), “India Healthcare: Inspiring Possibilities: Challenging Journey”, Mckinsey & Company2Sengupta Keya (2016), “Determinants of Health Status in India”, Springer, New Delhi3Bhandari Pranjul (2012), “Refining State Level Comparisons in India”, Planning Commission, Government of India, Working Paper Series
08
for defining health performance. This makes comparison difficult and unusable for drawing any policy implications. More importantly, the comparison is at country level.
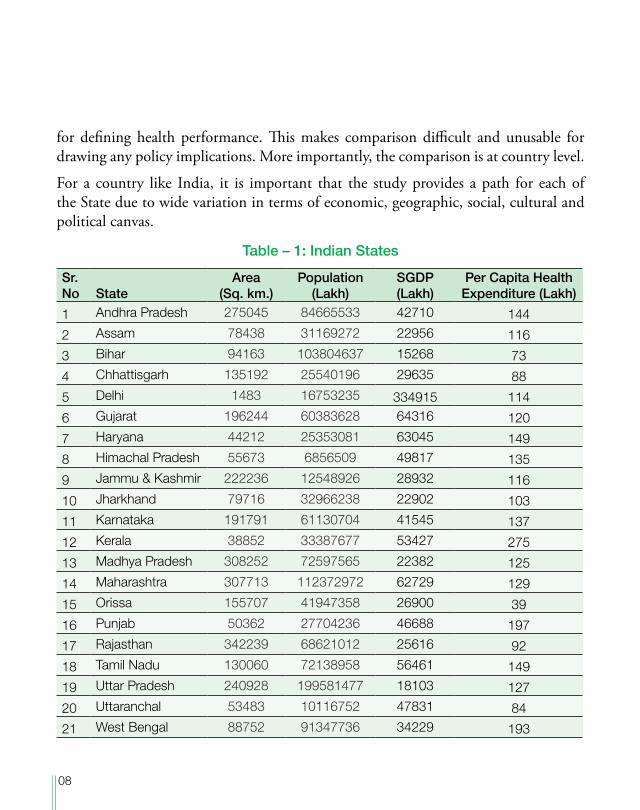
For a country like India, it is important that the study provides a path for each of the State due to wide variation in terms of economic, geographic, social, cultural and political canvas.
Table – 1: Indian States
Sr. No State
Area (Sq. km.)
Population (Lakh)
SGDP (Lakh)
Per Capita Health Expenditure (Lakh)
1 Andhra Pradesh 275045 84665533 42710 144
2 Assam 78438 31169272 22956 116
3 Bihar 94163 103804637 15268 73
4 Chhattisgarh 135192 25540196 29635 88
5 Delhi 1483 16753235 334915 114
6 Gujarat 196244 60383628 64316 120
7 Haryana 44212 25353081 63045 149
8 Himachal Pradesh 55673 6856509 49817 135
9 Jammu & Kashmir 222236 12548926 28932 116
10 Jharkhand 79716 32966238 22902 103
11 Karnataka 191791 61130704 41545 137
12 Kerala 38852 33387677 53427 275
13 Madhya Pradesh 308252 72597565 22382 125
14 Maharashtra 307713 112372972 62729 129
15 Orissa 155707 41947358 26900 39
16 Punjab 50362 27704236 46688 197
17 Rajasthan 342239 68621012 25616 92
18 Tamil Nadu 130060 72138958 56461 149
19 Uttar Pradesh 240928 199581477 18103 127
20 Uttaranchal 53483 10116752 47831 84
21 West Bengal 88752 91347736 34229 193
09
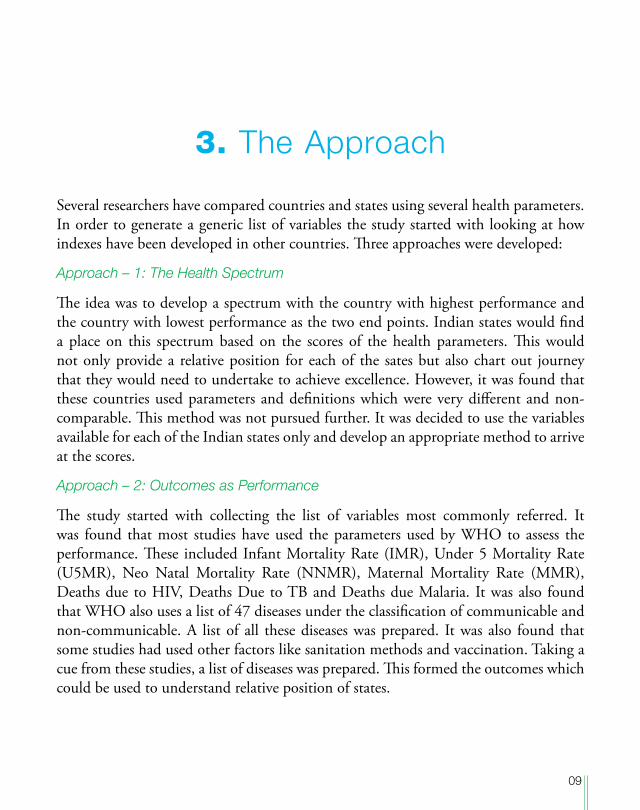
3. The Approach
Several researchers have compared countries and states using several health parameters. In order to generate a generic list of variables the study started with looking at how indexes have been developed in other countries. Three approaches were developed:
Approach – 1: The Health Spectrum
The idea was to develop a spectrum with the country with highest performance and the country with lowest performance as the two end points. Indian states would find a place on this spectrum based on the scores of the health parameters. This would not only provide a relative position for each of the sates but also chart out journey that they would need to undertake to achieve excellence. However, it was found that these countries used parameters and definitions which were very different and non-comparable. This method was not pursued further. It was decided to use the variables available for each of the Indian states only and develop an appropriate method to arrive at the scores.
Approach – 2: Outcomes as Performance
The study started with collecting the list of variables most commonly referred. It was found that most studies have used the parameters used by WHO to assess the performance. These included Infant Mortality Rate (IMR), Under 5 Mortality Rate (U5MR), Neo Natal Mortality Rate (NNMR), Maternal Mortality Rate (MMR), Deaths due to HIV, Deaths Due to TB and Deaths due Malaria. It was also found that WHO also uses a list of 47 diseases under the classification of communicable and non-communicable. A list of all these diseases was prepared. It was also found that some studies had used other factors like sanitation methods and vaccination. Taking a cue from these studies, a list of diseases was prepared. This formed the outcomes which could be used to understand relative position of states.
10
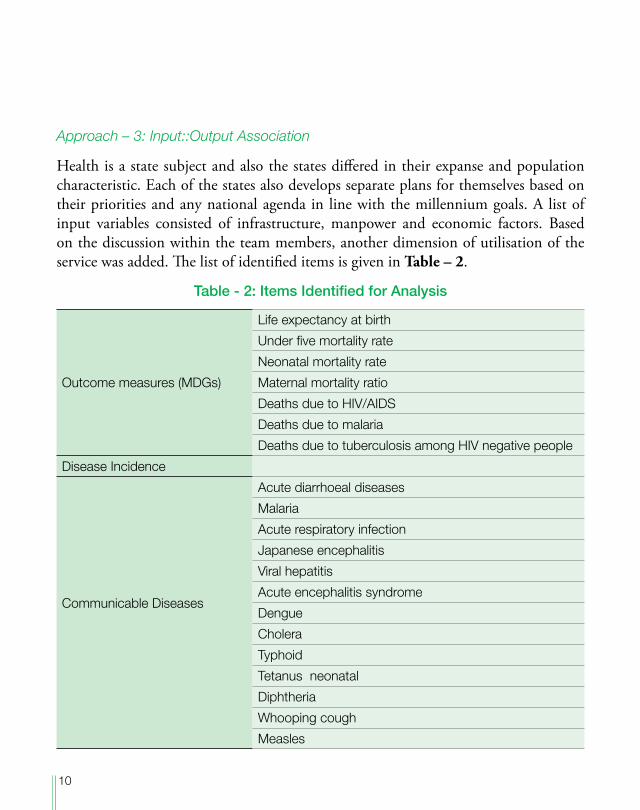
Approach – 3: Input::Output Association
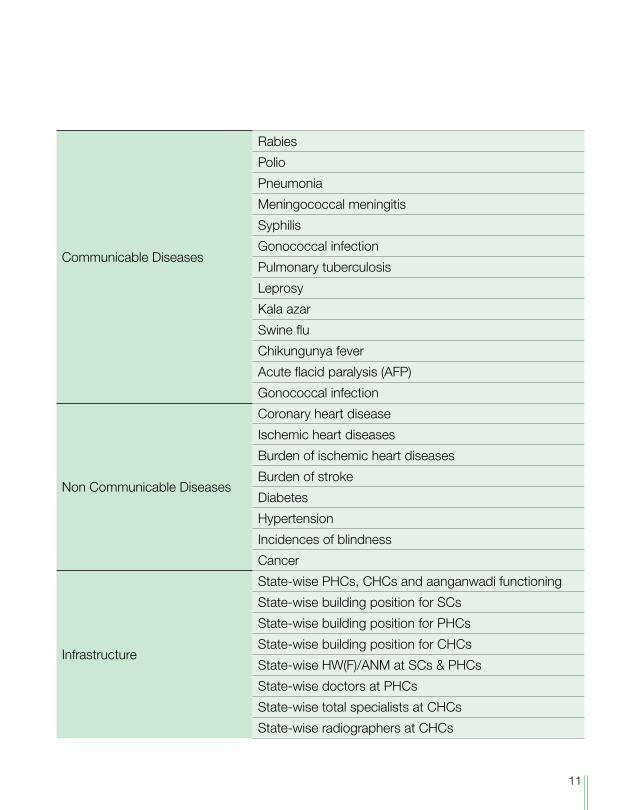
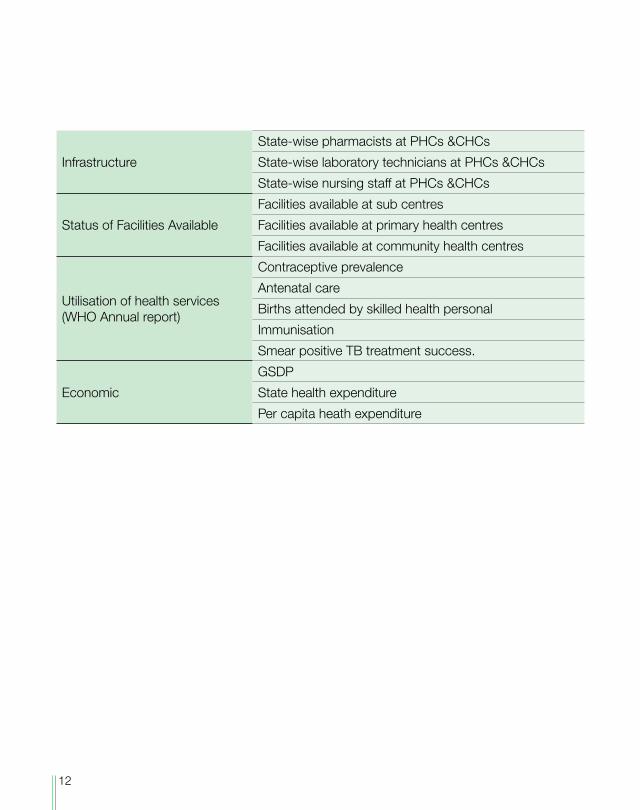
Health is a state subject and also the states differed in their expanse and population characteristic. Each of the states also develops separate plans for themselves based on their priorities and any national agenda in line with the millennium goals. A list of input variables consisted of infrastructure, manpower and economic factors. Based on the discussion within the team members, another dimension of utilisation of the service was added. The list of identified items is given in Table – 2.
Table - 2: Items Identified for Analysis
Outcome measures (MDGs)
Life expectancy at birth
Under five mortality rate
Neonatal mortality rate
Maternal mortality ratio
Deaths due to HIV/AIDS
Deaths due to malaria
Deaths due to tuberculosis among HIV negative people
Disease Incidence
Communicable Diseases
Acute diarrhoeal diseases
Malaria
Acute respiratory infection
Japanese encephalitis
Viral hepatitis
Acute encephalitis syndrome
Dengue
Cholera
Typhoid
Tetanus neonatal
Diphtheria
Whooping cough
Measles
11
Communicable Diseases
Rabies
Polio
Pneumonia
Meningococcal meningitis
Syphilis
Gonococcal infection
Pulmonary tuberculosis
Leprosy
Kala azar
Swine flu
Chikungunya fever
Acute flacid paralysis (AFP)
Gonococcal infection
Non Communicable Diseases
Coronary heart disease
Ischemic heart diseases
Burden of ischemic heart diseases
Burden of stroke
Diabetes
Hypertension
Incidences of blindness
Cancer
Infrastructure
State-wise PHCs, CHCs and aanganwadi functioning
State-wise building position for SCs
State-wise building position for PHCs
State-wise building position for CHCs
State-wise HW(F)/ANM at SCs & PHCs
State-wise doctors at PHCs
State-wise total specialists at CHCs
State-wise radiographers at CHCs
12
Infrastructure
State-wise pharmacists at PHCs &CHCs
State-wise laboratory technicians at PHCs &CHCs
State-wise nursing staff at PHCs &CHCs
Status of Facilities Available
Facilities available at sub centres
Facilities available at primary health centres
Facilities available at community health centres
Utilisation of health services (WHO Annual report)
Contraceptive prevalence
Antenatal care
Births attended by skilled health personal
Immunisation
Smear positive TB treatment success.
Economic
GSDP
State health expenditure
Per capita heath expenditure
13
4. Data Collection and Preparation
The study collected data from several sources. It used the resources available in the libraries and reports and databases as available from websites of government departments, development organisations and research and consulting companies. The effort was to collect data on as many items as possible for each state for the last five year. This step became critical in choosing the items for further analysis. Several sources were used to collect the data. Three factors were considered in choosing the sources and extent of data: (a) the data is available for each state, (b) it is available for five years and (c) the source is credible and acceptable to the stakeholders. Under these three conditions, some of the items were dropped. Diseases which had low incidences (less than 1000 per lakh population) were removed.
14
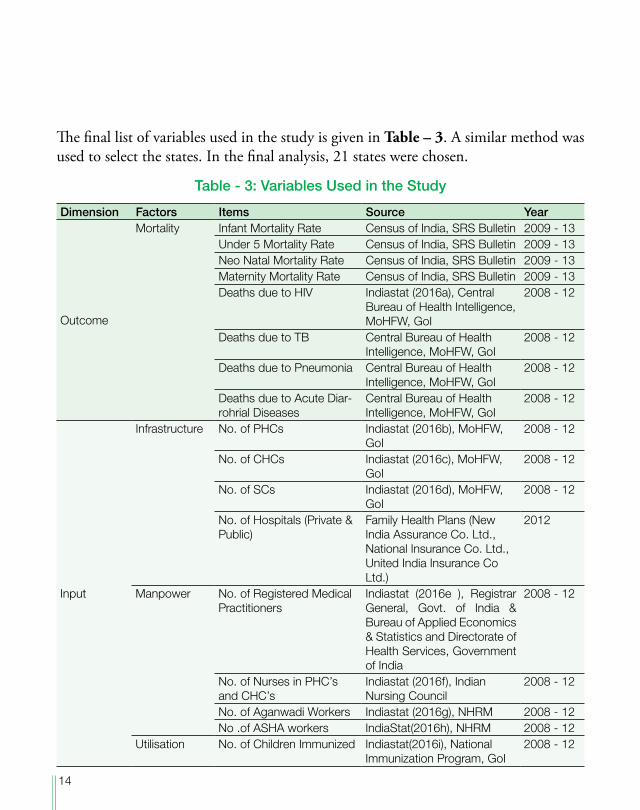
The final list of variables used in the study is given in Table – 3. A similar method was used to select the states. In the final analysis, 21 states were chosen.
Table - 3: Variables Used in the Study
Dimension Factors Items Source Year
Outcome
Mortality Infant Mortality Rate Census of India, SRS Bulletin 2009 - 13Under 5 Mortality Rate Census of India, SRS Bulletin 2009 - 13Neo Natal Mortality Rate Census of India, SRS Bulletin 2009 - 13Maternity Mortality Rate Census of India, SRS Bulletin 2009 - 13Deaths due to HIV Indiastat (2016a), Central
Bureau of Health Intelligence, MoHFW, GoI
2008 - 12
Deaths due to TB Central Bureau of Health Intelligence, MoHFW, GoI
2008 - 12
Deaths due to Pneumonia Central Bureau of Health Intelligence, MoHFW, GoI
2008 - 12
Deaths due to Acute Diar-rohrial Diseases
Central Bureau of Health Intelligence, MoHFW, GoI
2008 - 12
Input
Infrastructure No. of PHCs Indiastat (2016b), MoHFW, GoI
2008 - 12
No. of CHCs Indiastat (2016c), MoHFW, GoI
2008 - 12
No. of SCs Indiastat (2016d), MoHFW, GoI
2008 - 12
No. of Hospitals (Private & Public)
Family Health Plans (New India Assurance Co. Ltd., National Insurance Co. Ltd., United India Insurance Co Ltd.)
2012
Manpower No. of Registered Medical Practitioners
Indiastat (2016e ), Registrar General, Govt. of India & Bureau of Applied Economics & Statistics and Directorate of Health Services, Government of India
2008 - 12
No. of Nurses in PHC’s and CHC’s
Indiastat (2016f), Indian Nursing Council
2008 - 12
No. of Aganwadi Workers Indiastat (2016g), NHRM 2008 - 12No .of ASHA workers IndiaStat(2016h), NHRM 2008 - 12
Utilisation No. of Children Immunized Indiastat(2016i), National Immunization Program, GoI
2008 - 12
15
The data so obtained was further cleaned for accuracy and units. A small set of missing data was filled in relation to the proximous state identified on the basis of SGDP. The final number was arrived based on a coefficient derived based on health expenditure. Data was collected for five years. A one year lag was considered for the outcome data. Thus the data for input items was collected for the year 2008 – 12, whereas, data for outcome items was collected for 2009 – 13. In a further refinement, children mortality was indicated by number of deaths under the age of 5 years as other measures in the category were included in this number. According to WHO, infant are defined as young children who are less than 1 year of age. Under 5 mortality rate is determined by the number of children under five years of age dying in a given year. Maternal Mortality is the death of a woman while pregnant or within 42 days of termination of pregnancy, irrespective of the duration and site of the pregnancy, from any cause related to or aggravated by the pregnancy or its management but not from accidental or incidental causes. MMR has been considered as the number of women dying of pregnancy-related causes in a given year.4 All data was converted to per lakh of population. It was then normalised using mean and standard deviation.
4(N. D.) 2016, Humanitarian Health Action, World Health Organisation. http://www.who.int/hac/about/defini-tions/en/
16
5. Data Analysis
Two methods were applied to arrive at the scores for each of the states. In the first case a regression analysis was used. Outcome variables were considered as dependent variables. Child mortality was chosen as the variable. When regressed on input variables, the results did not indicate any clear direction. When a correlation matrix was generated, it was found that only a few of the input variables were correlated to the outcome. There were also incidences of multi-collinearity. It was also felt that the economic variables may create a nested situation since the inputs created by the state would be a function of the budget allocated for health. Hence, this method was not pursued.
Most methods of developing an index have used a weighted sum approach. The second method followed this approach. It applied factor analysis to arrive at the weights. Factor analysis helps to reduce the number of observed variables into smaller number of variables which account for the most of the variance in the observed variables.5 Analysis was carried out with all variables put together. The results were jumbled up and seemed confounded. The findings clearly hinted at the problem as was faced during the regression method. It was decided to carry out factor analysis separately for input and outcome. We applied Factor analysis to assign weights to each of the variables on the normalised data set. SPSS-22 was used for the same. The analysis was carried out at two stages. In the first stage, weights of each of the items were determined based on the factor loadings of each item. Using the normalised scores and these weights, a summated weighted score was arrived for each of the input factors. A second level factor analysis was carried out using the weighted scores for each factor for that dimensions. The factor loading so arrived was used to arrive at a summated score for the input dimension.
5Young, G. and Pearse, S (2013), A Beginner’s Guide to Factor Analysis: Focusing on Exploratory Factor Analysis”, Tuto-rials in Quantitative Methods for Psychology, Vol. 9(2), p. 79-94.
17
6. Findings
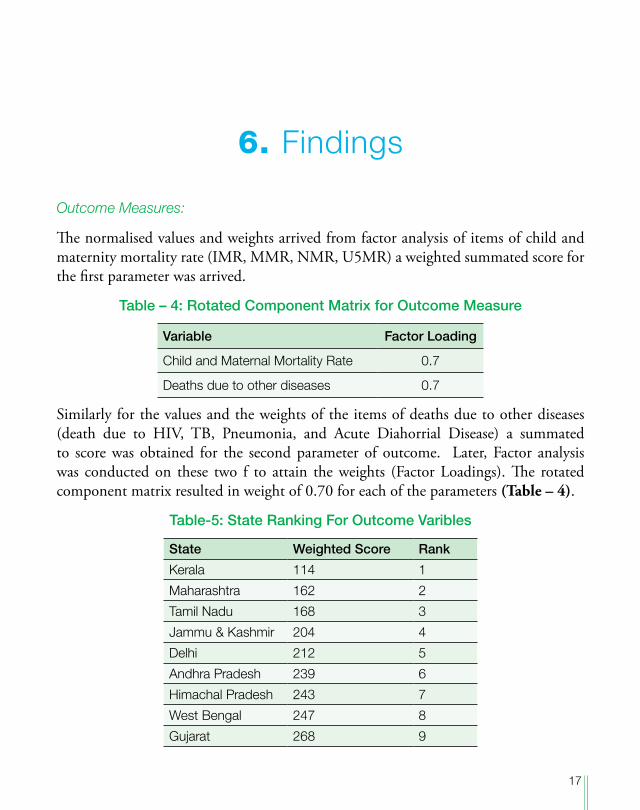
Outcome Measures:
The normalised values and weights arrived from factor analysis of items of child and maternity mortality rate (IMR, MMR, NMR, U5MR) a weighted summated score for the first parameter was arrived.
Table – 4: Rotated Component Matrix for Outcome Measure
Variable Factor Loading
Child and Maternal Mortality Rate 0.7
Deaths due to other diseases 0.7
Similarly for the values and the weights of the items of deaths due to other diseases (death due to HIV, TB, Pneumonia, and Acute Diahorrial Disease) a summated to score was obtained for the second parameter of outcome. Later, Factor analysis was conducted on these two f to attain the weights (Factor Loadings). The rotated component matrix resulted in weight of 0.70 for each of the parameters (Table – 4).
Table-5: State Ranking For Outcome Varibles
State Weighted Score Rank
Kerala 114 1
Maharashtra 162 2
Tamil Nadu 168 3
Jammu & Kashmir 204 4
Delhi 212 5
Andhra Pradesh 239 6
Himachal Pradesh 243 7
West Bengal 247 8
Gujarat 268 9
18
State Weighted Score Rank
Punjab 275 10
Karnataka 276 11
Haryana 295 12
Bihar 422 13
Jharkhand 423 14
Chhattisgarh 457 15
Orissa 473 16
Madhya Pradesh 480 17
Rajasthan 485 18
Uttaranchal 526 19
Uttar Pradesh 558 20
Assam 595 21
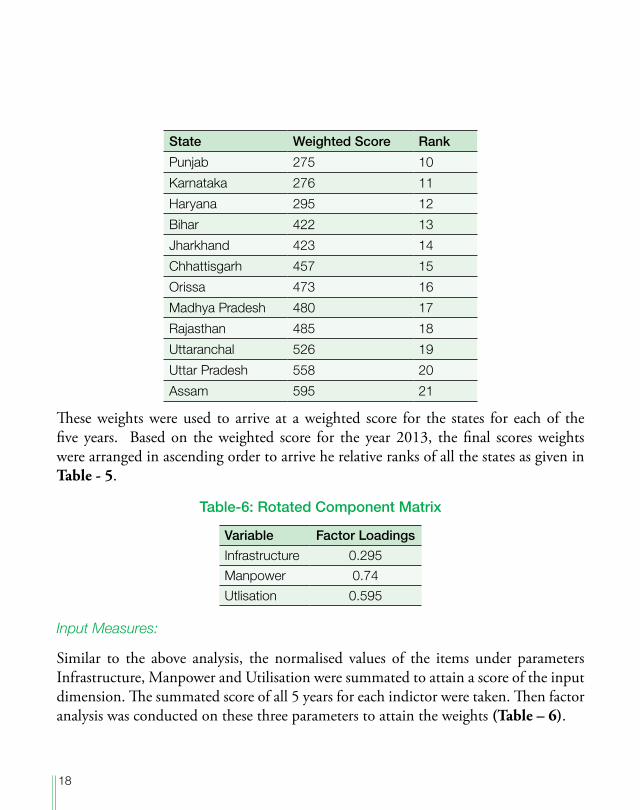
These weights were used to arrive at a weighted score for the states for each of the five years. Based on the weighted score for the year 2013, the final scores weights were arranged in ascending order to arrive he relative ranks of all the states as given in Table - 5.
Table-6: Rotated Component Matrix
Variable Factor Loadings
Infrastructure 0.295Manpower 0.74Utlisation 0.595
Input Measures:
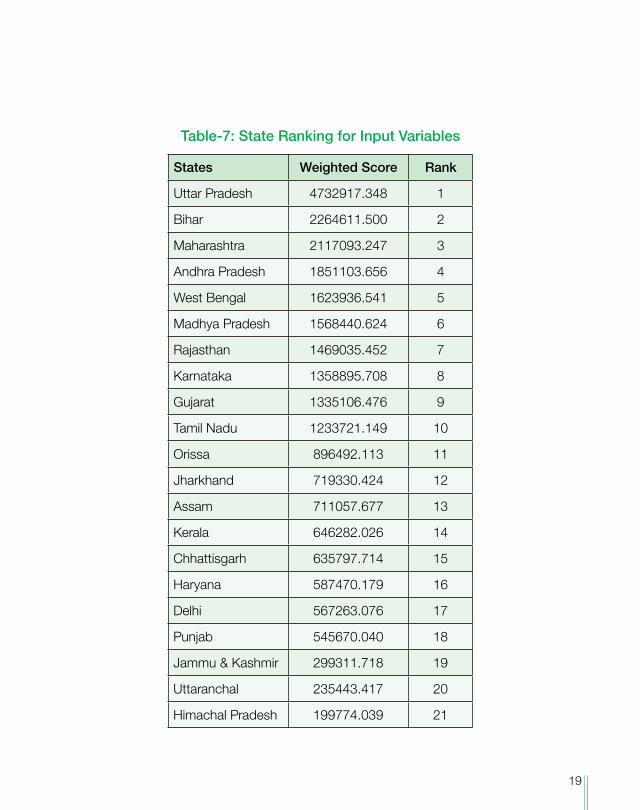
Similar to the above analysis, the normalised values of the items under parameters Infrastructure, Manpower and Utilisation were summated to attain a score of the input dimension. The summated score of all 5 years for each indictor were taken. Then factor analysis was conducted on these three parameters to attain the weights (Table – 6).
19
Table-7: State Ranking for Input Variables
States Weighted Score Rank
Uttar Pradesh 4732917.348 1
Bihar 2264611.500 2
Maharashtra 2117093.247 3
Andhra Pradesh 1851103.656 4
West Bengal 1623936.541 5
Madhya Pradesh 1568440.624 6
Rajasthan 1469035.452 7
Karnataka 1358895.708 8
Gujarat 1335106.476 9
Tamil Nadu 1233721.149 10
Orissa 896492.113 11
Jharkhand 719330.424 12
Assam 711057.677 13
Kerala 646282.026 14
Chhattisgarh 635797.714 15
Haryana 587470.179 16
Delhi 567263.076 17
Punjab 545670.040 18
Jammu & Kashmir 299311.718 19
Uttaranchal 235443.417 20
Himachal Pradesh 199774.039 21
20
In the second stage weighted values of each item within each indicator were added which resulted in a summated weighted scores all 5 years for each of the states. Based on the weighted score for the year 2012, states were arranged in descending order as a higher score would indicate a better position of the state (Table – 7).
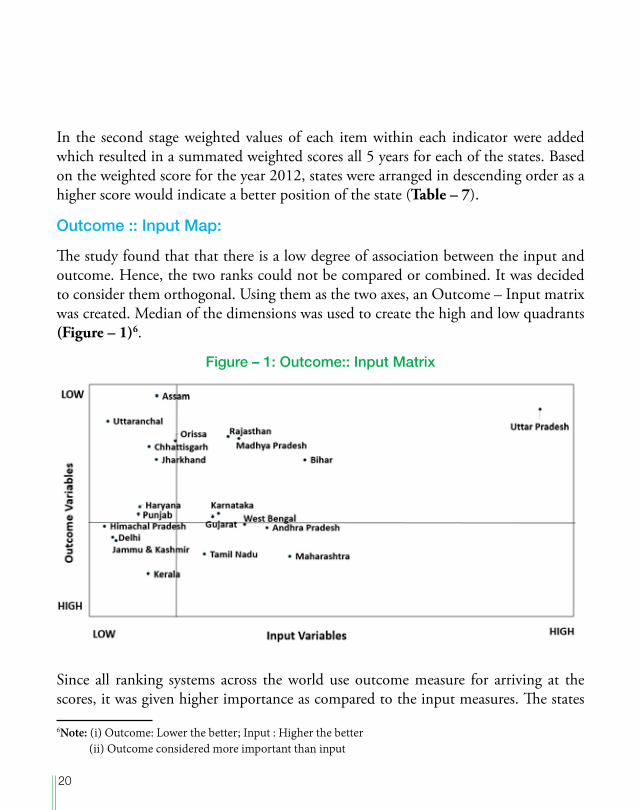
Outcome :: Input Map:
The study found that that there is a low degree of association between the input and outcome. Hence, the two ranks could not be compared or combined. It was decided to consider them orthogonal. Using them as the two axes, an Outcome – Input matrix was created. Median of the dimensions was used to create the high and low quadrants (Figure – 1)6.
Figure – 1: Outcome:: Input Matrix
Since all ranking systems across the world use outcome measure for arriving at the scores, it was given higher importance as compared to the input measures. The states
6Note: (i) Outcome: Lower the better; Input : Higher the better (ii) Outcome considered more important than input
21
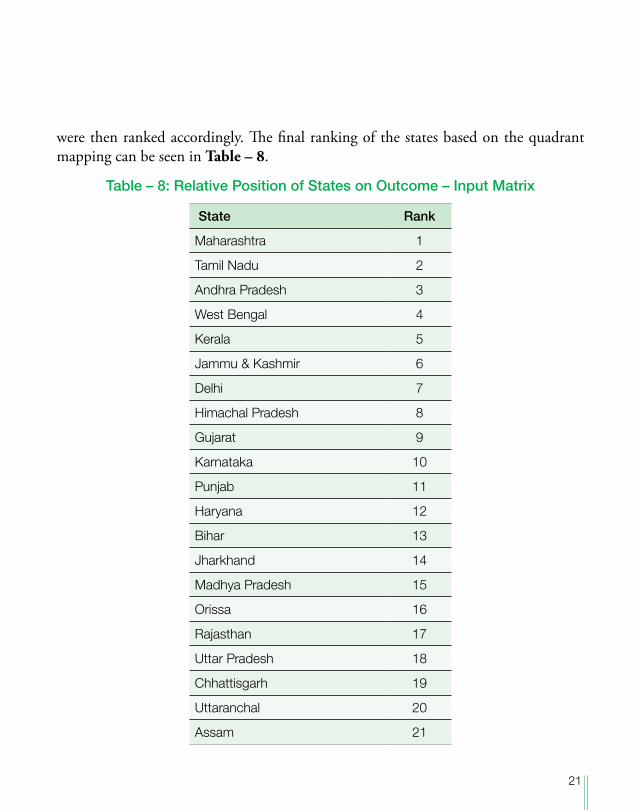
were then ranked accordingly. The final ranking of the states based on the quadrant mapping can be seen in Table – 8.
Table – 8: Relative Position of States on Outcome – Input Matrix
State Rank
Maharashtra 1
Tamil Nadu 2
Andhra Pradesh 3
West Bengal 4
Kerala 5
Jammu & Kashmir 6
Delhi 7
Himachal Pradesh 8
Gujarat 9
Karnataka 10
Punjab 11
Haryana 12
Bihar 13
Jharkhand 14
Madhya Pradesh 15
Orissa 16
Rajasthan 17
Uttar Pradesh 18
Chhattisgarh 19
Uttaranchal 20
Assam 21
22
7. Classification of States
The input::outcome matrix divided the states in 4 quadrants. It indicated that while resources are important, implementation of the initiatives to achieve the desired outcome is equally important. It also brings out that states and their policies need to be developed as suitable for the each of the states. It is expected that such segmentation would help in developing more focussed policies as well as fine tuning health policies for states and also at a level of cluster of states. The states could be divided into four classes:
High performers:
Maharashtra, Tamil Nadu and Kerala are high performing states. These states are performing well with respect to the inputs made available or created in the state. Kerala scores highest in outcome but falls to a lower rank due to resources.
Middling Performers:
Jammu and Kashmir, Delhi, Andhra Pradesh, West Bengal, Himachal Pradesh, Gujarat, Punjab, Haryana and Karnataka and lie in the low input and high outcome quadrant. Their performance falls in the middle range.
Strugglers:
Jharkhand, Bihar, Chhattisgarh, Orissa, Madhya Pradesh, Rajasthan, Uttar Pradesh, Uttaranchal and Assam are making efforts to come on the higher outcome performance. Of these states, Uttaranchal, Assam and Orissa are the poorest in terms of the resources available to them as well as lag behind in terms of come.

23
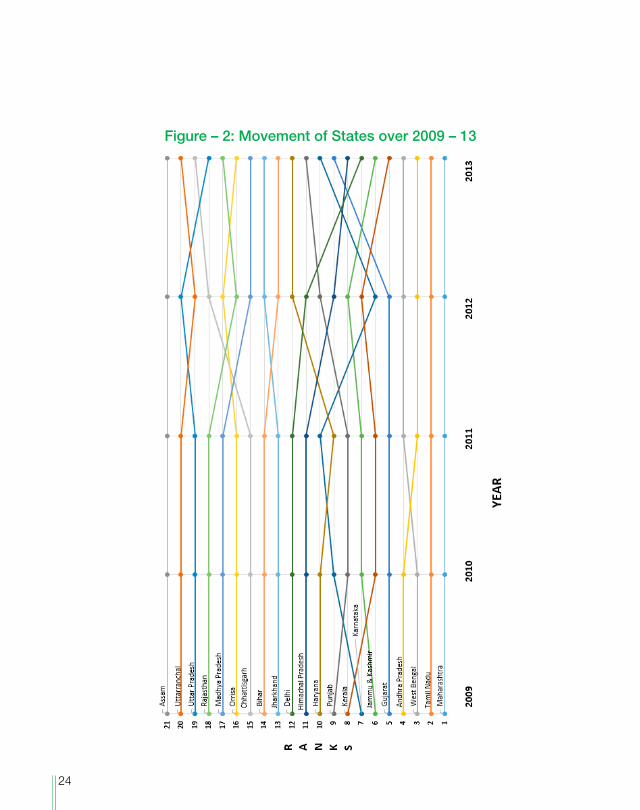
A time series based research was conducted to track the performance of the state on individual basis. Five year performance based on the outcome: input matrix can be seen in Figure – 2.
24
Figure – 2: Movement of States over 2009 – 13
25
8. Conclusion
The study uses a unique outcome-input matrix that throws some valuable insights. Not only does it help in showing relative status of states, it also indicates as to which states are performing better with limited resources and which are not utilising the resources to the maximum level. There are some states which are performing low because the resources available to them are limited. Very few states are performing well. This study can be used by the government to analyse the current position of the states and identify focussed policies to be worked upon.
The current research has an enormous scope for further research in analysing the performance of the states. Since the data was not available for all the states; more updated and adequate data can be incorporated in further research. Some new variables can be included in the
outcome and input parameters depending upon the availability of the data on the secondary sources.
9. Data Sources
1. Census of India (2009). SRS Bulletin, Sample registration System, Vol 44, No.1. Retrieved From: http://censusindia.gov.in
2. Census of India (2010). SRS Bulletin, Sample registration System, Vol 45, No.1. Retrieved From: http://www.censusindia.gov.in
3. Census of India (2011). SRS Bulletin, Sample registration System, Vol 46, No.1. Retrieved from: http://www.censusindia.gov.in
4. Census of India (2012). SRS Bulletin, Sample registration System, Vol 47, No.1. Retrieved From: http://www.censusindia.gov.in
5. Census of India (2013). SRS Bulletin, Sample registration System, Vol 48, No.2. Retrieved From:http://planningcommission.nic.in
6. Family Health Plan (2015). Retrieved from: https://www.fhpl.net
7. Indiastat.com (2016a). Retrieved from: http://www.indiastat.com
8. Indiastat.com (2016b). Retrieved from: http://www.indiastat.com
9. Indiastat.com (2016c). Retrieved from: http://www.indiastat.com
10. Indiastat.com (2016d). Retrieved from: http://www.indiastat.com
11. Indiastat.com (2016e). Retrieved from: http://www.indiastat.com
12. Indiastat.com (2016f ). Retrieved from: http://www.indiastat.com
13. Indiastat.com (2016g). Retrieved from: http://www.indiastat.com
14. Indiastat.com (2016h). Retrieved from: http://www.indiastat.com