development activity report - may 2016
TRANSCRIPT
May 2016
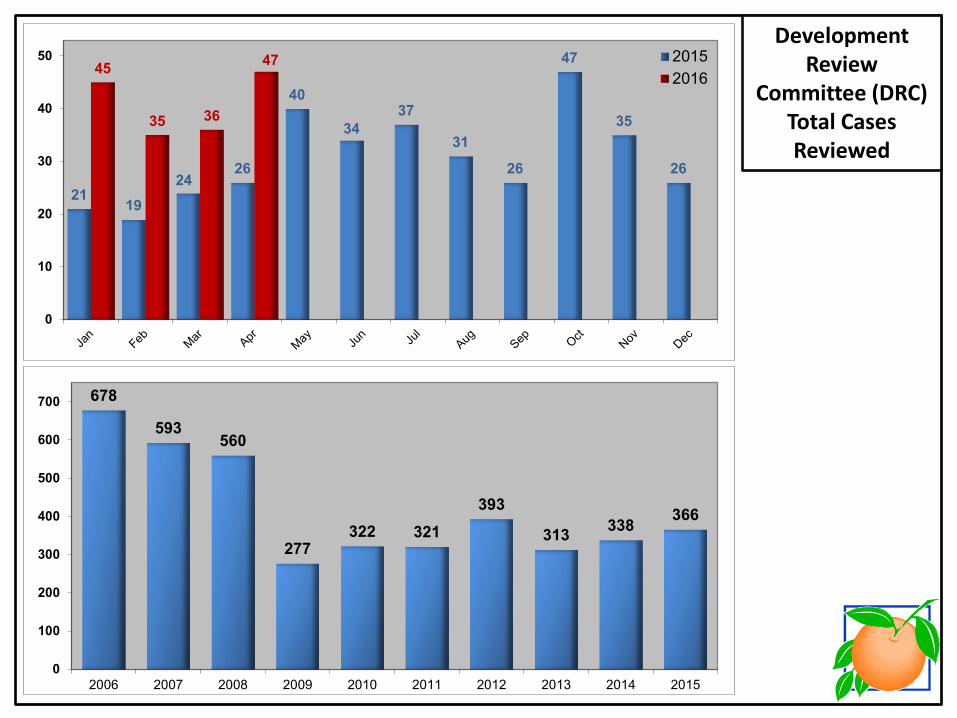
21 19
24 26
40
34 37
31
26
47
35
26
45
35 36
47
0
10
20
30
40
50 20152016
678
593 560
277 322 321
393
313 338 366
0
100
200
300
400
500
600
700
2006 2007 2008 2009 2010 2011 2012 2013 2014 2015
Development Review
Committee (DRC) Total Cases Reviewed
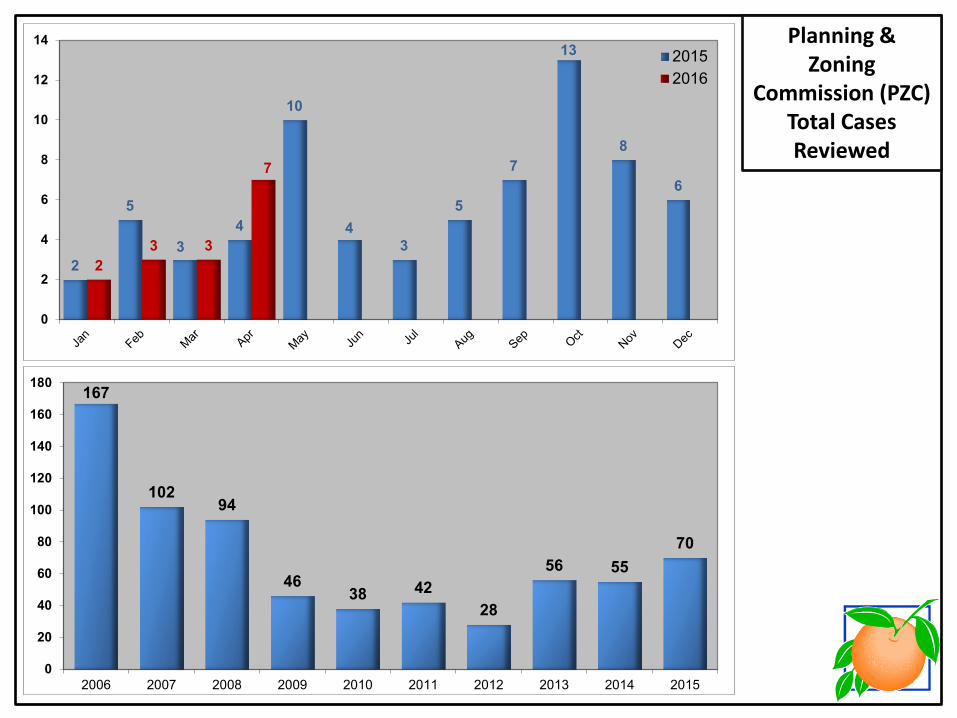
2
5
3 4
10
4 3
5
7
13
8
6
2 3 3
7
0
2
4
6
8
10
12
1420152016
167
102 94
46 38 42
28
56 55 70
0
20
40
60
80
100
120
140
160
180
2006 2007 2008 2009 2010 2011 2012 2013 2014 2015
Planning & Zoning
Commission (PZC) Total Cases Reviewed
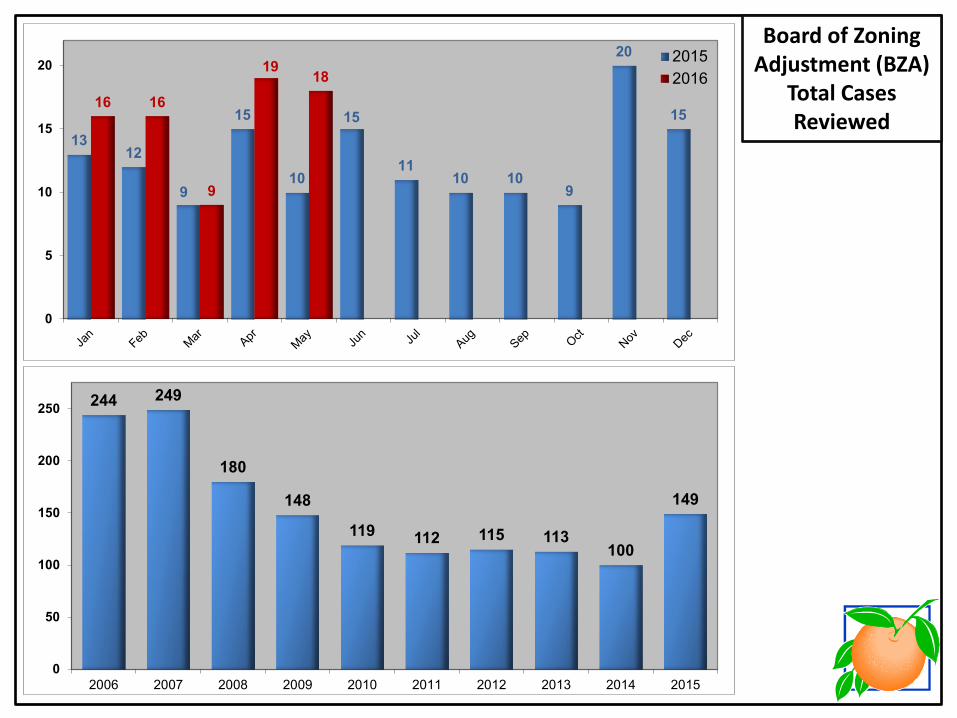
13 12
9
15
10
15
11 10 10
9
20
15 16 16
9
19 18
0
5
10
15
20 20152016
244 249
180
148
119 112 115 113 100
149
0
50
100
150
200
250
2006 2007 2008 2009 2010 2011 2012 2013 2014 2015
Board of Zoning Adjustment (BZA)
Total Cases Reviewed
70
57
31 32
11
28 34
52 58
79
0
10
20
30
40
50
60
70
80
90
2006 2007 2008 2009 2010 2011 2012 2013 2014 2015
4
7
11
6 5
8
4 5
4
13
6 6
3
5
7 7
0
2
4
6
8
10
12
1420152016
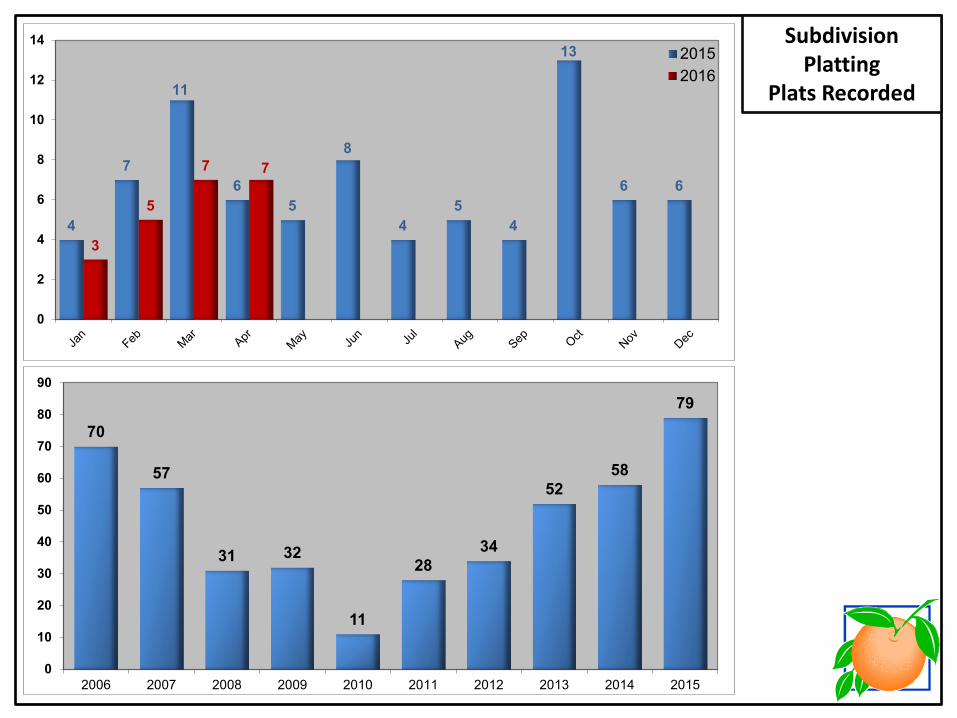
Subdivision Platting
Plats Recorded
4,475
2,784
384 473 493
1,105 1,197
2,374
3,870 4,272
0
500
1,000
1,500
2,000
2,500
3,000
3,500
4,000
4,500
5,000
2006 2007 2008 2009 2010 2011 2012 2013 2014 2015
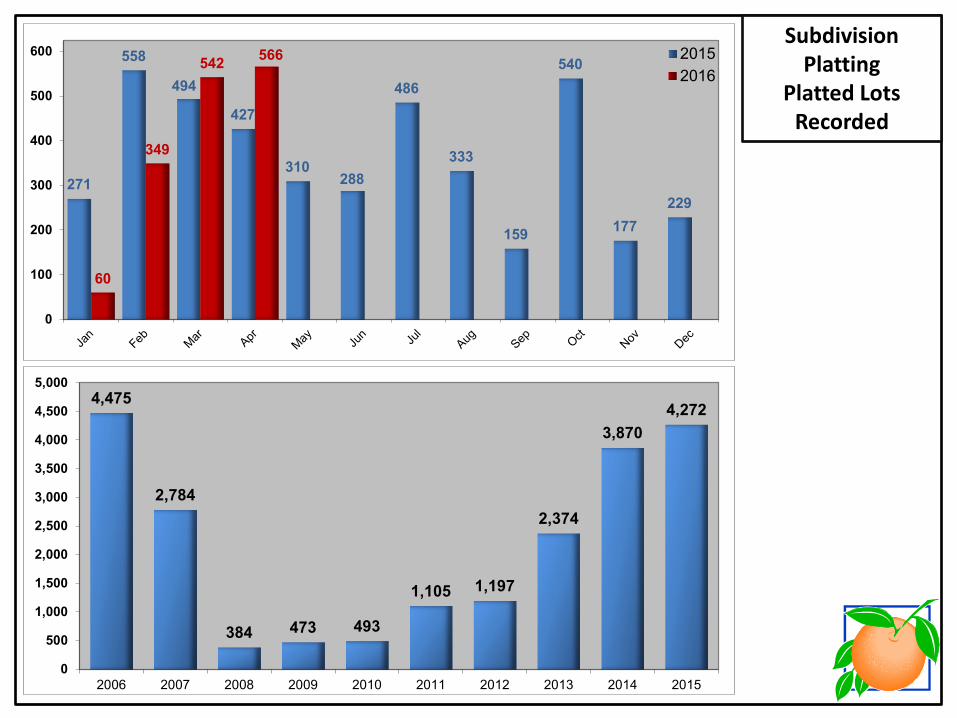
271
558
494
427
310 288
486
333
159
540
177 229
60
349
542 566
0
100
200
300
400
500
600 20152016
Subdivision Platting
Platted Lots Recorded
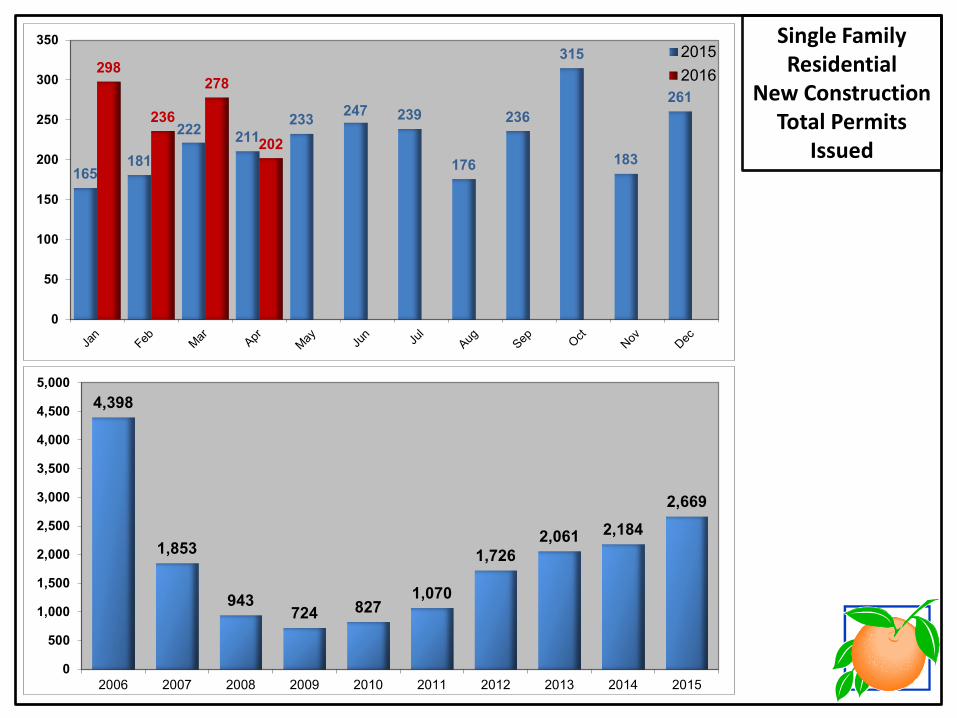
4,398
1,853
943 724 827
1,070
1,726 2,061 2,184
2,669
0
500
1,000
1,500
2,000
2,500
3,000
3,500
4,000
4,500
5,000
2006 2007 2008 2009 2010 2011 2012 2013 2014 2015
165 181
222 211 233 247 239
176
236
315
183
261
298
236
278
202
0
50
100
150
200
250
300
35020152016
Single Family Residential
New Construction Total Permits
Issued
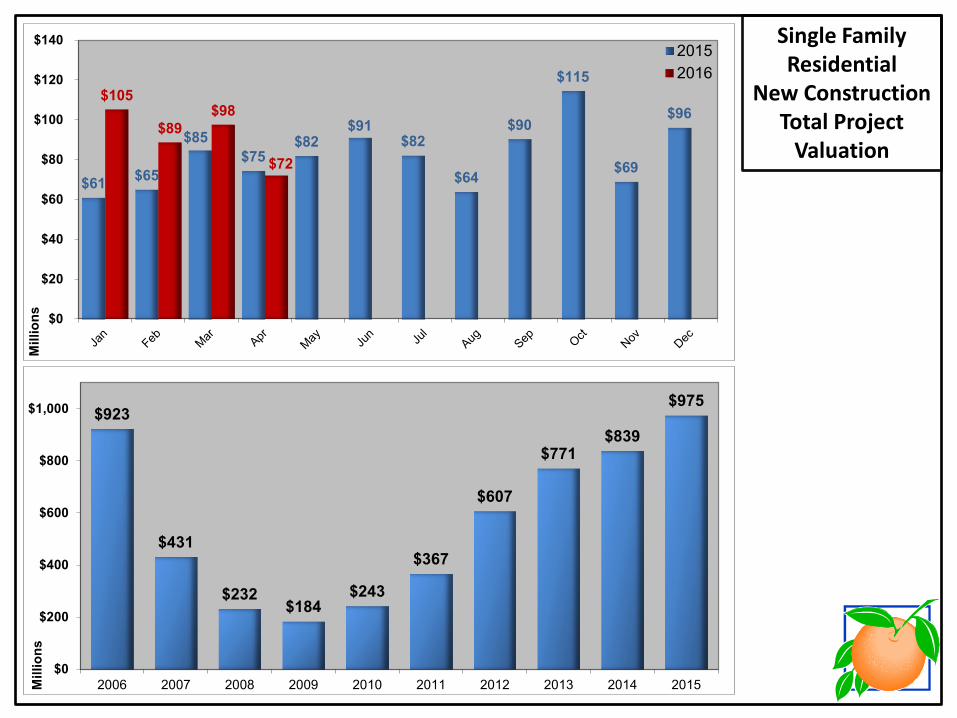
$61 $65
$85 $75
$82 $91
$82
$64
$90
$115
$69
$96 $105
$89 $98
$72
$0
$20
$40
$60
$80
$100
$120
$140M
illio
ns
20152016
$923
$431
$232 $184
$243
$367
$607
$771 $839
$975
$0
$200
$400
$600
$800
$1,000
2006 2007 2008 2009 2010 2011 2012 2013 2014 2015Mill
ions
Single Family Residential
New Construction Total Project
Valuation
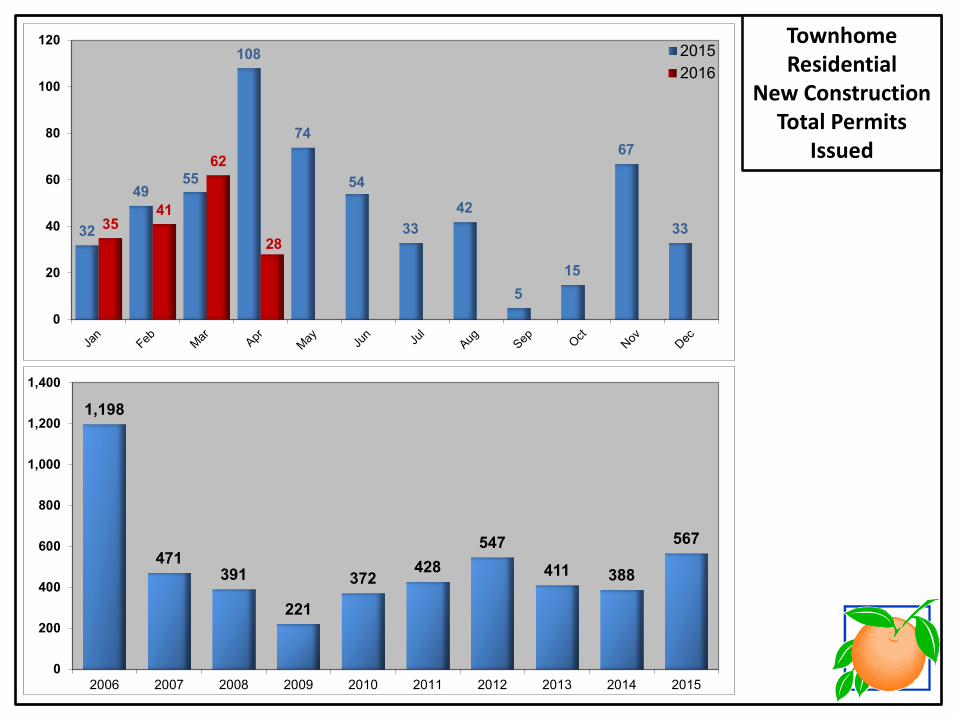
32
49 55
108
74
54
33 42
5 15
67
33 35 41
62
28
0
20
40
60
80
100
12020152016
1,198
471 391
221
372 428
547
411 388
567
0
200
400
600
800
1,000
1,200
1,400
2006 2007 2008 2009 2010 2011 2012 2013 2014 2015
Townhome Residential
New Construction Total Permits
Issued
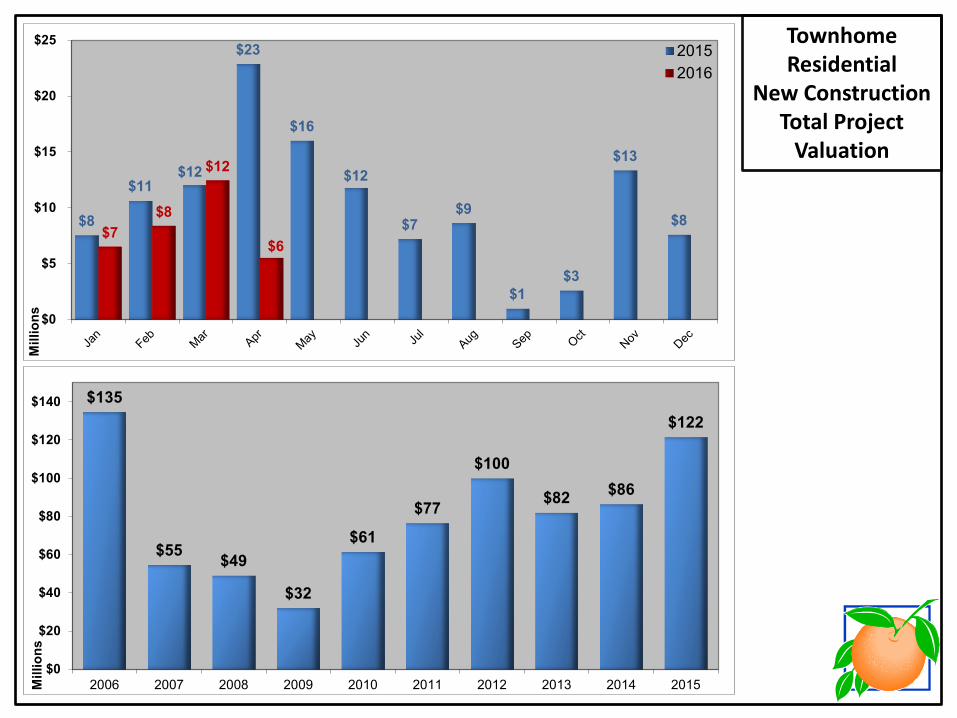
$8
$11 $12
$23
$16
$12
$7 $9
$1 $3
$13
$8 $7
$8
$12
$6
$0
$5
$10
$15
$20
$25M
illio
ns
20152016
$135
$55 $49
$32
$61
$77
$100
$82 $86
$122
$0
$20
$40
$60
$80
$100
$120
$140
2006 2007 2008 2009 2010 2011 2012 2013 2014 2015Mill
ions
Townhome Residential
New Construction Total Project
Valuation
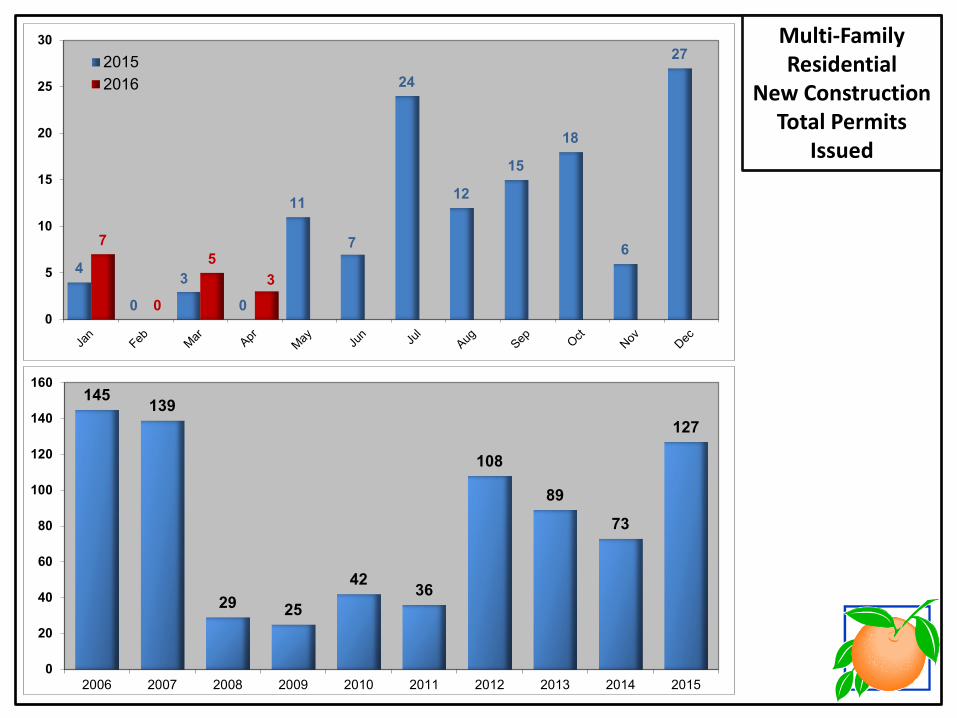
4
0
3
0
11
7
24
12
15
18
6
27
7
0
5 3
0
5
10
15
20
25
3020152016
145 139
29 25
42 36
108
89
73
127
0
20
40
60
80
100
120
140
160
2006 2007 2008 2009 2010 2011 2012 2013 2014 2015
Multi-Family Residential
New Construction Total Permits
Issued
$136
$186
$75
$35 $46
$100
$226 $245
$216
$306
$0
$50
$100
$150
$200
$250
$300
$350
2006 2007 2008 2009 2010 2011 2012 2013 2014 2015Mill
ions
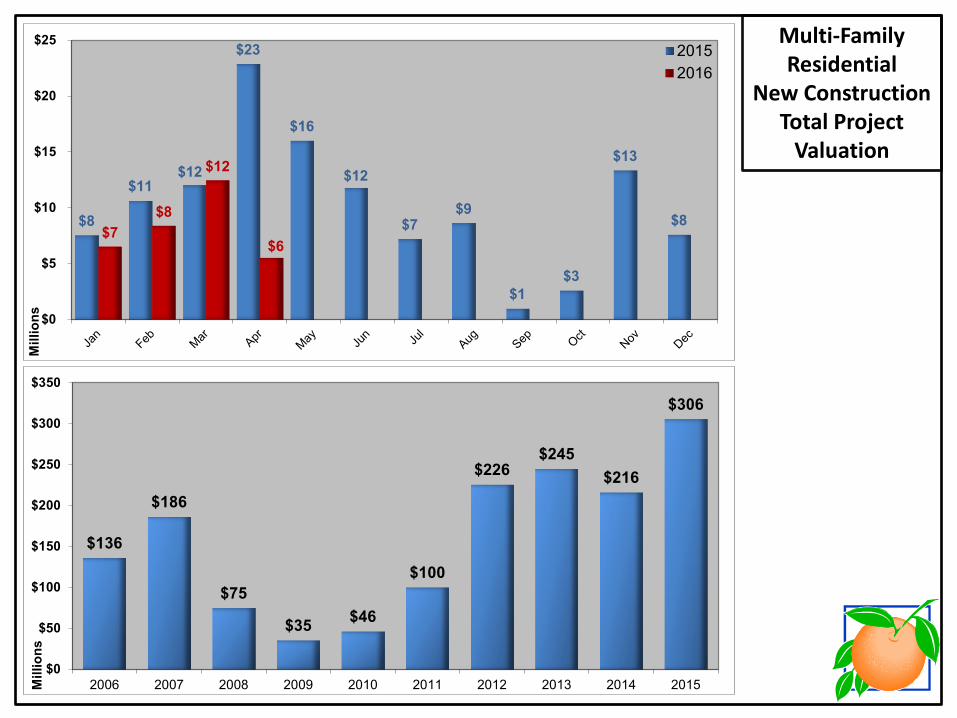
$8
$11 $12
$23
$16
$12
$7 $9
$1 $3
$13
$8 $7
$8
$12
$6
$0
$5
$10
$15
$20
$25M
illio
ns
20152016
Multi-Family Residential
New Construction Total Project
Valuation
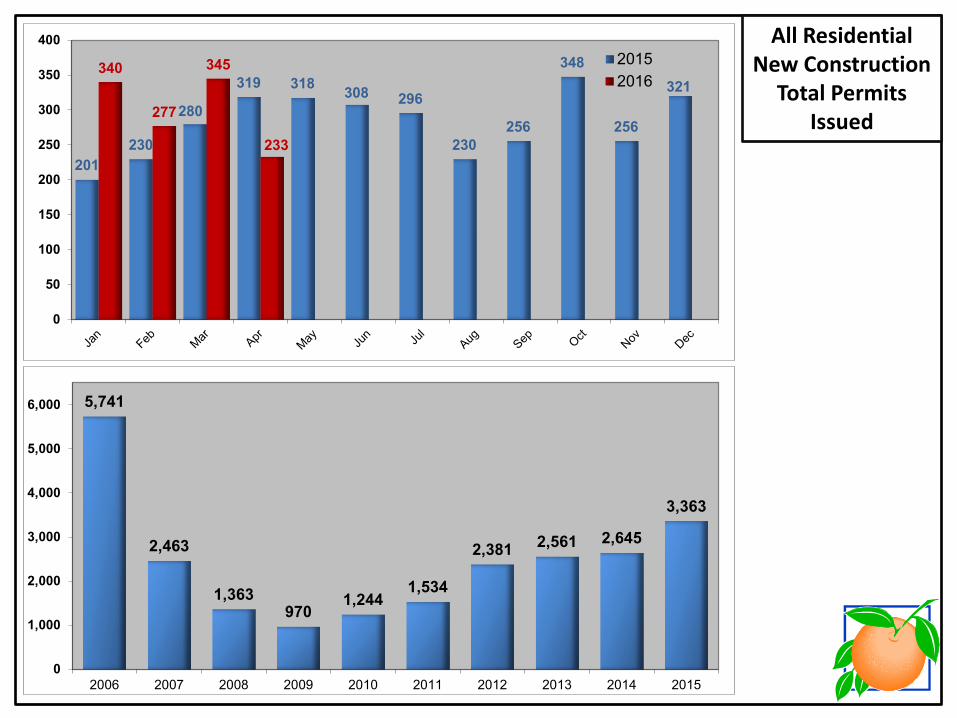
201 230
280
319 318 308 296
230 256
348
256
321 340
277
345
233
0
50
100
150
200
250
300
350
40020152016
5,741
2,463
1,363 970
1,244 1,534
2,381 2,561 2,645
3,363
0
1,000
2,000
3,000
4,000
5,000
6,000
2006 2007 2008 2009 2010 2011 2012 2013 2014 2015
All Residential New Construction
Total Permits Issued
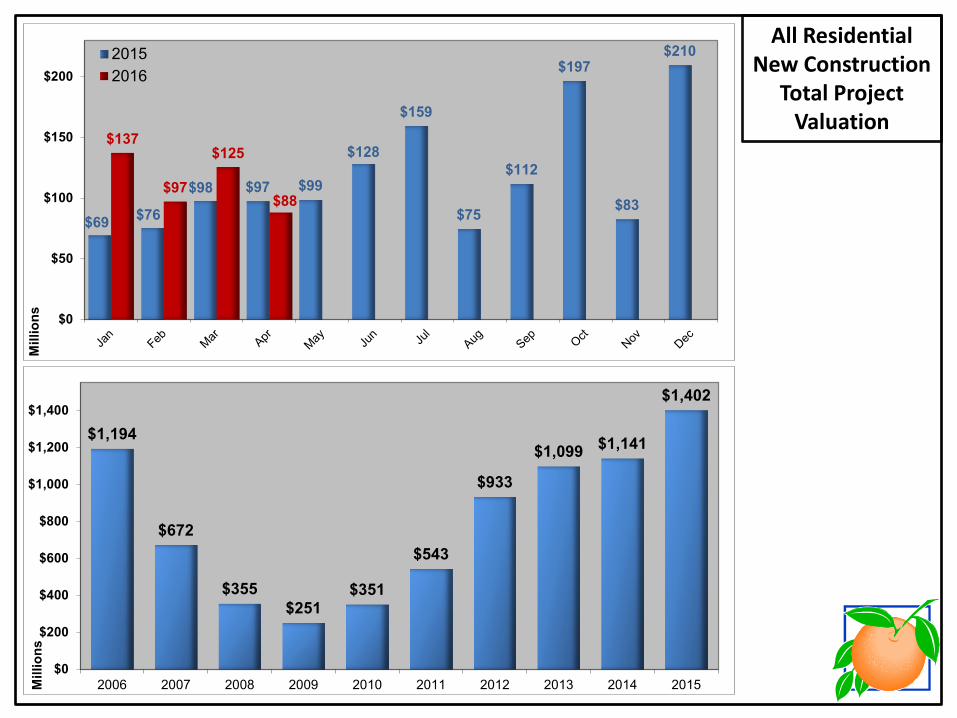
$69 $76
$98 $97 $99
$128
$159
$75
$112
$197
$83
$210
$137
$97
$125
$88
$0
$50
$100
$150
$200
Mill
ions
20152016
$1,194
$672
$355 $251
$351
$543
$933
$1,099 $1,141
$1,402
$0
$200
$400
$600
$800
$1,000
$1,200
$1,400
2006 2007 2008 2009 2010 2011 2012 2013 2014 2015Mill
ions
All Residential
New Construction Total Project
Valuation
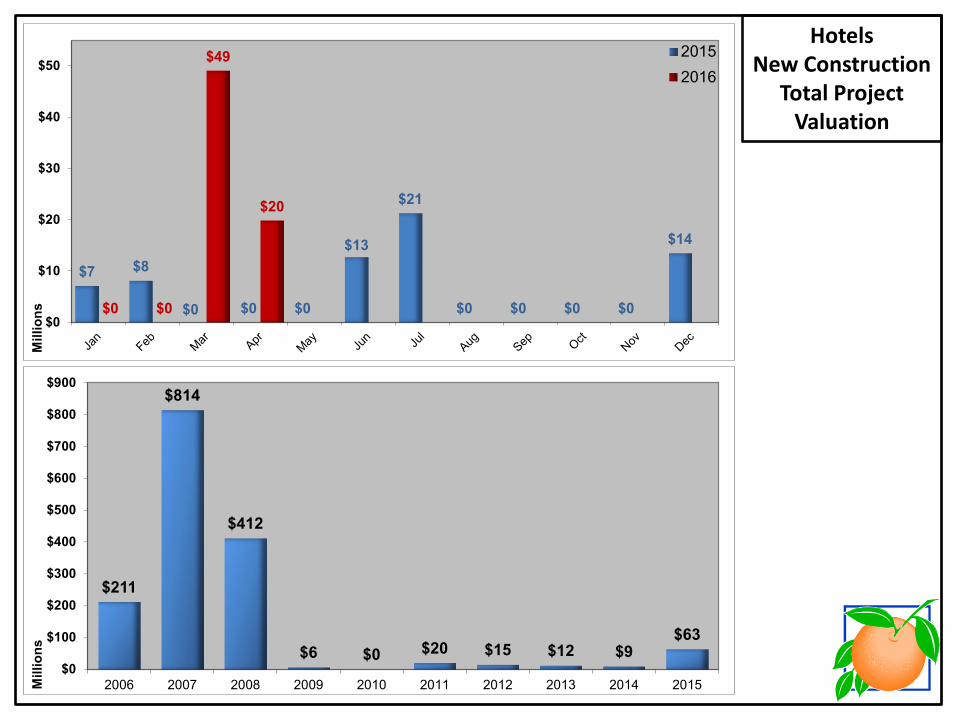
$7 $8
$0 $0 $0
$13
$21
$0 $0 $0 $0
$14
$0 $0
$49
$20
$0
$10
$20
$30
$40
$50
Mill
ions
20152016
$211
$814
$412
$6 $0 $20 $15 $12 $9 $63
$0
$100
$200
$300
$400
$500
$600
$700
$800
$900
2006 2007 2008 2009 2010 2011 2012 2013 2014 2015Mill
ions
Hotels
New Construction Total Project
Valuation
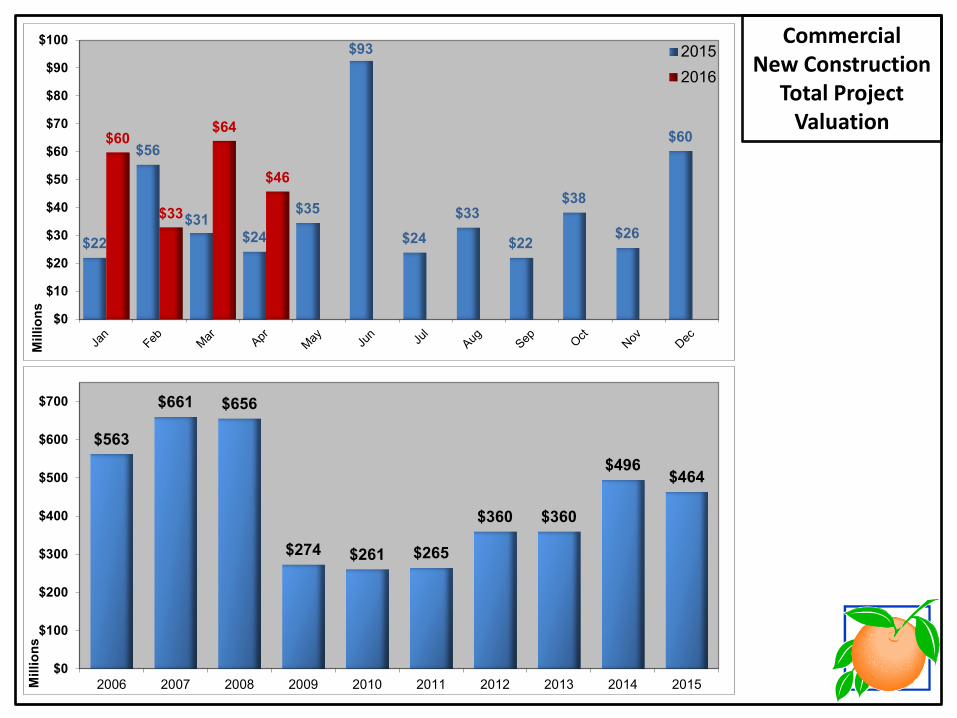
$563
$661 $656
$274 $261 $265
$360 $360
$496 $464
$0
$100
$200
$300
$400
$500
$600
$700
2006 2007 2008 2009 2010 2011 2012 2013 2014 2015Mill
ions
Commercial
New Construction Total Project
Valuation
$22
$56
$31 $24
$35
$93
$24 $33
$22
$38
$26
$60 $60
$33
$64
$46
$0
$10
$20
$30
$40
$50
$60
$70
$80
$90
$100M
illio
ns
20152016
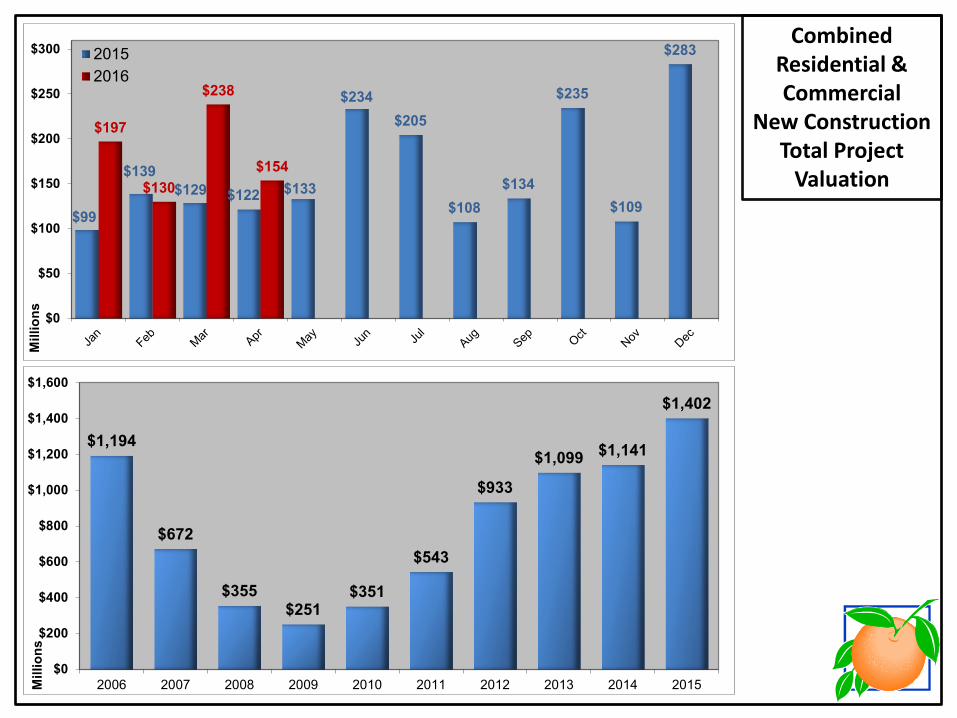
$99
$139 $129 $122 $133
$234 $205
$108 $134
$235
$109
$283
$197
$130
$238
$154
$0
$50
$100
$150
$200
$250
$300M
illio
ns
20152016
$1,194
$672
$355 $251
$351
$543
$933
$1,099 $1,141
$1,402
$0
$200
$400
$600
$800
$1,000
$1,200
$1,400
$1,600
2006 2007 2008 2009 2010 2011 2012 2013 2014 2015Mill
ions
Combined
Residential & Commercial
New Construction Total Project
Valuation
95,663 90,294
72,070
57,892 54,562 62,401
71,317 74,135 80,668
90,380
0
20,000
40,000
60,000
80,000
100,000
2006 2007 2008 2009 2010 2011 2012 2013 2014 2015
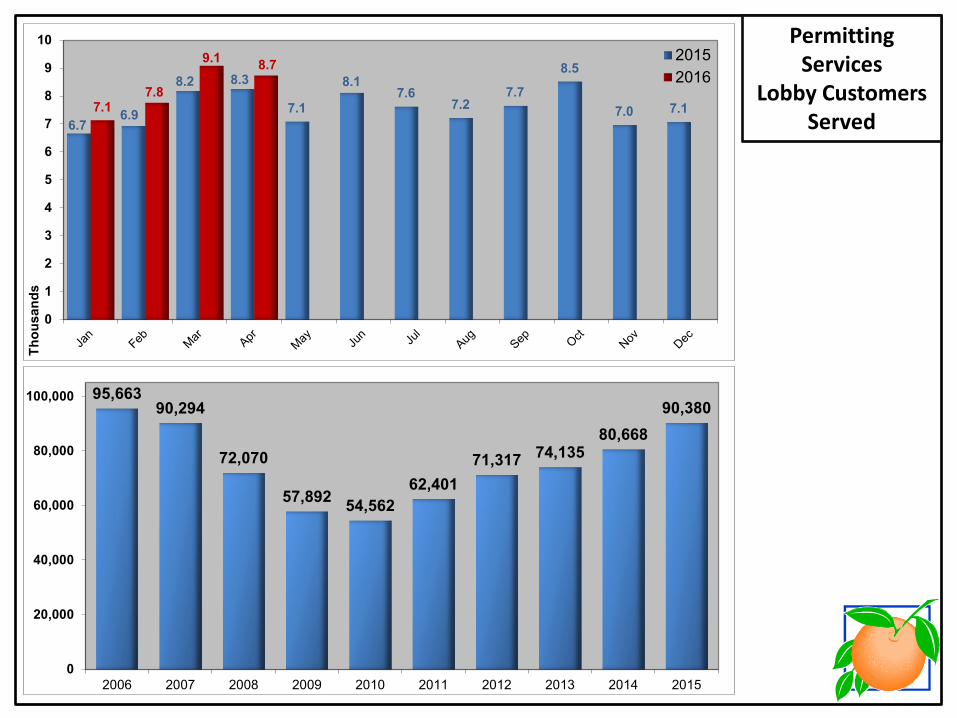
6.7 6.9
8.2 8.3
7.1
8.1 7.6
7.2 7.7
8.5
7.0 7.1 7.1 7.8
9.1 8.7
0
1
2
3
4
5
6
7
8
9
10Th
ousa
nds
20152016
Permitting Services
Lobby Customers Served
131.7
113.2
86.7 77.2 75.0 75.5
91.6 96.4 104.7
116.9
0
20
40
60
80
100
120
140
2006 2007 2008 2009 2010 2011 2012 2013 2014 2015Thou
sand
s
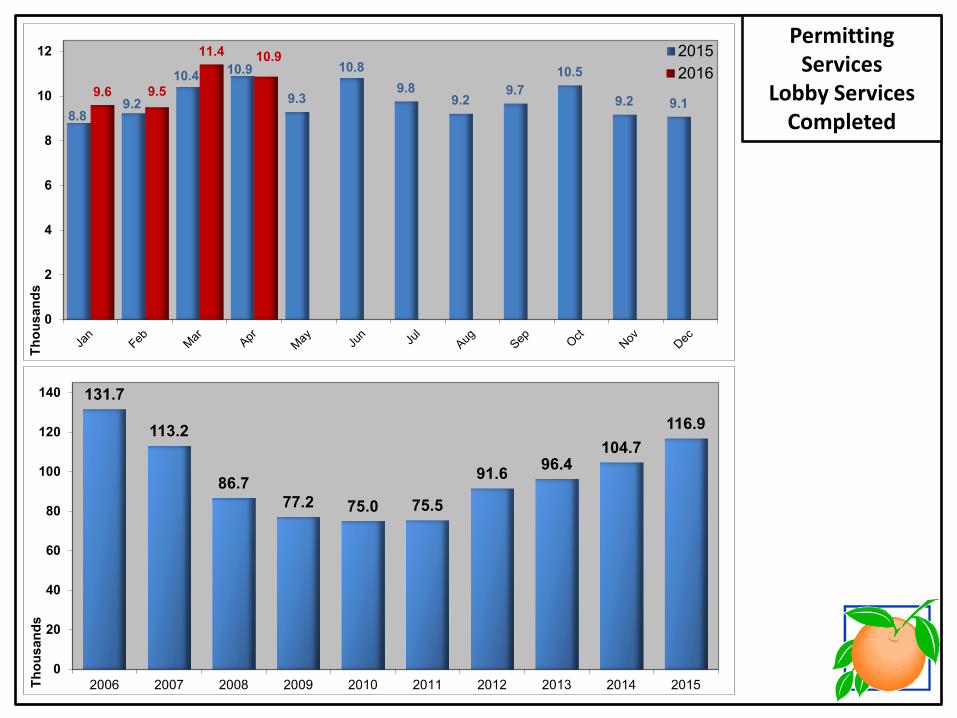
8.8 9.2
10.4 10.9
9.3
10.8 9.8
9.2 9.7
10.5
9.2 9.1 9.6 9.5
11.4 10.9
0
2
4
6
8
10
12Th
ousa
nds
20152016
Permitting Services
Lobby Services Completed
502.4
365.9 374.7
183.5 134.8 142.9
170.8 186.7 214.6 232.8
0
100
200
300
400
500
2006 2007 2008 2009 2010 2011 2012 2013 2014 2015Thou
sand
s
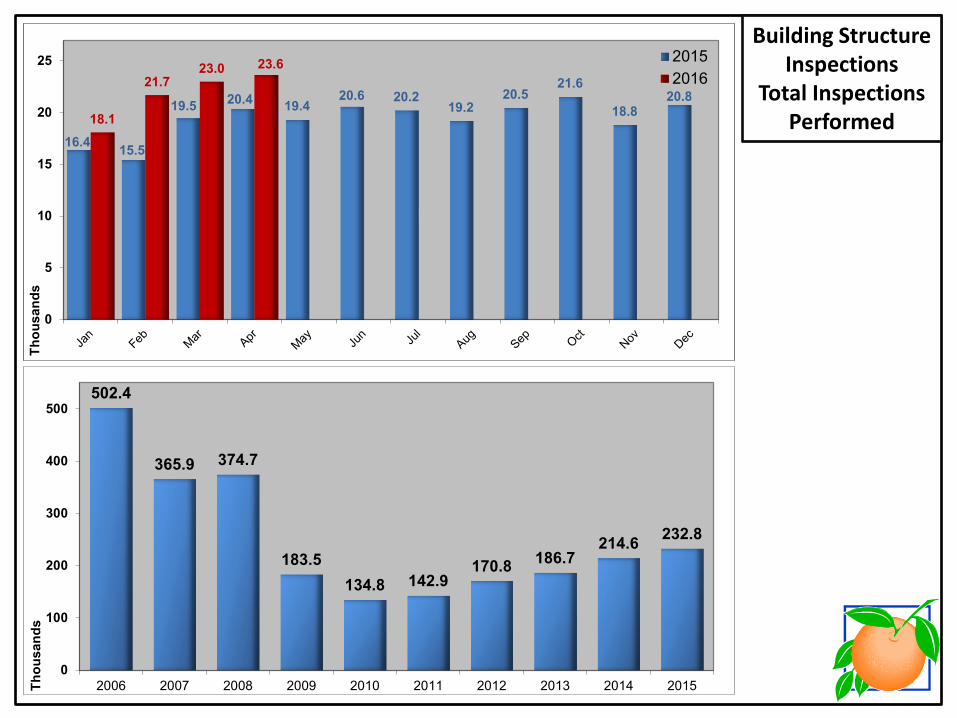
8,812 9,235
10,420 10,900
9,296
10,804 9,763
9,224 9,674
10,488
9,181 9,082 9,598 9,496
11,410 10,874
0
2,000
4,000
6,000
8,000
10,000
12,000 20152016
Building Structure Inspections
Total Inspections Performed
16.4 15.5
19.5 20.4 19.4 20.6 20.2
19.2 20.5
21.6
18.8 20.8
18.1
21.7 23.0 23.6
0
5
10
15
20
25
Thou
sand
s 20152016