fy16 development activity report
TRANSCRIPT

Orange County, Florida
Development Activity Report
October 2016
Fiscal Year 2016

0
10
20
30
40
50
60
593 604
322 306 332 352
381
298 339
456
0
100
200
300
400
500
600
700
FY 07 FY 08 FY 09 FY 10 FY 11 FY 12 FY 13 FY 14 FY 15 FY 16
Development Review Committee Cases
Orange County, Florida – October 2016
0
2
4
6
8
10
12
14
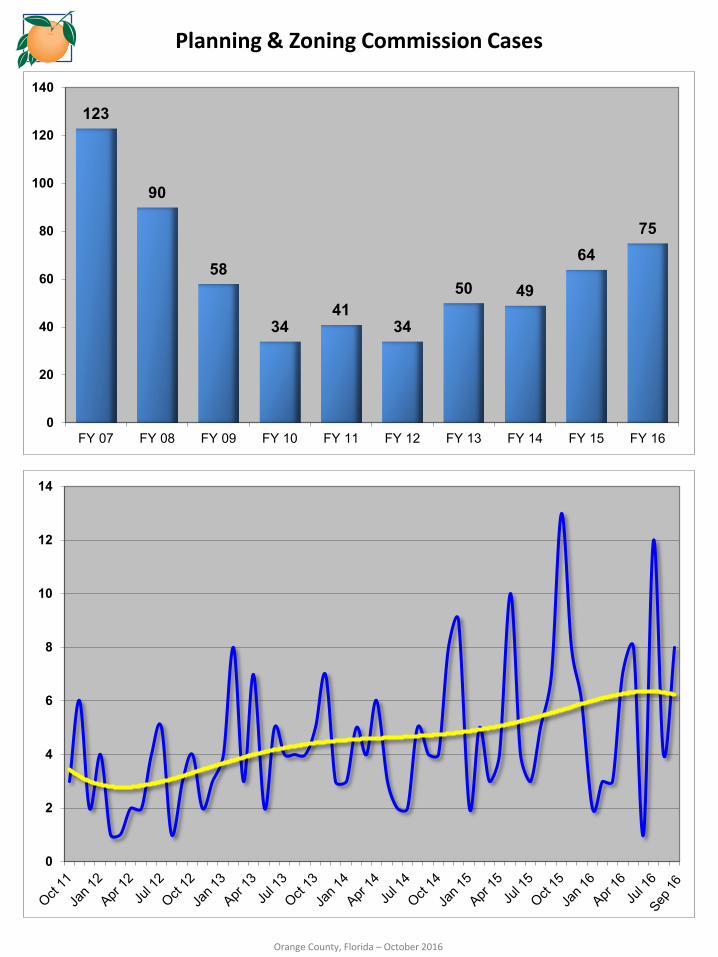
123
90
58
34 41
34
50 49
64 75
0
20
40
60
80
100
120
140
FY 07 FY 08 FY 09 FY 10 FY 11 FY 12 FY 13 FY 14 FY 15 FY 16
Planning & Zoning Commission Cases
Orange County, Florida – October 2016

0
5
10
15
20
25
30
255
190 177
111 121 115 109
93
140
195
0
50
100
150
200
250
300
FY 07 FY 08 FY 09 FY 10 FY 11 FY 12 FY 13 FY 14 FY 15 FY 16
Board of Zoning Adjustment Cases
Orange County, Florida – October 2016

0
2
4
6
8
10
12
14
62
42
27
16 21
28
54 55
71 72
0
10
20
30
40
50
60
70
80
FY 07 FY 08 FY 09 FY 10 FY 11 FY 12 FY 13 FY 14 FY 15 FY 16
Recorded Plats
Orange County, Florida – October 2016
0
100
200
300
400
500
600
700
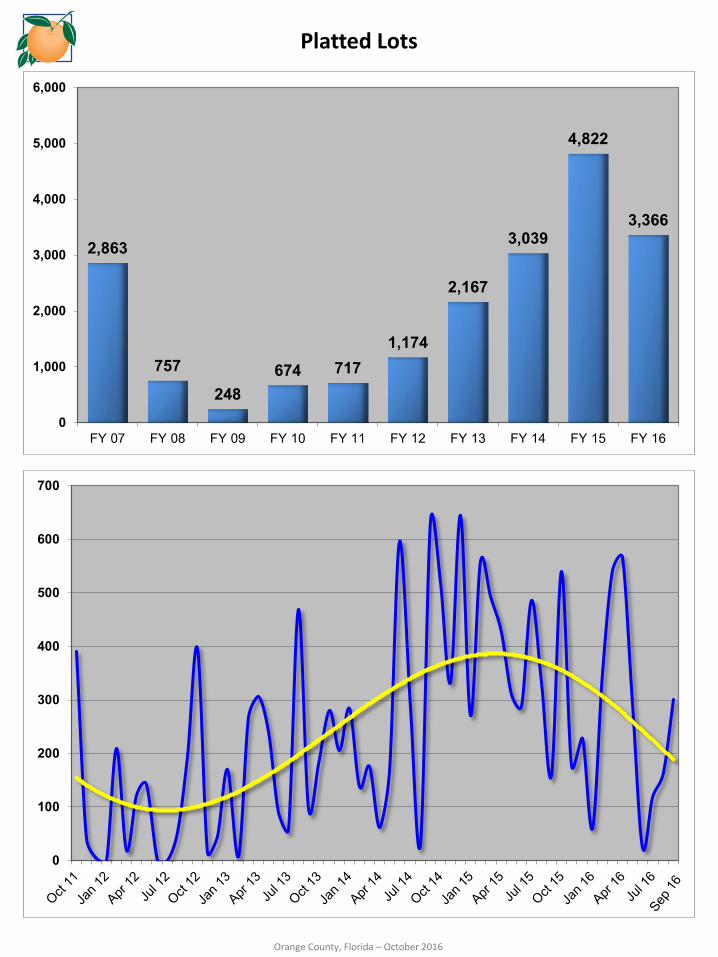
2,863
757
248 674 717
1,174
2,167
3,039
4,822
3,366
0
1,000
2,000
3,000
4,000
5,000
6,000
FY 07 FY 08 FY 09 FY 10 FY 11 FY 12 FY 13 FY 14 FY 15 FY 16
Platted Lots
Orange County, Florida – October 2016

Single Family Residential Permits
2,244
1,017 689
853 902
1,585
2,100 2,130 2,394
3,640
0
500
1,000
1,500
2,000
2,500
3,000
3,500
4,000
FY 07 FY 08 FY 09 FY 10 FY 11 FY 12 FY 13 FY 14 FY 15 FY 16
0
50
100
150
200
250
300
350
400
450
500
Orange County, Florida – October 2016
$0
$20
$40
$60
$80
$100
$120
$140
$160
Mill
ions
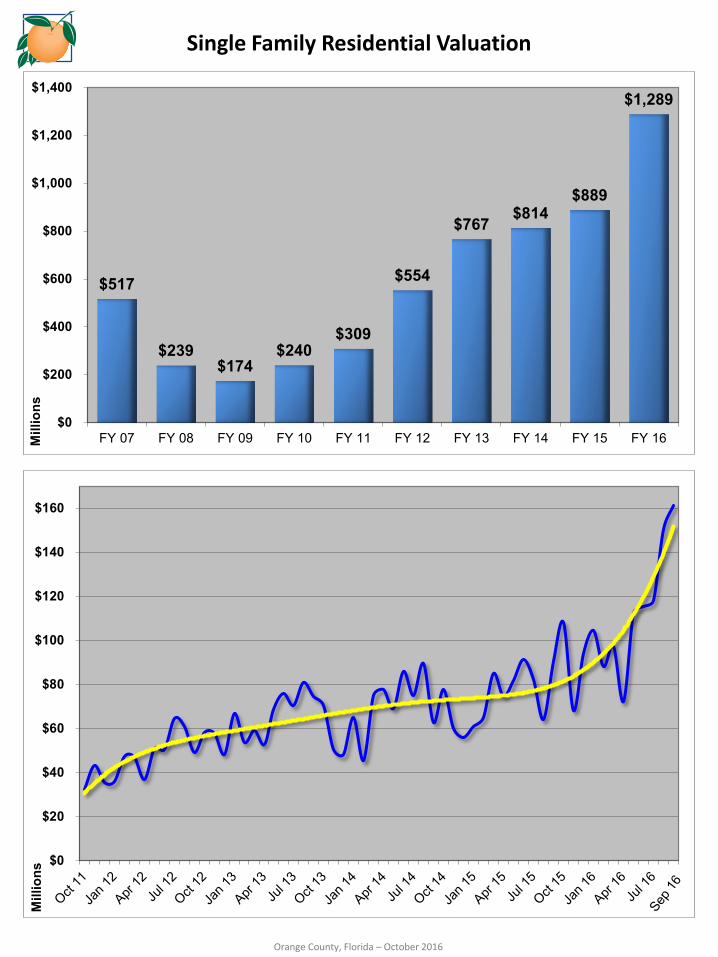
$517
$239 $174
$240 $309
$554
$767 $814
$889
$1,289
$0
$200
$400
$600
$800
$1,000
$1,200
$1,400
FY 07 FY 08 FY 09 FY 10 FY 11 FY 12 FY 13 FY 14 FY 15 FY 16Mill
ions
Single Family Residential Valuation
Orange County, Florida – October 2016

$300
$320
$340
$360
$380
$400
$420
$440
Thou
sand
s
$230k $235k $253k
$281k
$343k $349k $365k
$382k $371k $354k
$0
$50
$100
$150
$200
$250
$300
$350
$400
$450
FY 07 FY 08 FY 09 FY 10 FY 11 FY 12 FY 13 FY 14 FY 15 FY 16Thou
sand
s Single Family Residential Average Valuation
Orange County, Florida – October 2016
0
20
40
60
80
100
120
140
160
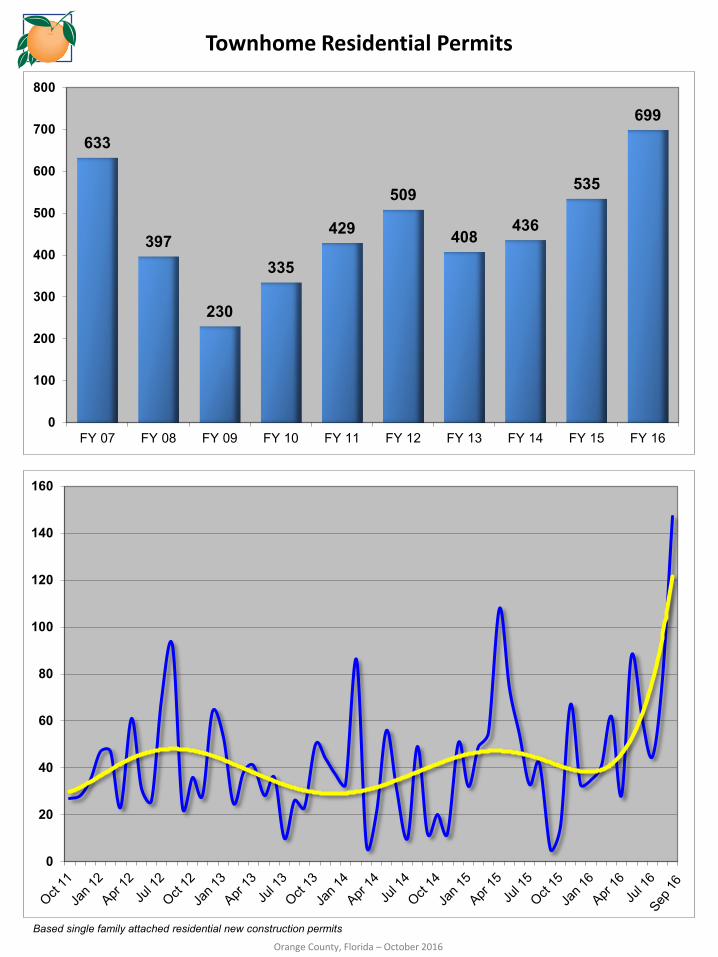
633
397
230
335
429
509
408 436
535
699
0
100
200
300
400
500
600
700
800
FY 07 FY 08 FY 09 FY 10 FY 11 FY 12 FY 13 FY 14 FY 15 FY 16
Townhome Residential Permits
Based single family attached residential new construction permits
Orange County, Florida – October 2016
$0
$5
$10
$15
$20
$25
$30
$35
Mill
ions
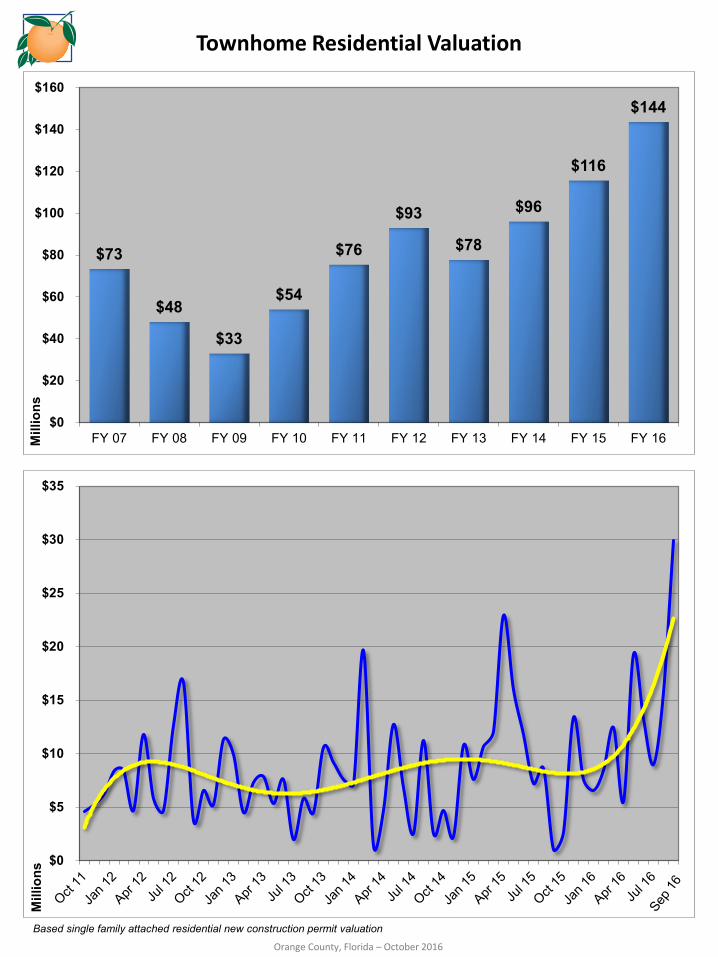
$73
$48
$33
$54
$76
$93
$78
$96
$116
$144
$0
$20
$40
$60
$80
$100
$120
$140
$160
FY 07 FY 08 FY 09 FY 10 FY 11 FY 12 FY 13 FY 14 FY 15 FY 16Mill
ions
Townhome Residential Valuation
Based single family attached residential new construction permit valuation
Orange County, Florida – October 2016

0
10
20
30
40
50
60
70
177
44 26
41 25
88
114
80 77
192
0
50
100
150
200
FY 07 FY 08 FY 09 FY 10 FY 11 FY 12 FY 13 FY 14 FY 15 FY 16
Multi-family Residential Permits
Based on two family, three family, four family and five or more family residential new construction permits
Orange County, Florida – October 2016

$0
$20
$40
$60
$80
$100
$120
$140
$160
$180
$200
Mill
ions
$229
$100
$38 $48 $61
$227
$282
$213
$125
$509
$0
$100
$200
$300
$400
$500
$600
FY 07 FY 08 FY 09 FY 10 FY 11 FY 12 FY 13 FY 14 FY 15 FY 16Mill
ions
Multi-family Residential Valuation
Based on two family, three family, four family and five or more family residential new construction permit valuation
Orange County, Florida – October 2016

0
100
200
300
400
500
600
700
3,054
1,458
945 1,229 1,356
2,182
2,622 2,646 3,006
4,531
0
500
1,000
1,500
2,000
2,500
3,000
3,500
4,000
4,500
5,000
FY 07 FY 08 FY 09 FY 10 FY 11 FY 12 FY 13 FY 14 FY 15 FY 16
Total Residential Permits
Based on single family, townhome and multi-family new construction permits
Orange County, Florida – October 2016

$0
$50
$100
$150
$200
$250
$300
$350
$400
Mill
ions
$819
$387 $245
$342 $446
$873
$1,127 $1,123 $1,129
$1,942
$0
$500
$1,000
$1,500
$2,000
FY 07 FY 08 FY 09 FY 10 FY 11 FY 12 FY 13 FY 14 FY 15 FY 16Mill
ions
Total Residential Valuation
Based on single family, townhome and multi-family new construction permit valuation
Orange County, Florida – October 2016

$701 $647
$341
$249 $263
$350 $351
$455 $460
$546
$0
$100
$200
$300
$400
$500
$600
$700
$800
FY 07 FY 08 FY 09 FY 10 FY 11 FY 12 FY 13 FY 14 FY 15 FY 16Mill
ions
$0
$10
$20
$30
$40
$50
$60
$70
$80
$90
$100
Mill
ions
Commercial Construction Valuation
Based on all non-residential new construction permit valuation
Orange County, Florida – October 2016

$803
$414
$27 $0 $20 $8 $19 $8 $51
$82
$0
$100
$200
$300
$400
$500
$600
$700
$800
$900
FY 07 FY 08 FY 09 FY 10 FY 11 FY 12 FY 13 FY 14 FY 15 FY 16Mill
ions
$0
$5
$10
$15
$20
$25
$30
$35
$40
$45
$50
Mill
ions
Hotel Construction Valuation
Orange County, Florida – October 2016

$2.32
$1.45
$0.61 $0.59 $0.73
$1.23
$1.50 $1.58 $1.64
$2.57
$0.0
$0.5
$1.0
$1.5
$2.0
$2.5
$3.0
FY 07 FY 08 FY 09 FY 10 FY 11 FY 12 FY 13 FY 14 FY 15 FY 16Bill
ions
$0
$50
$100
$150
$200
$250
$300
$350
$400
$450
Mill
ions
Residential & Commercial Total Valuation
Orange County, Florida – October 2016

93,588
75,239
60,963 54,744
60,298 69,121 72,577
79,731 87,487
101,759
0
20,000
40,000
60,000
80,000
100,000
FY 07 FY 08 FY 09 FY 10 FY 11 FY 12 FY 13 FY 14 FY 15 FY 16
0
2
4
6
8
10
12
14
Permitting Services Lobby Customers
Permitting Services covers Building Safety, Zoning, Impact Fees, Planning, Public Works, EPD, Utilities, Fire Rescue and Health
Orange County, Florida – October 2016

119,555
89,967 78,105 78,571
71,845
88,363 94,609
104,117 112,830
131,248
0
20,000
40,000
60,000
80,000
100,000
120,000
140,000
FY 07 FY 08 FY 09 FY 10 FY 11 FY 12 FY 13 FY 14 FY 15 FY 16
0
2,000
4,000
6,000
8,000
10,000
12,000
14,000
Permitting Services Lobby Services
Services rendered at the Permitting Services office located in the County Administration building
Orange County, Florida – October 2016
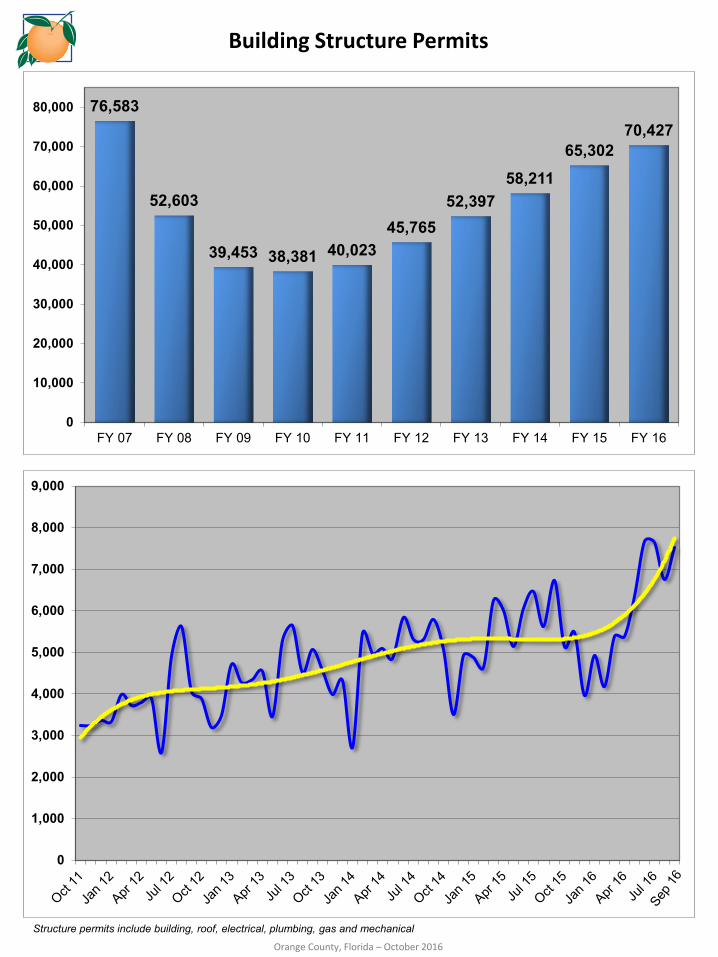
76,583
52,603
39,453 38,381 40,023 45,765
52,397 58,211
65,302 70,427
0
10,000
20,000
30,000
40,000
50,000
60,000
70,000
80,000
FY 07 FY 08 FY 09 FY 10 FY 11 FY 12 FY 13 FY 14 FY 15 FY 16
0
1,000
2,000
3,000
4,000
5,000
6,000
7,000
8,000
9,000
Building Structure Permits
Structure permits include building, roof, electrical, plumbing, gas and mechanical
Orange County, Florida – October 2016

0
5,000
10,000
15,000
20,000
25,000
378,358 386,239
227,056
136,670 134,020
169,131 175,090
217,006 223,383
263,461
0
50,000
100,000
150,000
200,000
250,000
300,000
350,000
400,000
450,000
FY 07 FY 08 FY 09 FY 10 FY 11 FY 12 FY 13 FY 14 FY 15 FY 16
Building Structure Inspections
Structure inspections include building, electrical, plumbing, gas and mechanical for residential and commercial permits
Orange County, Florida – October 2016