developing a project learning model in fragmented...
TRANSCRIPT

DEVELOPING A PROJECT LEARNING MODEL
CONSIDERING FRAGMENTATION IN CONSTRUCTION
ALI MOHAMMED MOHAMMED ALASHWAL
THESIS SUBMITTED IN FULFILLMENT OF THE
REQUIREMENTS FOR THE DEGREE OF DOCTOR OF
PHILOSOPHY
FACULTY OF BUILT ENVIRONMENT
UNIVERSITY OF MALAYA
KUALA LUMPUR
2012

ii
UNIVERSITI MALAYA
ORIGINAL LITERARY WORK DECLARATION
Name of Candidate: Ali Mohammed Alashwal (I.C/Passport No: 03569592)
Registration/Matric No: BHA 070013
Name of Degree: Doctor of Philosophy
Title of Project Paper/Research Report/Dissertation/Thesis (“this Work”): Developing a Project Learning Model Considering Fragmentation in Construction
Field of Study: Construction Management and Economics
I do solemnly and sincerely declare that:
1) I am the sole author/writer of this Work; 2) This Work is original; 3) Any use of any work in which copyright exists was done by way of fair dealing and for
permitted purposes and any excerpt or extract from, or reference to or reproduction of any copyright work has been disclosed expressly and sufficiently and the title of the Work and its authorship have been acknowledged in this Work;
4) I do not have any actual knowledge nor do I ought reasonably to know that the making of this work constitutes an infringement of any copyright work;
5) I hereby assign all and every rights in the copyright to this Work to the University of Malaya (“UM”), who henceforth shall be owner of the copyright in this Work and that any reproduction or use in any form or by any means whatsoever is prohibited without the written consent of UM having been first had and obtained;
6) I am fully aware that if in the course of making this Work I have infringed any copyright whether intentionally or otherwise, I may be subject to legal action or any other action as may be determined by UM.
……………………………………..
Candidate’s Signature Date
Subscribed and solemnly declared before,
……………………………………..
Witness’s Signature Date
Name:
Designation:

iii
ABSTRACT
Learning in construction has received growing attention due to such benefits as enhancing
performance, reducing the repetition of mistakes, and achieving competitive advantages.
However, most studies in the field have focused on organizational level of learning, paying
less attention to project level and ignoring the influence of project characteristics on
learning process. Therefore, the purpose of the current study is to develop a project
learning model that considers fragmentation as a distinguishing character of projects.
Fragmentation is defined in the current study as a multi-dimensional (hierarchical) concept
indicated by level of integration, collaboration, coordination, barriers, decoupling of
specializations, and spanning knowledge across boundaries. Project learning involves two
dimensions, intra-project and inter-project learning, which are also identified as multi-
dimensional latent constructs. The current study proposes a theoretical model that assumes
a negative effect of fragmentation on project learning. However, to what extent
fragmentation impacts learning and how learning can be achieved within a fragmented
context remain unclear.
To fill these gaps, a mixed methodology of qualitative and quantitative studies was
adopted. The purpose of the qualitative study was to explore factors that enable learning
within fragmentation. It involved in-depth interviews with 11 professionals in construction
projects. The purpose of the quantitative study was threefold: to test the theoretical model;
to develop the measurement scales of fragmentation, project learning, and enablers; and to
validate the results of the qualitative study. Using a questionnaire survey, the data were
collected from 36 big building projects (Grade 7) in Kuala Lumpur and Selangor,
Malaysia. The study targeted professionals working in these projects and collected 203
valid questionnaires.
Data analysis has involved parallel analysis, principal component analysis (PCA), and
confirmatory factor analysis (CFA) to develop and validate second-order (hierarchical)
measurement models of fragmentation and project learning. The relationships among
fragmentation, project learning, and enablers were tested using partial least squares-path

iv
modeling (PLS-PM), a variance-based approach to structural equation modeling (SEM).
The full model, comprises measurement and structural models, was analyzed using
SmartPLS software. Model’s quality, reliability, and validity were attained.
The results affirmed a negative significant influence of fragmentation on both intra- and
inter-project learning. Further analysis indicated a partial mediating effect of the enablers
of project learning. The results are expected to contribute to the body of knowledge in
three main areas. Firstly, the hierarchical measurement scales of fragmentation and project
learning can be used by future studies. Secondly, the enablers provide an explanation of
how learning occurs within fragmentation. This implies greater focus on these factors to
attain learning in construction projects. Lastly, the full model of project learning is sensible
and appropriate for construction projects as it reflects their unique nature. However,
further studies are recommended to generalize the model.

v
ABSTRAK
Pembelajaran projek atau pembelajaran berasaskan projek telah mendapat perhatian yang
meluas disebabkan kelebihannya untuk meningkatkan prestasi, mengurangkan kesilapan
secara berulang, dan mencapai kelebihan persaingan. Namun begitu, kebanyakan kajian
dalam bidang ini lebih banyak tertumpu kepada pembelajaran di peringkat organisasi,
tetapi kurang memberi perhatian di peringkat projek dan mengabaikan pengaruh ciri-ciri
projek ke atas proses pembelajaran. Oleh itu, kajian yang dilaksanakan ini dibuat bagi
membangunkan satu model pembelajaran projek yang mempertimbangkan faktor
fragmentasi (fragmentation) sebagai ciri perbezaan projek.
Fragmentasi (fragmentation) ditakrifkan sebagai satu konsep pelbagai-dimensi (hierarki)
yang diwakili oleh tahap integrasi, koloborasi, koordinasi, halangan, penyahgandingan
pengkhususan (decoupling of specializations), dan pengetahuan merentasi sempadan.
Manakala, pembelajaran projek melibatkan dua dimensi, iaitu, sesama (intra) projek dan
antara (inter) projek, yang juga dikenalpasti sebagai konstruk tersembunyi (latent
constructs) pelbagai-dimensi. Kajian ini mencadangkan satu model teori yang
mengandaikan pengaruh negatif fragmentasi (fragmentation) ke atas pembelajaran projek.
Walau bagaimanapun, sejauh mana pengaruh fragmentas (fragmentation) ini ke atas
pembelajaran dan bagaimana pembelajaran boleh dicapai dalam konteks ini masih lagi
kabur.
Bagi mengisi jurang (gap), kajian ini menggunakan pendekatan gabungan (mixed methods)
iaitu kaedah kualitatif dan kuantitatif. Kaedah kualitatif dilaksanakan bagi meneroka
faktor- faktor yang membolehkan pembelajaran di dalam lingkungan fragmentasi
(fragmentation). Untuk itu, kajian ini melibatkan temubual secara mendalam dengan 11
orang profesional dalam projek pembinaan. Manakala, kajian kuantitatif dilaksanakan bagi
menguji model teori; membangunkan skala pengukuran bagi fragmentasi (fragmentation),
pembelajaran projek, dan pemungkin (enablers); dan untuk mengesahkan dapatan hasil
kajian kualitatif. Data diperolehi dari 36 buah projek pembinaan berskala besar (Gred 7) di
Kuala Lumpur dan Selangor. Kajian ini juga mensasarkan profesional yang terlibat dalam
projek berskala besar dan sebanyak 203 soal-selidik yang sah telah dikumpulkan.

vi
Analisis data yang dibuat melibatkan analisis sejajar (parallel analysis), analisis komponen
utama (PCA), dan analisis faktor pengesahan (CFA) bagi membangun dan mengesahkan
skala kedua (hierarchical) fragmentasi (fragmentation) dan pembelajaran projek.
Hubungan di antara fragmentasi (fragmentation), pembelajaran projek, dan pemungkin
(enablers) diuji dengan menggunakan ‘partial least squares-path modelling’ (PLS PM),
dan pendekatan varians berasaskan kepada pemodelan persamaan struktur (SEM).
Manakala model penuh, yang mengandungi pengukuran dan model struktur telah
dianalisis menggunakan perisian SmartPLS yang dapat menghasilkan model yang
berkualiti, kebolehpercayaan dan mencapai kesahan.
Dapatan mengesahkan wujudnya pengaruh negatif yang signifikan bagi fragmentasi
(fragmentation) dengan pembelajaran projek di kedua-dua peringkat iaitu sesama (intra)
projek dan di antara (inter) projek. Analisis selanjutnya menunjukkan bahawa pengantara
separa (partial mediating) mempengaruhi pemungkin (enablers) bagi pembelajaran
projek. Oleh yang demikian,dapatan kajian dijangka dapat menyumbang kepada ilmu
pengetahuan menerusi tiga bidang utama. Pertama, skala pengukuran hierarki fragmentasi
(fragmentation) dan pembelajaran projek dapat digunakan untuk kajian masa depan.
Kedua, pemungkin (enablers) dapat memberikan penjelasan bagaimana pembelajaran
berlaku dalam linkungan fragmentasi (fragmentation). Dapatan ini membayangkan bahawa
tumpuan yang lebih perlu diberikan kepada faktor- faktor ini untuk mencapai pembelajaran
projek pembinaan. Akhir sekali, model penuh pembelajaran projek yang dihasilkan adalah
munasabah dan sesuai untuk diterima pakai bagi projek pembinaan kerana ia
menggambarkan ciri yang unik. Namun begitu, kajian lanjutan disarankan bagi
mengeneralisasikan model ini.

vii
ACKNOWLEDGEMENTS
I am grateful to the Ministry of Higher Education, Yemen for awarding me a scholarship,
which covered significant part of the financial expenses during this research. I am also
grateful to University of Malaya for considerable supports including a research grant
(project number: PS016-2009A), which facilitated the completion of this study.
My sincere gratitude and appreciation to my supervisor, Prof. Dr. Hamzah Abdul-Rahman
for his unlimited support, motivation, trust, and guidance during the 46-month journey in
conducting this research. It was my honor to be part of his research team and involved in
different research activities. This opportunity has enriched my knowledge, imbued me with
many skills and ideas, and given me the courage to continue this work.
I would like to extend my appreciation to all anonymous respondents and interviewees
from both academia and construction industry whom involved during the data collection
stage. Without their unrestrained sharing of experience, ideas, and insights, this thesis
would not have been possible.
I owe a deep debt of gratitude to Bawa Chafe Abdullahi, Angeline Loo, and Abdul Mutalib
Beksin for reading my thesis and giving valuable comments on that. Many thanks to my
colleagues and friends in the Faculty of Built Environment and in the Project and Facilities
Management Group for being so supportive, positive, and helpful, especially to Rafikullah
Derman, Kho Meiye, Abdul Tawab Qahtan, Dr. Abdul Aziz Abdullah, and Dr. Wang
Chen. Special thanks to Abdulla Altholaya from Faculty of Business and Accountancy for
his encouragement and assistance.
Last but not least, I am indebted to my parents for their continuous prayers and limitless
love and support. My gratitude to Ida for her encouragement and moral support. I am also
indebted to my wife, Amal, for her patience, prayers, and encouragement. And Praise be to
Allah, Lord of the Worlds.

viii
DEDICATION
This small effort is dedicated to my father for his great support and invaluable
love…

ix
TABLE OF CONTENTS
ORIGINAL LITERARY WORK DECLARATION ............................................................... ii
ABSTRACT ....................................................................................................................... iii
ABSTRAK ...........................................................................................................................v
ACKNOWLEDGEMENTS .................................................................................................vii
DEDICATION .................................................................................................................. viii
TABLE OF CONTENTS ......................................................................................................ix
LIST OF FIGURES ............................................................................................................xiv
LIST OF TABLES ..............................................................................................................xv
LIST OF ABBREVIATIONS.............................................................................................xvii
LIST OF APPENDICES ...................................................................................................xviii
CHAPTER 1: INTRODUCTION .............................................................................................19
1.0 Introduction...................................................................................................................19
1.1 Background of the Study ................................................................................................19
1.2 Motivation for the Study ................................................................................................22
1.3 Overview of Some Studies on Project Learning ...............................................................23
1.4 Research Gaps ...............................................................................................................25
1.5 Problem Statement .........................................................................................................25
1.6 Research Questions ........................................................................................................26
1.7 Aim and Objectives........................................................................................................27
1.8 Research Scope..............................................................................................................28
1.9 Research Methodology: An Overview .............................................................................29
1.9.1 Approaches and strategies ........................................................................................29
1.9.2 Justification of using mixed approaches ....................................................................31
1.10 Outline of Thesis Structure ...........................................................................................33
CHAPTER 2: LITERATURE REVIEW ...................................................................................35
2.0 Introduction...................................................................................................................35
Section I: Fragmentation..........................................................................................................35
2.1 Characteristics of Construction Industry and Projects .......................................................35
2.2 Levels of Fragmentation .................................................................................................37
2.2.1 Fragmentation of the industry (firm fragmentation) ....................................................39
2.2.2 Project level (production process level) .....................................................................40

x
2.2.3 Other dimensions of fragmentation ...........................................................................41
2.3 Definition of Fragmentation............................................................................................42
2.4 Causes of Fragmentation ................................................................................................43
2.5 Impact of Fragmentation ................................................................................................44
2.6 Overcoming Fragmentation ............................................................................................46
Section II: Project Learning .....................................................................................................54
2.7 Levels of Learning .........................................................................................................54
2.8 Learning in Construction: Highlighting Certain Gaps .......................................................54
2.9 Learning Approaches in Projects.....................................................................................60
2.10 Project Learning ..........................................................................................................61
2.10.1 Toward a better understanding of project learning ....................................................63
2.10.2 Some studies on project learning.............................................................................66
2.10.3 Studies on project learning in construction...............................................................73
2.10.4 Organizational learning and project learning ............................................................75
2.11 Features of Project Learning .........................................................................................80
2.12 Summary .....................................................................................................................81
CHAPTER 3: THEORETICAL MODEL AND RESEARCH DESIGN ......................................83
3.0 Introduction...................................................................................................................83
3.1 Framework of Fragmentation..........................................................................................83
3.2 Framework of Project Learning.......................................................................................87
3.2.1 Project team and action to learn ................................................................................87
3.2.2 Knowledge creation .................................................................................................90
3.2.3 Knowledge sharing ..................................................................................................93
3.2.4 Inter-project learning and knowledge transfer ............................................................95
3.3 Fragmentation and Project Learning ................................................................................96
3.4 Enablers of Project Learning within Fragmentation ..........................................................99
3.4.1 Boundary objects and boundary-crossing ..................................................................99
3.4.2 Situated learning theory and Sense’s model ............................................................. 101
3.5 Theoretical Model and Hypotheses Development........................................................... 103
3.6 Research Design .......................................................................................................... 105
3.7 Summary..................................................................................................................... 108
CHAPTER 4: QUALITATIVE STUDY ................................................................................. 110
4.0 Introduction................................................................................................................. 110
4.1 Sampling Design ......................................................................................................... 110

xi
4.2 Designing the Interview Questions and Protocol ............................................................ 112
4.3 Pilot Study .................................................................................................................. 114
4.3.1 Results of the pilot study ........................................................................................ 114
4.4 Choosing Projects and Interviewees .............................................................................. 115
4.5 Procedure of Data Collection and Analysis .................................................................... 117
4.6 Verification of Findings ............................................................................................... 119
4.7 Findings and Discussions ............................................................................................. 120
4.7.1 Project learning: Perception of the interviewees ....................................................... 120
4.7.2 Fragmentation: Perspective of the interviewees........................................................ 121
4.7.3 Enablers of project learning within fragmentation .................................................... 122
4.8 The Developed Model of Project Learning .................................................................... 126
4.9 Summary..................................................................................................................... 127
CHAPTER 5: QUANTITATIVE STUDY .............................................................................. 128
5.0 Introduction................................................................................................................. 128
Section I: Measurement and Method of Analysis ..................................................................... 129
5.1 Steps of Developing the Measurement Scale .................................................................. 129
5.2 Conceptualization, Operationalization, and Measurement ............................................... 130
5.3 Measurement Models: Reflective vs. Formative ............................................................. 131
5.3.1 Specifying the measurement models ....................................................................... 134
5.3.2 Deficiencies of formative measurements ................................................................. 135
5.4 Hierarchical (Higher-order) Models .............................................................................. 136
5.5 Method of Analysis...................................................................................................... 139
5.6 Principal Component Analysis (PCA) ........................................................................... 139
5.6.1 Identifying and interpreting components of PCA ..................................................... 141
5.6.2 Validation of PCA ................................................................................................. 143
5.7 Structural Equation Modeling (SEM) ............................................................................ 144
5.8 Partial Least Squares (PLS) .......................................................................................... 145
5.8.1 Advantages of PLS over CBSEM ........................................................................... 146
5.8.2 Evaluating the appropriateness of PLS for the current study ..................................... 148
5.8.3 Limitations of PLS ................................................................................................ 148
5.9 SmartPLS .................................................................................................................... 149
5.10 Identification of Hierarchical Models in PLS ............................................................... 151
5.11 Choosing the Appropriate Weighting Scheme .............................................................. 152
5.12 Quality of PLS Model ................................................................................................ 152
xii
5.12.1 Quality of measurement models ............................................................................ 153
5.12.2 Quality of structural model ................................................................................... 154
5.13 Bootstrapping and Blindfolding in PLS ....................................................................... 157
5.14 Mediating Test........................................................................................................... 159
Section II: Data Collection and Results ................................................................................... 160
5.15 Sampling Design........................................................................................................ 160
5.15.1 Choosing the sample ............................................................................................ 161
5.16 Developing and Pre-testing the Questionnaire Survey................................................... 163
5.16.1 Content validity ................................................................................................... 163
5.16.2 Face validity........................................................................................................ 164
5.16.3 Pilot study ........................................................................................................... 164
5.16.4 Reliability of pilot study ....................................................................................... 166
5.17 Measurement Instrument ............................................................................................ 167
5.18 Data Collection .......................................................................................................... 171
5.19 Examining Data for Multivariate Analysis ................................................................... 172
5.19.1 Missing data ........................................................................................................ 173
5.19.2 Outliers ............................................................................................................... 175
5.19.3 Test of normality ................................................................................................. 178
5.20 Reliability of Measurement Scale ................................................................................ 178
5.21 Descriptive Analysis .................................................................................................. 179
5.21.1 Frequencies of projects......................................................................................... 179
5.21.2 Frequencies of respondents................................................................................... 182
5.22 Principal Component Analysis Procedures and Results ................................................. 183
5.22.1 Parallel analysis ................................................................................................... 184
5.22.2 Parallel analysis and PCA of fragmentation ........................................................... 184
5.22.3 Parallel analysis and PCA of intra-project learning................................................. 188
5.22.4 Parallel analysis and PCA of inter-project learning................................................. 191
5.22.5 Parallel analysis and PCA of enablers ................................................................... 193
5.23 Confirmatory Factor Analysis Using PLS-PM Approach .............................................. 195
5.23.1 Confirmatory factor analysis of fragmentation ....................................................... 195
5.23.2 Assessing quality of fragmentation model ............................................................. 198
5.23.3 Multicollinearity of fragmentation ........................................................................ 199
5.23.4 Confirmatory factor analysis of intra-project learning............................................. 202
5.23.5 Confirmatory factor analysis of inter-project learning............................................. 203

xiii
5.23.6 Confirmatory factor analysis of enablers of project learning ................................... 205
5.24 Full Model of Project Learning ................................................................................... 207
5.25 Assessment of Full Model’s Quality ............................................................................ 210
5.25.1 Assessment of measurement models...................................................................... 211
5.25.2 Assessment of structural model and hypotheses testing........................................... 214
5.26 Results of Mediating Test ........................................................................................... 217
5.27 Summary ................................................................................................................... 221
CHAPTER 6: DISCUSSIONS ............................................................................................... 223
6.0 Introduction................................................................................................................. 223
6.1 Highlights of the Main Findings and Results .................................................................. 223
6.1.1 Main findings of the qualitative study ..................................................................... 223
6.1.2 Main results of quantitative study ........................................................................... 225
6.2 Discussions on the Relationship among Constructs ........................................................ 228
6.2.1 Interpretation of the relation between first- and second-order constructs .................... 229
6.2.2 Influence of fragmentation on project learning......................................................... 232
6.2.3 Role of the enablers in the model ............................................................................ 233
6.3 Discussions on the Measurement Models....................................................................... 234
6.3.1 Indicators of fragmentation .................................................................................... 234
6.3.2 Dimensions of intra-project learning ....................................................................... 238
6.3.3 Dimensions of inter-project learning ....................................................................... 240
6.3.4 Measurement of enablers of project learning............................................................ 242
6.4 Summary..................................................................................................................... 245
CHAPTER 7: CONCLUSION AND RECOMMENDATIONS ................................................ 247
7.0 Summary of Objectives and Main Findings ................................................................... 247
7.1 Contributions of the Study ............................................................................................ 249
7.2 Implications of the Study.............................................................................................. 250
7.3 Directions for Future Research and Recommendations ................................................... 251
REFERENCES ................................................................................................................. 253
APPENDICES .................................................................................................................. 269

xiv
LIST OF FIGURES
Figure 1.1: Research procedure ................................................................................................32
Figure 2.1: Levels of fragmentation ..........................................................................................38
Figure 2.2: Number of several studies on learning in the construction according to (a) level of
learning and (b) methodology used ...........................................................................................59
Figure 2.3: Connection of some fundamental works on project learning to other fields.................79
Figure 3.1: Theoretical model of project learning considering the influence of fragmentation ..... 104
Figure 3.2: Detailed research design and decisions followed in the current study ....................... 106
Figure 4.1: Exploring and coding data in qualitative study (Source: Creswell, 2008).................. 119
Figure 4.2: Developed theoretical model of project learning (adding the results of the qualitative
study) ................................................................................................................................... 127
Figure 5.1: Reflective measures vs. formative measures........................................................... 133
Figure 5.2: Type I second-order model (to specify intra- and inter-project learning) .................. 138
Figure 5.3: Type II second-order model (to specify fragmentation) ........................................... 138
Figure 5.4: Tsplot of fragmentation ........................................................................................ 185
Figure 5.5: Tsplot of intra-project learning .............................................................................. 188
Figure 5.6: Tsplot of inter-project learning .............................................................................. 191
Figure 5.7: Tsplot of enablers of project learning..................................................................... 193
Figure 5.8: Confirmatory factor analysis of fragmentation using SmartPLS (Type II hierarchical
model).................................................................................................................................. 196
Figure 5.9: Confirmatory factor analysis of intra-project learning (Type I hierarchical model) .... 202
Figure 5.10: Confirmatory factor analysis of inter-project learning ........................................... 204
Figure 5.11: Confirmatory factor analysis of enablers of project learning .................................. 206
Figure 5.12: Full model of project learning (inner and outer models) ........................................ 209
Figure 5.13: Full model of project learning (hiding the manifest variables) ............................... 210
Figure 5.14: Results of bootstrapping of the full model ............................................................ 215
Figure 5.15: Model 1 (full model without direct relationship) ................................................... 217
Figure 5.16: Model 2 (model without mediating constructs) ..................................................... 218
Figure 5.17: Model 3 (full model with direct relationship – original model) .............................. 218
Figure 6.1: Structural relationships of the project learning model ............................................. 228
xv
LIST OF TABLES
Table 1.1: Research methods and approaches according to the research questions .......................30
Table 2.1: A summary of fragmentation studies (industry and project levels) ..............................49
Table 2.2: A summary of different studies on learning in the construction industry ......................55
Table 3.1: Indicators of fragmentation of projects......................................................................86
Table 3.2: Indicators of project team action to learn and learning methods ..................................90
Table 3.3: Indicators of knowledge creation ..............................................................................93
Table 3.4: Indicators of knowledge sharing ...............................................................................94
Table 3.5: Indicators of knowledge transfer and inter-project learning ........................................96
Table 3.6: Indicators of enablers of project learning within fragmentation ................................. 102
Table 4.1: Questions for in-depth interviews ........................................................................... 113
Table 4.2: Sample of qualitative study (details of construction building projects) ...................... 116
Table 4.3: Profile of interviewees ........................................................................................... 117
Table 4.4: Results of interviews (situation of project learning and fragmentation)...................... 122
Table 4.5: Findings of the interviews (collapsed codes and themes of enablers of project learning)
............................................................................................................................................ 125
Table 5.1: Difference between reflective and formative measurements ..................................... 134
Table 5.2: Advantages of partial least squares over covariance-based SEM ............................... 147
Table 5.3: Characteristics of sample of the pilot study ............................................................. 165
Table 5.4: Characteristics of respondents of the pilot study ...................................................... 166
Table 5.5: Reliability of questionnaire survey of the pilot study................................................ 167
Table 5.6: Measurement items of fragmentation, intra-project learning, inter-project learning, and
enablers ................................................................................................................................ 168
Table 5.7: Reliability of the questionnaire survey .................................................................... 179
Table 5.8: Information of the sample projects.......................................................................... 180
Table 5.9: A summary of distribution and frequencies of the selected projects........................... 181
Table 5.10: Frequencies of respondents .................................................................................. 182
Table 5.11: KMO and Bartlett’s test ....................................................................................... 186
Table 5.12: Pattern matrix of fragmentation (rotated matrix of PCA) ........................................ 186
Table 5.13: KMO and Bartlett’s test of intra-project learning ................................................... 189
Table 5.14: Pattern matrix of intra-project learning (PCA results)............................................. 189
Table 5.15: KMO and Bartlett’s test of inter-project learning ................................................... 192
Table 5.16: Pattern matrix of inter-project learning (PCA results)............................................. 192

xvi
Table 5.17: KMO and Bartlett’s test of enablers of project learning .......................................... 194
Table 5.18: Pattern matrix of enablers of project learning (PCA results).................................... 194
Table 5.19: Correlations among first- and second-order constructs of fragmentation .................. 197
Table 5.20: Cross loadings of fragmentation ........................................................................... 197
Table 5.21: Quality criteria of CFA of fragmentation model.................................................... 198
Table 5.22: Weight of indicators of fragmentation ................................................................... 199
Table 5.23: Multicollinearity test of fragmentation: VIF results ................................................ 201
Table 5.24: Multicollinearity test of fragmentation: eigenvalue and condition index .................. 201
Table 5.25: Manifest variables’ loading and cross-loadings of Intra-PL..................................... 203
Table 5.26: Quality criteria of the model and correlation among constructs ............................... 203
Table 5.27: Manifest variables’ loading and cross-loadings of inter-project learning .................. 204
Table 5.28: Quality criteria of inter-project learning and correlation among constructs............... 205
Table 5.29: Manifest variables’ loading and cross loadings of enablers ..................................... 207
Table 5.30: Quality criteria and correlation among constructs of enablers of project learning model
............................................................................................................................................ 207
Table 5.31: Outer model (weights or loadings) of fragmentation and enablers ........................... 212
Table 5.32: Outer model (weights or loadings) of intra- and inter-project learning ..................... 212
Table 5.33: Quality criteria (overall) and GoF of the full model................................................ 213
Table 5.34: Correlations among latent constructs and discriminant validity of the model............ 213
Table 5.35: Total effect among all latent constructs in the full model ........................................ 214
Table 5.36: Path coefficients (mean, STDEV, t-values) and test of hypotheses .......................... 216
Table 5.37: Comparing Model 2 with Model 3 to examine the mediating effect......................... 219
Table 6.1: Variables of the full model of project learning ......................................................... 227
Table 6.2: Average weight and ranking of first-order constructs contributing to fragmentation ... 235

xvii
LIST OF ABBREVIATIONS
AVE Average Variance Extracted
BARRIERS A latent construct represents Barrier in projects, which causes
fragmentation
CBSEM Covariance-based Structural Equation Modeling (SEM)
CFA Confirmatory Factor Analysis
CIDB Construction Industry Development Board
CoP Communities of Practice
cv-com Cross-validated communality
cv-red Cross-validated redundancy
DoD A latent construct represents Decoupling of Diversity of
professionals, which causes fragmentation
FRAG A latent construct represents fragmentation of project team
INTEG A latent construct represents level of project team Integration
INTER1 First dimension of learning across projects (represents two processes: experience accumulation and knowledge articulation)
INTER2 Second dimension of learning across projects (represents two
processes: knowledge articulation and knowledge codification)
INTER-PL Learning across projects (inter-project learning)
INTRA1 First dimension of learning within project (social or soft process of
learning )
INTRA2 Second dimension of learning within project (technical or
procedural process of learning)
INTRA-PL Learning within project (intra-project learning)
KM Knowledge Management
KS SUPP A latent construct represents Knowledge Sharing Support
LO Learning Organization
MANAG SUPP A latent construct represents Managerial Support
OL Organizational Learning
PA Parallel Analysis
PCA Principal Component Analysis
PLS Partial Least Square
PLS-PM Partial Least Squares, Path Modeling (variance-based SEM)
PRO CULT A latent construct represents Project Culture
SEM Structural Equation Modeling
SKB A latent construct represents Spanning Knowledge across project’s
Boundaries
SMEs Small and Medium Enterprises
SPSS Statistical Package for the Social Sciences
VIF Variance inflation factor

xviii
LIST OF APPENDICES
Appendix A: List of publications ……………………………...…………...……...…269
Appendix B: Content validity questionnaire ……………………………...…….……270
Appendix C: Questionnaire survey forms..……………...………………...………….278
Appendix D: Missing data analysis ……………………...…………………..….……286
Appendix E: Distributions of projects and respondents ……………...……………....289
Appendix F: Parallel analysis ………………...…………………………………....…293
Appendix G: Cross- loading analysis …………………...………………………….…397

19
CHAPTER 1: INTRODUCTION
1.0 Introduction
This chapter provides an overview of the current study and the research method used. It
begins with a background that introduces the topics, followed by the motivation to conduct
the study. Some related works are reviewed to highlight the gaps in literature. Then,
problem statement, research questions, and objectives are presented. The last section of
this chapter outlines research method used.
1.1 Background of the Study
The construction industry in Malaysia is currently confronted with complex challenges,
including project performance, continuous improvement, and sustained competitiveness.
Thus, it is compelled to transform itself into a world-class, innovative, and knowledgeable
global solutions provider by 2015 (CIDB, 2007). The orientation toward a knowledge-
based economy reflects the focus on knowledge sharing by enabling the integration of
construction communities.
Construction is full with learning opportunities from and within projects (Anheim, 2003;
Täube, 2007). Effectively obtaining insights from projects facilitates the realization of
competitive advantage and project success (Sense & Antoni, 2003). Moreover, learning

20
can reduce errors, thereby increasing the profitability of construction firms (Josephson,
1994), as cited in (Knauseder et al., 2007). Kotnour and Hjelm (2002) revealed that
learning enables individuals to assimilate new ideas and transform these into action,
improves member competencies and work atmosphere in organizations, increases
productivity, and results in high morale.
Project learning practices can be defined as “the set of actions the project teams use to
create and share knowledge within and across projects” (Kotnour, 2000, p. 396). In
addition, project learning implies creating knowledge from experience, where
improvement takes place in projects (Kotnour, 1999). There are two dimensions of project
learning: intra-project and inter-project (Kotnour & Proctor, 1996). Intra-project learning is
defined as the acquisition and use of knowledge and experience within the same project
(Gieskes & Broeke, 2000). It focuses on tasks within a single project and supports the
delivery of a successful initiative through problem identification and resolution during the
project life cycle (Kotnour & Vergopia, 2005). Conversely, inter-project learning refers to
the transfer of knowledge and experience from one project to another within the same time
frame or to different projects over a period of time (Gieskes & Broeke, 2000).
Project learning is an important component for continuous improvement of the project-
based organization (Garvin, 1993; Williams, 2008). In addition, learning from projects
reduces the likelihood of repeating the same mistakes and “re- inventing the wheel.” Other
benefits of learning include the following: guaranties competitive advantages, enhances
project performance, improves innovation and professional expertise, and allows project
management to respond to uncertainties and environment pressure (Abdul-Rahman et al.,
2008; Ayas, 1997; Barlow & Jashapara, 1998; Drejer & Vinding, 2006).

21
However, project characteristics, discontinuity, and lack of mechanisms for knowledge
transfer at project and firm levels may affect learning from and within projects (Bresnen et
al., 2003; Maqsood et al., 2006). In addition, ad hoc working relationships among firms
may influence the continuity of learning (Drejer & Vinding, 2004). Other challenges of
learning in construction projects include the difficulty of establishing routine activities
given the discontinuity of resources and information flow and project team fragmentation
into different professional disciplines (Bresnen et al., 2003). Murdoch and Hughes (2008)
stated that establishing a construction system creates a demand for detailed specialized
knowledge and various skills. Increasing specialization and professionalization lead to
fragmentation because professionals maintain temporary relationships and pursue different
objectives (Murdoch & Hughes, 2008).
Fragmentation could be one of the primary problems that hinder learning (Knauseder et al.,
2007), hence the loss of learning benefits. The current study focuses on the influence of
project team fragmentation on project learning processes. Extant literature discusses two
levels of fragmentation: construction industry and project. The former involves increasing
the number of segregated small firms and reducing the number of large ones, while the
latter entails the disintegration of construction processes and entities. Both levels are
caused by team fragmentation (Gonz'alez et al., 1998). Fragmentation may stem from two
reasons: the product necessitates more comprehensive production processes, and
contractors and subcontractors are likely to specialize in specific areas in accordance with
demand (Seymour, 1987). The current study intent to explore further aspects of team
fragmentation. These include indicators that determine fragmentation such as lack of team
integration, collaboration, and coordination; diversity and decoupling of specializations;

22
barriers among professionals; and lack of spanning knowledge across project boundaries.
These will be elaborated in some next chapters.
1.2 Motivation for the Study
Given that construction is essentially organized around projects and not firms, examining
the manner by which learning occurs at the project level is essential. Traditional
organizational learning theories appear unable to reflect the nature of construction projects.
Groák (1994) questioned the relevance of applying organizational learning at the
construction project level. P. Chan et al. (2005, p. 747) stated that “it is felt that the
research effort into organizational learning had hitherto focused on the study of companies,
without paying attention to the project-based nature of the industry.” Knauseder et al.
(2007) affirmed that research on organizational learning in projects remains in its infancy,
creating a need for more investigations on learning in temporary organizations. Huemer
and Östergren (2000, p. 636) observed that literature mostly indicates what organizational
learning should be rather than what it actually is, stating: “it is difficult to investigate how
the connection between learning and the environment can be understood.” Hence, more
empirical investigations on project learning are necessary given the nature of the
construction industry.
During construction, various people and organizations gather to accomplish the project.
Thus, construction provides various opportunities for learning as a platform to document,
assimilate, and share knowledge within and across projects (Anheim, 2003; Knauseder et
al., 2003, 2007). Therefore, the present study focuses on project learning processes during

23
the construction stage (i.e., production) and how these processes are influenced by the
characteristics of construction.
1.3 Overview of Some Studies on Project Learning
One of the recently developed models on intra-project learning (learning within project) is
that of Sense (Sense, 2004, 2007a, 2007b, 2008; Sense & Antoni, 2003). Using a case
study in manufacturing industry, Sense’s model was built based on the situated approach
of learning (Lave & Wenger, 1991). The model included five elements affecting learning
activities: learning relationships, cognitive style, knowledge management, learning
mandate and learning environment support, and pyramid of authority.
Prencipe and Tell (2001) investigated three processes of inter-project learning (i.e.,
learning across projects), which are experience accumulation, knowledge articulation, and
knowledge codification. Using case study in some industries, excluding construction, the
scholars presented a matrix of the learning mechanisms according to three levels (i.e.,
individual, project/group, and organizational) of each of the learning processes. In
addition, they presented the learning typology of these processes includes learning by
doing, learning by using, learning by reflecting, learning by thinking, learning by
discussing, learning by confronting, learning by writing and re-writing, learning by
implementing, learning by replicating, and learning by adapting.
Gieskes and Broeke (2000) used a survey to investigate aspects of learning and continuous
improvement in construction projects. They highlighted some problems related to learning
in construction project including insufficient learning tools (such as benchmarking or

24
problem solving mechanisms), inadequate knowledge exchange between team members
and their leaders, lack of project reviews, and inability to capture lessons learned. They
concluded that learning is difficult to achieve due to certain characteristics of the
construction project. These include separation between design and actual realization of
construction (i.e., production), one-off nature of projects and their organization, on-site
character of projects that render communication difficult, culture of projects dominated by
a focus on technical aspects, and an environment where project completion is the main
orientation.
Other studies in construction include the review conducted by Knauseder et al. (2003),
who investigated organizational learning according to three aspects: contract forms,
construction process, and people. The first and second aspects indicate fragmentation, but
not extensively. They highlighted that individuals learn more in total construction projects
(such as design and build) due to enhanced feedback and greater time for reflection (cited
in Carlsson & Josephson, 2001). Another study by the scholars, (Knauseder et al., 2007),
indicated the issue of fragmentation in construction. They affirmed that boundaries
between projects and the parent organization may reduce trust, limit contact between
organizations, and reduce flow of experience. They proposed solutions for this problem,
including cross-organizational and cross-functional project teams; team environments that
encourage and support high performance collaboration; systematic documentation of
experiences; and “live” capture and reuse of knowledge. However, this study and the
previous one (Knauseder et al., 2003) were unable to address fragmentation extensively
and were focusing on organizational learning and learning styles in construction.

25
1.4 Research Gaps
The overview in the previous section highlights the following: empirical studies on project
learning in construction (not to be confused with organizational learning or project-based
learning) are limited. In general, most studies on learning in the construction industry are
qualitative-based and focus on the organizational level (refer to Chapter 2 for a
comprehensive review). Studies that investigate the influence of project characteristics,
specifically, fragmentation, on learning process are limited as well. Some studies claimed
that fragmentation has a negative influence on the learning process (Barlow & Jashapara,
1998; Gieskes & Broeke, 2000; Knauseder et al., 2007; Tan & Elias, 2000). However,
these studies did not demonstrate the extent of this impact.
More importantly, the concepts of project learning and fragmentation remain vague.
Project learning is confused occasionally with similar concepts such as organizational
learning and project-based learning. A precise definition of fragmentation remains lacking.
Therefore, conceptualizing and determining these concepts is important to fill this gap.
1.5 Problem Statement
The construction industry is organized around the project and not the firm (Groák, 1994).
In fact, there exist considerable differences between project and firm as milieus of
learning. Insufficient understanding of the difference between the two settings may result
in less practical and less realistic paradigms or models of learning (Ibert, 2004; Sense,
2007a). Learning in construction projects can be a difficult task due to their nature that is
temporary, ad hoc-based working relationship, and fragmented.

26
Furthermore, determining the influence of project characteristics on learning (P. Chan et
al., 2005; Gieskes & Broeke, 2000) is crucial to understand how learning occurs in
construction projects. However, the vast number of studies on organizational learning and
project-based learning failed to recognize the interaction between learning and the nature
of construction projects. Fragmentation, as one of the unique characteristics of construction
(Murdoch & Hughes, 2008; Winch, 2010), causes problems related to performance of
projects and knowledge spanning and production (Anumba et al., 2002; Baiden et al.,
2006; Egbu, 2006; Na et al., 2007). Inadequate awareness of fragmentation’s influence
may hinder learning processes and knowledge acquisition within and across construction
projects.
1.6 Research Questions
Stating several pertinent questions is important to articulate the research gaps and problem
and direct the study toward the appropriate methodology. The current study outlines three
main inquiries. The first inquiry is related to understanding the meaning and features of
project learning and fragmentation. Considering the fundamental differences between
project and permanent organization (firm), one may ask: What are the aspects of learning
in the project milieu? Is there any difference between project learning and similar concepts
such as project-based learning? How does project learning influenced by prominent
theories of learning such as organizational learning?

27
As stated previously, the notion of fragmentation is still vague. Therefore, it is important to
identify the factors that determine this notion. In addition, it is assumed that fragmentation
has a negative influence on project learning process. Thus, the second inquiry concerns
about identifying the extent of fragmentation’s impact on project learning.
The third inquiry concerns about exploring the factors that facilitate achieving learning
within fragmentation. The research questions are depicted around the following three main
inquires:
1) What are the features of project learning? Is there any difference between project
learning and similar concepts such as organizational learning and project-based
learning? What is fragmentation and how it can be determined?
2) To what extent does fragmentation influence project learning?
3) How to enable project learning within fragmentation?
1.7 Aim and Objectives
The present study aims to develop a model of project learning for construction projects.
The model will attempt to explain how learning occurs within fragmentation. This model
may contribute to the theory of project learning as well as the practice of construction
management in construction. The objectives of the current study are as follows:

28
To identify the aspects of project learning and fragmentation from the literature;
To identify the factors that enable learning within fragmentation in construction
projects; and
To develop a model of project learning for construction projects considering
fragmentation.
1.8 Research Scope
It is important to mention that the current study does not intend to offer any solutions to
fragmentation, rather to understand its effect on learning and how learning occurs. This
phenomenon can be examined within the scope of construction building projects in
developing countries (i.e., the case of Malaysia). The current study is limited to big
building projects that are under construction (i.e., in the production stage) during the
course of this research. The influence of other stages (e.g., design stage) on learning
activities could be indirect.
Project learning involves team members’ action to learn. Therefore, the current study is
focused on different individuals’ involvement in learning processes. These include project
managers, project engineers, project consultants, and other professionals in the
construction site.

29
1.9 Research Methodology: An Overview
Aspects of project learning and fragmentation will be identified through review and
synthesis of the literature. An initial theoretical model will be developed to demonstrate
the relationship between fragmentation and project learning. A qualitative study
comprising in-depth interviews will be used to explore new factors to enable project
learning within fragmentation. Qualitative data analysis employs manual analysis of the
interviews to explore codes and themes of the phenomenon (Creswell, 2008).
A quantitative study will be used then to validate the findings of the qualitative study and
to develop the model further. Data will be analyzed using factor analysis to summarize the
number of variables. Partial least squares-path modeling (PLS-PM) of structural equation
modeling approach (SEM) will be employed to analyze the whole model. This approach
suits exploratory-nature studies where prediction is the chief concern. In addition, PLS-PM
enables testing of different levels of relationships (e.g., measurement and structural
models) simultaneously. For example, it assesses the relationship between variables that
indicate fragmentation; at the same time, it assesses the association between fragmentation
and project learning. This grants a comprehensive testing and evaluation of the whole
model of project learning.
1.9.1 Approaches and strategies
According to Yin (2009), research strategy depends on three elements: research
question(s), control over behavioral events, and degree of focus on contemporary events.
Three approaches are employed in research procedures: qualitative, quantitative, and
mixed (Bryman, 2004; Creswell, 2009).

30
Mixed approach can involve three models: two-phase design, where the qualitative and
quantitative phases are conducted separately; dominant- less dominant design, where one
approach has a small portion of design compared with another approach; and mixed
methodology design, where qualitative and qualitative approach are mixed in any part of
the study (Creswell, 2008). The current research adopted the dominant- less dominant
design model. The qualitative study is dominant-less, while the quantitative study is the
dominant in this context.
A mixed-methods strategy has many sequential designs (see Creswell, 2009). The
sequential exploratory design, which begins with qualitative approach and data analysis
followed by quantitative approach and data analysis, appears to be appropriate for the
present research. According to Creswell (2009), this sequence is used in exploration
research and when developing a certain instrument is necessary. Table 1.1 illustrates
research approaches and methods based on the research objectives.
Table 1.1: Research methods and approaches according to the research questions
Research Objectives Research
Paradigm
Method of Data
Collection (Analysis) Purpose
1. To identify the aspects
of project learning and
fragmentation
- Literature rev iew
(Synthesizing)
- Conceptualize the notions of
project learn ing and
fragmentation
2. To identify the factors
that enable learning
within fragmentation
Qualitative
(inductive)
In-depth interviews
(Exploring Codes and
Themes)
- Explore the factors that
facilitate achiev ing project
learning within fragmentation
3. To develop the project
learning model
considering
fragmentation
Quantitative
(deductive)
Questionnaire survey
(PCA & CFA to refine
the measurement scale /
Hypotheses Testing
using PLS-PM)
- Develop measurement models
of fragmentation, project
learning and enablers
- Examine the association
between fragmentation and
project learn ing
- Validate the results of the
qualitative study

31
1.9.2 Justification of using mixed approaches
Identifying the association between fragmentation and project learning involves hypothesis
testing and answering the question “What?,” which requires a quantitative approach (Yin,
2009). Quantitative study has the ability to cover wide cases in numerical data. The last
inquiry involves answering the question “How?” (i.e., how to enable learning within
fragmentation), which implies a qualitative approach. The qualitative study is useful to
explore the enablers that are limited in the literature. In fact, the current study will begin
with the qualitative study to explore factors that enable learning. Subsequently, the
quantitative study will be used to validate findings of the qualitative study and to answer
the second inquiry. This sequence is useful for discovering new variables and obtaining
rich context of a phenomenon (Creswell, 2009).
In sum, qualitative approach will be employed to discover enablers of project learning
within a fragmented context. The quantitative approach will serve three purposes: to
validate and generalize the findings of the qualitative study; to establish the relationship
between fragmentation and project learning; and to develop the final model of project
learning out of the theoretical model. The research procedure for developing the final
model is shown in Figure 1.1.

32
Figure 1.1: Research procedure
Synthesizing of Literature
(Chapter 2)
Qualitative Study: To explore the
enablers of project learning (Chapter 4)
QUANTITATIVE Study: Testing the
full model and hypotheses (Chapter 5)
Discovering
new variables
Answering the
third inquiry
Confirming the
variables & relations
Answering the
second inquiry
Data Analysis
Data Analysis
Theoretical Model: Hypotheses
development (Chapter 3)
Answering the
first inquiry
First Model of
Project Learning
Second Model of
Project Learning
Final Model of
Project Learning

33
1.10 Outline of Thesis Structure
Including the current chapter, this thesis is divided into seven chapters.
Chapter 2: Literature Review
This chapter is divided into two sections, the first of which highlights the fragmentation
phenomenon and identifies two levels of fragmentation: industry level and project level. It
argues that both are related to team fragmentation. The second section reviews studies
related to learning in construction to show the research gap. The section highlights several
fundamental works on project learning and discusses the difference between this notion
and other similar notions such as project-based learning. The outcome of this chapter is the
point- form features of project learning.
Chapter 3: Theoretical Model and Research Design
This chapter proposes a theoretical framework of project learning. In this chapter, studies
that indicate the relationship between project learning and fragmentation are reviewed.
This chapter highlights specific indicators of project learning and fragmentation, which
will be used to develop the measurement scales of these notions. The research design is
proposed at the end of this chapter, which demonstrates the logical sequence of collecting
data based on the research proposition.
Chapter 4: Qualitative Study
This chapter intends to identify the enablers of project learning within fragmentation. The
chapter presents the findings of in-depth interviews with experts on construction projects.
Method of analysis and discussions of the findings are presented as well.

34
Chapter 5: Quantitative Study
The purpose of this chapter is twofold: first to develop the final model of project learning
out of the theoretical model proposed in Chapter 3. Second, to verify the findings of the
qualitative study presented in Chapter 4. A questionnaire survey is used for this purpose.
Steps for developing the questionnaire survey are presented, including conceptualization,
operationalization, and measurement of variables. Pre-test of the questionnaire is
conducted, including content validity, face validity, and pilot study. Steps for collecting
data, data analysis, and results are outlined in this chapter.
Chapter 6: Discussions
This chapter highlights the main findings of the qualitative and quantitative studies. The
chapter discusses the results of the final model of project learning. The role of enablers as
mediating variables is discussed as well. Moreover, this chapter discusses in detail the
structural and measurement models of fragmentation, project learning, and enablers of
project learning.
Chapter 7: Conclusion and Recommendations
This chapter highlights the main findings and contributions of the current study. It shows
the implications of the study to the academia and industry. Limitation of the current study
and recommendations for future researches are presented as well.

35
CHAPTER 2: LITERATURE REVIEW
2.0 Introduction
This chapter is divided into two sections. The first intends to review the characteristics of
the construction industry and fragmentation. It begins with an argument that fragmentation
is embedded in the nature of construction. This section elaborates fragmentation’s levels,
reasons, impact, and proposed solutions. Subsequently, the definition of team
fragmentation as a multi- faceted notion is presented. The second section, meanwhile,
highlights some gaps in the literature of learning in the construction field. It reviews
fundamental works on project learning as well as related theories to learning such as
organizational learning theory to provide a full picture of this notion. The connection
between project learning with previous theories is discussed and features of project
learning are identified.
SECTION I: FRAGMENTATION
2.1 Characteristics of Construction Industry and Projects
This section argues that fragmentation is rooted in the nature of the construction project
and industry. Hartmann and Caerteling (2005) emphasized on the relationship between
fragmentation (referred to as decoupling of construction services and process) and three
criteria of construction: client dependency, location dependency, and weather- influenced

36
activities. According to scholars, constructional task dependency on client and location
results in three aspects: transaction uncertainty, transaction complexity, and post-contract
asset specificity. The first aspect leads to fragmentation while the other two aspects lead to
the need for coordination and integration (Hartmann & Caerteling, 2005).
Langford and Male (2001) emphasized that construction structure is derived from location
and delivery requirements rather than volume-based consumer-oriented product delivery.
Construction as a product can be regarded as the following: assembly is carried out at a
particular site selected by the purchaser; high degree of product specificity ( requires
detailed plans and specifications); each facility is designed to order; and a unique price is
determined for each project and a fixed price on a cost-incurred basis (Lange & Mills,
1979, p. 4). According to Hillebrandt (2000), the structure of construction industry can be
determined by a large number of dispersed contracting firms and the usual separation of
design from construction. Characteristics of construction products that determine the
industry’s structure include: final product is large, heavy, and expensive; it is situated over
a wide geographical area; it is made mostly to the requirements of the individual customer;
and most of the components are manufactured elsewhere (Hillebrandt, 2000, p. 5). The
location-based production and order of construction present an extraordinary diversity and
heterogeneity (Carassus, 2000).
In general, construction projects are regarded as a one-of-a-kind product, site-dependent
production, and temporary organization (Koskela, 1992). Construction project as a
temporary multidiscipline organization involves numerous stakeholders who collaborate
with each other during the project life cycle (Dave & Koskela, 2009). The temporary
relationship between these stakeholders and the statistic-based production escort

37
fragmentation (Dainty et al., 2005). Other factors associated with the nature of projects that
cause fragmentation include the following: separation of design and construction process,
lack of coordination and integration between various functional disciplines, and poor
communication (Love, Irani, et al., 2004b; Xue et al., 2005).
Vlies and Maas (2009) described the construction industry from the perspective of social
capital theory. They argued that the industry contains little network closures and many
structural holes caused by fragmentation and project-based contract. The relatively sizeable
number of small construction firms makes the industry more segregated, while various
players within a construction project contribute to the segregation of design and
construction process (Vlies & Maas, 2009).
Studies on fragmentation are concentrated mainly on two levels. One appears at the
industry’s level, where a relatively large number of small firms cause structural
segregation of the industry. The second appears at the project level due to disintegration of
project activities and entities. Fragmentation can also be categorized into two dimensions:
fragmentation of entities (e.g., firms, team, etc.) and fragmentation of processes (e.g.,
design and construction). The following section elaborates on these two levels.
2.2 Levels of Fragmentation
This study distinguishes three levels of fragmentation. The first is industry level or inter-
organizational level, which occurs due to firms’ segregation. The second is project level,
which occurs due to the separation of construction process and entities. Although both
38
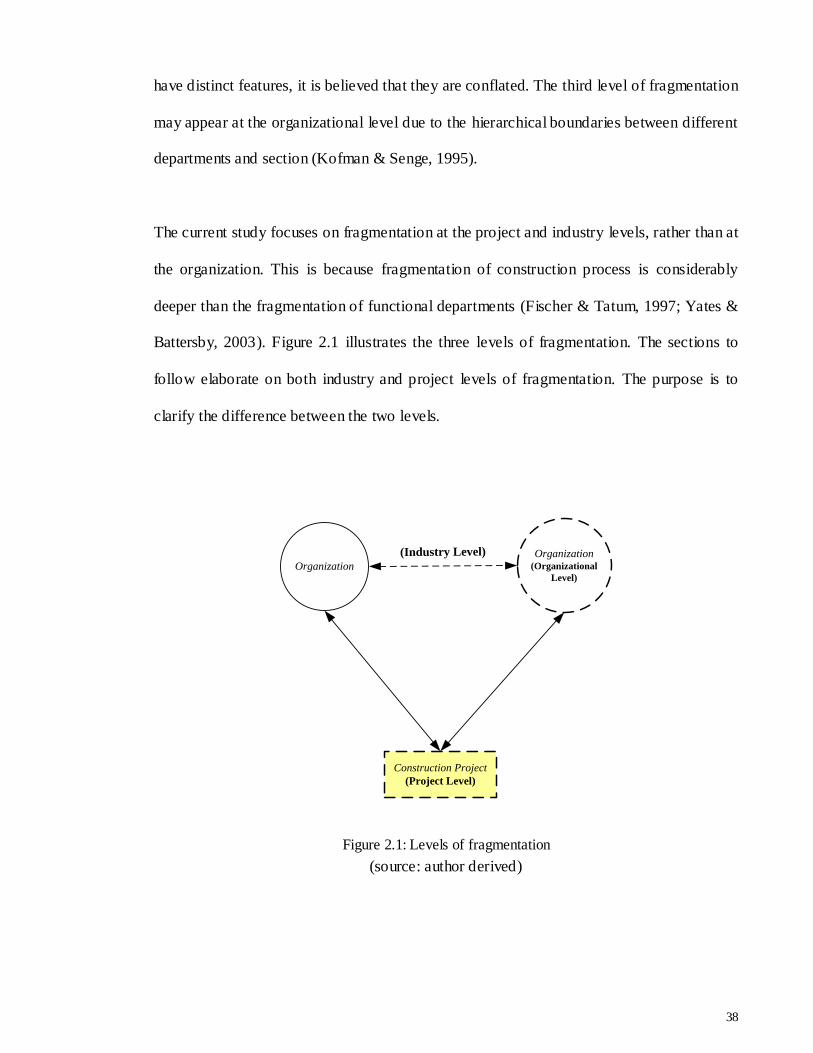
have distinct features, it is believed that they are conflated. The third level of fragmentation
may appear at the organizational level due to the hierarchical boundaries between different
departments and section (Kofman & Senge, 1995).
The current study focuses on fragmentation at the project and industry levels, rather than at
the organization. This is because fragmentation of construction process is considerably
deeper than the fragmentation of functional departments (Fischer & Tatum, 1997; Yates &
Battersby, 2003). Figure 2.1 illustrates the three levels of fragmentation. The sections to
follow elaborate on both industry and project levels of fragmentation. The purpose is to
clarify the difference between the two levels.
Organization
Construction Project
(Project Level)
(Industry Level) Organization (Organizational
Level)
Figure 2.1: Levels of fragmentation
(source: author derived)

39
2.2.1 Fragmentation of the industry (firm fragmentation)
The construction industry is composed of a large number of small enterprises; it comprises
multiple professions, occupations, and organizations to deliver the project (Garcia, 2005;
Lange & Mills, 1979; Langford & Male, 2001). Ofori (1993, p. 12) stated that the
construction industry is characterized by a multiplicity of small firms and a few large ones,
which is largely due to the nature of construction activities involving discrete projects that
are dispersed, location-specific, varied in scale, and predominantly small in size. Thus,
fragmentation of the construction industry is related to the reduction of average size of big
companies to small firms (Gonz'alez et al., 1998) and the scope of work packages.
The construction industry can be described as fragmented if no company has a significant
market share and is able to influence considerable outcomes within the industry (Langford
& Male, 2001). Graham Winch indicated that fragmentation occurs when “the bespoke-
integrated intra- firm networks are difficult to establish because of the relatively small size
of firms […]” (Winch, 2010, p. 391). Majority of these firms do not act together in such a
way that can improve the performance of the construction industry as a whole.
In the United Kingdom, for example, small and medium enterprises (SMEs) account for
over 95% of the construction industry (Oragne et al., 2005). The Malaysian construction
industry is fragmented and shares similar characteristics compared to other developed and
developing countries (Abdullah, 2004; CIDB, 2007). In 2011, more than 62,000
construction firms registered with the CIDB (construction industry development board)
(CIDB, 2011). Approximately 50,000 firms are considered SMEs (under the categories G1,
G2, and G3), representing approximately 80% of the total number of registered firms. A

40
reason for this huge increase in small firms is related basically to construction
characteristics that have been discussed previously. However, fragmentation at this level
can be viewed as an enabler of competition among firms (Langford & Male, 2001).
According to Duffy et al. (2007, p. 462), SMEs own most of the skills and knowledge, but
their performance can be hindered by setbacks such as lack of funds to invest individually
in research and development. This is accompanied by the dynamic and temporary
relationship between construction partners and the various disciplines in these firms (Duffy
et al., 2007). The temporary coalitions of stakeholders result in complex and detailed
contracts, low trust, and adversarial relationships (Winch, 2000). Garcia (2005)
emphasized on the importance of a network of SMEs to enable integration and innovation,
and to foster the creation, dissemination, and valuation of knowledge in a frame of
cooperation and confidence.
2.2.2 Project level (production process level)
Fragmentation at this level implies lack of coordination, collaboration, integration, and
poor communication between various functional disciplines and contractual partners in the
project (Bresnen & Marshall, 2001; Xue et al., 2005). Another aspect of fragmentation at
this level is the inability of specialists and professionals to work together efficiently.
Specialization can cause certain concomitant problem to knowledge sharing. Moreover,
knowledge created in construction is, to a certain extent, “situated” and a sizeable body of
experiential knowledge created in practice remains tacit and thus difficult to transfer
(Demaid & Quintas, 2006). “Of course, as there are obvious benefits to be gained from
specialization, fragmentation itself is not necessarily a problem […] However, it is
precisely the problems associated with lack of integration that have long been the focus of

41
industry, government and academic attention (from Emmerson to Egan)” (Bresnen &
Marshall, 2001, p. 343). Hence, collaboration and integration of professionals can attain
the benefits of specialization and enable better communication and sharing of knowledge.
Another aspect of fragmentation at this level is the separation of design and construction
stages. The function of the master builder was fragmented into designer and constructor
specialties during the late part of the 19th and early part of the 20th century (Yates &
Battersby, 2003). Thus, two different areas in this level can be distinguished:
fragmentation caused by the separation of the master builder function into disintegrated
design and construction function, and fragmentation caused by the specialization of design
and builders into a specific field of operation (Yates & Battersby, 2003).
2.2.3 Other dimensions of fragmentation
Fragmentation can be viewed from a different angle and categorized into two dimensions:
fragmentation of entities and fragmentation of process or function. The first implies
segregation of expertise, specialist teams, and specialist firms (Hertog & Brouwer, 2001;
Murdoch & Hughes, 2008). This dimension of fragmentation develops from lack of
collaboration, integration, or common objectives of project teams and firms. The second
dimension implies the disintegration of the construction process during the project life
cycle. The project can be divided into several stages: initiation, design and planning,
construction, and operation and demolishing. A vast divide exists between the design stage
and construction stage (Baiden et al., 2006; Forgues et al., 2009; Oragne et al., 2005).
People during the project life cycle work in silos (Anumba et al., 1997). Moreover, the
construction stage consists of many disintegrated sub-stages. For example, construction
work consists of site preparation, foundation works, structure works, and finishing and

42
handling. All these stages involve a significant number of specialists and firms; at the same
time, they involve separate and complex processes. Thus, the construction stage itself can
be regarded as a case that contains both fragmentation of entities and fragmentation of
function.
2.3 Definition of Fragmentation
The previously made distinction between the two levels of fragmentation (i.e., industry and
project levels) indicates no specific agreed-upon definition for this phenomenon. Gonz'alez
et al. (1998) affirmed that firm or industry fragmentation may be interpreted as team
fragmentation. The scholars affirmed that fragmentation can be viewed as change in
contractual patterns from employment relationship to market relationship, and “this
qualitative change of contracts is a transfer of the entrepreneur’s rights to other members of
the team, who become entrepreneurs themselves. Thus, from this point of view, firm
fragmentation is interpreted as team fragmentation” (Gonz'alez et al., 1998, p. 439).
The current study follows the view of Bresnen and Marshall (2001); Xue et al. (2005);
Love, Irani, et al. (2004a); and Demaid and Quintas (2006) on fragmentation: it is defined
as the lack of coordination, collaboration integration, poor communication, and diversity of
specializations of contractual partners and various functional disciplines. Fragmentation
here is a matter of degree rather than existence. Thus, fragmentation in the current study
can be defined as follows:

43
Project team heterogeneity results from specific delivery process of the project and lack
of collaboration, coordination, and integration. It is caused also by decoupling of
diversities and the situated nature of knowledge in the project.
2.4 Causes of Fragmentation
As discussed previously, construction projects have two main characteristics: pre-demand
nature of projects (the owner must buy the product before it is ready) and situated nature of
projects in a certain location (Langford & Male, 2001). These characteristics cause
“transaction uncertainty” and fragmentation (Hartmann & Caerteling, 2005). In addition,
“variations in regulation” may cause fragmentation of firms, complexity of services, and
market segmentation (Gonz'alez et al., 1998; Langford & Male, 2001; Oragne et al., 2005).
On the other hand, fragmentation at the project level can be traced back to various firms
brought together to form the construction team. This team is selected based on professional
capability rather than the team’s ability to integrate and work together effectively (Baiden
et al., 2006). Fragmentation at this level reflects fragmentation at the industry level, which
sustains a contractual and confrontational culture (Sorrell, 2003). The technical complexity
of the construction process and the problem of procuring system lead to a wide variety of
skills and specialists (Murdoch & Hughes, 2008). In addition, further production and
complexity of projects and proprietary of knowledge cause skills and diversity of
specializations (Seymour, 1987). Anumba et al. (2002) described the traditional
fragmented practice of construction project as “over the wall” approach, where several
participants work independently while formulating decisions that affect others.

44
Fragmentation can be caused by poor coordination between various disciplines and
division of labor during the project life cycle (Hertog & Brouwer, 2001; Vock', 2001).
Other reasons for project fragmentation include the following: lack of trust (Hertog &
Brouwer, 2001); temporary collaboration of several disciplines and participants (Anumba
et al., 1997; Mohamed & Tucker, 1996); several stakeholders and several construction
phases (Nitithamyong & Skibniewski, 2004); and sequential nature of the construction
process (Dulaimi et al., 2002).
2.5 Impact of Fragmentation
Fragmentation has a negative effect on construction industry and projects. The impact of
fragmentation can be categorized as follows: 1) performance of industry and projects; 2)
communication and relationships; and 3) knowledge and learning.
First, fragmentation is one of the causes of less interest in strategic management
implementation (Cheah & Chew, 2005). In addition, fragmentation of the industry may
slow the uptake of information technology (IT) among small firms given a relatively small
number of industry leaders who plan for strategic IT implementation (Stewart et al., 2004).
Fragmentation may cause variability of performance and productivity of projects, as well
as design clashes, omissions, and errors (Anumba et al., 2002; Baiden et al., 2006;
Nitithamyong & Skibniewski, 2004). Forgues et al. (2009) cited the problems resulting
from fragmentation mentioned in (Dupagne, 1991) into the following: lack of iterations in
the design process, lack of consideration of constraints within subsequent phases, and lack
of leadership and accountability. These problems, in turn, lead to suboptimal solutions,

45
rework in design and construction, and lack of innovation (Forgues et al., 2009).
Moreover, fragmentation limits the impact of human resource mechanisms (Cheng et al.,
2007); impacts constructability (Fischer & Tatum, 1997); lowers investment and concern
in the production process (Na et al., 2007); and hampers implementation of integrated
technologies (Koskela, 1992).
Second, adversarial relationships and poor communication between parties can cause
problems such as the lack of transparency and mistrust (Baiden et al., 2006); difficulties in
communication, information processing and integration (L. Liu, Georgakis, et al., 2007;
Nitithamyong & Skibniewski, 2004); misconceptions and misunderstanding among
different participants (Anumba et al., 2002); and adversarial workplace attitude of the
project team (Cheng et al., 2007). In addition, the limitation of communication among
project teams leads to conflicts, dispute, time and cost overrun, and rework (Dave &
Koskela, 2009; Tijhuis & Maas, 1996).
Lastly, fragmentation of projects can impact learning and innovation solutions (Hertog &
Brouwer, 2001; Na et al., 2007) and knowledge capturing and sharing (Dave & Koskela,
2009). Fragmentation can inhibit knowledge production, thereby leading to a low level of
productivity (Egbu, 2006; Oragne et al., 2005). In addition, fragmentation hinders the
useful experience and know-how to be used sufficiently during the planning process
(Vock', 2001). Moreover, fragmentation and the ad hoc-based working nature of small
firms lower the rate of learning in these firms (Tan & Elias, 2000). Furthermore, it causes
numerous contracts and points of information exchange (Tijhuis & Maas, 1996) that render
information integration more complex and difficult to achieve. Finally, fragmentation of
professional project team may impact the following: absorptive and innovative capacity of
46
the organization, ability to recognize the value of new knowledge, assimilation of new
knowledge with existing knowledge, and application of knowledge to commercial ends
(Bresnen et al., 2003).
2.6 Overcoming Fragmentation
At the industry level, several approaches have been recommended to overcome
fragmentation. These include the following: creating business-to-business network or
internetworking (S.L. Chan & Leung, 2004; Winch, 2010); encouraging partnering,
compromising, collaboration, and knowledge sharing in the supply chain (Egan, 1998;
Egbu, 2006; Kagioglou et al., 2000; Oragne et al., 2005); encouraging cooperation and
integration among firms and project parties via both the legal and social mechanisms
(Hartmann & Caerteling, 2005); and developing the procurement using alliance-based
management to overcome the IT literacy gap between large enterprises and SMEs (Stewart
et al., 2004).
Oragne et al. (2005) indicated an approach called cross-organizational learning (COLA) to
reduce the impact of fragmentation. This approach involves inter-organizational
agreements and workshops to enhance communication and knowledge sharing. Maqsood et
al. (2007) indicated this approach as well to develop a learning organization, and for
knowledge sharing across the supply chain as well as development of trust and
commitment of players.

47
On the other hand, the study of Forgues et al. (2009) underscored collaboration as the main
solution for fragmentation. The study proposed three main approaches to encourage
collaboration: integrated practices, integrated teams, and integrated design process. In
addition, the study examined two factors that facilitate collaboration, namely, change
practice and objects, to facilitate boundary crossing. In the first approach, the scholars
underpinned the activity theory (Engeström, 1987) to explain how to break barriers at the
pragmatic level. Meanwhile, the situated action theory (Lave & Wenger, 1991) was
presented to identify ways that help to cross the boundary between communities of practice
(CoP). A community of practice, according to Lave and Wenger (1991), is a term that
describes a group of people who share an interest, craft, and/or profession. The group can
evolve naturally because of the members’ common interest in a particular domain or area,
or it can be created specifically with the goal of gaining knowledge related to their field
(Lave & Wenger, 1991). Through the process of sharing information and experiences with
the group, members learn from each other and create an opportunity to develop themselves
personally and professionally.
Forgues et al. (2009) proposed IT as a boundary crossing that facilitates collaborative work
and transformational learning among member of a design team. On the other hand, Baiden
et al. (2006) observed that team practices within the context of procurement approach
affect the level of integration. Further recommendations and approaches of several scholars
to overcome fragmentation can be categorized into the following:
1. Utilizing ICT and/or knowledge management: utilizing computer- integrated construction
(CIC) methods (Koskela, 1992); providing a “knowledge centre” (Oragne et al., 2005);
utilizing knowledge management and innovation (Vock', 2001); construction collaboration

48
technologies (CCT) (Hore et al., 2009); and utilizing IT (Nitithamyong & Skibniewski,
2004).
2. Encouraging collaboration and team integration: promoting inter-sectoral collaboration
(e.g., joint initiative of the associations of engineers, architects, and construction firms) to
deliver a single and integrated product (Vock', 2001); addressing integration in the
procurement techniques, as they are limited to addressing the production problem only
(Naoum, 2003); motivating integration and closer cooperation between consultants and
contractors (Dulaimi et al., 2002); providing a clearer definition of the role of other
companies through specifications and contract (Sorrell, 2003); empowering the attitude of
full integration, cooperation, and trust (Tijhuis & Maas, 1996); and developing a protocol
of design and construction process (Kagioglou et al., 2000).
3. Utilizing design-and-build (D&B) and other approaches: promoting D&B and relatively
new procurement methods (Anumba et al., 1997; Dulaimi et al., 2002); adopting
concurrent engineering (CE) with appropriate organizational structure (Anumba et al.,
2002); developing and empowering the multi-disciplinary team (Anumba et al., 2002);
ensuring clarity and good procedures and responsibilities within the contracts (Tijhuis &
Maas, 1996); developing procurement using alliance-based management (Stewart et al.,
2004); and realizing the influence of design on project performance, clients’ dissatisfaction
with the currently dispersed responsibility, and prominence of specialist constructors,
especially those whose contribution must be coordinated (Ofori, 2003).

49
In a discussion on the limitation of design-and-build approach, Ofori (2003) emphasized
that D&B does not reduce fragmentation but transfers the problems from clients to
contractors. Design-and-build, according to the scholar, is not a panacea for the industry’s
problems. In addition, Anumba et al. (1997) stated that D&B has suffered from poor
design quality, lack of certainty on expected performance, high tendering costs, and lack of
flexibility in accommodating client change. Tijhuis and Maas (1996) likewise criticized
this method as it restricts the influence of the client and places higher risk on the
contractor. Table 2.1 summarizes the literature on fragmentation’s reasons, impact, and
solutions according to the two levels of industry and project.
Table 2.1: A summary of fragmentation studies (industry and project levels)
(Author,
year)
Frag. of
Industry
Frag. of
Project Reasons Impact Proposed solutions
(Seymour, 1987)
√
-Further production
of construction project needs highly
diverse of skills
-Proprietary of
knowledge
(knowledge may not transferable without
some cost) cause
specialization of
firms
-Complexity and size of supply of services.
(Koskela,
1992) √
-Hampers the implementation of
integrated technologies
-Utilizing computer
integrated construction (CIC) methods that facilitate
communications of data,
knowledge and design
solutions.
(Tijhuis &
Maas, 1996) √
-Conflicts (errors in
communication and
information)
-Several contracts and several points of
information exchange
-Empower the attitude of
fully integration,
cooperation, and trust.
-Clearness and the well done procedures and
responsibilities within the
contracts.
(Mohamed &
Tucker, 1996) √
-The nature of construction industry
(large number of
participants form a
temporary group to
accomplish the task)

50
(Author,
year)
Frag. of
Industry
Frag. of
Project Reasons Impact Proposed solutions
(Anumba et
al., 1997) √
-Several disciplines work together for
relatively short
period.
-Working
independently while taking decisions that
affect others ‘over the
wall’ approach
-Poor integration,
coordination and
collaboration
-Lack of communication -Unwarranted design
change
-Automation of various
aspects of the design and construction process
-Using new procurement
methods (e.g. D&B,
although it has some
limitations) -Computer-integrated
framework for concurrent
life-cycle design and
construction (CLDC)
(Tan & Elias,
2000) √
-Lowers the rate of
learning of small firms
(this besides the ad hoc
nature of their work that leads to organizational
forgetting)
(Kagioglou et
al., 2000) √
-Poor communication
between all parties
-Key elements: product development, project
implementation, partnering
the supply chain, and
production of components
-A protocol of design and construction process
(Hertog &
Brouwer,
2001)
√
-Difficulty in co-
ordination among
various disciplines involved in the
construction process
-Various phases of
this process -Lack of trust
-Limitation of learning -Innovative solutions to
problems are not always
well retained
(Vock', 2001) √
-Division of labor
and poor co-ordination in the
sequence of activities
during the life cycle
of construction
projects.
-Useful experience and
know-how is not used
sufficiently in the planning process.
-Difficulty of
implementing innovative,
efficient and beneficial
solutions.
-The joint initiative of the
associations of engineers, architects, and construction
firms (inter-sectoral
collaboration)
-Utilization of knowledge
management
(Langford &
Male, 2001) √
-Characteristics of
construction industry
(pre-demand, the localized project-
based nature, project
type, and the delivery
requirements).
-Large number of SMEs and small
number of large
companies (market
segments)
-Organization should seek
competitive advantage from
knowledge and information
based assets rather than
through technologically based assets per se.
(Anumba et
al., 2002) √
-The traditional
practice of
construction project ‘over the wall
approach’.
-Misconceptions and
misunderstanding of
different participants
-Fragmentation of design and construction data
leads to design clashes,
omissions and errors.
-Adopting concurrent
engineering with appropriate
organizational structure (e.g.
the matrix structure) -Development and
empowerment of multi-
disciplinary team
Table 2.1: A summary of fragmentation (industry and project levels) (Cont’d)

51
(Author,
year)
Frag. of
Industry
Frag. of
Project Reasons Impact Proposed solutions
(Dulaimi et
al., 2002) √
-The sequential
nature of the
construction process
-Lack of integration across
the value chain is the
major cause of low
productivity
-Motivation for greater
integration and closer cooperation between
consultant and contractors
-Promoting D&B
procurement method and
adopting new organizational structure
(Fischer &
Tatum, 1997) cited (Yates &
Battersby,
2003)
√ -Hinders constructability
(Naoum,
2003) √
-Utilizing methods that
address the problem of
integration (e.g. partnering),
whereas procurement
techniques are limited to addressing the production
problems only.
(Sorrell, 2003)
cited (Egan,
1998)
√
-Fragmentation at
project level reflects fragmentation at
industry level, which
sustain a contractual
and confrontational
culture.
-Define the role of other
companies (through
specifications and contracts)
(Ofori, 2003) √
-Realizing the influence of
design on project
performance -Clients’ dissatisfaction with
the current dispersed
responsibility
-Prominence of specialist
contractors especially those whose contributions must be
co-ordinate.
-(D&B is not appropriate as
it transfer the problem from
client to contractor)
(Stewart et al.,
2004) √
-Slow uptake of IT in the
supply chain (small number of industry leaders
in charge to plan for
strategic IT
implementation
-Developing the procurement
using alliance-based
management to overcome the IT literacy gap between
the large and SMEs
-Utilizing web-based
information management
system
(S.L. Chan & Leung, 2004)
√ -Fragmentation can occur geographically
or functionally
-Coordination among
various participants can be difficult task
Internetworking, specifically
for AEC, to help overcoming
the problem of communication and
spreading information. It is
cheap, widely available and
not too difficult to use.
(Nitithamyong
&
Skibniewski, 2004)
√
-Many stakeholders
and phases involved
in a construction project
-Problems related to
communication and
information processing
-Proliferation of
adversarial relationships between the parties.
-Low productivity
-Utilization of IT
Table 2.1: A summary of fragmentation (industry and project levels) (Cont’d)

52
(Author,
year)
Frag. of
Industry
Frag. of
Project Reasons Impact Proposed solutions
(Oragne et
al., 2005) √ √
-Huge number of
small and medium
construction enterprises.
-Ownership and
control of separate
functions and
processes resides in the hands of separate
organizations.
-Critical barrier to change
-Major factor of poor
communications between
parties working together
on construction project
-Cross Organizational
Learning Approach of knowledge sharing among
partners
-Restructure the industry by
engendering a spirit of
compromise and collaboration
-Inter-organizational
agreements and methods of
communication, and clearer
definition of roles and contract (recommended by
Latham, 1994)
-A ‘knowledge Centre’ to
access to the required
information (recommended by Egan, 1998)
(Hartmann &
Caerteling,
2005)
√ √
-The dependency of
constructional tasks on client and location
that causes the
‘transaction
uncertainty’ and
fragmentation
-Cooperation and integration among firms and project
parties via the legal
mechanisms and the social
mechanisms or networks
(Egbu, 2006) √
- Inhibits knowledge
production that lead to the
low level of productivity
-Partnering (suggested by
Egan) can also help in
knowledge production
(Baiden et al.,
2006) √
-Various
organizations brought
together to form the
team that is
responsible of producing the
product.
-Team member are
selected based on the
professional capability rather than
their ability to
integrate and work
together effectively.
-Reduce project delivery
efficiency and poor
performance -Adversarial relationships,
lack of transparency and
mistrust. This often results
in a ‘blame culture’.
- Individual rather than team objectives
-‘The construction
industry has not fully
benefited from the
increased productivity and product quality that can
result from teamwork’
-Increase design changes
and unnecessary liability
claims, which make true project life cycle analysis
difficult to achieve
-Encourage collaboration
and integration of process
and team (from Egan:
Accelerating Change) -‘Integration Toolkit’
-Team integration via
improving project
procurement (D&B) and
product delivery process -Construction managers’
roles
(Na et al.,
2007) √
-Low investment and
concern in production process
-Less motivation to invest
in innovation
-Hinders mutual sharing
of information and knowledge
(J. Liu, Li, et
al., 2007) √ √
-Adversarial relationships
among project participants and lack of
communication
-Hinders information
integration in construction
logistic system
-Collaborative teamwork among construction players.
-Building a favorable
learning environment for
contractors
-Mutual cooperation
Table 2.1: A summary of fragmentation (industry and project levels) (Cont’d)

53
(Author,
year)
Frag. of
Industry
Frag. of
Project Reasons Impact Proposed solutions
(Cheng et al.,
2007) √
-Stymied performance
improvement -Limited the impact of
HRM mechanisms
-Adversarial workplace
attitude in the supposedly
integrated project team environment
(Maqsood et
al., 2007) √
-Development of learning
organization and knowledge sharing across the supply
chain and with
clients/customers
-Development of trust and
commitment of players
(Murdoch &
Hughes, 2008) √
-Temporary
relationship of
different specialists and organizations.
-Wide variety of
skills resulted from
the technical
complexity of the problem associated
with procuring
buildings.
(Forgues et
al., 2009) √
-Lack of iterations in design process; lack of
consideration of
constraints within
subsequent phases; and lack of leadership and
accountability
-All those lead to
suboptimal solutions, poor
constructability, rework in design and construction
and lack of innovation
(cited Dupagne, 1991).
Role of IT and technology to
increase the collaborative
work
(Hore et al.,
2009) √
-Utilization of construction collaboration technologies
(CCT) (e.g. computer-aided
drafting, 3-D modeling, and
a host of Internet and
standard based design and project collaboration
technologies).
(Dave &
Koskela,
2009)
√
-Complexity of process -Hampers capturing and
sharing knowledge
-Limits communication
which lead to dispute,
time and cost overrun, and rework
(Winch, 2010) √ - Business to business Internet-based approach
Note: Reference in bold font represents studies that indicated both knowledge or learning and fragmentation.
Table 2.1: A summary of fragmentation (industry and project levels) (Cont’d)

54
SECTION II: PROJECT LEARNING
2.7 Levels of Learning
Learning occurs at certain levels, including individual, project (team/group), organization,
and inter-organization (Ayas, 1997; Barlow & Jashapara, 1998; Sun & Scott, 2005; Wu,
2005). Literature involves numerous investigations on learning at the organization level.
Individual learning is considered the underpinning of organizational learning (Argyris &
Schön, 1978). Linkage between individual learning and organizational learning is
discussed by studies such as Sun and Scott (2005) and Sense (2005). However, individual
learning is saddled with shortcomings compared with collective learning. For example,
individuals have limited capabilities to look at non-routine problems, to be involved in
learning processes, and to deal with complex situations (Bourgeon, 2007). Both individual
and group learning occur when an important issue arises (Anheim, 2003). As construction
is a project-based industry, paying greater attention to the project level is more important.
The current study focuses on the project learning level and entities that learn within this
context. The following section reviews several studies on learning in construction at
different levels, highlighting the need for more studies at the project level.
2.8 Learning in Construction: Highlighting Certain Gaps
This section summarizes several studies related to learning in the construction industry in
different levels: individual, team, project, organization, and inter-organization. This review
does not cover all studies on learning in the construction; rather, it provides an indicator of
the direction of the investigations in the field. The purpose is to establish that there are
limited empirical investigations addressing learning within and across construction

55
projects. In addition, there are limited studies that intend to develop learning models in
view of the construction project’s characteristics. Table 2.2 shows studies on learning in
construction according to level of learning, research method used, and location.
Table 2.2: A summary of different studies on learning in the construction industry
(Author(s),
year)
Milieu or
Level
Approach /
method Location Study’s contribution and some highlights
(Barlow & Jashapara,
1998)
Organization / Inter-
organization
Quali. / Case study
UK
Explored the role of partnering in stimulating
organizational learning (OL). Effective communication,
codifiability, and trust within and between organizations all improve learning and knowledge transfer. Type of
knowledge and organizational culture enable knowledge
transfer between firms.
(Gherardi
et al.,
1998)
Individual /
Organization
Quali. /
Semi-
structured
interviews
Italy
Contributed to understanding social perspective of
learning activity and developed a situated curriculum for
construction project manager (based on situated learning
theory).
(Barlow,
2000)
Inter-
organization
Quali. / Case
study UK
Examined the role of partnering to stimulating learning
and innovation. Forms of organizational learning in the
case studies include vicarious learning, team learning and
individual learning.
(Love, Li,
Irani, &
Faniran,
2000) / (Love, Li,
Irani, &
Holt, 2000)
Organization
Conceptual /
Synthesizing of literature
-
Incorporated total quality management (TQM)
philosophy, organizational learning and change in a conceptual framework for construction organization.
(Tan &
Elias,
2000)
Industry
Quanti. /
Archival data
(production
function
approach)
Singapore
Found that learning by doing was not significant in
construction industry. Reasons include fragmentation of
the industry, the dependency on imported technology and
unskilled foreign workers. Another reason is that learning
is a social-embrace, which emphasizes on the need for comprehensive measure of learning at different levels.
(Vakola &
Rezgui, 2000)
Organization Quali. / Case study
Sweden,
Norway, & France
Explored the role of re-engineering and innovation for
organizational learning in construction companies. Also, investigated the influence of these aspects to enhance
professionals in organizations.
(Gieskes &
Broeke,
2000)
Organization
/ project
Quanti. /
Survey Netherlands
Identified three characteristics of construction projects: the
one-off nature of projects and their organizations, the on-site character of projects, and culture. The results were
organized around the following: organizations’ dealing
with projects; methods and techniques for learning;
climate to support learning; tools for learning; and
knowledge exchange.
(Huemer & Östergren,
2000)
Organization Quali. /
Interviews Sweden
Investigated OL and strategic change in construction
companies and found that learning takes place in cultural
settings. Implications for learning are twofold. First, the identity of an organization makes possible a different set
of actions. It alters the firm’s strategic behavior. Second,
learning cannot be understood solely as a process of
adaptation to the environment. Triggers to learning arise
from both internal and external factors.

56
(Author(s),
year)
Milieu or
Level
Approach /
method Location Study’s contribution and some highlights
(Keegan &
Turner,
2001)
Organization
Quali. /
Interviews
and
observations
Different
countries in
Europe
Explored practice of OL across different industries,
including construction. Challenges faced by organization to learn from project were analyzed based on: variations,
selection, and retention. Characteristics of learning in
project-based organizations include: time pressure;
centralization of resources; and deferral. These also
impede project-based member in learning from and through projects.
(Bresnen et al., 2002) /
(Bresnen et
al., 2003)
Project /
organization
Mixed / Case
study and
survey
UK
Analyzed enablers and barriers of learning across different
industries including construction. These are project and project process characteristics, networking, learning
capture, and organizational context. The role of a regional
engineering manager (REM) to organize engineering
activities and support learning was introduced.
(Ren &
Anumba,
2002)
Individual
(agent
system)
Quali. /
Bayesian
approach
UK
Reviewed some aspects of learning as method of learning
(rote learning, learning from instructions, learning from
examples, learning by analogy, and learning by discovery)
and other aspects of negotiating agent learning in construction project.
(Davey et al., 2004)
Organization Quali. / Case study
UK
Investigated the role of action learning in promoting
innovation, continuous improvement and change culture
as part of construction SMEs. Action learning can generate a motivated, committed and innovative
management team, as well as better site management and
leadership.
(Love et
al., 2002)
Inter-
organization
Quali. / Case
study UK
Developed a model that relates transaction cost with
learning, alliance and contractual implication. Transaction
cost can be affected by two concepts of learning within
alliance environment: consider business decision that is
influenced by learning climate (bounded rationality) and make best use of information (opportunism).
(Love et al., 2003)
Organization Quanti. / Survey
Australia
Examined the influence of learning and quality on the
level of the cost of re-work. There was no significant negative correlation between a firm's learning practices
and rework costs. This suggests that firms have become
accustomed to paying rework costs.
(Fong,
2003)
Team /
project
Conceptual /
Synthesizing
of literature
and case
study
Hong Kong
Developed a model of knowledge creation process of
multi-disciplinary team. Processes of knowledge creation
are: boundary-crossing, knowledge sharing, knowledge
generation, knowledge integration, and collective project
learning.
(Knauseder
et al.,
2003)
Organization
/ intra-
project
Conceptual /
Synthesizing
of literature
-
Introduced the concept of OL capability in order to
understand existing and absent learning processes in
construction projects. The study highlighted the
characteristics of projects including construction process and fragmentation.
(Franco et
al., 2004)
Inter-
organization
Quali. /
Workshops using
Problem
Structuring
Method
UK
Developed Cross Organizational Learning (COLA)
approach using strategic-based workshops to identify and review problems and success factors of project among
partners. Obstacles of inter-organizational learning are:
obstacles related to inter-organizational routines; less
natural learning among partners; lack of trust; and the
transient nature of project team.
(Love,
Irani, et al.,
2004a)
Organization
/ Inter-
organization
Quanti. /
Questionnaire
survey
Australia
Investigated the role of benchmarking in obtaining the
most from organizational IT investment in construction
SM Es. Part of the process of benchmarking is the ‘check phase’, which, forms an integral part of the learning cycle
of the organization. “Once organisations have evaluated
themselves against ‘best practice’ firms within the
industry, they need to be able to determine how they can
learn from these firms as well—a process known as benchlearning”.
Table 2.2: A summary of different studies on learning in the construction industry (Cont’d)
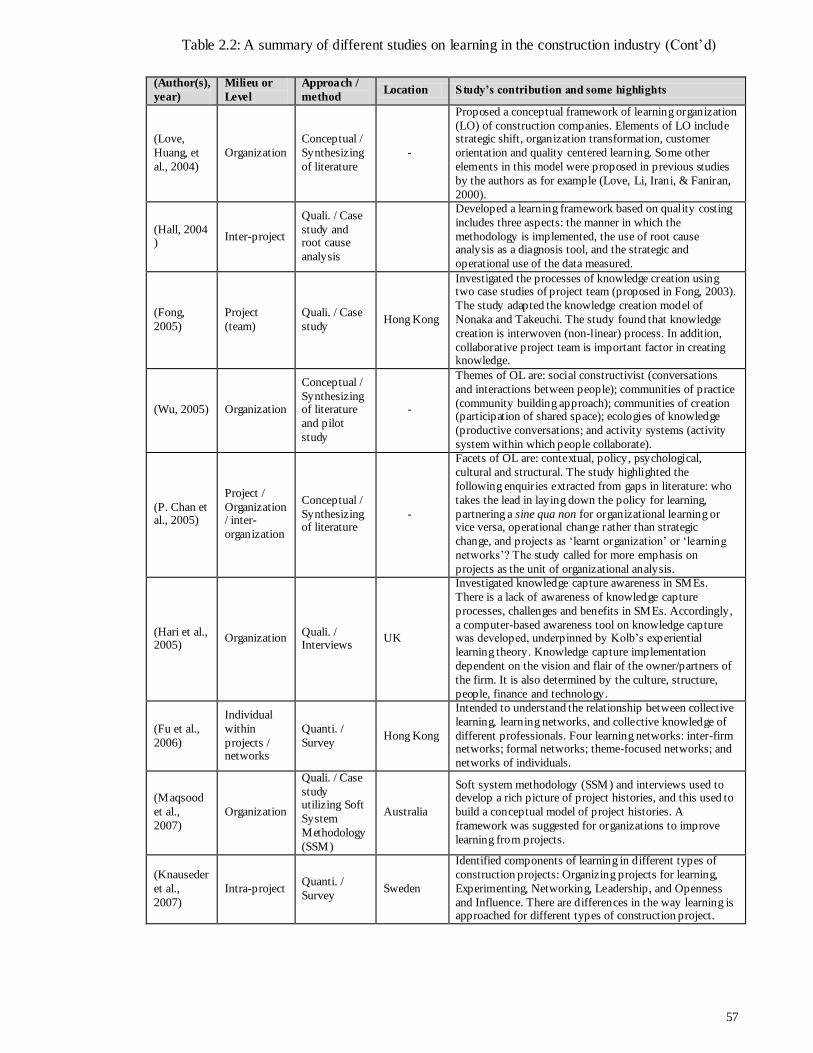
57
(Author(s),
year)
Milieu or
Level
Approach /
method Location Study’s contribution and some highlights
(Love,
Huang, et
al., 2004)
Organization
Conceptual /
Synthesizing
of literature
-
Proposed a conceptual framework of learning organization
(LO) of construction companies. Elements of LO include strategic shift, organization transformation, customer
orientation and quality centered learning. Some other
elements in this model were proposed in previous studies
by the authors as for example (Love, Li, Irani, & Faniran,
2000).
(Hall, 2004 )
Inter-project
Quali. / Case
study and root cause
analysis
Developed a learning framework based on quality costing
includes three aspects: the manner in which the
methodology is implemented, the use of root cause analysis as a diagnosis tool, and the strategic and
operational use of the data measured.
(Fong,
2005)
Project
(team)
Quali. / Case
study Hong Kong
Investigated the processes of knowledge creation using two case studies of project team (proposed in Fong, 2003).
The study adapted the knowledge creation model of
Nonaka and Takeuchi. The study found that knowledge
creation is interwoven (non-linear) process. In addition,
collaborative project team is important factor in creating knowledge.
(Wu, 2005) Organization
Conceptual /
Synthesizing of literature
and pilot
study
-
Themes of OL are: social constructivist (conversations
and interactions between people); communities of practice
(community building approach); communities of creation (participation of shared space); ecologies of knowledge
(productive conversations; and activity systems (activity
system within which people collaborate).
(P. Chan et al., 2005)
Project /
Organization / inter-
organization
Conceptual /
Synthesizing of literature
-
Facets of OL are: contextual, policy, psychological,
cultural and structural. The study highlighted the
following enquiries extracted from gaps in literature: who
takes the lead in laying down the policy for learning,
partnering a sine qua non for organizational learning or vice versa, operational change rather than strategic
change, and projects as ‘learnt organization’ or ‘learning
networks’? The study called for more emphasis on
projects as the unit of organizational analysis.
(Hari et al., 2005)
Organization Quali. / Interviews
UK
Investigated knowledge capture awareness in SMEs.
There is a lack of awareness of knowledge capture
processes, challenges and benefits in SMEs. Accordingly,
a computer-based awareness tool on knowledge capture was developed, underpinned by Kolb’s experiential
learning theory. Knowledge capture implementation
dependent on the vision and flair of the owner/partners of
the firm. It is also determined by the culture, structure,
people, finance and technology.
(Fu et al.,
2006)
Individual
within
projects / networks
Quanti. /
Survey Hong Kong
Intended to understand the relationship between collective
learning, learning networks, and collective knowledge of
different professionals. Four learning networks: inter-firm networks; formal networks; theme-focused networks; and
networks of individuals.
(Maqsood
et al.,
2007)
Organization
Quali. / Case
study utilizing Soft
System
Methodology
(SSM)
Australia
Soft system methodology (SSM) and interviews used to develop a rich picture of project histories, and this used to
build a conceptual model of project histories. A
framework was suggested for organizations to improve
learning from projects.
(Knauseder
et al.,
2007)
Intra-project Quanti. /
Survey Sweden
Identified components of learning in different types of
construction projects: Organizing projects for learning,
Experimenting, Networking, Leadership, and Openness
and Influence. There are differences in the way learning is approached for different types of construction project.
Table 2.2: A summary of different studies on learning in the construction industry (Cont’d)

58
(Author(s),
year)
Milieu or
Level
Approach /
method Location Study’s contribution and some highlights
(Hällgren & Wilson,
2007)
Intra-project Quali. / Case
study
Central America,
Asia and
Europe
Investigated how informal and incidental learning occurs
when there is a deviation in the project. There are two levels of learning; learning occurs when handling the
deviations and learning patterns emerge when handling
remedies.
(Landaeta,
2008)
Organization
/ Inter-
project
Quanti. /
Survey
Europe,
North,
Central, &
South
America
Knowledge transfer across projects has a positive
relationship with project body of knowledge and
performance. However, variation explained of
performance is not significantly influenced by knowledge
transfer.
(Abdul-
Rahman et al., 2008)
Intra-project
Mixed /
Preliminary
survey and case study
Malaysia
Developed a conceptual model that may assist in
mitigating project delay. The model consists of four
phases of project learning: knowledge identification; knowledge sharing, creation, and integration; knowledge
exploitation; and knowledge storage.
(Hasle et
al., 2009)
Individuals /
Organization
Quali. / Case
studies Denmark
Explore how the owners of small construction and metal
industry firms attribute accident causation and what they learn about accident prevention. The owners attribute the
incident to two things: mostly to unforeseeable
circumstances and secondarily to worker faults. Learning
from accident seems to be negative as the owners need to
withhold from accident prevention to maintain that accidents unforeseeable.
Figure 2.2 (a) indicates the distribution of the reviewed studies according to the level of
learning. Clearly, most studies are at the organization level. Studies on individual and team
levels are very limited. Number of studies at the project and inter-organizational levels are
almost equal, but less than the organizational level. Figure 2.2 (b) shows the studies based
on the methodology used. Most studies used the qualitative approach (including case
study, interviews, etc.). Number of quantitative studies (using questionnaire survey, etc.) is
approximately half of the qualitative studies. Similarly, the conceptual studies (used
synthesizing of literature to develop models or frameworks) are likewise approximately
half of the qualitative studies. Mixed approach is the less frequently used method.
Table 2.2: A summary of different studies on learning in the construction industry (Cont’d)

59
(a)
(b)
Figure 2.2: Number of several studies on learning in the construction according to (a) level of
learning and (b) methodology used
To summarize, learning at the project and team level has received less concern compared
with the organization level. In addition, there are limited empirical studies of learning at
project level. The influence of project characteristics on learning has obtained little
attention. Lastly, most studies are qualitative-based, which call for more quantitative
studies that examine project learning process.
0
5
10
15
20 Individual
Team
Project Organization
Inter-
organization
0
5
10
15 Conceptual
Qualitative
Quantitative
Mixed

60
2.9 Learning Approaches in Projects
Learning in project milieu can be distinguished according to type, model of learning, level
of individual learning, and learning method. Storm and Savelsbergh (2005) identified three
types of learning in projects: operational learning (e.g. lessons learned, learning curve,
etc.); managerial learning (e.g. learning during execution of managerial tasks); and
organizational learning through projects (e.g. project-based learning).
Models or styles that explain how learning occurs can be distinguished into the cognitive
model and community model (Swan et al., 1999). According to Bresnen et al. (2002), the
cognitive model deals mainly with codifying and circulating knowledge widely through the
application of ICT, while the community model focuses on tacit dimension of knowledge
whereby shared meaning of project team facilitates the understanding and application of
knowledge. In cross-project learning, IT will be used predominantly in the cognitive
model, while social networks will be utilized in the community model (Newell, 2004). The
community model, in addition, emphasizes on the social and behavioral aspects of
knowledge. Sense (2009) emphasized on the behavioral perspective of learning that
focuses on the role of action in learning.
According to Mumford (1995), individual learning from experience can be distinguished
into four levels or approaches: 1) intuitive (to learn from experience but without being
conscious of it); 2) incidental (learning by chance resulting from jolt such as mishap, etc.);
3) retrospective (learning by reviewing and developing lessons to learn); and 4)
prospective (to plan to learn before an experience takes place).

61
Learning methods can be divided into the following: rote learning (direct implementation
of knowledge), learning from instruction and by advice taken, learning from example and
by practice, learning by analogy, and learning by discovery (Ren & Anumba, 2002).
Complexity and efforts in these methods increase from the first to the last.
Lastly, project reviews and learning methods can be classified into process-based methods
and documentation-based methods (Schindler & Eppler, 2003). Process-based method
involves gathering lessons learned from concluded projects and explaining the relevant
steps and sequences of a project’s timeline. It consists of two methods: post-project
appraisal (PPA) and after action review (AAR). PPA represents a special type of project
review that includes a strong learning element. AAR method can assist immediate team
learning from errors and successes. Meanwhile, the documentation-based method is more
about learning from project experience and storage of contents within the organization.
This method consists of micro articles, learning histories, and recall.
2.10 Project Learning
Organizational learning may be applied differently to the project milieu (or locus) and
organization milieu. As can be perceived from the previous section, an organization learns,
similar to the individual and group. An important question to ask in this regard is, “Does a
project learn?” To understand the notion of project learning, the researcher will attempt to
distinguish between organization (routine organization) and project with regard to learning.
The discussion will expand to identify similarities and differences between project learning
and project-based learning. In addition, fundamental works of project learning will be

62
reviewed. The review will include works of organizational learning cited by project
learning studies. Lastly, features of project learning will be presented at the end of this
chapter.
Projects differ from permanent organizations in many facets. Projects are described as one-
shot, time-bound, goal-driven activities directed toward the delivery of new product or
service (Arthur et al., 2001). Moreover, construction projects are situated on a site, unique,
and fragmented (Winch, 2010). In the best situations, projects will be regarded as
temporary multi-organizations (Disterer, 2002; Gieskes & Broeke, 2000; Koskela, 1992).
Further discussion on the idea that projects are temporary organizations can be found in
(Packendroff, 1995; Turner & Müller, 2003). The temporary nature of construction
projects may affect the acquisition of learning and knowledge from previous experience
(Ceci & D'Andrea, 2009). Moreover, existing knowledge in construction projects is
described as dispersed (Garcia, 2005). Other characteristics of projects, which may also
influence learning, include customization, discontinuity, complexity, interdependence, and
uncertainty (Brady et al., 2002).
In organizations, learning activities are supported by organizational structure, routine, and
resources to assimilate knowledge (Mian & Takala, 2008). Discontinuity of project
practices, resources, and information flow render establishing routine tasks and learning
(Bresnen et al., 2003; Scarbrough & Swan, 2008). Unlike organizations, projects lack a
memory (e.g., experiential learning and work routines), rivaling cultures, or social
background (Ibert, 2004). Thus, it can be inferred that projects per se cannot learn.

63
2.10.1 Toward a better understanding of project learning
Project learning may differ from learning project and project-based learning. Learning
project, which appears less frequently in literature, can be defined as “an instrument for
members of an organization to organize learning activities systematically around a central
work-related theme or problem” (Poell, 2000, p. 179). Meanwhile, project-based learning
has been studied and defined more clearly. For example, Storm and Savelsbergh (2005)
defined project-based learning as the theory and practice of utilizing real-work assignments
on time-limited projects to achieve mandated performance objectives and facilitate
individual and collective learning. Project-based learning involves two main processes,
namely, learning by absorption and learning by reflection (Scarbrough et al., 2004). In
addition, Ayas and Zeniuk (2001, p. 64) pointed out the features of project-based learning
as follows:
1) Learning is one of the project’s objectives.
2) Environment offers psychological safety to tell the truth.
3) Projects are provided with the appropriate infrastructure to support learning.
4) There exist communities of practice (CoP) that cross project boundaries.
5) The leader of the project has commitment to learning.
6) There is a systematic and collective reflection, where problems are considered as a
chance to learn and change.
According to Ayas (1997, p. 59), “Learning within a project does not happen naturally: it
is a complex process that needs to be managed. Learning requires deliberate attention,
commitment and continuous investment of resources.” Thus, in project-based learning,
there exist objectives, awareness, intention, and commitment of individuals and leaders

64
toward learning activities. At the same time, the environment of the project is prepared to
support these activities. In addition, project-based learning caters more to the community
model or social process of learning. This is evident in a number of fundamental studies in
construction projects and other projects, including for example (Arthur et al., 2001;
Barlow, 2000; Bresnen et al., 2003; DeFillippi, 2001; Keegan & Turner, 2001; Midler &
Beaume, 2010; Newell, 2005; Nicolini & Meznar, 1995; Scarbrough & Swan, 2008).
Moreover, project-based learning represents the fourth approach of learning that is
prospective (i.e., planning to learn in advance) (Mumford, 1994). Project learning, on the
other hand, may involve all four approaches, namely: intuitive, incidental, retrospective,
and prospective. Both project-based learning and project learning are concerned about how
to attain certain benefits of learning, such as enhancing performance, avoiding the same
mistakes, and so on. On the other hand, project-based learning focuses more on the entity
that learns and how learning occurs. Meanwhile, project learning focuses on knowledge as
an outcome of the process of learning.
Sun (2006) distinguished between organizational learning and learning organization, where
the first involves obtainable and natural facets of learning, while the second implies ideal
and intentional learning practices. By analogy, we can regard project learning as
organizational learning, and project-based learning as learning organization. The first
involves single- loop learning, while the second involves both single- and double- loop
learning (Argyris & Schön, 1978; Sun, 2006). Furthermore, project learning, as
organizational learning, appears to be a description, while project-based learning (similar
to learning organization) is a prescription.

65
In general, project learning involves tasks of detecting and correcting errors and activities
of sharing, creating, and transferring knowledge (Ibert, 2004; Kotnour, 1999). The author
believes that project learning encompasses natural or “unintentional” aspects of learning.
In addition, project learning emphasizes the situated aspect of learning (Sense, 2004).
Sense (2007b) agreed that learning is linked to people and their actions and the conditions
in which it is generated: “…learning as a practical activity (in any setting), is always
socially structured activity where the conditions and forms for learning are established
unintentionally and tacitly by the community that shapes the practice…” (Sense, 2007b, p.
407). Thus, the general assumption is that learning occurs in any project.
At present, the definition of project learning remains broad. Some studies explicitly
indicate project learning, while others regard it as organizational learning. A general
definition was coined by Kotnour (2000, p. 396), who stated that project learning pertains
to “the set of actions the project teams use to create and share knowledge within and across
projects.”
This definition implies three aspects of project learning, namely, actions (i.e., activities) of
project team, outcome of this action (i.e., knowledge created and shared), and dimension or
level of learning (i.e., intra- and/or inter-project). Intra-project learning can be defined as
the acquisition and use of knowledge and experience within the same project (Gieskes &
Broeke, 2000). It focuses on tasks within a single project and supports the delivery of a
successful project by identifying problems and their solutions during the project life cycle
(Kotnour & Vergopia, 2005). On the other hand, inter-project learning refers to the transfer
of knowledge and experience from one project to other projects within the same time frame
or to different projects over a period of time (Gieskes & Broeke, 2000).

66
Fong (2003) indicated that transfer of knowledge can happen concurrently while
conducting the project or sequentially after finishing the project. In addition, Fong (2003,
p. 484) stated the following:
Central to inter-project learning is a certain degree of repetitiveness between
projects, whether they are task similarities or the principles are the same. The most
widely observed strategy in inter-project learning occurred in team members
engaged in multiple projects rather than where knowledge was codified in any
format.
Moreover, inter-project learning involves combining and sharing lessons learned across
projects to develop new knowledge (Kotnour & Kurstedt, 2000). Hence, intra-project
learning serves as a foundation for inter-project learning by providing the experiences to be
assimilated from the project (Kotnour & Proctor, 1996).
The following section provides a chronological review of several prominent works on
project learning in different fields, including construction. This review will attempt to
provide more insight into project learning and how this concept is perceived by different
studies.
2.10.2 Some studies on project learning
Until the mid-1990s, theories on learning within and between projects had been almost
non-existent (Packendroff, 1995). However, the ensuing period witnessed some emerging
works in this area. Poell (1998); Nobeoka (1995); and Schindler and Eppler (2003)

67
respectively mentioned some of the earliest studies that indicated learning within project
milieu, including Bouwen et al. (1992); Fujimoto et al. (1992); and (Nevison, 1994).
Nobeoka (1995) presented a model of inter-project learning in the new product
development field. The model implies that technical knowledge can be transferred in two
modes; the first occurs concurrently while developing the new product, where direct
communication and interaction are applicable. The second is a sequential transfer after the
completion of the base product. According to Nobeoka, documented knowledge (e.g.,
technical design) can be used in a subsequent product. However, direct transfer of
knowledge is more efficient and effective compared with the subsequent mode. This is
because the first mode can include specific activities such as direct interaction, task
sharing, and mutual adjustment.
Kotnour and Proctor (1996) indicated project learning as part of the management system
model. Learning within and across projects was indicated as part of organizational learning
and knowledge management. The scholars viewed intra-project learning as a process of
lessons learned to create, assimilate, and disseminate knowledge. Knowledge creation
implies documenting an innovative way to achieve certain tasks or major problems
encountered and approaches used for overcoming these problems. Continuous capturing of
lessons learned attains knowledge assimilation. Meanwhile, knowledge dissemination
implies a means of knowledge sharing among individuals within the project. On the other
hand, inter-project learning occurs when the process of creation, assimilation, and
dissemination of knowledge is implemented appropriately in a new project (Kotnour &
Proctor, 1996).

68
A framework proposed by Kotnour (1999, 2000) attempted to integrate learning in the
project management process. The framework was based on the idea of organizational
learning that an organization (i.e., project-based) learns when individuals create, share, and
apply knowledge. Kotnour discussed the role of lessons learned during these activities.
Individuals learn when they engage in a learning experience, namely, the plan-do-study-act
cycle (PDSA), which was developed from quality management (Juran, 1988). According
to Kotnour, learning within a project occurs when the project team discusses about
completing tasks or overcoming problems. On the other hand, learning across projects
implies sharing lessons learned across projects to develop new knowledge. Tools to
support this activity include IT and employee groups (peer groups) aimed at fulfilling this
activity.
Kotnour and Hjelm (2002) identified five factors that help in understanding learning in the
project team and to create a learning organization. These include organizational and
leadership action, project manager action, project team action, project culture and learning
culture, and organizational culture. The scholars focused on the role of leadership in
supporting learning and emphasized on the relationship between project team’s actions, the
right culture, and the right leader’s actions and support. Supporting aspects of learning
within project include having a goal and program for learning, having managers’ inner
model (i.e., personal development), experimenting with new ideas, having a reward
system, and forming a “community of learners” (Kotnour & Hjelm, 2002). Other works of
Kotnour (Kotnour & Vergopia, 2005, 2007) focused on project reviews in aerospace
industry. The works pointed out certain issues such as best practice in learning-based
project review, effective lessons learned, and integration of organizational learning with
project review.

69
Focusing on inter-project learning, Prencipe and Tell (2001) highlighted several criteria of
projects and project-based organizations to understand the learning process. The scholars
affirmed that projects embody technological as well as organizational traits, while project-
based firm is organized around projects, embodying most business functions and working
as a mechanism that integrates projects. Prencipe and Tell (2001) adopted three process
activities to develop a framework for inter-project learning abilities, namely, experience
accumulation, knowledge articulation, and knowledge codification. The scholars proposed
learning typologies of each of the previous processes. For example, experience
accumulation includes two typologies: learning by doing and learning by using. In
addition, the scholars identified mechanisms of inter-project learning of the three processes
according to different levels (i.e., individual, group/project, and organizational). For
example, experience accumulation at the group or project level includes the following
mechanisms: developed group thinking, person-to-person communication, informal
encounters, and imitations. To understand the aspects of inter-project learning, the scholars
developed a matrix called “learning landscape” that shows the learning mechanisms
according to the different levels.
In the IT sector, Disterer (2002) underscored that valuable knowledge may be lost after the
completion of projects due to their temporary nature. He affirmed that transferring
knowledge from the routine organization to the project may be attained by means of team
and users’ participation and involvement, standard operating procedures (SOP), and other
internal documentation. Meanwhile, transferring knowledge from projects to the
permanent organization appears to be a task of project management. In addition, the
scholar distinguished two types of knowledge that should be documented: knowledge with
regard to working results and knowledge about methods, tools, and innovative outcomes.

70
Examples of the first type of documented knowledge include technical drawings, user’s
manual and operating instructions, and training courses and materials. The second type of
knowledge is more difficult to document as it encompasses several aspects of tacit
knowledge and day-to-day working activities. It requires “professional” project
management techniques. These include project reviews, project profiles, and lessons
learned meant for other members to use in future projects. Defining new responsibilities in
the organization, as project experience manager or knowledge harvester, may foster these
activities (Disterer, 2002).
Ibert (2004), among a few scholars, attempted to distinguish between learning within firm
(routine or permanent organization) and learning within project according to three aspects
of organizational learning, namely: memory, experience, and reflection. Ibert stated that
learning in the firm setting has three approaches: strategic management approach ( i.e.,
leaders’ role to strategize the aim of learning and provide a climate of openness);
evolutionary approach (members’ talent to learn, i.e., focusing on inner factors rather than
external factors); and CoP approach (i.e., formation and creation of knowledge localized in
these communities). He affirmed that learning in a project is a task of problem solving and
is featured with four aspects: knowledge in action (i.e., action or practice to form the
knowledge and this contradicts the cognitive style and emphasize the situated approach);
integration of diversity (i.e., participation of different skills, identities and learning
trajectories, and relationships and reputation; however, diversity may cause tensions that
may stimulate learning process); de-coupling from organizational routine (i.e., low
inertia that allows change to build up momentum; this implies reflection as a way of
learning); and task-commitment (i.e., “challenging task” and collective aim provide

71
learning efforts; task commitment also provides integration of firms and professionals)
(Ibert, 2004).
Newell (2004) considered that effective lessons learned can be achieved if the lessons
focused on capturing successful processes and procedures in projects. Project members can
share lessons learned through social or personal networks, which are more effective than
ICT tools. The scholar identified two features of learning; the first implies that learning is
about perceived need (called timeliness of knowledge). People will seek knowledge when
they need it and when there is knowledge in a similar context. Second, knowledge is about
content and sharing knowledge is easier when there is a common ground or overlapping
between two contexts (i.e., knowledge redundancy or absorptive capacity). In this context,
Newell (2004) distinguished between two contents of knowledge: product (what was
actually accomplished in a project) and procedural (how the task was performed). This is
similar to the previous distinction of knowledge (Disterer, 2002). The second type is more
appropriate for developing shared knowledge across projects.
In another study, Newell (2005) investigated knowledge transfer via short-circuiting the
learning cycle of Kolb (Kolb, 1984). This can be performed by codifying the abstract
conceptualization and transferring it to others for use. The scholar identified knowledge
characteristics that render knowledge transfer problematic. She described knowledge as
distributed, ambiguous, and disruptive. These characteristics highlight three issues:
availability of usefulness of knowledge, acceptance and trust of knowledge, and resistance
to change practice. Based on these characteristics, the scholar suggested the following
steps: facilitate awareness of potentially useful knowledge, support the interpretation of
knowledge, and encourage acceptance of knowledge and change in practice.

72
Williams discussed several important issues in project learning, including how an
organization can learn from projects, why post-project reviews do not occur frequently in
practice, and what are the current practice of developing efficient lessons learned
(Williams, 2003, 2004, 2007, 2008). Some problems of learning from projects include the
temporary nature of projects, complexity of projects, and difficulties in identifying the
non- intuitive lessons learned. The scholar suggested practical approaches that can be used
in post-project review to develop easily understood lessons learned. Systems dynamic and
mapping techniques are two examples used for this purpose. On the other hand, learning in
projects includes two approaches: the first implies that knowledge creation is a socially
constructed activity and the second implies that knowledge is actively built by the
cognizing subject (constructivism approach of knowledge).
One of the recently developed models of intra-project learning is that of Sense (Sense,
2004, 2005, 2007a, 2007b, 2008; Sense & Antoni, 2003). The model was developed based
on a case study method in manufacturing industry. The main theories used to construct the
model are the Situated Learning Theory and Cognitive Learning Theory. The significance
of this model stems from its ability to integrate cognitive, behavioral, and sociological
perspectives of learning (i.e., information, action, and community dimensions). In two of
his works (Sense, 2004, 2007b), he proposed five elements that form the architecture of
project learning, namely: learning relationships, cognitive style, knowledge management,
learning mandate and learning environment support, and pyramid of authority. In some of
the previous studies, Sense elaborated on each of these elements extensively.

73
2.10.3 Studies on project learning in construction
Gieskes and Broeke (2000) investigated how infrastructure firms learn from their projects.
The scholars discussed the finding based on three characteristics of construction projects:
one-off nature of projects and their organizations, the on-site character of projects, and
culture. Their results were organized around the following: organizations’ learning from
projects, methods and techniques for learning, climate to support learning, tools for
learning, and knowledge exchange. Lastly, the scholars discussed difficulties in learning,
which can be related to the characteristics of construction projects.
Fong (2003) investigated project learning as part of the knowledge creation model of
project team. According to Fong, knowledge creation includes five processes: crossing
boundaries among multi-disciplinary team and boundaries between consultants, client, and
contractor; enabling knowledge sharing; enabling knowledge generation via interaction
and communication; enabling knowledge integration of various disciplines during design
and decision-making process; and collective project learning. The scholar emphasized that
project learning involves absorbing new technologies and techniques, creating the
appropriate environment that encourages enquiries and learning, using problem-solving
mechanisms, viewing failure as a way of learning, and undergoing the inter-project
learning process.
Bresnen et al. (2003) discussed the challenges involved in learning in construction
projects, including fragmentation of the team into different professional disciplines and the
difficulty to establish routine activities within projects due to discontinuity of resources
and information flow. According to Bresnen and colleagues, there are two approaches to
learning in projects: cognitive and community. The first implies codifying and circulating

74
knowledge via information-based tools and ICT, while the second focuses on the tacit
dimension of knowledge and its embeddedness within the social group. The study
introduced the role of a middle-level manager (called regional engineering manager or
REM) to spread engineering-based knowledge among different professionals. Another
contribution of this study is identifying enablers and barriers of cross-project learning,
including organizational structure; cultural context and climate for change; skills and
capabilities; communications, networks, and information flows; technological
mechanisms; and objectives and outputs. In addition, the study indicated two aspects of
learning: product innovation and process innovation. Product innovation includes different
sources of knowledge that can be integrated into a single product. Learning in this case can
be captured and transferred to explicit form easily. In process innovation, what is learned is
often in tacit or intangible form, which makes it difficult to measure, evaluate, and capture
in an explicit form. Construction projects involve these two aspects, but more of the
process innovation; this can explain the need for more social patterns and practices in
construction projects (Bresnen et al., 2003).
P. Chan et al. (2005) highlighted the question of whether organizational learning is
sustainable in the project context and whether projects are “learnt” organizations rather
than “learning” organizations. The scholars argued the need to consider the nature of the
construction industry, which is project-based, when developing the organizational learning
model. The scholars identified facets of organizational learning, namely, contextual,
policy, psychological, cultural, and structural facets. They highlighted the following
enquiries extracted from gaps in literature: Who takes the lead in laying down the policy
for learning, partnering a sine qua non for organizational learning or vice versa, operational
change rather than strategic change, projects as “learnt organization” or “learning

75
networks”? Lastly, the scholars called for greater emphasis on projects as the unit of
organizational analysis, and consequently, a requirement for greater research focus on the
inter-organizational dynamics involved.
Using multiple case studies of construction power plant projects, Hällgren and Wilson
(2007) investigated how informal and incidental learning occurs in case of a deviation in
the project. The scholars stated that when a deviation is discovered, the project team will
face what the authors called “mini-muddling,” where they have to make an initial decision
or choice until progress is made. When the deviation is sensitive, people will make choices
based on previous knowledge or experience, rather than create new solutions. In this
regard, the scholars affirmed two aspects of learning: learning occurs when handling the
deviations and learning patterns emerge when handling remedies. When proposing new
solutions, new knowledge can be developed. However, the team on site may not be able to
handle certain deviations and, in this case, the team at the corporate level may interfere to
propose appropriate remedies (Hällgren & Wilson, 2007).
2.10.4 Organizational learning and project learning
The current section does not intend to review the entire body of organizational learning
(OL) literature; rather, to highlight the main studies that have contributed to this field,
which cited by several studies on project learning.
According to Easterby-Smith and Lyles (2005), the idea of organizational learning was
indicated first by March and Simon (1958) and articulated by Cyert and March (1963) as
part of a decision-making model. Ideas in Cyert and March’s theory include the firm’s
adaption to its environment, firm’s ability to learn from its experience, and an early

76
distinction between single- and double- loop learning (Easterby-Smith & Lyles, 2005).
Cangelosi and Dill (1965) were perhaps the first to mention the term “organizational
learning” in the title of their article, and observed that this notion is suitable for established
organizations in stable environments. The work of Argyris and Schön (1978) considered
one of the main works that contribute to articulation of the field of organizational learning.
Argyris (1977) defined organizational learning as a process of detecting and correcting
errors. Behaviors of detecting and correcting errors can be attained on two levels: single-
loop and double- loop learning (Argyris & Schön, 1978). Single- loop learning involves
detecting and correcting errors while permitting the organization to retain its current
policies and objectives. Double- loop learning, on the other hand, occurs when detecting
and correcting errors in a way that involves changing the basic policies and objectives of
the organization.
Easterby-Smith and Lyles (2005) distinguished the field of organizational learning into two
traditions: the first considers the efficiency of knowledge utilization, where humans are
regarded as obstacles (called the neo-rationalist tradition). This tradition appears in the
fundamental works of March (1991); Huber (1991); Epple et al. (1991); and Simon (1991).
The second tradition examines organizational learning from the social perspective. This
appears in the works of Brown and Duguid (1991); Lave and Wenger (1991); Cook and
Yanow (1993); Nicolini and Meznar (1995); and von Krogh (2005).
Learning organization (LO) emerged later during late 1980s from organizational learning
(Easterby-Smith & Lyles, 2005). Some early works in this new field include those of
Garratt (1987); De Geus (1988); and Pedler et al. (1989). The major contribution to this
field was the work of Senge (1990), who provided practical steps for organizations to

77
achieve learning. Organizational learning has contributed to the learning organization
concept. For example, Örtenblad (2004) and Love, Li, Irani, and Faniran (2000) proposed
models of the learning organization based on organizational learning.
However, there are crucial differences between organizational learning and the learning
organization. Organizational learning is regarded as a descriptive term to explain and
quantify learning activities, while the learning organization is an organization designed to
enable learning (Love, Li, Irani, & Faniran, 2000). Sun (2006), among others, investigated
this issue and summarized several differences between the two streams, as follows:
1) Descriptive vs. perspective (i.e., OL is descriptive and concerned about how
learning occurs, while LO is perspective and implies how an organization should
learn);
2) Naturally occurring vs. not naturally occurring (e.g., single- loop can happen
naturally in OL, while LO requires a more complex process, including double- loop
learning);
3) Obtainable vs. ideal (i.e., obtainable implies that all organizations should learn to
survive, while ideal implies that organization shall follow certain archetypes);
4) Domain of academics vs. domain of practitioners (theory vs. practice); and
5) A distinction according to learning entities and knowledge location. In OL,
knowledge exists outside individuals and organizational memory is the primary
focus. Entities of learning are the individual and organization as a super-person. In
LO, the case is opposite, where focus on organizational memory is less and that on
individual learning on behalf of the organization is more emphasized.

78
Other fields that may have a relationship with project learning are organizational
knowledge and knowledge management. According to Easterby-Smith and Lyles (2005),
organizational knowledge has been around for a long time and some fundamental works
include those of Polanyi on knowledge. Other works include for example Nelson and
Winter (1982); Alvesson (1993); Starbuck (1992); Starbuck (1993); Blackler (1995);
Nonaka and Takeuchi (1995); and von Krogh (2005). On the other hand, knowledge
management emerged recently in the late 1990s. According to Easterby-Smith and Lyles
(2005), some few fundamental works in this area include those of Nonaka and Takeuchi
(1995) and Davenport and Prusak (2000).
Project learning is related to the four areas: organizational learning, learning organization,
organizational knowledge, and knowledge management. This is evident from several
fundamental studies on project learning that cited works from these four areas, as shown in
Figure 2.3. This indicates that project learning is quite new compared with the previous
four areas.

79
Figure 2.3: Connection of some fundamental works on project learning to other fields
Kotnour & Hjelm (2002)
Cyert & March (1963)
Argyris & Schön (1978)
Nelson & Winter (1982)
Levitt & March (1988)
Senge (1990)
March (1991)
Huber (1991)
Simon (1991)
Brown & Duguid (1991)
Garvin (1993)
Levinthal & March (1993)
March (1993)
Nonaka (1991 – 1994)
Nonaka & Takeuchi (1995)
Simon (1996)
Morgan (1997)
Dibella & Nevis (1998)
von Krogh (1998)
Davenport & Prusak (1998)
Crossan et al. (1999)
Hansen et al. (1999)
Kotnour (1999)
Prencipe & Tell (2001)
Ibert (2004)
Williams (2003)
Williams (2008)
Gieskes & Broeke (2000)
Bresnen et al. (2003)
Newell (2004)
Landaeta (2008)
Kotnour & Proctor (1996)
Nobeoka (1995)
Sense (2006-2008)
Fong (2003)
Organizational Learning
Organizational Knowledge
Learning Organization
Knowledge Management
Project Learning
Legend:
(5)
(2)
(1)
(5)
(7)
(1)
(2)
(6)
(1)
(1)
(1)
(1)
(3)
(8)
(2)
(2)
(2)
(1)
(4)
(2)
(n) – Number o f citations

80
2.11 Features of Project Learning
The previous section provided a chronological review of some works on project learning in
different fields, including construction. In general, project learning implies three aspects:
action to learn (i.e., mainly involves the team as entity), dimension of this learning (i.e.,
within and across project), and outcome of learning process (i.e., knowledge being created
and shared). Unlike an organization, projects cannot learn.
Based on the previous review of fundamental works in project learning and several works
in other related fields such as organizational learning, the current study identifies features
of project learning. These are summarized as follows. Some of these features will be
investigated further in the current study.
Project learning is essentially a task of the project team to detect errors and identify
solutions for problems.
Project learning involves two dimensions: learning within project (intra-project
learning) and learning across projects (inter-project learning). The two dimensions
are associated but have different criteria. In addition, both focus on knowledge as
an outcome of learning process.
Project learning may involve intentional and unintentional (natural) aspects of
learning, thus, it can involve the four modes of experiential learning including
intuitive, incidental, retrospective, and prospective.
Project learning, especially when the intention is to transfer knowledge to
organizations or other projects, is a task of project management, but other entities
have significant roles to play.

81
Projects per se cannot learn (at least from the perspective of the current literature)
because they are discontinuous, have insufficient recourses, and do not have a
memory. However, project repositories and documentation could be the temporary
memory of projects.
Project’s milieu and the non-routine nature enable learning via practice or action of
knowledge (situated approach), participation of different identities and skills
(integration), challenging task and collective learning efforts (commitment), and
reflective and decoupling from routine activities.
Project’s characteristics (such as fragmentation, the sequential and temporary
nature, diversity, difficulty to establish routine tasks, and so on) may influence
learning activities.
2.12 Summary
This chapter reviewed studies on a distinct criterion of the construction industry and
project, namely, fragmentation. Studies on fragmentation are concentrated around two
levels: the industry and project levels. Both are related to team fragmentation, which was
defined accordingly. In addition, this chapter elaborated the reasons, influence, and
solutions of fragmentation.
This chapter also reviewed some significant works on project learning. The review
commenced with an overview of general studies on learning in construction. The purpose
was to point out the gap arising from limited empirical investigations on learning at the
project level. Subsequently, the chapter argued the difference between project learning and

82
other concepts such as organizational learning (i.e., learning within a permanent
organization) and project-based learning. Learning in project differs from learning in the
organization in some aspects, including lack of memory, decoupling of routine,
challenging task, and influence of project characteristics on the learning process. Project
learning is akin to organizational learning, while project-based learning is akin to learning
organization. Unlike project-based learning, however, project learning involves
unintentional aspects of learning. Other features of project learning were identified to
clarify what project learning is.

83
CHAPTER 3: THEORETICAL MODEL AND RESEARCH DESIGN
3.0 Introduction
This chapter attempts to conceptualize the notions of fragmentation, and intra- and inter-
project learning. Conceptualization includes identifying the indicators that determine these
notions. In addition, this chapter reviews studies that highlight the association between
fragmentation and learning. The purpose is to understand how fragmentation influences
project learning.
The current study presumes that fragmentation has a negative influence on both intra- and
inter-project learning. Thus, the assumption is that enabling project learning within
fragmentation is vital. A theoretical model will be coined and hypotheses will be
developed to determine the relationships among fragmentation, intra-project learning,
inter-project learning, and enablers of learning.
3.1 Framework of Fragmentation
The purpose of this section is to identify the factors that determine (measure) the level of
fragmentation. As the current study is concerned about identifying latent variables that
influence the level of fragmentation, factors such as project delivery process or
procurement method will not be considered. As proposed in the previous chapter,

84
fragmentation is a multi- faceted construct consisting of the following latent variables: level
of integration, coordination, collaboration, boundaries, decoupling of diversity, and
spanning knowledge across boundaries.
Integration of the construction project team is defined as the point “where different
disciplines or organizations with different goals, needs and cultures merge into a single
cohesive and mutually supporting unit with collaborative alignment of processes and
cultures” (Baiden & Price, 2010, p. 129). Characteristics of integrated construction project
team include single focus and objectives, diminished boundaries between individuals, and
teamwork based on beneficial outcomes (Baiden & Price, 2010). Indicators of level of
integration are identified in the study of (Baiden et al., 2006). Tools to support team
integration include toolkit for integration, project delivery process, computer-integrated
construction (CIC), construction collaboration technology (CCT), computer-integrated
framework for concurrent life-cycle design and construction (CLDC), and so on (Anumba
et al., 1997; Koskela, 1992; Nitithamyong & Skibniewski, 2004; Vock', 2001).
On the other hand, low levels of coordination and collaboration imply a high level of
fragmentation, as discussed previously in Chapter 2. Ali et al. (2009) identified the factors
that determine coordination during refurbishment of the design process, including lateral
relationship, IT, interpersonal relationships, and the architect’s role. The role of architect
can be replaced by that of the coordinator to suit the current study’s setting, which is the
construction site. On the other hand, collaboration of the project team can be determined
by the following factors: common goal among firms, trust, self-governing teams, focus on
end-user needs, and free exchange of information (Baiden et al., 2006).
85
Fragmentation can be affected by boundaries within the project. Ratcheva (2009) identified
boundaries that hinder knowledge integration of multi-disciplinary teams. These are action
boundary, knowledge boundary, and social boundary. Fong (2003) identified boundaries
that influence teams’ ability to exchange and integrate knowledge, which include expertise
and hierarchical boundaries. Boundaries between team members of different disciplines are
regarded as expertise boundaries. Other boundaries exist among the client, consultant, and
contractor as hierarchical boundaries. These and other boundaries, such as cultural or
language boundaries, may contribute to fragmentation.
Construction project encompasses multi-disciplinary or multi-professional teams.
Disciplines of the project team differ in terms of number of specialized individuals,
territories, and epistemology (i.e., world of thoughts and functional departments)
(Ratcheva, 2009). Diversity of project team members in terms of varying professions and
specializations is not a problem per se (Bresnen & Marshall, 2001). However, diversity of
knowledge may influence effective sharing process (Ratcheva, 2009). In addition, the
inability of the team members to collaborate with each other may influence learning and
knowledge creation. This can be referred as decoupling of team members’ specializations
or diversity. Decoupling of diversity can be determined by the following: participation of
different disciplines in projects, adversarial relationship among team members,
misconception and misunderstanding, design clashes, and omissions and errors, typically
due to data fragmentation (Anumba et al., 2002).
Ratcheva (2009) proposed knowledge integration processes of a multi-disciplinary team
across different boundaries. This process, termed boundary spanning, integrates knowledge
across three boundaries: 1) project social boundary (i.e., boundary within the team); 2)
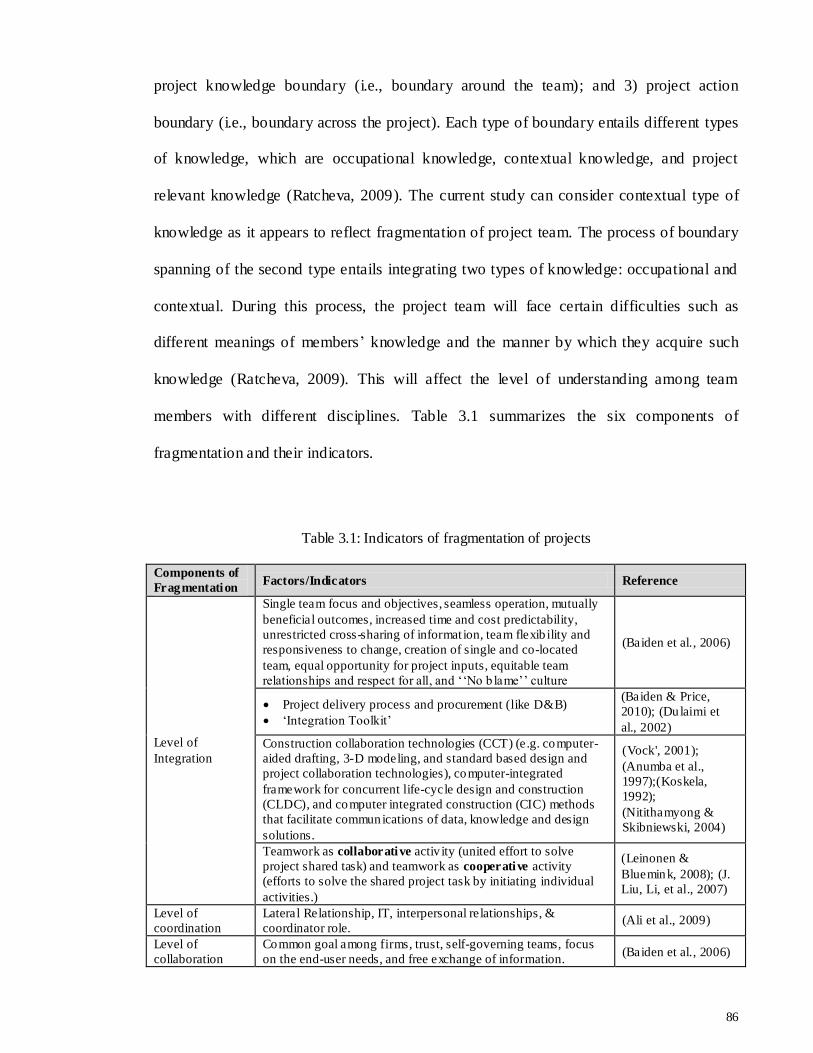
86
project knowledge boundary (i.e., boundary around the team); and 3) project action
boundary (i.e., boundary across the project). Each type of boundary entails different types
of knowledge, which are occupational knowledge, contextual knowledge, and project
relevant knowledge (Ratcheva, 2009). The current study can consider contextual type of
knowledge as it appears to reflect fragmentation of project team. The process of boundary
spanning of the second type entails integrating two types of knowledge: occupational and
contextual. During this process, the project team will face certain difficulties such as
different meanings of members’ knowledge and the manner by which they acquire such
knowledge (Ratcheva, 2009). This will affect the level of understanding among team
members with different disciplines. Table 3.1 summarizes the six components of
fragmentation and their indicators.
Table 3.1: Indicators of fragmentation of projects
Components of
Fragmentation Factors/Indicators Reference
Level of
Integration
Single team focus and objectives, seamless operation, mutually
beneficial outcomes, increased time and cost predictability,
unrestricted cross-sharing of informat ion, team flexib ility and
responsiveness to change, creation of single and co-located
team, equal opportunity for project inputs, equitable team
relationships and respect for all, and ‘‘No b lame’’ culture
(Baiden et al., 2006)
Project delivery process and procurement (like D&B)
‘Integration Toolkit’
(Baiden & Price,
2010); (Dulaimi et
al., 2002)
Construction collaboration technologies (CCT) (e.g. computer-
aided drafting, 3-D modeling, and standard based design and
project collaboration technologies), computer-integrated
framework for concurrent life-cycle design and construction
(CLDC), and computer integrated construction (CIC) methods
that facilitate communications of data, knowledge and design
solutions.
(Vock', 2001);
(Anumba et al.,
1997);(Koskela,
1992);
(Nitithamyong &
Skibniewski, 2004)
Teamwork as collaborative activ ity (united effort to solve
project shared task) and teamwork as cooperative activity
(efforts to solve the shared project task by initiating individual
activities.)
(Leinonen &
Bluemink, 2008); (J.
Liu, Li, et al., 2007)
Level of
coordination
Lateral Relationship, IT, interpersonal relationships, &
coordinator role. (Ali et al., 2009)
Level of
collaboration
Common goal among firms, trust, self-governing teams, focus
on the end-user needs, and free exchange of information. (Baiden et al., 2006)

87
Components of
Fragmentation Factors/Indicators Reference
Boundaries
Expertise boundaries, hierarchical boundaries, and cultural-
related boundaries between professions (Fong, 2003)
Project action boundary, project knowledge boundary and
project social boundary (Ratcheva, 2009)
Decoupling of
Diversity
Participating of different professionals in projects, adversarial
relationship, misconception and misunderstanding, and design
clashes, omissions and errors (due to data fragmentation).
(Anumba et al.,
2002)
Level of
boundary-
spanning of
knowledge
Level of integrating two types of knowledge: occupational
and contextual knowledge during the construction stage
(sufficiency of information from previous stage).
Understanding informat ion from other occupational or
disciplinary team members
(Ratcheva, 2009)
3.2 Framework of Project Learning
A framework of project learning may help to articulate learning in construction projects
and develop a conceptual model of this notion. Indicators or aspects of project learning
process can be identified from literature. According to the definition of project learning
postulated by (Kotnour, 2000), project learning consists of four components: project team
action to learn, knowledge creation, knowledge sharing, and dimension of learning either
within or across projects. The following sections discuss each of the four components in
detail.
3.2.1 Project team and action to learn
The current study focuses on the team action to learn as a basic component of project
learning. Typically, there are six types of construction project team: self-directed team,
traditional work-based team, problem-solving team, virtual-based team, management-
based team, and research-based team (Kululanga, 2009). Project team learning is the
process that integrates individual and organizational learning (Horvath et al., 1996).
Table 3.1: Indicators of fragmentation of projects (Cont’d)

88
Knowledge integration can be attained by the team only (Ratcheva, 2009) and teams’
features contribute to positive influence with respect to learning (Anheim, 2003). It is
important to highlight that composition or type of team and their influence on learning is
out of the scope of the current study. Bourgeon (2007) examined the influence of project
team composition, called staffing approach, on collective learning conditions. He
emphasized on certain points in collective learning, including diversity, homogeneity,
project duration, and management and leader’s role. In addition, he identified dimensions
of collective learning, including the following: empathy of team with its project; team
commitment in the error correction process; participative management mode
implementation; knowledge sharing; and problem resolution agendas.
Moreover, Ayas (1997) proposed an alternative structural arrangement for the project team
to facilitate learning, particularly the project network structure (PNS). This structure
contains a core team that can be formed at the beginning of a project and contains a desired
mixture of skills and specialties. Each member of this core team becomes responsible for
another team at another level of hierarchy to perform a certain task. Coordination within
this network is simple and error identification is easier. The holistic approach of learning in
this network is via information and knowledge crossing of the organizational and
functional boundaries. Lastly, formal and informal communication between the team is
cultivated faster (Ayas, 1997).
Anheim (2003) identified the factors that influence project team learning, namely, arena
for learning, tacit to tacit, combination, high tolerance, scope for decision, team
composition, and dialogue. He emphasized on a climate that supports mistake admission to
89
foster project team learning. Lastly, Anheim identified the following conditions to enable
team learning within and across construction projects:
A dynamic team (mixed people with different skills) is required in the interaction
process between tacit and explicit knowledge.
Dialogue is a significant element of team learning (adopted from the fourth
discipline in Senge’s theory).
Workplace is an important arena for exchanging experience, especially if supported
by a good working environment. However, the team can give rise to negative
consequences as such as conflict of interest and territorial thinking.
A good environment for project team requires six factors: shared goals, shared
values, ability to accept new members, not permitting subgroups with their own
delineations, freedom, and ability to resolve conflicts.
Individual members need to feel affinity, security, and respect for their fellow
members.
According to Kotnour and Hjelm (2002), project team action is associated with the right
culture and right leader’s actions and support. Aspects of project team learning include the
following: ability to absorb new technology and techniques; self-directed learning (i.e.,
creating an environment to maximize opportunities for individual inquiry and learning);
problem-solving; and learning from failure (Fong, 2003, 2005). Abdul-Rahman et al.
(2008) identified the following aspects of learning from construction projects: formal face-
to-face interaction, periodic meetings, documentation learning, and problem-solving
methods. On the other hand, tools and methods of learning can support project team

90
activities for learning. For example, Williams (2008) highlighted some learning
approaches that the project team can use, including formal procedures, meetings, project
audits, lessons at all stages, learning diaries, narratives, interview, specific departments,
external facilitator, and external team. Moreover, a number of tools can improve team
communication and consequently facilitate learning, namely, dialogue, learning histories,
leadership styles and management techniques, and role of organizational goals and
strategies (Law & Chuah, 2004). Table 3.2 summarizes the indicators of project team
action to learn discussed previously.
Table 3.2: Indicators of project team action to learn and learning methods
Factors / indicators of project team action to learn Reference
Project team act ion associates the right culture and the right leader’s actions and
support. Learning-by-doing is useful here and the plan-do-study-act cycle is used to
represent the learning process in a project environment.
(Kotnour & Hjelm,
2002)
Absorb new technology and techniques, Self-direct learning (creating an
environment to maximize the opportunities for indiv idual inquiry and learning),
Problem solving, and Learning from failure
(Fong, 2003)
Formal face-to-face interaction, Periodic meetings, Documentation, and Problem
solving methods
(Abdul-Rahman et
al., 2008)
Formal procedures, Meetings, Project audits , Lessons at all stages, Learning diaries,
Narrat ives, Interview, Specific departments, External facilitator, and External team (Williams, 2008)
Tools improve team communication and consequently facilitate learn ing: Dialogue;
Learn ing histories; Leadership styles and management techniques; and Role of
organizational goals and strategies.
(Law & Chuah,
2004); (Anheim,
2003)
3.2.2 Knowledge creation
Knowledge creation significantly benefits a project team’s long-term effectiveness,
innovation, and productivity (Senge, 1990). Project team action to create knowledge is
considered one of the most prominent aspects of learning (Kotnour, 1999). Roth et al.
(2000) affirmed that no learning can occur without knowledge creation and vice versa.

91
Fong (2005) identified collective learning of project team as the core process of knowledge
creation. In this regard, Stahl (2002) indicated that learning can be viewed as a knowledge
creation process instead of knowledge-transmission process, which occurs during
conversations with others.
Nonaka and Takeuchi (1995) proposed a model of knowledge creation, which is
considered one of the fundamental works in the field of organizational knowledge.
Basically, knowledge creation involves a complex process of conversion between tacit and
explicit knowledge within a context (Nonaka & Takeuchi, 1995). This model consists of
four modes: socialization, externalization, combination, and internalization (SECI).
Socialization implies sharing tacit knowledge through face-to-face communication,
informal social interaction, or teaching by practical examples. Externalization means
attempting to convert tacit knowledge to explicit knowledge by developing concepts and
models. In this process, tacit knowledge is converted to an understandable and
interpretable form, so others can utilize this knowledge as well. Externalized and
theoretical knowledge, as the scholars affirmed, is a base for creating new knowledge.
Combination, meanwhile, indicates compiling and organizing of externalized explicit
knowledge to broader entities and concept systems. Lastly, internalization means
understanding explicit knowledge. It occurs when explicit knowledge is transformed into
tacit knowledge and becomes part of the individual’s basic information. When individuals
share their tacit knowledge again, the cycle continues in the spiral of knowledge back to
socialization (Nonaka & Takeuchi, 1995). The SECI model was further developed by
Nonaka (1999) and Nonaka et al. (2000), who added the effect of moderator and
emphasized more on the context or “ba.”

92
Fong (2003) modified the previous model of Nonaka and Takeuchi (1995) by identifying
five elements of knowledge creation within the construction project team. The first element
encompasses crossing boundaries within the team members and the project. Objects used
for this process include for example drawings, personal conversations, team members
valuing others’ experience, and examples set by project managers. The second element is
knowledge sharing, which can be influenced by openness, motivation, trust, and time
pressure. The third element is knowledge generation, which involves social networks, print
sources, and interaction between customers and competitors. The fourth element is
knowledge integration, which implies that multiple stakeholders’ perspective, project
documentation, and design object are integrative tools. The last element is collective
project learning, which involves individual, team, and inter-project learning. In addition,
the knowledge creation process may be influenced by the following factors: IT support,
incentives, individual competency, and collaborative vision of leadership (Teerajetgul &
Charoenngam, 2006). Other factors include shared values and a unified vision for
knowledge creation in projects (Ajmal & Koskinen, 2008).
Egbu (2006) identified three streams of knowledge creation or “production” from
literature. First is the mainstream systems thinking, which represents a complex process of
transforming knowledge from one form to another within a context (Nonaka & Takeuchi,
1995; Stacey, 2001). The second stream is the social constructionist, which focuses on
learning (also in a context) to produce knowledge. According to Egbu, this stream
emphasizes the relationship among action, understanding, and communication. The last
stream is complex responsive process (Stacey, 2001), where knowledge is produced in the
communicative interaction between people. Knowledge production in construction

93
involves several approaches, including reflective practice, transformation, and combination
of existing knowledge (Egbu, 2006). Table 3.3 summarizes the factors that indicate the
knowledge creation process.
Table 3.3: Indicators of knowledge creation
Factors / indicators of Knowledge Creation Reference
Socialization, Externalization, Co mb ination, Internalization, and ‘Ba’
(Nonaka & Takeuchi,
1995);
(Nonaka et al., 2000)
Reflective pract ice, transformation, and combination of existing knowledge
Triggers to knowledge creation are: need to solve problems, need to innovate
and the management of change
(Egbu, 2006)
Factors affecting the modes of Nonaka and Tackeuchi in construction include:
Individuals competency, IT, Incentives (rewards), Collaboration, and Vision of
leadership.
(Teerajetgul &
Charoenngam, 2006)
Collaboration among multid isciplinary project team (Fong, 2005)
Boundary crossing (Expertise boundaries and Hierarchical boundaries)
Knowledge sharing: competition; communication thickness; and sharing from
different knowledge domain. Contributing factors include: (openness,
motivation, t rust, and time pressure).
Knowledge generation: social networks, print sources; and customers and
competitors. Contributing factors include: (time, and motivation)
Knowledge integration: mu ltiple stakeholder’s perspectives; and project
documentation and design object as integrative tool).
Collective project learning: (individual, team and intra-project learn ing)
(Fong, 2003); (Fong,
2005)
Seven enablers of learn ing acceleration that enable also knowledge creation:
scanning imperative; experimental mind-set; climate of openness ;
continuous education; multiple advocates ; involved leadership; and systems
pers pective .
Enablers of knowledge creation within pro ject during the execution phase:
Physical closeness (Informal Dialogues between colleagues (‘coffee break
discussions’); clear goals and purposes (Contacts with External consultants);
mentor relationships (Discussion take place when time and context allows).
(Roth et al., 2000)
3.2.3 Knowledge sharing
Factors affecting knowledge sharing are sufficiently documented in literature. For
example, Issa and Haddad (2008) highlighted three main factors of knowledge sharing:
organizational culture, IT (i.e., computer-supported collaborative work), and mutual trust.
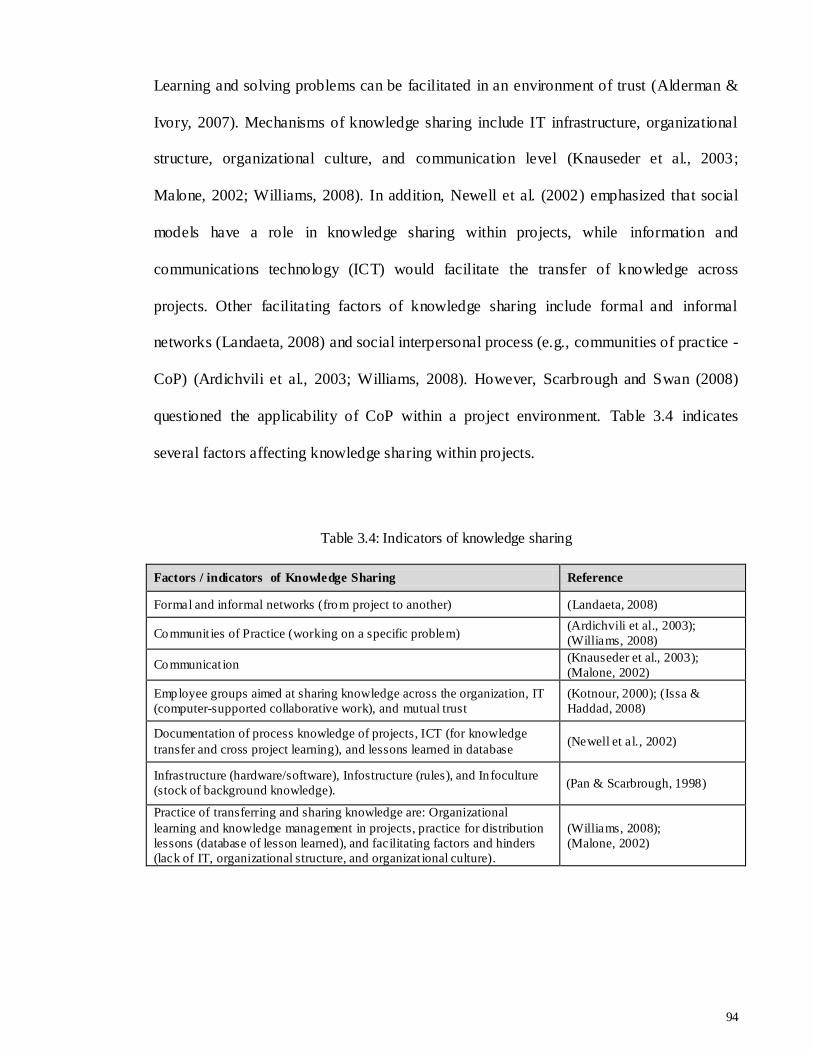
94
Learning and solving problems can be facilitated in an environment of trust (Alderman &
Ivory, 2007). Mechanisms of knowledge sharing include IT infrastructure, organizational
structure, organizational culture, and communication level (Knauseder et al., 2003;
Malone, 2002; Williams, 2008). In addition, Newell et al. (2002) emphasized that social
models have a role in knowledge sharing within projects, while information and
communications technology (ICT) would facilitate the transfer of knowledge across
projects. Other facilitating factors of knowledge sharing include formal and informal
networks (Landaeta, 2008) and social interpersonal process (e.g., communities of practice -
CoP) (Ardichvili et al., 2003; Williams, 2008). However, Scarbrough and Swan (2008)
questioned the applicability of CoP within a project environment. Table 3.4 indicates
several factors affecting knowledge sharing within projects.
Table 3.4: Indicators of knowledge sharing
Factors / indicators of Knowledge Sharing Reference
Formal and informal networks (from project to another) (Landaeta, 2008)
Communit ies of Practice (working on a specific problem) (Ardichvili et al., 2003);
(Williams, 2008)
Communicat ion (Knauseder et al., 2003);
(Malone, 2002)
Employee groups aimed at sharing knowledge across the organization, IT
(computer-supported collaborative work), and mutual trust
(Kotnour, 2000); (Issa &
Haddad, 2008)
Documentation of process knowledge of projects, ICT (for knowledge
transfer and cross project learning), and lessons learned in database (Newell et al., 2002)
Infrastructure (hardware/software), Infostructure (rules), and In foculture
(stock of background knowledge). (Pan & Scarbrough, 1998)
Practice of transferring and sharing knowledge are: Organizational
learning and knowledge management in projects, practice for distribution
lessons (database of lesson learned), and facilitating factors and hinders
(lack of IT, organizational structure, and organizat ional culture).
(Williams, 2008);
(Malone, 2002)

95
3.2.4 Inter-project learning and knowledge transfer
There are two modes of inter-project learning; the first is transfer of knowledge to other
projects directly via individuals and the second is transfer of knowledge to the organization
and subsequently to other projects (Disterer, 2002). Prencipe and Tell (2001) adopted the
processes of inter-project learning, which are experience accumulation, knowledge
articulation, and knowledge codification. Each of these processes is presented according to
three levels of entities: individual, group/project, and organization. The current study is
concerned about the group/project level. Experience accumulation at the group level, for
example, includes the following mechanisms: group thinking, person-to-person
communication, informal encounters, and imitation (Prencipe & Tell, 2001).
Knowledge transfer requires developing a certain level of shared meaning that allows one
group to understand and apply another’s insights and knowledge within their own context
(Bresnen et al., 2002). In addition, Knauseder et al. (2003) emphasized on having a
common understanding and interpretation of concepts that would help in reducing
uncertainty and miscommunication. There are several tools and methods that enable
knowledge transfer. These include, but are not limited to, project audit, project reviews,
communications, experience diffusion, and knowledge anchoring in the organization
(Ayas, 1997; Drejer & Vinding, 2006; Wheelwright & Clark, 1992).
However, knowledge transfer is associated with certain barriers. For example, Sun and
Scott (2005) investigated this issue at the individual, group, organizational, and inter-
organizational levels. Barriers to the transfer of knowledge from team level to
organizational level include the following: organizational system and structure; team
climate; organizational climate; and individual imperative (Sun & Scott, 2005). Obstacles

96
to the transfer of knowledge from team to organizational level are considered one of the
hindrances to inter-project learning (Disterer, 2002; Hall, 2004 ). Other obstacles to
knowledge transfer include the following: difficulties in attaining a clear analysis of
failures and reasons for mistakes; barriers related to open and productive atmosphere; lack
of motivation to undertake appropriate review of projects; and lack of supportive
leadership (Ajmal & Koskinen, 2008).
Table 3.5: Indicators of knowledge transfer and inter-project learning
Factors / indicators of Knowledge Transfer and Inter-project Learning Reference
Inter-project learning modes: Project team to transfer knowledge directly to
other projects and project team to transfer knowledge to organization and
then to other projects
(Disterer, 2002)
Experience Accumulation: group thinking, person-to-person
communicat ion, informal encounters, and imitation Knowledge Articulation: brainstorming, formal reviews, de-briefing
meet ings, ad hoc meetings, lessons learned meetings, intra-pro ject
correspondents
Knowledge Codification: project plan/audit, milestones, meeting
minutes, case writing, p roject history, intra-project lessons learnt
database
(Prencipe & Tell, 2001)
Shared meaning of pro ject team (Bresnen et al., 2002)
Project audit / post-project review, experience diffusion and knowledge
anchoring, and communication
(Wheelwright & Clark, 1992);
(Ayas, 1997); (Drejer &
Vinding, 2004); (Knauseder et
al., 2003)
3.3 Fragmentation and Project Learning
Studies that investigate the relationship between fragmentation and project learning are
limited. The current section highlights the studies that indicated both. Oragne et al. (2005)
addressed the problem of fragmentation through the processes of knowledge management

97
and organizational learning. They emphasized on a cross-organizational learning approach
to promote organizational learning among construction partners.
Egbu (2006) stated that the characteristics of construction and fragmentation inhibit
knowledge production, which is the reason for low levels of productivity. To enable
knowledge production, Egbu recommended moving toward change and collaboration. At
the project level, Egbu recommended effective team composition, high level of expertise,
and trust among project team members.
Fong (2003) identified two types of boundaries, namely, expertise boundaries and
hierarchical boundaries, which can be considered as another aspect of fragmentation.
Crossing these boundaries is important to attain learning and to create knowledge.
Knauseder et al. (2007) also viewed fragmentation as boundaries between projects and
permanent organization. These boundaries may affect trust, contact among organizations,
and the flow of experience. Solutions to overcome these boundaries include cross-
organizational and cross-functional project team, an environment that encourages and
supports high performance collaboration, systematic documentation of experiences, and
“live” capture and reuse of knowledge (Knauseder et al., 2007). In addition, project team
approach and learning networks may overcome organizational boundaries (Ayas, 1997; Fu
et al., 2006). Individual learning networks are divided into two types: social networks and
coordination networks (Fu et al., 2006).
J. Liu, Li, et al. (2007) emphasized on collaboration and a favorable learning environment
for contractors to improve performance and overcome fragmentation. Forgues et al. (2009)
pointed organizational learning approach to overcome boundaries among specialists, which

98
causes fragmentation of knowledge. They emphasized several approaches to tackle
fragmentation, including collaboration, integrated practices, integrated team, and integrated
design process.
Delivery process of project (e.g., procurement method) may influence both fragmentation
and learning. For example, people learn more in total construction contract (Carlsson and
Josephson, 2001 cited Knauseder et al., 2003). In this regard, partnership increases
learning, possibly due to improved communication over organizational boundaries (Barlow
& Jashapara, 1998; Knauseder et al., 2003). However, fragmentation escorts certain
boundaries, which may hinder communication among team members. These include
difficulty in understanding each other, lack of shared language (e.g., vocabulary), and lack
of knowledge brokers (Knauseder et al., 2003; Newell et al., 2002).
To summarize, fragmentation can influence knowledge creation, collective learning, trust,
contact, and flow of experience. Boundaries to communication can have different facets
such as insufficient understanding among individuals, lack of shared language, and lack of
knowledge brokers. Solutions to fragmentation with regard to learning include the
following: collaboration among project team, partnering, learning networks, appropriate
project delivery methods, cross-organizational and cross-functional project teams, and
systematic documentation of experiences.

99
3.4 Enablers of Project Learning within Fragmentation
As indicated previously, fragmentation may have a negative influence on project learning.
Therefore, one may ask about the factors that facilitate learning within fragmentation.
These factors can be referred to as “enablers” of learning as they work as stimuli to achieve
learning. Related literature provides very limited materials about these enablers. The
qualitative study in Chapter 4 will provide more insights into these enablers. However, a
number of factors from literature appear to suit this purpose. These include boundary
object, boundary-crossing, and several elements of Sense’s model of project learning.
3.4.1 Boundary objects and boundary-crossing
The concept of boundary object was developed by Star and Griesemer (1989) based on a
model coined to explain how a group of workers in a museum can manage discrepancy
between divergent of viewpoints. Boundary object is “an analytic concept of those
scientific objects which both inhabit several intersecting social worlds and satisfy the
informational requirements of each of them. Boundary objects are objects which are bo th
plastic enough to adapt to local needs and the constraints of the several parties employing
them, yet robust enough to maintain a common identity across sites” (Star & Griesemer,
1989, p. 393). A simpler definition was proposed by Star (1989, p. 47) as object that works
to establish a shared that sits in the middle. In addition, boundary object serves as an
interface between different communities of practice (Koskinen & Mäkinen, 2009).
Phelps and Reddy (2009) identified the characteristics of boundary objects that enhance
collaboration among construction team members: boundary objects shall be familiar and
trusted by the project team, must be important, and must have power or control so the

100
project team can create the need for information or make it available. Furthermore, Carlile
(2002, p. 451) identified the following characteristics of good boundary object in new
product development: 1) boundary object shall establish a shared syntax or language for
individuals to represent their knowledge; 2) shall provide a concrete means for individuals
to specify and learn about their differences and dependencies across a given boundary; and
3) shall facilitate a process where individuals can jointly transform their knowledge.
However, the characteristics of boundary objects are difficult to sustain “as problems and
people change” (Carlile, 2002, p. 452).
Phelps and Reddy (2009) highlighted the importance of boundary objects as they can guide
information search activities and guide the type and timing of collaborative activities by
establishing the process for capturing, modifying, or using information. The importance of
the concept of boundary objects in this study stems from its ability to overcome boundaries
between specialized knowledge that may result from fragmentation.
According to Koskinen and Mäkinen (2009), there are two types of boundary objects:
institutionalized (e.g., memos, drawings, manifestations of shared understanding, and so
on) and non-institutionalized (e.g., factors that foster openness, trust, togetherness, and so
on). Examples of boundary objects in a construction project include drawing,
specifications, and reports (Phelps & Reddy, 2009). Other examples include artifacts,
documents, and even vocabulary that can help people from different organizations to build
a shared understanding (Koskinen & Mäkinen, 2009). Lastly, Fong (2003) highlighted two
types of objects: drawings and personal conversations (to overcome expertise boundaries);
and team members consciously breaking down any barriers by valuing the expertise of
others and examples set by project managers (to overcome hierarchical boundaries).

101
Breakers or boundary crossing serves as the media that hold boundary objects and may
help in achieving collaborative teamwork. Forgues et al. (2009) identify IT as a boundary
crossing object for knowledge sharing and generation during the design process of
construction and aerospace industries. They employed IT to break up two barriers of power
structure and asymmetry of knowledge. Another example of boundary crossing is
construction contract identified by (Koskinen & Mäkinen, 2009).
3.4.2 Situated learning theory and Sense’s model
Situated learning theory was coined by Lave and Wenger (1991). The theory implies that
situation is what drives people’s learning, and not the goal. This theory emphasizes the role
of practice and feedback in learning process (Newell et al., 2002). Thus, the theory can
help to explain how learning occurs with the fragmentation context. There are two notable
schools of thought in the discipline of learning: cognitive school and behavioral school
(Huber, 1991). Situated learning theory can be categorized under the second type. In this
school, people learn from actual experiences, experiment, and practice to determine what
works best (Newell, 2005). On the other hand, practical and social aspects of learning can
be situated within an arena or a community (e.g., CoP) within an organization (Forgues et
al., 2009). An important criterion of this theory is the context, which embodies practical
and social aspects of learning (Sense, 2004, 2007a).
Sense (2004; 2007a; 2007b) utilized this theory, in addition to the cognitive learning
theory to create a model of project learning. The model can be used to create a supportive
situated environment, contains five elements: learning relationships, cognitive style, KM,
pyramid of authority, and learning environment support. Last element consists of two
domains: workplace of a project team and organizational workplace (Sense, 2007b).

102
Project environment can support learning activities via establishing strategic thrusts of
learning; establishing infrastructures for learning (e.g., time and space for conversation and
reflection); and nurturing an ongoing stimulus environment supportive of learning through
the project life cycle (Sense, 2007b). Table 3.6 summarizes the enablers of project learning
discussed in this section as well as other enablers.
Table 3.6: Indicators of enablers of project learning within fragmentation
Factors/indicators of Boundary objects / boundary crossing / Sense’s
Model References
Boundary Objects: Drawings, specifications, and reports (Phelps & Reddy, 2009)
Boundary Objects: Artefacts, documents and even vocabulary that can help
people from d ifferent organizat ions to build a shared understanding.
Memos, drawings, manifestations of shared understanding, etc.
(institutionalized)
Factors that foster openness, trust, and togetherness, etc. (non-
institutionalized)
(Koskinen & Mäkinen,
2009)
Boundary Objects: Drawings and personal conversations (expertise
boundaries).
Team members consciously breaking down any barriers by valuing the
expertise of others and secondly, examples set by project managers
(hierarchical boundaries).
(Fong, 2003)
Boundary Objects: Collaboration among project team, partnering, learning
networks, appropriate project delivery methods, cross -organizational and cross-
functional project teams, and systematic documentation of experiences.
(Ayas, 1996); (Liu et al.,
2007); (Carlsson &
Josephson, 2001); (Fu et
al., 2006)
Boundary-crossing objects: IT and construction contract
(Forgues et al., 2009);
(Koskinen & Mäkinen,
2009)
Favorable workplace of learning
Five elements of project learning (learning relat ionships; cognitive style; KM;
pyramid of authority; and learning mandate and learn ing environment
support)
(Sense, 2004, 2007a,
2007b, 2008)

103
3.5 Theoretical Model and Hypotheses Development
Based on the reviews in this chapter and the previous one, a theoretical model can be
proposed to highlight the relationship between fragmentation and both intra- and inter-
project learning via enablers. Direct relationship between fragmentation and both intra- and
inter-project learning is assumed to be negative. Meanwhile, the role of enablers will be to
stimulate learning within fragmentation (i.e., intervening effect). As discussed previously,
fragmentation can be affected by six factors: level of project team integration,
coordination, collaboration among team members, decoupling of diversity, boundaries
among professionals, and spanning-boundary of knowledge. Intra-project learning consists
of the following processes: knowledge creation, knowledge sharing, team action to learn,
and learning support. Inter-project learning consists of experience accumulation,
knowledge articulation, knowledge codification, knowledge transfer, and networking.
Lastly, enablers of project learning include boundary object, boundary crossing, and
Sense’s model. Other enablers will be identified in a qualitative study in the next chapter.
Figure 3.1 shows the initial model of project learning.

104
Figure 3.1: Theoretical model of project learning considering the influence of fragmentation
To articulate the relationship among fragmentation, project learning, and enablers, several
propositions can be highlighted. It is assumed that there is a negative influence of
fragmentation on intra- and inter-project learning processes. Enablers would have an
intervening influence of this relationship. In addition, it is assumed that there is an
association between each concept and its components. For example, there is a relationship
between fragmentation and the six components that indicate it. These relationships will be
tested in a quantitative study (Chapter 5) using PLS-PM approach. Research propositions
are articulated around the following hypotheses:
Fragmentation
Level of integration of
project team members
Level of coordination
among project team
Level of collaboration
among project team
Decoupling of
professionals diversity
Spanning-boundary of
knowledge integration
Professionals and
cultural boundaries
Intra-Project Learning
Knowledge creation
Knowledge sharing
Learning support
Team action to learn
Inter-Project Learning
Knowledge articulation
Knowledge codification
Knowledge transfer
Experience accumulation
Enablers of Project
Learning
Boundary Object &
Boundary Crossing
Sense’s M odel
(-) H1
(-) H2
(+) H4
(+) H5
H3
Qualitative study to
explore more factors

105
Hypothesis 1: There is a negative and significant relationship between fragmentation and
intra-project learning process.
Hypothesis 2: There is a negative and significant relationship between fragmentation and
inter-project learning process.
Hypothesis 3: There is a significant relationship between fragmentation and enablers.
Hypothesis 4: There is a positive and significant relationship between enablers and intra-
project learning.
Hypothesis 5: There is a positive and significant relationship between enablers and inter-
project learning.
3.6 Research Design
Research design is an important procedure to guide the research prior to data collection. In
addition, research design provides a logical sequence that connects research questions and
conclusion through data compilation, analysis, and interpretation (Yin, 2009). Research
design consists of five main components, namely, research questions, propositions or
purpose of study, unit of analysis, logical linking of the data to propositions or purpose,
and criteria for interpreting the findings (Yin, 2009).
Cavana et al. (2001) proposed a comprehensive model of research design, and the current
study adapted some items from this model. Figure 3.2 shows several items involved in the
research design that are suitable for the current study. Further explanation of the main
components is explained as follows.

106
Figure 3.2: Detailed research design and decisions followed in the current study
(adapted from Cavana et al., 2001)
1. Research questions: As indicated previously, the research questions of the current study
involve the questions “What?” and “How?” The first research question investigates the
association between fragmentation and project learning. This implies the use of hypothesis
testing for this purpose. The second question is related to exploring the enablers of project
learning. This implies qualitative investigation to explore the conditions for achieving
project learning within fragmentation.
Res
earc
h Q
ues
tion
s
Purpose of the
study
Exploration + Hypothesis
testing
Unit of
analysis
Individuals (Site team
members)
Types of
investigation
Clarification +
Correlational
Study setting
Contrived or
Non-contrived
Researcher
interface
Minimal
Time horizon
One-shot
Measurement
and measures
Operational
definition +
Measure +
Scaling
Sampling
design
Non-probability
(theoretical &
purposive) +
Sample size
Qual. data
collection
Interviews
Quant. data
collection
Questionnaire
survey
Fin
din
gs
Inte
rpre
tati
on
Qual. data
analysis
Manual (codes
and themes)
Quant. data
analysis
PCA, CFA, &
PLS-PM

107
2. Proposition: The main hypothesis of the current study is that fragmentation has a
negative influence on project learning; in particular, it reduces the efficiency of learning.
Thus, one may inquire about the condition to achieve an efficient project learning process.
These conditions or enablers are believed to work as stimuli for project learning.
3. Unit of analysis: This indicates the levels of information source, including individuals,
groups, and organizations (Cavana et al., 2001). According to Creswell (2008), data can be
gathered from one or multiple levels, depending on the research questions/hypotheses or
research variables. Project managers and professionals working in the construction project
site (production phase) are the main source of information. Project team members are
regarded as entities that create and transfer knowledge and experience from the project
level to the organization level and to other projects.
4. Sampling design: This requires a decision on the following: target population,
parameters of interest, sampling frame, appropriate sampling method, and required size of
the sample (Cooper & Schindler, 2006). Sampling design will defer according to the
research approach. For example, the current study will use a theoretical purposive sample
for the qualitative approach and non-probability purposive sampling for the quantitative
approach. Creswell (2008) indicated that purposeful qualitative sampling is used to
develop a detailed understanding of the phenomenon. Purposive (or judgment) sampling of
the quantitative study can be used when the target groups have criteria set by the researcher
and they “are in the best position to provide the information required” (Cavana et al., 2001,
p. 263). The findings of this kind of sampling cannot be confidently generalized to the
population (Cavana et al., 2001). However, this is not the main concern here as the current
study is exploratory in nature.

108
5. Data collection methods: In-depth interviews with experts in construction (i.e., open-
ended questions) can help to obtain better understanding of the enablers of learning in a
fragmented context. On the other hand, questionnaire survey is appropriate to determine
the extent of fragmentation’s effect on project learning. Thus, data collection procedure
followed by the current study is the cross-sectional method, consisting of qualitative
interview and survey method (Bryman, 2004).
6. Logical linking of data to propositions: This involves testing the previous proposition of
the association among fragmentation, enablers, and project learning. Relationship among
these factors can be affirmed by hypotheses testing. More comprehensive methods of
testing shall be used. These include structural equation modeling (SEM), which is capable
of testing multiple factors at the same time. Partial least squares (PLS) approach of SEM is
adopted for data analysis. Chapter 5 will discuss this method in detail.
7. Criteria for interpreting findings: This involves developing an appropriate interpretation
of the obtained data. Data interpretation in this study will consist of interpretation of
qualitative data and quantitative data. This will be elaborated in Chapter 6.
3.7 Summary
This chapter was divided into two sections: theoretical model and research design.
Developing the theoretical model involves identifying the indicators of fragmentation,
project learning, and enablers of project learning. As a latent concept, fragmentation can be
determined via level of integration, coordination, and collaboration among team members.
Other indicators of this concept are decoupling of specialists and diversities, spanning

109
knowledge across project boundaries, and barriers. Indicators of project learning include
project team action to learn, knowledge creation, knowledge sharing, inter-project learning
processes, and knowledge transfer. Lastly, indicators of enablers include boundary
crossing and boundary objects, and some elements of Sense’s model in the situated
learning theory. The theoretical model proposed a need to conduct further investigation to
identify more enablers of project learning.
Research design summarizes the procedure of collecting, analyzing, and interpreting data
through a logical connection between research questions and conclusions. Research design
of both qualitative and quantitative studies was presented. The next chapter presents the
procedures and results of the qualitative study, which will be used to explore the factors
that enable project learning within fragmentation. The findings are expected to contribute
to the development of the theoretical model presented in this chapter.

110
CHAPTER 4: QUALITATIVE STUDY
4.0 Introduction
The purpose of this chapter is to explore factors that enable project learning within
fragmentation. These factors will help in explaining how learning occurs within this
context. This chapter attempts to develop the theoretical model proposed in Chapter 3. In
general, qualitative study is useful in identifying the underlying themes and phenomena
that were unexplained due to limitation in literature (Creswell, 2009).
Data collection was performed using in-depth interviews with individuals who were
involved and possessed experience in construction projects. Prior to this, a pilot study was
conducted to ensure clarity, sufficiency, and accuracy of the interview questions. The
findings indicated new enablers and confirmed some factors proposed previously in the
theoretical model.
4.1 Sampling Design
The purpose of qualitative sampling is not to generalize findings to the population, but to
develop an understanding of the phenomenon (Creswell, 2008). In a qualitative study,
choosing participants depends on whether they are “information rich” and relevant to the
research questions (Bryman, 2004; Creswell, 2008). The current study employs purposive

111
sampling method. According to Bryman (2004), purposive samples can be divided into
snowball sampling and theoretical sampling. Meanwhile, Creswell (2008) divided this
sampling method into several sampling methods, depending on the time they were
conducted, either before or after data collection. The current study adopted theoretical
sampling, as it is more appropriate to achieve the research objectives.
Theoretical or concept sampling is undertaken before data collection to generate or
discover a theory or specific concepts within a theory (Creswell, 2008). This method
entails conducting qualitative interviews and the number of interviews will depend on the
theoretical saturation achieved (Glaser & Strauss, 1967). Conducting this kind of sampling
implies analyzing the collected data concomitantly.
The sample in the current study is building projects in Kuala Lumpur and Selangor States.
The current study sets the following characteristics of the sample :
Projects vary in type (e.g., education building, administration building, and so on).
Projects are sizeable (i.e., value of projects is approximately RM50 million or
above, to show some complexity to test the phenomenon on hand).
Projects vary in terms of specialist individuals involved in the production process
(i.e., number of specialized firms and professions involved is not less than five,
depending on the construction stage).

112
Respondents or source of information (Bryman & Bell, 2007) for the in-depth interviews
are managers and consultants involved in the construction process (i.e., production stage).
The reason for choosing managers for the face-to-face interviews is their role in defining
the team structure and engendering a culture of confidence, trust, safety, and mutual
respect among members (Mosey, 2009). Conducting interviews with consultants is crucial
to perceive how these individuals look at the learning process. Selection criteria of the
interviewees are as follows:
Directly involved in the construction process (i.e., must have conducted at least
three construction projects);
Possess sufficient experience in construction building projects (i.e., minimum 10
years); and
Possess experience in project review and audit (optional).
4.2 Designing the Interview Questions and Protocol
The questions intend to explore more enablers of project learning within fragmentation.
Altogether, the questionnaire comprises seven open-ended questions. The first and second
questions are intended to perceive the interviewees’ opinion on the situation of project
learning and fragmentation in construction projects in Malaysia. The rest of the questions
are intended for exploring the enablers. These questions are summarized in Table 4.1. The
nature of in-depth interviews allows for expanding the discussion with the interviewees to
explore the topic further. Therefore, the questions may be considered as a guideline for
further questions.

113
Table 4.1: Questions for in-depth interviews
Question Purpose
1. How do you evaluate the practice of project learning in Malaysia?
To observe how respondents perceive learning and to test their information about this topic
2. What is your perception about fragmentation in local projects?
To observe how respondents perceive fragmentation and to test their information about this topic
3. What increases trust, collaboration, and communication among project team?
To explore factor that overcome the negative impact of fragmentation
4. How to enable knowledge and experience sharing within fragmentation?
To explore the factors that enable achieving intra-project learning within fragmented project team
5. How to enable knowledge creation within fragmentation?
- Same as above -
6. How to enable knowledge transfer within fragmentation?
To explore the factors that enable achieving inter-project learning within fragmentation
7. What enables the practice of project learning within fragmentation?
To explore the factors that enable learning method within fragmentation
Prior to conducting the interviews, developing a protocol to collect data is advised
(Creswell, 2008). The protocol is useful for structuring the interview and collecting the
data carefully. It also serves as a reminder for the researcher during conducting the
interviews. Simply, the protocol is a form that contains instruction to conduct the
interviews, questions to be asked, and space to take notes (Creswell, 2008). According to
Creswell (2009), interview questions shall start with an icebreaker question, followed by
the questions related to the study and a concluding question. The following is the protocol
for conducting the interview of the current study adapted from Creswell (2009):

114
1) Ice-breaker question;
2) Introductory questions: question related to the interviewee’s experience in the
field and question related to the awareness of the interviewee on project
learning and fragmentation;
3) Researcher’s explanation of the concepts of fragmentation and project learning
to the interviewees;
4) Questions related to the study (refer to Table 4.1); and
5) Possible further comments of the interviewee.
4.3 Pilot Study
The purpose of the pilot study is to check the clarity of interview questions (Fellows &
Liu, 2003). An academic was asked to examine the interview questions to verify clarity,
accuracy, and flow, and provide suggestions for enhancing the questions generally. In
addition, the first two interviews are considered as pilot study. However, findings from
these interviews were added to the main results. During the two interviews, the researcher
noted any possible problems related to the questions or the way the interview was
conducted.
4.3.1 Results of the pilot study
The academic advised changing and/or explaining certain terms so it will be easier for
industry practitioners to cope with the terms. Furthermore, the expert advised attaching one
page of the research aims and objectives so interviewees will be able to see it on paper
instead of merely hearing a verbal explanation.

115
Two interviews were conducted with a project manager and a project engineer in this pilot
study. The researcher deemed it was necessary to modify the technique of asking questions
because interviewees failed to understand the topic easily. For example, the interviewees
faced difficulty in coping with terms such as fragmentation, project learning, and
knowledge creation. Thus, the researcher employed terms such as separation of design and
build process, lack of collaboration and cooperation, and lack of experience sharing across
different stages of the project. The researcher replaced the term “knowledge creation” with
“creating new ideas” and the term “tacit knowledge” with “experience” and “how to do
things.”
As the conversation commenced with the first two interviewees, the researcher realized the
importance of flexibility in terms of asking the questions or expanding the topic. This is
true with the in-depth interviews, where the interviewees are accorded freedom to explain
the topic from their points of view. After further developing the interview questions, the
researcher was able to start conducting the interviews with other individuals in the sample.
4.4 Choosing Projects and Interviewees
The study attempts to choose a mixture of different construction building projects to obtain
data that are more comprehensive. The sample of the current study consists of six projects:
an administration building, an education building, two hospitals, an airport, and a bank.
The said projects were all in the construction stage when the study was conducted. Value
of these projects ranged between 46 million to 997 million Malaysian Ringgit. Table 4.2
provides more details on these projects.

116
Table 4.2: Sample of qualitative study (details of construction building projects)
No. Project type
(specification) Location
Value (RM
million)
Completion
percentage (% )
Contracting
method
1 Administration building (10
stories)
UM (Kuala
Lumpur) 61.0 65 Conventional
2 Education build ing (9
stories laboratory)
UM (Kuala
Lumpur) 46.1 7 Conventional
3
Hospital (10 stories -
pediatric building and 6
stories obstetric build ing)
UM (Kuala
Lumpur) 173.0 85 Conventional
4 Hospital (13 stories -
general hospital)
UM (Kuala
Lumpur) 176.0 31 Conventional
5 Airport (the build ings
package only) KLIA 997.0 34
Design and
build
6 Bank (1500 acre) Brickfield
(Kuala Lumpur) 500.0 30
Design and
build
The approached interviewees were project directors, project managers, site engineer, a
coordinator, and a consultant (Table 4.3). Interviewees with experience in project learning
(e.g., post-mortem project and quality assurance) provided an extra advantage. Majority of
interviewees were project managers with a minimum of 20 years of experience. The study
envisaged to interview a variety of experts in the field of project management and
construction. The variety of disciplines among interviewees enabled the study to obtain
rich information and cover different views and opinions about the subject matter.
Theoretical saturation (Bryman, 2004) was achieved at the 11th interview.

117
Table 4.3: Profile of interviewees
Interviewee Date Age Gender Education Position Experience
(years)
X1 17/5/10 40 Male Bachelor Degree Project Manager 20
X2 17/5/10 38 Male Bachelor Degree Project Engineer 10
X3 21/5/10 37 Male Master Degree Project Manager 12
X4 22/5/10 49 Male Master Degree Project Manager 20
X5 31/5/10 50 Male Bachelor Degree Construction Manager 20+
X6 02/6/10 48 Male Bachelor Degree Director of Projects 20
X7 03/6/10 49 Male Dip loma Consultant 20+
X8 07/6/10 55 Male Bachelor Degree Project Director 20+
X9 01/7/10 40 Male Bachelor Degree Project Coordinator 16
X10 08/7/10 42 Male Bachelor Degree Project Manager 15
X11 14/7/10 52 Male Bachelor Degree Project Manager 25+
4.5 Procedure of Data Collection and Analysis
Data may be collected using a recorder, in addition to direct writing during the interview
(Bryman, 2004). These methods are called formal and informal methods of recording
(Creswell, 2008). Using both methods is suggested so the informal method can be used as
backup. After recording the interview, audiotaped data can be transcribed. Data
transcription is the process of transferring audio to written text and storing it in a computer
database (Creswell, 2008).
Each interview lasted an average of 25 minutes and was transcribed into approximately six
pages. Analysis of interviews involves making a general sense of the data. According to
Creswell (2008), analysis of interviews include the following features: it is inductive, that
is, going from the particular to the general; it involves simultaneous and iterative data
analysis and collection; it involves developing deeper understanding of data by reading
them several times; it is interpretive and requires personal assessment; and it entails no

118
single method. In addition, data analysis and interpretation involve six main steps:
preparing and organizing data; exploring and coding the database; describing findings and
forming themes; representing and reporting findings; interpreting the meaning of the
findings; and validating the accuracy of findings (Creswell, 2008). These steps will be
discussed in detail in the following paragraphs.
Preparing and organizing the data includes verbatim transcription of the audio interviews
into text. After doing so, the researcher shall decide whether to use manual or computer
software for the analysis. According to Creswell (2008), the decision to analyze data
manually depends on the size of manuscript (less than 500 pages of single-spaced
transcription); desire to be close to the data sans intrusion of a machine; and availability of
time for hand analysis. The researcher decided to use manual analysis, as the size of
manuscripts is not large.
Exploring and coding data is the first step in data analysis. According to Creswell (2008),
this step involves reading the transcript; writing memos on the margin of the text of ideas,
phrases, or hunches; and dividing the text into segments (defined as labeled sentences or
paragraphs in the transcript that can explain the phenomena or answer the research
questions). These segments shall be assigned certain codes. Codes can be in vivo codes that
are the actual words of the participants, or they can be words in standards terms extracted
from the literature (Creswell, 2008). Examples of in vivo codes are Consultant Ego and
Interfacing Meetings. Other codes were obtained from the literature, such as Incentives.
Typically, a manuscript of 20 pages entails 10 to 15 codes (Creswell, 2008). After coding
the entire text, a list of all codes shall be arranged in a tab le to reduce similar and
redundant codes. Afterward, the codes shall be collapsed to a fewer number of themes or

119
categories (five to seven themes). Themes are similar codes aggregated together to form a
major idea in the database (Creswell, 2008). Figure 4.1 illustrates the process of exploring
and coding data.
Figure 4.1: Exploring and coding data in qualitative study (Source: Creswell, 2008)
4.6 Verification of Findings
Qualitative data shall be verified to ensure that findings are accurate during data collection
and analysis (Creswell, 2008). Data verification can be attained using one the following
methods: triangulation, which entails data collection from different sources; member
checking by asking one or more respondent (i.e., the same interviewees) to check the
accuracy of findings; or external audit (academics, peers, etc.) who may review the
different aspects of findings (Creswell, 2008).
Initial read text
data (Memos)
Div ide the text
into segments of
informat ion
Label the
segments of
informat ion with
code
Reduce overlap
and redundancy
of codes
Collapse codes
into themes
Many pages of
text
Many segments
of text
30 – 40 codes
Codes reduced to
20
Codes reduced
to 5 – 7 themes
120
The researcher asked two peers to check the wording of codes and whether they represent
the segments (peer review) (Creswell, 2008). The peers were asked to check whether the
codes provide sensible answers to the research questions. The codes were enhanced
accordingly. In addition, in the following chapter, the quantitative study will be used to
verify these findings.
4.7 Findings and Discussions
4.7.1 Project learning: Perception of the interviewees
The researcher observed that some interviewees were not very familiar with terms such as
project learning and knowledge creation. This may indicate lack of implementation of such
concepts within the project arena. For some interviewees, people can learn during a session
of sharing new knowledge about certain issues using a presentation (e.g., coaching).
However, other interviewees were aware of certain processes of project learning, which
involves knowledge documentation and transfer to others within and across projects. These
interviewees indicated that documented knowledge is mainly about budget, construction
method (physical works), or problems that may occur during construction. Mainly, the
documented knowledge of post-mortem project focuses on the financial aspect and
examines whether or not the project obtains profits. These documents will be stored by the
main contractor and will not be shared with other companies.

121
Majority of interviewees affirmed their willingness to share knowledge that facilitates the
achievement of the project. Knowledge here is mostly in an explicit form, including
information required to achieve the project such as drawings, specifications, and reports.
Knowledge related to how to do things (tacit knowledge) can be shared freely when it
helps to achieve the project. However, as a project manager commented, “People will
share knowledge if they asked to do so, but still they will not give full details.” The same
interviewee stated that he would not share how to do things (tacit knowledge) with people
he does not know, without some sort of incentives.
4.7.2 Fragmentation: Perspective of the interviewees
Majority of interviewees, especially builders, viewed fragmentation as a significant
problem that may influence project performance and learning. However, an interviewee
(consultant) disagreed that fragmentation hinders project learning, as consultants can meet
and discuss with others any time if necessary. Another interviewee indicated that people do
not hesitate to share their knowledge because they work in one project, where there is no
competition that can affect knowledge sharing. However, majority agreed that
fragmentation cannot be avoided. An interviewee stated that it is better to have more
specialists involved in the project, but the problem would lie on how to coordinate between
all those people. Another interviewee (a consultant) stated that fragmentation could be
avoided by coordination among different people, specifically contractors and
subcontractors. The said interviewee highlighted that fragmentation between main
contractors and subcontractor (vertical) is more severe than fragmentation between
consultants and contractor (horizontal). Other opinions and perceptions about project
learning and fragmentation are summarized in Table 4.4.

122
Table 4.4: Results of interviews (situation of project learning and fragmentation)
Aspect Feedback Interviewee
Perception about
project learn ing
practice
Project reviews are mainly about construction method, complet ion time
and cost. The purpose is to find the causes of problems. Some reasons
for delay and over cost is lack of coordination
X9, X3
Conducted by contractor company (team from the main office / HQ) X9
A committee of p roject director, coordinator etc. is assigned to
conduct post project review X9
The content is like trade secrets or it is private and confidential
(especially for pricing, not technical information). Other organizations
cannot benefits from it. An alternative of post project review is
seminars for the sub-contractors.
X9, X10
In most projects, there is no development of lesson learned about
specific problems … only normal correspondence letters. X10
Perception about
fragmentation
within local
projects
Fragmentation has no influence on knowledge sharing because people
have to share their knowledge to complete the project. People are
willing to share knowledge because they are working in the same
project. Another reason for people willingness to share knowledge is
because normally specialized companies have no competitors working
in the same pro ject.
X10
Fragmentation influences project learning indirectly. X9
4.7.3 Enablers of project learning within fragmentation
Enablers that facilitate knowledge creation among team members within fragmentation
include technical meeting, discussions, informal gathering, encounters, and the role of
senior manager in gathering people and creating new ideas from different specialists.
Interviewees believed that sharing of experience and knowledge among different
specialists has strong influence on knowledge creation. Trust appears important for the
individual to share his or her tacit knowledge, although one interviewee indicated that
people trust each other because they have “nothing to hide.”

123
Relationship among project team members can be highlighted when addressing
fragmentation. Consultants and builders may not get along very well. For example, several
builders indicated that consultants are egoistic in sharing knowledge. Consultants, on the
other hand, have a negative pre-impression that all the contractors always “cheat.” The
relationship between consultant and contractor is akin to “forced marriage,” as a project
manager stated. However, what bonds team members is the common goal of achieving the
project. Friendship is viewed as a factor that facilitates experience sharing. Some people
find it difficult to share knowledge with “strangers” unless they are explicitly asked to do
so.
On the other hand, communication does not appear to be a problem as team members
conduct formal and informal meetings quite frequently. In addition, consultants can
arrange for a meeting when necessary. Another factor that facilitates communication
among people is the availability of IT and ICT in projects.
Respondents suggested several factors that increase trust and communication and enhance
relationships between project team members, subsequently reducing the impact of
fragmentation. These include participation, collaboration, off-site activities and informal
gathering, and project leader role. Participation implies consultant involvement in different
activities during construction. Participation and collaboration depend on people ’s attitude,
as the interviews indicated. Off-site activities and informal gathering and encounters are
believed to increase trust as well as build good relationship among team members.
Moreover, the project leader can serve as a role model in fostering this behavior among
members.

124
With regard to the procurement method, several interviewees (especially on the
contractors’ side) view design and build (D&B) as better in terms of knowledge sharing
because the consultants and contractors will be working together in the early stage of the
project, particularly in the design stage. However, majority of the interviewees perceive no
difference between the two methods, with regard to knowledge sharing. Several
interviewees prefer the conventional method, as D&B is saddled with disadvantages such
as delay and low quality. In fact, trust between consultants and contractor may be affected
in D&B due to payment related issues, as an interviewee affirmed.
The respondents highlighted several factors that facilitate knowledge transfer and achieve
project learning: IT, lessons learned project documentation (e.g. project history and quality
assurance systems), common goals of project team, and boundary object. Majority of
interviewees agreed on the role of boundary crossing and boundary objects in enabling
knowledge sharing and creation among project team members. These include IT (Forgues
et al., 2009), construction contract (Koskinen & Mäkinen, 2009), and drawings,
specifications, and reports (Phelps & Reddy, 2009). Information technology is used mainly
to transfer knowledge via documentation of relevant information in a database.
Factors that enable knowledge sharing in this context include the following: meetings (e.g.,
coordination meetings), problem-solving sessions, brainstorming sessions, procurement
method, spirit of project team and common goals, contract and owner role, and knowledge
type (certain people experience difficulties in sharing all knowledge with others). Other
factors that may have a less or indirect effect are documentation, transparency,
commitment, incentives for knowledge sharing, attitude, and personal relationship. These
findings are summarized in Table 4.5.

125
Table 4.5: Findings of the interviews (collapsed codes and themes of enablers of project learning)
Segments and Emerging Codes Interviewee Collapsed Codes Themes
What increases trust, collaboration, and communication between project team?
Consultants’ participation in different construction
activities (to avoid general contract and BQ at the same time increase trust) (Phelps & Reddy, 2009).
Collaboration depends on people
X2, X9, X10 Participation of
Consultant
People attitude Contract
Working Relationship
ISO (9000)
Manager &
Coordinator’s Role Off-site Activities
Leader Role in
creating appropriate
working environment
Leader as a Role Model
Timing Factor
Discussions &
meetings (esp.
informal)
- Participation - Attitude
- Rules and
regulation
- Relationships
(working & personal)
- Leader’s Role
- Coordinator Role
- Off-site Activities
- Informal encounters and
discussions
- Timing factor
Contract (bond the relationship) X4, X7
Good working relationship (rather than partnering) X7
ISO system to enable coordination and systematic working between main contractor and sub-
contractor
X7
Project manager (to coordinate between consultants and contractors)
X6
Coordinator role to interface between different
people and companies (multi-discipline) X9, X6
Get people together and know each other (off site
activities) (Koskinen & Makinen, 2009) X6
Project leader to create appropriate environment
and to learn people how to learn
Leader as a role model
X8
Three factors to increase trust: time, discussions,
and performance accordingly
Meetings and informal encounters
X9, X10, X11
What are the enablers of knowledge sharing within fragmentation?
Regular meetings / coordination meetings X1, X3, X7, X6,
X8, X11
Regular Meetings
(coordination)
Discussions & Seminars
Memos
Brain Storming &
Problem solving
Sessions Attitude of Leaders
ISO
Record file form
Procurement Method
(D&B) Spirit of Project
Team
Transparency and
openness
Commitment Motivation &
Incentives
Knowledge as a trade
secret
Contract Client Request
Method Statement
Responsibility
Objectives of
achieving the project Leaders Role
Personal
Relationships
- Meetings
- Problem-solving Sessions
- Attitude
- Documentation
- Procurement
Method - Spirit of Project
Team
- Openness
- Commitment
- Incentives for knowledge
sharing
- Knowledge Type
- Contract
- Owner’s Role - Common Goal
- Leader’s Role
- Relationships
Discussions, seminars and site memos X3, X7, X6, X11
Brain storming and problem solving X8
Attitude of the main players X3, X9
ISO system X3
Strong writing up and record file form X2, X1
Spirit of project team X2, X11
Transparency and openness X11
Contractor commitment for acquisition of
knowledge X1
Monetary incentives X4
Don’t share everything as some types of
knowledge is treated as a ‘trade secret’ X4
Construction contract X4
Client may request sharing some necessary
information X4
Method statement (documentation) X4, X8, X5
Interfacing meetings (coordination meetings), courses and training, and D&B
X5
Motivation X6
Individuals to take responsibility and commitment X8
People will share knowledge regardless of
fragmentation because they are doing business ‘forced marriage’
X8
Leaders role X8
Consultants’ attitude X9
‘Buddies’ relationships X4
What are the enablers of knowledge creation within fragmentation?
Regular technical meetings X2, X7, X6, X11 Technical Meetings
Frequent Discussions
Project & Senior
Manager Role Informal Meetings
- Meetings &
Discussions
- Management
Role - Informal
Frequent discussions X3, X7
Project manager to allows for openness X6, X11
Senior mangers role X11
Informal meetings and getting people together X4, X7, X6

126
Experience sharing (of specialists) X8
Experience Sharing Encounters
- Knowledge
Sharing
What enables knowledge transfer within fragmentation?
IT databases (e.g. infostore) X7, X5, X6
IT
Project Learning
Quality Assurance
- IT
- Project review
- Regulation of
the organization
Project review and post project mortem X3, X6
Lessons learned X3, X6
Project history X7
Quality assurance system X7
What enables the practice of project learning in fragmented project?
Attitude of facilitator (project manager) X3 Attitude of Leader
IT
Drawings & Contract
Common Goals
- Attitude of
Leaders
- Boundary
Objects
- Common Goals
Boundary objects (IT, drawings, contract) (Most of the
interviewees)
Common goal of achieving the project (Several interviewees)
Note: Underscored fonts of the themes indicate new discovered enablers. Normal fonts are enablers identified from the
literature and emphasized by the interviewees.
4.8 The Developed Model of Project Learning
Figure 4.2 presents the theoretical model proposed previously in Chapter 3. This model
indicates the new factors that enable project learning. These include roles of project
manager and senior manager, meetings (including technical meetings and problem-solving
sessions), attitude, knowledge type, incentives for knowledge sharing, and company rules
and regulations. Other factors that may have been indicated in literature and emphasized by
the interviewees include the following: knowledge documentation, procurement methods,
openness, commitment, informal encounters and relationships, spirit of project team,
common goals and objectives, and boundary crossing and boundary objects. Further testing
of these enablers and other elements in the model will be conducted in the quantitative
study in the following chapter.
Table 4.5: Results of the interviews (Cont’d)

127
Figure 4.2: Developed theoretical model of project learning (adding the results of the qualitative
study)
4.9 Summary
This chapter presented the procedures for qualitative data collection, analysis, and
discussion. The chapter presented the findings of 11 in-depth interviews with individuals
involved in construction building projects. The study explored new factors that facilitate
the learning process within fragmentation. Certain findings confirmed the variables
extracted from the literature. These finding were used to develop the theoretical framework
proposed in the previous chapter. The next chapter will verify these findings and test the
whole model of project learning.
Fragmentation
Level of integration of
project team members
Level of coordination
among project team
Level of collaboration
among project team
Decoupling of
professionals diversity
Spanning-boundary of
knowledge integration
Professionals and
cultural boundaries
Intra-Project Learning
Knowledge creation
Knowledge sharing
Learning support
Team action to learn
Inter-Project Learning
Knowledge articulation
Knowledge codification
Knowledge transfer
Experience accumulation
Enablers of Project
Learning
Boundary Object &
Boundary Crossing
Sense’s M odel
Qualitative Study:
management role,
meetings, attitude,
knowledge type,
incentives for knowledge sharing,
and company’s
policy…etc.

128
CHAPTER 5: QUANTITATIVE STUDY
5.0 Introduction
This chapter intends to develop and test the project learning model proposed in Chapters 3
and 4. A questionnaire survey will be used to answer the research questions and test the
hypotheses. This chapter is divided into two sections. The first gives a comprehensive
background of the process of developing the measurement scale and collecting and
analyzing data. The second section presents the results of the analyses.
This chapter illustrates the development of the questionnaire, including conceptualization,
operationalization, and measurement of latent constructs (i.e., fragmentation and project
learning) (Cavana et al., 2001). In addition, this chapter discusses two types of
measurement models, namely, reflective and formative measurements. Furthermore, it
highlights the identification of these measurements as hierarchical models.
Data collection involves non-probability sampling design, which suits the exploratory
nature of the current study. This sampling method can be used as well when a study
requires certain criteria set by the researcher (Cavana et al., 2001). Principal component
analysis (PCA), confirmatory factor analysis (CFA), and path modeling approach of partial
least squares (PLS-PM) will be used to analyze data. PCA can summarize the variables and
identify their structure into components, while CFA can validate the results of PCA. PLS-

129
PM offers advantages over other similar approaches and cope with special conditions,
including theoretical, measurement, and practical conditions. In addition, this approach
allows building the hierarchical models easily and analyzing structural and measurement
model simultaneously.
The results include descriptive analysis of respondents and projects. The results likewise
include parallel analysis, PCA, CFA, and the results of PLS-PM using SmartPLS package.
Quality of the full model is presented as well, including several tests to ascertain internal
reliability, multicollinearity (of fragmentation), discriminant validity, convergent validity,
and goodness-of- fit. Lastly, the results of mediating test of enablers are presented.
SECTION I: MEASUREMENT AND METHOD OF ANALYSIS
5.1 Steps of Developing the Measurement Scale
Developing a measurement scale of latent variables includes conceptualization,
operationalization of the concept, item measurement, and scaling (Babbie, 2010; Cavana et
al., 2001). Latent (or nebulous) variables are phenomena of theoretical interest, which
cannot be measured directly without certain indicators or manifest observable measures
(Diamantopoulos et al., 2008; Hair et al., 2006).
Defining an appropriate scale is the next step in developing the measurement. Scales can
be nominal, ordinal, interval, or ratio (Babbie, 2010; Cavana et al., 2001). The current
study will use the interval scale to suit multivariate analysis (Hair et al., 2006). In
developing a measurement scale, it is important to ensure that the scale is stable and it
130
measures the concepts on hand adequately. This is called goodness of measurement
(Cavana et al., 2001), which consists of item analysis, reliability, and validity. All these
steps will be discussed in other sections in this chapter.
5.2 Conceptualization, Operationalization, and Measurement
Conceptualization, according to Babbie (2010, p. 131), “gives definite meaning to a
concept by specifying one or more indicators of what we have in mind.” The advantage of
conceptualization is that it provides the imprecise notions more specific, precise, and clear
meaning (Babbie, 2010). Chapter 2 elaborated the conceptual definitions of fragmentation,
project learning, and enablers.
On the other hand, “operationalizing the concept involves reducing the abstract notions to
observable behavior and characteristic, which then can be translated into observable and
measureable elements to form an index of measures of the concept” (Cavana et al., 2001,
p. 188). Furthermore, operationalization represents the development of specific research
procedures (operation) that will result in empirical observations representing those
concepts in the real world (Babbie, 2010). In addition, Cavana et al. (2001) related
operationalization to the process of examining dimensions, facets, or properties denoted by
the notion.
For example, project learning consists of two main dimensions: intra-project and inter-
project learning. Intra-project learning, in turn, involves three dimensions, namely,
knowledge creation, knowledge sharing, and team’s action to learn. To measure these

131
dimensions, there is a need to operationalize them by identifying their measurement items
or indicators (refer to the theoretical framework in Chapter 3). In fact, conceptualization
involves refinement processes of a concept (Babbie, 2010). Therefore, it is important to
mention that the indicators presented in Chapter 3 will be confirmed by further analysis.
Concepts or dimensions can be measured by direct observation, indirect observation or by
using constructs (Kaplan, 1964). Constructs, as indicated by (Diamantopoulos, 2010, p.
92), are abstraction that are discussed in literature in several theories; it is the role of the
researcher to define them conceptually. This implies that the same construct’s name can
have a different meaning or definition (Babbie, 2010). For example, the concepts of
fragmentation and project learning are latent or unobservable constructs. Thus, determining
these concepts require conceptual definitions based on their indicators.
In measurement development, it is important to specify the measurement type. Indicators
of the latent variables can be either reflective or formative (Diamantopoulos et al., 2008;
Jarvis et al., 2003). Reflective indicators are affected by the latent variable, while
formative indicators cause formation or changes in the latent variable (Haenlein & Kaplan,
2004). The following section elaborates these two types.
5.3 Measurement Models: Reflective vs. Formative
Measurement models can be described as the relationships between a construct and its
measures (also called items, indicators, or manifest variables). It is important to specify the
measurement model properly, specifically to identify whether the model is reflective or

132
formative. According to Jarvis et al. (2003), specifying the measurement model as
reflective or formative is an important step in developing the measurement model.
Misspecification of the model (e.g., specifying the model as reflective but by right it
should be formative) may result in considerable problems. These include the following:
incorrect theoretical conclusion; incorrect answer to the research questions and misleading
direction of theory development; illusion view that the model fits the data (that results in
erroneous inferences); inflated measurement model (over-estimated) if the reflected
construct is misspecified; and deflated measurement model (under-estimated) if the
formative construct is misspecified (Baxter, 2009; Jarvis et al., 2003; MacKenzie, 2003).
Model misspecification may result from discrepancy between conceptualization
(conceptual definition of constructs) and operationalization (specifying measurement
models) (Diamantopoulos, 2010). To avoid model misspecification, Diamantopoulos
(2010) advised the following: observe caution when developing the models during research
design, provide a clear conceptual definition of constructs, recognize the differences
between reflective and formative measurements, and employ a measurement development
procedure that is consistent with the constructs.
In the reflective measurement, variables are used to measure the construct; in particular,
the arrow goes from the construct to the manifest variable. Conversely, variables are used
to indicate the latent construct; the arrow goes from the manifest variable to the construct
in the formative measurement. Figure 5.1 illustrates the difference between these two
measurements. Other differences between reflective and formative measurements are
adapted from (Jarvis et al., 2003) and summarized in Table 5.1. Equations of the reflective
and formative measurements can be given as follows (Diamantopoulos et al., 2008):

133
Reflective:
χί = λί η + εί ……………………………………………………………(5.1)
where χί is the indicator of latent construct η; εί is the measurement error for χ; and λί is the
coefficient or loading capturing the effect of η on χ ί.
Formative:
η = γί χί + ζ ……………………………………………………(5.2)
where χί is the indicator of the latent construct η; ζ is a disturbance term; and γί is the coefficient of
the effect of χί on η.
χ 1
χ 2
χ 3
Reflective
Construct
(η)
ε 2
ε3
Formative
Construct
(η)
ζχ 1
χ 2
χ 3
ε1
λ 1
λ 2
λ 3
γ1
γ2
γ3
Г1,2,3
Figure 5.1: Reflective measures vs. formative measures
(Source: Diamantopoulos et al., 2008)
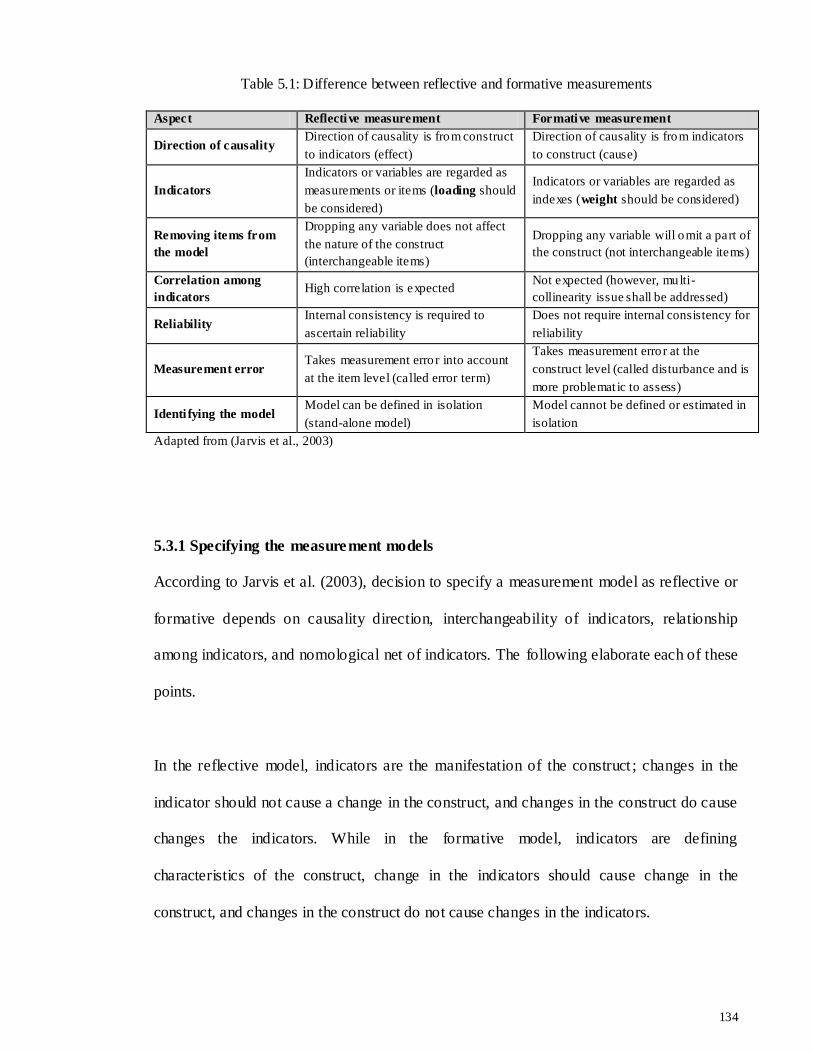
134
Table 5.1: Difference between reflective and formative measurements
Aspect Reflective measurement Formative measurement
Direction of causality Direction of causality is from construct
to indicators (effect)
Direction of causality is from indicators
to construct (cause)
Indicators
Indicators or variables are regarded as
measurements or items (loading should
be considered)
Indicators or variables are regarded as
indexes (weight should be considered)
Removing items from
the model
Dropping any variable does not affect
the nature of the construct
(interchangeable items)
Dropping any variable will omit a part of
the construct (not interchangeable items)
Correlation among
indicators High correlation is expected
Not expected (however, multi-
collinearity issue shall be addressed)
Reliability Internal consistency is required to
ascertain reliability
Does not require internal consistency for
reliability
Measurement error Takes measurement erro r into account
at the item level (called error term)
Takes measurement erro r at the
construct level (called disturbance and is
more problemat ic to assess)
Identi fying the model Model can be defined in isolation
(stand-alone model)
Model cannot be defined or estimated in
isolation
Adapted from (Jarvis et al., 2003)
5.3.1 Specifying the measurement models
According to Jarvis et al. (2003), decision to specify a measurement model as reflective or
formative depends on causality direction, interchangeability of indicators, relationship
among indicators, and nomological net of indicators. The following elaborate each of these
points.
In the reflective model, indicators are the manifestation of the construct ; changes in the
indicator should not cause a change in the construct, and changes in the construct do cause
changes the indicators. While in the formative model, indicators are defining
characteristics of the construct, change in the indicators should cause change in the
construct, and changes in the construct do not cause changes in the indicators.

135
Interchangeability of indicators in the reflective model is possible and indicators should
share a common theme. Dropping an indicator should not alter the conceptual domain of
the construct. Meanwhile, indicators in formative model need not be interchangeable; they
need not have the same or similar content, nor a common theme. Dropping an indicator
may alter the conceptual domain of the construct.
Covariation among indicators in the reflective model is expected, and change in one
indicator should be associated with change in other indicators. In the formative model, it is
not necessary for indicators to covary with each other and a change in one indic ator does
not necessarily need to be associated with change in other indicators.
Lastly, in the reflective model, nomological net for the indicators should not differ, and
indicators are required to have the same antecedents and consequences. In the formative
model, meanwhile, nomological net for the indicators may differ and indicators are not
required to have the same antecedents and consequences.
5.3.2 Deficiencies of formative measurements
Although utilizing the formative measurements in social science has increased recently,
they continue to suffer from fundamental shortcomings. These include controversial issues
related to reliability and validity (Baxter, 2009; Diamantopoulos et al., 2008). A recent
study conducted by Edwards (2011) was quite extreme in criticizing this kind of
measurement, concluding that viability of formative measurements is a fallacy. Edwards
(2011) advised to use hierarchical or multi-dimensional model that replaces formative
measures with facet constructs, where first-order constructs are identified as reflective

136
measurements and connected to the second-order construct formatively. In fact, the
hierarchical model suggested by Edwards was proposed previously by Jarvis et al. (2003)
and later on by Diamantopoulos et al. (2008). Next section will elaborate the hierarchical
measurement models.
To recall, fragmentation consists of certain dimensions as level of integration and so on.
These dimensions require certain indicators to measure them. The concept of
fragmentation, therefore, can be defined in a hierarchical relationship. Project learning can
be defined in a hierarchical relationship as well. In addition, fragmentation is measured
formatively, while intra- and inter-project learning are measured reflectively. Therefore, to
optimize between the advantages and drawbacks of formative measurements, the current
study identifies fragmentation measurement as Type II second-order model (presented in
Figure 5.3 in the next section). On the other hand, project learning can be identified as a
second-order reflective measurement called Type I (presented in Figure 5.2 in the next
section).
5.4 Hierarchical (Higher-order) Models
As mentioned previously, latent construct can be measured using certain indicators.
However, there are cases where the main latent construct consists of “sub-constructs.” In
particular, the main construct consists of another level of latent constructs that are
measured by another set of indicators. According to Diamantopoulos et al. (2008, p. 1205),
hierarchical or higher-order model “consists of number of interrelated attributes or
dimensions that are conceptualized under an overall abstraction and it is theoretically

137
meaningful and parsimonious to use this overall abstraction as a representation of the
dimension…” Specifying the model to include more than one dimension or level offers the
advantage of overcoming the abstract definition of one level measurement (Wetzels et al.,
2009). Another advantage is to overcome several shortcomings of formative measurement,
as indicated previously in (Edwards, 2011).
Models can be specified to include more than two levels of constructs; i.e., three or even
four levels (e.g. Wetzels et al., 2009). However, the most common type is the second-order
construct (two levels). For example, intra-project learning by definition consists mainly of
knowledge sharing and knowledge creation. These two dimensions cannot be measured
directly, but require certain indicators (i.e., manifest variables). Constructs of knowledge
sharing and creation and their indicators constitute a first-order model, and construct of
project learning with its indicators constitute a second-order model.
It is important to specify the relationship between the first-order and second-order models
(i.e., from indicators to dimensions to latent constructs) (Diamantopoulos et al., 2008).
Jarvis et al. (2003) identified four types of second-order measurement model, depending
on the measurement specification, as reflective or formative. These include Type I
(reflective first-order, reflective second-order); Type II (reflective first-order, formative
second-order); Type III (formative first-order, reflective second-order); and Type IV
(formative first-order, formative second-order). The current study is concerned about the
first and second types of second-order model, namely, Type I and Type II (Figures 5.2 and
5.3). As discussed in the previous section, intra- and inter-project learning can be specified
as Type I second-order model, while fragmentation can be specified as Type II second-
order model.

138
χ 1
χ 2
χ 3
Second-
order
Construct
ε2
ε3
ε1 λ 1
λ 2
λ 3
Component
1
Component
2
Component
3
χ 4
χ 5
χ 6
ε5
ε6
ε4 λ 4
λ 5
λ 6
χ 7
χ 8
χ 9
ε8
ε9
ε7 λ 7
λ 8
λ 9
ζ3
ζ2
ζ1
β 1
β 2
β 3
Figure 5.2: Type I second-order model (to specify intra- and inter-project learning)
(Source: Jarvis et al., 2003)
χ 1
χ 2
χ 3
Second-
order
Construct
ε2
ε3
ε1 λ 1
λ 2
λ 3
Component
1
Component
2
Component
3
χ 4
χ 5
χ 6
ε5
ε6
ε4 λ 4
λ 5
λ 6
χ 7
χ 8
χ 9
ε8
ε9
ε7 λ 7
λ 8
λ 9
ζ
β 1
β 2
β 3
Φ1,2,3
Figure 5.3: Type II second-order model (to specify fragmentation)
(Source: Jarvis et al., 2003)

139
5.5 Method of Analysis
This section intends to highlight different methods of analyzing data. Principal component
analysis (PCA) will be conducted to summarize the number of variables in the instrument
and to identify the underlying structure of the main constructs. Confirmatory factor
analysis (CFA) will be conducted afterward to validate the results of PCA. All these
analyses will be used to refine and develop the measurement scales of fragmentation,
project learning and enablers of learning.
Among various techniques to analyze multivariate data (refer to the model of Hair et al.
(2006), pp. 14-15 about choosing the appropriate technique for analyzing multivariate
data), structural equation modeling (SEM) appears to be the most appropriate technique for
the current study. This is because project learning model consists of metric data in multiple
dependence relationships. On the other hand, this model consists of measurement models
and structural model in a hierarchical relationship. SEM allows the examination of all the
relationships in both measurement and structural model simultaneously (Haenlein &
Kaplan, 2004). Partial least squares-path modeling (PLS-PM) is one of the approaches of
SEM and it is appropriate for the current study, as will be discussed in some other sections.
5.6 Principal Component Analysis (PCA)
According to Hair et al. (2006), the purpose of principal component analysis (PCA) is to
define the underlying structure among correlated variables and to summarize or reduce
data. The current study utilizes PCA to reduce the number of variables used to measure the
constructs (total number of metric variables in the current study is 99). In addition, PCA
140
can be used to identify the underlying components or dimensions for each construct. This
will help in developing comprehensive measurement models for the current study. Hair et
al. (2006) identified two conditions to which we can decide whether to choose PCA or
other technique of factor analysis as common factor analysis, based on the following:
1) Objective of factor analysis: PCA can be used to reduce variables, while common
factor analysis can be used to identify the latent dimensions between variables.
2) Prior knowledge about variance among variables: Little specific and error variance
suggest using component analysis, while large or unknown specific or error
variance suggests using common factor analysis. Total variance is the sum of three
variances, namely, common (shared) variance, specific (unique) variance, and error
variance. PCA does not discriminate between common or specific variance
(Costello & Osborne, 2005). In addition, common factor analysis can be used in
case of little knowledge on the amount of specific or error variance.
A third condition is to consider whether the technique is compatible with PLS analysis.
According Chin (1995) and Sosik et al. (2009), PCA is aligned with PLS. On the other
hand, common factor analysis method may suffer from factor indeterminacy or invalid
value of communality (greater than 1 or less than 0) (Hair et al., 2006). The previous
conditions demonstrate that PCA is more suitable than common factor analysis for the
current study.
According to Hair et al. (2006), there are conceptual and statistical issues that shall be
considered while conducting PCA. Conceptual issues can be evaluated by the researcher.
The researcher shall observe any pattern and structure among variables that are valid

141
conceptually. The researcher shall also ensure that the sample is homogenous ( i.e., there
are no group differences). If there is a group difference in the sample, then factor analysis
should be performed separately for each group. Second, correlation among variables
should be more than 0.30. Bartlett test of sphericity can be considered to determine the
appropriateness of PCA of the entire correlation matrix (Hair et al., 2006). Empirical
evidence from the analysis to identify the number of components depends on one or more
of the following criteria:
Latent root (eigenvalue should be > 1);
Percentage of variance (.60 or higher);
Scree test (beyond the cut-off point in the graph where the curve flattens out); and
Parallel analysis to identify the appropriate number of extracted variables (Tsplot)
(O'Connor, 2000).
O'Connor (2000) developed a syntax that can be used in the SPSS software for parallel
analysis. The purpose of this analysis is to determine the number of extracted
factors/component either in component analysis or common factor analysis. The syntax
produces a Tsplot that is a “modified” scree plot used to identify the optimum number of
factors representing a set of variables.
5.6.1 Identifying and interpreting components of PCA
Identifying factors/components requires strong conceptual foundation for the structure and
its rationale. This stage consists of three processes: estimation of factor matrix, factor
rotation, and factor interpretation and respecification (Hair et al., 2006).

142
First, the output of PCA is a matrix consisting of variables and components with factor
loadings. Factor loading is the correlation between variables and factors. High factor
loading means high correspondence between variables and factor, indicating high
representative of the factor (Hair et al., 2006). Second, we may decide to rotate the factors
to obtain better interpretation of the factor, better underlying structure, and more
theoretical solution (Hair et al., 2006). There are two types of rotation, namely, orthogonal
and oblique. The current study utilizes the second type. Oblique rotation is more realistic
and allows for correlated factors instead of maintaining independence between the rotated
factors (Hair et al., 2006). Examples of oblique rotation application include direct oblimin,
quartimin, and promax. Lastly, practical steps in interpreting the factor matrix and
respecifying the factorial model, as suggested in (Hair et al., 2006), are as follows:
1) Observe factor loadings to assess the significance level of factors. The minimal
level of factor loading for structure interpretation is ± 0.30 to ± 0.40. In addition,
loading of ± 0.50 or greater indicates a significant structure. Meanwhile, loading
more than 0.70 indicates a well-defined structure. Finally, the significance of factor
loading decreases with large sample size. For example, the significance level of a
200 sample size is 0.40.
2) Identify any cross- loading variable; that is, one variable shares a significance level
factor loading between more than one factor.
3) Assess communality of variables, that is, the amount of variance accounted for by
the factor solution for each variable (less than 0.50 communality is not significant).
4) Respecify the factor model, if needed (will be discussed in the following
paragraph).

143
5) Label the factors using a variable with the highest loading as the most
representative factor. Labeling likewise can be performed by reflecting accurately
the whole set of variables representing the factor.
The researcher may decide to respecify the solution model when one of three problems
occurs: no significant loading of a variable; low communality between variables; and
cross- loading variables. There are several remedies for these problems, and choosing one
of them depends on the researcher’s judgment, objectives of study, and conceptual
foundation underlying the analysis (Hair et al., 2006):
Ignore these problems and interpret solution as it is.
Evaluate variables for possible deletion.
Use alternative rotation method.
Decrease/increase the number of factors retained.
Modify the type of model used (e.g., using common factor analysis instead of
component analysis).
5.6.2 Validation of PCA
Confirmatory factor analysis (CFA) through structural equation modeling (SEM) is one of
the ways to validate the results of factor analysis (Hair et al., 2006). In addition, Costello
and Osborne (2005) highlighted the importance of conducting CFA to draw a
comprehensive conclusion. The detailed procedure of CFA will be shown in the results
section after conducting PCA.

144
5.7 Structural Equation Modeling (SEM)
Structural equation modeling or models (SEM) is “a family of statistical models that seek
to explain the relationships among multiple variables” (Hair et al., 2006, p. 711). SEM
intends to estimate causal relationships among latent variables, which are defined
according to a theoretical model and measured through some observable indicators (Vinzi
et al., 2010). Furthermore, SEM uses two familiar techniques: factor analysis and multiple
regression analysis (Hair et al., 2006); thus it can examine simultaneously the relationship
between indicators and constructs as well as the interrelationships among constructs in the
structural model.
Analysis of latent variables in SEM can be divided into two main approaches: covariance-
based SEM or CBSEM (also known as covariance structure analysis or LISREL) and
partial least squares-path modeling or PLS-PM (Haenlein & Kaplan, 2004; Hair et al.,
2006; Tenenhaus et al., 2005). Both approaches were developed at the same time during
late 1960s, but covariance-based SEM was more popular possibly due to ease-of-use
software packages and methodological options (Temme et al., 2010). With the recent
advances in software packages, PLS-PM approach is attaining growing interest. PLS and
CBSEM have two fundamental differences: in the objectives (prediction vs. theory testing)
and in the approach (variance vs. covariance) (Chin & Newsted, 1999). The current study
utilizes PLS-PM to analyze data because of its advantages and due to certain conditions,
which will be discussed in the following section.

145
5.8 Partial Least Squares (PLS)
According to Dijkstra (2010), partial least squares (PLS) was created and developed during
the 1960s, 1970s, and 1980s by Herman Wold with main concern on prediction, which is
the interest in fields of inquiry such as social science. PLS consists of two approaches,
namely, PLS regression (PLS-R) and PLS path modeling (PLS-PM) (known also as PLS
approach to SEM or components-based SEM) (Tenenhaus et al., 2005; Vinzi et al., 2010).
The current study focuses only on the second approach. After this, PLS-PM may be
indicated as PLS only.
According to Vinzi et al. (2010), PLS-PM was extended from the principle of PLS for
principal component analysis in four major works, including those of Wold (1975, 1982,
1985); Lohmöller (1987, 1989); Chin (1998b); and Tenenhaus et al. (2005). PLS-PM
consists of “interdependent equations” of simple and multiple regressions to estimate the
interrelationships among the latent variables (i.e., structural or inner model) and the links
between the manifest variables and their own latent variables ( i.e., measurement or outer
model) (Vinzi et al., 2010).
PLS is preferred in cases of small sample, too many variables (as in the case of the current
study), and data with non-normal or unknown distribution (Chin & Dibbern, 2010; Chin &
Newsted, 1999; Fornell & Bookstein, 1982). In fact, PLS uses nonparametric methods
(e.g., bootstrapping), thus it is free of the assumptions of normal distribution and other
assumptions (Guenzi et al., 2009). PLS-PM does not require strong assumptions regarding
the measurement scale; therefore, it is considered as a “soft modeling” technique (Vinzi et

146
al., 2010). In addition, PLS-PM explains, at best, the residual variance of the latent
variables and indicators in the model. This is why it is considered more suitable for
exploratory research (Vinzi et al., 2010).
In general, PLS is preferred when the purpose of research is to determine the relative
relationship among latent variables and when the path model is an objective rather than the
overall model fit (Barclay et al., 1995; Éthier et al., 2006; Hulland et al., 2010). PLS,
unlike CBSEM, can be used for causal-predictive analysis with complex situation and
where there is a low theoretical information (Jöreskog & Wold, 1982). Hence, covariance-
based SEM is useful where the objective of study is to test a theory, while PLS is useful for
predictive applications and theory development (Anderson & Gerbing, 1988; Chin &
Newsted, 1999). PLS is preferable for prediction because it provides the estimates based
on maximizing explained variance (Chin & Dibbern, 2010; Hair et al., 2006). Lastly, PLS
is suitable when the phenomenon under study is new or changing (i.e., theoretical
framework is not yet fully crystallized), when the model is relatively complex (i.e., large
number of manifest and latent variables), and when formative constructs are included in
the conceptual framework (Wetzels et al., 2009, p. 180).
5.8.1 Advantages of PLS over CBSEM
Using PLS has been proven to offer similar or, in some cases, more accurate results
compared with CBSEM (Hulland et al., 2010). Vilares et al. (2010) compared PLS with
maximum likelihood (ML) estimates, which is a CBSEM method, and concluded that PLS
estimates are generally better than ML estimates. In general, PLS produces better estimates
of the measurement model (i.e., outer model) than ML, but ML produces better estimates

147
of the structural model (i.e., inner model) than PLS (Tenenhaus et al., 2005). Chin and
Dibbern (2010) observed no difference in results between PLS and AMOS for the analysis
of convergent validity. The advantages of PLS-PM compared with CBSEM are
summarized in Table 5.2.
Table 5.2: Advantages of partial least squares over covariance-based SEM
No. Advantages of PLS-PM compared with CBS EM Reference
1 PLS is preferred in the case of small sample, too many variables, and
data with non-normal or unknown distribution
(Chin & Dibbern, 2010; Chin
& Newsted, 1999; Fornell &
Bookstein, 1982; Hulland et
al., 2010)
2
“ML [CBSEM] is theory-oriented, and emphasizes the transition from
exploratory to confirmatory analysis. PLS is primarily intended for
causal-predictive analysis in situations of high complexity but low
theoretical info rmation”
(Jöreskog & Wold, 1982, p.
270)
3 PLS provides measurement assessment of the new developed
measures. It is ideal for the early stages of theory development.
(Guenzi et al., 2009);
(Wetzels et al., 2009); (Sosik
et al., 2009)
4
PLS has the ability to build model with single- or two-item
measurement.
In the case of measurement theory failing to stand the scrutiny of a
CFA and convergent validity, PLS still provides estimates of
relationships in the model.
(Hair et al., 2006)
5
PLS is considered better in estimating higher-order models, while
CBSEM may suffer d ifficu lties in mathematical identification or
underidentification.
(Wetzels et al., 2009)
6 PLS is ideal for complex models and allows for latent constructs to be
modeled as reflective, formative, or mixed.
(Duarte & Raposo, 2010;
Éthier et al., 2006; Vinzi et
al., 2010)
7
PLS provides better estimates of formative measurements and when
the number of measurement variab les is small. In addit ion, it is useful
to obtain indicator weights and produce the prediction of latent
variables (or called the outer loading), while CBSEM are useful to
obtain model coefficient (inner model).
(Vilares et al., 2010);
(Tenenhaus et al., 2005)
8
PLS can overcome problem encountered by improper solutions in
CBSEM as negative error variances and standardized loadings greater
than 1.
(Wilson, 2010)

148
5.8.2 Evaluating the appropriateness of PLS for the current study
There are four conditions to evaluate the appropriateness of PLS compared with
covariance-based SEM, namely: theoretical conditions, measurement conditions,
distributional conditions, and practical conditions (Falk & Miller, 1992).
From a theoretical perspective, the relationship between fragmentation and project learning
is not very clear. In addition, no strong theoretical or empirical explanation for this
relationship is currently available. As the purpose of the study is to determine (i.e., predict)
the extent of fragmentation influence on project learning, PLS is considered more suitable.
Hair et al. (2006) recommended a ratio of 1:5 or 1:20 of variables to cases ( i.e.,
respondents). However, achieving this ratio of cases is probably not applicable for the
current study as number of variables is huge (i.e., 99 variables as we will see later on in
this study). Lastly, identifying the measurement models of the current study as hierarchical
Type I and Type II makes PLS approach more practical. These conditions, in addition to
the advantages of PLS-PM discussed above, encouraged the researcher to use this
approach for analyzing data and testing the model and hypotheses.
5.8.3 Limitations of PLS
Regardless of the advantages of PLS highlighted previously, there are limitations to this
approach. Estimations of error measurements of PLS are typically biased to a certain
degree compared with CBSEM (Dijkstra, 1983). In addition, PLS does not impose any
restrictions on data. Therefore, no overall test of model fit is available (Temme et al.,
2010). However, quality of the model can be tested by global goodness-of-fit (Tenenhaus
et al., 2005).

149
5.9 SmartPLS
The interest of utilizing PLS-PM has increased with the advances in software packages.
User- friendly software packages have been developed, including the first package
(LVPLS) developed by Lohmöller (1987). Temme et al. (2010) reviewed several packages
of PLS, including SmartPLS, and compared them in terms of requirements,
methodological options, and ease-of-use. SmartPLS will be used in the current study
because it has extra features, which will be discussed in the succeeding paragraphs.
SmartPLS (Ringle et al., 2005) is a java-based software; it is independent from the user’s
operating system that can analyze raw data only. Models in SmartPLS can be specified by
drawing the structural model for the latent variables and by assigning the indicators
(measurement model) to the latent variables via “drag and drop” (Temme et al., 2010).
SmartPLS, similar to other packages, enables the simultaneous analysis of measurement
and structural models. Moreover, SmartPLS has the following features (Temme et al.,
2010):
Output can be provided in different formats, such as HTML, Excel, or Latex.
It is provided with special feature called finite mixture routine (FIMIX), which is
used to identify any unobserved heterogeneity in the data.
It offers user- friendly advantages such as supporting the estimation of interaction
effects and helpful export options.
It offers two options regarding missing data analysis: substitute the mean over all
cases or delete cases with missing data (case-wise deletion).

150
Resampling methods such as bootstrapping and blindfolding can be used for cross-
validated communality and redundancy, and other validations.
It provides correction procedures for errors resulting from bootstrapping procedure
(calculates the confidence intervals from bootstrapping).
It offers different estimating methods or schemes, including centroid-, factor-, or
path-weighting to calculate the inner [and outer] model.
A drawback of Smart-PLS is that it does not address the problem of multicollinearity.
Therefore, another software package, such as SPSS, can be used to address this problem
when needed.
A newly developed software called WarpPLS has been released recently (Kock, 2011),
offering additional advantages over the previous packages such estimating the model fit
and VIF of multiconllinearity (the software is available at
http://www.scriptwarp.com/warppls/). Regardless of these advantages, the researcher
decided not to use WarpPLS because, unlike SmartPLS, it is not considerably supported by
literature and this may affect the reliability of the software. In addition, SmartPLS is more
user-friendly compared with WarpPLS.

151
5.10 Identification of Hierarchical Models in PLS
As indicated previously, the current study uses two types of second-order measurement
models: Type II for fragmentation and Type I for project learning and enablers (Jarvis et
al., 2003).
There are three ways to identify the higher-order models in PLS: 1) repeated indicators
approach or hierarchical component, which is also known as superblock approach
(Tenenhaus et al., 2005); 2) two-stage approach; and 3) hybrid approach (Wilson &
Henseler, 2007). The most popular approach in hierarchical models is the repeated
indicators approach, which will be adopted by the current study.
According to Wilson and Henseler (2007), the repeated indicators approach was suggested
by Wold (1982). In this approach, the manifest variables of the first-order constructs will
be repeated in the second-order construct. Thus, the manifest variables are used twice in
the second-order models, or many times depending on the hierarchical level. For example,
lack of integration (as a first-order measurement) consists of 10 manifest variables. These
variables will be repeated in the second-order measurement to measure fragmentation.
Loadings of the first-order manifest variables are called “primary” loadings, while loadings
of the second-order construct are called “secondary” loading (Wetzels et al., 2009).
However, Wilson and Henseler (2007) indicated that this approach may suffer from bias in
the estimation as the exogenous variables in the first-order construct become endogenous
variables in the second-order construct.

152
5.11 Choosing the Appropriate Weighting Scheme
SmartPLS is provided with three schemes for estimating algorithm: centroid scheme,
factor scheme, and path scheme. Centroid weighting scheme considers the sign of
correlations between a latent variable and its adjacent latent variables, while factor scheme
uses the correlations (Henseler, 2010). Therefore, these two schemes are preferable for
confirmatory factor analyses (CFA), as they imply the existence (rather than the direction)
of relationship between latent variables (Tenenhaus & Hanafi, 2010). Specifically, centroid
scheme is preferably used when there is a strong correlation between the manifest
variables, while factor scheme is preferable for the weaker correlations (Vinzi et al., 2010).
Lastly, the path weighting scheme takes into account the arrow (directional) orientation in
the path model (Henseler, 2010). Vinzi et al. (2010, p. 53) recommended the path scheme
among the other two schemes as it “explicitly considers the direction of relationship as
specified in the prediction path model.” Lastly, Tenenhaus and Hanafi (2010) used path
weighting scheme for calculating the interrelationships, and used centroid weighting
scheme for CFA. The current study follows Tenenhaus and Hanafi’s approach.
5.12 Quality of PLS Model
Quality of PLS-PM model can be attained by two means: quality of the measurement
model (i.e., relationship between the manifest variables and the constructs they are
measuring, also called outer model) and quality of the structural model (i.e., relationship
among constructs, also called inner model) (Tenenhaus et al., 2005). In the first approach,
reliability and validity are the two dominant criteria for examining the quality of the
model. These include items’ loadings, reliability of measurement, communality,

153
discriminant validity, and convergent validity. Second, quality of the structural model can
be attained by means of how the relationship among constructs is theoretically sound and
via the model’s goodness-of- fit and cross-validated redundancy. The following section
elaborates the two approaches.
5.12.1 Quality of measurement models
Goodness of the measurement instrument can be examined in three ways: item analysis,
reliability, and validity (Cavana et al., 2001; Churchill, 1979). Specifically, the current
study considers items’ loading, internal consistency, discriminant validity, and convergent
validity.
1. Item loading: This should not be less than 0.55 (i.e., 30%) (Falk & Miller, 1992).
However, if the purpose is to examine item weight of formative measurements, then 0.1 is
the minimum figure (Chin, 1998b).
2. Internal consistency: This can be examined using composite reliability index (0.6 to 0.7
is the threshold) (Bagozzi & Yi, 1988; Fornell & Larcker, 1981; Hair et al., 2006).
Cronbach’s alpha can be used as well to examine the reliability of scale, where the
accepted value of alpha should be above 0.6 (Girden, 2001; Malhotra, 2003).
3. Discriminant validity: This indicates the extent to which a given construct is different
from other latent constructs. The cut-off threshold of average variance extracted (AVE) is
0.5 (Fornell & Larcker, 1981). AVE “attempts to measure the amount of variance which a
latent variable component captures from its indicators relative to the amount due to
measurement error” (Chin, 2010, p. 670). The square root of the AVE can be compared

154
with the correlations among all constructs. If constructs have stronger correlations with
their own measures rather than with any other construct in the model, this indicates good
discriminant validity (Fornell & Larcker, 1981). The magnitude of items’ cross loading
can be used to indicate the discriminant validity. Indicators shall show higher loadings
with their respective constructs than with any other construct (Chin, 1998b; Wetzels et al.,
2009).
4. Convergent validity: This is defined as “the extent to which blocks of items strongly
agree (i.e., converge) in their representation of the underlying construct they were created
to measure. In other words, how high are each of the loadings and are they more or less
similar?” (Chin, 2010, p. 674). This can be established by examining the range among
highest and lowest items’ loading of a construct. The less the range (or difference) among
items is, the more will be the convergent validity (Chin & Dibbern, 2010). Cross-loading
test (inter-construct correlations) can be used to assess convergent validity as well as
discriminant validity (e.g. Turel et al., 2007).
5.12.2 Quality of structural model
On the other hand, quality of PLS structural model can be achieved by means of how the
relationship among constructs are theoretically sound (Chin, 1998b), global goodness-of- fit
(GoF), standard error, cross-validated redundancy (also called Stone-Geisser test
represented by Q2 or F2), and cross-validated communality (H2) (Tenenhaus et al., 2005).
The latter actually indicates the quality of measurement model.

155
1. Good theoretically sound model: Indicators of good theoretically sound model include
estimating the external validity (Bagozzi, 1994). This can be attained by assessing the
strength of relationship among constructs (i.e., structural path) as hypothesized and by
calculating the prediction of endogenous constructs represented by the coefficient of
determination (R2) (Bagozzi, 1994; Chin, 1998b). Path coefficient indicates the strength of
the relationship, but the significance of this relationship must be calculated using
bootstrapping procedure. The ideal standardized path coefficient is 0.30 (C. Liu et al.,
2008). For the endogenous construct, R2 should be greater than 0.24 to indicate good
prediction in PLS-PM model (Tenenhaus & Hanafi, 2010).
2. Goodness-of-fit: Goodness-of-fit (GoF) can be used to validate the PLS model globally
(Guenzi et al., 2009, p. 306). Value of GoF can be calculated using the root square of both
the geometric mean of average communality multiplied by the average R2, as shown in the
following equation (Tenenhaus et al., 2005):
GoF = √ communality * R2 ………………………………………………(5.3)
However, Tenenhaus and colleagues did not indicate the threshold of GoF. Wetzels et al.
(2009) proposed three values to indicate the threshold of GoF, including 0.1, 0.25, and
0.36, representing small, medium, and large GoFs, respectively. Hence, a value of GoF
larger than 0.36 can indicate good global model.

156
3. Cross-validated communality and cross-validated redundancy: Cross-validated
communality (cv-com) or H2 “measures the capacity of the path model to predict the
manifest variables directly from their own latent variable by cross validation” (Guenzi et
al., 2009, p. 307). Cv-com indicates the quality of measurement model (outer model) if
means of indexes are positive for all blocks (Tenenhaus et al., 2005). On the other hand,
cross-validated redundancy (cv-red) or F2 or Q2 can be used to measure the quality of
structure model (i.e., inner model) if means of indexes are positive (i.e., > zero) for all
endogenous blocks (Tenenhaus et al., 2005). When F2 > 1, then the observed endogenous
variables can be perfectly predicted by the model (Fornell & Bookstein, 1982). Value of
the Stone-Geisser (Q2) should be greater than zero to indicate that the model has predictive
relevance (Chin, 1998b). However, Chin (2010) indicated that endogenous construct with
Q2 above 0.50 shows good structural model. On the other hand, if H2 and F2 are negative
values, then this is an indicator of a bad estimation of the corresponding latent variables
(Tenenhaus et al., 2005). Both cv-com and cv-red can be calculated using a blindfolding
procedure, which is available in SmartPLS (e.g. Guenzi et al., 2009). Cross-validated
communality and cross-validated redundancy can be calculated using the following
formulas (Tenenhaus et al., 2005):
H2 = 1-
………………………………………….……. (5.4)
where SSE is the sum of squared prediction errors for a block and SSO is the sum of squares of observations
for a b lock.
F2 = 1-
………………………………………………..(5.5)
where SSÉ is the sum of squared prediction errors for an endogenous block and SSO is the sum of squares of
observations for a block.

157
5.13 Bootstrapping and Blindfolding in PLS
Bootstrapping is a resampling method that replaces the original sample to produce samples
consisting of the same number of units as in the original sample (Tenenhaus et al., 2005).
According to Gray and Meister (2006), bootstrapping is a nonparametric approach for
estimating the precision of paths. In addition, bootstrapping is used to assess the
psychometric properties of the latent variables and structural relationships (Wetzels et al.,
2009). Thus, it permits hypothesis testing. Furthermore, bootstrapping offers advantages
over other resampling methods, such as jackknifing, as it allows for calculating confidence
intervals other than those calculated from a normal distribution and permits the use of a
larger number of samples (Chin, 1998a).
Conducting bootstrapping using SmartPLS results in the following: weight and loading of
outer (measurement) and inner (structural) models, path coefficient, total effect, T-
statistics, standard deviation, and standard error (Guenzi et al., 2009; Wetzels et al., 2009).
Number of resamples can be specified as 100 or higher (e.g., 200) to obtain more
reasonable standard error estimates (Tenenhaus et al., 2005). Estimating parameters of
bootstrapping include three methods that are available in SmartPLS: standard, individual
sign changes, and construct level changes.
1. Standard (called “no sign change” in SmartPLS): In this choice, the software will
calculate the equation without considering the sign change in each variable. For example,
if certain items in the questionnaire are worded negatively, the calculation will be affected.
Tenenhaus et al. (2005) did not recommend the use of this parameter because it may yield
very high standard errors and, consequently, low t-value.

158
2. Individual sign changes: Tenenhaus et al. (2005) did not recommend this choice also
because the sign in each resample is consistent with that in the original sample without
ensuring a global coherence. However, this parameter “seems to be a good procedure in the
case where all signs in the same block are equal, at the original sample level” (Tenenhaus
et al., 2005, p. 177).
3. Construct level changes (default in SmartPLS): This parameter is preferred to avoid the
shortcomings of the previous two parameters; however, it has some shortcomings when
used with formative measurements (Tenenhaus et al., 2005).
The researcher tested the effect of changing the parameters on the results of bootstrapping.
The influence of changing parameters on decoupling of diversity construct (part of
fragmentation) was observed. With “no sign change,” the t-value was very low at 0.99
while standard error was quite high at 0.7. When choosing “construct level changes,” the t-
value increased dramatically to 19 with a considerably lower standard error of 0.04. Given
this, it may be interpreted that some items that measure decoupling of diversity were
worded negatively. Thus, the current study utilized construct level change for the
bootstrapping procedure.
Blindfolding, on the other hand, involves omitting “one case at a time and reestimating the
model parameters based on the remaining cases, and predicting the omitted case values on
the basis of the remaining parameters” (Duarte & Raposo, 2010, p. 471). This procedure
can be used to calculate the cv-com and cv-red (Duarte & Raposo, 2010; Guenzi et al.,
2009), which indicate the quality of outer and inner models as stated previously.

159
The procedure of blindfolding in SmartPLS involves identifying the “omission distance” or
G value. A values of G between 5 and 10 is feasible (Chin, 1998b). Tenenhaus et al. (2005,
p. 174) stated that Wold recommended G = 7, which is also the default in SmartPLS.
However, Duarte and Raposo (2010) indicated that a larger value of G shall be used with
complex models.
5.14 Mediating Test
The current study will test the influence of enablers as mediating or intervening variables
between fragmentation and project learning. According to Hair et al. (2006, p. 866)
“mediating effect is created when a third variable/construct intervenes between two other
related constructs.” To test whether enablers are really mediating constructs, as assumed in
the theoretical model, the current study follows the procedures presented in (Cohen &
Cohen, 1983 cited in Hair et al., 2006).
The procedure involves observing the influence of the mediator once it is included in the
model. If the relationship between fragmentation and both intra- and inter-project learning
remains significant and unchanged once enablers (i.e., mediators) are included in the
model as an additional predictor, then mediation is not supported. If the relationships
between fragmentation and both intra- and inter-project learning are reduced but remain
significant when enablers are included in the model, then partial mediation is supported.
Lastly, if the relationships between fragmentation and both intra- and inter-project learning
are reduced to a point where it is not significantly different from zero after the enablers are
included, then full mediation is supported. In fact, this technique is similar to that proposed

160
by Baron and Kenny (1986). Examples of studies used this technique in PLS include
Wetzels et al. (2009) and Guenzi et al. (2009). Wetzels et al. (2009) adopted the procedure
of Baron and Kenny (1986) and Holmbeck (1997), and conducted the following steps:
1) Estimating a model that contains only the direct relationship (independent latent
variable and dependent latent variable);
2) Estimating the indirect effect of mediating variable;
3) Observing the magnitude difference between direct and indirect effect (β, z, and p);
4) Conducting the incremental F to test whether including the direct effect of IV on
DV significantly increases the explained variance for DV;
5) Estimating standard error using bootstrapping, which appears to be more
appropriate than the method proposed by (Sobel, 1982); and
6) Reporting the results (i.e., stating whether the mediator has no, partial, or full
mediating effect).
SECTION II: DATA COLLECTION AND RESULTS
5.15 Sampling Design
The current study utilizes purposive sampling categorized under non-probability sampling
(Babbie, 2010; Cavana et al., 2001). Using this type of sampling suits the exploratory
nature of research and involves several advantages, such as ease of identifying sample and
collecting data (Cavana et al., 2001). Purposive or judgmental sampling can be selected
based on the purpose of the study and knowledge about the population and its elements

161
(Babbie, 2008). Unlike probability sampling, generalizing the finding of this kind of
sampling to the population is difficult (Bryman, 2004). However, purposive sampling can
provide a general understanding of the topic on hand (Babbie, 2010).
Purposive sampling can be used when the sample possesses desirable information and
conforms to some criteria set by the researcher, as stated by (Cavana et al., 2001). This
sampling is suitable when the population of the study is difficult to identify (Babbie, 2010)
or when there is a trade-off between time and cost (Cavana et al., 2001).
Sample size of non-probability sampling does not appear to follow a rigorous procedure.
This is because the purpose of sampling in this case is not to ensure a representative of the
sample to the population. Method of data analysis can affect sample size. For example,
Cavana et al. (2001) recommended that the sample size should be several time the number
of variables in the study. Hair et al. (2006) recommended a minimum ratio of 1:5 variables
to cases (i.e., respondents). However, number of cases should not be less than 100 to run
multivariate analysis, specifically factor analysis (Hair et al., 2006). However, partial least
squares (PLS) does not require a large sample size to run the analysis because it involves a
non-parametric test (Chin & Dibbern, 2010; Chin & Newsted, 1999; Fornell & Bookstein,
1982; Hulland et al., 2010).
5.15.1 Choosing the sample
Samples of the current study include selected building projects, which were at the
construction stage during the course of the current study. These projects are expected to
show some complexity in terms of size, number of professionals involved, and diversity of
specializations. These features permit testing the phenomenon of the current study. Thus,

162
the selected projects are that undertaken by Grade 7 (G7) contractors. Contractors under
this grade are eligible to procure for projects with no limited value (CIDB, 2011).
The researcher decided to approach projects in Kuala Lumpur and Selangor states, which
were convenient to access. The CIDB website (http://www.cidb.gov.my/v6/) provided
some information that indicated the characteristics of G7 projects. These projects were
categorized into residential, commercial, social amenities, industrial, administration,
security buildings, mix development, and others (CIDB, 2011).
In addition, the projects can be categorized according to the source of funding:
government, private, and mixed. They can also be categorized according to the
procurement method: conventional (traditional); design and build; turnkey; build, operate,
and transfer (BOT); and so on. It is noted that majority of projects are residential, funded
by private developers, and most are procured using the conventional method.
The target respondents (unit of analysis) of the questionnaire survey are professionals
working in project sites. The said professionals include project managers, project
engineers, project consultants, and other professionals in the site. Further explanation on
the respondents can be found in another section in this chapter.

163
5.16 Developing and Pre-testing the Questionnaire Survey
Prior to distributing the final questionnaire to respondents, conducting a pre-test is
important. Pre-test of the questionnaire, a process of developing the measurement
instrument, includes content validity, face validity, and pilot study (Cavana et al., 2001;
Creswell, 2008). Content validity refers to the extent to which content of the used items are
related to the construct/variable they are assigned to (Straub et al., 2004). According to
Dunn et al. (1994), items in the survey could be derived from existing literature to ensure
high content validity. The purpose of face validity is to ensure that items are clear and
understandable, and to check whether items appear to measure the concepts being
investigated. On the other hand, the purpose of the pilot study is to ensure that the
instrument as a whole functions effectively (Bryman & Bell, 2007). Further elaboration of
content validity, face validity, and pilot study is provided in the following sections.
5.16.1 Content validity
According to Cavana et al. (2001), the purpose of content validity is to ensure that the
instrument adequately measures the concept according to three ways: relevant literature or
theories, previous research, and judgment of experts and the researcher. All items in the
instrument of the current study were gathered from two main sources: previous relevant
literature and qualitative study (refer to Chapters 3 and 4). The researcher further validated
the adequacy of items to measure the concepts by seeking the judgment of experts (Cavana
et al., 2001). As illustrated in Appendix (B), the researcher sought the opinion of four
academics in the field to validate the content of instrument. The academics were asked to
provide their opinion on the adequacy of each item to measure the four constructs of the
study (i.e., fragmentation, intra-project learning, inter-project learning, and enablers of

164
project learning). They were asked to rate each item in terms of relevance and importance
based on a four-point scale: “neither relevant nor important”; “relevant”; “important”; or
“relevant and important.” Lastly, the academics were asked to add any missing item to the
questionnaire that they deem relevant and important. Based on the results of content
validity, some items in the questionnaire were eliminated or added.
5.16.2 Face validity
Face validity may be conducted in line with the pilot study (Cavana et al., 2001). The
questionnaire survey of the pilot study was self-administered (i.e., distributed and collected
by the researcher). This allowed the researcher to ask respondents about clarity and
accuracy of each item. Upon conducting face validity, the researcher decided either to
change the wording of some questions or to delete/replace redundant items.
5.16.3 Pilot study
The purpose of the pilot study is to test whether respondents are capable of completing the
survey and whether they can understand the questions (Creswell, 2008). According to
Bryman and Bell (2007), the pilot study should be carried out on respondents who are not
part of the sample. Respondents should be a small set of comparable members of the
population to avoid the effect of sample representativeness (Bryman & Bell, 2007).
The researcher distributed the questionnaire survey on February 16, 2011. After exactly
one month, the researcher collected 31 valid questionnaires from 15 construction projects
in the Kuala Lumpur and Selangor territories. Table 5.3 illustrates the characteristics of the
sample of the pilot study. Variety of the sample may show different patterns of learning
within these projects. Respondents from these projects included project managers, project

165
engineers, consultants, and project coordinators. Variety of respondents is important to
obtain a better understanding of learning activities in projects from different perspectives
and opinions. Table 5.4 illustrates the respondents’ criteria.
Table 5.3: Characteristics of sample of the pilot study
No. Acronym-
Location
No. of
Respondents Category
Procurement
Method
Type of
Project
Value
(RM m.)
Completion
percentage %
1 Faculty Building-
KL 3 Gov. Conventional
Social
Amenities 50-100 41-60
2 Hospital -KL 3 Gov. Conventional Social
Amenities 100-300 61-80
3 Administration
Building-KL 2 Gov. Conventional
Non-
Residential 50-100 61-80
4 Faculty Building-
KL 2 Gov. Conventional
Social
Amenities 50-100 61-80
5 Hospital-KL 1 Gov. Conventional Social
Amenities 100-300 More than 80
6 Stadium-KL 1 Gov. Design &
Build
Social
Amenities 10-50 21-40
7 Condominium-
Selangor 2 Private Conventional Residential 10-50 More than 80
8
Primary &
secondary school-
Selangor
2 Gov. Conventional Social
Amenities 50-100 41-60
9 Bank-KL 1 Private Design &
Build
Non-
Residential
500-
1,000 21-40
10 Office Building-
KL 1 Private Conventional
Non-
Residential
- [no
answer] 61-80
11 Sport complex-KL 2 Gov. Conventional Social
Amenities 10-50 21-40
12 Administration
building-KL 4 Gov. Conventional
Non-
Residential 50-100 41-60
13 Library-Selangor 1 Gov. Conventional Social
Amenities
Less
than 10 More than 80
14 Hotel-KL 2 Private Conventional Non-
Residential 10-50 Less than 20
15 Bank-KL 4 Mix Turnkey Non-
Residential 100-300 21-40
Total Respondents 31

166
Table 5.4: Characteristics of respondents of the pilot study
Respondent Age Category Gender Education Level Position in project Ex p. Construction Profession
R 1 between 40-49 Male Bachelor degree Project Engineer - [no answer] -
R 2 between 30-39 Male Bachelor degree Project Engineer Between 11-15 years -
R 3 between 40-49 Male Bachelor degree Project Engineer Between 11-15 years -
R 4 less than 30 Female Bachelor degree Project Coordinator Less than 5 years Architect
R 5 between 50-59 Male Bachelor degree Project Coordinator Between 16 - 20 years -
R 6 between 40-49 Male Bachelor degree Project Manager More than 25 years -
R 7 between 30-39 Male Bachelor degree Project Consultant Between 6-10 years -
R 8 between 30-39 Male Bachelor degree Other Between 6-10 years -
R 9 between 40-49 Male Bachelor degree Project Manager Between 16 - 20 years -
R 10 between 30-39 Male Bachelor degree Project Coordinator Between 6-10 years -
R 11 between 40-49 Male Bachelor degree Project Manager Between 16 - 20 years -
R 12 between 40-49 Male High school Other Between 16 - 20 years -
R 13 between 30-39 Male Bachelor degree Project Manager Between 11-15 years Civil
R 14 between 40-49 Male High school Project Manager More than 25 years Architect
R 15 between 50-59 Male PhD Project Consultant Between 16 - 20 years QS
R 16 between 30-39 Female Master degree Project Consultant Between 6-10 years QS
R 17 between 50-59 Male Bachelor degree Project Consultant More than 25 years Civil
R 18 between 30-39 Female PhD Project Consultant Between 11-15 years QS
R 19 less than 30 Male Others Other Less than 5 years QS
R 20 between 40-49 Male Bachelor degree Other Between 16 - 20 years Civil
R 21 between 40-49 Male Master degree Project Manager Between 16 - 20 years Civil
R 22 between 30-39 Male Bachelor degree Other - Safety Officer
R 23 between 30-39 Male Bachelor degree Project Manager Between 11-15 years Civil
R 24 between 40-49 Male Master degree Project Consultant More than 25 years Civil
R 25 between 30-39 Male Master degree Project Consultant Between 6-10 years -
R 26 less than 30 Female Bachelor degree Project Engineer Less than 5 years QA/QC Eng.
R 27 between 30-39 Male Bachelor degree Project Engineer Between 6-10 years Civil
R 28 between 40-49 Male Master degree Project Director Between 16 - 20 years Civil
R 29 between 40-49 Male Bachelor degree Project Coordinator Between 11-15 years Civil
R 30 between 40-49 Male Bachelor degree Project Manager Between 21 - 25 years Civil
R 31 between 40-49 Male Bachelor degree Other Between 11-15 years Civil
5.16.4 Reliability of pilot study
Test of reliability was performed to check the internal consistency and stability of the
instrument (Cavana et al., 2001). In other words, this tested whether the instrument would
yield consistent answers when repeated. Test of reliability of the pilot study was conducted

167
using Cronbach’s alpha available in the SPSS package (version 19). The results revealed
that reliability of the whole instrument (including the four constructs) was high at .853. If
item deleted, scores of scales of fragmentation (FRAG), intra-project learning (INTRA),
inter-project learning (INTER), and enablers (SUP) are .817, .758, .801, and .869,
respectively (refer to Table 5.5). According to Malhotra (2003), Cronbach’s alpha of .60
and above indicates good reliability. These results are encouraging to develop the final
measurement instrument.
Table 5.5: Reliability of questionnaire survey of the pilot study
Scale Mean if
Item Deleted
Scale Variance
if Item Deleted
Corrected Item-
Total Correlation
Cronbach's Alpha
if Item Deleted
FRAG 11.2246 .969 .684 .817
INTRA 11.0628 .929 .824 .758
INTER 11.1174 .981 .724 .801
SUP 11.2512 1.052 .560 .869
The scale (all items) .853
5.17 Measurement Instrument
After conducting face validity, content validity, and pilot study, the final instrument was
developed. The final questionnaire form consists of a cover letter and an introduction to the
topic showing the aim of the survey and definition of terms. As illustrated in Appendix
(C), the questionnaire consists of a cover letter and five sections. Section I contains
demographic information about the respondents, including age, education level, years of
experience, gender, and so on. All questions in this section are categorical or dichotomous
questions. Section II includes 29 items that indicate fragmentation. Section III consists of

168
26 items that measure intra-project learning, while Section IV consists of 17 items that
measure inter-project learning. Section V consists of 27 items that measure enablers of
project learning.
Table 5.6 lists all items of these four constructs. All these items are rated using a five-point
Likert scale, ranging from 1 = Totally Disagree to 5 = Totally Agree (with the statement).
The respondents shall write down a number between 1 to 5 by each statement. Each
questionnaire survey requires 15 to 20 minutes to answer. Appendix C shows the
questionnaire survey form.
A single separated sheet was distributed to the project manager to obtain general
information about each project visited. This sheet consisted of general questions about the
project, including the name (if possible), location, grade of main contractor, type of
project, procurement method used, value of the project, and other information (refer to
Appendix C).
Table 5.6: Measurement items of fragmentation, intra-project learning, inter-project learning, and
enablers
No. Indicator/Variable Statement
Construct 1. FRAGMENTATION (indicators = 29)
1. Integration
1.1 Mutual objectives In this project me and other team members have the same objective and focus (no
individual objectives)
1.2
Seamless operation with
no organizational
boundaries
I form a single team with others though they come from different companies
1.3 Mutually beneficial
outcomes
Project’s outcomes and benefits will consider the whole project team rather than
individuals working in this project
1.4 Increased time and cost predictability
I can easily access to information related to design and construction cost of this project
1.5 Unrestricted cross-
sharing of information Information related to this project are well managed

169
No. Indicator/Variable Statement
1.6 Creation of single and
collocated team I work with all team members in one common site office
1.7 Equal opportunity for
project inputs
In this project all team members have the same chance to contribute in making
decisions about the work
1.8
Equitable team
relationships and respect
for all
In this project all team members are treated as having equal professional capability
1.9 No blame culture
There is no blame for individuals if a problem happen (group will take responsibility)
1.10 Problems will be solved by project team together rather than individuals
2. Coordination
2.1
Lateral Relationship
In this project, I can directly call other team members (for example designer and
other consultants)
2.2 I often have meetings with other team members (for example designer and other
consultants)
2.3 Information Technology Information Technology (IT) facilitates the coordination my work that is related to
other members
2.4 Interpersonal
Relationships I have long-term business relationship with most of the team members
2.5 Coordinator Role The coordinator of this project plays important role to bring different people together
3. Collaboration
3.1 Trust (relational) I trust other team members working in this project though they come from different
companies
3.2 Focus on the end-user
needs I, and other team member, focus on the need of the owner of this project
3.3 Self-governing team In this project, I and other team members have the freedom to organize our work for
better outcomes
4. Boundaries
4.1 Expertise boundaries In this project, I feel there are barriers between me and other professionals who have
different background
4.2 Cultural boundaries There are cultural barriers between me and other team members (especially those
from different ethnic groups)
4.3 Language boundaries There is a language barrier between me and other team members (especially those
from different ethnic groups)
4.4 Organizational
boundaries
I feel there is a barriers between me and other team members come from other
companies
5. Decoupling of Diversity
5.1 Diversity My contact with members who come from different background or discipline is
limited
5.2 Participation I, with members from different background, can participate in different tasks to make
appropriate decision-making (for example to solve a problem related to design)
5.3 Design clashes Clashes and discrepancies (omissions / errors of design) are difficult to resolve in this
project
5.4 Good relationship I have good relationship with most of project team (including contractor’s team and
consultants)
6. Spanning boundaries (for integrating diverse knowledge)
6.1 Spanning project
knowledge boundaries –
Contextual Knowledge
I need to get sufficient information from previous phases
6.2 I need to get sufficient information from other project consultants
6.3 It is difficult for me to understand some information from other occupational or disciplinary group
Construct 2. INTRA-PROJECT LEARNING (indicators = 26)
1. Knowledge Creation
1.1 Informal dialogue I often have informal dialogue with other team members (example a discussion over
coffee break)
1.2 Contact external
consultant I often contact external consultant if there is a new idea or problem to discuss
1.3 Face-to-face interaction I communicate with experts face-to-face (in-person) to get some experience or
information
1.4 Periodic meetings I attend frequent meetings with experts to discuss issue related to this project
1.5 Group discussion Normally I attend group discussions about certain issues or problems related to this
project
2. Collective Learning
Table 5.6: Measurement items of fragmentation, intra-project learning, inter-project learning, and
enablers (Cont’d)

170
No. Indicator/Variable Statement
2.1 Opportunities for inquiry I am always encouraged to ask questions about issues related to the project
2.2 Mistake admission I can tell about mistakes I do freely
2.3 Problem solving
I consider that solving problems in this project is efficient (example resolving design
clashes or omissions)
2.4 When problem happen we will report to upper management
2.5 Understanding In this project, we have to identify the causes of problems happen in the site
2.6 Absorb new technology In this project, I have implemented new technology / technique
3. Knowledge Sharing
3.1 Trust (knowledge sharing)
I trust other team members so I can share my experience with them freely
3.2 Communication I have been able to directly contact all people in this project
3.3 ICT Information Communication Tools (ICT) facilitates my communications with other
members in this project
4. Environment / Leader Support
4.1 Delegation Project leader delegate some of his work to me and to other team members
4.2 Supporting collaboration
I am encouraged to collaborate with new colleagues
4.3 It is always appreciated when we collaborate with people from other companies
4.4 Learning from mistakes We need to learn from mistake and not to be punished for trying new things
4.5 Second chance We deserve to have second chance if we made mistakes
5. Openness and influence
5.1 Open discussions I can have an open (frank) discussion about issues or problems related to this project
5.2 Alternative working
method We always try to find alternative ways of working method
5.3 Telling others’ mistakes I always tell persons people see doing wrong or using insufficient method
6. Ibert’s Theory
6.1 Knowledge in action In this project, interaction with other team members has polished my experience
6.2 Decoupling of routines We always follow the common routines/standards of doing work in this project
6.3 Task commitment
I feel that this project is a challenging task for me
6.4 I am committed to the main objective of this project
Construct 3. INTER-PROJECT LEARNING (indicators = 17)
1. Experience Accumulation
1.1 Person-to-person
communication
In this project, mostly we communicate face-to-face other than other ways (e.g.
telephone, email etc.)
1.2 Informal encounters Usually I see team members off-the-project for informal gathering or activities
1.3 Imitation I use some ideas/techniques from other projects and implement it in this project
2. Knowledge Articulation
2.1 Intra-project
correspondents
Usually I contact people in other project to discuss about certain issues related to this
project
2.2 Debriefing meetings We conduct special meetings to obtain some useful information oabout the project
2.3 Brainstorming sessions I attend brainstorming sessions with colleagues to discuss certain problems
2.4 Formal project reviews In this project we conduct investigation to review some problems and identify their
causes
2.5 Ad hoc meetings Other than the regular meetings, I attend meetings when something urgent need to be discussed
2.6 Lessons learnt sessions I attend meetings/activities to develop lessons that can be learned from this project
3. Knowledge Codification
3.1 Project plan/audit Project plans are recorded clearly so can be kept for future usage
3.2 Milestone deadlines Important information as project milestones are recorded clearly
3.3 Meeting minutes Meeting minutes in this project will be kept for future usage
3.4 Project history files This project has a compiled record of ‘project history’
3.5 Intra-project database There is a database in this project so I can record important issue or lesson that can be learned in future projects
4. Networking
4.1 Visiting other projects I visited other projects during this project
4.2 Transfer ideas to main
office I contact some colleagues in the main office in the company
4.3 Communication with
others It is easy to find people in this project or other project to answer my inquiries
Construct 4. ENABLERS OF PROJECT LEARNING WITHIN FRAGMENTATION (indicators = 27)
1. Results of the qualitative study
Table 5.6: Measurement items of fragmentation, intra-project learning, inter-project learning, and
enablers (Cont’d)

171
No. Indicator/Variable Statement
1.1 Meetings I need to attend more meetings to share experience and exchange knowledge
1.2 Spirit of project team There is a need for everybody to feel the spirit of one project team
1.3 Organizational policy Being open to everybody in the project is one of my company’s policies
1.4 Client role Project owner has important role to play in getting different project team together
1.5 Incentives I am willing to share my experience if I get appropriate incentive (monetary incentive
for example)
1.6 Business relationship I share my experience only with people who I have long-term business relationship
1.7 Sharing with friends I share my experience with my friends only
1.8 Mutual benefits I share my experience with other members if there are benefits for all of us and for the project
1.9 Learning as project’s
goal It is important to set learning as one of the project’s goals
1.10
Supporting dialogue,
conversation and
discussion
This project needs more support from project leader for dialogue, conversations and
open discussions with everybody
1.11 Leader as a role model Our leader should show role model in open communication, honesty and show how
to trust others
1.12 Attitude of project
manager
Project manager attitude can influence my relationship with people from other
companies in this project
1.13 Supporting good relationship
Project manager/leader has to encourage us to build up good relationship with every team members
1.14 Project culture We need to be committed to respect each other’s views
2. Boundary Crossing Objects (BCO)
2.1 Institutionalized BCO to
build up shared meaning
Drawings and specification of this project play important role to facilitate ideas and
experience sharing
2.2 Construction contract can play important role to obligate experience sharing between
project team
2.3 Non-institutionalized
BCO to build up shared meaning
We need more support to be trusted by other team members especially those from
other companies
2.4 I need to feel that my experience is valuable for other team members
2.5 IT / ICT ICT tools (as video conferencing etc.) will be useful for better communication with
other project team (e.g. the designer)
3. Sense’s Model (Situated Learning Theory)
3.1 Learning relationships I think it is important to know each other’s experience and abilities so we can share
knowledge better
3.2
Cognitive style
I prefer to learn by thinking of different ways of doing things and like to challenge
the current standards in this project
3.3 I prefer to learn by looking at how things are being done and I found changing the
existing standards very difficult
3.4
Learning mandate
The setting of site office allow for better communication with everybody
3.5 I have enough time to discuss and share experience with other team members
3.6 This project has the appropriate resources for learning
3.7 Pyramid of authority
I understand my role in sharing experience and learning in this project
3.8 I like to make decisions about the way I can learn from this project
5.18 Data Collection
The sample used for the pilot study was excluded from this stage. Data collection lasted for
three months, starting from April 12, 2011 until July 15, 2011. The researcher distributed
the questionnaire survey to building projects granted access and conducted by G7
contractors in Kuala Lumpur and Selangor. The study targeted only professionals work ing
Table 5.6: Measurement items of fragmentation, intra-project learning, inter-project learning, and
enablers (Cont’d)
172
in the project site to record their opinion on the practice of project learning as well as the
influence of fragmentation. Data collection was self-administered; the researcher visited,
distributed, and collected the questionnaire by hand. Reaching respondents within the
construction site was difficult to achieve using mail or e-mail. A number of questionnaires
were distributed and collected by two enumerators. This expedited the process of data
collection.
The total number of respondents approached was approximately 650 in the project sample.
However, only 203 valid questionnaires were collected. This represents a respondent rate
of approximately 31%. Questionnaires were collected from 36 accessed projects. On
average, approximately six respondents in each project answered the questionnaire survey.
Prior to conducting the analyses, satisfying certain requirements of multivariate data
analysis is important (Hair et al., 2006). The following elaborates the examination of data
for multivariate analysis.
5.19 Examining Data for Multivariate Analysis
Multivariate analysis involves simultaneous analyses of three or more variables (Bryman,
2004). Examining collected data is essential before commencing the multivariate analysis.
Data examination helps to obtain truly valid and accurate results and include, but not
limited to the following: missing data, outliers, and test of normality (Hair et al., 2006).
The following paragraphs elaborate these in detail.
173
5.19.1 Missing data
Missing data can serve as threat to the distribution of data and quality of results. In some
questionnaire forms, there must be some lift-out questions that respondents forget or
decline to answer or to tick the appropriate response. According to Hair et al. (2006),
understanding the causes of missing data before selecting an appropriate remedy is
important. Hair et al. (2006) identified the following steps to manage missing data:
1. Determine type of missing data: This process involves understanding the causes of
missing data. Some missing data are ignorable; in such cases, no specific remedy is
required. Other missing data can be categorized as known and unknown. According to Hair
et al. (2006), known reasons include procedural factors such as errors in data entry,
disclosure restriction, failure to complete the entire questionnaire, or even morbidity of
respondents. Remedies for this type of missing data are applicable if missing data are
found to be random. Unknown missing data processes are related to respondents. For
example, respondents refuse to respond or possess insufficient knowledge. Both known
and unknown missing data were found in the data set of the current study. Errors in data
entry (known reason) were corrected accordingly. Remedies for unknown missing data will
be illustrated in the following steps.
2. Determine the extent of missing data: The extent of missing data can be examined by
considering the percentage of variables and number of cases with missing data. Less than
10% of missing data for individual cases can be ignored, unless it occurs in specific
nonrandom manner, while cases with 50% or more shall be deleted (Hair et al., 2006). In
the current study, all cases have less than 10% missing data for each individual case (refer

174
to Appendix D for table on missing data analysis). The extremist case has only five
missing data, which account for merely 4% of overall data. The low percentage of missing
data is affected possibly by the design of questionnaire (itemized scale requests the
respondents to write down a number instead of ticking on a box). Hence, the researcher
decided to retain all cases with missing data and conduct the appropriate remedy. In
addition, 14.9% of non-factual variables have missing data. The researcher decided not to
delete any variable, but rather to utilize the suitable imputation method, as will be shown in
the following paragraphs.
3. Diagnose the randomness of missing data: According to Hair et al. (2006), there are two
levels of randomness: missing at random (MAR) and missing completely at random
(MCAR). As the level of missing data for each case was not sufficient to warrant action
(only 4%), the researcher decided to consider the missing data as MCAR. The next step is
to choose the appropriate imputation method for missing data remedy.
4. Select the imputation method: There are several methods for managing missing
completely at random (MCAR) data. These include imputation using only valid data
(including complete case approach and using all-available data) and imputation by using
replacement values (including using known replacement values and calculating
replacement values) (Hair et al., 2006).
The researcher decided to use the all-available data imputation method to analyze the
missing data. In SPSS, PAIRWISE represents this method. The decision was also made
based on the following criteria:

175
Level of missing data is relatively low.
Sample size is not large enough to call for other methods that exclude missing data
from the analysis (e.g., LISTWISE).
The relationship between variables is considered to be moderated (no need to use
methods that depend on using replacement values as the mean).
5.19.2 Outliers
Outliers can be defined as observation with a unique combination of characteristics that
differ from other observations (Hair et al., 2006). Outliers, in some cases, can be caused by
errors in data entry. Boxplots can be used to identify any outlier that occurred due to errors
in data entry or other errors. The plot can show any value ranging beyond the normal range
of the scale, particularly above 5 or below 1, except the pre-defined values of missing data
(e.g., 99).
According to Hair et al. (2006), outliers can be classified into procedural error (must be
corrected), extraordinary event, extraordinary observation (has no explanation and can be
omitted unless it represents the population), and unique in their combination of value
across the variables. There are three methods to detect outliers : univariate detection,
bivariate detection, and multivariate detection (Hair et al., 2006). This study used both
univariate detection and multivariate detection. Bivariate detection was not considered as
scatterplots, which are used to demonstrate the relationship between pairs of variables,
require a significant number of plots.

176
1. Univariate detection: Detecting univariate outliers involves converting data values to
standard scores with a mean of 0 and standard deviation of 1 (Hair et al., 2006). The
following steps demonstrate how data in the current study were converted into standard
score using SPSS (version 19):
From Analyze, choose Descriptive Statistics, then choose Descriptives.
Choose all the metric variables and tick on the box “Save standardized values as
variables”.
In data view, we can observe that the program adds new variables starting with the
letter Z followed by the original name of our variables (e.g. , ZFrag1).
Standardized variables with values up to ± 4 were considered as probable outliers (Hair et
al., 2006). The researcher identified 15 probable univariate outliers within 11 cases. The
decision to eliminate outlier cases will depend on whether these cases are aberrant and do
not represent the population (Hair et al., 2006). The researcher decided to eliminate cases
that have more than one outlier, and whose respondents are non-experts (i.e., respondents
who are below 30 years old, do not have a degree, or have less than five years of
experience in construction). Thus, six cases were eliminated from the data set.
2. Multivariate detection: The researcher used Mahalanobis D2 measure to detect any
outlier of multivariate combination of variables. The value that resulted from dividing the
D2 by the number of variables involved (i.e., D2/df) should be less than 3 or 4 in large

177
samples with significance level of .005 or .001 (Hair et al., 2006). SPSS produced a
variable called (MAH_1) that showed the scores of D2. The researcher computed the
probability of MAH_1 using the compute command in SPSS (version 19), as shown in the
following:
From Transform, choose Compute Variable.
Choose Cdf.Chisq from Function Group.
Assign (MAH_1) to this function, followed by comma, followed by the number of
dependent variables.
Choose a name for the new computed variable in the Target Variable (e.g.,
P_MAH_1).
Click on OK and notice the new added variable (P_ MAH_1) in the Data View.
The current study identified three cases that have probable multivariate outliers. The
researcher observed that outliers of multivariate variables were not the same as univariate
variables. The decision to eliminate or keep these outliers again depended on whether these
cases were aberrant and did not represent the population. Respondents of these three cases
had little experience and their answers were not highly consistent. Therefore, the
researcher decided to eliminate these from the analysis.
Thus, the total number of eliminated cases was nine. This reduced the number of the
sample from 203 to 194 cases. The researcher believes eliminating these cases will not
influence the results as they represent a trivial percentage of the total number of cases.

178
5.19.3 Test of normality
Test of normality is important because large non-normality distribution results in invalid
statistical tests (Hair et al., 2006). Some tests of normality include Shapiro-Wilks and
Kolmogorov-Smirnov tests. In addition, normality can be tested statistically using the
following equations (Hair et al., 2006):
Zsk =
………………………………………………..(5.6)
(value of Zsk should be ± 2.58.)
Zku =
………………………………………………...(5.7)
(value of Zku should be ± 1.96.)
The current study will not perform rigorous tests of normality. This is because partial least
squares-path modeling (PLS-PM) analysis does not necessitate normal distribution of the
sample (Chin & Dibbern, 2010; Chin & Newsted, 1999; Fornell & Bookstein, 1982). More
discussion on this point can be found in a previous section on PLS in this chapter.
5.20 Reliability of Measurement Scale
Test of reliability of the final instrument was conducted using SPSS (version 19). The
whole scale obtained quite a high result of .842 of Cronbach’s alpha. This indicated a good
reliability of measurement scale. For fragmentation scale, the result of Cronbach’s alpha
was quite satisfactory. Fragmentation (FRAG) obtained .768, as shown in Table 5.7. On
the other hand, intra-project learning (INTRA-PL) and inter-project learning (INTER-PL)

179
obtained higher results at .858 and .852, respectively. The last measurement scale, enablers
of project learning (SUPP), obtained the highest results among the other scales with .880
of Cronbach’s alpha.
Table 5.7: Reliability of the questionnaire survey
Construct N of Items Cronbach's Alpha
FRAG 29 .768
INTRA-PL 26 .858
INTER-PL 17 .852
SUPP 27 .880
The scale (all items) 99 .842
5.21 Descriptive Analysis
This section intends to show a general picture of the data. This includes frequencies of
projects (i.e., sample) and frequencies of respondents (i.e., unit of analysis). Descriptive
statistics include describing single variables and/or the associations between variables
(Babbie, 2010). Univariate analysis denotes describing single variables, while bivariate
analysis is concerned about analyzing two variables to uncover their relationship (Bryman
& Bell, 2007). The current study shows the univariate descriptive statistics of each
categorical variable only.
5.21.1 Frequencies of projects
For the survey, the total number of selected projects is 36 building projects. All projects
were undertaken by G7 contractors. Table 5.8 provides information about the projects,
which included project sectors, procurement method used, and other information. Value of

180
projects, number of firms, and number of team members can indicate the size and
complexity of projects. Table 5.9 summarizes the frequency of all projects. Appendix (E)
shows the distribution of the projects in plot- form.
Table 5.8: Information of the sample projects
No. Project’s
Acronym Sector
Procurement
Method
Completion
Percentage % Category
Value
(RM m)
No. of
Firms
No. of team
members
1 Hotel & Office Private Conventional Less than 20 Mix
development
between
501-1000
between
5-14 11
2 Administration
Building Government D&B Less than 20
Non
residential
between
301-500
between
15-24 20
3 Shopping Mall Private Conventional More than 81 Non
residential
between
101-300m.
between
5-14 30
4 Office Building Government Conventional Between 21-
40
Social
amenities
between
51-100
between
35-44 5
5 Opuleria Private Others Less than 20 Infrastructure
8
6 Bank Private D&B Between 21-
40
Non
residential
between
301-500
between
5-14 26
7 Apartment & shop Mixed Turnkey Between 61-
80 Residential
between
51-100
between
15-24 10
8 Hospital Government Turnkey Less than 20 Social
amenities
between
301-500
more
than 45 50
9 Condominium Private D&B Between 21-
40 Residential
between
301-500
between
15-24 16
10 Condominium Private D&B More than 81 Residential between
301-500
between
15-24 20
11 Condominium Private Conventional Less than 20 Residential between
101-300
between
5-14 15
12 Central Park Private Conventional Less than 20 Mix
development
between
101-300
between
5-14 13
13 Condominium Private D&B Between 41-
60 Residential
between
301-500
between
15-24 15
14 Boulevard Plaza Private D&B Between 41-
60
Non
residential
between
101-300
between
5-14 20
15 Condominium Private Conventional Between 41-
60 Residential
between
51-100
between
5-14 20
16 Office Private Conventional Between 21-
40
Non
residential
between
10-50
between
5-14 10
17 Airport Mixed D&B Between 21-
40 Infrastructure
between
501-1000 60
18 Condominium Private Conventional Less than 20 Residential between
101-300
between
15-24 8
19 Condominium Private Conventional Between 61-
80 Residential
between
501-1000
between
25-34 15
20 Commercial
Building Private D&B
Between 21-
40
Mix
development
between
101-300
between
5-14 10
21 Hotel Private Conventional Between 41-
60
Non
residential
between
51-100
more
than 45 30
22 Education
Building Government Conventional More than 81
Social
amenities
between
101-300
between
5-14 15
23 Faculty Government Conventional More than 81 Social
amenities
between
51-100
between
5-14 10

181
No. Project’s
Acronym Sector
Procurement
Method
Completion
Percentage % Category
Value
(RM m)
No. of
Firms
No. of team
members
24 Office Tower Private Conventional Between 41-
60
Non
residential
between
101-300
between
5-14 25
25 Condominium Private D&B Less than 20 Residential between
301-500
between
5-14 10
26 Condominium &
Shopping Mall Mixed D&B
Between 61-
80
Mix
development
between
51-100
between
15-24
27 Condominium Private Conventional Between 41-
60 Residential
between
101-300
between
15-24 25
28 Hospital Government D&B Between 61-
80
Social
amenities
between
101-300
between
25-34 40
29 Office Mixed Conventional Less than 20 Non
residential
between
501-1000
between
25-34 30
30 Commercial
Retails & Hotel Private Conventional
Between 41-
60
Mix
development
between
301-500
between
5-14 15
31 Condominium &
Shopping Mall Private Conventional
Between 21-
40
Mix
development
between
101-300
between
5-14 8
32 Condominium &
Shopping Mall Private Conventional
Between 21-
40
Mix
development
between
51-100 13
33 Residential Units Private D&B Between 21-
40 Residential
between
51-100
between
5-14 15
34 Condominium Private Conventional Between 41-
60 Residential
between
101-300
between
5-14 2
35 Complex Centre Private Conventional Between 41-
60
Social
amenities
between
51-100
between
5-14 10
36 Residential Units Private Conventional Between 41-
60 Residential
between
101-300
between
25-34
20 (Total ≈
650)
*Blank fields indicate missing data
Table 5.9: A summary of distribution and frequencies of the selected projects
Project
Information Details [Frequency] Total
Sector Private [26] Government [6 ] Mixed [4]
36
Procurement
method
Conventional
[21]
Design and
Build [12] Turnkey [2]
Build, Operate,
Transfer [0] Others [1] 36
Completion
percentage
Less than
20% [9]
Between 21-
40% [9]
Between 41-
60% [10]
Between 61-80%
[4]
More than
81% [4] 36
Type Residential
[13]
Non Residential
[8]
Social
Amenit ies [6]
Mix
Development [7] Others [2] 36
Value (RM
Million)
Between 10-
50 [1]
Between 51-
100 [9]
Between 101-
300 [13]
Between 301-
500 [8]
Between 501-
1000 [4 ]
34 (2
missing)
No. of firms
in projects
Between 5-14
[18]
Between 15-24
[8]
Between 25-
34 [4]
Between 35-44
[1]
More than 45
[2]
33 (3
missing)
Table 5.8: Information of the sample projects (Cont’d)

182
5.21.2 Frequencies of respondents
The total number of valid questionnaires is 203. However, after eliminating the outliers, as
indicated previously, the number of final cases was reduced to 194. Table 5.10 shows the
profile of respondents including age, years of experience, gender, position in the project,
background of respondents and experience in project review or audit. Most of the
respondents are aged between 40-49 (34.5%) and majority of them hold a bachelor’s
degree (58.8%). Most respondents have working experience between 11-15 years in the
construction industry. The respondents are a homogenous sample of project managers,
consultants, project engineers, resident engineers, and other professionals with different
backgrounds. Appendix (E) shows the distribution of respondents in scatter plot.
Table 5.10: Frequencies of respondents
Age of respondent
Frequency Percent Valid Percent Cumulat ive Percent
Valid less than 30 36 18.6 18.6 18.6
between 30-39 60 30.9 30.9 49.5
between 40-49 67 34.5 34.5 84.0
between 50-59 30 15.5 15.5 99.5
more than 59 1 .5 .5 100.0
Total 194 100.0 100.0
Education level of respondent
Frequency Percent Valid Percent Cumulat ive Percent
Valid High school 9 4.6 4.7 4.7
Bachelor degree 114 58.8 59.1 63.7
Master degree 55 28.4 28.5 92.2
PhD 2 1.0 1.0 93.3
Other 13 6.7 6.7 100.0
Total 193 99.5 100.0
Missing 99 1 .5
Total 194 100.0
Years of experience in construction industry
Frequency Percent Valid Percent Cumulat ive Percent
Valid Less than 5 years 36 18.6 18.6 18.6
Between 6-10 years 42 21.6 21.6 40.2
Between 11-15 years 48 24.7 24.7 64.9
Between 16 - 20 years 43 22.2 22.2 87.1
Between 21 - 25 years 15 7.7 7.7 94.8
More than 25 years 10 5.2 5.2 100.0
Total 194 100.0 100.0
Gender of respondent

183
Frequency Percent Valid Percent Cumulat ive Percent
Valid Male 174 89.7 89.7 89.7
Female 20 10.3 10.3 100.0
Total 194 100.0 100.0
Position in the project
Frequency Percent Valid Percent Cumulat ive Percent
Valid Project Manager 26 13.4 13.5 13.5
Manager Assistant 18 9.3 9.4 22.9
Project Consultant 17 8.8 8.9 31.8
Project Engineer 46 23.7 24.0 55.7
Resident Engineer 30 15.5 15.6 71.4
Resident Architect 18 9.3 9.4 80.7
Other 37 19.1 19.3 100.0
Total 192 99.0 100.0
Missing 99 2 1.0
Total 194 100.0
Background
Frequency Percent Valid Percent Cumulat ive Percent
Valid Civil engineering 74 38.1 38.9 38.9
Architecture 54 27.8 28.4 67.4
QS 12 6.2 6.3 73.7
Mechanical engineering 37 19.1 19.5 93.2
Others 13 6.7 6.8 100.0
Total 190 97.9 100.0
Missing 99 4 2.1
Total 194 100.0
Experience in project reviews / audit
Frequency Percent Valid Percent Cumulat ive Percent
Valid Yes 68 35.1 35.4 35.4
No 124 63.9 64.6 100.0
Total 192 99.0 100.0
Missing 99 2 1.0
Total 194 100.0
5.22 Principal Component Analysis Procedures and Results
As stated previously, principal component analysis (PCA) was selected to extract
factors/components and summarize variables of each construct. It must be emphasized that
this method is aligned with the PLS approach (Chin, 1995). Collectively, there are four
main constructs, each being measured by number of variables. PCA analyses will be
conducted for each construct separately.
Table 5.10: Frequencies of respondents (Cont’d)

184
Different tests will be conducted to assess the appropriateness of factor analysis, which
include Kaiser-Meyer-Olkin (KMO), Bartlett, and goodness-of- fit (Hair et al., 2006). The
threshold of KMO is .60 (Tabachnick & Fidell, 1989). Bartlett’s test of sphericity
determined if the correlation matrix is an identity matrix, which implies meaningless factor
analysis (Field, 2000). The results should reveal the appropriate significance level.
5.22.1 Parallel analysis
This analysis will be conducted prior to PCA to identify the appropriate number of
extracted components. Traditional methods to determine the number of components
include identifying all factors that have eigenvalues equal to one or above, or observing the
cut-off point in the scree plot (Hair et al., 2006). As stated previously, O'Connor (2000)
developed a syntax for SPSS based on parallel analysis (Horn, 1965) to determine the
number of extracted factors either for PCA or for exploratory factor analysis. Appendix (F)
shows O'Connor’s syntax and the steps of conducting this analysis using SPSS. The output
of this analysis contains a plot called “Tsplot,” which is similar to scree plot but with near
horizontal lines crossing the main line of the eigenvalue. Factors above these crossing lines
will be determined as the appropriate number of extracted factors. Results of parallel
analysis and PCA of the four measurement models – namely, fragmentation, intra-project
learning, inter-project learning, and enablers – are shown in the following paragraphs.
5.22.2 Parallel analysis and PCA of fragmentation
The results of parallel analysis indicated four components of fragmentation as a fixed
number to be extracted when conducting PCA later on. As shown in the following Tsplot,
factors above the extraction line will be considered. Y-axis represents the eignenvalue

185
while X-axis represents the number of variables. The full output of parallel analysis can be
found in Appendix F (example is inter-project learning).
Figure 5.4: Tsplot of fragmentation
After determining the appropriate number of components to be extracted, principal
component analysis was conducted using SPSS (version 19). Criteria used to extract
factors of fragmentation using SPSS are as follows:
Extraction method: principal component analysis – number of extracted factor was
restricted by the results of parallel analysis (4 components);
Rotation method: Oblique (Promax – kappa = 4);
Missing data: excluding cases Pairwise; and
Factor loading ≥ .40 (Hair et al., 2006).
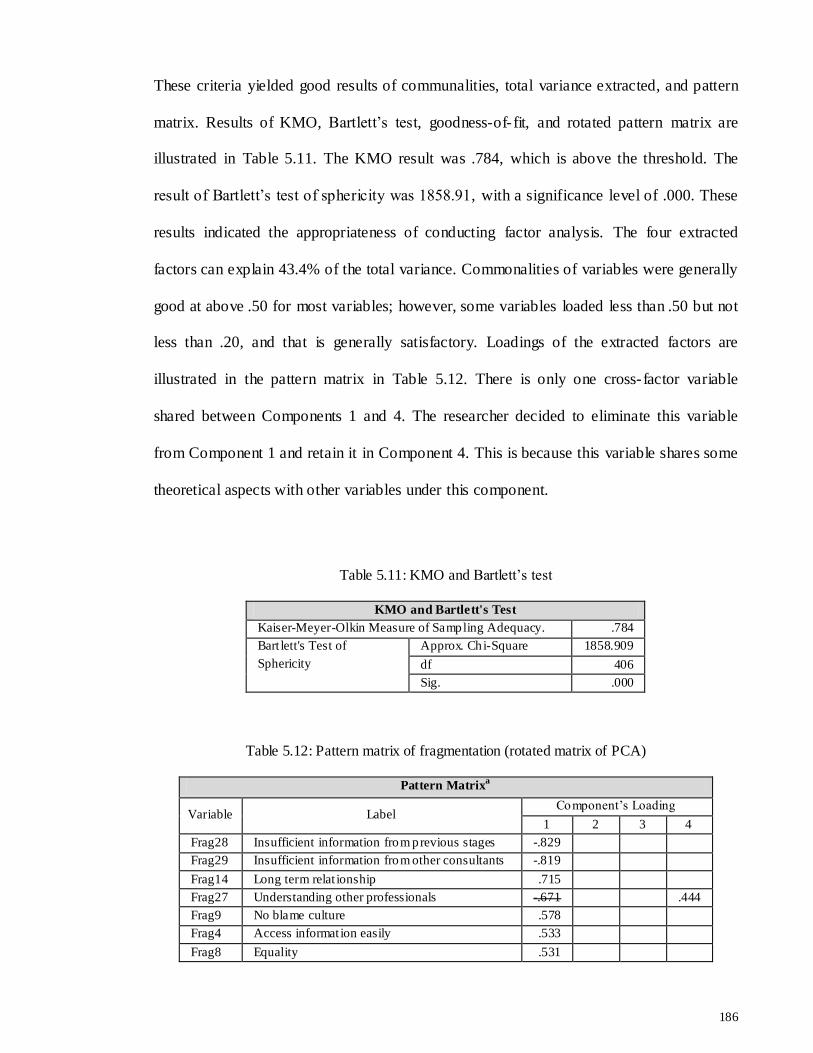
186
These criteria yielded good results of communalities, total variance extracted, and pattern
matrix. Results of KMO, Bartlett’s test, goodness-of- fit, and rotated pattern matrix are
illustrated in Table 5.11. The KMO result was .784, which is above the threshold. The
result of Bartlett’s test of sphericity was 1858.91, with a significance level of .000. These
results indicated the appropriateness of conducting factor analysis. The four extracted
factors can explain 43.4% of the total variance. Commonalities of variables were generally
good at above .50 for most variables; however, some variables loaded less than .50 but not
less than .20, and that is generally satisfactory. Loadings of the extracted factors are
illustrated in the pattern matrix in Table 5.12. There is only one cross-factor variable
shared between Components 1 and 4. The researcher decided to eliminate this variable
from Component 1 and retain it in Component 4. This is because this variable shares some
theoretical aspects with other variables under this component.
Table 5.11: KMO and Bartlett’s test
KMO and Bartlett's Test
Kaiser-Meyer-Olkin Measure of Sampling Adequacy. .784
Bart lett's Test of
Sphericity
Approx. Chi-Square 1858.909
df 406
Sig. .000
Table 5.12: Pattern matrix of fragmentation (rotated matrix of PCA)
Pattern Matrixa
Variable Label Co mponent’s Loading
1 2 3 4
Frag28 Insufficient information from previous stages -.829
Frag29 Insufficient information from other consultants -.819
Frag14 Long term relat ionship .715
Frag27 Understanding other professionals -.671 .444
Frag9 No blame culture .578
Frag4 Access informat ion easily .533
Frag8 Equality .531

187
Frag5 Well managed information .525
Frag13 Role of IT .478
Frag23 Good relationship with others .404
Frag7 Contribution b
Frag2 Single team
Frag10 Collective problem solving
Frag25 Participation .577
Frag1 Common objectives .561
Frag12 Regular meetings .531
Frag17 Focus on project owner's needs .496
Frag6 Common site office .475
Frag3 Project's outcomes consider whole team .462
Frag11 Contact others directly .456
Frag18 Freedom for self organizing team .408
Frag16 Trust
Frag20 Organizational barriers .819
Frag22 Cultural barriers .808
Frag21 Language barriers .801
Frag19 Professionals barriers .749
Frag24 Contact with other professionals .739
Frag26 Solving discrepancies - clashes .723
Frag15 Role of coordinator
Extraction Method: Principal Component Analysis.
Rotation Method: Promax with Kaiser Normalization.
a. Rotation converged in 7 iterations
b. The variables in italic font will be eliminated from further analysis as they score less than .40
Out of 29 variables indicating fragmentation, 24 were extracted under four components.
Names of the new components can be retained or changed according to the variables
loaded to them. According to Hair et al. (2006), a component can be assigned a name
according to the highest variable loaded to it. In addition, the name can be assigned
according to the whole set of variables representing the component. It is worth mentioning
that PCA changed the grouping of some variables under other components. For example,
some variables of integration, collaboration, and coordination were grouped under one
component, which may be named “Integration” as it contained majority of integration
variables.
Table 5.12: Pattern matrix of fragmentation (rotated matrix of PCA) (Cont’d)

188
Component 1 can be called “Spanning Knowledge across Boundary” (SKB) as variables
under this component indicate attributes of information and knowledge across different
stages of project and boundaries. Component 2 may be named “Integration” (INTEG) as it
involves majority of the variables of integration as in the theoretical framework.
Component 3 may be assigned the name “Barriers” (BARRIER) as it involves all variables
of the original construct in the theoretical framework. Lastly, Component 4 may be named
“Decoupling of Diversity” (DoD) as it also involves some items in the original construct.
5.22.3 Parallel analysis and PCA of intra-project learning
The results of parallel analysis of intra-project learning suggested one component as a
fixed number for extraction (refer to Figure 5.5). However, one factor or component does
not provide enough variance for the construct, so the decision was made to extract two
components to obtain better results.
Figure 5.5: Tsplot of intra-project learning

189
Principal factor analysis of intra-project learning construct was conducted using the
following criteria:
Extraction method: principal component analysis – number of extracted factor (2
components);
Rotation method: Oblique (Promax – kappa = 4);
Missing data: excluding cases Pairwise; and
Factor loading ≥ .40.
The results of KMO, Bartlett’s test, and pattern matrix are shown as follows:
Table 5.13: KMO and Bartlett’s test of intra-project learning
KMO and Bartlett's Test
Kaiser-Meyer-Olkin Measure of Sampling Adequacy. .833
Bart lett's Test of
Sphericity
Approx. Chi-Square 1416.899
df 325
Sig. .000
Table 5.14: Pattern matrix of intra-project learning (PCA results)
Pattern Matrix a
Variable Label Component
1 2
IntraPL21 Commitment to main ob jectives of project .813
IntraPL19 Collaboration support .602
IntraPL26 Project as challenging task .597
IntraPL1 Trust- knowledge sharing .536
IntraPL3 Face-to-face communicat ion .525
IntraPL8 Group discussions .517
IntraPL5 Contact team members directly .512

190
IntraPL9 Asking others .509
IntraPL2 Informal dialogue .453
IntraPL15 Identifying problem reasons .421
IntraPL11 Open discussion .400
IntraPL20 Collaboration with people from other companies b
IntraPL16 Report problems to upper management
IntraPL24 Interaction to polish knowledge
IntraPL13 Alternative ways of doing things
IntraPL17 Implement new technology or methods .772
IntraPL10 Mistakes admission .764
IntraPL4 Contact external consultant .660
IntraPL12 Tell others doing wrong .533
IntraPL6 Role of ICT .523
IntraPL25 Following the common routine of work -.454
IntraPL18 Delegate works .434
IntraPL14 Efficient problem solving .424
IntraPL22 No punishment for trying new things
IntraPL7 Frequent meetings
IntraPL23 Second chance
Extraction Method: Principal Component Analysis.
Rotation Method: Promax with Kaiser Normalization.
a. Rotation converged in 3 iterations.
b. The variables in italic font will be eliminated from further analysis as they score less than .40
Out of 26 variables in the original measurement, 19 variables were extracted to measure
intra-project learning. The new components may be named “(INTRAPL-1)” and
“(INTRAPL-2),” or any other name representing variables under each component. The
first component represents the “social” aspects of learning, such as face-to-face
communication, discussion, and so on. Meanwhile, the second component involves
“technical” aspects of learning, such as implementing new technology, problem solving,
and so on.
Table 5.14: Pattern matrix of intra-project learning (PCA results) (Cont’d)

191
5.22.4 Parallel analysis and PCA of inter-project learning
The same criteria of fragmentation and intra-project learning were used to determine the
number of components for inter-project learning. The results of parallel analysis suggested
two components of inter-project learning that should be extracted. As shown in the
following Tsplot, factors above the extraction line will be determined.
Figure 5.6: Tsplot of inter-project learning
Principal factor analysis of inter-project learning construct was conducted using the same
criteria as the ones employed in fragmentation and intra-project learning. The only
difference is the number of components to be extracted (two components). The results of
KMO, Bartlett’s test, and pattern matrix are shown in Tables 5.15 and 5.16.

192
Table 5.15: KMO and Bartlett’s test of inter-project learning
KMO and Bartlett's Test
Kaiser-Meyer-Olkin Measure of Sampling Adequacy. .859
Bart lett's Test of
Sphericity
Approx. Chi-Square 1248.744
df 136
Sig. .000
Table 5.16: Pattern matrix of inter-project learning (PCA results)
Pattern Matrix a
Variable Label Component
1 2
InterPL16 Visit ing other projects .855
InterPL5 Communicat ion with people from other projects .853
InterPL2 Informal gathering off the project .769
InterPL7 Brainstorming sessions .688
InterPL6 Debriefing meet ings .636
InterPL14 Project history .594
InterPL3 Networking .582
InterPL17 Transfer knowledge to main office .565
InterPL4 Using knowledge from other pro jects .488
InterPL10 Lessons learned sessions .449
InterPL15 Lessons learned database b
InterPL1 Face-to-face communication
InterPL12 Storage of important in formation .903
InterPL11 Storage of project plans .797
InterPL8 Review sessions .637
InterPL9 Ad hoc meetings .584
InterPL13 Storage of meeting minutes .451
Extraction Method: Principal Component Analysis.
Rotation Method: Promax with Kaiser Normalization.
a. Rotation converged in 3 iterations.
b. The variables in italic font will be eliminated from further analysis as they score less than .40
The results of PCA indicated 15 variables of inter-project learning. Only two variables
have been eliminated from further analysis as they scored loading of less than .40. Similar
to intra-project learning, the two components may be named (INTERPL-1) and
(INTERPL-2). Essentially, the first component represents the process of experience
accumulation to knowledge articulation. Meanwhile, the second component represents the

193
process of knowledge articulation to knowledge codification. This indicates the continuity
and intertwined process of inter-project learning. These findings will be discussed further
in the next chapter.
5.22.5 Parallel analysis and PCA of enablers
The criteria for determining the number of components of enablers of project learning
using parallel analysis are similar to the previous procedure. The results of parallel analysis
suggested three components of enablers of project learning to be extracted, as shown in the
following Tsplot.
Figure 5.7: Tsplot of enablers of project learning
Lastly, PCA of enablers of project learning construct was conducted using the same criteria
as above. The number of extracted components was restricted by three components. The
results of KMO, Bartlett’s test, and pattern matrix are shown in the tables below.

194
Table 5.17: KMO and Bartlett’s test of enablers of project learning
KMO and Bartlett's Test
Kaiser-Meyer-Olkin Measure of Sampling Adequacy. .845
Bart lett's Test of
Sphericity
Approx. Chi-Square 1734.034
df 351
Sig. .000
Table 5.18: Pattern matrix of enablers of project learning (PCA results)
Pattern Matrixa
Variable Label Component
1 2 3
SupPL1 More meetings .829
SupPL3 Company's policy to support openness .821
SupPL5 Individuals' ro le in learning .699
SupPL13 Trust support .616
SupPL30 Making decision about the way of learn ing .613
SupPL2 Spirit of p roject team .584
SupPL6 Enough resources for learn ing .583
SupPL15 Role of ICT tools .570
SupPL16 Setting learning as one of project's goals .551
SupPL27 Enough time for learning .460
SupPL23 Innovative way of learn ing .400
SupPL17 Role of leader to support dialogue
SupPL10 Sharing knowledge returned benefits
SupPL14 Valuing each other's experience
SupPL4 Role of project owner
SupPL12 BCO-contract
SupPL20 Role of leader to support good relationship .770
SupPL19 Leader's attitude .724
SupPL21 Respect each others' views .611
SupPL18 Leader as a role model .596
SupPL26 Setting of site office .562
SupPL11 BCO-drawings and specificat ions .528
SupPL22 Knowing each others' abilities .451
SupPL7 Incentives for knowledge sharing .860
SupPL9 Friendship relations to facilitate knowledge sharing .828
SupPL8 Relationship between companies to enable KS .819
SupPL24 Adaptive way of learning
Extraction Method: Principal Component Analysis.
Rotation Method: Promax with Kaiser Normalization.
a. Rotation converged in 5 iterations.
b. The variables in italic font will be eliminated from further analysis as their score is less than .40

195
Out of the 27 variables measuring the enablers construct, 23 variables were extracted under
three components. These components will be assigned new names other than the original
constructs’ names in the theoretical framework. Component 1 may be named “Managerial
Support” (MANAG SUPP); Component 2 may be named “Knowledge Sharing Support”
(KS SUPP); and Component 3 may be named “Project Culture” (PRO CULT).
5.23 Confirmatory Factor Analysis Using PLS-PM Approach
The next step after conducting PCA is further examination of the extracted variables.
Confirmatory factor analysis (CFA) can be accomplished using partial least squares-path
modeling (e.g. Barroso et al., 2010; Tenenhaus & Hanafi, 2010). As indicated previously,
CFA is one way to validate the results of PCA (Hair et al., 2006).
SmartPLS does not offer the double-headed arrows of correlation. Therefore, to conduct
CFA, we shall choose algorithm options that do not consider the directional relationship
but only their existence. These include centroid scheme and factorial scheme (Tenenhaus
& Hanafi, 2010). As indicated previously, the current study followed Tenenhaus and
Hanafi’s approach to CFA by utilizing the centroid scheme. Factor weighting scheme can
be problematic as it overestimates the effects (Wilson & Henseler, 2007).
5.23.1 Confirmatory factor analysis of fragmentation
SmartPLS was used to build the second type hierarchical measurement model based on the
results of PCA. The first-order constructs were identified as reflective measurements.
Meanwhile, the second-order construct (FRAG) was identified as formative measurement.

196
FRAG was built using the repeated indicators approach (Tenenhaus et al., 2005; Wilson &
Henseler, 2007). In this approach, all manifest variables of the four components will be
assigned to the second-order construct formatively. Variables with low loading (less than
.55) will be eliminated from the first-order constructs to yield a better model quality, called
scale purification (Chin, 1998b). The final model of CFA of fragmentation contains 16
variables altogether, as illustrated in Figure 5.8. Results of correlation between constructs
are shown in Table 5.19.
Figure 5.8: Confirmatory factor analysis of fragmentation using SmartPLS (Type II hierarchical
model)

197
Table 5.19: Correlations among first- and second-order constructs of fragmentation
BARRIERS DoD FRAG INTEG SKB
BARRIERS 1.0000
DoD 0.0023 1.0000
FRAG 0.5021 0.6730 1.0000
INTEG 0.1971 0.2031 0.6746 1.0000
SKB 0.1234 0.5678 0.7851 0.3773 1.0000
Table 5.20 shows the loading, weight, and cross-loading of all manifest variables. These
loadings are also shown in the previous figure (Figure 5.8). Values in bold font illustrate
loadings that are above 0.55. The table shows one cross- loading variable, namely Frag27,
between the constructs DoD and SKB. Eliminating this variable from the model will be the
extremist remedy, while accepting this variable as it is can also be one of the solutions, but
this requires some interpretation (Hair et al., 2006). The variable shares some variance as
they measure the same construct (fragmentation); this may cause the cross-loading.
Table 5.20: Cross loadings of fragmentation
BARRIERS DoD INTEG SKB
Frag12 0.0525 0.1799 0.6964 0.2245
Frag14 0.1592 0.4688 0.3277 0.7770
Frag17 0.0287 0.0899 0.6980 0.2600
Frag18 0.2949 0.1764 0.8344 0.3437
Frag19 0.7804 0.1358 0.1367 0.0367
Frag20 0.8544 0.0002 0.1937 0.0959
Frag21 0.7947 -0.1055 0.1533 0.0882
Frag22 0.8033 -0.0384 0.1518 0.1770
Frag24 0.0913 -0.6321 -0.0492 -0.1396
Frag26 -0.0289 -0.8379 -0.1195 -0.3603
Frag27 -0.0194 -0.8762 -0.2474 -0.6714
Frag28 0.0628 0.5454 0.2468 0.8108
Frag29 0.0408 0.4441 0.1824 0.7364
Frag4 0.0731 0.3005 0.3177 0.6214
Frag5 0.0359 0.2731 0.3202 0.6249
Frag9 0.1388 0.2991 0.1935 0.6048

198
5.23.2 Assessing quality of fragmentation model
Quality criteria of fragmentation include average variance extracted (AVE), reliability,
communality, and goodness-of- fit (GoF). These results are shown in Table 5.21. All values
indicated acceptable to good results. As discussed in the previous section of this chapter,
GoF of the model was calculated depending on the Equation 5.3 presented previously
(Tenenhaus et al., 2005). As recommended by Wetzels et al. (2009), the GoF value of 0.36
will represent the cut-off point of good quality model. The value of GoF has been
calculated based on the root square of the average of communality and R2 (Table 5.21).
The value of GoF is 0.718, which is significantly higher than the cut-off point of 0.36.
Table 5.21: Quality criteria of CFA of fragmentation model
AVE
Composite
Reliability
R
Squared
Cronbachs
Alpha Communality Redundancy
FRAG 1.0000 0.2519 0.0498
BARRIERS 0.6540 0.8830 0.8236 0.6540
DoD 0.6231 0.8296 0.7139 0.6231
INTEG 0.5562 0.7886 0.6069 0.5562
SKB 0.4910 0.8509 0.7887 0.4910
Average - - 1.0000 - 0.5152 -
GoF √ 1.000*0.5152 = 0.718
Other ways to assess the quality of formative measurement model include checking the
significant of weights and multicollinearity test (Chin, 1998b). In fact, weight “provides
information about the composition and relative importance of each indicator in the
creation/formation of the construct” (Duarte & Raposo, 2010, p. 462). Weights of
formative variables of fragmentation are illustrated in Table 5.22. The table likewise shows
the contribution of each variable to fragmentation (without considering the negative sign).

199
The table shows also the ranking of each manifest variable according to its weight.
Weights less than 0.1 are considered trivial (Chin, 1998b). However, these cannot be
eliminated from the formative measurement model of fragmentation.
Table 5.22: Weight of indicators of fragmentation
Rank Variables
(Construct) Label
Loading /
Weight
1 Frag27 (DoD) Understanding informat ion from people from other background -0.2818
14 Frag26 (DoD) Solving discrepancies – clashes 0.0261
15 Frag24 (DoD) Contact with other professionals -0.0191
2 Frag5 (SKB) Well managed information 0.2732
3 Frag14 (SKB) Long term relat ionship 0.2099
6 Frag4 (SKB) Access informat ion easily 0.1342
7 Frag29 (SKB) Insufficient information from other consultants 0.1201
12 Frag28 (SKB) Insufficient information from previous stages 0.0340
10 Frag9 (SKB) No blame culture 0.0770
4 Frag18 (INTEG) Freedom for self-organizing team/work 0.1786
5 Frag17 (INTEG) Focus on project owner’s requirements 0.1737
9 Frag12 (INTEG) Irregular meet ings 0.1055
8 Frag19 (BARR) Professional barriers 0.1080
11 Frag20 (BARR) Organizational barriers 0.0748
12 Frag22 (BARR) Barriers between different ethnic groups 0.0618
16 Frag21 (BARR) Language barriers -0.0023
5.23.3 Multicollinearity of fragmentation
Multicollinearity can be referred to as a situation in which there is an exact, or almost
exact, linear relation between two or more variables (Hocking & Pendleton, 1983).
Assessing multicollinearity level is one way to check the validity of formative
measurement (Chin, 1998b). Multicollinearity of second-order fragmentation construct can
be conducted to ensure that there is no substantial correlation among the formative
manifest variables. Multicollinearity is a problematic situation because it may produce

200
unstable estimates of standard errors and p-values (Gordon, 1968). Moreover,
multicollinearity indicates redundant information due to high linear inter-correlations
(Diamantopoulos et al., 2008). Therefore, high multicollinearity of fragmentation
measurement is unfavorable situation.
Variance inflation factor (VIF) can be used to assess the level of multicollinearity
(Marquardt, 1970). The cut-off threshold of VIF is 10 (Kleinbaum et al., 2007). Another
way of evaluating overall multicollinearity is to observe condition index and condition
number. Condition index is the root square of the highest eigenvalue divided by the lowest
eigenvalue in the matrix (Alin, 2010). The condition number is the highest value of the
condition index. According to Alin (2010), values of condition index between 5–10
indicate weak multicollinearity and 30–100 indicate moderate to strong multicollinearity.
However, Cohen (2003) emphasized that choosing 30 as a threshold for multicollinearity
is not based on strong statistical rationale.
The test was performed using linear regression in SPSS (version 19) to obtain the values of
VIF and condition index. To run the linear correlation, one of the manifest variables of
fragmentation was assigned randomly as a dependent variable. To ensure that this
dependent variable would not have collinearity with other variables under fragmentation,
the test was conducted again by assigning a different variable as dependent. No
considerable difference in VIF value and condition number was observed in the two tests.
The results of VIF and condition number indicated low multicollinearity level among the
variables of fragmentation (Tables 5.23 and 5.24).

201
Table 5.23: Multicollinearity test of fragmentation: VIF results
Model Correlations Collinearity Statistics
Zero-order Partial Part Tolerance VIF
Well managed information .027 .157 .131 .666 1.502
No blame culture -.044 .049 .041 .693 1.443
Irregular meetings -.096 -.075 -.062 .782 1.279
Short-term relationship -.161 -.050 -.042 .494 2.025
Project owner's needs -.027 -.027 -.022 .731 1.368
Self organizing team -.003 .057 .048 .661 1.512
Professionals barriers -.091 -.083 -.069 .432 2.312
Organizational barriers .032 -.014 -.012 .382 2.615
Language barriers .209 .129 .108 .372 2.686
Cultural barriers .167 .042 .035 .375 2.666
Discrepancies - clashes .481 .313 .273 .609 1.641
Understanding among professionals .348 .169 .142 .422 2.371
Insufficient information from previous stages -.174 -.006 -.005 .415 2.409
Insufficient information from other consultants -.125 .053 .044 .511 1.957
Access to information -.065 -.011 -.009 .698 1.432
Note: Dependent variable: Contact among professionals
Table 5.24: Multicollinearity test of fragmentation: eigenvalue and condition index
Dimension Eigenvalue Condition Index
1 14.234 1.000
2 .453 5.606
3 .278 7.151
4 .168 9.215
5 .139 10.134
6 .124 10.729
7 .111 11.333
8 .100 11.924
9 .084 13.006
10 .077 13.569
11 .063 15.081
12 .051 16.771
13 .044 18.005
14 .038 19.454
15 .028 22.598
16 .010 (condition number) 37.688

202
5.23.4 Confirmatory factor analysis of intra-project learning
Similar criteria of fragmentation were followed to perform the CFA of intra-project
learning construct (INTRAPL). However, first- and second-order constructs are reflective.
Centroid weighting scheme of algorithm was followed to determine the loadings as well as
the quality of the model. Figure 5.9 illustrates the result of CFA obtained from SmartPLS.
Collectively, 10 variables remained after eliminating the variables with low loadings.
Tables 5.25 and 5.26 show the results of correlations, loading, and cross- loading of
variables. Goodness-of- fit was calculated depending on the previous GoF index (see Table
5.26). GoF value is 0.57, which is above the cut-off point for good quality model (Wetzels
et al., 2009).
Figure 5.9: Confirmatory factor analysis of intra-project learning (Type I hierarchical model)

203
Table 5.25: Manifest variables’ loading and cross-loadings of Intra-PL
INTRAPL-1 INTRAPL-2
IntraPL1 0.6180 0.3187
IntraPL11 0.6845 0.3514
IntraPL14 0.4697 0.6945
IntraPL17 0.3822 0.8135
IntraPL18 0.3255 0.6910
IntraPL19 0.7165 0.4371
IntraPL2 0.6173 0.2721
IntraPL3 0.6917 0.4117
IntraPL6 0.2977 0.6076
IntraPL9 0.6203 0.2763
Table 5.26: Quality criteria of the model and correlation among constructs
AVE
Composite
Reliability
R
Squared
Cronbachs
Alpha Communality Redundancy INTRAPL
INTRAPL-
1
INTRAPL-
2
INTRAPL
0.3534 0.8439
0.7942 0.3534 1.0000
INTRAPL-
1 0.4347 0.8213 0.8246 0.7394 0.4347 0.3575 0.9080 1.0000
INTRAPL-
2 0.4977 0.7967 0.6991 0.6589 0.4977 0.3450 0.8361 0.5295 1.0000
Average
0.7618
0.4286
GoF √0.7618*0.4286 = 0.571
5.23.5 Confirmatory factor analysis of inter-project learning
The following figure demonstrates the results of CFA of inter-project learning. This is a
reflective second-order model as well. Collectively, 14 variables remained after conducting
the CFA. Results of correlations, cross-loading and model quality, and goodness-of- fit are
shown in the tables to follow (see Tables 5.27 and 5.28). Goodness-of- fit was calculated
depending on the previous GoF index. GoF value is 0.600, which indicates a good-global
quality model (Wetzels et al., 2009).

204
Figure 5.10: Confirmatory factor analysis of inter-project learning
Table 5.27: Manifest variables’ loading and cross-loadings of inter-project learning
INTERPL-1 INTERPL-2
InterPL10 0.6901 0.5186
InterPL11 0.3561 0.6644
InterPL12 0.3510 0.7652
InterPL13 0.4280 0.6366
InterPL14 0.6550 0.3815
InterPL16 0.7627 0.3737
InterPL17 0.6722 0.4323
InterPL2 0.7807 0.4346
InterPL3 0.7068 0.4592
InterPL5 0.6877 0.2520
InterPL6 0.6725 0.3661
InterPL7 0.6736 0.3857
InterPL8 0.4701 0.7760
InterPL9 0.4190 0.6866

205
Table 5.28: Quality criteria of inter-project learning and correlation among constructs
AVE
Composite
Reliability
R
Squared
Cronbachs
Alpha Communality Redundancy INTERPL
INTERPL-
1
INTERPL-
2
INTERPL
0.3990 0.9020
0.8825 0.3990 1.0000
INTERPL-
1 0.4919 0.8967 0.8899 0.8701 0.4919 0.4360 0.9433 1.0000
INTERPL-
2 0.5012 0.8331 0.6626 0.7488 0.5012 0.3295 0.8140 0.5753 1.0000
Average
0.776
0.4640
GoF √0.776*0.464 = 0.600
5.23.6 Confirmatory factor analysis of enablers of project learning
The same procedure was followed in analyzing the enablers of project learning. The
difference here is that enablers are not a hierarchical model, as the objective of the current
study is to investigate the effect of each component in the full model individually. Figure
5.11 illustrates the results of CFA of the three components (i.e., MANAG SUPP, KS
SUPP, and PRO CULT) that comprise enablers.

206
Figure 5.11: Confirmatory factor analysis of enablers of project learning
It is important to note that the arrow in this model does not imply any causal effect; rather,
it indicates a correlation (Tenenhaus & Hanafi, 2010). This is can be attained when
choosing Centroid Weighting Scheme option in SmartPLS to estimate the algorithm.
Unlike the Path Weighting Scheme, this option, as mentioned previously, will not consider
the relationship effect among the three constructs. Results of correlations, model quality,
loadings, and goodness-of- fit are shown in the following tables. GoF of the model is 0.298,
which indicates moderate good- global quality model (Wetzels et al., 2009).

207
Table 5.29: Manifest variables’ loading and cross loadings of enablers
KS S UPP MANAG S UPP PRO CULT
SupPL1 0.2329 0.6755 0.2264
SupPL13 0.1608 0.6163 0.3156
SupPL20 0.0184 0.2612 0.7065
SupPL21 0.0114 0.3079 0.6256
SupPL22 0.0259 0.3820 0.7114
SupPL26 0.1400 0.4402 0.7896
SupPL27 0.1896 0.7219 0.4398
SupPL6 0.2858 0.7698 0.3524
SupPL5 0.0678 0.6548 0.3512
SupPL3 0.0559 0.6870 0.3507
SupPL30 0.0746 0.6805 0.3965
SupPL7 0.8060 0.1396 0.0692
SupPL8 0.8679 0.2068 0.1041
SupPL9 0.8594 0.2376 0.0460
Table 5.30: Quality criteria and correlation among constructs of enablers of project learning model
AVE
Composite
Reliability
R
Squared
Cronbachs
Alpha Communality Redundancy
KS
SUPP
MANAG
SUPP
PRO
CULT
KS
SUPP 0.7138 0.8820 0.0570 0.8025 0.7138 0.0378 1.0000
MANAG
SUPP 0.4734 0.8623
0.8155 0.4734 0.2359 1.0000
PRO
CULT 0.5050 0.8021 0.2586 0.6875 0.5050 0.1228 0.0878 0.5085 1.0000
Average
0.1578
0.5641
GoF √0.1578*0.5641 = 0.2984
5.24 Full Model of Project Learning
The full model was depicted using SmartPLS by connecting all constructs according to the
theoretical model. Manifest variables were assigned to their latent constructs according to
the results of the previous analyses. The current study used the following criteria to run the
algorithm in SmartPLS to obtain the results of the full model:

208
Weighting Scheme: Path weighting scheme (Tenenhaus & Hanafi, 2010; Vinzi et
al., 2010);
Data Metric: Mean 0, Var 1(the default in the program, to ensure normality);
Maximum Iterations: 300 (the default in the program);
Abort Criterion: 1.0E-5 (the default in the program);
Initial Weight: 1 (the default in the program).
As stated previously, path weighting scheme is the only scheme that considers the
direction of relationship as specified in the model (Vinzi et al., 2010, p. 53). In addition,
this scheme takes into consideration the direction of the arrow in the model (Tenenhaus &
Hanafi, 2010), thus, it is considered more appropriate in path modeling assessment.
Figure 5.12 shows the full model consists of both measurement and structural models.
Measurement models (i.e., outer models) indicate the relationship between the manifest
variables (i.e., rectangular shape) and their own constructs (i.e., oval shape). The structural
model (i.e., inner model) indicates the relationship among the constructs (e.g., FRAG and
MANAG SUPP, etc.).
Fragmentation construct (FRAG) is a second-order construct measured formatively by four
first-order constructs: spanning knowledge boundaries (SKB); integration (INTEG);
barriers (BARRIERS); and decoupling of diversity (DoD). These constructs are measured
by reflectively. Both intra-project learning (INTRA-PL) and inter-project learning
(INTER-PL) are second-order constructs each measured reflectively by two first-order
constructs. FRAG influences both INTRA-PL and INTER-PL via three mediating
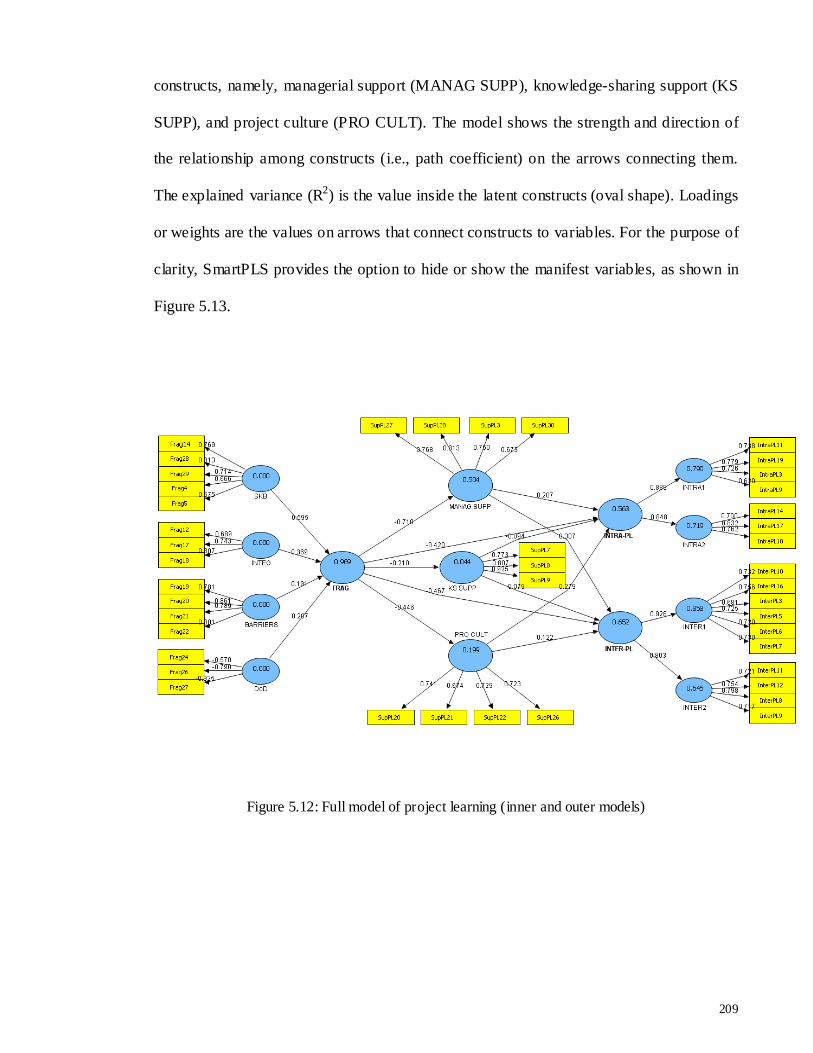
209
constructs, namely, managerial support (MANAG SUPP), knowledge-sharing support (KS
SUPP), and project culture (PRO CULT). The model shows the strength and direction of
the relationship among constructs (i.e., path coefficient) on the arrows connecting them.
The explained variance (R2) is the value inside the latent constructs (oval shape). Loadings
or weights are the values on arrows that connect constructs to variables. For the purpose of
clarity, SmartPLS provides the option to hide or show the manifest variables, as shown in
Figure 5.13.
Figure 5.12: Full model of project learning (inner and outer models)

210
Figure 5.13: Full model of project learning (hiding the manifest variables)
5.25 Assessment of Full Model’s Quality
Assessment of the full model can be performed at two levels: measurement model level
and structural model level (Fornell & Larcker, 1981; Tenenhaus et al., 2005). This can be
achieved by assessing validity, reliability, redundancy, and communality, and evaluating
structural regression equations (via cross-validated redundancy – F2) and quality of the
measurement model (via cross-validated communality – H2) (Tenenhaus et al., 2005).
Cross-loading test was conducted to check whether a variable of a certain construct shares
loading with other constructs across the model (refer to Appendix G). Based on this test,
some variables were eliminated from the model (Hair et al., 2006). Eliminating the cross-
loaded variables enhances the discriminant validity of the model.

211
5.25.1 Assessment of measurement models
Assessment of the reflective latent constructs involves evaluating reliability and validity of
the measurement (i.e., multi- item scales) (Churchill, 1979). Several steps were taken to
ensure reliability and validity of the scale, including principal component analysis and
confirmatory factor analysis (Churchill, 1979; Hair et al., 2006). Detailed steps of
evaluating the measurement models (some mentioned previously) include the following:
Ensure the significance of items loading and weight [threshold is 0.55 for reflective
measures (Falk & Miller, 1992) and 0.1 for formative measures (Chin, 1998b)].
Calculate the internal consistency indicated by Cronbach’s alphas or composite
reliability [threshold is 0.70 (Nunnally, 1978)].
Ascertain the convergent validity by observing the range of items loading and
cross- loading (Chin, 2010).
Ascertain the discriminant validity by calculating the average variance extracted
(AVE) [threshold of AVE is 0.50 (Fornell & Larcker, 1981)]. This can be attained
by comparing the square root of AVE with all the correlations between constructs.
The square root of AVE should be greater than all the correlations to establish the
discriminant validity (Fornell & Larcker, 1981).
Ensure that the cv-com is above zero for all constructs (Tenenhaus et al., 2005).
Tables 5.31 and 5.32 show the assessment of the measurement models in terms of factor
loadings or weights of fragmentation, enablers, intra-project learning and inter-project
learning. All loadings of variables are above the threshold of 0.55.

212
Table 5.31: Outer model (weights or loadings) of fragmentation and enablers
FRAG
(1st-order) BARRIERS DoD INTEG SKB
KS
SUPP
MANAG
SUPP
PRO
CULT
Frag17 0.1737
0.7428
Frag18 0.1786
0.8065
Frag12 0.1055
0.6888
Frag19 0.1080 0.7809
Frag20 0.0748 0.8610
Frag21 -0.0023 0.7888
Frag22 0.0618 0.8006
Frag24 -0.0191
-0.5704
Frag26 0.0261
-0.7896
Frag27 -0.2818
-0.9252
Frag28 0.0340
0.8126
Frag29 0.1201
0.7137
Frag4 0.1342
0.6661
Frag5 0.2732
0.6746
Frag14 0.2099
0.7693
SupPL20
0.7408
SupPL21
0.6743
SupPL22
0.7288
SupPL26
0.7230
SupPL27
0.7676
SupPL28
0.8129
SupPL3
0.7503
SupPL30
0.6728
SupPL7
0.7727
SupPL8
0.8073
SupPL9
0.9247
Table 5.32: Outer model (weights or loadings) of intra- and inter-project learning
INTER-PL
(1st-order) INTER1 INTER2
INTRA-PL
(1st-order) INTRA1 INTRA2
InterPL16 0.6815 0.7563
InterPL3 0.6675 0.6806
InterPL5 0.6037 0.7253
InterPL6 0.6521 0.7196
InterPL7 0.6689 0.7304
InterPL10 0.7386 0.7323
InterPL8 0.6643
0.7981
InterPL9 0.6018
0.7165
InterPL11 0.5641
0.7207
InterPL12 0.5650
0.7543
IntraPL14
0.6516 0.7002
IntraPL17
0.6734 0.8316
IntraPL18
0.6204 0.7620
IntraPL19
0.7209 0.7785
IntraPL3
0.6649 0.7258
IntraPL9
0.5086 0.6197
IntraPL11
0.6362 0.7379

213
Tables 5.33 and 5.34 present the quality criteria of the outer model, which include AVE,
composite reliability, Cronbach’s alpha, communality, redundancy, cv-com, and
discriminant validity. All results are good and above the recommended thresholds.
Table 5.33: Quality criteria (overall) and GoF of the full model
AVE
Composite
Reliability
R
Squared
Cronbachs
Alpha Communality Redundancy
cv-
red
cv-
com
BARRIERS 0.6536 0.8828
0.8236 0.6536 0.419 0.419
DoD 0.6017 0.8138
0.7139 0.6017 0.271 0.271
FRAG*
0.9691
0.2508 0.0239 0.252 0.167
INTEG 0.5589 0.7910
0.6069 0.5589 0.143 0.143
INTER-PL* 0.4134 0.8750 0.6522 0.8408 0.4134 0.2020 0.255 0.279
INTER1 0.5249 0.8688 0.8583 0.8188 0.5249 0.4471 0.456 0.308
INTER2 0.5597 0.8353 0.6451 0.7375 0.5597 0.3595 0.367 0.282
INTRA-PL* 0.4126 0.8297 0.5634 0.7602 0.4126 0.1589 0.212 0.217
INTRA1 0.5154 0.8086 0.7900 0.6854 0.5154 0.4054 0.414 0.205
INTRA2 0.5875 0.8096 0.7194 0.6451 0.5875 0.4193 0.441 0.195
KS SUPP 0.7013 0.8750 0.0440 0.8025 0.7013 0.0236 0.016 0.402
MANAG SUPP 0.5664 0.8387 0.5042 0.7427 0.5664 0.2850 0.259 0.283
PRO CULT 0.5143 0.8088 0.1987 0.6875 0.5143 0.0972 0.098 0.199
SKB 0.5321 0.8496
0.7780 0.5321 0.267 0.267
Average
0.5944
0.5281 0.276 0.260
GoF √ 0.5944*0.5281 = 0.5603
* Indicates second-order construct
Table 5.34: Correlations among latent constructs and discriminant validity of the model
BARR DoD INTEG
INTER
1
INTER
2
INTRA
1
INTRA
2
KS
SUPP
MANAG
SUPP
PRO
CULT SKB
BARRIERS (0.808)
DoD 0.008 (0.776)
INTEG 0.185 0.214 (0.748)
INTER1 -0.206 -0.590 -0.431 (0.724)
INTER2 -0.196 -0.239 -0.406 0.520 (0.748)
INTRA1 -0.219 -0.166 -0.451 0.481 0.510 (0.718)
INTRA2 -0.214 -0.463 -0.381 0.624 0.456 0.511 (0.766)
KS SUPP 0.085 -0.265 -0.079 0.288 0.108 0.015 0.085 (0.837)
MANAG SUPP -0.225 -0.499 -0.416 0.704 0.508 0.445 0.654 0.208 (0.753)
PRO CULT -0.177 -0.182 -0.410 0.378 0.509 0.548 0.422 0.066 0.495 (0.717)
SKB 0.105 0.597 0.387 -0.707 -0.424 -0.450 -0.557 -0.238 -0.633 -0.296 (0.729)
Notes: correlations of the second-order constructs are not included in this table.
Values between parentheses on the diagonal are the square root of AVE, while values off the diagonal are the correlations
between constructs. Discriminant validity can be established when the values on the diagonal are higher than any value
off the diagonal.

214
However, the AVE of some second-order constructs, namely, INTER-PL and INTRA-PL
was slightly low. These are hierarchical models and were identified by repeating all items
of the first-order constructs. These items may have lower correlation among each other.
This can be considered one of the shortcomings of the hierarchical models.
5.25.2 Assessment of structural model and hypotheses testing
The model’s goodness-of- fit (GoF) can be calculated according to the formula presented in
(Tenenhaus et al, 2005). The threshold of GoF was adopted from Wetzels et al. (2009),
who proposed a threshold of 0.36 (as explained previously). GoF of the full model is
0.560, which is above the threshold of goodness-of- fit model (Table 5.33 above). In
addition, redundancy of the whole model, indicated by cv-red, is positive for all constructs
(Table 5.33).
The structural model can be assessed using algorithm and bootstrapping calculations. First,
the algorithm procedure indicated the total effect (i.e., direct and indirect) of all exogenous
constructs on endogenous constructs, as illustrated in Table 5.35.
Table 5.35: Total effect among all latent constructs in the full model
FRAG
INTER-
PL INTER1 INTER2
INTRA-
PL INTRA1 INTRA2
KS
SUPP
MANAG
SUPP
PRO
CULT
BARRIERS 0.1908 -0.1442 -0.1336 -0.1158 -0.1281 -0.1139 -0.1087 -0.0400 -0.1354 -0.0850
DoD 0.2072 -0.1566 -0.1451 -0.1258 -0.1391 -0.1237 -0.1180 -0.0435 -0.1471 -0.0923
FRAG*
-0.7562 -0.7006 -0.6073 -0.6717 -0.5971 -0.5698 -0.2099 -0.7101 -0.4457
INTEG 0.3685 -0.2786 -0.2581 -0.2238 -0.2475 -0.2200 -0.2099 -0.0773 -0.2616 -0.1642
INTER-PL*
0.9264 0.8032
INTRA-PL*
0.8888 0.8482
KS SUPP
0.0789 0.0731 0.0634 -0.0940 -0.0835 -0.0797
MANAG SUPP
0.3067 0.2842 0.2464 0.2070 0.1840 0.1756
PRO CULT
0.1224 0.1134 0.0983 0.2794 0.2484 0.2370
SKB 0.5949 -0.4498 -0.4167 -0.3613 -0.3996 -0.3552 -0.3389 -0.1249 -0.4224 -0.2651
* Indicates second-order construct
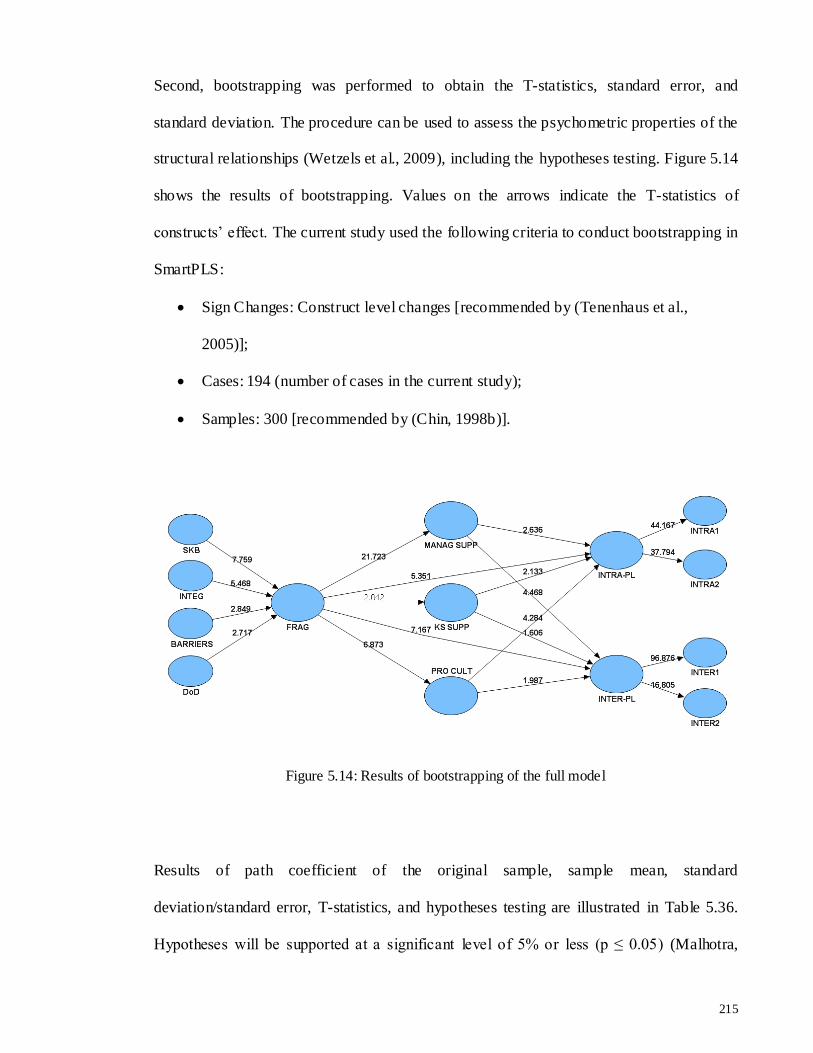
215
Second, bootstrapping was performed to obtain the T-statistics, standard error, and
standard deviation. The procedure can be used to assess the psychometric properties of the
structural relationships (Wetzels et al., 2009), including the hypotheses testing. Figure 5.14
shows the results of bootstrapping. Values on the arrows indicate the T-statistics of
constructs’ effect. The current study used the following criteria to conduct bootstrapping in
SmartPLS:
Sign Changes: Construct level changes [recommended by (Tenenhaus et al.,
2005)];
Cases: 194 (number of cases in the current study);
Samples: 300 [recommended by (Chin, 1998b)].
Figure 5.14: Results of bootstrapping of the full model
Results of path coefficient of the original sample, sample mean, standard
deviation/standard error, T-statistics, and hypotheses testing are illustrated in Table 5.36.
Hypotheses will be supported at a significant level of 5% or less (p ≤ 0.05) (Malhotra,

216
2003). The significance level was calculated using T-statistics and degree of freedom (df).
Value of T-statistics equal or above 1.64 indicates significance level of 5% or less (for one
tail). All hypotheses, including the relationship between the first- and second-order
constructs, were supported, except the relationship between KS SUPP and INTER-PL.
Table 5.36: Path coefficients (mean, STDEV, t-values) and test of hypotheses
Path Coefficient
of Original
Sample (O)
Sample
Mean
(M)
Standard
Deviation
(STDEV)
Standard
Error
(STERR)
T Statistics
(|O/STERR|)
Significant
Level (p-
value)
Hypothesis
Supported?
BARRIERS ->
FRAG 0.1908 0.1903 0.0669 0.0669 2.8491 0.0049 Yes
DoD ->
FRAG 0.2072 0.2069 0.0762 0.0762 2.7171 0.0072 Yes
FRAG ->
INTER-PL -0.4672 -0.4966 0.0651 0.0651 7.1670 0.0001 Yes
FRAG ->
INTRA-PL -0.4199 -0.4433 0.0784 0.0784 5.3513 0.0001 Yes
FRAG -> KS
SUPP -0.2099 -0.2163 0.1028 0.1028 2.0418 0.0425 Yes
FRAG ->
MANAG SUPP -0.7101 -0.7247 0.0326 0.0326 21.7225 0.0001 Yes
FRAG -> PRO
CULT -0.4457 -0.4651 0.0648 0.0648 6.8732 0.0001 Yes
INTEG ->
FRAG 0.3685 0.3612 0.0673 0.0673 5.4679 0.0001 Yes
INTER-PL ->
INTER1 0.9264 0.9279 0.0095 0.0095 96.8760 0.0001 Yes
INTER-PL ->
INTER2 0.8032 0.7986 0.0477 0.0477 16.8046 0.0001 Yes
INTRA-PL ->
INTRA1 0.8888 0.8886 0.0201 0.0201 44.1668 0.0001 Yes
INTRA-PL ->
INTRA2 0.8482 0.8503 0.0224 0.0224 37.7936 0.0001 Yes
KS SUPP ->
INTER-PL 0.0789 0.0799 0.0491 0.0491 1.6055 0.1100 No
KS SUPP ->
INTRA-PL -0.0940 -0.0961 0.0440 0.0440 2.1327 0.0342 Yes
MANAG SUPP
-> INTER-PL 0.3067 0.2896 0.0686 0.0686 4.4677 0.0001 Yes
MANAG SUPP
-> INTRA-PL 0.2070 0.1911 0.0785 0.0785 2.6363 0.0091 Yes
PRO CULT ->
INTER-PL 0.1224 0.1039 0.0615 0.0615 1.9873 0.0483 Yes
PRO CULT ->
INTRA-PL 0.2794 0.2676 0.0652 0.0652 4.2835 0.0001 Yes
SKB ->
FRAG 0.5949 0.5841 0.0766 0.0766 7.7585 0.0001 Yes
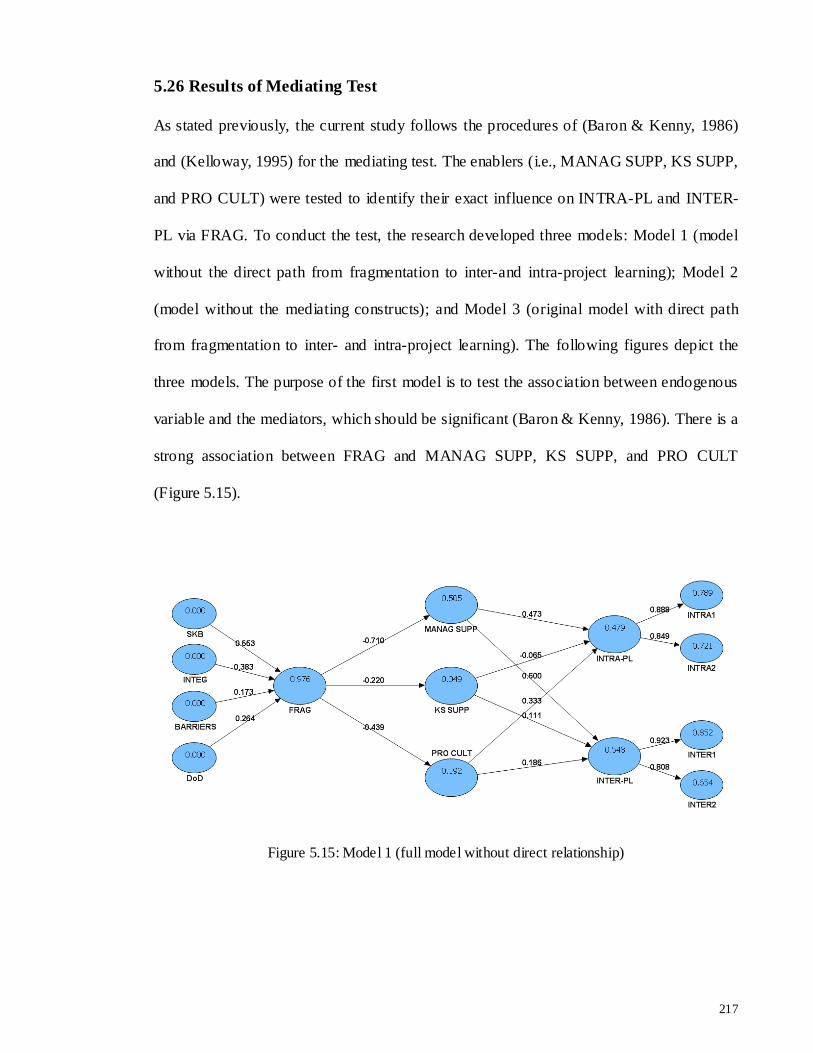
217
5.26 Results of Mediating Test
As stated previously, the current study follows the procedures of (Baron & Kenny, 1986)
and (Kelloway, 1995) for the mediating test. The enablers (i.e., MANAG SUPP, KS SUPP,
and PRO CULT) were tested to identify their exact influence on INTRA-PL and INTER-
PL via FRAG. To conduct the test, the research developed three models: Model 1 (model
without the direct path from fragmentation to inter-and intra-project learning); Model 2
(model without the mediating constructs); and Model 3 (original model with direct path
from fragmentation to inter- and intra-project learning). The following figures depict the
three models. The purpose of the first model is to test the association between endogenous
variable and the mediators, which should be significant (Baron & Kenny, 1986). There is a
strong association between FRAG and MANAG SUPP, KS SUPP, and PRO CULT
(Figure 5.15).
Figure 5.15: Model 1 (full model without direct relationship)

218
Figure 5.16: Model 2 (model without mediating constructs)
Figure 5.17: Model 3 (full model with direct relationship – original model)

219
To examine the mediating effect, the following conditions must be satisfied:
1) Effect of independent constructs on dependent constructs must be significant in
Model 2.
2) Effect of independent constructs on mediating constructs must be significant in
Model 3.
3) Effect of mediating constructs on dependent constructs must be significant in
Model 3.
4) Effect of independent constructs on dependent constructs must be lower in Model 3
than in Model 2.
There is a perfect mediating effect if the direct relationship of independent constructs on
dependent constructs is not significant in Model 3. If direct relationship is reduced, but still
significance then there is a partial mediating effect. Table 5.37 shows the results of the
mediating test of Models 2 and 3.
Table 5.37: Comparing Model 2 with Model 3 to examine the mediating effect
Model 2 (without the mediating constructs) Model 3 (original model: direct relationship
between dependent and independents)
Path coefficient T-Statistics Path coefficient T-Statistics
FRAG ->KS SUPP - - -0.2099 2.0418*
FRAG -> MANAG SUPP - - -0.7101 21.7225**
FRAG -> PRO CULT - - -0.4457 6.8732**
FRAG -> INTER-PL -0.7536 29.8290** -0.4672 7.1670**
FRAG -> INTRA-PL -0.6725 16.0556** -0.4199 5.3513**
KS SUPP -> INTER-PL - - 0.0789 1.6055
KS SUPP -> INTRA-PL - - -0.0940 2.1327*
MANAG SUPP -> INTER-PL - - 0.3067 4.4677**
MANAG SUPP -> INTRA-PL - - 0.2070 2.6363*
PRO CULT -> INTER-PL - - 0.1224 1.9873*
PRO CULT -> INTRA-PL - - 0.2794 4.2835**
Note: Only second-order constructs are shown in this table.
* Significant at p < 0.05
** Significant at p < 0.001

220
According to Table 5.37, the effect of fragmentation (FRAG) on inter-project learning and
intra-project learning (INTER-PL and INTRA-PL) in Model 2 is significant (-0.754, T =
29.83 and -0.673, T = 16.056, respectively).
In Model 3, effect of FRAG on mediating constructs – namely, KS SUPP, MANAG SUPP,
and PRO CULT – is significant as well (-0.4672, T = 2.0418; -0.4199, T = 21.7225; and -
0.2099, T = 6.8732).
In addition, in Model 3, the effect of mediator KS SUPP on INTER-PL is trivial and not
significant (0.0789, T = 1.6055). KS SUPP has a small but significant effect on INTRA-PL
(-0.0940, T = 2.1327). Effect of the second mediator MANAG SUPP on both INTER-PL
and INTRA-PL is positive and significant, but slightly lower on INTRA-PL (0.3067, T =
4.4677 and 0.2070, T = 2.6363). Lastly, effect of the mediator PRO CULT on INTER-PL
and INTRA-PL is significant (0.1224, T = 1.9873 and 0.2794, T = 4.2835).
Comparing the effect of independent construct FRAG on the dependent construct INTER-
PL in Model 2 (-0.7536, T = 29.8290), we observed that the effect and significant level
were reduced in Model 3 (-0.7101, and T= 7.1670). Moreover, the effect of FRAG on
INTRA-PL in Model 2 (-0.6725, T = 16.0556) was reduced (-0.4457, T = 5.3513) in
Model 3. We can notice that the effect of FRAG on both INTER-PL and INTRA-PL has
reduced but remained significant in Model 3, compared with Model 2.

221
To summarize the previous results, the dependent constructs INTER-PL and INTRA-PL
are partly mediated by two constructs (i.e., MANAG SUPP and PRO CULT). On the other
hand, the effect of the mediator KS SUPP on INTER-PL is neither significant nor high. In
addition, the influence of KS SUPP on INTRA-PL is negative but significant. This
negative influence indicates that KS SUPP has small influence on INTRA-PL, so it cannot
change the negative influence of FRAG.
5.27 Summary
The chapter presented the procedure of developing the measurement scale of four
constructs, namely, fragmentation, intra-project learning, inter-project learning, and
enablers. The procedure involved conceptualization, operationalization, content validity,
measurement, and pilot study. The chapter elaborated on the method of analyses and data
collection. Method of analyses involved a discussion on hierarchical measurement models
and ways to analyze them using partial least squares-path modeling approach (PLS-PM).
The chapter also elaborated on this approach and argued the appropriateness of using it for
the current research.
Parallel analysis, principal factor analysis (PCA), and confirmatory factor analysis (CFA)
were highlighted as well and used to develop the measurement scale. Data were collected
from 36 big construction projects. Total collected valid questionnaires forms were 203,
from professionals working in these projects.
Using SPSS, PCA was conducted to summarize variables and to identify the underlying
structure of components. The components of fragmentation, intra-project learning, inter-

222
project learning, and enablers were identified. CFA was conducted using PLS-PM
approach to verify the results of PCA. PLS-PM approach was also used to analyze the
whole model of project learning using SmartPLS software.
Different tests of model reliability, validity, and quality were conducted at two levels:
measurement and structural models. Mediating test of the enablers was conducted to verify
the role of three constructs in the model. The model of project learning was finalized
accordingly.
The results confirmed the main hypothesis that fragmentation has a negative influence on
project learning. Mediating test verified a partial mediating role of two factors, namely,
Managerial Support and Project Culture, in enabling learning within fragmentation.
Knowledge Sharing Support had a trivial effect on inter-project learning. Discussion of
these finding will be presented in the next chapter.

223
CHAPTER 6: DISCUSSIONS
6.0 Introduction
The primary purpose of this chapter is to discuss the results of the quantitative study
presented in the previous chapter. The chapter begins with an overview of main findings
and results of both qualitative and qualitative studies. It discusses the full model of project
learning, including the measurement models and structural model. The discussion then
expands to include all items in the model. Lastly, the chapter argues the role of enablers as
mediating factors.
6.1 Highlights of the Main Findings and Results
6.1.1 Main findings of the qualitative study
1. Project learning in local practice: Some interviewees viewed learning as a task of
“people in the main office” at the end of the project. In fact, the practice of project review
involves auditing activities. A committee composed of project director, project manager,
coordinator, and so on is formed to check whether the contractor company has met its
original plan of profit and project completion on time. The committee is expected to
identify the reasons behind problems such as cost overrun, delay, and so on. Information
developed at this stage will be used by the main contractor for better costing estimates and
methods in the future.

224
However, when a problem occurs during the construction phase, reviews or lessons learned
are not usually developed. In addition, construction projects are faced with setbacks such
as inadequate resources, awareness, and objectives of learning.
2. Fragmentation: Some interviewees believed that fragmentation has an indirect influence
on learning. Nevertheless, they believed that it may not influence knowledge sharing
process among project team members who work in the same construction site. As stated by
one interviewee, people are willing to share knowledge because they belong to the same
project. All parties attached to the project are driven by the main goal of completing the
project. Therefore, they will not hesitate to share the necessary knowledge to achieve this
goal. Lack of competition among firms working within the same project may be one of the
reasons that freely enable knowledge sharing.
On the other hand, builders viewed fragmentation as a real problem that hinders the
performance of projects. Interviewees highlighted some factors that contribute to
fragmentation, such as attitude of people, negative perception (e.g., “builders always
cheat”), and low level of coordination (i.e., horizontally among team members and
vertically between main contractor and subcontractors). Factors that may reduce the
influence of fragmentation include good working relationship, attitudes of leader and
individuals, and inter-sectoral collaboration. Lastly, the interviewees highlighted some
factors that enable trust, collaboration, and integration, including participation and
responsibility, contract, procedures, relationships, working environment, togetherness, top
management role, and coordinator role.

225
3. Enablers of knowledge sharing and knowledge creation: Results of the qualitative study
identified various variables such as: meetings (e.g., interfacing and technical meetings),
working environment, spirit of project team, transparency, documentation (e.g., method
statement), project leader’s attitude, motivations, policy of companies, and knowledge
type. The results also affirmed some factors identified from the literature, such as IT,
boundary objects, a common main goal, and leaders’ roles.
The factors, combined from the literature and findings of qualitative study, were used to
develop the theoretical model (see Chapters 3 and 4). Quantitative study was employed to
test and develop the model further to attain the final model of project learning. The
quantitative study also involved a questionnaire survey to measure fragmentation, project
learning, and enablers, and to determine the relationship among these. In addition,
quantitative study was used to verify the findings of the qualitative study.
6.1.2 Main results of quantitative study
The quantitative study involved developing three hierarchical measurement models,
namely, fragmentation, intra-project learning, and inter-project learning. The study also
involved testing and developing the whole model of project learning. The results
concentrated around two levels: structural and measurement models.
Analysis of the structural model was conducted to determine the extent of fragmentation’s
influence on the project learning process. The results affirmed that fragmentation has a
negative significant influence on both intra- and inter-project learning. In addition,
fragmentation has a significant influence on the mediating constructs: managerial support,

226
knowledge sharing support, and project culture. Managerial support has positive
significant relationships with both intra- and inter-project learning. Moreover, project
culture has a positive significant relationship with intra- and inter-project learning.
Knowledge sharing support has no effect on inter-project learning, but it has a small effect
on intra-project learning.
Values of variance explained (R2) of the endogenous constructs (dependents) were quite
high. This demonstrates a good theoretical structural model. Other tests of the quality of
model, such as path coefficient and model’s goodness-of- fit, supported this finding. This
confirms the importance of considering fragmentation of construction projects when
addressing project learning.
To obtain a valid and reliable measurement scale, the study conducted content validity,
pilot study, principal component analysis, and confirmatory factor analysis. Partial least
squares-path modeling was conducted to test the whole model. In addition, the model’s
reliability, validity, and quality were attained. The analyses resulted in 43 variables
measuring the main constructs (i.e., fragmentation, project learning, and enablers of
learning). The final list of items of the whole model is shown in the following table.

227
Table 6.1: Variables of the full model of project learning
Constructs Items
1. Fragmentation (FRAG)
1.1 Spanning Knowledge
Boundaries (SKB) (5 items)
Relationship, Insufficient informat ion from previous stages,
Insufficient information from other consultants, Access informat ion
easily, and Well managed informat ion.
1.2 Integration (INTEG) (3 items) Regular meetings, Focusing on project owner's needs, and Freedom
for self o rganizing team.
1.3 Barriers (BARRIERS) (4
items)
Professionals’ barriers, Organizat ional barriers, Language barriers,
and Cultural barriers.
1.4 Decoupling of Diversity (DoD)
(3 items)
Contact with other professionals, Discrepancies or clashes, and
Understanding other professionals.
2. Intra-Project Learning (INTRA-PL)
2.1 INTRA 1 (4 items) Open discussion, Collaborat ion support, Face-to-face
communicat ion, and Asking others.
2.2 INTRA 2 (3 items) Efficient problem solving, Implementing new technology or
methods, and Job delegation.
3. Inter-Project Learning (INTER-PL)
3.1 INTER 1 (6 items)
Lessons learned sessions, Visiting other projects, Networking,
Communicat ion with people from other projects, Debriefing
meet ings, and Brainstorming sessions.
3.2 INTER 2 (4 items) Storage of project plans, Storage of important information, Review
sessions, and Ad hoc meetings.
4. Enablers (S UPP)
4.1 Managerial Support (MANAG
SUPP) (4 items)
Enough time for learning, Enough resources for learning, Making
decision about the way of learn ing, and Company's policy supports
openness.
4.2 Knowledge Sharing Support
(KS SUPP) (3 items)
Incentives for knowledge sharing, Relat ionship between companies
to enable KS, and Friendship relation to facilitate knowledge
sharing.
4.3 Project Culture (PRO CULT)
(4 items)
Role of leader to support good relationship, Respect each others'
views, Knowing each others' abilities, and Setting of site office.
The following sections discuss two levels of the whole model, namely, structural and
measurement models. The first level involves the relationship among main constructs, as
well as the interpretation of mediating effect of enablers on project learning. The second
includes the relationship between manifest variables and their constructs, such as the
relationship between indicators and integration that measures fragmentation.

228
6.2 Discussions on the Relationship among Constructs
This section discusses the results of the structural model (i.e., path analysis). The
discussion involves two directions, namely, the relationship between first- and second-
order constructs and the relationship among second-order constructs (i.e., fragmentation,
project learning, and enablers). Figure 6.1 shows the final model of project learning and
the influence of fragmentation as exogenous construct and enablers as mediating
constructs. Indicators of all the constructs have been shown previously in Table 6.1.
Values on the arrows indicate the strength and significant of the relationships (path
coefficient and p-value), while values inside the constructs indicate the variance explained
(R squared).
INTEG
BARR
SKB
DoD
FRAG
(0.97)
0.37**
0.19*
0.59**
0.21
*
PRO CULT
(0.20)
KS SUPP
(0.04)
MANAG
SUPP
(0.50)
- 0.20*
- 0.44**
- 0.7
1**
INTRA-PL
(056)
INTER-PL
(0.65)
INTRA1
(0.79)
INTRA2
(0.72)
INTER1
(0.86)
INTER2
(0.64)
0.89**
0.85**
0.93**
0.80**
- 0.09*
0.079
0.20*
0.12*
0.28
**
0.30**
- 0.47**
- 0.42**
* Significant at p < 0.05
** Significant at p < 0.001
Figure 6.1: Structural relationships of the project learning model

229
6.2.1 Interpretation of the relation between first- and second-order constructs
The full model of project learning included three main constructs identified as hierarchical
or second-order constructs, namely, fragmentation, intra-project learning, and inter-project
learning. These constructs are measured by first-order latent constructs, either formatively
or reflectively. The previous figure (6.1) shows the relationship between the first- and
second-order models. All relationships are strong and significant.
There are four components that contribute to fragmentation: spanning knowledge across
boundaries, integration (lack), decoupling of diversity (DoD), and barriers. Path coefficient
and T-statistics indicate good and significant relationship between these components and
fragmentation. Referring to Figure 6.1, it appears that spanning knowledge boundaries
(SKB) has the most influence on fragmentation. The average weight of items measuring
SKB, which will be discussed later on in Section 6.3.1, affirmed this finding. These items
– which are well-managed information, long-term relationship, access information,
sufficient information from other consultants, and sufficient information from previous
stages – can explain fragmentation from a new perspective. In this regard, fragmented
construction processes may indicate a problem related to information and knowledge, such
as sufficiency of information from other consultants, difficulty to access information, a nd
relationship among consultants.
The level of team integration (INTEG) significantly influences fragmentation. Three items
that measure this level, which are autonomy of the team to organize work for better
outcome, mutual focus on owner’s requirements, and getting together (regular meetings).
This construct has the second most influence on fragmentation after SKB.

230
Decoupling of diversity (DoD) has significant influence on fragmentation, but lower than
SKB and INTEG. The construction project is described as an arena where different people
from different professions are gathered to achieve one goal. Specialization per se is
considered an advantage; however, decoupling or disintegration of different professionals
is the issue. This level of decoupling can be measured by understanding information from
people from other backgrounds, solving discrepancies or clashes between design and
construction, and maintaining a level of contact with professionals from other
backgrounds. Understanding information from people from other backgrounds scored the
highest weight on fragmentation, while the other two scored low weights. From this
perspective, fragmentation can be viewed as the level of understanding information among
different professionals.
The last component that influences fragmentation is barriers (BARRIERS). This
component includes various aspects, including professional, organizational, cultural, and
language barriers. This component has the lowest influence on fragmentatio n compared
with the other three components. In addition, three items under this component ( i.e.,
organizational, cultural, and language barriers) have trivial influence on fragmentation.
Meanwhile, professional barriers scored quite significant weight. Hence, fragmentation can
be interpreted as a feature of professional barriers.
On the other hand, intra-project learning can determine two components: INTRA 1 and
INTRA 2. Both components have a very strong and significant relationship with intra-
project learning. While the first component can be related to the social or “soft” process of
learning, the second can be related to more technical or complex ways of learning. The
first component includes face-to-face interaction, open discussion, collaboration with new

231
colleagues, and asking others. The second component includes items with a more complex
level of learning, such as problem solving, implementation of a new technology and
method, and job delegation. Both, social and technical constructs, have equal contribution
to intra-project learning. Learning in construction projects, therefore, can be regarded as a
socio-technical perspective.
Similarly, inter-project learning can be determined by two components: INTER 1 and
INTER 2. The relationship between these with inter-project learning is also very strong
and significant. The first component includes items that indicate the process of experience
accumulation and knowledge articulation. These items include visiting other projects,
contacting individuals from other projects, networking, de-briefing meetings,
brainstorming sessions, and lessons- learned sessions. In the original theoretical framework,
experience accumulation and knowledge articulation are separated components (Prencipe
& Tell, 2001), but they are identified as one component in the current study. This is
possibly attributed to the high association between the two.
The second component includes items related to knowledge articulation and knowledge
codification, such as storage of important information, storage of project plans/audit,
review sessions, and ad hoc meetings. Review sessions can reveal some aspects of
knowledge articulation, but they include the aspect of knowledge codification as well. For
example, during review sessions, the main activity is to identify causes of problems or
issues, which will be followed by writing in the form of reports.
Therefore, inter-project learning can be viewed as two main processes. The first involves
the process of experience accumulation to knowledge articulation, while the second

232
involves the process of knowledge articulation to knowledge codification. This shows that
inter-project learning is a continuous but not linear process. Thus, it is an intertwined
activity of the three main processes mentioned above.
6.2.2 Influence of fragmentation on project learning
Previous studies (e.g. Barlow & Jashapara, 1998; Forgues et al., 2009; Gieskes & Broeke,
2000; Knauseder et al., 2007) indicated a negative influence of fragmentation on different
learning activities. The results of the current study confirm the negative influence of team
fragmentation on project learning processes. In the direct relationship model, without
considering the influence of enablers (or mediating variables), the path coefficient between
fragmentation and intra- and inter-project learning is -0.67 and -0.75, with high T-statistic
values of 16.1 and 29.8, respectively (refer to Figure 5.16 in the previous chapter). This
indicates a strong and significant association.
The variance of intra- and inter-project learning (R squared) explained by fragmentation is
quite high as well. The variance explained for intra-project learning is (R2 = 0.45), while
the variance explained for inter-project learning is (R2 = 0.57) (see Figure 5.16 in the
previous chapter). In other words, fragmentation can explain approximately 20% of the
variance in intra-project learning. Similarly, fragmentation can also explain 32% of the
variance in inter-project learning. Both values are considered quite high, especially if we
bear in mind that there is only one exogenous construct in the model, which is
fragmentation. This clearly demonstrates the importance of considering fragmentation in
the learning process of construction projects. The argument here is that fragmentation must
be considered when the purpose is to obtain efficient team learning in construction
projects.

233
6.2.3 Role of the enablers in the model
Two of the mediating constructs (managerial support and project culture) partially mediate
the relationship between fragmentation and both intra- and inter-project learning. However,
project culture has quite a low influence on inter-project learning. The third mediator (i.e.,
knowledge sharing support) has no strong mediating effect on the model, specifically on
inter-project learning. This is possibly due to people’s perception that knowledge can be
shared freely with every individual in the project. In addition, people might be willing to
share the necessary knowledge to achieve the objectives of the project.
These mediating variables can partially explain how learning occurs within a fragmented
context. Some variables have considerable roles in enabling project learning. For example,
allocations of time and resources, authority for choosing the preferred way of learning, and
support for openness are some variables that have partial roles in this context. Other
variables that facilitate the project learning process include supporting good relationships,
respect for each other’s views, awareness of each other’s abilities, and the setting of the
site office. Some of these variables were obtained from Sense’s model (e.g. Sense, 2004,
2007b), which is based on the situated learning theory. For the current study, the theory
implies that context is significant not only to attain learning, but also to enable learning
within fragmentation. Social activities and communicative interaction among team
members (Egbu, 2006; Sense, 2009) have a significant influence in this regard.
Other variables may possibly have a stronger influence on achieving project learning
within fragmentation. Identifying such variables requires more in-depth investigation that
focuses on this topic per se. However, procurement method, knowledge management,

234
partnering, and project governance, may have a significant role in enabling project learning
in this context. Efforts to manage and harvest knowledge in projects can help in reducing
the fragmentation of organizational knowledge (Love et al., 2005).
6.3 Discussions on the Measurement Models
Measurement scales of fragmentation, intra-project learning, and inter-project learning
may advance the way of measuring these notions as second-order latent constructs. The
following discusses each main construct in the model and their manifest variables (i.e.,
items).
6.3.1 Indicators of fragmentation
Table 6.2 shows the average weight of all first-order constructs that indicate fragmentation.
Average weight of each construct shows the contribution of first-order constructs to
fragmentation. The results infer that spanning knowledge boundaries (SKB) and lack of
integration (INTEG) are the constructs that contribute the most to fragmentation. On the
other hand, barriers (BARRIERS) have the lowest influence on fragmentation. Only one
item under this construct contributes to fragmentation: professional barrier. The rest have
trivial influence, as they scored weights less than 0.1 (Chin, 1998b). However, formative
items, even with very small weights, should not be eliminated from the analysis because
they contribute to the measurement (Chin, 2010). The table also shows the ranking of each
item according to weight. For example, “understanding information from people from
other background” under decoupling of diversity (DoD) is the highest contributor to

235
fragmentation. Meanwhile, “language barrier” under BARR is the lowest. The following
discusses the indicators of fragmentation according to their ranking.
Table 6.2: Average weight and ranking of first-order constructs contributing to fragmentation
Variables Construct Label Ranking Weight
Frag27 Decoupling of Diversity
(DoD)
Understanding informat ion from people
from other background 1 -0.282
Frag26 Solving discrepancies – clashes 13 0.026
Frag24 Contact with other professionals 14 -0.019
Average weight 0.109
Frag5
Spanning Knowledge across
boundaries
(SKB)
Well managed information 2 0.273
Frag14 Long term relat ionship 3 0.210
Frag4 Access informat ion easily 6 0.134
Frag29 Insufficient information from other
consultants 7 0.120
Frag28 Insufficient information from previous
stages 12 0.034
Average weight 0.154
Frag18 Integration
(INTEG)
Freedom for self-organizing team/work 4 0.179
Frag17 Focus on project owner’s requirements 5 0.174
Frag12 Irregular meet ings 9 0.105
Average weight 0.153
Frag19
Barriers
(BARRIERS)
Professional barrier 8 0.108
Frag20 Organizational barrier 10 0.075
Frag22 Barriers between different ethnic groups 11 0.062
Frag21 Language barrier 15 -0.002
Average weight 0.062
Note: The average weight of each construct was calculated without considering the effect of the negative sign, which is a
result of negative wording in the questionnaire.
The first item in the ranking intends to measure the degree of “understanding information
from people from other backgrounds.” This item contributed the most to fragmentation.
The construction project is an arena of diverse specializations and professions. Inadequate
understanding of information among professionals indicates team fragmentation.
Professionals are supposed to speak the same “technical language.” However, it appears

236
that the project team requires more standardized information. Mutual understanding of
project knowledge and information among team members may influence learning.
The second item that indicates fragmentation is “well managed information.” In fact, well-
managed and organized information influences its usage by different team members across
the project life cycle. This allows for easier sharing of information during the construction
stage and other stages of the project. Another item related to this item is “ease of
information access.” This item ranks sixth and indicates the availability and accessibility
of information when needed. Ease of information access indicates the utilization of certain
tools (e.g., IT) in the project, which facilitate information sharing across project
boundaries.
The indicator “long-term relationship” was originally under the coordination construct in
the theoretical framework (Ali et al., 2009). After conducting principal component
analysis, this item was linked with other items to the spanning knowledge boundaries
(SKB) construct. Long-term relationship works as an enabler of better knowledge sharing
across project boundaries. However, one may ask, “how is this item related to
fragmentation?” To understand its role in fragmentation, we must think about it as one of
the items that measure spanning knowledge across boundaries (Ratcheva, 2009).
Mitigating the impact of fragmentation can be attained by efficient information and
knowledge sharing across boundaries. Good relationship among the team is one of the
ways that break different boundaries in the project and enable knowledge sharing.

237
“Freedom for self-organizing team/work” indicates the degree to which team members
have the autonomy to overcome barriers that contribute to fragmentation. Inadequacy of
self-organizing team can increase the negative influence of fragmentation. Ayas (1996)
indicated that the project team is one of the best ways to integrate across boundaries; with a
self-managing team, effective performance and success can be achieved. The ability of
team members to enjoy some degree of autonomy may influence their learning as well
(Sense & Antoni, 2003).
The fifth indicator of fragmentation is “inadequate focus on the owner’s (sponsor) needs.”
This indicator implies a low level of collaboration and integration within the team (Baiden
et al., 2006). In addition, inadequate collaboration within the team can influence the
performance of the project in general, and it is believed to increase fragmentation.
“Insufficient information from other consultants,” which is under SKB, indicates limited
sharing of information and explicit knowledge. This is related to a negative lateral
relationship among team members or shortcoming in the current practice in construction.
Insufficient information from other members (e.g., consultants) may be related to the
nature of the construction project, where there is always a degree of uncertainty when
conducting the work. In such cases, consultants may not be able to provide comprehensive
information about some activities/works.
Items that measure fragmentation but with low weight (less than 0.1) include language
barriers, organizational barriers, cultural barriers, contact with other professionals, solving
discrepancies or clashes, and insufficient information from previous stages. Barriers,
excluding professional barriers, have a small effect on fragmentation. People in

238
construction projects believe that cultural or organizational related barriers do not
influence their relationship. On the other hand, contact with other professionals also has a
small influence on fragmentation. This is due to ease of usage and advances of
communication tools in projects. Solving discrepancies or clashes between design and
construction may not indicate the latent dimension of fragmentation as defined in the
current study. Discrepancies are common in most projects, and solving them is considered
normal practice in construction projects. However, the efficiency of solving discrepancies
may indicate high level of communication and sharing information among team members.
Lastly, insufficient information from previous stages has low influence on fragmentation,
possibly because builders believe they have enough information from previous stages or
they can request for it when needed.
6.3.2 Dimensions of intra-project learning
The measurement of intra-project learning (INTRA-PL) includes seven reflective items
within the full model. This construct consists of two dimensions or first-order constructs,
namely INTRA 1 and INTRA 2. The first involves items that can be considered social or
simple processes of learning within projects. These include open discussion, collaboration
with new colleagues, face-to-face communication, and asking others. Meanwhile, INTRA
2 involves items that are technical or require procedural process of learning; thus, it can be
called complex process of learning. Items measuring this construct include problem
solving, implementation of new technology or methods, and job delegation.
The first item indicates the social aspect of learning is “open discussion,” which implies a
degree of transparent and frank discussion on problems and/or issues related to the project
(Knauseder et al., 2007). Open discussion help in identifying the causes of problems and
239
their solutions efficiently. “Collaboration with new colleagues” is considered one of the
items that support the development of better relationships and cooperation. According to
Knauseder et al. (2007), appropriate project preparation and cooperation among individuals
enable experience exchange and expand knowledge base. “Face-to-face communication” is
an important aspect of knowledge creation. This item, along with others, forms the
socialization mode of the knowledge creation process in Nonaka’s model. Moreover,
physical closeness is the first item in (Roth et al., 2000) for achieving knowledge creation.
Face-to-face interaction enables direct sharing of experience and immediate feedback.
Among other items that measure knowledge creation, face-to- face communication appears
to be the most frequent variable used in this context. The last item under the first
component of intra-project learning is “asking other professionals.” Although this item
appears simple, but it can be a significant approach of learning. This is because it involves
communication, experience sharing, and feedback. In addition, it indicates good
relationship with those who have the experience (mentor relationship).
The first item under the technical aspect of learning is “efficient problem solving.” One of
the main processes of organizational learning is detecting and correcting errors (Argyris &
Schön, 1978). Efficient problem solving encompasses identifying problem causes and their
solutions (Bourgeon, 2007; Kotnour, 1999; Kotnour & Hjelm, 2002). On the other hand,
Ibert (2004) referred to this process as the “task of problem solving,” which he considers
one of the main processes in project learning. Furthermore, Fong (2003) considered this
task as one of the processes of collective (self-directed) learning, which is one of the
components of knowledge creation within the construction team.

240
The second item is “implementing new technology or method” during construction. Again,
collective learning can be attained by offering people opportunities to absorb new
technology (Fong, 2003). This item was part of one component in (Knauseder et al., 2007),
which was called experimenting. Experimenting is an important process in the learning
cycle in projects (Kolb, 1984; Kotnour, 1999). Among other items in Knauseder et al.’s
(2007) model, this item appears to be the only one practiced in local construction projects.
“Job delegation” is the project leader or manager’s act of authorizing team members to
perform a certain task. In addition, job delegation is one aspect of project team
empowerment (Newcombe, 1996). Team members work – and possibly learn – better
when given the trust to perform a certain duty. Furthermore, team members may learn
when exposed to different tasks and duties. Lastly, delegating work enables individuals to
involved in certain tasks such as decision-making and coordination, which help in
establishing knowledge networks and gaining new knowledge (Teerajetgul &
Charoenngam, 2006).
6.3.3 Dimensions of inter-project learning
Inter-project learning or cross-project learning can be measured by two main components
in the context of the current study. The first component (INTER1) contains different items,
including networking, experience accumulation, and knowledge articulation. Meanwhile,
the second component (INTER2) is related mainly to knowledge codification. Both
components contain items from the two models proposed by (Prencipe & Tell, 2001) and
(Knauseder et al., 2007).

241
The first item that measures the first component (INTER1) is “visiting other projects
during the current project.” This item indicates direct sharing of knowledge from/to other
projects (Disterer, 2002). The frequency of visiting other projects may create opportunities
for direct experience sharing across projects. Knowledge accumulation in this context can
occur not only within a project but also from other people across projects.
“Communication with people from other projects” implies the level of interaction and
networking among people in different projects. In this item, degree of physical contact is
lower than the first item. However, item can be more practical than the first item, as
visiting other projects physically implies time constraints and location proximity. The third
item, which is also an aspect of networking, is “ease of finding people in current project or
other projects to answer enquiries.” Good relationship among team members is believed to
contribute to this item. Apparent advantages of networking include bridging boundaries
and enhancing learning (Knauseder et al., 2007).
Several mechanisms are encountered in knowledge accumulation and articulation,
including “de-briefing meetings,” “brainstorming sessions,” and “lessons-learned
sessions.” These mechanisms are practiced in local construction projects, or at least people
believe that they have a role in this process. In fact, these activities can work as a
preliminary process to knowledge codification, which is an integral part of inter-project
learning processes.
Knowledge articulation and codification, which represent the second component
(INTER2), consist of the first item: “review session.” In fact, review session activities
involve certain aspects of both brainstorming and writing up or codifying knowledge.

242
Similarly, “ad hoc meetings” involve some aspects of both knowledge articulation and
codification. Project team members in such meetings may highlight certain problems (or
instant issues), where meeting minutes or any other forms of knowledge codification will
take part in this process. The last two items of knowledge codification mechanisms are
“storage of project plans/audit” and “storage of important information about the project.”
Important information includes project milestones, correspondents, case writing, reports on
certain problems during construction, and others. To be more precise, these items imply
information codification rather than knowledge codification. Explicit knowledge
codification is a rather more complex process than information codification. However,
these items are able to hold sufficient information that can be treated as explicit
knowledge. Tacit knowledge is rather more difficult to codify, specifically in a
construction project, that is described as complex and multi-disciplinary arena.
6.3.4 Measurement of enablers of project learning
Enablers of project learning within fragmentation are knowledge sharing support (KS
SUPP), managerial support (MANAG SUPP), and project culture (PRO CULT). The
following paragraphs elaborate each item under these constructs.
1. Knowledge sharing support (KS SUPP): The theoretical framework of the current study
assumes that some items can facilitate knowledge sharing within fragmented projects.
There are three items under this component: “incentives for knowledge sharing,”
“relationship between companies to enable experience sharing,” and “friendship relation
to facilitate knowledge sharing.” Incentives for knowledge sharing include monetary and
non-monetary incentives. Mutual collaboration among companies includes joint venture

243
and alliance, for example. Sharing experience with friends only indicates the influence of
relationships on learning.
Surprisingly, the effect of these items on project learning within fragmentation was trivial.
Individuals possibly view knowledge as one that cannot be traded with money or other
incentives. Knowledge may be shared freely as long as it contributes to the betterment of
the project. In addition, friendship and other close relationships appear to have unessential
roles in this activity. A possible reason is that individuals are driven by the main goal of
completing the project, and they will share the necessary knowledge to achieve this goal.
2. Managerial support (MANAG SUPP): This construct consists of four items, most of
which are derived from Sense’s model of project learning. The first and second items
under this component are “enough time for learning” and “appropriate resources for
learning.” The project team shall be given sufficient time to discuss and share their
experiences in line with their daily activities on the site. Appropriate resources include
facilities for efficient meetings, communication tools, and others. According to Sense
(2007b), learning requires establishing time and a learning space for conversation and
reflection among project team members and the intervention of a “project sponsor” in the
learning space. “Organizational action” that offers learning resources (i.e., time, money,
and training programs) is an essential component in project team learning (Kotnour &
Hjelm, 2002). The third item under this component is “making decision about the way of
learning.” This item is basically about individuals’ authority to formulate decisions on the
way they create and share knowledge. It involves two aspects: individual authority leads to
better understanding of learning and project sponsor influence on this activity, which
influence individuals action to explore issues more deeply and more freely (Sense, 2008;

244
Sense & Antoni, 2003). Within the context of the current study, team members appear to
prefer less interference about their way of learning. The last item, “organizational support
of openness,” includes organizational support for accepting alternative solutions and
methods, promoting a flexible way of working, and considering new ideas (Knauseder et
al., 2007).
Managerial support in the current study has partial mediating but significant influence on
both intra-project and inter-project learning. Items under this component, as discussed in
the previous paragraphs, are essential to support learning in projects in general. The current
study found that these items partially support learning within a fragmented context.
However, one may ask, “Why do these items support learning in this context?” It appears
that these items have a strong influence that they could overcome the negative influence of
fragmentation.
3. Project culture (PRO CULT): The first item to be discussed under this component is the
“leader’s role to encourage good relationships.” Supporting good relationship in the
project team is essential not only for achieving the project goal, but also for better
experience sharing and openness. Regardless of team diversity, good relationship can thaw
boundaries between individuals. The leader has to serve as a role model and show a good
example of how to deal with others. In addition, the leader should attempt to resolve
conflicts and reduce divergence among team members. He or she may encourage
opportunities for team cohesiveness and support off-site activities. The second item is
“respecting each other’s views,” which is part of Kotnour and Hjelm (2002) study of
project culture in supporting team learning. In fact, it is a way of evaluating each other’s
experiences, which can overcome boundaries among professionals (Fong, 2003).

245
Moreover, equitable team relationship and respect for all are important elements for
achieving an integrated team (Baiden et al., 2006). The third item, “knowing each other’s
knowledge and experience,” is also a boundary object and is essential for knowledge
sharing and learning. According to Sense (2004), this item is the first step in building
“learning relationships” among individuals in projects. In addition, this item also entails
better knowledge identification and acquisition. The last item, “setting of site office or
workplace,” is considered part of learning environment support (Sense, 2007b). The
workplace setting includes the appropriate layout and provision of facilities, may create
opportunities for face-to-face interaction, communication, discussion, and reflection. A
common site office allows for situating team members in a single place, which facilitate
their integration (Baiden et al., 2006).
According to Kotnour and Hjelm (2002), project culture is one of the elements that explain
project team learning. For the current study, project culture has a significant relationship
with both intra- and inter-project learning. Thus, items under this component mainly
support learning processes within projects. Support across project learning requires the
inclusion of variables that mainly facilitate knowledge codification and transfer.
6.4 Summary
The chapter commenced with an overview of the main findings of both qualitative and
quantitative studies. However, the primary purpose of this chapter was to discuss the
results of the full model of project learning. The discussion was divided into two main
parts: structural and measurement models.

246
The first involved interpreting the relationship between the four main constructs, namely:
fragmentation, intra-project learning, inter-project learning, and enablers of learning. The
argument is that fragmentation, as a distinguished characteristic of construction, has a
significant influence on the project learning process and is important to consider if the
purpose is to attain learning. The role of enablers as intervening factors was discussed as
well. The discussion elaborated on the role of managerial support, project culture, and
knowledge sharing support. The low influence of knowledge sharing support was
interpreted. The discussion likewise involved the relationship between the four main
constructs and their sub-constructs (i.e., first and second-order constructs).
The second part focused on interpreting the relationship between the constructs and their
variables (i.e., measurement models). The discussion elaborated on each item and its role
in determining the four constructs, namely, fragmentation, intra-project learning, inter-
project, and enablers.

247
CHAPTER 7: CONCLUSION AND RECOMMENDATIONS
7.0 Summary of Objectives and Main Findings
The first objective of the study was to identify the features of project learning from
literature. Project team action to learn is one of the features of project learning. Project
learning includes some aspects of organizational learning, such as detecting and correcting
errors. Moreover, project learning can be determined by knowledge being created and
shared within and across projects. Projects encompass situated and unintentional features
of learning; thus, learning is assumed to occur in any project. In this regard, three
approaches of learning in projects can be observed: knowledge in action, integrating
different entities, and project as a challenging task. Projects are temporary and devoid of
memory; therefore, it is assumed that projects per se cannot learn. Lastly, project
characteristics may have a significant influence on shaping learning processes.
The second objective was to identify the factors that facilitate learning processes in
construction project considering fragmentation. The qualitative study was used to explore
some factors (called enablers) of project learning. These factors were purified and
validated in the quantitative study. Three main construct comprise the enablers are
knowledge sharing support, management support, and project culture, were identified.

248
The last objective was to develop the project learning model that considers fragmentation
as a distinguished characteristic of construction. The model was first developed based on
related theories and on the qualitative study. It was assumed that fragmentation has a
negative and significant relationship with intra- and inter-project learning. In addition, it
was assumed that project learning requires enablers that attain learning within this context.
The quantitative study used principal component analysis (PCA) and partial least squares-
path modeling approach (PLS-PM) for further testing of the theoretical model. The
purpose of the quantitative study was threefold: to develop the measurement models and
ascertain their reliability and validity; to examine the interdependence relationship among
constructs (i.e., path analysis and hypotheses testing of the main constructs); and to
examine the mediating effect of enablers. The empirical investigation has determined the
relationship among all constructs. In addition, several tests were conducted to attain
validity, reliability, and quality of the full model.
Two main enablers of project learning have exhibited partial mediating effect on the
relationship between project learning and fragmentation, namely, Managerial Support and
Project Culture. Meanwhile, the third enabler (i.e., Knowledge Sharing Support) had no
significant effect on both intra- and inter-project learning (refer to Figure 6.1 in the
previous chapter for the full model of project learning).

249
7.1 Contributions of the Study
The current study attempted to contribute to the theory of project learning in four areas.
First, it identified the aspects of project learning from the literature. This facilitated
understanding what project learning is and how it differs from similar concepts such as
project-based learning. In addition, the study provided a framework of project learning
comprises the indicators of this latent construct. Quantifying such construct required
rigorous process and various analyses.
Second, the project learning model that encompasses intra-project and inter-project
learning were identified as hierarchical measurement models. Intra-project learning was
determined by two constructs: “social” and “technical” or dimensions of learning. For
example, face-to-face interaction is considered as a soft dimension, while the problem-
solving process was identified under the procedural dimension. On the other hand, two
aspects of inter-project learning model were identified as well. While the first aspect
involves dimensions of experience accumulation and knowledge articulation, the second
includes dimensions of knowledge codification. Developing hierarchical measurement
models using PLS-PM retains full and concrete definition of such abstract notions. Using
this method can establish advantages in the construction field such as better understanding
of project learning process.
Third, the study advanced the theory of project learning by considering the effect of
fragmentation of construction project. It provides an empirical evidence on the extent of
fragmentation’s influence on project learning. In addition, the study was able to explain
how learning can be attained within this milieu. This was achieved by identifying the

250
factors that contribute to overcoming the negative influence of fragmentation on project
learning. The influence of these enablers was deemed to be partial between fragmentation
and project learning.
Finally, the current study advanced the fragmentation measurement scale by indicating this
concept as a multi- faceted second-order construct (Type II formative hierarchical model).
This construct was measured by formative manifest variables, while the first-order
constructs were measured by reflective manifest variables. The study recognized the latent
dimensions of fragmentation, which include more than the separation between design-and-
build process or individuals working in silos. A fragmented project team implies the
following new aspects: level of spanning of knowledge boundaries, level of team
integration, decoupling of diversity or specialization, and barriers. Determining the
concepts of fragmentation and project learning as hierarchical measurement models using
PLS-PM approach has, to the best of the researcher’s knowledge, not used previously in
construction studies.
7.2 Implications of the Study
Results of the current study have theoretical as well as practical implications. First, the
project learning model may serve as a base for other researchers to create a comprehensive
framework of the notion in construction. In addition, researchers may utilize the
measurement models (specifically the results of CFA) to conduct other investigations on
fragmentation, project learning, or the enablers of project learning. Furthermore,

251
researchers may use the same method to develop and measure other latent concepts in the
field.
Implications for practitioners include the following. Practitioners can use the result of the
study to assess the project learning situation in the industry and advance the practice of
project learning by defining what is lacking. In addition, project managers and other
stakeholders (of construction project and project-based organization) can leverage the
results of this study to understand learning and recognize its challenges. The study shows
the process of learning within and across projects, which people in the industry can adopt
to gain the benefits of learning. Moreover, practitioners can be more cautious about the
drawback of learning (i.e. variables of fragmentation) so as to tackle them more
effectively. Lastly, practitioners may focus on the enablers proposed by the current study
to stimulate learning within and across projects.
7.3 Directions for Future Research and Recommendations
The exploratory nature of the current study and purposive sampling of the quantitative
study may influence generalization of the results to the population. The study focused on
mega-size building projects only (i.e., projects undertaken by G7 companies). Further
investigation is required targeting a random sample of construction projects, including
different types of projects such as infrastructure projects. In addition, a cross-sectoral
investigation to compare the model between construction and non-construction projects
would be interesting. This will allow for generalization of the results and testing of the
model in different contexts.

252
The study was limited to investigating the influence of one independent factor:
fragmentation. Although this allowed for comprehensive investigation, considering other
characteristics of construction projects may lead to a profound model of project learning.
Other limitations of the current study, which can be covered in future studies, include
investigating the role of control variables (e.g., procurement method, team composition,
project structure, and so on) on fragmentation and project learning. Future studies may
include also investigating the influence of fragmentation and project learning on other
variables such as performance or innovation in construction projects.
To conclude, the current research is an attempt to attain efficient learning in construction
projects. Construction as an arena of various disciplines and professions, can offer many
learning opportunities for better development and efficiencies. However, fragmentation
can be one of the major drawbacks of learning and its benefits. Understanding
fragmentation’s influences on learning and how learning can be stimulated within this
context is useful. Awareness of project sponsors and top management of these issues is
important, while their support of learning activities would benefit team development and
project performance. Finally, overcoming the influence of fragmentation to achieve
learning is required for competitive, knowledge-based, and innovative construction
industry.

253
REFERENCES
Abdul-Rahman, H., Yahya, I. A., Berawi, M. A., & Low, W. W. (2008). Conceptual delay mitigation model using a project learning approach in practice. Construction Management and Economics, 26(1), 15-27.
Abdullah, F. (2004). Construction Industry & Economic Development: The Malaysian Scene (First ed.): Penerbit Universiti Teknologi Malaysia
Ajmal, M. M., & Koskinen, K. U. (2008). Knowledge transfer in project-based organizations: An organizational culture perspective. Project Management Journal, 39(1), 7–15.
Alderman, N., & Ivory, C. (2007). Partnering in major contracts: Paradox and metaphor. International Journal of Project Management, 25(2007), 386–393.
Ali, A. S., Salleh, H., & Al-Zawawi, S. A. F. (2009). Coordination devices in the refurbishment design process: A partial-correlation approach. Journal of Design and Built Environment, 5(December ), 19-30.
Alin, A. (2010). Multicollinearity. Wiley Interdisciplinary Reviews: Computational Statistics, 2(3), 370-374.
Alvesson, M. (1993). Organizations as rhetoric: Knowledge- intensive firms and the struggle with ambiguity. Joumal of Management Studies, 30(6), 997-1015.
Anderson, J. C., & Gerbing, D. W. (1988). Structural equation modeling in practice: A
review and recommended two-step approach. Psychological bulletin, 103(3), 411-423.
Anheim, F. (2003). Importance of the project team to the creation of learning within and between construction project. In B. Atkin, J. Borgbrant & P.-E. Josephson (Eds.), Construction Process Improvement (pp. 183-194). Oxford, UK: Blackwell Science
Ltd. Anumba, C., Baron, G., & Evbuomwan, N. F. (1997). Communications issues in
concurrent life-cycle design and construction. BT Technol Journal 15(1), 209 - 216. Anumba, C., Baugh, C., & Khalfan, M. (2002). Organisational structures to support
concurrent engineering in construction. Industrial Management & Data Systems,
102(5), 260 - 270. Ardichvili, A., Page, V., & Wentling, T. (2003). Motivation and barriers to participation in
virtual knowledge-sharing communities of practice. Journal of Knowledge Management, 7(1), 64-77.
Argyris, C. (1977). Double loop learning in organizations. Harvard Business Review,
55(5), 115-126. Argyris, C., & Schön, D. A. (1978). Organizational learning: A theory of action
perspective. Reading, MA: Addison-Wesley. Arthur, M. B., DeFillippi, R. J., & Jones, C. (2001). Project-based learning as the interplay
of career and company non-financial capital. Management Learning, 32(1), 99-117.
Ayas, K. (1996). Professional project management: A shift towards learning and a knowledge creating structure. International Journal of Project Management, 14(3),
131-136. Ayas, K. (1997). Integrating corporate learning with project management. International
Journal of Production Economics 51(1997), 59-67.
Ayas, K., & Zeniuk, N. (2001). Project-based learning: Building communities of reflective practitioners. Management Learning 32(1), 61-76

254
Babbie, E. (2008). The basics of social research (4th ed.): Thomson Wadsworth. Babbie, E. (2010). The practice of social research (12th ed.). Belmont Wadsworth,
Cengage Learning, USA. Bagozzi, R. P. (1994). Advanced methods of marketing research : Blackwell Business. Bagozzi, R. P., & Yi, Y. (1988). On the evaluation of structural equation models. Journal
of the Academy of Marketing Science, 16(1), 74-94. Baiden, B. K., & Price, A. D. F. (2010). The effect of integration on project delivery team
effectiveness. International Journal of Project Management, 29(2), 129-136. doi: 10.1016/j.ijproman.2010.01.016
Baiden, B. K., Price, A. D. F., & Dainty, A. R. J. (2006). The extent of team integration
within construction projects. International Journal of Project Management, 24(2006), 13–23.
Barclay, D., Higgins, C., & Thompson, R. (1995). The partial least squares (PLS) approach to causal modeling: Personal computer adoption and use as an illustration. Technology Studies, 2(2), 285-309.
Barlow, J. (2000). Innovation and learning in complex offshore construction projects. Research Policy, 29(2000), 973–989.
Barlow, J., & Jashapara, A. (1998). Organisational learning and inter-firm “partnering” in the UK construction industry. The Learning Organization, 5(2), 86 - 98.
Baron, R. M., & Kenny, D. A. (1986). The moderator-mediator variable distinction in
social psychological research: Conceptual, strategic, and statistical considerations. Journal of Personality and Social Psychology, 51(6), 1173-1182.
Barroso, C., Carrión, G. C., & Roldán, J. L. (2010). Applying maximum likelihood and PLS on different sample sizes: Studies on SERVQUAL model and employee behavior model. In V. E. Vinzi, W. W. Chin, J. Henseler & H. Wang (Eds.),
Handbook of Partial Least Squares: Concepts, Methods and Applications (pp. 427-447): Springer.
Baxter, R. (2009). Reflective and formative metrics of relationship value: A commentary essay. Journal of Business Research, 62(2009), 1370–1377. doi: 10.1016/j.jbusres.2008.12.004
Blackler, F. (1995). Knowledge, knowledge work and organizations: An overview and interpretation. Organization Studies, 16(6), 1021-1046. doi:
10.1177/017084069501600605 Bourgeon, L. (2007). Staffing approach and conditions for collective learning in project
teams: The case of new product development projects. International Journal of
Project Management, 25(2007), 413–422. Bouwen, R., Visch, J. d., & Steyaert, C. (1992). Innovation projects in organizations:
Complementing the dominant logic by organizational learning. In D. M. Hosking & N. Anderson (Eds.), Organizational change and innovation: Psychological perspectives and practices in Europe (pp. 123-148). London: Routledge.
Brady, T., Marshall, N., Prencipe, A., & Tell, F. (2002). Making sense of learning landscapes in project-based organizations. Paper presented at the OKLC 2002: The
Third European Conference on Organizational Knowledge, Learning, and Capabilities Athens, Greece.
Bresnen, M., Edelman, L., Newell, S., Scarbrough, H., & Swan, J. (2003). Social practices
and the management of knowledge in project environments. International Journal of Project Management, 21(3), 157-166.
Bresnen, M., Edelman, L., Swan, J., Laurent, S., Scarbrough, H., & Newell, S. (2002). Cross-sector research on knowledge management practices for project-based

255
learning. Paper presented at the Innovative Research in Management, European Academy of Management 2nd Annual Conference: Organisational Learning and
Knowledge Management, Stockholm, Sweden. Bresnen, M., & Marshall, N. (2001). Understanding the diffusion and application of new
management ideas in construction. Engineering, Construction and Architectural
Management, 8(5/6), 335 - 345. Brown, J. S., & Duguid, P. (1991). Organizational Learning and Communities-of-Practice:
Toward a Unified View of Working, Learning, and Innovation. Organization Science, 2(1), 40-57. doi: 10.1287/orsc.2.1.40
Bryman, A. (2004). Social research methods (2nd ed.): Oxford University Press.
Bryman, A., & Bell, E. (2007). Business research methods (Second ed.): OXFORD University Press.
Cangelosi, V. E., & Dill, W. R. (1965). Organizational learning: Observations toward a theory. Administrative Science Quarterly, 10(2), 175 - 203.
Carassus, J. (2000). A mesoeconomic analysis of the construction sector: Applied to the
French construction industry. Paper presented at the CIB W55-W65 and TG 23 - 31 -35, Reading Meeting, Reading, England.
Carlile, P. R. (2002). A pragmatic view of knowledge and boundaries: Boundary objects in new product development. Organization Science, 13(4).
Carlsson, B., & Josephson, P. E. (2001). Kommunikation i byggprojekt -verkligheter och
möjligheter (in Swedish). Gothenburg, Sweden: The Swedish Construction Federation.
Cavana, R. Y., Delahaye, B. L., & Sekaran, U. (2001). Applied business research: Qualitative and quantitative methods: John Wiley & Sons Australia.
Ceci, F., & D'Andrea, D. (2009). Knowledge dynamics in fragmented industries. Paper
presented at the DRUID, Frederiksberg, DENMARK. Chan, P., Cooper, R., & Tzortzopoulos, P. (2005). Organizational learning: conceptual
challenges from a project perspective. Construction Management and Economics, 23(2005), 747–756.
Chan, S. L., & Leung, N. N. (2004). Prototype web-based construction project
management system. Journal of Construction Engineering and Management, November/December(2004), 935 - 943.
Cheah, C. Y. J., & Chew, D. A. S. (2005). Dynamics of strategic management in the Chinese construction industry. Management Decision, 43(4), 551-567.
Cheng, M.-I., Dainty, A., & Moore, D. (2007). Implementing a new performance
management system within a project-based organization. International Journal of Productivity and Performance Management, 56(1), 60-75.
Chin, W. W. (1995). Partial Least Squares is to LISREL as principal components analysis is to common factor analysis. Technology Studies, 2(2), 315-319.
Chin, W. W. (1998a). Commentary: Issues and opinion on structural equation modeling.
MIS Quarterly, 22(1), vii-xvi. Chin, W. W. (1998b). The partial least squares approach for structural equation modeling.
In G. A. Marcoulides (Ed.), Modern methods for business research (pp. 295–236). London: Lawrence Erlbaum Associates.
Chin, W. W. (2010). How to write up and report PLS analyses. In V. E. Vinzi, W. W.
Chin, J. Henseler & H. Wang (Eds.), Handbook of Partial Least Squares: Concepts, Methods and Applications (pp. 655 - 690): Springer.
Chin, W. W., & Dibbern, J. (2010). An introduction to a permutation based procedure for multi-group PLS analysis: Results of tests of differences on simulated data and a

256
cross cultural analysis of the sourcing of information system services between Germany and the USA. In V. E. Vinzi, W. W. Chin, J. Henseler & H. Wang (Eds.),
Handbook of Partial Least Squares: Concepts, Methods and Applications (pp. 171-193): Springer.
Chin, W. W., & Newsted, P. R. (1999). Structural equation modeling analysis with small
samples using partial least squares. In R. Hoyle (Ed.), Statistical strategies for small sample research (pp. 307-341). Thousand Oaks, CA: Sage Publications.
Churchill, G. A. (1979). A paradigm for developing better measures of marketing constructs. Journal of Marketing Research, XVI (February 1979), 64-73.
CIDB. (2007). Construction Industry Master Plan Malaysia 2006-2015 (pp. 357).
Malaysia: Construction Industry Development Board. CIDB. (2011). Buletin Statistik Pembinaan Suku Tahunan - 2011 (Construction Quarterly
Statistical Bulletin) (Vol. Suku 3): CIDB. Cohen, J. (2003). Applied multiple regression/correlation analysis for the behavioral
sciences (Vol. 1): Lawrence Erlbaum.
Cohen, J., & Cohen, P. (1983). Applied multiple regression/correlation analysis for the behavioral science (2nd ed.). Mahwah, NJ: Lawrence Erlbaum.
Cook, S. D. N., & Yanow, D. (1993). Culture and organizational learning. Journal of Management Inquiry, 2(4), 373 - 390. doi: 10.1177/105649269324010
Cooper, D. R., & Schindler, P. S. (2006). Marketing Research: McGraw-Hill Irwin
Costello, A. B., & Osborne, J. W. (2005). Best practices in Exploratory Factor Analysis: Four recommendations for getting the most from your analysis. [Electronic
Article]. Practical Assessment Research & Evaluation, 10(7). Creswell, J. W. (2008). Educational research: Planning, conducting, and evaluating
quantitative and qualitative research (3rd ed.): Pearson Education International.
Creswell, J. W. (2009). Research design: Qualitative, quantitative, and mixed methods approaches (3rd ed.): Sage Publication.
Cyert, R. M., & March, J. G. (1963). A behavioural theory of the firm. Englewood Cliffs, NJ: Prentice-Hall.
Dainty, A. R. J., Cheng, M.-I., & Moore, D. R. (2005). Competency-based model for
predicting construction project managers’ performance. Journal of Management in Engineering, 21(1), 2-9.
Dave, B., & Koskela, L. (2009). Collaborative knowledge management - A construction case study. Automation in Construction, 18(2009), 894–902.
Davenport, T. H., & Prusak, L. (2000). Working knowledge: How organizations manage
what they know. Boston, Massachusetts: Harvard Business School Press. Davey, C. L., Powell, J. A., Cooper, I., & Powell, J. E. (2004). Innovation, construction
SMEs and action learning. Engineering, Construction and Architectural Management, 11(4), 230–237. doi: 10.1108/ 09699980410547586
De Geus, A. P. (1988). Planning as learning. Harvard Business Review, 66(2), 70-74.
DeFillippi, R. J. (2001). Introduction: Project-based learning, reflective practices and learning outcome. Management Learning, 32(1), 5-10.
Demaid, A., & Quintas, P. (2006). Knowledge across cultures in the construction industry: Sustainability, innovation and design. Technovation, 26(2006), 603-610.
Diamantopoulos, A. (2010). Reflective and formative metrics of relationship value:
Response to Baxter's commentary essay. Journal of Business Research, 63(2010), 91–93. doi: 10.1016/j.jbusres.2009.03.001
257
Diamantopoulos, A., Riefler, P., & Roth, K. P. (2008). Advancing formative measurement models. Journal of Business Research, 61(2008), 1203–1218. doi:
10.1016/j.jbusres.2008.01.009 Dijkstra, T. K. (1983). Some comments on maximum likelihood and partial least squares
methods. Journal of Econometrics, 22(1-2), 67-90.
Dijkstra, T. K. (2010). Latent variables and indices: Herman Wold’s basic design and partial least squares. In V. E. Vinzi, W. W. Chin, J. Henseler & H. Wang (Eds.),
Handbook of Partial Least Squares: Concepts, Methods and Applications (pp. 23-46): Springer.
Disterer, G. (2002). Management of project knowledge and experiences. Journal of
Knowledge Management, 6(5), 512-520. doi: 10.1108/13673270210450450 Drejer, I., & Vinding, A. L. (2004). Organization anchoring of knowledge and innovation
activity in the construction industry. Paper presented at the DRUID Summer Conference 2004 on Industrial Dynamics, innovation and development, Elsinore, Denmark.
Drejer, I., & Vinding, A. L. (2006). Organisation, 'anchoring' of knowledge, and innovative activity in construction. Construction Management and Economics,
September(24), 921-931. Duarte, P. A. O., & Raposo, M. L. B. (2010). A PLS model to study brand preference: An
application to the mobile phone market. In V. E. Vinzi, W. W. Chin, J. Henseler &
H. Wang (Eds.), Handbook of Partial Least Squares: Concepts, Methods and Applications (pp. 449-485): Springer.
Duffy, K., Graham, B., & Thomas, K. (2007). Assessing the potential for construction collaboration technologies (CCT) in small to medium enterprises in the Irish construction industry. Paper presented at the 23rd Annual ARCOM Conference, 3-
5 September, Belfast, UK. Dulaimi, M. F., Ling, F. Y. Y., Ofori, G., & Silva, N. D. (2002). Enhancing integration and
innovation in construction. Building Research & Information, 30(4), 237–247. Dunn, S. C., Seaker, R. F., & Waller, M. A. (1994). Latent variables in business logistics
research: Scale development and validation. Journal of Business Logistics, 15(2),
145-172. Dupagne, A. (1991). Computer integrated building: Sreategic final report: ESPRIT II.
Easterby-Smith, M., & Lyles, M. A. (2005). Introduction: Watersheds of organizational learning and knowledge management. In M. Easterby-Smith & M. A. Lyles (Eds.), Handbook of organizational learning and knowledge management (pp. 1-15):
Blackwell Publishing. Edwards, J. R. (2011). The fallacy of formative measurement. Organizational Research
Methods, 14(2), 370-388. doi: 10.1177/1094428110391814 Egan, J. (1998). Rethinking construction: The report of the construction task force.
London: HMSO.
Egbu, C. (2006). Knowledge production and capabilities – their importance and challenges for construction organisations in China. Journal of Technology Management in
China, 1(3), 304-321. Engeström, Y. (1987). Learning by expanding. An activity-theoretical approach to
developmental research. Helsinki: Orienta-Konsultit.
Epple, D., Argote, L., & Devadas, R. (1991). Organizational learning curves: A method for investigating intra-plant transfer of knowledge acquired through learning by doing.
Organization Science, 2(1), 58 - 70. doi: 10.1287/orsc.2.1.58

258
Éthier, J., Hadaya, P., Talbot, J., & Cadieux, J. (2006). B2C web site quality and emotions during online shopping episodes: An empirical study. Information & Management,
43(2006), 627–639. doi: 10.1016/j.im.2006.03.004 Falk, R. F., & Miller, N. B. (1992). A primer for soft modeling : Akron, Ohio : University
of Akron Press.
Fellows, R. F., & Liu, A. M. M. (2003). Research methods for construction (2nd ed.): Blackwell Publishing.
Field, A. (2000). Discovering statistics using SPSS for Windows: Advanced techniques for the beginner. London: Sage Publications.
Fischer, M., & Tatum, C. B. (1997). Characteristics of design-relevant constructability
knowledge. Construction Engineering and Management, 123(3), 253 - 260. doi: 10.1061/(ASCE)0733-9364
Fong, P. S. W. (2003). Knowledge creation in multidisciplinary project teams: an empirical study of the processes and their dynamic interrelationships. International Journal of Project Management, 21(2003), 479–486.
Fong, P. S. W. (2005). Co-creation of knowledge by multidisciplinary project teams. In P. E. D. Love, P. S. W. Fong & Z. Irani (Eds.), Management of knowledge in project
environments (pp. 41-56): Elsevier/Butterworth-Heinemann. Forgues, D., Koskela, L., & Lejeune, A. (2009). Information Technology as boundary
object for transformational learning. Journal of Information Technology in
Construction (ITcon), 14(2009), 48 - 58. Fornell, C., & Bookstein, F. L. (1982). Two structural equation models: LISREL and PLS
applied to consumer exit-voice theory. Journal of Marketing Research, 19(4), 440-452.
Fornell, C., & Larcker, D. F. (1981). Evaluating structural equation models with
unobservable variables and measurements error. Journal of Marketing Research 18(1), 39-50.
Franco, L. A., Cushman, M., & Rosenhead, J. (2004). Project review and learning in the construction industry: Embedding a Problem Structuring Method within a partnership context. European Journal of Operational Research, 152(2004), 586-
601. Fu, W.-K., Lo, H.-P., & Drew, D. S. (2006). Collective learning, collective knowledge and
learning networks in construction. Construction Management and Economics, 24(10), 1019-1028.
Fujimoto, T., Clark, K. B., & Aoshima, Y. (1992). Managing the product line: A case of
the automobile industry. Working paper. Harvard Business School. Garcia, M. A. (2005). Challenges of the construction sector in the global economy and the
knowledge society. International Journal of Strategic Property Management, 9(2005), 65 - 77.
Garratt, B. (1987). The Learning Organization. London: Fontana Press.
Garvin, D. (1993). Building a learning organization: Harvard Business Review. Gherardi, S., Nicolini, D., & Odella, F. (1998). Toward a social understanding of how
people learn in organizations: The notion of situated curriculum. Management Learning, 29(3), 273-297.
Gieskes, J. F. B., & Broeke, A. M. t. (2000). Infrastructure under construction: continuous
improvement and learning in projects. Integrated Manufacturing Systems, 11(3), 188-198.
Girden, E. R. (2001). Evaluating research articles from start to finish (Second ed.): Sage Publication.

259
Glaser, B. G., & Strauss, A. L. (1967). The discovery of grounded theory: strategies for qualitative research. Chicago: Aldine Publishing Company.
Gonz'alez, M., Arru'nada, B., & Fern'andez, A. (1998). Regulation as a cause of firm fragmentation: The case of the Spanish construction industry. International Review of Law and Economics, 18(1998), 433-450.
Gordon, R. A. (1968). Issues in multiple regression. American Journal of Sociology, 592-616.
Gray, P. H., & Meister, D. B. (2006). Knowledge sourcing methods. Information & Management, 43(2), 142-156. doi: 10.1016/j.im.2005.03.002
Groák, S. (1994). Is construction an industry? Construction Management and Economics,
12(1994), 287-293. Guenzi, P., Georges, L., & Pardo, C. (2009). The impact of strategic account managers'
behaviors on relational outcomes: An empirical study. Industrial Marketing Management 38 (2009), 300–311. doi: 10.1016/j.indmarman.2007.09.011
Haenlein, M., & Kaplan, A. M. (2004). A beginner’s guide to partial least squares analysis.
Understanding Statistics, 3(4), 283–297. Hair, J. F., Black, W. C., Babin, B. J., Anderson, R. E., & Tatham, R. L. (2006).
Multivariate data analysis (6th ed.): Pearson Education International. Hall, M. (2004 ). Inter-project learning in construction using quality costing. Working
paper vol. 1, 2004/5- 5. University of Bristol, Department of Management.
Hällgren, M., & Wilson, T. L. (2007). Mini-muddling: learning from project plan deviations. Journal of Workplace Learning, 19(2), 92-107. doi:
10.1108/13665620710728475 Hari, S., Egbu, C., & Kumar, B. (2005). A knowledge capture awareness tool An empirical
study on small and medium enterprises in the construction industry. Engineering,
Construction and Architectural Management, 12(6), 533-567. Hartmann, A., & Caerteling, J. (2005). The influence of social networks on inter-firm
exchange in construction. Paper presented at the 11th Joint CIB International Symposium Combining Forces – Learning from Experiences: New Challenges, Theories, and Practices in Construction, Helsinki, Finland.
Hasle, P., Kines, P., & Andersen, L. P. (2009). Small enterprise owners’ accident causation attribution and prevention. Safety Science, 47(2009), 9–19. doi:
10.1016/j.ssci.2007.12.005 Henseler, J. (2010). On the convergence of the partial leas t squares path modeling
algorithm. Computational Statistics, 25(1), 107-120. doi: 10.1007/s00180-009-
0164-x Hertog, P. d., & Brouwer, E. (2001). Innovation in the Dutch construction cluster. In P. d.
Hertog & S. Remoe (Eds.), Innovative clusters: drivers of national innovation systems (pp. 203-228): Organisation for Economic Co-operation and Development.
Hillebrandt, P. M. (2000). Economic Theory and the construction industry (3rd ed.):
MacMillan Press Ltd. Hocking, R. R., & Pendleton, O. J. (1983). The regression dilemma. Communications in
Statistics-Theory and Methods, 12(5), 497-527. doi: 10.1080/03610928308828477 Holmbeck, G. N. (1997). Toward terminological, conceptual, and statistical clarity in the
study of mediators and moderators: Examples from the child-clinical and pediatric
psychology literatures. Journal of Consulting and Clinical Psychology, 65(4), 599-610. doi: 10.1037/0022-006X.65.4.599

260
Hore, A. V., West, R. P., & Redmond, A. (2009). The future scenario of creating a digital SME community in the Irish construction industry. Paper presented at the CIB W78
(Managing Construction for Tomorrow), Istanbul. Horn, J. L. (1965). A rationale and test for the number of factors in factor analysis.
Psychometrika, 30, 179-185.
Horvath, L., Callahan, J. L., Croswell, C., & Mukri, G. (1996). Team sensemaking: An imperative for individual and organizational learning. Paper presented at the
Academy of Human Resource Development Conference. Huber, G. P. (1991). Organizational learning: The contributing processes and the
literatures. Organization Science, 2(1), 88-115. doi: 10.1287/orsc.2.1.88
Huemer, L., & Östergren, K. (2000). Strategic change and organizational learning in two ‘Swedish’ construction firms. Construction Management and Economics,
18(2000), 635–642. Hulland, J., Ryan, M. J., & Rayner, R. K. (2010). Modeling customer satisfaction: A
comparative performance evaluation of covariance structure analysis versus partial
least squares. In V. E. Vinzi, W. W. Chin, J. Henseler & H. Wang (Eds.), Handbook of Partial Least Squares: Concepts, Methods and Applications (pp. 307-
324): Springer. Ibert, O. (2004). Projects and firms as discordant complements: organisational learning in
the Munich software ecology. Research Policy, 33(2004), 1529–1546.
Issa, R. R. A., & Haddad, J. (2008). Perceptions of the impacts of organizational culture and information technology on knowledge sharing in construction. Construction
Innovation, 8(3), 182-201. Jarvis, C. B., Mackenzie, S. B., & Podsakoff, P. M. (2003). A critical review of construct
indicators and measurement model misspecification in marketing and consumer
research. Journal of Consumer Research, 30 (September), 199-218. Jöreskog, K. G., & Wold, H. (1982). The ML and PLS techniques for modeling with latent
variables: Historical and comparative aspects. In K. G. Jöreskog & H. Wold (Eds.), Systems Under Indirect Observation: Causality, Structure, Prediction (Vol. I, pp. 263-270). Amsterdam: North-Holland.
Josephson, P. E. (1994). Causes of defects in building (in Swedish). PhD, Chalmers University of Technology, Göteborg, Sweden. (Report 40)
Juran, J. M. (1988). Juran on planning for quality. New York: The Free Press. Kagioglou, M., Cooper, R., Aouad, G., & Sexton, M. (2000). Rethinking construction: the
generic design and construction process protocol. Engineering, Construction and
Architectural Management, 7(2), 141–153. Kaplan, A. (1964). The conduct of inquiry: Methodology for behavioral science. San
Francisco: Chandler. Keegan, A., & Turner, R. (2001). Quantity versus quality in project-based learning
practices. Management Learning, 32(1), 77-98.
Kelloway, E. K. (1995). Structural equation modelling in perspective. Journal of Organizational Behavior, 16(3), 215-224.
Kleinbaum, D. G., Kupper, L. L., & Muller, K. E. (2007). Applied regression analysis and other multivariable methods: Duxbury Pr.
Knauseder, I., Josephson, P.-e., & Styhre, A. (2003). Learning capability in construction
projects: from the learning organisation to the learning project . Paper presented at the CIB, W99 (Construction Project Management System: The Challegne of
Integration), São Paulo, Brazil
261
Knauseder, I., Josephson, P.-e., & Styhre, A. (2007). Learning approaches for housing, service and infrastructure project organizations. Construction Management and
Economics, 25(August 2007), 857–867. Kock, N. (2011). Using WarpPLS in e-collaboration studies: An overview of five main
analysis steps. International Journal of e-Collaboration, 6(4), 1-11. doi:
10.4018/jec.2010100101 Kofman, F., & Senge, P. (1995). Communities of commitment: The heart of learning
organizations. In S. Chawla & J. Renesch (Eds.), Learning Organizations: Developing Cultures for Tomorrow’s Workplace (pp. 572). New York: Productivity Press
Kolb, D. A. (1984). Experiential learning: experience as the source of learning and development. New Jersey: Prentice-Hall.
Koskela, L. (1992). Application of the new production philosophy to construction CIFE Technical Report 72: CIFE (center for integrated facility engineering), Stanford University
Koskinen, K. U., & Mäkinen, S. (2009). Role of boundary objects in negotiations of project contracts. International Journal of Project Management, 27(2009), 31–38.
Kotnour, T. (1999). A learning framework for project management. Project Management Journal, 30(2), 32-38.
Kotnour, T. (2000). Organizational learning practices in the project management
environment. International Journal of Quality & Reliability Management, 17(4/5), 393-406.
Kotnour, T., & Hjelm, M. (2002). Leadership mechanisms for enabling learning within project teams. Paper presented at the The Third European Conference on Organizational Knowledge, Learning and Capabilities (OKLC 3), Athens, Greece.
Kotnour, T., & Kurstedt, H. (2000). Understanding the Lessons-Learned Process. International Journal of Cognitive Ergonomics, 4(4), 311–330.
Kotnour, T., & Proctor, M. (1996). Processes and tools to support knowledge management in a virtual organization. Paper presented at the International Conference on Engineering and Technology Management, IEMC 96., Vancouver, BC, Canada.
Kotnour, T., & Vergopia, C. (2005). Learning-based project reviews: Observations and lessons learned from the Kennedy Space Center. Engineering Management
Journal, 17(4), 30-38. Kotnour, T., & Vergopia, C. (2007, 5-9 August,). A framework and findings for learning
based project reviews. Paper presented at the PICMET 2007 Proceedings, Portland,
Oregon - USA. Kululanga, G. K. (2009). Construction process improvement through cognitive power
under team generative learning. Engineering, Construction and Architectural Management, 16(4), 307 - 324. doi: 10.1108/09699980910970815
Landaeta, R. E. (2008). Evaluating benefits and challenges of knowledge transfer across
projects. Engineering Management Journal, 20(1), 29-38. Lange, J. E., & Mills, D. Q. (1979). An introduction to the construction sector of the
economy. In J. E. Lange & D. Q. Mills (Eds.), The Construction Industry: Lexington Books.
Langford, D., & Male, S. (2001). Strategic management in construction (2nd ed.). London
Blackwell Science. Lave, J., & Wenger, E. (1991). Situated Learning: legitimate peripheral participation.
Cambridge Cambridge University Press.

262
Law, K. M. Y., & Chuah, K. B. (2004). Project-based action learning as learning approach in learning organisation: the theory and framework. Team Performance
Management, 10(7/8), 178-186. Leinonen, P., & Bluemink, J. (2008). The distributed team members’ explanations of
knowledge they assume to be shared. Journal of Workplace Learning, 20(1), 38-53.
Liu, C., Sia, C. L., & Wei, K. K. (2008). Adopting organizational virtualization in B2B firms: An empirical study in Singapore. Information & Management, 45(7), 429-
437. doi: 10.1016/j.im.2008.06.005 Liu, J., Li, B., Lin, B., & Nguyen, V. (2007). Key issues and challenges of risk
management and insurance in China’s construction industry: An empirical study.
Industrial Management & Data Systems, 107(3), 382-396. Liu, L., Georgakis, P., & Nwagboso, C. (2007, August 18 - 21). A theoretical framework of
an integrated logistics system for UK construction industry. Paper presented at the Proceedings of the IEEE International Conference on Automation and Logistics, Jinan, China.
Lohmöller, J.-B. (1987). LVPLS program manual (Version 1.8): Zentralarchiv für Empirische Sozialforschung, Universität Zu Köln, Köln.
Lohmöller, J.-B. (1989). Latent variable path modeling with partial least squares. Heildelberg: Physica-Verlag.
Love, P. E. D., Fong, P. S. W., & Irani, Z. (2005). Management of knowledge in project
environments: Elsevier/Butterworth-Heinemann. Love, P. E. D., Huang, J. C., Edwards, D. J., & Irani, Z. (2004). Nurturing a learning
organization in construction: a focus on strategic shift, organizational transformation, customer orientation and quality centered learning. Construction Innovation, 4(2004), 113–126. doi: 10.1191=1471417504ci070oa
Love, P. E. D., Irani, Z., & Edwards, D. J. (2003). Learning to reduce rework in projects: Analysis of firm's organizational learning and quality practices. Project
Management Journal, 34(3), 13-25. Love, P. E. D., Irani, Z., & Edwards, D. J. (2004a). Industry-centric benchmarking of
information technology benefits, costs and risks for small-to-medium sized
enterprises in construction. Automation in Construction, 13(2004), 507– 524. Love, P. E. D., Irani, Z., & Edwards, D. J. (2004b). A seamless supply chain model for
construction. Supply Chain Management: An International Journal, 9(1), 43–56. Love, P. E. D., Li, H., Irani, Z., & Faniran, O. (2000). Total quality management and the
learning organization: a dialogue for change in construction. Construction
Management and Economics 18(3), 321-331. doi: 10.1080/014461900370681 Love, P. E. D., Li, H., Irani, Z., & Holt, G. D. (2000). Re-thinking TQM: toward a
framework for facilitating learning and change in construction organizations. The TQM Magazine, 12(2), 107-116.
Love, P. E. D., Tse, R. Y. C., Holt, G. D., & Proverbs, D. G. (2002). Transaction costs,
learning, and alliances. Journal of Construction Research, 3(2), 193-207. MacKenzie, S. B. (2003). The dangers of poor construct conceptualization. Journal of the
Academy of Marketing Science, 31(3), 323-326. doi: 10.1177/0092070303254130 Malhotra, N. K. (2003). Marketing research: An applied orientation (4th ed.): Pearson
Prentice Hall.
Malone, D. (2002). Knowledge Management: A model for organizational learning. International Journal of Accounting Information Systems, Pergamon(3), 111-123.

263
Maqsood, T., Finegan, A., & Walker, D. (2006). Applying project histories and project learning through knowledge management in an Australian construction company.
The Learning Organization, 13(1), 80-95. Maqsood, T., Walker, D., & Finegan, A. (2007). Extending the “knowledge advantage”:
creating learning chains. The Learning Organization, 14(2), 123-141.
March, J. G. (1991). Exploration and exploitation in organizational learning. Organization Science, 2(1), 71 - 87. doi: 10.1287/orsc.2.1.71
March, J. G., & Simon, H. A. (1958). Organizations. New York: Wiley. Marquardt, D. W. (1970). Generalized inverses, ridge regression, biased linear estimation,
and nonlinear estimation. Technometrics, 12(3), 591-612.
Mian, A., & Takala, J. (2008). Knowledge activities and learning in project-based industry: Relation to organizational culture. Paper presented at the 10th IBIMA
Conference, Kuala Lumpur, Malaysia. Midler, C., & Beaume, R. (2010). Project-based learning patterns for dominant design
renewal: The case of electric vehicle. International Journal of Project
Management, 28(2010), 142–150. doi: 10.1016/j.ijproman.2009.10.006 Mohamed, S., & Tucker, S. (1996). Options for applying BPR in the Australian
construction industry. International Journal of Project Management, 14(6), 379-385.
Mosey, D. (2009). Early contractor involvement in building procurement: Contracts,
partnering and project management: Wiley-Blackwell. Mumford, A. (1994). Four approaches to learning from experience. Learning
Organization, 1(1), 4-10. doi: 10.1108/09696479410053386 Mumford, A. (1995). Four approaches to learning from experience. Industrial and
Commercial Training, 27(8), 12-19.
Murdoch, J., & Hughes, W. (2008). Construction contracts: Law and management (4th ed.): Taylor & Francis.
Na, L. J., Ofori, G., Ling, F. Y. Y., & Hua, G. B. (2007). Role of national institutions in promoting innovation by contractors in Singapore. Construction Management and Economics, 25(October 2007), 1021–1039.
Naoum, S. (2003). An overview into the concept of partnering. International Journal of Project Management, 21(2003), 71–76.
Nelson, R. R., & Winter, S. G. (1982). An evolutionary theory of economic change : Harvard University Press.
Nevison, J. M. (1994). What can we learn about learning on projects? Project Management
Network, 8(6), 6-8. Newcombe, R. (1996). Empowering the construction project team. International Journal
of Project Management, 14(2), 75-80. Newell, S. (2004). Enhancing cross-project learning. Engineering Management Journal,
16(1), 12-20.
Newell, S. (2005). Knowledge transfer and learning: Problems of knowledge transfer associated with trying to short-circuit the learning cycle. Journal of Information
Systems and Technology Management, 2(3), 275-290. Newell, S., Scarbrough, H., Swan, J., Robertson, M., & Galliers, R. D. (2002). The
importance of process knowledge for cross project learning: Evidence from a UK
hospital. Paper presented at the Proceedings of the 35th Annual Hawaii International Conference on System Sciences, Hawaii.
Nicolini, D., & Meznar, M. B. (1995). The social construction of organizational learning: Conceptual and practical issues in the field. Human Relations, 48(7), 727-746.

264
Nitithamyong, P., & Skibniewski, M. C. J. (2004). Web-based construction project management systems: how to make them successful? Automation in Construction,
13(2004), 491-506. Nobeoka, K. (1995). Inter-project learning in new product development. Academy of
Management Journal(1995), 432-436.
Nonaka, I. (1999). The dynamics of knowledge creation. In R. Ruggles & D. Holtshouse (Eds.), The knowledge advantage: 14 visionaries define marketplace success in
new economy (pp. 64-87). Oxford, UK: Ernst & Young LLP. Nonaka, I., & Takeuchi, H. (1995). The knowledge-creating company: How Japanese
companies create the dynamics of innovation. Oxford: Oxford University Press.
Nonaka, I., Toyama, R., & Konno, N. (2000). SECI, Ba and leadership: A unified model of dynamic knowledge creation. Long Range Planning, 33(1), 5–34.
Nunnally, J. C. (1978). Psychometric theory. New York McGraw-Hill. O'Connor, B. P. (2000). SPSS and SAS programs for determining the number of
components using parallel analysis and Velicer's MAP test. Behavior Research
Methods, Instrumentation, and Computers, 32(3), 396-402. Ofori, G. (1993). Managing construction industry development: lessons from Singapore's
experience: Singapore University Press. Ofori, G. (2003). Preparing Singapore’s construction industry for the knowledge-based
economy: practices, procedures and performance. Construction Management and
Economics, 21(2003), 113–125. Oragne, G., Onions, P., Burke, A., & Colledge, B. (2005). Knowledge management:
Facilitating organizational learning within the construction industry. In A. S. Kazi (Ed.), Knowledge management in the construction industry: a socio-technical perspective: Idea Group Publishing.
Örtenblad, A. (2004). The learning organization: towards an integrated model. The Learning Organization, 11(2), 129-144.
Packendroff, J. (1995). Inquiring into the temporary organization: New directions for project management research. Scandinavian Journal of Management, 11(4), 319-333. doi: 10.1016/0956-5221(95)00018-Q
Pan, S. L., & Scarbrough, H. (1998). A socio-technical view of knowledge-sharing at Buckman Laboratories. Journal of Knowledge Management, 2(1), 55-66.
Pedler, M., Boydell, T., & Burgoyne, J. G. (1989). Towards the learning company. Management Education and Development, 20(1), 1 - 8.
Phelps, A. F., & Reddy, M. (2009). The influence of boundary objects on group
collaboration in construction project teams. Paper presented at the ACM 2009 international conference on supporting group work, Sanibel Island, Florida, USA
Poell, R. F. (1998). Organizing work-related learning projects: A network approach. Nijmegen: Katholieke Universiteit.
Poell, R. F. (2000). Learning-project structures in different work types: an empirical
analysis. Human Resource Development International, 3(2), 179–193. Prencipe, A., & Tell, F. (2001). Inter-project learning: processes and outcomes of
knowledge codification in project-based firms. Research Policy, 30(2001), 1373-1394.
Ratcheva, V. (2009). Integrating diverse knowledge through boundary spanning processes
– The case of multidisciplinary project teams. International Journal of Project Management, 27(2009), 206–215. doi: 10.1016/j.ijproman.2008.02.008

265
Ren, Z., & Anumba, C. J. (2002). Learning in multi-agent systems: A case study of construction claims negotiation. Advanced Engineering Information, 16(2002),
265-275. Ringle, C. M., Wende, S., & Will, A. (2005). SmartPLS 2.0 M3, www.smartpls.de.
Hamburg, Germany. Retrieved from www.smartpls.de.
Roth, J., Florén, H., & Ingelgård, A. (2000). Knowledge creation in the context of continuous improvements. Paper presented at the EIASM, Cambridge.
Scarbrough, H., Bresnen, M., Edelman, L. F., Laurent, S., Newell, S., & Swan, J. (2004). The processes of project-based learning: An exploratory study. Management Learning, 35(4), 491-506. doi: 10.1177/1350507604048275
Scarbrough, H., & Swan, J. (2008). Project work as a locus of learning: the journey through practice. In A. Amin & J. Roberts (Eds.), Community, economic creativity,
and organization (pp. 148 -177). Oxford: Oxford University Press. Schindler, M., & Eppler, M. J. (2003). Harvesting project knowledge: A review of project
learning methods and success factors. International Journal of Project
Management, 21(2003), 219-228. Senge, P. M. (1990). The fifth discipline: The art and practice of the learning organization
(1st ed.). New York: Doubleday Currency. Sense, A. J. (2004). An architecture for learning in projects? Journal of Workplace
Learning, 16(3), 123-145.
Sense, A. J. (2005). Facilitating conversational learning in a project team practice. Journal of Workplace Learning, 17(3), 178-193.
Sense, A. J. (2007a). Learning within project practice: Cognitive styles exposed. International Journal of Project Management, 25(2007), 33–40.
Sense, A. J. (2007b). Structuring the project environment for learning. International
Journal of Project Management, 25(2007), 405–412. Sense, A. J. (2008). The conditioning of project participants’ authority to learn within
projects. International Journal of Project Management, 26(2008), 105–111. Sense, A. J. (2009). The social learning character of projects and project teams.
International Journal of Knowledge Management Studies, 3(3-4), 195 - 208
Sense, A. J., & Antoni, M. (2003). Exploring the politics of project learning. International Journal of Project Management, 21(2003), 487–494.
Seymour, H. (1987). The multinational construction industry: Croom Helm. Simon, H. A. (1991). Bounded rationality and organizational learning. Organization
Science, 2(1), 125-134. doi: 10.1287/orsc.2.1.125
Sobel, M. E. (1982). Asymptotic confidence intervals for indirect effects in structural equation models. Sociological Methodology, 13(1982), 290-312. doi:
10.2307/270723 Sorrell, S. (2003). Making the link: climate policy and the reform of the UK construction
industry. Energy Policy, 31(2003), 865–878.
Sosik, J. J., Kahai, S. S., & Piovoso, M. J. (2009). Silver bullet or voodoo statistics? A primer for using the Partial Least Squares data analytic technique in group and
organization research. Group & Organization Management Decision, 34(1), 5-36. doi: 10.1177/1059601108329198
Stacey, R. D. (2001). Complex responsive processes in organizations: Learning and
knowledge creation: Psychology Press. Stahl, G. (2002). Contributions to a theoretical framework for CSCL. Paper presented at
the Computer Supported Collaborative Learning (CSCL 2002), Boulder, USA.

266
Star, S. L. (1989). The structure of ill- structured solutions: Boundary objects and heterogeneous distributed problem solving. In M. Huhns & L. Gasser (Eds.),
Readings in Distributed Artificial Intelligence. Menlo Park, C A.: Morgan Kaufman.
Star, S. L., & Griesemer, J. R. (1989). Institutional ecology, 'translations' and boundary
objects: Amateurs and professionals in Berkeley's Museum of vertebrate zoology, 1907-39. Social Studies of Science, 19(3), 387-420.
Starbuck, W. H. (1992). Learning by knowledge- intensive firms. Journal of Management Studies, 29(6), 713-740. doi: 10.1111/j.1467-6486.1992.tb00686.x
Starbuck, W. H. (1993). Keeping a butterfly and an elephant in a house of cards: The
elements of exceptional success. Journal of Management Studies, 30(6), 885-921. doi: 10.1111/j.1467-6486.1993.tb00471.x
Stewart, R. A., Mohamed, S., & Marosszeky, M. (2004). An empirical investigation into the link between information technology implementation barriers and coping strategies in the Australian construction industry. Construction Innovation,
4(2004), 155–171. Storm, P., & Savelsbergh, C. (2005). Lack of managerial learning as a potential cause of
project failure. Paper presented at the Proceedings SAM 18 conference, Arhus, Danmark.
Straub, D., Boudreau, M.-C., & Gefen, D. (2004). Validation guidelines for IS positivist
research. Communications of the Association for Information Systems, 13(1), 380-427.
Sun, P. Y. T. (2006). A method for assessing and developing features of the learning organization. PhD, University of Waikato, Hamilton.
Sun, P. Y. T., & Scott, J. L. (2005). An investigation of barriers to knowledge transfer.
Journal of Knowledge Management, 9(2), 75-90. Swan, J., Newell, S., Scarbrough, H., & Hislop, D. (1999). K nowledge management and
innovation: Networks and networking Journal of Knowledge Management, 3(4), 262-275.
Tabachnick, B. G., & Fidell, L. S. (1989). Using multivariate statistics (2nd ed.). New
York: HarperCollins College Publishers. Tan, W., & Elias, Y. (2000). Learning by doing in Singapore construction. Journal of
Construction Research, 1(2), 151-158. Täube, F. A. (2007). Sourcing and transfer of knowledge in international projects. Paper
presented at the IRNOP VIII Project Research Conference: Projects in Innovation,
Innovation in Projects, Brighton, UK. Teerajetgul, W., & Charoenngam, C. (2006). Factors inducing knowledge creation:
empirical evidence from Thai construction projects. Engineering, Construction and Architectural Management, 13(6), 584-599.
Temme, D., Kreis, H., & Hildebrandt, L. (2010). A comparison of current PLS Path
Modeling software: Features, ease-of-use, and performance. In V. E. Vinzi, W. W. Chin, J. Henseler & H. Wang (Eds.), Handbook of Partial Least Squares:
Concepts, Methods and Applications (pp. 798): Springer. Tenenhaus, M., & Hanafi, M. (2010). A bridge between PLS Path Modeling and multi-
block data analysis. In V. E. Vinzi, W. W. Chin, J. Henseler & H. Wang (Eds.),
Handbook of Partial Least Squares: Concepts, Methods and Applications (pp. 99-123): Springer.

267
Tenenhaus, M., Vinzi, V. E., Chatelin, Y.-M., & Lauro, C. (2005). PLS path modeling. Computational Statistics & Data Analysis, 48 (2005), 159 – 205. doi:
10.1016/j.csda.2004.03.005 Tijhuis, W., & Maas, G. J. (1996). Construction-process: Fragmentation or integration?
Some international experiences 41(2), 125 - 138. Retrieved from
Turel, O., Serenko, A., & Bontis, N. (2007). User acceptance of wireless short messaging services: Deconstructing perceived value. Information & Management, 44(1), 63-
73. Turner, J., & Müller, R. (2003). On the nature of the project as a temporary organization.
International Journal of Project Management, 21(1), 1-8.
Vakola, M., & Rezgui, Y. (2000). Organizational learning and innovation in the construction industry. The Learning Organization 7(4), 174-183.
Vilares, M. J., Almeida, M. H., & Coelho, P. S. (2010). Comparison of likelihood and PLS estimators for structural equation modeling: A simulation with customer satisfaction data. In V. E. Vinzi, W. W. Chin, J. Henseler & H. Wang (Eds.),
Handbook of Partial Least Squares: Concepts, Methods and Applications (pp. 289-305): Springer.
Vinzi, V. E., Trinchera, L., & Amato, S. (2010). PLS Path Modeling: From foundations to recent developments and open issues for model assessment and improvement. In V. E. Vinzi, W. W. Chin, J. Henseler & H. Wang (Eds.), Handbook of Partial Least
Squares: Concepts, Methods and Applications (pp. 47-82): Springer. Vlies, R. D. v. d., & Maas, G. J. (2009). A social capital perspective to innovation
management in construction. Paper presented at the 26th International Symposium on Automation and Robotics in Construction (ISARC 2009).
Vock', P. (2001). An anatomy of the Swiss construction cluster In P. d. Hertog & S. Remoe
(Eds.), Innovative clusters: drivers of national innovation systems (pp. 229-247): Organisation for Economic Co-operation and Development.
von Krogh, G. (2005). Knowledge sharing and the communal resource. In M. Easterby-Smith & M. A. Lyles (Eds.), Handbook of Organizational Learning and Knowledge Management (pp. 372 - 392): Blackwell Publishing.
Wetzels, M., Odekerken-Schröder, G., & Oppen, C. v. (2009). Using PLS path modeling for assessing hierarchical construction models: Guidelines and empirical
illustration. MIS Quarterly, 33(1), 177-195 Wheelwright, S. C., & Clark, K. B. (1992). Revolutionizing Product Development:
Quantum Leaps in Speed, Efficiency, and Quality. New York, NY: Free Press.
Williams, T. (2003). Learning from projects. Journal of the Operational Research Society, 54(2003), 443–451.
Williams, T. (2004). Identifying the hard lessons from projects – easily. International Journal of Project Management, 22(2004), 273–279.
Williams, T. (2007). Post-project reviews to gain effective lessons learned : Project
Management Institute. Williams, T. (2008). How do organizations learn lessons from projects—and do they?
IEEE Transactions on Engineering Management 55(2), 248-266. Wilson, B. (2010). Using PLS to investigate interaction effects between higher order
branding constructs. In V. E. Vinzi, W. W. Chin, J. Henseler & H. Wang (Eds.),
Handbook of Partial Least Squares: Concepts, Methods and Applications (pp. 621 - 652): Springer.
Wilson, B., & Henseler, J. (2007). Modeling reflective higher-order constructs using three approaches with PLS Path Modeling: A Monte Carlo comparison. Paper presented

268
at the Australian and New Zealand Marketing Academy Conference Department of Marketing, School of Business, University of Otago.
Winch, G. M. (2000). Institutional reform in British construction: partnering and private finance. Building Research and Information, 28(2), 141–155. doi: 10.1080/096132100369046
Winch, G. M. (2010). Managing construction projects (2nd ed.): Wiley-Black Well Wold, H. (1975). Path models with latent variables: The NIPALS approach. In H. M.
Blalock, A. Aganbegian, A. F. M. Borodkin, R. Boudon & V. Capecchi (Eds.), Quantitative Sociology (pp. 307–359). New York: Acad. Pr.
Wold, H. (1982). Soft modeling: the basic design and some extensions. In K. G. Jöreskog
& H. Wold (Eds.), Systems under indirect observation: Causality, structure, prediction. (Vol. 2, pp. 1-53). Amsterdam: North-Holland.
Wold, H. (1985). Partial Least Squares. In S. Kotz & N. L. Johnson (Eds.), Encyclopedia of statistical sciences (Vol. 6, pp. 581–591). New York: Wiley.
Wu, J. (2005). Aspects of learning in construction organizations: The need for change.
Paper presented at the Queensland University of Technology Research Week International Conference, Brisbane, Australia.
Xue, X., Li, X., Shen, Q., & Wang, Y. (2005). An agent-based framework for supply chain coordination in construction. Automation in Construction, 14(2005), 413– 430.
Yates, J. K., & Battersby, L. C. (2003). Master Builder Project Delivery System and
Designer Construction Knowledge. Journal of Construction Engineering and Management November/December (2003), 635-644.
Yin, R. K. (2009). Case study research: Design and methods (Vol. 5): Sage publications, INC.

269
APPENDICES
APPENDIX A: List of Publications
Alashwal, A. M., Abdul Rahman, H., Abdullah, A., and Abdul Samad, Z. (2009). Project
Learning and Knowledge Management in Construction: Literature Review. Paper
presented in the 3rd APGS, April, Kuala Lumpur.
Abdul Rahman, H., Alashwal, A. M., Jamaludin, Z. (2010). Project Learning Practice of
Quantity Surveying Firms. Proceeding of KMICe, Kuala Terengganu, Malaysia.
Alashwal, A. M. and Abdul Rahman, H. (2010). Project Learning and Fragmentation in
Construction Organizations. Proceeding of the 2nd International Conference
on Construction In Developing Countries, 3-5 August, Cairo, Egypt.
Abdul Rahman, H., Alashwal, A.M., & Jamaludin, Z.H. (2011). “Implementation and
Methods of Project Learning in Quantity Surveying Firms: Barriers, Enablers and Success
Factors”. American Journal of Economics and Business Administration 3 (3): 430-438
Alashwal, A. M., Abdul Rahman, H., and Beksin, A. (2011). Knowledge Sharing in a
Fragmented Construction Industry: On the Hindsight. Scientific Research and Essays, Vol.
6 (7), pp. 1530-1536.
Alashwal, A. M., Abdul Rahman, H. & Wang, C. (2011). How fragmented is the
construction industry? A theoretical outlook. Proceeding of the 2nd International
Conference of Project and Facilities Management, University of Malaya, Malaysia. 18-19
May, pp. 188-193

270
APPENDIX B: Content Validity of the Questionnaire
Content validation of the instrumental questionnaire survey
On:
Developing a Project Learning Model Considering
Fragmentation in Construction
By:
Ali Mohammed Alashwal
Ph.D. candidate
Supervisor:
Prof. Dr. Hamzah Abdul-Rahman
Deputy Vice-Chancellor (Research & Innovation)
University of Malaya
FACULTY OF BUILT ENVIRONMENT
UNIVERSITY OF MALAYA
February 2011

271
Dear Sir/Madam,
The aim of this research is to investigate the effect of fragmentation on project learning
practice. It is assumed that fragmentation has a negative impact on project learning. This
study attempts to test this premise using a questionnaire survey. A part from developing a
strong questionnaire survey is to conduct a content validity. In content validity, we test the
relevancy and importance of questions asked before sending the questionnaire for data
collection. This questionnaire consists of four (4) sections as the following (divided
according to the main constructs of this study): 1) factors that measure fragmentation of
project team, 2) factors that measure learning within projects, 3) factors that measure
learning across project, and 4) the enablers of project learning. Your feedback is essential
to establish a valid instrument, which will contribute to the development of a good quality
questionnaire survey.
Thank you very much for your feedback and cooperation.
Yours,
Ali Mohammed Alashwal
Ph.D. candidate
University of Malaya
Demographic data
Please fill in the blank or mark (√) on the appropriate column.
Name: ………………………………..
Gender: Male Female
Age (year): 25-35 36-40 41-50 50 or above
Number of years of experience: ………………… (year)
Affiliation: (where do you work?) ……………………………….

272
1: Fragmentation of Project Team
Fragmentation of project team happens due to some reasons: separation of design activities
from construction activities, lack of integration, coordination, boundaries between project team
and adversarial relationships. A project team will be described as a fragmented if all or most of
these conditions appear in the project environment.
Kindly indicate your opinion about whether the following questions indicate fragmentation. You
can also write down other items that you think they are relevant to fragmentation at the end of
the questions.
Please rate the relevancy and importance of each of the following questions to the definition of the
construct given above by using the following scale:
1 = not R / I (Not Relevant nor Important) 2 = R (Relevant) 3 = I (Important)
4 = R & I (Relevant and Important)
No. QUES TION not R /
I R I R & I
1
In this project, it is difficult to communicate directly with
other team members especially with those come from other
companies
1 2 3 4
2 I have long-term business relationship with most of the team
members 1 2 3 4
3 My relationship with other team members can be described as
a ‘good’ relat ionship 1 2 3 4
4 The coordinator of this project plays important role to bring
different members together 1 2 3 4
5 I often meet other team members (for example, the architect)
to discuss or coordinate work 1 2 3 4
6 In this project information technology (IT) facilitates
coordinating my work with others 1 2 3 4
7 The way I am working in this project is to have a common
goal and focus with other team members to achieve it 1 2 3 4
8 I with other members will form single team with spirit o f
group identity 1 2 3 4
9 I with other members will form single team with no
organizational boundaries 1 2 3 4
10 Project’s outcomes and goals will consider the whole p roject
team rather than individuals working in this project 1 2 3 4
11 Information related to project (for example cost) are accessed
easily 1 2 3 4
12 Information related to project (for example cost) are managed
appropriately 1 2 3 4
13 Me with other team members form a single team because we
work in one common office 1 2 3 4
14 All team members in this project are treated as having equal
and significant professional capability 1 2 3 4
15 Problems are identified and solved collectively (no blame
culture for individuals) 1 2 3 4
16 I trust other team members working in this project though they
come from d ifferent companies 1 2 3 4

273
17 I, and other team members, know what is the need of the
owner of the project 1 2 3 4
18 In this project, I and other team members have the freedom to
organize our self fo r better outcomes 1 2 3 4
19
Different team members (from d ifferent backgrounds) can
participate in d ifferent tasks to get a collective decision-
making
1 2 3 4
20 Different team members can participate in different tasks to
increase trust and reliance 1 2 3 4
21 In this project, I feel there are barriers between me and other
professionals who come from other companies 1 2 3 4
22 There are no barriers between me and the upper management
1 2 3 4
23 There are no cultural barriers between me and other team
members (especially those from different ethnic groups) 1 2 3 4
24 There is no language barrier between me and other team
members (especially those from different ethnic groups) 1 2 3 4
25 Procurement Method (categorical question): Tradit ional,
D&B, Turnkey, o r BOT. 1 2 3 4
Do you think that there are other items can be used to indicate fragmentation according to the
definition? Please specify the i tems below and rate them accordingly.
2: Learning within Construction Project
Learning within project is defined as project team actions to create and share knowledge. There
are some factors that can help in supporting learning within project include: structuring project
environment for learning, leaders supports, good relationship between individuals etc. Similar to
the previous section, you are required kindly to indicate whether the questions are relevant and
important to measure learning within construction projects.
Please rate the relevancy and importance of each of the following questions to the definition of the
construct given above by using the following scale:
1 = not R / I (Not Relevant nor Important) 2 = R (Relevant) 3 = I (Important)
4 = R & I (Relevant and Important)
No. QUES TION not R /
I R I R & I
1 I often have informal d ialogue with other team members
(example a d iscussion over coffee break) 1 2 3 4
2 I often contact other team members if there is a new idea to
discuss 1 2 3 4
3 From t ime to time, I attend meet ings to discuss new ways of
doing things 1 2 3 4
4 I can describe my relationship with other team members to be
informal more than formal 1 2 3 4
5 Project leader always considers any new idea I propose for the
betterment of the project 1 2 3 4
6 Others team members can share their experience with me so I
can develop new ideas 1 2 3 4

274
7 I trust others in the team so I can share my experience with
them without hesitation 1 2 3 4
8 All team member have the same technical language so our
communicat ion is very easy 1 2 3 4
9 I communicate easily with other team members because we
can speak the same language (e.g. BM or English) 1 2 3 4
10 In this project, sharing experience is easy because team
members have good relationship (e.g. friendship) 1 2 3 4
11 In this project, I with other team members use (IT) to facilitate
our experience sharing 1 2 3 4
12 I and other team members share what we have learned from
previous projects 1 2 3 4
13 The leader of th is project encourages us to work as one team
1 2 3 4
14 Communicat ion with top management is easy in this project
1 2 3 4
15 I have little experience in this type of projects
1 2 3 4
16 I have met few problems that we face in th is project before
1 2 3 4
17 In this project, other team members have different values and
experience than mine 1 2 3 4
18 I often collaborate with new colleagues
1 2 3 4
19 In this project, I can learn from other occupational
/professional groups 1 2 3 4
20 Me and other team member can tell about mistakes we do
freely 1 2 3 4
21 I get much feedback in this project
1 2 3 4
22 In this project, I can use many new technical solutions
1 2 3 4
23 I constantly seek new ideas and use many new material
1 2 3 4
24 I have changed my way of working in this project
1 2 3 4
25 I, with other colleagues, can change the basic way of doing
work if a better way found 1 2 3 4
26 No much routine work in this project compared with the
routine in the company 1 2 3 4
27 In this project I feel that my knowledge has gotten polished
1 2 3 4
28 I learn more by building relationship with other professionals
or skilled individuals 1 2 3 4
29 I feel that this project is a new challenging task for me
1 2 3 4
30 I, with my colleagues, know the objectives and goals in this
project 1 2 3 4
31 I often have an open discuss with other team members about
problems solution or new ideas 1 2 3 4
32 I always tell persons I see doing wrong or using insufficient
method 1 2 3 4

275
33 When a problem arises, we will report to upper management
1 2 3 4
34 We will develop a repair p lan of troubleshooting when
problem arises 1 2 3 4
35 In this project, there are some experts who do coaching for
other team members 1 2 3 4
36 I learn from other professionals in the project although they
come from d ifferent disciplines or have different background 1 2 3 4
Do you think that there are other items can be used to indicate learning within projects according to
the definition? Please specify the items below and rate them accordingly.
3: Learning across Construction Project
Learning across project can be attained by project team process of experience accumulation,
knowledge articulation and knowledge codification. Basically, it involves transferring learning
gained from one project to another directly or via a company first then to other projects. Please
state whether you think that the following questions represent construction team learning across
projects.
Please rate the relevancy and importance of each of the following questions to the definition of the
construct given above by using the following scale:
1 = not R / I (Not Relevant nor Important) 2 = R (Relevant) 3 = I (Important)
4 = R & I (Relevant and Important)
No. QUES TION not R /
I R I R & I
1 We solve problems or discuss ideas in this project by having
group thinking session 1 2 3 4
2 I share my experience with other team members directly
(person-to-person communication) 1 2 3 4
3 Usually I see other team member off the project (informal
gathering) 1 2 3 4
4 I take some ideas or use some methods from other pro jects
1 2 3 4
5 I can attend meetings with people in other projects
1 2 3 4
6 I consider that it is easy to transfer and implement some ideas
in other projects to this project 1 2 3 4
8 I discuss some problems with colleagues who work in other
projects 1 2 3 4
9 New ideas have been discussed in this project can be
transferred to our head office 1 2 3 4
10 The head office (o r company) concern about project team to
get new knowledge from pro jects 1 2 3 4
11 I will be able to transfer what I have learned in this project to
other projects easily 1 2 3 4
12 Usually we conduct brainstorming sessions in this project
1 2 3 4
13 We conduct meetings to review important issues and identify
the causes of some problems 1 2 3 4

276
15
I often use documents from previous projects (e.g. lessons
learned) to get new knowledge that can be implemented in this
project
1 2 3 4
16 Normally, project review (for example project audit,
postmortem etc.) will take p lace at the end of this project 1 2 3 4
17 Important informat ion about the project (e.g. milestones,
deadlines…etc.) will be recorded clearly 1 2 3 4
18 Minutes of meetings will be kept for future usage
1 2 3 4
19 This project has a data base to record lessons learned which
can be used in future projects 1 2 3 4
20 This project has a compiled record of ‘pro ject history’
1 2 3 4
Do you think that there are other items can be used to indicate learning across projects according to
the definition? Please specify the items below and rate them accordingly.
4: Enablers of Project Learning within Fragmentation
These enablers represent the factors that may help in achieving learning within and across project
regardless of fragmentation. The enablers can be divided into: structuring project environment
for learning, networking, supporting relationships, knowledge type, etc. Kindly check the relevant
and important factors similar to the previous section.
Please rate the relevancy and importance of each of the following questions to the definition of the
construct given above by using the following scale:
1 = not R / I (Not Relevant nor Important) 2 = R (Relevant) 3 = I (Important)
4 = R & I (Relevant and Important)
No. QUES TION not R /
I R I R & I
1 I need to attend more meetings in this project to share
experience and exchange knowledge with others 1 2 3 4
2 In this project, I need to see more people formally or
informally to exchange ideas and discuss important issue 1 2 3 4
3 We need to conduct brain-storming and decision making
sessions for experience sharing and exchange of ideas 1 2 3 4
4 Attitude of the project’s leader influence the way I am sharing
my experience with other people in the team 1 2 3 4
5 I think it is necessary to record important issues or problems
for this project 1 2 3 4
6 There is a need for everybody to feel the spirit o f project team
in this project 1 2 3 4
7
Some form of recorded knowledge as ‘Method Statement’ is
important for experience sharing between different team
members
1 2 3 4
8 Project leader has to play important role to encourage us to
build up good relationship with other team members 1 2 3 4

277
9 I am always encouraged to trust others
1 2 3 4
10 I am willing to share my experience if I get appropriate
incentive (monetary incentive for example) 1 2 3 4
11 I will share my experience only with the people I know (for
example my buddies) 1 2 3 4
12 I will share only part of my experience because some of what
I know is considered ‘trade secrete’ 1 2 3 4
13 I will share my experience with others because the policy of
my company required that 1 2 3 4
14 I get words of thanks when I share my experience with others
1 2 3 4
15 I have to share my experience with others because that is
mentioned in the contract 1 2 3 4
16 Project owner can ask me to share my experience with other
team members 1 2 3 4
17 I believe it is important to know each other abilities so there
will be better sharing of experience 1 2 3 4
18
My way of learning is innovative: I like to think of different
ways of doing things and like to challenge the current
paradigm in work
1 2 3 4
19
My way of learning is adaptive: I like to look at how things
are being done and I found changing the existing paradigm
very difficult
1 2 3 4
20 I believe that this project needs more infrastructure that
supports recording and using important knowledge 1 2 3 4
21 I believe we need better support for dialogue, conversations
and discussion in this project 1 2 3 4
22 It is important to set learning as one of the project’s goals
1 2 3 4
23 Time and resources for learning are not adequate in this
project 1 2 3 4
24 I think that our leaders need to be more open for new ideas
from any body 1 2 3 4
25 I think that our leaders need to behave in boundary-less
fashion 1 2 3 4
26 Our leader should show role model in open communication,
honesty and show how to trust others 1 2 3 4
27 I believe that project leader shall highlight the importance of
learning from the project 1 2 3 4
28 I think our leaders should give us more room for d iscussion
and problem solving by ourselves 1 2 3 4
29 It is important to engage us in making decisions related to the
way of how we should learn in this project 1 2 3 4
Do you think that there are other items can be used to support project learning within fragmented
construction? Please specify the items below and rate them accordingly.
This is the end of this survey, thank you very much for your response

278
APPENDIX C: The Questionnaire Survey Instrument
Faculty of Built Environment, University of Malaya,
50603, Kuala Lumpur, Malaysia
DEVELOPING A PROJECT LEARNING MODEL
CONSIDERING FRAGMENTATION IN CONSTRUCTION
Questionnaire Survey - 1
---------------------------Part of requirements to fulfill Ph.D. study------------------------
The aim of this survey is to examine the impact of team fragmentation on learning practice in
construction projects in Malaysia. In addition, this survey attempts to find out the factors that may
help in reducing this impact.
Fragmentation of project team involves: diversity of skilled team; the separation between design
and build process; lack of integration, coordination and collaboration; and lastly the adversarial
relationship between project team members.
Project Learning Practice is the action that project team do to create and share knowledge within
and between projects. It is believed that fragmentation has a negative influence on project learning
practice.
Project Team here means any professional works in the project site including the design team or
consultants and the construction team as well as project engineer, coordinator or project manager.
Your positive respond to this survey is very much appreciated and, hopefully, will help in the
betterment of construction industry in Malaysia. You are required to fill up the following questions
and give your opinion. Your answer will be confidential and the questionnaire will not ask you to
write down your name, which will guarantee the anonymity of the respondents. The results of this
survey will be used for the purposes of the academic research only. Filling up this survey will take
about 15 minutes of your valuable time. We really appreciate your effort and support to accomplish
this research. We are willing to share part of the results of this survey upon your request.
Yours,
Ali Mohammed Alashwal
The Faculty of Built Environment, University of Malaya
H/P: 0177144079 E-mail: [email protected]
Professor Dr. Hamzah Abdul-Rahman (Supervisor)
Deputy Vice-Chancellor (Research & Innovation), University of Malaya
Tel: 03-7967 3203
E-mail: [email protected]
“This survey will be used for the purpose of research only and the participants’ identity or views will be treated in strictest confidence”
Code (for researcher only)

279
SECTION 1: Personal Information
(Please state or tick the appropriate answer):
1. What is your age? 2. What is your highest education?
3. How many years of
experience do you have in construction?
1) Less than 30 1) High School 1- Less than 5 years
2- Between 6-10 years
3- Between 11-15 years
4- Between 16-20 years
5- Between 21-25 years
6- More than 25 years
2) Between 30-39 2) Bachelor Degree
3) Between 40-49 3) Master Degree
4) Between 50-59 4) PhD
5) More than 60 5) Other …..……………
4. What is your gender? 5. What is your position in this project or the organization?
7. Your background:
1) Male
2) Female 1) Project Manager
2) Manager Assistant
3) Project Consultant
4) Project Engineer
5) Resident Engineer
6) Resident Architect
7) Other: ……………………
1) Civil Engineering
2) Architecture
3) QS
4) Mechanical Engineering
5) Other (pls specify)………….
6. Size of your company:
1) Small (G1-G3)
2) Medium (G4-G6)
3) Big (G7)
8. Working mode in this project:
9. Are you a member in BEM, PAM or other associations…?
10. Do you have experience in Post Project Review or Audit?
1) Temporary contract
2) Permanently join a
company
Yes No Yes No
If yes, how many years? ………..
SECTION 2: Practice of Project Team in this Project
This section attempts to perceive your opinion about fragmentation. Team fragmentation involves
some aspects as lack of collaboration, separation between design and construction process,
adversarial relationships, and diversity of project team. Kindly use the scale below, and write the
appropriate number (from 1 to 5) on the blank by each statement. Number 1 indicates that you
totally disagree with the statement, 2 you disagree, 3 neutral or don’t know, 4 you agree and 5 you
totally agree.
Totally Disagree
1
Disagree
2
Neutral
3
Agree
4
Totally Agree
5
1 In this project, I and other team members have the same objective (no individual objectives)
2 I form a single team with other members although they come from different companies
3 Project’s outcomes and benefits will consider the whole project team rather than individuals
4 I can easily access to information related to construction cost and schedule of this project

280
5 Information related to this project are well managed
6 I work with all team members in one common site office
7 Me and other team members have fair chance to contribute in making decisions about the work
8 In this project all team members are treated as having equal professional capability
9 There is no blame for an individual if any problem happens (group will take responsibility)
10 Problems will be solved by the whole project team rather than individuals
11 In this project, I can directly call other team members (e.g. consultants or project engineers)
12 I have regular meetings with other team members (e.g. consultants or project engineers)
13 Information Technology (IT) facilitates coordinating works between me and other members
14 I have long-term relationship with most of the project team members
15 The coordinator of this project plays important role to bring different people together
16 I trust other team members work in this project though they come from different companies
17 We focus mainly on the requirements of the owner/client of this project
18 We have the freedom to organize ourselves / our work for better outcomes
19 I feel there are barriers between me and other professionals who have different background
20 I feel there is a barriers between me and other team members come from other companies
21 There is a language barrier between me and other team members (especially those from
different ethnic groups)
22 There are cultural barriers between me and other team members (especially those from different ethnic groups)
23 My contact with members who come from different background or discipline is limited
24 I often participate with other members, from different backgrounds, in solving problems (e.g. to solve a problem related to the design)
25 Clashes between design and construction (omissions / errors of design) are difficult to resolve in this project
26 It is difficult for me to understand some information from people from other backgrounds
27 I need to get sufficient information from previous phases of this project
28 I need to get sufficient information from other project consultants or professionals
29 My relationship with most of project team is good (including contractor’s team and other consultants)
SECTION 3: Learning within Projects
This section aims to get your opinion about factors that promote learning of team within the project.
Project learning involves project team sharing and creating of experience and knowledge in
construction projects. Kindly write down the appropriate number from 1 to 5 in the blank.

281
Totally Disagree
1
Disagree
2
Neutral
3
Agree
4
Totally Agree
5
1 I trust other team members so I can share my experience with them freely
2 I often have informal dialogue with other team members (e.g. a discussion over coffee break)
3 I communicate with experts in-person (face-to-face) to get some experience or information
4 I often contact external consultant if there is a new idea or problem to discuss
5 I am able to contact all people in this project directly
6 Information Communication Tools (ICT) facilitates my communication with other members (e.g. video conferencing etc.)
7 I get very much experience from the frequent meetings I attend
8 Normally I attend group discussions about certain issues or problems related to this project
9 I do not hesitate to ask questions about issues related to the project
10 I can inform about mistakes I do freely
11 I can have an open (frank) discussion about issues or problems related to this project
12 I can tell people who do wrong or use insufficient method
13 I, and other members, always try to find alternative ways of doing things
14 Solving problems in this project is efficient (e.g. resolving design clashes/omissions)
15 In this project, we have to identify the causes of problems happen in the site
16 When problem happen we will report to upper management
17 In this project, I have implemented new technology / technique
18 I learn new things when project leader delegate some of his work to me
19 I am encouraged to collaborate with new colleagues
20 It is always appreciated when we collaborate with people from other companies
21 In this project, interaction with other team members has polished my experience
22 I always follow the common routines/standards of doing work in this project
23 I feel that this project is a challenging task for me
24 I am committed to the main objective of this project
25 We need to learn from mistake and not to be punished for trying new things
26 We deserve to have second chance if we made mistakes
SECTION 4: Learning across Projects
This section aims to perceive your opinion about factors that promote the practice of project
learning across construction projects. Similar to the previous sections, you are requested to state
your response number by writing down the appropriate number (1 to 5).

282
Totally Disagree
1
Disagree
2
Neutral
3
Agree
4
Totally Agree
5
1 In this project, mostly we communicate face-to-face other than other ways (e.g. telephone, email etc.)
2 I see team members off-the-project for informal gathering or activities
3 It is easy to find people in this project or other project to answer my inquiries
4 I use some ideas/techniques/documents from other projects and implement it in this project
5 I contact people from other projects to discuss about certain issues related to this project
6 We conduct special meetings to obtain some useful information or knowledge about the project
7 I attend brainstorming sessions with colleagues to discuss certain problems
8 We conduct investigation to review some problems and identify their causes
9 Other than the regular meetings, I attend meetings when something urgent need to be discussed
10 I attend meetings/activities to develop lessons that can be learned from this project
11 Project plans are recorded clearly so can be kept for future usage
12 Important information as project milestones are recorded clearly
13 Meeting minutes in this project will be kept for future usage
14 This project has a compiled record of ‘project history’
15 This project need an appropriate database to record important information and lessons learned for future projects
16 I visited other projects during this project
17 I often contact the main office of my company to discuss about issue related to this project
SECTION 5: Supporting Project Learning
This section attempts to get your opinion about some items that can help in promoting project
learning practice within fragmentation of construction. Similar to the previous section, you are
required to state your response number by writing down the appropriate number (1 to 5).
Totally Disagree
1
Disagree
2
Neutral
3
Agree
4
Totally Agree
5
1 I need to attend more meetings with different members for experience and knowledge sharing
2 There is a need for everybody to feel the spirit of the project team
3 Being open to everybody in the project is one of my company’s policies
4 Project owner/client has important role to play in getting different project team together
5 I am willing to share my experience if I get appropriate incentive (e.g. monetary incentive)
6 I share more experience with people that my company has long -term relationship with their companies
7 I share my experience with my friends only

283
8 I share my experience with other members if there are benefits for all of us and for the project
9 Drawings and specification of this project play important role to facilitate ideas and experience sharing
10 Construction contract can play important role to oblige experience sharing between project
team
11 I need to be trusted by other team members especially those from other companies
12 I need to feel that my experience is valuable for other team members
13 ICT tools (as video conferencing etc.) will be useful for better communication with other project team (e.g. the designer)
14 I believe it is important to set learning as one of the project’s goals
15 This project needs more support from project leader for dialogue, conversations and open discussions with everybody
16 Our leader should show role model in open communication, honesty and show how to trust
others
17 The attitude of project leader can influence my relationship with people from other companies
18 Project manager/leader has to encourage us to build up good relationship with every team
members
19 We need to be committed to respect each other’s views
20 I think it is important to know each other’s experience and abilities so we can share knowledge
better
21 My way of learning is to think of different ways of doing things (challenge the current standards of work)
22 My way of learning is to look at how things are being done (cannot change the existing standards/paradigms)
23 The setting of site office allow for better communication with everybody
24 I have enough time to discuss and share experience with other team members
25 This project has the appropriate resources for learning
26 I understand my role in sharing experience and learning in this project
27 I like to make decisions about the way I can learn from this project
This is the end of this survey. Thank you very much for your kind response

284
Faculty of Built Environment, University of Malaya,
50603, Kuala Lumpur, Malaysia
DEVELOPING A PROJECT LEARNING MODEL
CONSIDERING FRAGMENTATION
Questionnaire Survey – 2
-----------------------------Part of requirements to fulfill Ph.D. study------------------------
The aim of this survey is to identify the practice of project learning within project team in
the Malaysian construction projects. In addition, the survey attempts to identify the
influence of some characteristics of construction on learning and project performance.
This part of questionnaire shall be filled in by project manager or any person who
has sufficient information about the whole project. Please note that this survey will be
used for the purpose of research only and the participants’ identity or response will be
treated as confidential information.
Appreciate your time and efforts.
Thank you very much,
Yours,
Code (for researcher only)
Ali Mohammed Alashwal
Faculty of Built Environment, University of Malaya H/P: 017-7144079 E-mail: [email protected]

285
GENERAL INFORMATION ABOUT THE PROJECT
(Please state or tick the appropriate answer):
1. Name of this project: 2. Location: 3. Date of award of project:
…………………………. …………………………. / / /
4. Owner of project: 5. Name of the main contractor: 6. Grade of the main contractor:
…………………………. …………………………. G1 G2 G3 G4 G5 G6 G7
7. Category of the project: 8. Procurement method used: 9. Completion percentage:
1- Government
2- Private
3- Mixed
1- Traditional / Conventional
2- Design-and-Build
3- Turnkey
4- Built, operate, & transfer (BOT)
5- Other ……………….
1- Less than 20 %
2- Between 21 to 40 %
3- Between 41 to 60 %
4- Between 61 to 80 %
5- More than 80 %
10. Type of the project (note):
11. Value of the project (RM): 12. No. of sub-con. & consultant firms work in this project:
1- Residential
2- Non Residential
3- Social Amenities
4- Mix Development
5- Infrastructure
6- Other …..………….
1- Less than 10 million
2- Between 10 - 50 million
3- Between 50 - 100 million
4- Between 100 - 300 million
5- Between 300 - 500 million
6- Between 500 - 1,000 million
7- More than 1,000 million
1- Less than 5 firms
2- Between 5 to 14
3- Between 15 to 24
4- Between 25 to 34
5- Between 35 to 44
6- More than 45 firms
13. How do you describe the discrepancy between design and construction (clashes or errors of design)?
14. How do you describe the S-curve of this project, so far
1) No clashes or discrepancies in this project so far
2) Clashes / discrepancies are less than 2%
3) Clashes / discrepancies represent 2 to 5%
4) Clashes / discrepancies represent 6 to 10%
5) Clashes / discrepancies represent more than 10%
1) Less than 6% of the plan
2) Less than 1-5 % of the plan
3) According to the plan
4) More than 1-5% of the plan
5) More than 6% of the plan
15. Approximately, how many professionals work in this project (including managers
assistant, project consultants, project engineers, resident architect, coordinators, mechanical
engineers etc.)?………………..
Residential: Quarters , terrace house, semi -detached house, bungalow, flat, condominium, apartment, townhouse and dormitory. Non-Residential:, Adminis tration, commercial, manufacturing, safety, and agricul ture buildings . Social
Amenities: Hospital, clinic, medical laboratory, medical treatment center, higher learning institu tion, school , education
and training center, youth center, sport centers , wel fare center, rehabili tation center and protection center, religious house, community center, public hall and multipurpose hall, etc. Mix Development: Construction project with more
than one category. Infrastructure: Airport, railway or train station, bus s tation, taxi s tation, harbor, jetty, road, highway, railway track, rail , traffic light, bridge and tunnel , etc.
Thank you very much for your response

286
APPENDIX D: Missing Data Analysis
Missing Data Analysis
N Mean Std. Deviation
Missing No. of Extremesb
Count Percent Low High
PROmethod 203 1.65 .779 0 .0 0 5
TIME 198 2.5000 1.08871 5 2.5 0 0
COST 197 3.1777 .79790 6 3.0 4 0
SATSF 200 2.7650 .48055 3 1.5 0 0
CLASHES 201 2.7861 .73417 2 1.0 0 8
Scurve 197 2.8477 1.02875 6 3.0 . .
AGE 203 2.46 1.001 0 .0 0 1
EDU 202 2.44 .874 1 .5 0 13
EXp.Const 203 2.91 1.399 0 .0 0 0
GEN 203 1.11 .318 0 .0 . .
Position 200 4.32 1.989 3 1.5 0 0
SizeCom 193 2.64 .606 10 4.9 0 0
Backg 199 2.26 1.327 4 2.0 0 0
WorkingMOD 189 1.72 .448 14 6.9 0 0
MbrAssoc 198 1.44 .498 5 2.5 0 0
Exp.PL 201 1.64 .481 2 1.0 0 0
Frag1 202 1.6782 .64678 1 .5 0 1
Frag2 203 2.0887 .83962 0 .0 . .
Frag3 203 1.7537 .69540 0 .0 0 5
Frag4 202 2.0000 .90877 1 .5 0 14
Frag5 202 2.0644 .82908 1 .5 . .
Frag6 202 1.8366 .91860 1 .5 0 12
Frag7 203 2.0690 .77407 0 .0 . .
Frag8 203 2.0345 .82281 0 .0 0 8
Frag9 203 2.1823 .94465 0 .0 0 4
Frag10 202 1.9257 .79139 1 .5 0 10
Frag11 203 1.8374 .80110 0 .0 0 7
Frag12 203 1.8621 .72487 0 .0 0 5
Frag13 203 2.0739 .80804 0 .0 0 1
Frag14 203 2.1921 .90518 0 .0 0 2
Frag15 203 1.8473 .72531 0 .0 0 3
Frag16 203 2.0739 .69614 0 .0 . .
Frag17 202 1.8713 .69344 1 .5 0 2
Frag18 203 1.9852 .77382 0 .0 0 5
Frag19 203 2.7882 1.11224 0 .0 0 0
Frag20 203 2.7143 1.02307 0 .0 0 7
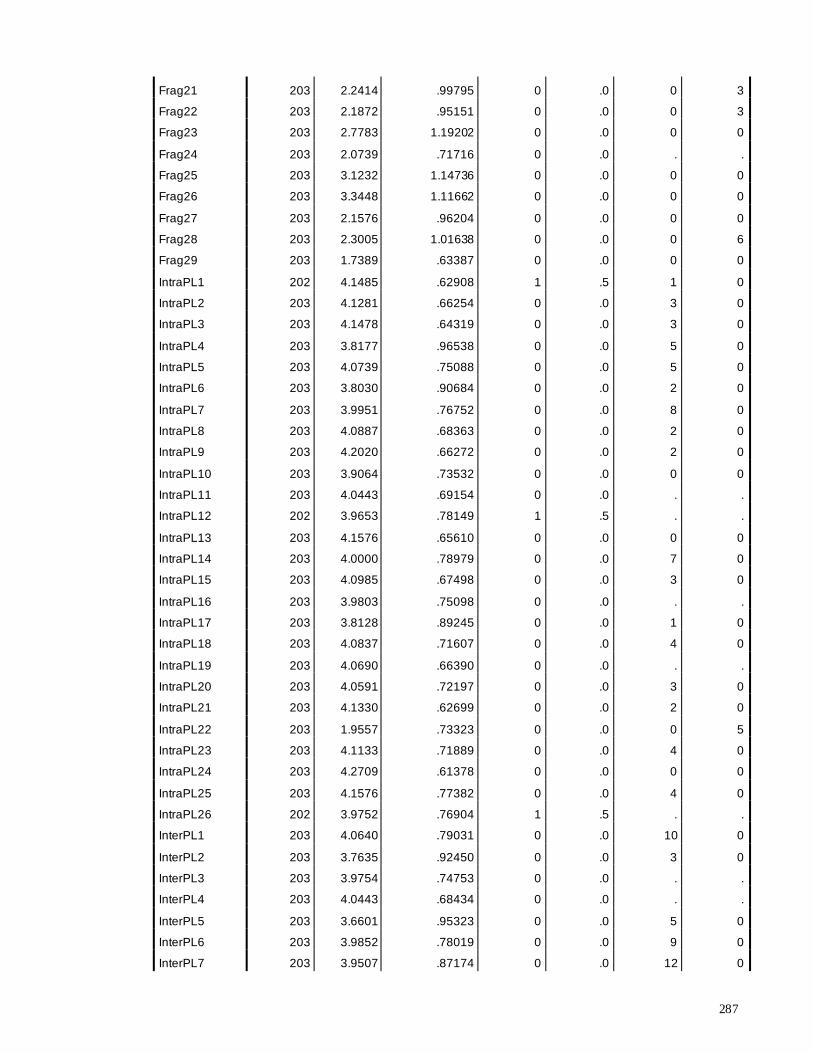
287
Frag21 203 2.2414 .99795 0 .0 0 3
Frag22 203 2.1872 .95151 0 .0 0 3
Frag23 203 2.7783 1.19202 0 .0 0 0
Frag24 203 2.0739 .71716 0 .0 . .
Frag25 203 3.1232 1.14736 0 .0 0 0
Frag26 203 3.3448 1.11662 0 .0 0 0
Frag27 203 2.1576 .96204 0 .0 0 0
Frag28 203 2.3005 1.01638 0 .0 0 6
Frag29 203 1.7389 .63387 0 .0 0 0
IntraPL1 202 4.1485 .62908 1 .5 1 0
IntraPL2 203 4.1281 .66254 0 .0 3 0
IntraPL3 203 4.1478 .64319 0 .0 3 0
IntraPL4 203 3.8177 .96538 0 .0 5 0
IntraPL5 203 4.0739 .75088 0 .0 5 0
IntraPL6 203 3.8030 .90684 0 .0 2 0
IntraPL7 203 3.9951 .76752 0 .0 8 0
IntraPL8 203 4.0887 .68363 0 .0 2 0
IntraPL9 203 4.2020 .66272 0 .0 2 0
IntraPL10 203 3.9064 .73532 0 .0 0 0
IntraPL11 203 4.0443 .69154 0 .0 . .
IntraPL12 202 3.9653 .78149 1 .5 . .
IntraPL13 203 4.1576 .65610 0 .0 0 0
IntraPL14 203 4.0000 .78979 0 .0 7 0
IntraPL15 203 4.0985 .67498 0 .0 3 0
IntraPL16 203 3.9803 .75098 0 .0 . .
IntraPL17 203 3.8128 .89245 0 .0 1 0
IntraPL18 203 4.0837 .71607 0 .0 4 0
IntraPL19 203 4.0690 .66390 0 .0 . .
IntraPL20 203 4.0591 .72197 0 .0 3 0
IntraPL21 203 4.1330 .62699 0 .0 2 0
IntraPL22 203 1.9557 .73323 0 .0 0 5
IntraPL23 203 4.1133 .71889 0 .0 4 0
IntraPL24 203 4.2709 .61378 0 .0 0 0
IntraPL25 203 4.1576 .77382 0 .0 4 0
IntraPL26 202 3.9752 .76904 1 .5 . .
InterPL1 203 4.0640 .79031 0 .0 10 0
InterPL2 203 3.7635 .92450 0 .0 3 0
InterPL3 203 3.9754 .74753 0 .0 . .
InterPL4 203 4.0443 .68434 0 .0 . .
InterPL5 203 3.6601 .95323 0 .0 5 0
InterPL6 203 3.9852 .78019 0 .0 9 0
InterPL7 203 3.9507 .87174 0 .0 12 0

288
InterPL8 203 3.9951 .77394 0 .0 4 0
InterPL9 203 4.1084 .70926 0 .0 4 0
InterPL10 203 3.9754 .80493 0 .0 . .
InterPL11 203 4.1034 .77341 0 .0 6 0
InterPL12 203 4.1626 .73672 0 .0 4 0
InterPL13 203 4.1675 .72544 0 .0 4 0
InterPL14 203 4.0000 .79603 0 .0 5 0
InterPL15 203 1.9458 .82775 0 .0 0 8
InterPL16 202 3.6634 1.11772 1 .5 11 0
InterPL17 203 3.8374 .99910 0 .0 0 0
SupPL1 200 4.0350 .83502 3 1.5 12 0
SupPL2 200 4.2400 .65155 3 1.5 2 0
SupPL3 200 4.0500 .77492 3 1.5 3 0
SupPL4 203 4.1872 .72058 0 .0 7 0
SupPL5 203 3.0099 1.21863 0 .0 0 0
SupPL6 203 3.3645 1.03174 0 .0 12 0
SupPL7 203 2.7241 1.22384 0 .0 0 0
SupPL8 203 3.9704 .90056 0 .0 15 0
SupPL9 203 4.2562 .67001 0 .0 3 0
SupPL10 203 4.1773 .72308 0 .0 3 0
SupPL11 203 4.0788 .76021 0 .0 7 0
SupPL12 203 3.9803 .78324 0 .0 . .
SupPL13 203 3.9704 .80783 0 .0 0 0
SupPL14 203 4.0887 .70502 0 .0 3 0
SupPL15 203 4.0936 .80599 0 .0 8 0
SupPL16 203 4.2611 .66438 0 .0 3 0
SupPL17 203 4.1379 .70408 0 .0 3 0
SupPL18 203 4.2463 .62014 0 .0 2 0
SupPL19 203 4.2808 .65625 0 .0 1 0
SupPL20 203 4.2315 .59751 0 .0 0 0
SupPL21 203 4.0640 .67548 0 .0 . .
SupPL22 203 3.8227 .95341 0 .0 0 0
SupPL23 203 4.0985 .73130 0 .0 4 0
SupPL24 203 3.8768 .86723 0 .0 2 0
SupPL25 203 3.9310 .84734 0 .0 0 0
SupPL26 203 4.1330 .62699 0 .0 1 0
SupPL27 201 4.0050 .79055 2 1.0 0 0
a. . indicates that the inter-quartile range (IQR) is zero.
b. Number of cases outside the range (Q1 - 1.5*IQR, Q3 + 1.5*IQR).

289
APPENDIX E: Distributions
1. Distribution of the Selected Projects:

290

291
2. Distribution of the Respondents

292

293
APPENDIX F: Parallel Analysis
1. O'Connor’s Syntax of Parallel Specification:
* Enter the name/location of the data file for analyses after
"FILE =";
If you specify "FILE = *", then the program will read the
current,
active SPSS data file; You can alternatively enter the
name/location
of a previously saved SPSS systemfile instead of "*";
you can use the "/ VAR =" subcommand after "/ missing=omit"
subcommand to select variables for the analyses.
GET raw / FILE = * / missing=omit / VAR = InterPL1 to InterPL17.
* Enter the desired number of parallel data sets here.
compute ndatsets = 100.
* Enter the desired percentile here.
compute percent = 95.
* Enter either
1 for principal components analysis, or
2 for principal axis/common factor analysis.
compute kind = 1 .
* Enter either
1 for normally distributed random data generation parallel
analysis, or
2 for permutations of the raw data set.
compute randtype = 1.
****************** End of user specifications. ******************
2. Steps of conducting the analysis using SPSS:
1. Copy O'Connor’s syntax to a new syntax in the data set.
2. Determine five criteria in the syntax, indicating the name of variables, number of
data set (default number is 100), percentile (e.g., 95%), type of analysis (either
principal component analysis or common factor analysis), and distribution of data
(either normal distribution or permutations).
3. Run the syntax to obtain the output.

294
3. Specifications and output of the parallel analysis (example: Inter-project learning):
Specifications used to run the analysis of Inter-project are as the following:
Variables’ name (VAR = InterPL1 to InterPL17);
Number of parallel data sets (ndatsets = 100);
Percentile = 95;
Extraction method = 1 (principal component analysis); and
Distribution = 1 (normally distributed random data generation parallel analysis).
The output after running the syntax in SPSS is as the following:
Run MATRIX procedure:
PARALLEL ANALYSIS:
Principal Components & Random Normal Data Generation
Specifications for this Run:
Ncases 194
Nvars 17
Ndatsets 100
Percent 95
Raw Data Eigenvalues, & Mean & Percentile Random Data Eigenvalues
Root Raw Data Means Prcntyle
1.000000 6.300243 1.555957 1.677537
2.000000 1.518506 1.434151 1.507118
3.000000 1.077819 1.350673 1.422956
4.000000 .998899 1.274972 1.333581
5.000000 .960785 1.202919 1.250889
6.000000 .877134 1.142763 1.187820
7.000000 .770399 1.084683 1.131202
8.000000 .754337 1.027545 1.078670
9.000000 .597052 .973868 1.019504
10.000000 .559997 .920296 .964363
11.000000 .502459 .870491 .921875
12.000000 .488702 .821410 .867371
13.000000 .414017 .771379 .811238
14.000000 .352392 .725616 .766163
15.000000 .309958 .671966 .715757
16.000000 .288515 .621360 .665913
17.000000 .228788 .549951 .607321
------ END MATRIX -----

295
Sequence Plot Notes
Output Created 26-Sep-2011 10:57:20 Comments Input File Label File created by MATRIX
Filter <none> Weight <none> Split File <none> N of Rows in Working Data File 17 Date <none>
Missing Value Handling
Definition of Missing User-defined missing values are treated as missing.
Cases Used All the cases or all the specified cases are used to define the sequence.
Syntax TSPLOT VARIABLES= rawdata means percntyl /ID= root /NOLOG.
Resources Processor Time 00 00:00:00.593 Elapsed Time 00 00:00:00.562
Use From First observation To Last observation
Time Series Settings (TSET)
Amount of Output PRINT = DEFAULT
Saving New Variables NEWVAR = CURRENT
Maximum Number of Lags in Autocorrelation or Partial Autocorrelation Plots
MXAUTO = 16
Maximum Number of Lags Per Cross-Correlation Plots
MXCROSS = 7
Maximum Number of New Variables Generated Per Procedure
MXNEWVAR = 60
Maximum Number of New Cases Per Procedure
MXPREDICT = 1000
Treatment of User-Missing Values MISSING = EXCLUDE
Confidence Interval Percentage Value CIN = 95
Tolerance for Entering Variables in Regression Equations
TOLER = .0001
Maximum Iterative Parameter Change CNVERGE = .001
Method of Calculating Std. Errors for Autocorrelations
ACFSE = IND
Length of Seasonal Period Unspecified
Variable Whose Values Label Observations in Plots
Unspecified
Equations Include CONSTANT
Model Description
Model Name MOD_8 Series or Sequence 1 rawdata
2 means 3 percntyl
Transformation None Non-Seasonal Differencing 0 Seasonal Differencing 0 Length of Seasonal Period No periodicity Horizontal Axis Labels root Intervention Onsets None For Each Observation Values not joined
Applying the model specifications from MOD_8

296
Case Processing Summary
rawdata means percntyl
Series or Sequence Length 17 17 17 Number of Missing Values in the Plot
User-Missing 0 0 0
System-Missing 0 0 0
[Tsplot of inter-project learning construct]
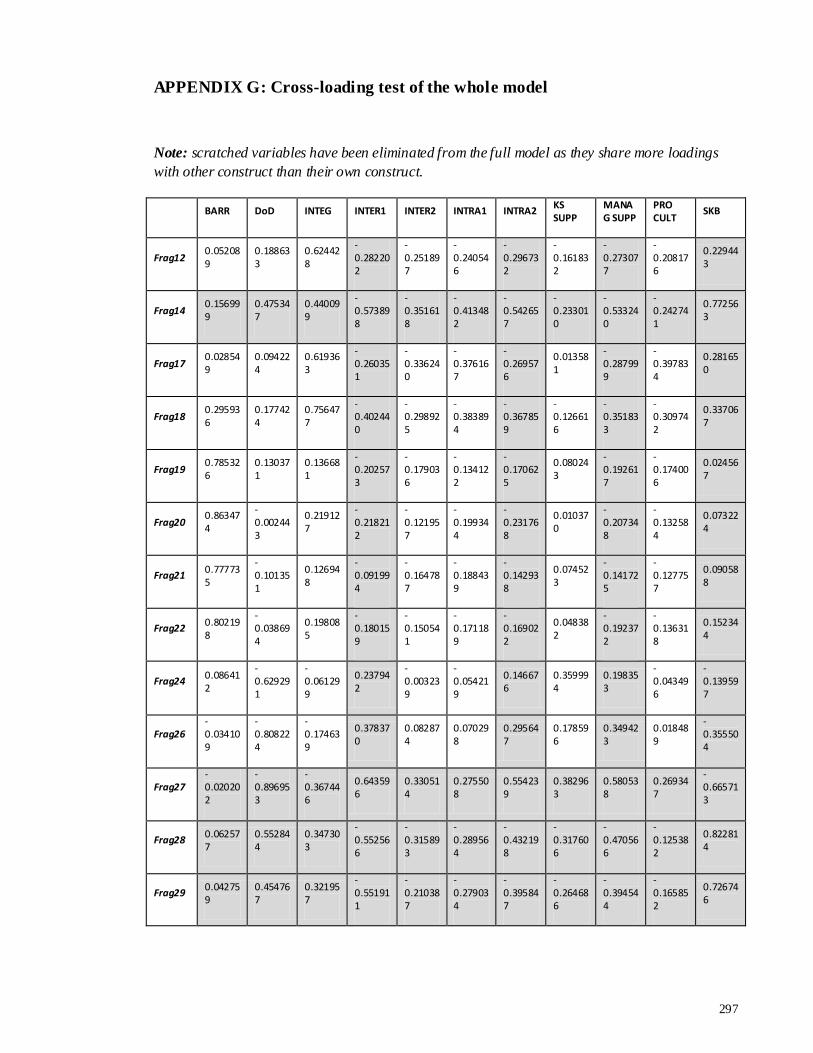
297
APPENDIX G: Cross-loading test of the whole model
Note: scratched variables have been eliminated from the full model as they share more loadings
with other construct than their own construct.
BARR DoD INTEG INTER1 INTER2 INTRA1 INTRA2 KS SUPP
MANAG SUPP
PRO CULT
SKB
Frag12 0.052089
0.188633
0.624428
-0.282202
-0.251897
-0.240546
-0.296732
-0.161832
-0.273077
-0.208176
0.229443
Frag14 0.156999
0.475347
0.440099
-0.573898
-0.351618
-0.413482
-0.542657
-0.233010
-0.533240
-0.242741
0.772563
Frag17 0.028549
0.094224
0.619363
-0.260351
-0.336240
-0.376167
-0.269576
0.013581
-0.287999
-0.397834
0.281650
Frag18 0.295936
0.177424
0.756477
-0.402440
-0.298925
-0.383894
-0.367859
-0.126616
-0.351833
-0.309742
0.337067
Frag19 0.785326
0.130371
0.136681
-0.202573
-0.179036
-0.134122
-0.170625
0.080243
-0.192617
-0.174006
0.024567
Frag20 0.863474
-0.002443
0.219127
-0.218212
-0.121957
-0.199344
-0.231768
0.010370
-0.207348
-0.132584
0.073224
Frag21 0.777735
-0.101351
0.126948
-0.091994
-0.164787
-0.188439
-0.142938
0.074523
-0.141725
-0.127757
0.090588
Frag22 0.802198
-0.038694
0.198085
-0.180159
-0.150541
-0.171189
-0.169022
0.048382
-0.192372
-0.136318
0.152344
Frag24 0.086412
-0.629291
-0.061299
0.237942
-0.003239
-0.054219
0.146676
0.359994
0.198353
-0.043496
-0.139597
Frag26 -0.034109
-0.808224
-0.174639
0.378370
0.082874
0.070298
0.295647
0.178596
0.349423
0.018489
-0.355504
Frag27 -0.020202
-0.896953
-0.367446
0.643596
0.330514
0.275508
0.554239
0.382963
0.580538
0.269347
-0.665713
Frag28 0.062577
0.552844
0.347303
-0.552566
-0.315893
-0.289564
-0.432198
-0.317606
-0.470566
-0.125382
0.822814
Frag29 0.042759
0.454767
0.321957
-0.551911
-0.210387
-0.279034
-0.395847
-0.264686
-0.394544
-0.165852
0.726746

298
Frag4 0.074611
0.311958
0.356159
-0.46253
5
-0.33562
1
-0.38886
6
-0.41980
4
-0.22497
1
-0.39625
7
-0.23496
0
0.652271
Frag5 0.037455
0.285266
0.399746
-0.513453
-0.408584
-0.410451
-0.461885
-0.225403
-0.527764
-0.301694
0.661895
Frag9 0.144302
0.307151
0.602107
-0.429370
-0.230308
-0.289795
-0.476524
-0.192732
-0.428887
-0.257095
0.450757
InterPL10
-0.244310
-0.333840
-0.402083
0.689156
0.518564
0.376360
0.519989
0.262621
0.568017
0.372840
-0.455312
InterPL11
-0.132411
-0.104819
-0.355793
0.355643
0.661984
0.337227
0.294229
0.142573
0.300059
0.301185
-0.275562
InterPL12
-0.126225
-0.026218
-0.328512
0.350603
0.763070
0.403311
0.332246
-0.036804
0.368498
0.398929
-0.262445
InterPL13
-0.076079
-0.166504
-0.217041
0.427918
0.638327
0.431919
0.334642
-0.036111
0.423519
0.367789
-0.324131
InterPL14
-0.119382
-0.329711
-0.324507
0.654803
0.382377
0.332812
0.477241
0.209011
0.505118
0.341439
-0.441263
InterPL16
-0.115418
-0.489239
-0.381454
0.763499
0.374381
0.356621
0.462537
0.438058
0.575997
0.217937
-0.548459
InterPL17
-0.211903
-0.396592
-0.403206
0.671754
0.432534
0.375097
0.526271
0.264595
0.511095
0.370941
-0.515117
InterPL2 -0.171212
-0.511720
-0.437295
0.780961
0.435266
0.368993
0.576790
0.339071
0.632284
0.332058
-0.570545
InterPL3 -0.147237
-0.359470
-0.413213
0.706141
0.459516
0.458009
0.574726
0.259667
0.543304
0.319514
-0.491229
InterPL5 -0.091728
-0.458806
-0.351179
0.688478
0.252194
0.311851
0.496200
0.224146
0.464765
0.124436
-0.535104
InterPL6 -0.174128
-0.338286
-0.360650
0.672781
0.366226
0.380842
0.446410
0.250253
0.498604
0.291465
-0.480010
InterPL7 -0.117943
-0.524062
-0.332031
0.674334
0.386586
0.334933
0.422021
0.324015
0.569401
0.299567
-0.567979
InterPL8 -0.148592
-0.328122
-0.318862
0.469949
0.777454
0.431801
0.468956
0.172285
0.483556
0.435390
-0.410372

299
InterPL9 -0.17922
0
-0.17194
2
-0.28369
6
0.418580
0.687837
0.348260
0.348789
0.078902
0.361777
0.378750
-0.29036
3
IntraPL11
-0.164422
-0.108790
-0.348089
0.357142
0.427529
0.711926
0.349624
-0.010322
0.339023
0.396945
-0.311369
IntraPL14
-0.208931
-0.221005
-0.386220
0.511746
0.434232
0.448259
0.685518
0.162365
0.480633
0.325001
-0.403414
IntraPL17
-0.144380
-0.466518
-0.456785
0.611725
0.363606
0.381541
0.817708
0.238603
0.620307
0.337968
-0.540033
IntraPL18
-0.139275
-0.331050
-0.328504
0.394560
0.305282
0.327475
0.695993
0.001264
0.449013
0.306366
-0.323842
IntraPL19
-0.216848
-0.194180
-0.401473
0.427144
0.453673
0.741771
0.437580
0.092373
0.401811
0.392997
-0.389206
IntraPL2
-0.095525
-0.223928
-0.300335
0.381566
0.304538
0.612711
0.271690
0.126735
0.369446
0.335242
-0.412603
IntraPL3
-0.106202
-0.052788
-0.337569
0.341768
0.369316
0.703357
0.409698
0.115143
0.330750
0.424107
-0.342317
IntraPL6
-0.140052
-0.353812
-0.395534
0.488415
0.326109
0.293260
0.608067
0.202288
0.467585
0.170137
-0.485026
IntraPL9
-0.132552
-0.050575
-0.294425
0.271865
0.316907
0.634698
0.274870
-0.018233
0.267502
0.363410
-0.208832
SupPL1 -0.183129
-0.473606
-0.271355
0.543984
0.313487
0.235131
0.487195
0.300037
0.684443
0.220881
-0.474298
SupPL13
0.015633
-0.315560
-0.234224
0.454207
0.381952
0.422298
0.418058
0.169851
0.609152
0.311718
-0.379766
SupPL20
-0.161688
-0.031185
-0.239378
0.231079
0.354522
0.373102
0.252217
0.027656
0.263410
0.735395
-0.135694
SupPL21
-0.119339
-0.032823
-0.274760
0.245469
0.360821
0.429239
0.283049
0.015516
0.305406
0.674920
-0.157445
SupPL22
-0.110197
-0.156298
-0.369921
0.304696
0.365161
0.408503
0.358075
0.042107
0.381921
0.729220
-0.215620
SupPL26
-0.123176
-0.208999
-0.368379
0.405389
0.441111
0.398104
0.276212
0.124719
0.434439
0.726246
-0.299281

300
SupPL27
-0.17751
1
-0.37847
3
-0.39978
1
0.551371
0.390432
0.334143
0.541382
0.281829
0.690684
0.419888
-0.47094
4
SupPL28
-0.195713
-0.363189
-0.374891
0.616261
0.445375
0.355478
0.560776
0.318222
0.750315
0.349249
-0.512602
SupPL29
-0.250449
-0.354252
-0.375444
0.487239
0.331680
0.362181
0.457752
0.134830
0.673856
0.348088
-0.327859
SupPL3 -0.171497
-0.353981
-0.455187
0.558852
0.412445
0.379420
0.486575
0.129137
0.720450
0.346313
-0.491318
SupPL30
-0.135521
-0.345199
-0.408384
0.509791
0.384424
0.341472
0.506522
0.108387
0.690023
0.386421
-0.417744
SupPL5 0.019374
-0.397067
-0.193897
0.418926
0.085114
0.115876
0.268600
0.903610
0.313451
0.057664
-0.366414
SupPL6 0.049719
-0.391340
-0.246751
0.406765
0.094224
0.116528
0.220954
0.900197
0.283532
0.093012
-0.346639
SupPL7 0.154669
-0.169214
-0.020948
0.183796
0.042248
-0.050284
0.079971
0.719482
0.131789
0.065242
-0.164974
SupPL8 0.111003
-0.091257
-0.015958
0.197552
0.061738
0.054367
0.067586
0.660425
0.195742
0.089965
-0.133067
SupPL9 0.021676
-0.338491
-0.132702
0.319042
0.078040
0.047408
0.124451
0.827814
0.225132
0.035554
-0.261844