determining online consumer typologies and their …
TRANSCRIPT
DETERMINING ONLINE CONSUMER TYPOLOGIES AND THEIR SHOPPING
BEHAVIORS IN B2C E-COMMERCE PLATFORMS
A THESIS SUBMITTED TO
THE GRADUATE SCHOOL OF INFORMATICS
OF
THE MIDDLE EAST TECHNICAL UNIVERSITY
BY
FARID HUSEYNOV
IN PARTIAL FULFILLMENT OF THE REQUIREMENTS FOR THE DEGREE OF
DOCTOR OF PHILOSOPHY
IN
THE DEPARTMENT OF INFORMATION SYSTEMS
NOVEMBER 2016

DETERMINING ONLINE CONSUMER TYPOLOGIES AND THEIR SHOPPING
BEHAVIORS IN B2C E-COMMERCE PLATFORMS
Submitted by Farid Huseynov in partial fulfillment of the requirements for the degree
of Doctor of Philosophy in Information Systems, Middle East Technical
University by,
Prof. Dr. Deniz Zeyrek Bozşahin _____________________
Director, Informatics Institute
Prof. Dr. Yasemin Yardımcı Çetin _____________________
Head of Department, Information Systems
Assoc. Prof. Dr. Sevgi Özkan Yıldırım _____________________
Supervisor, Information Systems, METU
Examining Committee Members:
Prof. Dr. Mehmet Abdülkadir Varoğlu
Business Administration, Başkent University _____________________
Assoc. Prof. Dr. Sevgi Özkan Yıldırım
Information Systems, METU _____________________
Assist. Prof. Dr. Erhan Eren
Information Systems, METU _____________________
Assoc. Prof. Dr. Banu Günel Kılıç
Information Systems, METU _____________________
Assist. Prof. Dr. Banu Yüksel Özkaya
Industrial Engineering, Hacettepe University _____________________
Date: 14.11.2016


iii
I hereby declare that all information in this document has been obtained and
presented in accordance with academic rules and ethical conduct. I also declare
that, as required by these rules and conduct, I have fully cited and referenced all
material and results that are not original to this work.
Name, Last name: Farid Huseynov
Signature : ______________


v
ABSTRACT
DETERMINING ONLINE CONSUMER TYPOLOGIES AND THEIR SHOPPING
BEHAVIORS IN B2C E-COMMERCE PLATFORMS
Huseynov, Farid
Ph.D., Department of Information Systems
Supervisor: Assoc. Prof. Dr. Sevgi Özkan Yıldırım
November 2016, 132 pages
Business-to-consumer (B2C) e-commerce is the service or product exchange from
businesses to consumers over the Internet. B2C e-commerce enables customers to
easily compare offered products and services, to find cheaper and better ones from
many alternatives and to shop from any given store without physically visiting them.
Despite those conveniences provided by B2C e-commerce, a large number of
customers prefer to stay away from the idea of shopping over internet due to several
factors. For better customer relationship management, it is important for online
retailers to clearly understand those critical factors affecting online consumer shopping
behavior and take necessary actions accordingly. Numerous studies in this field
assessed consumer online shopping behavior from various aspects. However, literature
review showed that conducted studies do not carry out segmentation analysis while
accessing shopping behavior of online consumers. The general conclusions made by
these studies about consumer attitude, behavior and decision making process might
not reflect actual behavior of different consumer segments. Contrary to previous
studies, this study initially identified different online consumer segments by
conducting two different types of market segmentation analysis, psychographic and
behavioral. Psychographic segmentation was based on self-report responses, while
behavioral segmentation made use of real e-commerce transaction data. As a result of
psychographic and behavioral segmentation analysis four and five different online
consumer segments were identified respectively. Shopping behavior of each
psychographic segment was further assessed by using the developed behavior
evaluation framework. Online retailers can utilize findings of this study to develop
more effective marketing strategies for each determined consumer segment.
Keywords: B2C e-commerce, Consumer Behavior, Online Consumer Typologies

vi
ÖZ
B2C E-TİCARET PLATFORMLARINDA ONLINE TÜKETİCİLERİN
TİPOLOJİLERİNİN VE ALIŞVERİŞ DAVRANIŞLARININ BELİRLENMESİ
Huseynov, Farid
Doktora, Bilişim Sistemleri
Tez Yöneticisi: Doç. Dr. Sevgi Özkan Yıldırım
Kasım 2016, 132 sayfa
B2C e-ticaret, internet üzerinden işletmeden tüketiciye ürün veya hizmet alışverişidir.
B2C e-ticaret, müşterilerin kolaylıkla, sunulan ürün ve hizmetleri karşılaştırmasını,
daha ucuz ve iyi olan ürünleri birçok alternatif arasında bulmasını ve fiziksel olarak
herhangi bir mağazaya gitmeksizin alışveriş yapmasını sağlar. E-ticaret tarafından
sağlanan bu kolaylıklara rağmen birçok müşteri internet üzerinden alışveriş yapmaktan
çeşitli faktörler nedeniyle uzak kalmayı tercih ediyor. Daha iyi müşteri ilişki yönetimi
için satış yapan kurumlar için online müşteri davranışını etkileyen bu kritik faktörleri
anlamak ve tedbir almak önemlidir. Bu alanda bir çok çalışma müşterilerin online
alışveriş tutumunu farklı açılardan değerlendirmiştir. Ancak; literatür araştırması,
yürütülen çalışmaların online müşterilerin alışveriş davranışlarını ölçerken müşterileri
alışveriş türlerine göre ayırmadıklarını ortaya koymuştur. Bu çalışmalarda müşteri
tutumuna ilişkin ulaşılan genel sonuç; davranış ve karar verme süreci, farklı müşteri
türlerinin gerçek davranışını yansıtmayabilir. Önceki çalışmaların aksine, başlangıçta
bu çalışma farklı online müşteri türlerini psikografik ve davranışsal olmak üzere iki
farklı segmentasyon analizi yaparak belirlemiştir. Psikografik segmentasyon,
katılımcıların kendi ifadelerine dayanırken davranışsal segmentasyon gerçek e-ticaret
verilerine dayanmaktadır. Psikografik ve davranışsal segmentasyon analizi sonucunda
sırasıyla dört ve beş farklı müşteri segmenti ortaya çıkmıştır. Belirlenen her bir
psikografik segmentin online alışveriş davranışı geliştirilmiş davranış değerlendirme
çerçevesinde ayrıca değerlendirilmiştir. Online satıcılar, belirlenen her bir segment
için daha etkili pazarlama stratejisi geliştimek üzere bu çalışmanın bulgularını
kullanabilir.
Anahtar Kelimeler: B2C e-ticaret, Tüketici Davranışları, Online Tüketici Tipolojileri

vii
This thesis is dedicated to:
My beautiful wife Sema Yıldız Huseynov
&
My dear son Emir Huseynov

viii
ACKNOWLEDGEMENTS
I would like to express my sincere thanks and appreciation to my supervisor, Assoc.
Prof. Dr. Sevgi Özkan Yıldırım, for her advice, guidance and encouragement she has
provided throughout my graduate studies.
I would like to thank Ministry of Education of Azerbaijan and Nippon foundation
(Japan Turkey Central Asia Friendship Association) for supporting me with
scholarships during my graduate studies.
I would also like to thank Markafoni.com for supporting this research by providing
real e-commerce transaction data.
I would like to thank my parents Vaqif and Tarana, brother Elvin and sister Nazrin for
always believing in my success during my graduate studies.
Finally, and most importantly, I would like to thank my wife Sema Yıldız Huseynov.
Her support and patience during my researches have been invaluable.

ix
TABLE OF CONTENTS
ABSTRACT ............................................................................................................................ v
ÖZ ........................................................................................................................................... vi
ACKNOWLEDGEMENTS ............................................................................................... viii
TABLE OF CONTENTS ..................................................................................................... ix
LIST OF TABLES ............................................................................................................... xii
LIST OF FIGURES ............................................................................................................ xiii
LIST OF ABBREVIATIONS ............................................................................................ xiv
CHAPTER I ........................................................................................................................... 1
INTRODUCTION .................................................................................................................. 1
1.1 Statement of the Problem ......................................................................................... 1
1.2 Purpose of the Study ................................................................................................ 2
1.3 Research Questions .................................................................................................. 3
1.4 Justification of the Study.......................................................................................... 3
1.5 Thesis Outline .......................................................................................................... 4
CHAPTER II .......................................................................................................................... 5
LITERATURE REVIEW ..................................................................................................... 5
2.1 Background of Electronic Commerce ...................................................................... 5
2.2 Previous studies on B2C E-Commerce .................................................................. 11
2.2.1 Studies Focusing on Online Consumer Behavioral Issues ............................. 15
2.2.2 Studies Focusing on Online Store/Vendor Related Factors ........................... 16
CHAPTER III ...................................................................................................................... 19
RESEARCH MODEL DEVELOPMENT AND HYPOTHESES FORMULATION.... 19
3.1 Conceptual Models ................................................................................................ 19
3.2 Online Consumer Typologies ................................................................................ 21
3.3 Behavior Evaluation Framework and Stated Hypotheses ...................................... 22
3.3.1.1 Perceived Ease of Use (PEOU) and Perceived Usefulness (PU) ............... 22
3.3.1.2 Perceived Enjoyment (PENJ) ..................................................................... 23
3.3.1.3 Perceived Compatibility (PCP) .................................................................. 23
3.3.1.4 Perceived Information Security (PIS) ........................................................ 24

x
3.3.1.5 Perceived Social Pressure (PSP) ................................................................ 25
3.3.1.6 Attitude toward Online Shopping (ATT) ................................................... 25
CHAPTER IV ....................................................................................................................... 27
RESEARCH METHODOLOGY ........................................................................................ 27
4.1 Research Design ..................................................................................................... 27
4.2 Procedures .............................................................................................................. 28
4.3 Study Sample .......................................................................................................... 29
4.4 Survey Instruments ................................................................................................. 29
4.5 Statistical Techniques ............................................................................................. 30
CHAPTER V ........................................................................................................................ 31
DATA ANAYLSIS ............................................................................................................... 31
5.1 Exploratory Factor Analysis (EFA)........................................................................ 31
5.1.1 EFA on Internet Activities Scale .................................................................... 31
5.1.2 EFA on Internet Psychographics Scale .......................................................... 33
5.2 Psychographic Segmentation Analysis................................................................... 35
5.2.1 Shopping Lovers ............................................................................................. 42
5.2.2 Direct Purchasers ............................................................................................ 43
5.2.3 Suspicious Browsers ....................................................................................... 45
5.2.4 Incompetent Consumers ................................................................................. 47
5.3 Behavioral Segmentation Analysis......................................................................... 49
5.3.1 Opportunist Customers ................................................................................... 56
5.3.2 Transient Customers ....................................................................................... 58
5.3.3 Need-based Shoppers ..................................................................................... 60
5.3.4 Skeptical Newcomers ..................................................................................... 62
5.3.5 Repetitive Purchasers ..................................................................................... 64
5.4 Multi-group Structural Equation Modeling (SEM) ................................................ 66
5.4.1 Normality Assessment .................................................................................... 66
5.4.2 Collinearity Assessment ................................................................................. 67
5.4.3 Validity and Reliability Assessment .............................................................. 67
5.4.4 The Baseline Model ........................................................................................ 68
5.4.5 The Configural Model .................................................................................... 70
5.4.6 Testing for Measurement and Structural Invariance ...................................... 71
5.4.7 Testing for the Invariance of a Causal Structure ............................................ 72
5.4.8 Hypotheses Testing ........................................................................................ 72
CHAPTER VI ....................................................................................................................... 77
DISCUSSION AND CONCLUSION .................................................................................. 77
6.1 Practical Business Implications .............................................................................. 77
6.1.1 Psychographic Segments ................................................................................ 77
6.1.2 Behavioral Segments ...................................................................................... 84

xi
6.2 Limitations and Future Research Suggestions ....................................................... 89
REFERENCES ..................................................................................................................... 91
APPENDICES .................................................................................................................... 107
APPENDIX A – LIST OF REVIEWED JOURNALS ........................................................ 107
APPENDIX B – ETHICAL CLEARANCE ........................................................................ 109
APPENDIX C – DEMOGRAPHIC AND DOMAIN SPECIFIC SCALE .......................... 110
APPENDIX D – INTERNET PSYCHOGRAPHICS SCALE ............................................ 112
APPENDIX E – MAIN SURVEY ITEMS .......................................................................... 114
APPENDIX F – DATA ITEMS (E-COMMERCE TRANSACTION LOGS) .................... 117
APPENDIX G – CORRELATION MATRIX (INTERNET ACTIVITIES) ....................... 118
APPENDIX H – ANTI IMAGE MATRICES (INTERNET ACTIVITIES) ....................... 119
APPENDIX I – EXPLAINED VAR. & SCREE PLOT (INT. ACTIVITIES) .................... 120
APPENDIX J – EXPLAINED VAR. & SCREE PLOT (INT. PSYCHOGRAPHICS) ...... 122
APPENDIX K – CENTROIDS (SEGMENTATION FACTORS) ...................................... 124
APPENDIX L – BEHAVIORAL SEGMENT SIZES ACCORDING TO REGIONS ........ 126
APPENDIX M – NORMALITY ASSESSMENT ............................................................... 127
APPENDIX N – CFA FACTOR LOADINGS .................................................................... 128
APPENDIX O – ESTIMATED STRUCTURAL COEFFICIENTS.................................... 130
CURRICULUM VITAE .................................................................................................... 131
xii
LIST OF TABLES
Table 1 - Types of E-Commerce .............................................................................................. 6
Table 2 - Benefits of e-commerce to customers, organizations and society ............................ 9
Table 3 - Journals with more than three articles on B2C e-commerce ................................... 12
Table 4 - Common limitations of retrieved articles ................................................................ 13
Table 5 - KMO and Barlett’s test of sphericity (Internet activities scale) .............................. 31
Table 6 - Rotated factor matrix (Internet activities scale) ...................................................... 32
Table 7 - Reliability test results (Internet activities scale) ..................................................... 33
Table 8 - KMO and Bartlett's test of sphericity (Internet psychographics scale) ................... 33
Table 9 - Rotated factor matrix (Internet psychographics scale) ............................................ 34
Table 10 - Reliability test results (Internet psychographics scale) ......................................... 35
Table 11 - Demographic profile of respondents ..................................................................... 36
Table 12 - Description of psychographic segmentation factors ............................................. 37
Table 13 - Two Step auto-clustering result (Psychographic segmentation) ........................... 38
Table 14 - Psychographic segmentation results ..................................................................... 41
Table 15 - Demographic profile of customers ........................................................................ 50
Table 16 - Description of behavioral segmentation and evaluation factors ........................... 51
Table 17 - Two Step auto-clustering result (Behavioral segmentation) ................................. 53
Table 18 - Behavioral segmentation results ........................................................................... 55
Table 19 - Correlation between predictor variables ............................................................... 67
Table 20 - Construct reliability assessment ............................................................................ 68
Table 21 - Goodness-of-Fit Statistics of Baseline Model....................................................... 70
Table 22 - Goodness-of-fit indices of multiple-group CFA invariance testing ...................... 71
Table 23 - Goodness-of-fit indices of multigroup SEM analysis for causal structure ........... 72
Table 24 - Goodness-of-fit indices of structural model .......................................................... 73
Table 25 - Hypotheses testing results ..................................................................................... 75
Table 26 - Practical Business Implications (Psychographic Segments) ................................. 82
Table 27 - Practical Business Implications (Behavioral Segments) ....................................... 87
xiii
LIST OF FIGURES
Figure 1 - Most Popular Online Activities in USA (2002-2011) ............................................. 6
Figure 2 - The most popular online activities in Turkey .......................................................... 7
Figure 3 - The share of e-retailing in total retailing (Source: TÜBİSAD & Deloitte, 2014) ... 7
Figure 4 - E-commerce market size in Turkey (Source: TÜBİSAD & Deloitte, 2014)........... 8
Figure 5 - Global e-Commerce Sales (Source: eMarketer.com, December 2014)................... 8
Figure 6 - Steps followed in an online shopping task ............................................................ 10
Figure 7 - Distribution of the reviewed articles by year ........................................................ 12
Figure 8 - Classification of articles based on their research focus, aim and perspective. ...... 14
Figure 9 - Potential online consumer segments ..................................................................... 20
Figure 10 - Online consumer behavior evaluation framework .............................................. 20
Figure 11 - Research Phases .................................................................................................. 28
Figure 12 - Psychographic segmentation radar chart ............................................................. 40
Figure 13 - Shopping Lovers (Average factor scores) ........................................................... 42
Figure 14 - Shopping Lovers (Variable importance plot) ...................................................... 43
Figure 15 - Direct Purchasers (Average factor scores) .......................................................... 44
Figure 16 - Direct Purchasers (Variable importance plot) ..................................................... 45
Figure 17 - Suspicious Browsers (Average factor scores) ..................................................... 46
Figure 18 - Suspicious Browsers (Variable importance plot) ................................................ 47
Figure 19 - Incompetent Consumers (Average factor scores)................................................ 48
Figure 20 - Incompetent Consumers (Variable importance plot) .......................................... 49
Figure 21 - Behavioral segmentation radar chart ................................................................... 54
Figure 22 - Behavioral segment sizes according to regions ................................................... 56
Figure 23 - Opportunist Customers (Radar chart).................................................................. 57
Figure 24 - Opportunist Customers (Variable importance plot) ............................................ 58
Figure 25 - Transient Customers (Radar chart)...................................................................... 59
Figure 26 - Transient Customers (Variable importance plot) ................................................ 60
Figure 27 - Need-based Shoppers (Radar chart) .................................................................... 61
Figure 28 - Need-based Shoppers (Variable importance plot) ............................................... 62
Figure 29 - Skeptical Newcomers (Radar chart) .................................................................... 63
Figure 30 - Skeptical Newcomers (Variable importance plot) .............................................. 64
Figure 31 - Repetitive Purchasers (Radar chart) .................................................................... 65
Figure 32 - Repetitive Purchasers (Variable importance plot) ............................................... 66
Figure 33 - CFA (Baseline Model) ........................................................................................ 69
Figure 34 - Structural Equation Model .................................................................................. 74

xiv
LIST OF ABBREVIATIONS
ATT Attitude
B2C Business to Consumer
E-Commerce Electronic Commerce
EDI Electronic Data Interchange
EFT Electronic Fund Transfers
E-Store Electronic Store
HTML Hypertext Markup Language
HTTP Hypertext Transfer Protocol
ICT Information and Communication Technology
IS Information Systems
INT Intention
METU Middle East Technical University
PEOU Perceived Ease of Use
PENJ Perceived Enjoyment
PCP Perceived Compatibility
PIS Perceived Information Security
PSP Perceived Social Pressure
PU Perceived Usefulness
TAM Technology Acceptance Model
TPB Theory of Planned Behavior
TÜBİSAD Türkiye Bilişim Sanayiciler Derneği
US United States
USA United States of America
WWW World Wide Web

1
CHAPTER I
INTRODUCTION
1.1 Statement of the Problem Business-to-consumer electronic commerce or simply B2C e-commerce allows
consumers to directly buy goods and services from online retailers over the Internet.
The widespread adoption of e-commerce plays an important role in the development
of countries. The benefits of e-commerce technologies for countries range from social
to economic. E-commerce technologies enable companies to expand their marketplace
by enabling them rapidly, easily and cost-efficiently locate not only more customers
but also the best suppliers and the most suitable business partners both nationally and
internationally (Turban et al., 2005; Albăstroiu, 2007). On the other side, it increases
buyers productivity by enabling them to carry out fast, convenient and price
transparent e-commerce transactions with many national and international sellers. It
also improves the standard of living in rural areas by enabling people to reach products
and services which are not available in their present location (Turban et al., 2005).
Reduction of market entry costs, reduction of transaction costs, improvement of access
to market information, better resource allocation, improvement of international
coordination, an open economy stimulating competitions, diffusion of key
technologies, less road traffic and lower air pollution are some other positive impacts
of e-commerce on economy and society (Ghibutiu, 2003; Vinaja, 2003; Turban et al.,
2005). In developing countries, e-commerce has a potential to add a higher value to
businesses and consumers compared to developed countries. However, most
companies and consumers in developing countries have failed to get the benefits of e-
commerce enhanced by modern information and communications technologies (ICTs)
(Kshetri, 2007). According to market researches, while e-commerce is among top five
popular activities conducted over the Internet in developed countries (Pew Research
Center, 2011; EuroStat, 2013); in developing nations, most of the internet users use
the internet to socialize and get information and less people use it for e-commerce
transactions (Pew Research Center, 2014). The share of e-retailing constitutes only
6.5 percent of total retailing sales in developed nations and this figure is only 4.5
percent in developing nations (Deloitte, 2015). Financial, logistics and ICT
infrastructures are vital parts of any e-commerce business operations. Despite the
improvements in financial, logistics and ICT infrastructures in most of the countries,
e-retailing is not getting enough attention especially in developing countries.

2
Studies in information systems literature have showed that any given ICT will not get
proper attention by its potential users unless users’ behavioral issues are taken into
consideration while designing and operating such systems. In e-commerce domain, it
has also been realized that very good technical infrastructures and solutions are not
enough for e-retailing to be successful in today’s highly competitive business
environment. The problem in this domain is not purely technical but mainly behavioral
in nature. For that reason, a great deal of researches was conducted in order to identify
critical factors influencing shopping behavior of online consumers. Online consumer
behavior was investigated from the perspectives of consumer demographics (Chau et
al., 2002; Brown et al., 2003; Garbarino & Strahilevitz, 2004; Alam et al., 2008),
psychological factors (Huang et al., 2006; Shankar et al., 2003; Lin, 2007; Bosnjak et
al.,2007; Lian & Lin, 2008; Bashar & Wasiq, 2013), cognitive factors (Belanger et al.,
2002; Kim et al., 2008; Javadi et al.,2012; Bashar & Wasiq, 2013), cultural factors
(Park & Jun, 2003; Ko et al., 2004; Davis et al.,2008; Yoon, 2009) and online store
related factors (i.e., design, functionality, content) (Ranganathan & Ganapathy, 2002;
Shergill & Chen, 2005; Ghasemaghaei et al.,2009).
However, while accessing consumers shopping behavior in online platforms, a great
deal of the existing studies did not take into consideration the existence of different
consumer typologies (Huseynov and Yıldırım, 2016a). That is, a great majority of
studies assumed that online consumer audience is composed of single type of
consumers and this assumption might lead researchers to make conclusions about
online consumers shopping behaviors which might not be valid for different types of
consumer groups.
1.2 Purpose of the Study This study aims to identify different consumer typologies in business-to-consumer
(B2C) online shopping platforms and later determine the critical factors influencing
shopping behaviors of each determined consumer segment. If these critical factors
influencing consumers’ shopping behavior can be identified and managed correctly
they can provide several advantages to the companies over its competitors by allowing
them to generate more revenues and increase its customer base by developing
successful marketing strategies customized to the characteristics of each determined
consumer segment. Segmentation is a process of dividing a broad target market into
subsets of consumers who share common needs, expectations and interests.
Segmentation process enables firms to design and implement successful marketing
strategies to target different segments. Explorative segmentation analysis that will be
carried in this study aims to identify hidden structures in consumers behavior and
attitudes. More specifically, segmentation analysis in this study aims to identify groups
of online consumers who share similar characteristics in terms of their perception of
e-commerce.
This study aims to fulfill the existing gap in relevant literature by initially carrying out
market segmentation analysis in order to determine different online customer segments
and their main characteristics. The segmentation approach in this study will be based
on psychographic and behavioral factors. Later, comprehensive online consumer
behavior evaluation framework developed within the scope of this study will be tested
on each determined consumer segment. A customer segmentation process enhanced
with behavior evaluation framework will explain much more reliable information
about the characteristics of different online consumer groups which will enable online

3
retailers to effectively allocate their marketing resources and design more successful
marketing mix for each consumer segment. Determination of shopping behavior of
each online customer segment will also provide insight to online retailers in
customizing their products and services for them to appeal more specifically to each
segment’s needs, expectation and motivations.
1.3 Research Questions In line with the purpose of this study, two research questions were identified.
R1: What segments exist in a broad online consumer audience and what are their main
behavioral characteristics in terms of online shopping?
R2: Do factors influencing consumer attitudes and intentions toward online shopping
exhibit changes according to different consumers segments?
1.4 Justification of the Study The worldwide audience of online consumers is constantly growing. This growing
trend requires online consumers to be segmented very carefully for marketing efforts
to be successful. Segmentation enables to divide broad target market into subset of
consumers who have common needs, expectations and interests. Successful
segmentation process enables companies to develop more effective marketing
strategies, reduce direct marketing costs, increase consumers satisfaction levels,
reduce churn rates and determine the profitable customer groups (Laudon and Laudon,
2014, pp.386). It also enables companies to customize their products according to each
segments’ needs.
Systematic literature review (Huseynov and Yıldırım, 2016a) on the issue showed that
most of the existing studies assume that online consumer audience is composed of a
single type of customers who share similar characteristics in perception of e-
commerce. That is, the major deficiency of these studies is their assumption about
online consumer audience being composed of a single type of customers. However,
numerous studies showed that online consumer audience is not a single market
segment (Swinyard and Smith, 2003; Brengman et al., 2005; Jayavardhena et al., 2007;
Ganesh et al., 2010; Ye et al., 2011). Therefore, the general conclusions made by these
studies about consumers’ behavior, attitudes and decision making processes might not
be valid for broad online consumer audience and might not reflect actual behavior of
different consumer segments. Carrying out segmenting process on online consumer
audience and later assessing each segments behavior which are the main objectives of
this research can reveal more reliable results.
Most of the existing segmentation studies classified online customers according to
their demographic characteristics such as age, gender, culture, income, occupation,
marital status, etc. (Huseynov and Yıldırım, 2016a). However, only few studies carried
out segmentation analysis based on psychographic and behavioral characteristics.
Psychographic and behavioral segmentation approach takes into consideration several
factors about online consumer such as online activities, attitudes, perceptions,
expectations, lifestyle, consumption and etc. Segmentation analysis based on
psychographic and behavioral factors can be more robust than segmentation simply
based on demographic factors as literature review showed that there exist a reasonable
amount of contradictions among findings of studies based on demographic factors
(Huseynov and Yıldırım, 2016a). Contradictory results of demographic studies show

4
that caution should be exercised while interpreting research findings to different
cultural contexts. In contrast, segmentation based on psychographic and behavioral
factors exhibits stability and consistency even in cross-cultural environments
(Swinyard and Smith, 2003; Brengman et al., 2005). Therefore, in this study two robust
form of segmentation approach (i.e., psychographic and behavioral) are utilized in
dividing a consumer base into separate subsets and in evaluating their behavioral
characteristics.
1.5 Thesis Outline This thesis is divided into six chapters which are mentioned below. In Chapter 1,
statement of the problem, purpose of the study, research questions and justification of
the study are given. Chapter 2 mentions about B2C e-commerce concept and reviews
previous studies conducted on this field. In Chapter 3, research model and proposed
hypotheses are provided. In Chapter 4, the methodology of the study including
research design, procedures, study sample, survey instruments and statistical
techniques are presented. Chapter 5 is about the data analysis. In this section, the
collected data is analyzed by using necessary statistical methods and tools. Results of
the statistical tests are also explained in this chapter. Chapter 6 summarizes the
research findings and presents derived practical business implications. This chapter
also mentions about research limitations and suggests possible future research
directions in this field.

5
CHAPTER II
LITERATURE REVIEW
2.1 Background of Electronic Commerce Commerce is a branch of business which deals with exchange of goods and services.
It includes all the activities which facilitate this exchange process either directly or
indirectly. Before going into detail about the electronic commerce (e-commerce), it is
worth to review the terms Internet and World Wide Web (WWW). Many people use
the words Internet and WWW interchangeable; however, these two words refers
completely different but related things. Internet refers to a networking infrastructure
which connects millions of computers and electronic devices globally. However, the
WWW is simply one of many applications of Internet. WWW, or simple web, is based
on HTML, HTTP, web servers and browsers. WWW consists of pages which reside
on servers and can be accessed by using a web browser. In its early years, the term e-
commerce referred the electronic execution of commercial transactions with the help
of technologies such as Electronic Data Interchange (EDI) and Electronic Fund
Transfers (EFT). These transactions mostly executed by big companies and
organizations. However, thousands of new businesses started to appear on web after
the commercialization of Internet in 1991. Just before the commercialization of
Internet, a new revolution was started in 1990 when Tim Berners-Lee built all the
necessary tools including the first web browser (WWW) for a working web. Initially,
WWW was adopted by scientific research centers and laboratories of universities.
However, after the introduction of first graphical web browsers “Mosaic” in 1992,
WWW started to gain popularity. Electronic commerce, also known as e-commerce,
is a type of business model which allows buyers and sellers to conduct a business or
transaction over the Internet or other computer networks.
Different types of e-commerce are given in Table 1. As it is given in Table 1, there are
9 main types of e-commerce. B2B model refers to commercial transaction between
businesses. Transactions between manufacturer, wholesaler and retailer can be an
example to B2B. In B2C model, business is conducted directly between the company
and the consumer who are the end-user of the products or the services provided by the
given company. C2C e-commerce is third party facilitated electronic transactions
between end-users of the products or services. Online auction websites can be given
an example to C2C. C2B which is reverse of B2C refers to business model in which
end user creates and provides goods or services to the companies. B2G encompasses
6
marketing of products and services by private organizations to various government
sectors. On the other hand, G2B involves the sale of government services and goods
to the private business organizations.
Table 1 - Types of E-Commerce
Business Consumer Government
Business B2B B2C B2G
Consumer C2B C2C C2G
Government G2B G2C G2G
The most common type electronic commerce we encounter on the Internet is B2C
online shopping. B2C online shopping is a form of electronic commerce which allows
consumers to buy products or services from the seller over the Internet. Online
shopping transforms traditional shopping in the physical stores to the digital market.
After the commercialization of Internet more and more dotcoms started to appear on
the web. Dotcoms refers to the companies that conduct most of their business over the
Internet. Even though many dotcoms went out of business between 1999 and 2001,
many others survived and continued to be successful till present.
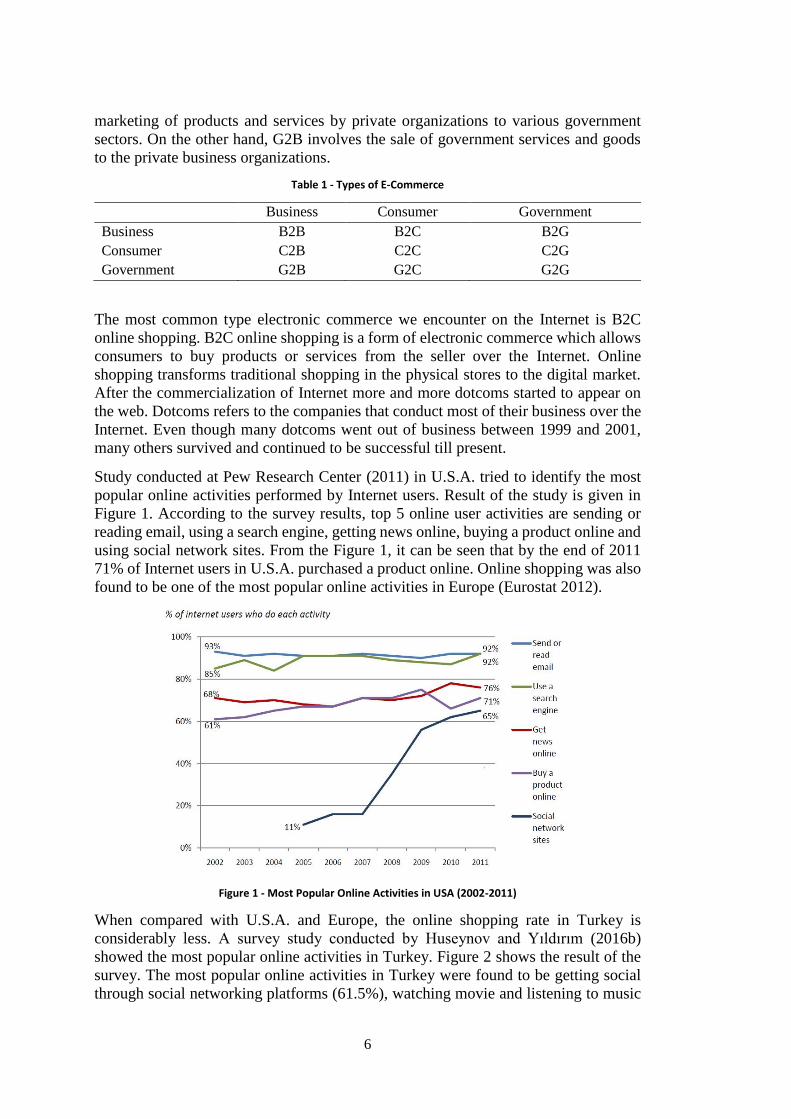
Study conducted at Pew Research Center (2011) in U.S.A. tried to identify the most
popular online activities performed by Internet users. Result of the study is given in
Figure 1. According to the survey results, top 5 online user activities are sending or
reading email, using a search engine, getting news online, buying a product online and
using social network sites. From the Figure 1, it can be seen that by the end of 2011
71% of Internet users in U.S.A. purchased a product online. Online shopping was also
found to be one of the most popular online activities in Europe (Eurostat 2012).
Figure 1 - Most Popular Online Activities in USA (2002-2011)
When compared with U.S.A. and Europe, the online shopping rate in Turkey is
considerably less. A survey study conducted by Huseynov and Yıldırım (2016b)
showed the most popular online activities in Turkey. Figure 2 shows the result of the
survey. The most popular online activities in Turkey were found to be getting social
through social networking platforms (61.5%), watching movie and listening to music

7
(48.2%) and reading news (45.6%). Only 18.5% of respondents stated that they
actively use Internet for online shopping.
Figure 2 - The most popular online activities in Turkey
The research conducted by TÜBİSAD and Deloitte (2015) assessed the share e-
retailing in total retailing in different nations of the world. The result of the research is
given in Figure 3. In developing nations, on average 4.5 percent of total retail sales
comes from online retailing. In developed nations, this ratio is 6.5 percent. In Turkey,
online retail transaction constitutes only 1.6 percent of total retail sales which is well
below the average of both developing and developed nations. Turkey comes just ahead
of India (1.5 percent) in e-retailing penetration level.
Figure 3 - The share of e-retailing in total retailing (Source: TÜBİSAD & Deloitte, 2014)
2
13.8
17.9
18.5
21
32.3
40
45.6
48.2
61.5
0 10 20 30 40 50 60 70
Other
Blogs
Sharing files
Shopping
Game
Downloading resources
Chat
News
Movie and music
Social networking

8
Even though market potential is good (18.9 billion TL) in Turkey and expanding every
year with 35% (Figure 4) growth level, it does not get enough attention when compared
with other nations (TÜBİSAD and Deloitte, 2015).
Figure 4 - E-commerce market size in Turkey (Source: TÜBİSAD & Deloitte, 2014)
The rate of e-commerce sales has kept growing every year since its first appearance
on the Internet as a new way of conducting a business and it is estimated to continue
growing year by year. Figure 5 shows the estimated global e-commerce sales between
2013 and 2018 in trillion US dollars. According to the statistics, while the online retail
sales were 21.2 trillion dollars in 2013, it is estimated to reach approximately 28.3
trillion dollars in 2018. That is, the volume of online sales is estimated to increase
approximately 25 percent in 6-year time period.
Figure 5 - Global e-Commerce Sales (Source: eMarketer.com, December 2014)
There are several reasons behind the growing trend of e-commerce worldwide.
According to Internet World Statistics (2015), the number of global Internet users is
increasing every year. By the end of 2015 the number of Internet users was
approximately 3.37 billion (Internet World Stats, 2015). The growth rate in the number
of Internet users between the years 2000 and 2015 is approximately 833 percent. As a
result of the increase in Internet usage, the rate of e-commerce is on the increase
particularly in the countries where marketing infrastructure are well developed (Salehi,
2012). Other possible reasons behind the growth level of e-commerce can be listed as
follows. Firstly, sellers and buyers are not limited to geographical locations; that is,
consumers do not need to travel long distances in order to purchase the items they
need. Through e-store they can easily make transactions with sellers located in another
2013 2014 2015 2016 2017 2018
Trillion Dollars $21.2 $22.5 $23.9 $25.4 $26.8 $28.3
$0.0
$5.0
$10.0
$15.0
$20.0
$25.0
$30.0
9
city or country by saving both time and traveling cost. Secondly, in order to attract
consumers to physical store very good branding, customer relationships, marketing
strategies are required. However, in e-commerce it is very easy to attract potential
customers worldwide to e-store by utilizing certain search engines, social networking
and online advertising strategies. Thirdly, a lowered cost is another factor which makes
e-commerce so popular (Su & Huang, 2011). When compared with costs physical
retailing, advertising and marketing costs in electronic commerce is much lower.
Organic traffic from search engines, social media traffic, per-pay-click traffic and
other online advertising strategies lowers the marketing expenses of online retailers.
In addition, automation of the billings, checkouts and operational processes lowers the
expenses by reducing the number of employees required. Moreover, since online
retailers are selling their products over Internet, they do not need to rent, build or
purchase a physical store which requires a large amount of investment. All of these
reduced costs mentioned above are reflected to online consumers in the form of
discounted prices. Finally, in physical store a lot of effort and time are required in order
to physically find and compare the features of the items. However, in e-commerce
there exist intelligent services which searches the products across well-known stores
and after finding the relevant items it compare features and prices of those items and
list them in a tabular form which makes decision making process for online customer
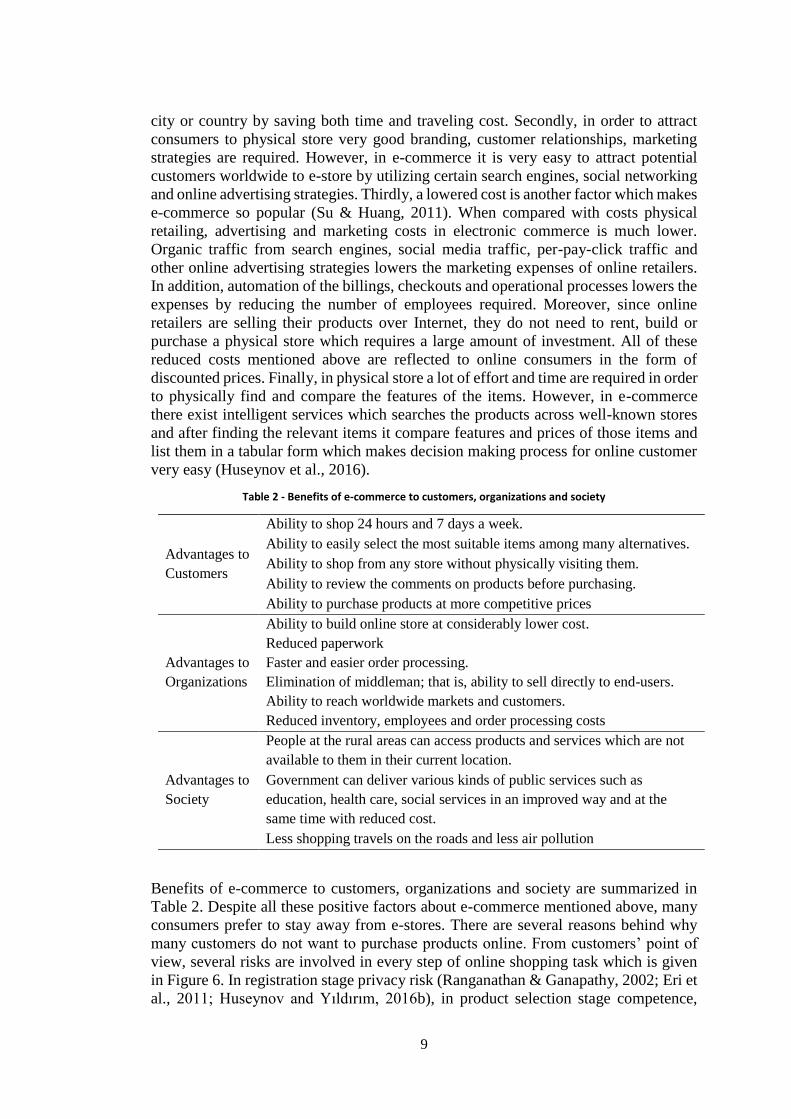
very easy (Huseynov et al., 2016).
Table 2 - Benefits of e-commerce to customers, organizations and society
Advantages to
Customers
Ability to shop 24 hours and 7 days a week.
Ability to easily select the most suitable items among many alternatives.
Ability to shop from any store without physically visiting them.
Ability to review the comments on products before purchasing.
Ability to purchase products at more competitive prices
Advantages to
Organizations
Ability to build online store at considerably lower cost.
Reduced paperwork
Faster and easier order processing.
Elimination of middleman; that is, ability to sell directly to end-users.
Ability to reach worldwide markets and customers.
Reduced inventory, employees and order processing costs
Advantages to
Society
People at the rural areas can access products and services which are not
available to them in their current location.
Government can deliver various kinds of public services such as
education, health care, social services in an improved way and at the
same time with reduced cost.
Less shopping travels on the roads and less air pollution
Benefits of e-commerce to customers, organizations and society are summarized in
Table 2. Despite all these positive factors about e-commerce mentioned above, many
consumers prefer to stay away from e-stores. There are several reasons behind why
many customers do not want to purchase products online. From customers’ point of
view, several risks are involved in every step of online shopping task which is given
in Figure 6. In registration stage privacy risk (Ranganathan & Ganapathy, 2002; Eri et
al., 2011; Huseynov and Yıldırım, 2016b), in product selection stage competence,

10
benevolence and product quality risks (Komiak & Benbasat, 2006), in payment stage
financial security risks (Belanger et al., 2002; Garbarino & Strahilevitz, 2004; Nazir
et al., 2012; Huseynov and Yıldırım, 2016b), in delivery stage transportation risks
(Moshref Javadi et al., 2012) and in after-sales stage maintenance or repair risks
(Ghasemaghaei et al., 2009; Nazir et al., 2012) are involved.
Figure 6 - Steps followed in an online shopping task
Firstly, in order to purchase a product from online stores users are required to enter
their personal information and get registered to the system. Customers sometimes are
reluctant to enter their personal information due to privacy risks involved in this stage.
Online customers are not sure about how the information they supply will be protected.
That is, they are not sure whether their personal information will be shared or sold to
unwanted people. A privacy issue in online shopping context is one of the important
factors analyzed by researchers (Ranganathan & Ganapathy, 2002; Eri et al., 2011).
Secondly, in product selection phase, customers are required to enter their product
preferences to the shopping system and then, system searches database and shows the
most relevant products to the customers. Due to competence and benevolence risks
involved in such systems customers are sometimes reluctant to shop over Internet. In
this stage, online consumers sometimes are not sure whether shopping system
performs effectively, cares about consumer and acts in the interest of them (Komiak
& Benbasat, 2006).
Thirdly, in a payment phase of online shopping task, customers get nervous about
security risks involved in this stage. In order to purchase any item or service over
Internet, customers need to provide their credit card information. With the fear that
their credit card information can be stolen by unwanted people, those customers prefer
physical stores to online stores (Belanger et al., 2002; Garbarino & Strahilevitz, 2004,
Nazir et al., 2012; Huseynov and Yıldırım, 2016b).
Fourthly, customers who do not prefer virtual stores are afraid of the fact that product
they purchase from Internet might not be delivered or might be damaged during the
transportation. Product delivery risks have a significant impact on consumer behavior
toward online shopping (Moshref Javadi et al., 2012).
Finally, after-sales services factors which include refunds, replacements, technical
assistance, repair and maintenance makes customers have doubts about online
shopping (Ghasemaghaei et al., 2009; Nazir et al., 2012). Due to lack of face-to-face
interaction, customers’ fears about after-sales issues increase.
Trustworthiness is also another important factor which makes customers anxious about
online store (Belanger et al., 2002). Everyone can launch an online store within a day
and start selling fake products of services to online customers who are unaware that
fact that they are deceived by Internet thieves. Doubt about the online store being
genuine keeps many customers away from the idea of e-commerce. Besides these two
important points mentioned above, there exist many other factors which makes
RegistrationProduct
SelectionMaking a Payment
Delivery of Products
After-Sales Service
11
consumers hesitated about online shopping. Ever since its emergence, behavioral
issues in B2C ecommerce have been researched extensively by both scholars and
practitioners due to huge potential economic impact of ecommerce. Many researches
were conducted to understand what factors influence consumers shopping intentions
toward online stores. The following subsection discusses previous studies on B2C e-
commerce in detail.
2.2 Previous studies on B2C E-Commerce
It is possible to come across B2C e-commerce articles in various journals in many
disciplines such as marketing, management, business, psychology, information
technology and etc. In order to retrieve all the relevant articles, extensive literature
review was carried out on the following databases (Huseynov and Yıldırım, 2016a):
Emerald,
IEEE Xplore,
Sage Journals Online,
Science Direct,
Springer Link
Wiley Online Library
The literature searching process involved the combination of the following keywords:
B2C ecommerce
Online shopping
Internet shopping
Internet retailing
Web shopping
Online consumer
Consumer behavior
Consumer shopping behavior
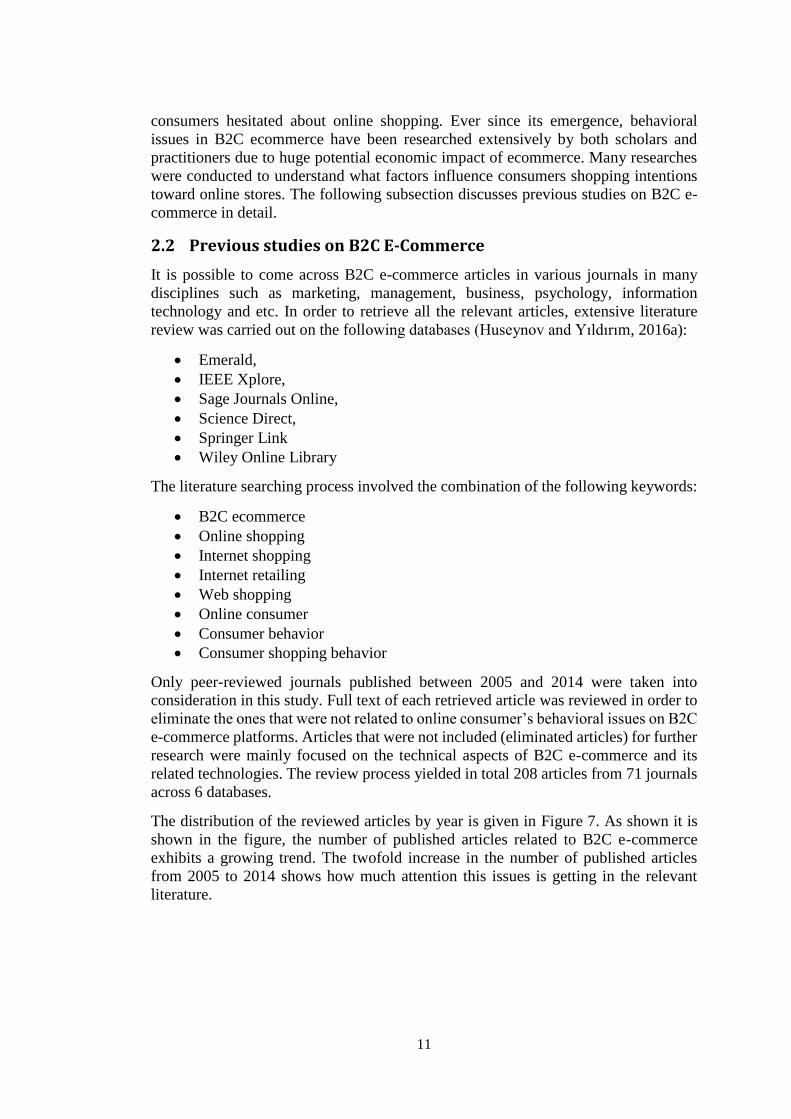
Only peer-reviewed journals published between 2005 and 2014 were taken into
consideration in this study. Full text of each retrieved article was reviewed in order to
eliminate the ones that were not related to online consumer’s behavioral issues on B2C
e-commerce platforms. Articles that were not included (eliminated articles) for further
research were mainly focused on the technical aspects of B2C e-commerce and its
related technologies. The review process yielded in total 208 articles from 71 journals
across 6 databases.
The distribution of the reviewed articles by year is given in Figure 7. As shown it is
shown in the figure, the number of published articles related to B2C e-commerce
exhibits a growing trend. The twofold increase in the number of published articles
from 2005 to 2014 shows how much attention this issues is getting in the relevant
literature.

12
Figure 7 - Distribution of the reviewed articles by year
The list of journals that published more than three articles related to B2C e-commerce
is given in Table 3. Full list of journals and number of articles published on the issue
can be found in Appendix A. Journal of Business Research, Electronic Commerce
Research and Applications, Computers in Human Behavior are the top three journals
that published approximately one fifth of the retrieved articles.
Table 3 - Journals with more than three articles on B2C e-commerce
Journal Name
# of
Articles
Cum.
Count
Cum.
%
Journal of Business Research 18 18 8,5
Electronic Commerce Research and Applications 15 33 15,6
Computers in Human Behavior 11 44 20,9
International Journal of Retail & Distribution Management 11 55 26,1
Journal of Retailing and Consumer Services 10 65 30,8
Electronic Commerce Research 8 73 34,6
Information & Management 8 81 38,4
Electronic Markets 7 88 41,7
International Journal of Information Management 7 95 45,0
Information Systems and e-Business Management 5 100 47,4
Internet Research 5 105 49,8
Journal of Fashion Marketing and Management 5 110 52,1
Decision Support Systems 4 114 54,0
Direct Marketing: An International Journal 4 118 55,9
International Journal of Consumer Studies 4 122 57,8
Journal of Consumer Behavior 4 126 59,7
Journal of Research in Interactive Marketing 4 130 61,6
Journal of Retailing 4 134 63,5
Journal of Services Marketing 4 138 65,4
Psychology and Marketing 4 142 67,3
Technovation 4 146 69,2
0
5
10
15
20
25
30
35
2005 2006 2007 2008 2009 2010 2011 2012 2013 2014
13
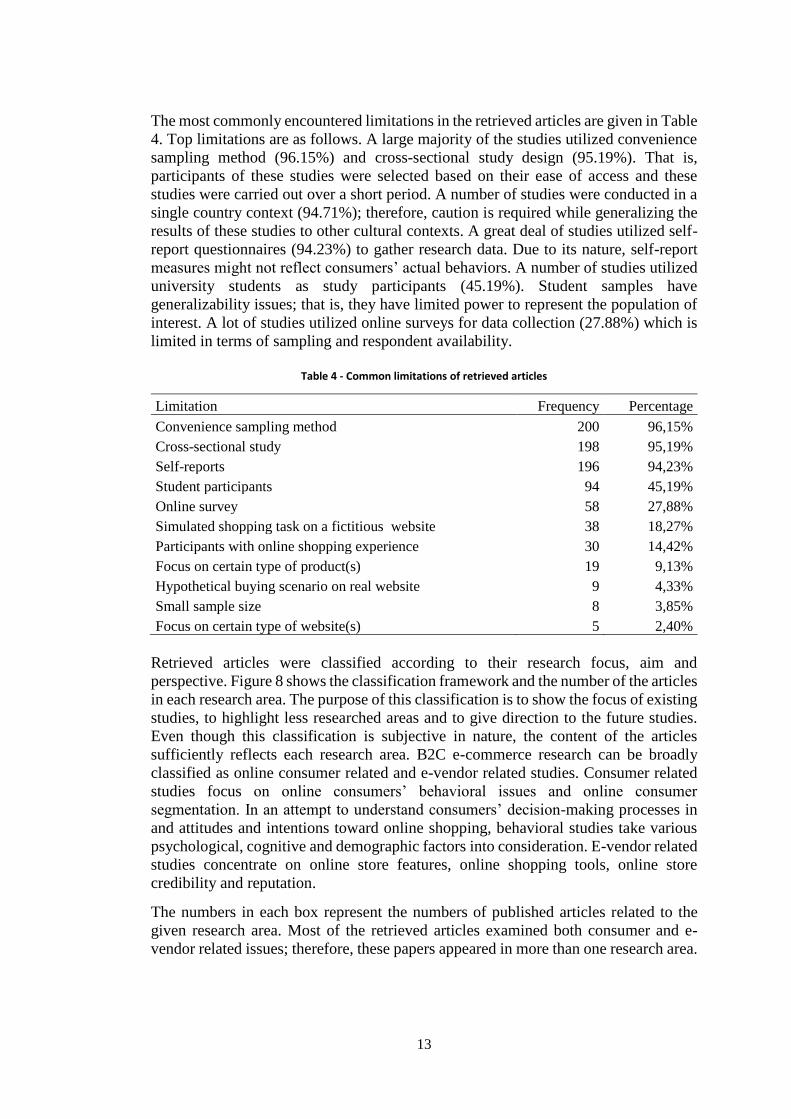
The most commonly encountered limitations in the retrieved articles are given in Table
4. Top limitations are as follows. A large majority of the studies utilized convenience
sampling method (96.15%) and cross-sectional study design (95.19%). That is,
participants of these studies were selected based on their ease of access and these
studies were carried out over a short period. A number of studies were conducted in a
single country context (94.71%); therefore, caution is required while generalizing the
results of these studies to other cultural contexts. A great deal of studies utilized self-
report questionnaires (94.23%) to gather research data. Due to its nature, self-report
measures might not reflect consumers’ actual behaviors. A number of studies utilized
university students as study participants (45.19%). Student samples have
generalizability issues; that is, they have limited power to represent the population of
interest. A lot of studies utilized online surveys for data collection (27.88%) which is
limited in terms of sampling and respondent availability.
Table 4 - Common limitations of retrieved articles
Limitation Frequency Percentage
Convenience sampling method 200 96,15%
Cross-sectional study 198 95,19%
Self-reports 196 94,23%
Student participants 94 45,19%
Online survey 58 27,88%
Simulated shopping task on a fictitious website 38 18,27%
Participants with online shopping experience 30 14,42%
Focus on certain type of product(s) 19 9,13%
Hypothetical buying scenario on real website 9 4,33%
Small sample size 8 3,85%
Focus on certain type of website(s) 5 2,40%
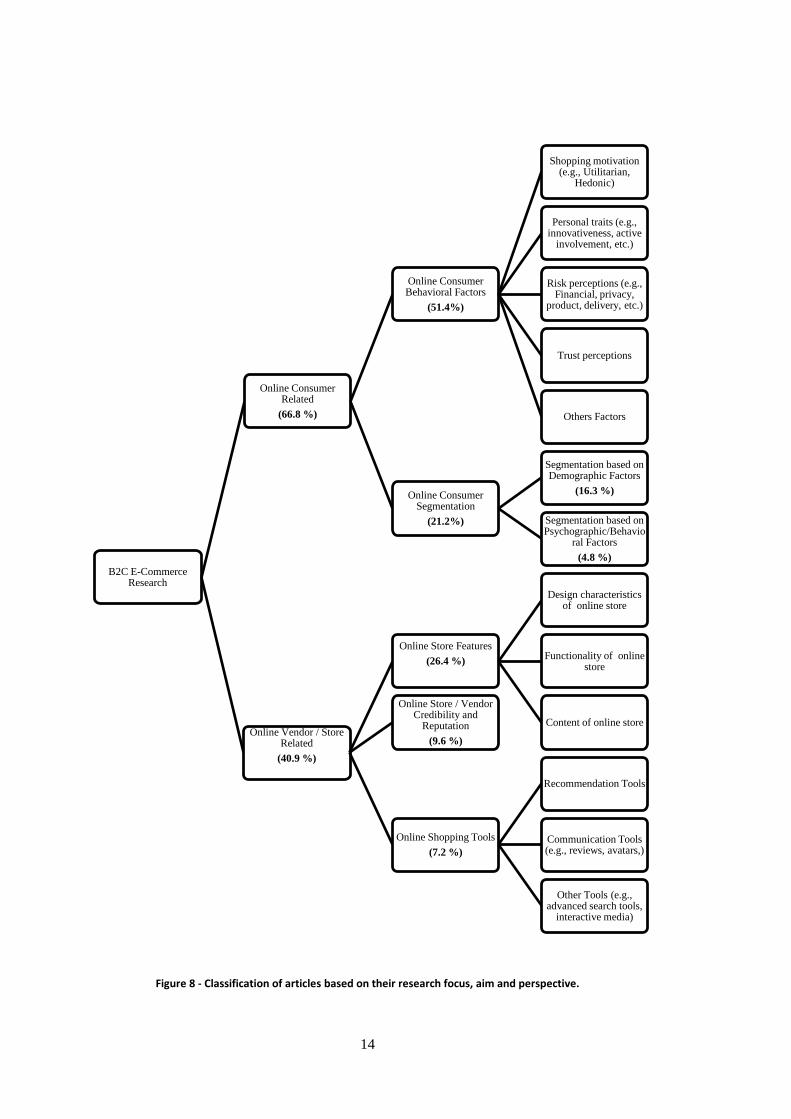
Retrieved articles were classified according to their research focus, aim and
perspective. Figure 8 shows the classification framework and the number of the articles
in each research area. The purpose of this classification is to show the focus of existing
studies, to highlight less researched areas and to give direction to the future studies.
Even though this classification is subjective in nature, the content of the articles
sufficiently reflects each research area. B2C e-commerce research can be broadly
classified as online consumer related and e-vendor related studies. Consumer related
studies focus on online consumers’ behavioral issues and online consumer
segmentation. In an attempt to understand consumers’ decision-making processes in
and attitudes and intentions toward online shopping, behavioral studies take various
psychological, cognitive and demographic factors into consideration. E-vendor related
studies concentrate on online store features, online shopping tools, online store
credibility and reputation.
The numbers in each box represent the numbers of published articles related to the
given research area. Most of the retrieved articles examined both consumer and e-
vendor related issues; therefore, these papers appeared in more than one research area.
14
Figure 8 - Classification of articles based on their research focus, aim and perspective.
B2C E-Commerce Research
Online Consumer Related
(66.8 %)
Online Consumer Behavioral Factors
(51.4%)
Shopping motivation (e.g., Utilitarian,
Hedonic)
Personal traits (e.g., innovativeness, active
involvement, etc.)
Risk perceptions (e.g., Financial, privacy,
product, delivery, etc.)
Trust perceptions
Others Factors
Online Consumer Segmentation
(21.2%)
Segmentation based on Demographic Factors
(16.3 %)
Segmentation based on Psychographic/Behavio
ral Factors
(4.8 %)
Online Vendor / Store Related
(40.9 %)
Online Store Features
(26.4 %)
Design characteristics of online store
Functionality of online store
Content of online store
Online Store / Vendor Credibility and
Reputation
(9.6 %)
Online Shopping Tools
(7.2 %)
Recommendation Tools
Communication Tools (e.g., reviews, avatars,)
Other Tools (e.g., advanced search tools,
interactive media)
15
2.2.1 Studies Focusing on Online Consumer Behavioral Issues Online consumer related studies focus on consumers’ behavioral and consumer
segmentation issues. By taking into consideration various psychological, cognitive and
demographic factors, behavioral studies attempts to understand consumers’ decision
making process in B2C e-commerce platforms. On the other hand, segmentation
studies attempt to classify online consumers based on their demographic,
psychographic and behavioral characteristics in order to help online retailers to tailor
their products and services according to each segments needs and requirements.
Factors analyzed in the scope of behavioral studies includes consumers’ Internet usage
and previous online shopping experiences, shopping motivation, personal traits, risk
perceptions, benefit perceptions, trust perception, subjective norms, perceived
behavioral control and etc. In the conducted studies, researchers analyzed how these
factors influence consumers’ decision making process in online shopping and attitudes
and behavioral intentions toward online shopping.
Some findings from the selected articles are as follows. Two types of online consumer
shopping motivation, utilitarian and hedonic, were examined quite extensively in the
relevant literature (Overby and Lee 2006; Close and Kinney; 2010; Bridges and
Florsheim, 2008; To et al., 2007; Scarpi et al., 2014; Shun and Yunjie, 2006; Lopez
and Ruiz, 2011; Kim et al., 2012; Lee et al., 2006; Davis et al., 2014; Chiu et al., 2014).
While, utilitarian motivation is defined as goal oriented hedonic motivation refers to
consumers’ shopping behaviors that focus on enjoyment, satisfaction, happiness and
sensuality. These two motivational factors were found to be positively associated with
behavioral intention to shop online (Kim et al., 2012; Davis et al., 2014; Chiu et al.,
2014) and spread positive word-of-mouth information on the web about online
retailers (Scarpi et al., 2014).
The relationship between online shopping behavior and personal traits such as
innovativeness, active involvement, agreeableness, conservation, self-enhancement,
self-confidence, openness to experience, individualism, collectivism and risk aversion
was assessed by several studies (Blake et al., 2005; Riquelme and Roman, 2014;
Bosnjak et al., 2007; Xia, 2010; Bigné-Alcaniz et al., 2008; Yoon, 2009; Crespo and
Bosque, 2008; Lu et al., 2013; Zhou et al., 2014; Hsu et al., 2012; Wu et al., 2011).
Active involvement, agreeableness and openness to experience were found to have a
significant influence on consumers’ willingness to shop online (Bosnjak et al., 2007).
Innovativeness in new technology was also found to affect attitude and intention
toward online shopping positively (Blake et al., 2005; Bigné-Alcaniz et al., 2008;
Crespo and Bosque, 2008).
The relationship between consumer risk perceptions and shopping behavior were
examined by several studies in the literature. Privacy risk, security risk, financial risk,
product delivery risk, product performance risk, psychological risk, social risk and
refund risk are among the risk factors that found to negatively influence shopping
behavior of online consumers (Huseynov and Yıldırım, 2016b; Chiu et al., 2014;
Broekhuizen and Huizingh, 2009; Wang et al., 2006; Hong and Cha, 2013; Lian and
Lin, 2008; Lian and Yen, 2013; Crespo and Bosque, 2010; Liao and Keng, 2013;
Soopramanien and Robertson, 2007; Teo and Yu, 2005; Liu et al., 2013; Zhang and
Liu, 2011; Korgaonkar and Karson, 2007; Keating et al., 2009; Buttner and Goritz,
2008; Forsythe et al., 2006; Soopramanien, 2011; Punj, 2012; Huang et al., 2006; Stern
et al., 2008; Wu et al., 2010; Lee et al., 2010; Yu et al., 2012).

16
When it comes to the segmentation studies grouping and assessing the behavior of
online consumers according to their demographic characteristics is one the most
commonly followed strategies in the literature. Age, gender, marital status, income
and occupation are some of the characteristics upon which segmentation process is
carried out (Chen et al., 2014; Yoon, 2009; Liebermann and Stashevsky, 2009; Crespo
and Bosque, 2010; Gong et al., 2013; Kim et al., 2012; Davis et al., 2014; Roman,
2010; Clemes et al., 2014). Bhatnagar (2007) and Gong et al. (2013) found that income
level of the consumer plays a significant role in the frequency of online shopping.
While Clemes et al. (2014) showed that occupation has a positive impact on online
shopping adoption, Crespo and Bosque (2010) did not find any significant relationship
between them. While the study conducted in China by Clemes et al. (2014) indicated
that single consumers are more likely to shop online, the study conducted in Israel by
Liebermann and Stashevsky (2009) found no significant relationship between marital
status and online shopping rate.
Segmentation according to psychographic and behavioral characteristics considers
factors such as online consumers’ lifestyle, attitudes, expectations, shopping activities,
shopping motivation and shopping orientation while assigning consumers to groups
consisting of members who have common needs, expectations and interests.
Conducted studies showed the existence of different types of online consumer
segments based on consumer characteristics (Lu et al., 2013), shopping motivation
(Hill et al., 2013), shopping orientation (Gehrt et al., 2012), consumers’ underlying
cognitive style and involvement (Wang et al., 2006), Internet usage pattern
(Aljukhadar and Senecal, 2011), computer expertise (Chen et al., 2010) and decision
making style (Rezaei, 2015).
2.2.2 Studies Focusing on Online Store/Vendor Related Factors E-vendor related studies mainly concentrate on the relationship between consumer
behavioral issues and online store features (i.e., design, functionality, and content),
online shopping tools, online store credibility and reputation.
Studies that focus on online store design factors evaluate online stores’ general design
and visual aspects (Chung and Shin, 2010; Liao et al., 2006; Bartikowski and Singh,
2014; Shin et al., 2013; Ethier et al., 2006; Koo, 2006), ambience and atmosphere
(Mummalaneni, 2005; Ding and Lin, 2012; Wu et al., 2014) and customer interface
features (Chang and Chen, 2008; Fasolo et al., 2006; Mazursky and Vinitzky, 2005).
In several studies, it was found that the better consumers perceive online store design
to be, the more they get enjoyment and satisfaction from their online transactions
(Chung and Shin, 2010; Floh and Madlberger, 2013; Liu et al. 2008). Liao et al. (2006)
showed that the appearance of an online store positively affects the consumers’
perceptions about online stores’ usefulness.
Studies that focus on online store functionality evaluate online stores from the
perspective of convenience (Chang an Chen, 2008; Chung and Shin, 2010; Clemes et
al., 2014; Shin et al., 2013), customization (Tsai and Huang, 2007; Pechpeyrou, 2009;
Chellappa and Sin, 2005), technical adequacy (Liao et al., 2006; Shin et al., 2013; Ou
and Sia, 2010), usability (Chen and Macredie, 2005; Baie et al., 2008; Zviran et al.,
2006), interactivity (Lee et al., 2006; Chang and Chen, 2008; Wu et al., 2010),
fulfillment (Liao et al., 2010; Lee et al., 2009), efficiency (Lee et al., 2009), complexity
(Wang et al., 2014), navigation (Floh and Madlberger, 2013) and transaction speed
(Liu et al., 2008; Rajamma et al., 2009). It was found that when consumers find the
17
online transaction completion process as inconvenient, they are more likely to abandon
the online shopping cart (Rajamma et al., 2009). Online stores that exhibit a high
degree of convenience in terms of transaction and search processing positively
influence consumers’ online shopping intention and loyalty (Chang and Chen, 2008;
Jiang et al., 2013). Customization was found to positively influence online consumers’
satisfaction, loyalty and behavioral intentions toward online shopping (Chang and
Chen, 2008; Tsai and Huang, 2007).
Studies that focus on online store content assess online stores in terms of general
content quality (Chen and Cheng, 2013; Chen et al., 2014; Liao et al., 2006;
Baritkowski and Singh, 2014; Gregg and Walczak, 2010), content quantity (Gao et al.,
2012; Chen et al., 2009; Parra and Ruiz, 2009), content presentation (Zo and
Ramamurthy, 2009; Yoo and Kim, 2012; Huang and Kuo, 2011), informativeness
(Chung and Shin, 2010; Shin et al., 2013) and product variety (Clemes et al., 2014;
Liu et al., 2008). All of these factors were found to influence consumers’ satisfaction,
loyalty and behavioral intentions toward online shopping.
The influence of online store credibility and reputation on online consumer attitudes
and behavioral intentions toward online shopping were assessed by several studies
(Riquelme and Roman, 2014; Pan and Zinkhan, 2006; Smith and Shao, 2007; Xie et
al., 2006; Kinney and Close, 2010). It was found that if consumers do not perceive
online stores credibly due to privacy and security issues, they are more likely to switch
to physical stores (Kinney and Close, 2010). Credibility of the online stores was
assessed from various aspects such as existence of sound privacy policies (Riquelme
and Roman, 2014; Pan and Zinkhan, 2006; Smith and Shao, 2007; Xie et al., 2006;
Kinney and Close, 2010; Cheung and Lee, 2006; Wirtz et al., 2007), effective security
measures (Sahney et al., 2013; Riquelme and Roman, 2014; Jiang et al, 2008; Kinney
and Close, 2010; Cheung and Lee, 2006; Sha, 2009; Noort et al., 2008), reasonable
delivery services (Lantz and Hjort, 2013) and fair return policies (Sahney et al., 2013;
Noort et al., 2008; Lantz and Hjort, 2013; Pei et al., 2014). Findings of the studies
showed that privacy and security measures within online stores positively influence
perceived trustworthiness of online stores (Riquelme and Roman, 2014; Pan and
Zinkhan, 2006). If consumers do not perceive online stores credibly due to privacy and
security issues, they are more likely to buy online cart contents from physical stores
(Kinney and Close, 2010). It was also found that free delivery and return policies
increase the number of order made over online stores (Lantz and Hjort, 2013). Kim
and Lennon (2013) showed that when online sellers’ reputation is high, consumers’
hold more positive emotions and less perceived risk toward online sellers.
In several studies the influence of various online shopping tools on consumer decision
making process were assessed. These tools include recommender agents (Yoon et al.,
2013; Hostler et al., 2012; Lee and Kwon, 2008; Hostler et al., 2011; Huseynov et al.,
2016), avatars (Keeling et al., 2010), image interactive technologies (Lee et al., 2010,
Kim et al., 2007; Shim and Lee, 2011), social presence tools (Ogonowski et al., 2014;
Chattaraman et al., 2012), search tools (Chen et al., 2009; Parra and Ruiz, 2009) and
communication tools such as online consumer reviews and ratings (Bae and Lee,
2011).

18

19
CHAPTER III
RESEARCH MODEL DEVELOPMENT AND HYPOTHESES FORMULATION
3.1 Conceptual Models
Research models of the study are given in Figure 9 and 10. Figure 9 visually depicts
potential online consumers segments which are going to be extracted in this study.
Figure 10 presents online consumer behavior evaluation framework which aims to
predict consumer behavior in an online environment by utilizing Technology
Acceptance Model (TAM) (Davis, 1989) as a robust theoretical base and incorporating
previous empirical findings from the relevant literature. This behavior evaluation
framework will be tested for each determined consumer segment separately. Testing
the developed behavior evaluation framework on each determined consumer segment
will further help to understand the differences between various consumer segments.
There are eight constructs in the model. While perceived usefulness of online
shopping, attitude toward online shopping and behavioral intention to shop online are
dependent variables, perceived enjoyment, perceived ease of use, perceived
compatibility, perceived information security and perceived social pressure are
independent variables. This model will be tested separately for each potential segment
that will be determined as a result of psychographic segmentation analysis. Testing the
developed model separately on each segment will further help to understand the
differences between various segments in terms of their perceptions about online
shopping. All independent variables but perceived information security is
hypothesized to directly and positively influence consumers behavioral intention to
shop over online stores. All independent variables are also hypothesized to indirectly
(i.e., through attitude toward online shopping) and positively influence consumers’
behavioral intentions.

20
Figure 9 - Potential online consumer segments
Figure 10 - Online consumer behavior evaluation framework
SEGMENT
B
SEGMENT
A
SEGMENT
C
SEGMENT
D
20

21
3.2 Online Consumer Typologies
There exists a steady growth in the number of Internet users globally (Internet World
Stats, 2015). As the number of Internet users increase worldwide, the size of online
consumer audience also increases. This growing trend requires online consumers to be
segmented very carefully for marketing efforts to be successful. If customer segments
can be clearly identified, then products, services and marketing efforts can be
customized so that they appeal more specifically to each segment’s needs, expectations
and motivations. There are several ways to segment the online consumers.
Segmentation according to demographic, behavioral and psychographic characteristics
is the most common type of segmentation strategies. Demographic segmentation aims
to group individuals based on their characteristics like age, gender, marital status and
etc. Behavioral segmentation groups individuals based on the behavioral patterns
during online shopping. Behaviors such as decision making, usage, consumption and
spending can be considered while carrying out segmentation according to the
behavioral characteristics. Psychographic segmentation groups individuals according
to their lifestyles. This kind of grouping strategy takes into account activities, attitudes,
expectations and perceptions of individuals during segmentation process.
In the relevant literature, researchers carried out various types of market segmentation
analysis based on various factors. The prominent ones among these factors are
psychographic factors, cognitive factors, demographic factors, shopping motivation,
shopping orientation, decision-making style, computer expertise, Internet usage
patterns, shopping activities and etc. There also exists a study that carried out market
segmentation analysis based on real online shopping activities of consumers that were
extracted from their online store transaction logs (Liu et al. 2015). Results of these
studies showed that a broad online consumer audience is not a single market segment
(Swinyard and Smith, 2003; Wang et al., 2006, Brengman et al., 2005; Jayawardhena
et al., 2007; Ganesh et al., 2010; Liu et al. 2015). Rather, it is a collection of different
consumer segments whose members have different behavioral characteristics in terms
of online shopping and respond differently to the marketing efforts.
In their study, Ganesh et al. (2010) found six and seven different online consumer
segment by utilizing e-store attribute and shopping motivation measures respectively.
Study of Jayawardhena et al. (2007) showed that online consumers can be segmented
into five distinct groups based on their online purchase orientation. In another study,
by using 38 “Internet Shoppers Lifestyle” scale Swinyard and Smith (2003) showed
that there exist four shopper and four non-shopper segments among U.S.A. online
consumers. Study of Brengman et al. (2005) cross-culturally validated the “Internet
Shoppers Lifestyle” scale of Swinyard and Smith (2003) by conducting survey in both
U.S.A. and Belgium. They derived four online shopper segment and four online non-
shopper segments in both countries.
Based on the discussion mentioned above, following hypothesis is put forward:
Hypothesis 1: A broad online consumer audience is not a single market
segment. It is comprised of different consumer segments whose members have
different perceptions about online shopping.

22
3.3 Behavior Evaluation Framework and Stated Hypotheses
3.3.1.1 Perceived Ease of Use (PEOU) and Perceived Usefulness (PU) According to the Technology Acceptance Model (TAM) (Davis, 1989) which is one
of the most commonly used theory in information systems literature, there exist several
factors that influence users’ decision about whether to use a new technology or not.
The most prominent among these factors are the perceived ease of use (PEOU) and
perceived usefulness (PU). While perceived usefulness (PU) refers to the extent to
which users perceive that using a particular technology would improve their job
performance, perceived ease of use (PEOU) refers to the extent to which users believe
that using a particular technology would be effortless (Davis, 1989). TAM states that
perceived usefulness and perceived ease of use are the fundamental determinants of
attitude toward using a new information technology. That is, TAM proposes that when
users perceive a new information technology as useful and easy to use then they
develop positive attitude toward using this technology. Furthermore, TAM proposes
the existence of direct influence of perceived ease of use (PEOU) on perceived
usefulness (PU). That is, it states that when users perceive an information technology
as easy to use, they find it to be useful as well. These proposals of TAM got a
reasonable support in the relevant literature. A number of studies conducted in
different cultural contexts found that perceived ease of use (PEOU) (Bigné-Alcaniz et
al., 2008) and perceived usefulness (PU) (Bigné-Alcaniz et al., 2008; Ha and Stoel,
2009; Kim, 2012; Chen and Teng, 2013) of online shopping systems positively and
statistically significantly affects users’ attitudes toward such systems. Numerous
studies also showed that perceived ease of use (PEOU) of online shopping systems
positively and statistically significantly affects perceived usefulness (PU) of such
systems (Shang et al., 2005; Bigné-Alcaniz et al., 2008; Ha and Stoel, 2009; Yoon,
2009; Smith et al,, 2013).
Another claim of TAM is that there exist a direct relationship between perceived
usefulness (PU) of particular technology and users’ behavioral intention (INT) toward
using that technology. More specifically, it states that when users perceive a certain
technology as useful then they develop a positive intention toward using such
technology. This claim of TAM was also verified by a great number of studies
conducted in different cultural contexts (Liao et al., 2006; Bigné-Alcaniz et al., 2008;
Ha and Stoel, 2009; Yoon, 2009; Chen and Teng, 2013; Gong et al., 2013; Smith et
al., 2013).
Studies conducted in U.S. and China also showed direct and positive relationship
between PEOU and behavioral intention (INT) toward using online shopping systems
(Yoon, 2009; Smith et al., 2013). That is, users perceptions about online shopping
system’s ease of use led them to develop a positive intention toward using it.
Following the Technology Acceptance Model (Davis, 1989) and empirical
investigations from the existing literature, the following hypotheses are put forward:
Hypothesis 2: Perceived ease of use is positively related to perceived usefulness
of online shopping (H2a), attitude toward online shopping (H2b) and behavioral
intention to shop online (H2c).
Hypothesis 3: Perceived usefulness is positively related to attitude toward
online shopping (H3a) and behavioral intention to shop online (H3b).

23
3.3.1.2 Perceived Enjoyment (PENJ) In an online shopping context, there exist various motivational factors that influence
consumers attitudes and behavioral intentions toward shopping at online stores.
Prominent among these motivational factors are consumers hedonic and utilitarian
online shopping motivations. Hedonic shopping motivations refers to enjoyment,
satisfaction, happiness and similar types of emotions that consumer pursue during
online shopping activities (To et al., 2007). That is, consumers with hedonic
motivation enjoy and derive pleasure from their online shopping acts. On the other
hand, utilitarian shopping motivation is defined as mission critical, need-based and
goal oriented. More specifically, from online consumer point of view, the utilitarian
benefits of shopping over online stores can be stated as follows: convenience (i.e.
saved time and effort), monetary savings, breadth and depth of offered products and
the quality of information obtained about products (Chiu et al., 2014). Both hedonic
and utilitarian motivational factors were found to play an important role in influencing
consumers’ online shopping intentions (Kim et al., 2012; Davis et al., 2014; Chiu et
al., 2014). In their study, Chiu et al. (2014) has found that hedonic and utilitarian
motivational factors positively and statistically significantly influence consumer
intention to repeat their online shopping activities. Cha (2011) also found positive and
significant relationship between perceived enjoyment and consumers’ intention to
shop online.
Perceived enjoyment not only influences consumers’ intention to shop online, but also
their perception about its usefulness. Ha and Stoel (2009) has found that when
consumers enjoy shopping at online stores they develop positive perceptions about its
usefulness. Ha and Stoel (2009) also found significant relationship between perceived
enjoyment and consumers attitude in online shopping contexts. More specifically, they
found that when consumers get enjoyment from online shopping activities then they
develop positive attitude toward using this technology
Based on the discussion mentioned above, following hypotheses are put forward:
Hypothesis 4: Perceived enjoyment is positively related to perceived usefulness
of online shopping (H4a), attitude toward online shopping (H4b) and behavioral
intention to shop online (H4c).
3.3.1.3 Perceived Compatibility (PCP) In e-commerce context compatibility is the extent to which the new technology (e.g.,
online shopping platforms) is perceived as consistent with the potential adopters’
lifestyle, existing values, previous experiences, expectations and needs (Rogers,
1995). Perceived compatibility concept can be better discussed within the scope of
Innovation Diffusion Theory (IDT) which is one of the most extensively used theory
in information systems contexts. According to IDT proposed by Rogers (1995),
compatibility is one of the main factors that affect the rate of adoption of an innovation
(i.e., new technology) by potential users. Other factors that influence the adoption of
innovation are relative advantage, complexity, trialability and observability. When
potential users perceive the new technology as more compatible in terms of the factors
mentioned above, they are more likely to adopt this particular technology in their daily
life. That is, the greater the perceived compatibility of the particular technology is, the
faster the adoption of this technology will be.
Study conducted by Vijayasarathy (2004) found positive and statistically significant
relationship between consumers’ attitudes toward online shopping and their

24
perceptions about its compatibility with their existing values and lifestyle. This study
showed that consumers whose shopping habits and preferences are better met by other
alternatives to physical stores are more inclined to adopt online shopping methods.
Other studies conducted in online shopping context (Eri et al., 2011) and online
banking service (Al-Ajam and Nor, 2013) also found perceived compatibility as a
significant predictor of attitude toward a technology in question.
In various information systems contexts, there was found positive association between
perceived compatibility of new technology and users’ perceptions about its usefulness
(Gumussoy et al., 2007; Wu et al., 2007). In their study Wu et al. (2007) has also found
that users’ behavioral intention toward using a new technology is positively related
with their perceptions about the given technology’s being compatible with their
previous experiences, existing values and needs.
Following the Innovation Diffusion Theory (Rogers, 1995) and empirical
investigations from the relevant literature, the following hypotheses are put forward:
Hypothesis 5: Perceived compatibility is positively related to perceived
usefulness of online shopping (H5a), attitude toward online shopping (H5b) and
behavioral intention to shop online (H5c).
3.3.1.4 Perceived Information Security (PIS) Even though privacy and security variables are distinct concepts, from consumer,
legislative and companies point of view, these two concepts are assumed to be a
dimensions of a single construct which is known as “Perceived Security in the
Handling of Private Data” (Flavian and Guinaliu, 2006). Privacy concern is one of the
main reasons that keep many consumers away from the idea of Internet shopping
(George, 2004). During online shopping process, customers are required to provide
their private information in order to complete their purchasing transactions which deter
many customers from online purchasing due to privacy concerns (Lian & Lin, 2008).
Those privacy concerns can be categorized as improper access, unauthorized
secondary use, errors and data collection (Smith et al., 1996). Privacy concerns of
consumers can show variation based on individual context, demographics, social
context and culture (Hsu, 2006). Study conducted by Lian and Lin (2008) showed that
customer who are more concerned about personal privacy issues are less likely to
engage in online shopping. In his study, George (2002) showed that consumers forms
negative attitudes toward Internet shopping when they believe that they should control
and protect their own personal information. However, another study of George (2004)
did not provide any support for the claim that consumers’ concern about the fact that
unauthorized use of sharing personal information leads to negative attitudes toward
online purchasing. Study of Eri et al. (2011) also did not find any relationship between
consumers’ attitude toward shopping over the Internet and their beliefs on privacy
provided by engaging in Internet shopping. Literature showed that the relationship
between privacy concerns of consumers and consumers’ attitude toward Internet
shopping is blurry and needs further investigation.
A considerable attention has been devoted to the transaction security issues over the
Internet both in the form of safe and accurate transfer of credit card details and in the
form of transaction costs and risks (Liao & Cheung, 2001). When compared with
traditional trading, in virtual trading environment there exist higher anonymity and
there also exist lack of face-to-face interaction between buyers and sellers which
creates security issues (Lian & Lin, 2008). Study conducted by Huseynov and Yıldırım
(2016b) in Turkey showed that 33.3 percent of survey participants had concerns that
25
their credit card details and 52.3 percent worried that their personal information can
be abused on online platforms. Studies conducted in USA and Singapore also showed
that privacy and security issues are among major concerns of online consumers (Teo,
2002; Udo, 2011). In their study, Liao and Cheung (2001) showed that transaction
security significantly affect the willingness of consumers to shop over the Internet.
Several studies also showed that consumers form positive attitude toward online
shopping when they believe that web is secure for conducting transactions (Lian &
Lin, 2008; Eri et al., 2011).
Based on the discussions mentioned above, the following hypothesis is put forward:
Hypothesis 6: Perceived information security is positively related to attitude
toward online shopping.
3.3.1.5 Perceived Social Pressure (PSP) According to Theory of Planned Behavior (TPB) (Azjen, 1985, 1991), perceived social
pressure (i.e., subjective norms) is one of the main factors that have an influence on
individual’s intention to engage in any given act. Perceived social pressure indicates
in what way the significant referents (e.g., relatives, friends, media) influence the
individual`s particular behavior. Determinants of perceived social pressure can be
categorized as interpersonal influence and external influence (Bhattacherjee, 2000).
Interpersonal influence emerges from word-of-mouth influence by friends, colleagues,
superiors and other prior adopters, while external influence emerges from mass media
reports, expert reviews and opinions, and other non-personal information considered
by individuals while engaging in a behavior. Interpersonal and external factors were
found to be significant predictors of subjective norms in B2C e-commerce
environment (Bhattacherjee, 2000; Lin, 2007).
In several studies, perceived social pressure was found to play a significant role in the
formation of intention to carry out transaction in online stores (Bhattacherjee, 2000;
Lin, 2007; Al-Jabari et al., 2012; Hansen, 2008; Laohapensang, 2009; Lim et al.,
2011). In their study, Crespo and Bosque (2008) also found that perceived social
pressure exerts a positive impact on consumer behavioral intention to shop online.
Study of Kim et al. (2009) showed that perceived social pressure not only significantly
and positively influences behavioral intention to use online stores but also attitude
toward carrying out transactions on such platforms.
Following the Theory of Planned Behavior (Ajzen, 1985, 1991) and empirical
investigations from the existing literature, the following hypotheses are put forward:
Hypothesis 7: Perceived social pressure to engage in online shopping is
positively related to attitude toward online shopping (H7a) and behavioral
intention to shop online (H7b).
3.3.1.6 Attitude toward Online Shopping (ATT) According to the TAM (Davis, 1989) and TPB (Ajzen, 1985, 1991), behavioral
intention is about individuals’ readiness to engage in a given behavior. Behavioral
intention plays an important role in influencing individuals’ actual behavior. The
stronger intention individuals have, the more likely behavior in question will be
performed by them.
TAM states that intention of individuals is a major determinant of their actual behavior
and intention itself is a function of individuals’ attitude toward a given behavior. TPB
also proposes that existence of a direct relationship between attitude toward behavior
and intention to engage in a particular behavior. In the literature, a lot of studies applied

26
TAM and TPB in various information systems contexts and confirmed what these two
models suggests about the relationship between attitude toward particular behavior and
behavioral intention to engage in that behavior. Although study of Al-Jabari et al.
(2012) found no direct significant influence of attitude on shopping intention, many
other studies (Bhattacherjee, 2000; Lee et al., 2006; Lin, 2007; Hansen, 2008; Bigné-
Alcaniz et al., 2008; Ha and Stoel, 2009; Eri et al., 2011; Kim, 2012; Lim et al., 2011)
found that individuals’ favorable attitudes toward online shopping positively and
statistically significantly influence their behavioral intention toward online shopping.
Following the propositions of Technology Acceptance Model (TAM), Theory of
Planned Behavior (TPB) and empirical investigations from the relevant literature the
following hypothesis is put forward:
H8: Attitude toward online shopping is positively related to behavioral intention
to shop online.
27
CHAPTER IV
RESEARCH METHODOLOGY
4.1 Research Design Main objectives of this study are to determine different segments that might exist in
online consumer audience and later, to investigate the relationship between variables
that might influence consumer attitudes and intentions toward using business-to-
consumer (B2C) online shopping platforms for each determined consumer segment.
In order to achieve these objectives, this study employed quantitative research
methods, where data were collected through paper-based and online self-administered
questionnaires. In addition to self-administered questionnaires, this study also made
use of real e-commerce transaction data supplied by one of the famous B2C online
shopping platforms in Turkey, Markafoni.com.
Correlational research design is considered to be an appropriate method of
investigation for this research. Correlation research which is also called association
research aims to investigate the potential relationships among study variables
(Fraenkel et al., 2012, p.331). Correlation research will enable to understand various
online consumer behavior patterns by identifying relationships among dependent and
independent study variables. Correlation research not only helps to explain important
human behaviors but also help to predict likely outcomes. That is, it identifies
relationships among independent and dependent variables and it also has a power to
make prediction if sufficient magnitude exists between those variables (Fraenkel et al.,
2012, p.332). In this study, there are several independent and dependent variables
between which possible relationships were investigated. Independent variables of this
study can be classified as perceived ease of use, perceived enjoyment, perceived
information security, perceived social pressure and perceived compatibility.
Dependent variables of the study are perceived usefulness, attitude toward online
shopping and behavioral intention to shop online.
Research phases of the study are given in Figure 11. This study started with a research
idea. Based on this research idea, the relevant literature was reviewed extensively.
Research questions were generated after reviewing the relevant literature and
conceptual model of the study were developed based on the research questions. In
order to test conceptual model, necessary research was designed and required data
were collected. Later, collected data were analyzed in order to find answers to research
questions. Finally, results of the study were interpreted and conclusions were derived.

28
Figure 11 - Research Phases
4.2 Procedures In this study, three different types of data set were utilized. The first and the second
data sets were based on self-administered questionnaires in the form of Likert scale.
Participants of the study were required to fill two different types of questionnaires.
Psychographic segmentation analysis and related hypotheses testing were carried by
using these two types of data sets. Before collecting the first and the second data sets,
necessary documents (e.g. informed consent forms, survey instruments, description of
study and etc.) were submitted to METU ethics center in order to obtain required
permissions to conduct study. After obtaining the necessary permissions from ethics
center (Appendix B), surveys were distributed within several universities in Ankara.
Surveys were distributed in two formats: printed hard copy and electronic. Printed hard
copies were distributed within faculties. Electronic surveys were prepared by using
METU online survey service and sent to student mail groups after obtaining necessary
permissions from related authorities. Before filling the survey, the participants of the
research were informed about the purpose of the study, what to be done within the
scope of the study, potential benefits and risks involved and confidentiality of provided
responses.
The third type of data set used in this study was based on real e-commerce transaction
data. Behavioral segmentation analysis was carried out by using this real e-commerce
transaction data set. This data set includes various types of information carried out by
customers on Markafoni.com which is one of the most extensively used online
shopping platform in Turkey. This data set was supplied by Markafoni.com after
signing the non-disclosure agreement with the company. According to this agreement,
all the data provided by Markafoni.com shall be used only in the thesis study in
question, shall be kept confidential and shall not be shared with any other third parties.
In addition, in accordance with this agreement, all the data provided by Markafoni.com
shall be deleted after the study in question is finalized.
Research Idea Literature ReviewGeneration of
Research QuestionsConceptual Model
Development
Research DesignPilot Study
(Data Collection)
Pilot Study
(Data Analysis)
Main Study
(Data Collection)
Behavioral Segmentation
Analysis
Interpretation of Behavioral
Segmentation Results
Psychographic Segmentation
Analysis
Interpretation of Psychographic
Segmentation Results
Multi-group Data Analysis
Interpretation of the Group Results
Interpretation of the Entire Analysis
Conclusion and Future Research
Suggestions
29
4.3 Study Sample In the psychographic segmentation process, non-probability convenience sampling
technique was utilized in order to select respondents of the study. All potential
respondents of the study were chosen based on their ease of access. Participants of the
psychographic segmentation process were limited to university students. Data
collection was carried out at three universities located in Ankara, Middle East
Technical University (METU), Bilkent University and Çankaya University.
On the other hand, data which was used in behavioral segmentation process was based
on real online shopping transactions conducted on Markafoni.com. This data set was
composed of various types of online shopping transaction information for randomly
selected customers.
4.4 Survey Instruments This study makes use of quantitative research techniques; therefore, Likert type
surveys were administered in order to collect the necessary data for the research.
Participants of the study were required to fill two kinds of surveys. One of the surveys
was used in psychographic segmentation process. Measurement scale of segmentation
survey items changed between 1 (Strongly Disagree) and 5 (Strongly Agree). Survey
items for psychographic segmentation analysis were based on “Internet Shopper
Lifestyle Scale” which was proposed by Swinyard and Smith (2003). This is a
powerful scale which was validated cross-culturally (i.e., United States, Europe, and
China) (Brengman et al., 2005, Ye et al., 2011). In addition to “Internet Shopper
Lifestyle Scale”, online activities of respondents were used as an input in the
segmentation process. That is, respondents were asked how often they carry out
activities related to e-commerce (i.e., shopping, online banking), entertainment,
information gathering and etc. The second survey was used for testing the developed
theoretical model on different consumer segments. Measurement scale of this survey
changed between 1 (Strongly Disagree) to 7 (Strongly Agree).
Surveys items were prepared by considering the previously validated items from the
relevant literature. English and Turkish version of the questionnaire items were
prepared by paying careful attention in order not to cause any semantic losses which
can change the actual meaning of the measurement item. Appendix C, D and E provide
both English and Turkish version of all questionnaire items and their sources.
Instruments of the study were tested and validated by conducting a pilot study. Pilot
study enabled to get necessary feedback from participants related questionnaire items;
that is, it was conducted to check that the survey instructions are comprehensible,
wording of the survey is correct and statistical processes are effective. Necessary
modifications were made to survey questions and research procedure based on the
feedbacks that had been received from the pilot group.
This study also made use of real online shopping transaction data in behavioral
segmentation process. This data set was comprised of categorical, interval and ratio
type variables. Necessary information related to each variable that exists in this data
set can be found in Appendix F.
30
4.5 Statistical Techniques The main statistical tools and techniques used in this study are Exploratory Factor
Analysis (EFA), Confirmatory Factor Analysis (CFA), SPSS Two-Step Cluster
Analysis and Multi-group Structural equation modeling (SEM).
EFA was used to determine the numbers of factors required to represent the sample
data. CFA was used to test whether measures of a construct are consistent with the
nature of that given construct. EFA and CFA were utilized prior to the psychographic
segmentation process. These two statistical tools enabled to derive the necessary
factors to be used in the segmentation analysis.
Both in psychographic and behavioral segmentation process, SPSS Two-Step Cluster
Analysis technique was utilized. The strength of this techniques is that it can handle
large datasets with both categorical and continuous variables (SPSS Inc., 2001). This
technique is also capable of automatically determining optimal number of clusters
given the input variables.
Finally, Multi-group Structural Equation Modeling (SEM) technique was utilized to
test developed theoretical model for each determined consumer segment. Multi-group
SEM analysis allowed to test whether the different consumer segments have
significant differences in the causal relationships put forward by the developed
behavior evaluation model. SEM analysis was carried out by using IBM SPSS AMOS
version 22.
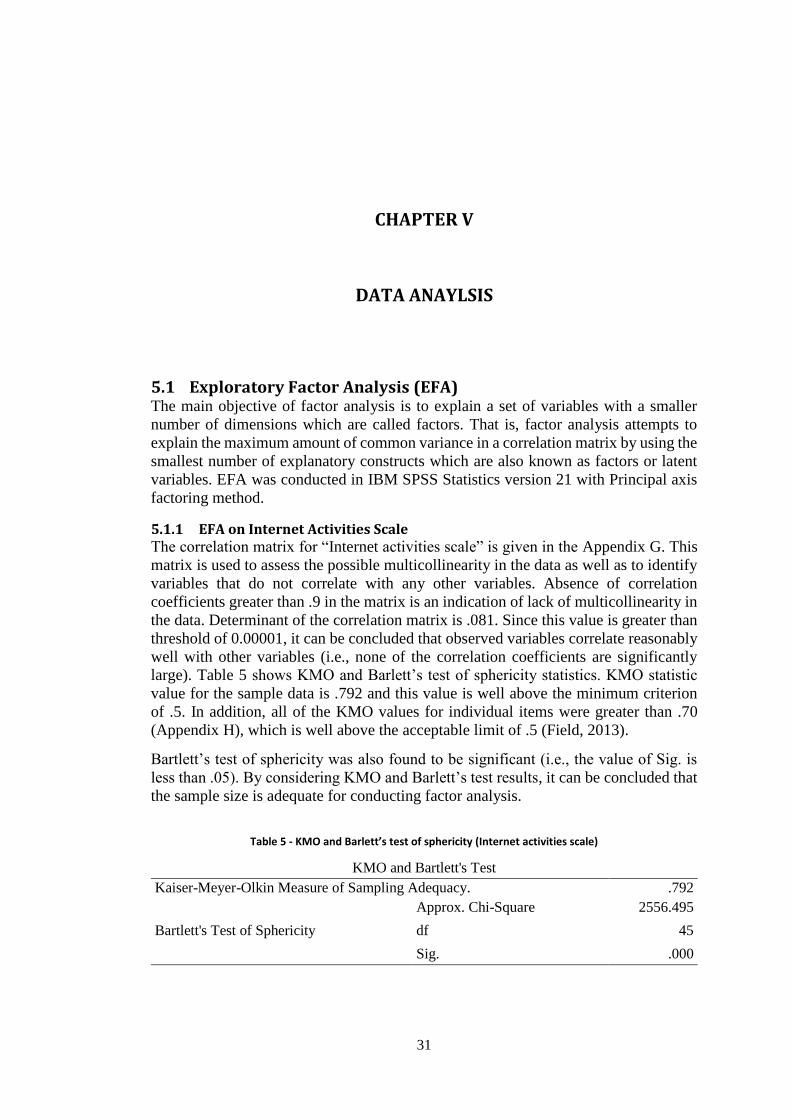
31
CHAPTER V
DATA ANAYLSIS
5.1 Exploratory Factor Analysis (EFA) The main objective of factor analysis is to explain a set of variables with a smaller
number of dimensions which are called factors. That is, factor analysis attempts to
explain the maximum amount of common variance in a correlation matrix by using the
smallest number of explanatory constructs which are also known as factors or latent
variables. EFA was conducted in IBM SPSS Statistics version 21 with Principal axis
factoring method.
5.1.1 EFA on Internet Activities Scale The correlation matrix for “Internet activities scale” is given in the Appendix G. This
matrix is used to assess the possible multicollinearity in the data as well as to identify
variables that do not correlate with any other variables. Absence of correlation
coefficients greater than .9 in the matrix is an indication of lack of multicollinearity in
the data. Determinant of the correlation matrix is .081. Since this value is greater than
threshold of 0.00001, it can be concluded that observed variables correlate reasonably
well with other variables (i.e., none of the correlation coefficients are significantly
large). Table 5 shows KMO and Barlett’s test of sphericity statistics. KMO statistic
value for the sample data is .792 and this value is well above the minimum criterion
of .5. In addition, all of the KMO values for individual items were greater than .70
(Appendix H), which is well above the acceptable limit of .5 (Field, 2013).
Bartlett’s test of sphericity was also found to be significant (i.e., the value of Sig. is
less than .05). By considering KMO and Barlett’s test results, it can be concluded that
the sample size is adequate for conducting factor analysis.
Table 5 - KMO and Barlett’s test of sphericity (Internet activities scale)
KMO and Bartlett's Test
Kaiser-Meyer-Olkin Measure of Sampling Adequacy. .792
Bartlett's Test of Sphericity
Approx. Chi-Square 2556.495
df 45
Sig. .000

32
A principal axis factor analysis was conducted on the 10 items with Orthogonal
rotation (varimax). An initial analysis was run to obtain eigenvalues for each factor in
the data. Three factors had eigenvalues over Kaiser’s criterion of 1 and in combination
explained 60.99% of the variance (Appendix I). The scree plot results also showed
inflexion that would justify retaining 3 factors (Appendix I). As a result 3 factors were
retained by taking into consideration Kaiser’s criterion and scree plot results. Table 6
shows the factor loadings after rotation. Stevens (2002) recommends that for a sample
size 300, a factor loadings should be greater than 0.298. However, for a sample size of
1000 factor loading should be greater than 0.162. That is, in a very large sample small
factor loadings can be evaluated as statistically meaningful. In EFA, we want variables
that are theorized to belong to one construct (i.e., factor) to load strongly on that
particular construct and to load weakly on other remaining constructs. For an “Internet
activities scale”, the items that cluster on the same factor suggest that factor 1
represents entertainment activities, factor 2 represents information gathering activities
and factor 3 represents e-commerce transaction rate.
Table 6 - Rotated factor matrix (Internet activities scale)
Rotated Factor Matrixa
Factor
1
(Entertainment activities)
2
(Information gathering)
3
(e-Commerce transaction rate)
Fun4 .715
Fun3 .677
Fun2 .663
Fun1 .418
Info2 .748
Info3 .683
Info1 .424
Shop2 .741
Shop3 .634
Shop1 .446
Extraction Method: Principal Axis Factoring.
Rotation Method: Varimax with Kaiser Normalization.
a. Rotation converged in 5 iterations.
In the Table 7, reliability test results for each extracted factor is given. Reliability test
ensures that a measure (i.e., questionnaire) consistently reflects the construct that it is
measuring (Field, 2013). For reliability analysis, Cronbach’s α was utilized. While a
Cronbach’s alpha greater than .60 is generally considered to be acceptable, loadings
between .70 and .90 are considered to be good (Gliem & Gliem, 2003). According to
Cronbach’s α test, reliability scores of entertainment, information gathering and e-
commerce activities constructs were above the minimum requirement of .60.
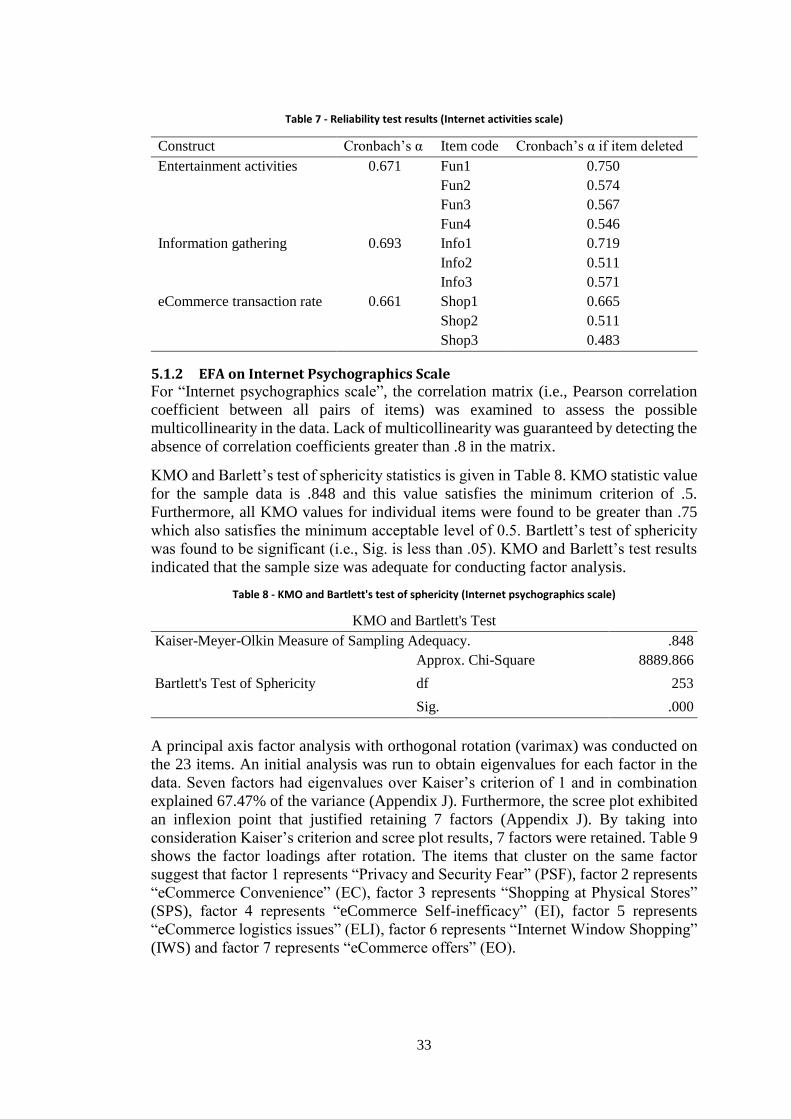
33
Table 7 - Reliability test results (Internet activities scale)
Construct Cronbach’s α Item code Cronbach’s α if item deleted
Entertainment activities 0.671 Fun1 0.750
Fun2 0.574
Fun3 0.567
Fun4 0.546
Information gathering 0.693 Info1 0.719
Info2 0.511
Info3 0.571
eCommerce transaction rate 0.661 Shop1 0.665
Shop2 0.511
Shop3 0.483
5.1.2 EFA on Internet Psychographics Scale For “Internet psychographics scale”, the correlation matrix (i.e., Pearson correlation
coefficient between all pairs of items) was examined to assess the possible
multicollinearity in the data. Lack of multicollinearity was guaranteed by detecting the
absence of correlation coefficients greater than .8 in the matrix.
KMO and Barlett’s test of sphericity statistics is given in Table 8. KMO statistic value
for the sample data is .848 and this value satisfies the minimum criterion of .5.
Furthermore, all KMO values for individual items were found to be greater than .75
which also satisfies the minimum acceptable level of 0.5. Bartlett’s test of sphericity
was found to be significant (i.e., Sig. is less than .05). KMO and Barlett’s test results
indicated that the sample size was adequate for conducting factor analysis.
Table 8 - KMO and Bartlett's test of sphericity (Internet psychographics scale)
KMO and Bartlett's Test
Kaiser-Meyer-Olkin Measure of Sampling Adequacy. .848
Bartlett's Test of Sphericity
Approx. Chi-Square 8889.866
df 253
Sig. .000
A principal axis factor analysis with orthogonal rotation (varimax) was conducted on
the 23 items. An initial analysis was run to obtain eigenvalues for each factor in the
data. Seven factors had eigenvalues over Kaiser’s criterion of 1 and in combination
explained 67.47% of the variance (Appendix J). Furthermore, the scree plot exhibited
an inflexion point that justified retaining 7 factors (Appendix J). By taking into
consideration Kaiser’s criterion and scree plot results, 7 factors were retained. Table 9
shows the factor loadings after rotation. The items that cluster on the same factor
suggest that factor 1 represents “Privacy and Security Fear” (PSF), factor 2 represents
“eCommerce Convenience” (EC), factor 3 represents “Shopping at Physical Stores”
(SPS), factor 4 represents “eCommerce Self-inefficacy” (EI), factor 5 represents
“eCommerce logistics issues” (ELI), factor 6 represents “Internet Window Shopping”
(IWS) and factor 7 represents “eCommerce offers” (EO).

34
Table 9 - Rotated factor matrix (Internet psychographics scale)
Rotated Factor Matrixa
Factors
1
(PSF)
2
(EC)
3
(SPS)
4
(EI)
5
(ELI)
6
(IWS)
7
(EO)
DisTr2 .872
DisTr1 .803
DisTr3 .717
DisTr4 .617
Conv2 .788
Conv1 .712
Conv4 .652
Conv3 .455
Phys2 .863
Phys1 .754
Phys4 .374
Ineff3 .728
Ineff2 .728
Ineff1 .505
Log3 .666
Log2 .605
Log4 .527
Win1 .758
Win2 .689
Win3 .476
IntOffer2 .924
IntOffer1 .488
IntOffer3 .402
Extraction Method: Principal Axis Factoring.
Rotation Method: Varimax with Kaiser Normalization.
a. Rotation converged in 7 iterations.
Table 10 shows reliability test results for factors that are extracted from “Internet
Psychographics Scale”. According to Cronbach’s α test results Internet distrust,
Internet convenience, Energy of physical stores, e-Commerce inefficacy and Online
window shopping constructs had high reliability (i.e., above 0.70). Reliability scores
of Internet logistics issues and Internet offers were also above the minimum
requirement of 0.60.

35
Table 10 - Reliability test results (Internet psychographics scale)
Construct Cronbach’s α Item code Cronbach’s α if item
deleted
Privacy and Security Fear 0.888 DisTr1 0.854
DisTr2 0.834
DisTr3 0.850
DisTr4 0.880
eCommerce Convenience 0.787 Conv1 0.713
Conv2 0.685
Conv3 0.801
Conv4 0.734
Shopping at Physical Stores 0.715 Phys1 0.561
Phys2 0.450
Phys4 0.800
eCommerce Self-inefficacy 0.761 Ineff1 0.750
Ineff2 0.653
Ineff3 0.638
eCommerce logistics issues 0.696 Log2 0.591
Log3 0.591
Log4 0.629
Internet Window Shopping 0.721 Win1 0.564
Win2 0.602
Win3 0.741
eCommerce offers 0.677 IntOffer1 0.630
IntOffer2 0.361
IntOffer3 0.699
5.2 Psychographic Segmentation Analysis
Psychographic segmentation is a process in which individuals are grouped based on
psychographic and cognitive factors such as lifestyle, attitudes, perceptions,
expectations and etc. Volunteer student participants were involved in the
psychographic segmentation process. Demographic profile of respondents involved in
psychographic segmentation process are given in Table 11.
Participants were undergraduate and graduate students from various faculties of three
different universities in Ankara. In total 1027 usable responses were obtained from
students. Gender distribution in Table 11 shows that the majority of respondents were
female (57.64 percent) . In regards to age group, most of the respondents aged from
18 to 20 (50.15 percent) followed by respondents whose age ranged from 21 to 23
(26.58 percent). As for educational level, most of the respondents were undergraduate
students (82.86 percent) and the others were master’s (11.49 percent) and doctorate
students (4.38 percent). The majority of respondents were mainly from faculty of
engineering (31.35 percent) followed by faculty of law (18.79 percent) and faculty of
art and sciences (17.33 percent).

36
Table 11 - Demographic profile of respondents
Demographic Profile Frequencies Percentage (%)
Gender
Male 428 41.67
Female 592 57.64
Age
18-20 515 50.15
21-23 273 26.58
24-26 125 12.17
27-29 48 4.67
30 and above 102 9.93
Education
Bachelors 851 82.86
Masters 118 11.49
Doctorate 45 4.38
Faculties
Faculty of Engineering 322 31.35
Faculty of Law 193 18.79
Art and Sciences 178 17.33
Business, Economics & Administrative Sciences 137 13.34
Faculty of Education 119 11.59
Technology 26 2.53
Health 19 1.85
Architecture and Design 19 1.85
Online Shopping Experience
Yes 913 88.90
No 106 10.32
Note: Percentages may not sum up to 100% due to missing data
In this study, SPSS Two-Step Clustering approach was utilized in order to carry out
segmentation analysis. The algorithm of SPSS Two-Step Clustering has two main
steps which are pre-clustering and clustering steps. Pre-clustering step is based on a
sequential clustering method. In pre-clustering step, scores of respondents are grouped
into several small sub-clusters. That is, in pre-clustering stage, scores of respondents
are scanned one by one and decision is made whether the current score should be
merged with the previously formed clusters or new cluster should be created based on
the distance criterion. The second step of SPSS Two-Step Clustering approach is based
on agglomerative hierarchical clustering. Hierarchical clustering is a process in which
clusters are recursively merged until only one cluster remains that contains all scores.
In the second step of clustering algorithm, the small clusters generated in pre-
clustering step are used as an input in generating groups of larger clusters. In contrast
to different types of segmentation approaches (e.g., K-means clustering), SPSS Two
Step Clustering algorithm is capable of automatically determining optimal number of
clusters given the input variables. Two SPSS Step cluster analysis are also capable of
handling large datasets with both categorical and continuous variables (SPSS Inc.,
2001). IBM SPSS Statistics version 21 was utilized in conducting the Two-Step
Clustering analysis.
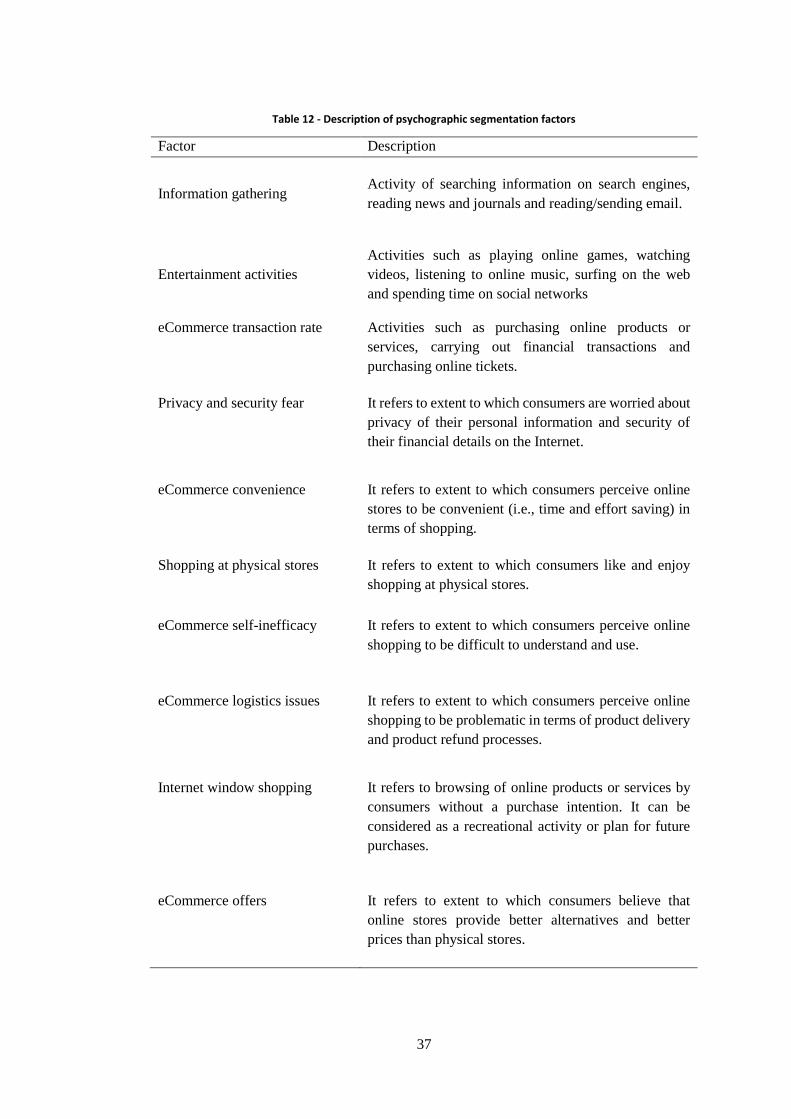
37
Table 12 - Description of psychographic segmentation factors
Factor Description
Information gathering Activity of searching information on search engines,
reading news and journals and reading/sending email.
Entertainment activities
Activities such as playing online games, watching
videos, listening to online music, surfing on the web
and spending time on social networks
eCommerce transaction rate Activities such as purchasing online products or
services, carrying out financial transactions and
purchasing online tickets.
Privacy and security fear It refers to extent to which consumers are worried about
privacy of their personal information and security of
their financial details on the Internet.
eCommerce convenience It refers to extent to which consumers perceive online
stores to be convenient (i.e., time and effort saving) in
terms of shopping.
Shopping at physical stores It refers to extent to which consumers like and enjoy
shopping at physical stores.
eCommerce self-inefficacy It refers to extent to which consumers perceive online
shopping to be difficult to understand and use.
eCommerce logistics issues It refers to extent to which consumers perceive online
shopping to be problematic in terms of product delivery
and product refund processes.
Internet window shopping It refers to browsing of online products or services by
consumers without a purchase intention. It can be
considered as a recreational activity or plan for future
purchases.
eCommerce offers It refers to extent to which consumers believe that
online stores provide better alternatives and better
prices than physical stores.

38
The results of the segmentation analysis was discussed and presented in detail in the
following paragraphs. Exploratory Factor Analysis (EFA) which was carried out on
Internet activities scale and Internet Psychographics scale yielded three and seven
factors respectively. Description of each determined factor is provided in Table 12.
Ten factors given in Table 12 were used as input in SPSS Two-Step Clustering analysis
with Log-likelihood distance measure and BIC (Schwarz's Bayesian) clustering
criterion. The results of the auto clustering process is given in Table 13.
Table 13 - Two Step auto-clustering result (Psychographic segmentation)
Auto-Clustering
Number of
Clusters
Schwarz's Bayesian
Criterion (BIC)
BIC
Changea
Ratio of BIC
Changesb
Ratio of Distance
Measuresc
1 7252.308
2 6935.175 -317.133 1.000 1.423
3 6753.629 -181.547 .572 1.161
4 6616.528 -137.101 .432 1.764
5 6598.908 -17.620 .056 1.100
6 6595.435 -3.474 .011 1.072
7 6601.510 6.076 -.019 1.186
8 6628.387 26.877 -.085 1.035
9 6658.995 30.608 -.097 1.124
10 6701.502 42.507 -.134 1.173
11 6758.194 56.692 -.179 1.018
12 6816.324 58.130 -.183 1.009
13 6875.189 58.865 -.186 1.228
14 6948.900 73.710 -.232 1.031
15 7024.536 75.636 -.238 1.043
a. The changes are from the previous number of clusters in the table.
b. The ratios of changes are relative to the change for the two cluster solution.
c. The ratios of distance measures are based on the current number of clusters against the
previous number of clusters.
While deciding on the number of clusters to be extracted from the data, the algorithm
takes into consideration the following criteria: low BIC value coefficient, high value
of BIC change and high value of Ratio of distance measures. Two-Step Clustering
algorithm suggested four clusters to be extracted from the data (BIC=6616.528, BIC
change=-137.101, Ratio of distance measures=1.764). The results of cluster analysis
provided enough evidence to accept the Hypothesis 1 which proposes that a broad
online consumer audience is a collection of different consumer segments.
The size of each segment is given in Table 14. Shopping Lovers (22.3 percent) and
Direct Purchasers (25.1 percent) have 229 and 258 observations respectively.
Suspicious Browsers (27.2 percent) and Incompetent Consumers (25.4 percent) have
39
279 and 261 observations respectively, and Suspicious Browsers segment is the one
that have the largest number of observations. The ratio of the largest segment size to
the smallest one is 1.22 which was below the recommended maximum value of 2. The
Centroids table presenting the mean and standard deviation of the observations in each
segment is given in Appendix K.
For each derived segment, a radar chart is created to visually depict each segments’
average score on each factor (Figure 12). A radar chart (a.k.a., spider chart or star
chart) enables to plots the values of each factor along a separate axis which origins
from the center of the chart and ends on the endmost ring. The Anderson-Rubin coding
method was utilized to produce each respondent’s factors scores on each derived
factor. The Anderson-Rubin method produces factor scores which are standardized
(i.e., Mean=0 and Standard deviation=1) and uncorrelated (Field, 2013). The radar
chart’s vertical axis provides information on particular segment’s average score on
each factor. The value 0.0 in the chart represents entire sample mean and the numbers
higher or lower than 0.0 shows the number of standard deviations from the entire
sample mean. Each segment was given an appropriate name by taking into
consideration their scores on various psychographic factors.
For comparison purpose, the average factor score of four derived consumer segments
are visually depicted in a single radar chart given in Figure 12. The following
subsections discuss the distinguished characteristics of each determined consumer
segment by taking into consideration segments’ scores on various psychographic
factors (Table 14) and results of variable importance charts which were created for
each segment. The variable importance chart shows how important the different
psychographic factors are to the formation of a given consumer segment. The vertical
axis in the figure shows each psychographic factor and the horizontal axis indicates
the Student’s t statistics. Dashed lines shows critical level (i.e., p<0.05). While a
negative Student’s t statistic indicates that the particular factor predominantly takes
smaller than average values within this segment, a positive Student’s t statistic
indicates the opposite. A particular factor is considered to statistically significantly
contribute to the formation of a segment if it’s bar line crosses the critical levels (i.e.,
p<0.05), either in positive or negative direction.
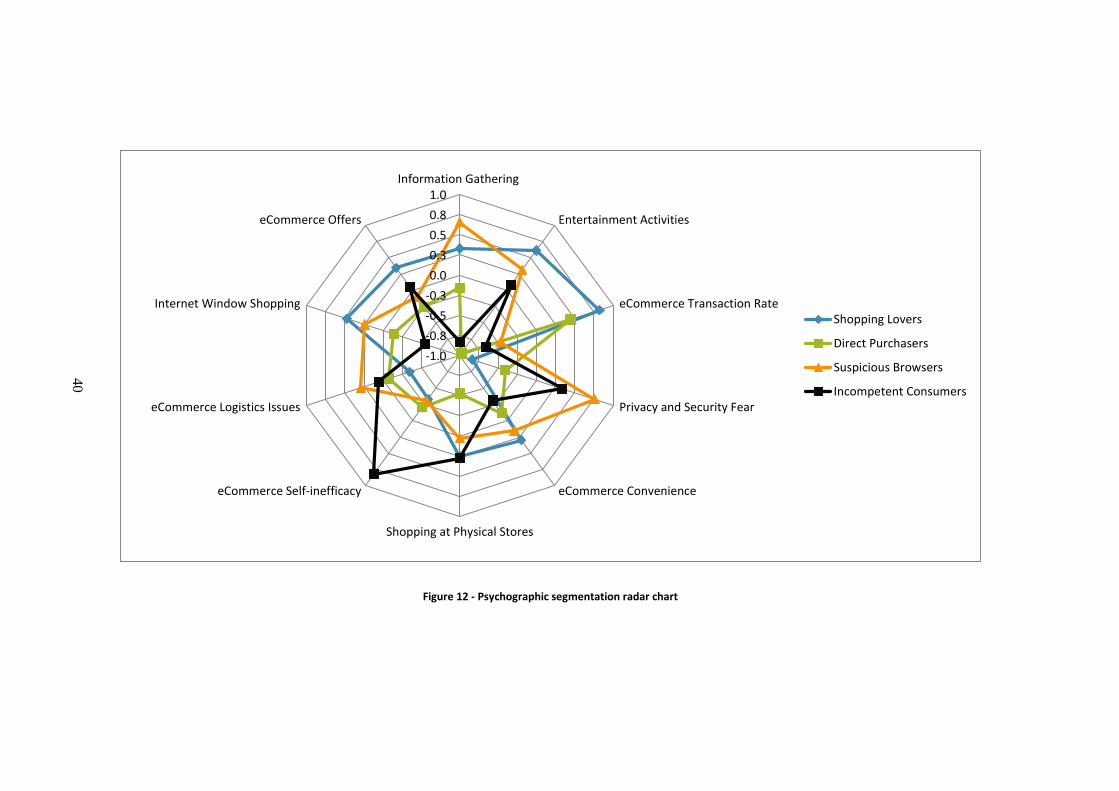
40
Figure 12 - Psychographic segmentation radar chart
-1.0
-0.8
-0.5
-0.3
0.0
0.3
0.5
0.8
1.0Information Gathering
Entertainment Activities
eCommerce Transaction Rate
Privacy and Security Fear
eCommerce Convenience
Shopping at Physical Stores
eCommerce Self-inefficacy
eCommerce Logistics Issues
Internet Window Shopping
eCommerce Offers
Shopping Lovers
Direct Purchasers
Suspicious Browsers
Incompetent Consumers
40

41
Table 14 - Psychographic segmentation results
Shopping Lovers Direct Purchasers Suspicious Browsers Incompetent Consumers
Dem
ogra
phic
fac
tors
Segment size (%) 22.3% 25.1% 27.2% 25.4%
Segment size (#) 229 258 279 261
Gender
Male 41.9% 53.9% 27.2% 44.8%
Female 57.2% 45.3% 72.4% 54.4%
e-Commerce experience
Yes 98.7% 97.7% 91.8% 68.6%
No 1.3% 2.3% 6.8% 30.7%
Seg
men
tati
on f
acto
rs
(cen
troid
val
ues
)
Entertainment activities (EA)* 0.61 -0.97 0.32 0.08
Information gathering (IG)* 0.33 -0.16 0.66 -0.83
eCommerce transaction rate (ETR)* 0.82 0.44 -0.47 -0.66
Privacy and Security Fear (PSF)* -0.84 -0.41 0.76 0.33
eCommerce convenience (EC)* 0.30 -0.12 0.15 -0.31
Shopping at physical stores (SPS)* 0.25 -0.53 0.03 0.27
eCommerce self-inefficacy (EI)* -0.33 -0.21 -0.31 0.82
eCommerce logistics issues (ELI)* -0.34 -0.07 0.29 0.06
Internet window shopping (IWS)* 0.47 -0.13 0.25 -0.55
eCommerce offers (EO)* 0.35 -0.25 -0.10 0.06
Notes: *Shows standardized values (i.e., 0.00 represents the entire sample average and +/- represents number of standard deviations above or below
the entire sample average
41

42
5.2.1 Shopping Lovers Shopping Lovers segment is comprised of 41.9 percent of male and 57.2 percent of
female participants. While 98.7 percent of respondents reported to have an online
shopping experience, 1.3 percent of respondents have not purchased any products or
services online before. The radar chart showing the average factors scores for this
segment is given in Figure 13. Based on this radar chart, the distinguished
characteristics of this segment can be listed as follows. Watching videos, listening to
music, spending time on social networks and playing games are among the activities
that carried out most commonly by the consumers of this segment.
Figure 13 - Shopping Lovers (Average factor scores)
This segment of consumers has the lowest level of Internet distrust (PSF=-0.84). That
is, Shopping Lovers do not worry as much as other consumers about security of their
private and financial information during online e-commerce transactions. This
segment also scored very low on “e-Commerce Inefficacy” factor (EI=-0.33) which
means that they know very well how to use online stores and place online orders.
Perceived convenience of e-commerce is another factor which is reported to be very
high for this segment (EC=0.30). That is, this type of consumers stated that they do
not have to leave home during online shopping and no transportation means (e.g., car,
bus and subway) are required to visit such stores. Furthermore, this segment thinks
that that online shopping platforms offer better prices and better product options than
physical stores (EO=0.35).
Internet logistics problems are one of the main factors that prevent consumers to place
orders online (Naiyi, 2004; Huseynov and Yıldırım, 2016b). However, for this type of
consumers, perceived Internet logistics problems are not reported to be a major
problem (ELI=-0.34). That is, they do not have many worries about the delivery
problems, online shipping charges and the complexities of returning online products.
As a consequence of the above mentioned characteristics of consumers in this segment,
it is not surprising that their e-commerce transaction rate is the highest one among four
determined consumer segments (ETR=0.82). Consumers in this segment actively use
the Internet to purchase products and services. They also tend to visit online stores to
examine products without any purchasing intention (IWS=0.48). Furthermore, for this
-1.0-0.8-0.6-0.4-0.20.00.20.40.60.81.0
InformationGathering
EntertainmentActivities
eCommerceTransaction Rate
Privacy andSecurity Fear
eCommerceConvenience
Shopping atPhysical Stores
eCommerce Self-inefficacy
eCommerceLogistics Issues
Internet WindowShopping
eCommerceOffers
Shopping Lovers
Entire average

43
segment shopping at physical stores (SPS=0.25) was also found to be above the
average which implies that consumers in this segment enjoy shopping whether it is
online or in physical stores.
The variable importance chart confirms what the radar chart indicated about this
segment by showing that all of the psychographic factors significantly contribute to
the formation of this segment (Figure 14). According to variable importance chart,
“Entertainment Activities”, “eCommerce Transaction Rate”, “Internet Window
Shopping” and “Information Gathering” are among the factors that contribute more to
the segment formation and within this segment, these factors generally take scores
larger than entire sample average. On the other side, “Privacy and Security Fear” and
“eCommerce Self-inefficacy” are also among factors that contribute more to the
segment formation and within this segment, these factors predominantly take scores
smaller than entire sample average.
Figure 14 - Shopping Lovers (Variable importance plot)
5.2.2 Direct Purchasers
Direct Purchasers segment is comprised of 53.9 percent of male and 45.3 percent of
female participants. While 97.7 percent of respondents reported to have an online
shopping experience, 2.3 percent of respondents do not have such an experience.
The radar chart showing the average factors scores for this segment is given in Figure
15. Based on the average scores on various factors, the distinctive characteristics of
this segment can be stated as follows. Among other segments, this segment scored the
least on entertainment activities (EA=-0.97). Consumers in this segment reported that

44
they mostly do not spend time on watching videos, listening to music, surfing on social
networks and playing games on the Internet.
Figure 15 - Direct Purchasers (Average factor scores)
Consumers in this segment mostly do not enjoy shopping at physical stores as their
scores on “Shopping at Physical Stores” factor was found to be well below the average
(SPS=-0.53). However, they prefer to meet their shopping needs over online stores as
their online shopping rate was found to be above the average (ETR=0.44). “Internet
Window Shopping” factor score (IWS=-0.13) was found to be below the average for
this segment which implies that this type of consumers do not like spending time on
looking through online products without any purchase. Furthermore, this type of
consumers do not think that online shopping platforms offer better prices and better
product options than physical stores (EO=-0.25).
The Internet distrust level of this segment was found to be well below the average
(PSF=-0.41). That is, consumers in this segment do not have many concerns about the
security of their private and financial information during online shopping activities.
This segment’s score on “e-Commerce Inefficacy” factor was found to be very low
(EI=-0.21) which implies that consumers in this segment know very well how to use
online shopping websites and how to place online orders. This segment also do not
perceive Internet logistics issues as a major problem (ELI=-0.07). That is, they do not
have many worries about the delivery of online products, online shipping charges and
the complexities of returning online products.
The above stated findings coincide well with what radar chart (Figure 15) puts forward
about the characteristics of this segment. According to variable importance plot
(Figure 16), all factors, except “eCommerce Transaction Rate”, predominantly take
scores smaller than average within this segment. On the other side, “eCommerce
Transaction Rate” factor generally takes scores larger than average and this factor is
one of the top factors that contribute more to the segment formation. “eCommerce
-1.0-0.8-0.6-0.4-0.20.00.20.40.60.81.0
InformationGathering
EntertainmentActivities
eCommerceTransaction Rate
Privacy andSecurity Fears
eCommerceConvenience
Shopping atPhysical Stores
eCommerce Self-inefficacy
eCommerceLogistics Issues
Internet WindowShopping
eCommerceOffers
Direct Purchasers
Entire average

45
convenience” and “eCommerce Logistics Issues” factors were not found to contribute
to the segment formation as their test statistics did not cross the critical values.
Figure 16 - Direct Purchasers (Variable importance plot)
5.2.3 Suspicious Browsers
Suspicious Browsers segment is comprised of 27.2 percent of male and 72.4 percent
of female participants. While 91.8 percent of respondents reported to have an online
shopping experience, 6.8 percent of respondents do not have such experience.
By taking into consideration the scores of this segment on various psychographic
factors which are given in Figure 17, the distinguished characteristics of this segment
can be stated as follows. This segment’s score on “Information Gathering” activities
was found to be well above the average (IG=0.66). That is, consumers in this segment
most of the time use Internet to search information on search engines, read news and
journals and send/read emails. In addition, consumers in this segment commonly use
the Internet for watching videos, listening to music, spending time on social networks
and playing games (EA=0.32).
However, when it comes to “eCommerce Transaction Rate”, this segment’s score was
found to be very low (ETR=-0.47). Even though consumers in this segment agree with
the idea that shopping on the Internet provides convenience and time-saving benefits
(EC=0.15), they usually do not prefer to purchase products and services over online
shopping platforms. Their unwillingness to adopt online shopping is not due to the
perceived complexities of e-commerce as score on “eCommerce Self-inefficacy”
factor was found to be very low (EI=-0.31). However, low level of e-commerce
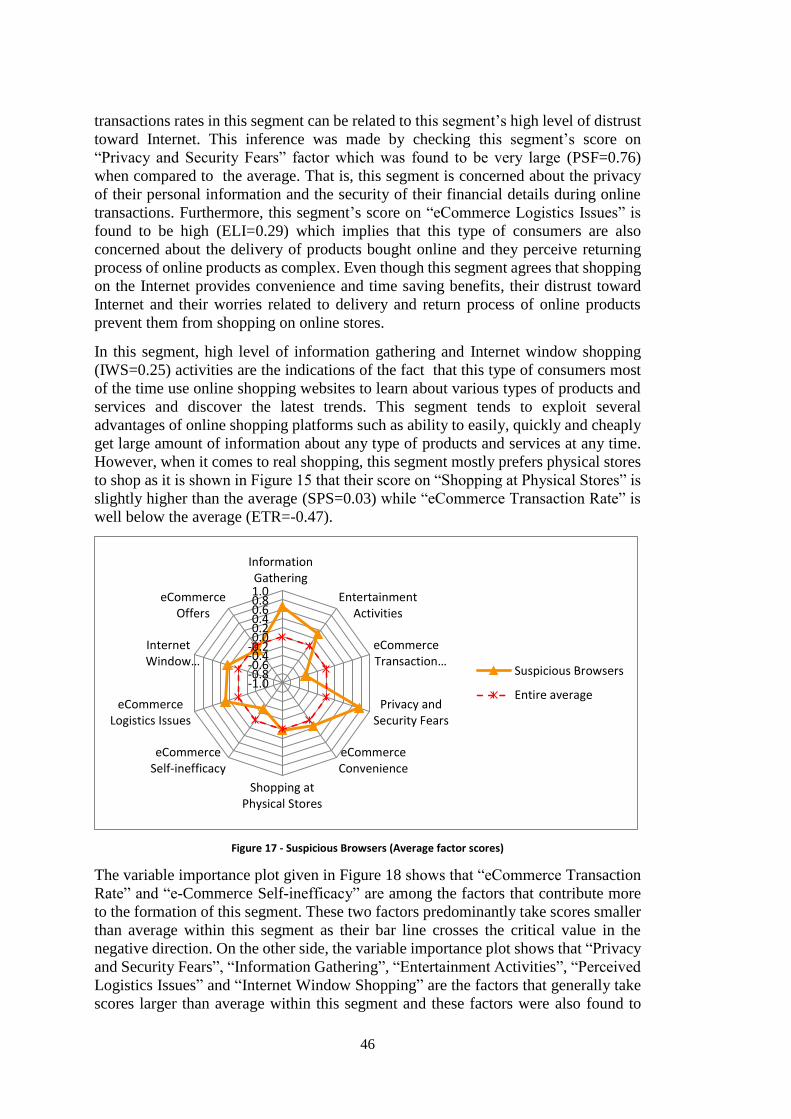
46
transactions rates in this segment can be related to this segment’s high level of distrust
toward Internet. This inference was made by checking this segment’s score on
“Privacy and Security Fears” factor which was found to be very large (PSF=0.76)
when compared to the average. That is, this segment is concerned about the privacy
of their personal information and the security of their financial details during online
transactions. Furthermore, this segment’s score on “eCommerce Logistics Issues” is
found to be high (ELI=0.29) which implies that this type of consumers are also
concerned about the delivery of products bought online and they perceive returning
process of online products as complex. Even though this segment agrees that shopping
on the Internet provides convenience and time saving benefits, their distrust toward
Internet and their worries related to delivery and return process of online products
prevent them from shopping on online stores.
In this segment, high level of information gathering and Internet window shopping
(IWS=0.25) activities are the indications of the fact that this type of consumers most
of the time use online shopping websites to learn about various types of products and
services and discover the latest trends. This segment tends to exploit several
advantages of online shopping platforms such as ability to easily, quickly and cheaply
get large amount of information about any type of products and services at any time.
However, when it comes to real shopping, this segment mostly prefers physical stores
to shop as it is shown in Figure 15 that their score on “Shopping at Physical Stores” is
slightly higher than the average (SPS=0.03) while “eCommerce Transaction Rate” is
well below the average (ETR=-0.47).
Figure 17 - Suspicious Browsers (Average factor scores)
The variable importance plot given in Figure 18 shows that “eCommerce Transaction
Rate” and “e-Commerce Self-inefficacy” are among the factors that contribute more
to the formation of this segment. These two factors predominantly take scores smaller
than average within this segment as their bar line crosses the critical value in the
negative direction. On the other side, the variable importance plot shows that “Privacy
and Security Fears”, “Information Gathering”, “Entertainment Activities”, “Perceived
Logistics Issues” and “Internet Window Shopping” are the factors that generally take
scores larger than average within this segment and these factors were also found to
-1.0-0.8-0.6-0.4-0.20.00.20.40.60.81.0
InformationGathering
EntertainmentActivities
eCommerceTransaction…
Privacy andSecurity Fears
eCommerceConvenience
Shopping atPhysical Stores
eCommerceSelf-inefficacy
eCommerceLogistics Issues
InternetWindow…
eCommerceOffers
Suspicious Browsers
Entire average

47
significantly contribute to the segment formation. The findings of variable importance
plot about this segment were found to be consistent with what radar chart (Figure 17)
states about the characteristics of this segment.
Figure 18 - Suspicious Browsers (Variable importance plot)
5.2.4 Incompetent Consumers Incompetent Consumers segment is comprised of 44.8 percent of male and 54.4
percent of female participants. While 68.6 percent of respondents reported to have an
online shopping experience, 30.7 percent of respondents do not have such experience.
Scores of this segment on various psychographic factors is given in a radar chart in
Figure 19. Based on this chart, the distinguished characteristics of this segment of
consumers are as follows. This segment of consumers stated that looking for
information on search engines, reading news and sending/reading email are not among
the activities they carry out most of time on the Internet (IG=-0.83). This segment of
consumers do not agree with the idea that Internet provides convenience in terms of
shopping (EC=-0.31). Internet distrust level of this segment was also found to be above
the average (PSF=0.33). That is, consumers in this segment have fears related to online
shopping due to perceived privacy and security issues on the Internet. Another notable
feature of consumers in this segment are their high level of e-commerce self-inefficacy
(EI=0.82). That’s, this segment of consumers reported that they are not good at using
online stores to purchase products or services. They perceive it as difficult to learn
placing online orders. By taking into consideration the above mentioned point, it seems
sensible why consumers in this segment do not carry much online transactions. E-
commerce transaction rate of this segment was found to be well below the average
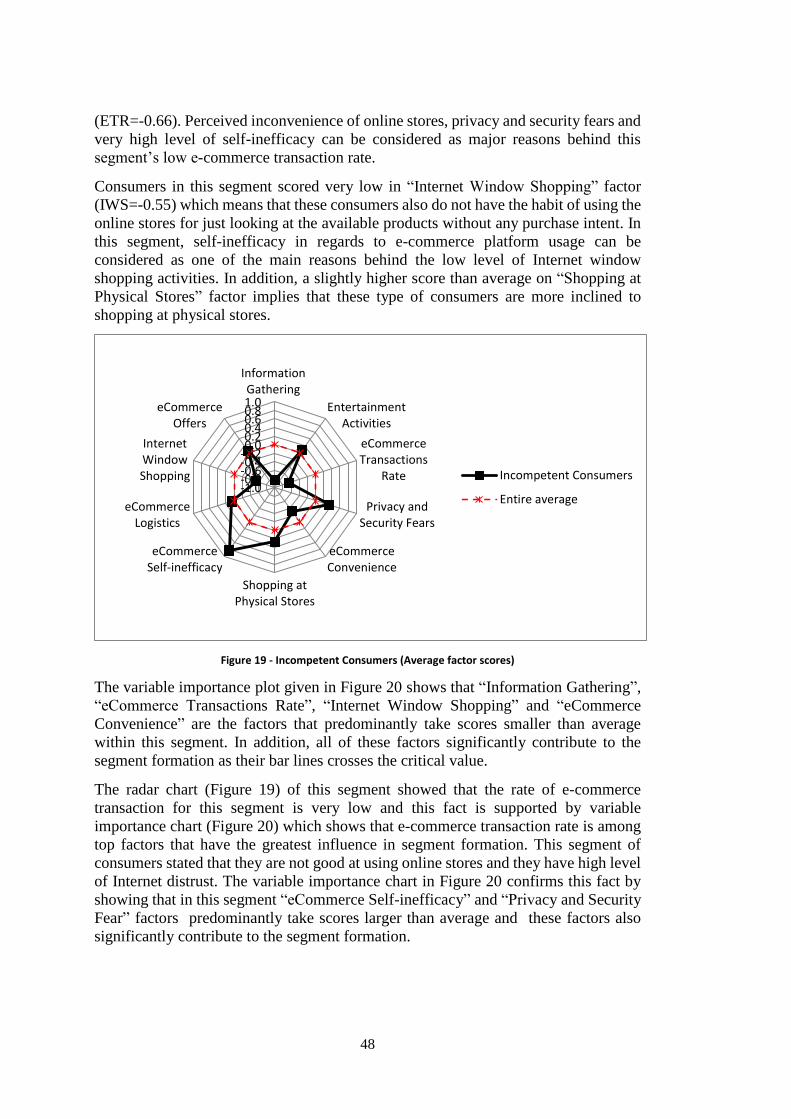
48
(ETR=-0.66). Perceived inconvenience of online stores, privacy and security fears and
very high level of self-inefficacy can be considered as major reasons behind this
segment’s low e-commerce transaction rate.
Consumers in this segment scored very low in “Internet Window Shopping” factor
(IWS=-0.55) which means that these consumers also do not have the habit of using the
online stores for just looking at the available products without any purchase intent. In
this segment, self-inefficacy in regards to e-commerce platform usage can be
considered as one of the main reasons behind the low level of Internet window
shopping activities. In addition, a slightly higher score than average on “Shopping at
Physical Stores” factor implies that these type of consumers are more inclined to
shopping at physical stores.
Figure 19 - Incompetent Consumers (Average factor scores)
The variable importance plot given in Figure 20 shows that “Information Gathering”,
“eCommerce Transactions Rate”, “Internet Window Shopping” and “eCommerce
Convenience” are the factors that predominantly take scores smaller than average
within this segment. In addition, all of these factors significantly contribute to the
segment formation as their bar lines crosses the critical value.
The radar chart (Figure 19) of this segment showed that the rate of e-commerce
transaction for this segment is very low and this fact is supported by variable
importance chart (Figure 20) which shows that e-commerce transaction rate is among
top factors that have the greatest influence in segment formation. This segment of
consumers stated that they are not good at using online stores and they have high level
of Internet distrust. The variable importance chart in Figure 20 confirms this fact by
showing that in this segment “eCommerce Self-inefficacy” and “Privacy and Security
Fear” factors predominantly take scores larger than average and these factors also
significantly contribute to the segment formation.
-1.0-0.8-0.6-0.4-0.20.00.20.40.60.81.0
InformationGathering
EntertainmentActivities
eCommerceTransactions
Rate
Privacy andSecurity Fears
eCommerceConvenience
Shopping atPhysical Stores
eCommerceSelf-inefficacy
eCommerceLogistics
InternetWindowShopping
eCommerceOffers
Incompetent Consumers
Entire average

49
Figure 20 - Incompetent Consumers (Variable importance plot)
5.3 Behavioral Segmentation Analysis
In contrast to psychographic segmentation approach in which individuals are grouped
based on their lifestyles, attitudes, perceptions and expectations, behavioral
segmentation approach takes into consideration individuals’ actual behaviors. For
example, in the online shopping context consumers’ spending, consumption and usage
patterns are some of the many possible factors upon which behavioral segmentation
analysis can be carried out.
In this study, the data that were used in behavioral segmentation analysis are based on
real B2C e-commerce transactions which were carried out at Markafoni.com.
Markafoni.com is one of the most popular online shopping websites in Turkey with
7.2 million members. Markafoni.com offers its members many selected brands from
different categories such as clothing, accessories, cosmetics, decoration and lifestyle.
After signing the non-disclosure agreement with Markafoni.com, the data required for
behavioral segmentation analysis were provided by the company. The dataset which
was provided by Markafoni.com was comprised of 350.000 product purchases from
157.000 orders carried out by 10.000 unique customers. Random sampling method
was utilized while retrieving customers and related online transactions data from the
database.
Demographic profile of this customer set is given in Table 15. Gender distribution in
Table 15 shows that the majority of the consumers were female (73.84 percent). In
regards to age, most of the consumers aged from 30 to 34 (28.39 percent) followed by

50
consumers whose age ranged from 25 to 29 (24.28 percent). As for geographic
location, the majority of consumers are from Marmara region (45.05 percent) followed
by Central Anatolia region (16.91 percent) and Aegean region (13.79 percent).
Table 15 - Demographic profile of customers
Demographic Profile Frequencies Percentage (%)
Gender
Male 2616 26.16
Female 7384 73.84
Age
Less than 25 817 8.17
25-29 2428 24.28
30-34 2839 28.39
35-39 1931 19.31
40-44 1024 10.24
45 and above 961 9.61
Geographical Region
Aegean Region 1379 13.79
Black Sea Region 758 7.58
Central Anatolia Region 1691 16.91
Eastern Anatolia Region 420 4.20
Marmara Region 4505 45.05
Mediterranean Region 808 8.08
Southeastern Anatolia Region 439 4.39
As in psychographic segmentation process, SPSS Two-Step Clustering method was
used in behavioral segmentation process. SPSS Two-Step Cluster analysis is a robust
clustering tool in which clusters are derived from the dataset in two main steps, namely
pre-clustering and hierarchical clustering steps. This clustering tool can handle very
large datasets with various data types (i.e., scale, ordinal) (SPSS Inc., 2001).
Furthermore, it can also determine the optimal number of clusters which is a
challenging task left to researcher in other clustering methods (e.g., hierarchical, k-
means).
IBM SPSS Statistics version 21 was utilized in conducting the Two-Step Clustering
analysis. Five behavioral factors upon which segmentation analysis were carried out
are listed and explained in Table 16. These factors are; 1) online shopping rate 2)
average price paid 3) coupon redemption rate 4) product diversity rate 5) refund rate.
There are also some behavioral factors (Table 16) which were not used in segmentation
process but utilized in understanding the specific characteristics of each determined
consumer segment. Some of these factors were not included in the main segmentation
process because they cause quality reduction in derived segments. Some others were
not included mainly because they are dichotomous variables with two levels which
lead to formation of just two segments.
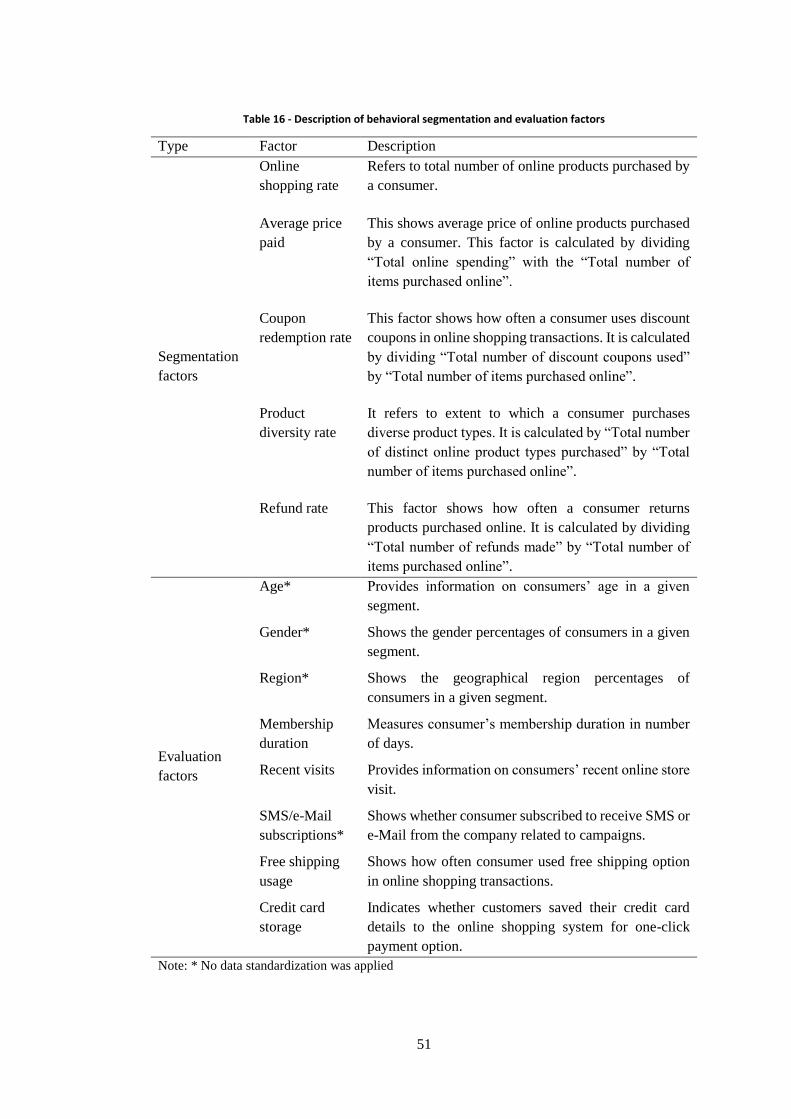
51
Table 16 - Description of behavioral segmentation and evaluation factors
Type Factor Description
Segmentation
factors
Online
shopping rate
Refers to total number of online products purchased by
a consumer.
Average price
paid
This shows average price of online products purchased
by a consumer. This factor is calculated by dividing
“Total online spending” with the “Total number of
items purchased online”.
Coupon
redemption rate
This factor shows how often a consumer uses discount
coupons in online shopping transactions. It is calculated
by dividing “Total number of discount coupons used”
by “Total number of items purchased online”.
Product
diversity rate
It refers to extent to which a consumer purchases
diverse product types. It is calculated by “Total number
of distinct online product types purchased” by “Total
number of items purchased online”.
Refund rate This factor shows how often a consumer returns
products purchased online. It is calculated by dividing
“Total number of refunds made” by “Total number of
items purchased online”.
Evaluation
factors
Age* Provides information on consumers’ age in a given
segment.
Gender* Shows the gender percentages of consumers in a given
segment.
Region* Shows the geographical region percentages of
consumers in a given segment.
Membership
duration
Measures consumer’s membership duration in number
of days.
Recent visits Provides information on consumers’ recent online store
visit.
SMS/e-Mail
subscriptions*
Shows whether consumer subscribed to receive SMS or
e-Mail from the company related to campaigns.
Free shipping
usage
Shows how often consumer used free shipping option
in online shopping transactions.
Credit card
storage
Indicates whether customers saved their credit card
details to the online shopping system for one-click
payment option.
Note: * No data standardization was applied
52
Each of these behavioral factors related to online shopping had a different dimension
which is required to be standardized before conducting the segmentation analysis. Data
standardization which is an important step in a segmentation analysis is carried out in
order to remove the possible influences of different dimensions of various data items
(Liu et al., 2015).
The data used in behavioral segmentation process is standardized in two main steps.
In the first step, for each behavioral factor listed in Table 16 the quintile points were
determined. Quintiles are four cut-off points that divides a dataset into five equal-size
parts. In the literature, it is quite common to use quintiles to create cut-off points for a
given population. For each behavioral factor the original raw data is sorted in the
increasing order and quintile points were determined. While the first quintile
represented the lowest end of the data (1-20%), the final quintile represented the
highest end of the data (81% - 100%). By taking into consideration the determined
quintile position, for each behavioral factor each data point is labeled between 1 (i.e.,
low) and 5 (i.e., high). In the second step of the data standardization process, each
behavioral factor which was rescaled between 1 and 5 is further rescaled to have a
mean of zero and standard deviation of one (i.e., converted to z-scores). This approach
is the one which was also used to standardize the factor scores in the psychographic
segmentation process. This second step of data standardization will enable to clearly
see which segment’s various factor scores are close to entire sample average (i.e.,
segment’s mean z-score close to 0), lower than average (i.e., segment’s mean z-score
lower than 0) or higher than the average (i.e., segment’s mean z-score higher than 0).
After the data standardization process, 5 behavioral factors listed in Table 16 were
used as input in SPSS Two-Step Cluster analysis with Log-likelihood distance measure
and BIC (Schwarz's Bayesian) clustering criterion. The results of the segmentation
analysis was discussed and presented in detail in the following paragraphs. In order to
determine the number of segments to be extracted from the dataset, SPSS Two Step
Cluster algorithm takes into consideration the following criterions: low BIC value
coefficient, high value of BIC change and high value of Ratio of distance measures.
Results of the auto clustering process is provided in Table 17. By taking into
consideration the 5 determined behavioral factors clustering algorithm suggested 5
segments to be extracted from the data (BIC=16027.407, BIC change=-1306.710,
Ratio of distance measures=1.400). The results of cluster analysis provided enough
evidence to accept the Hypothesis 1 which proposes that a broad online consumer
audience is composed of different consumer segments.

53
Table 17 - Two Step auto-clustering result (Behavioral segmentation)
Auto-Clustering
Number of
Clusters
Schwarz's Bayesian
Criterion (BIC)
BIC
Changea
Ratio of BIC
Changesb
Ratio of Distance
Measuresc
1 25697.308
2 21930.999 -3766.309 1.000 1.311
3 19079.934 -2851.064 .757 1.602
4 17334.117 -1745.817 .464 1.315
5 16027.407 -1306.710 .347 1.400
6 15119.551 -907.856 .241 1.213
7 14386.818 -732.733 .195 1.105
8 13732.136 -654.682 .174 1.047
9 13110.960 -621.175 .165 1.162
10 12588.588 -522.373 .139 1.064
11 12103.092 -485.496 .129 1.334
12 11761.484 -341.608 .091 1.074
13 11449.376 -312.108 .083 1.002
14 11138.002 -311.374 .083 1.133
15 10873.670 -264.331 .070 1.002
a. The changes are from the previous number of clusters in the table.
b. The ratios of changes are relative to the change for the two cluster solution.
c. The ratios of distance measures are based on the current number of clusters against the previous
number of clusters. The number of segments and their sizes are provided in Table 18. Opportunist
Customers (13.7 percent), Transient Customers (24.8 percent) and Need-based
Shoppers (15.8 percent) have 1367, 2477 and 1583 observations respectively.
Skeptical Newcomers (21.8 percent) and Repetitive Purchasers (23.9 percent) have
2182 and 2391 observations respectively. Transient Customers is the one that have the
largest number of observations. The ratio of the largest cluster size to the smallest one
is 1.81 which is below the recommended maximum value of 2. The Centroids table
presenting the mean and standard deviation of the observations in each segment is
provided in Appendix K.
For each determined consumer segment a radar chart is created to show each segment’s
average score on each behavioral factor. In a radar chart, score on each behavioral
factor is plotted along a separate axis. While the value 0.0 in the chart shows the entire
sample mean, the numbers higher or lower than 0.0 represents the numbers of standard
deviations from the entire sample mean. Each segment is given an appropriate name
by taking into consideration their scores on various behavioral factors listed in Table
16. For comparison purpose, the average factor score of five derived consumer
segments are plotted in a single radar chart given in Figure 21. Following subsections
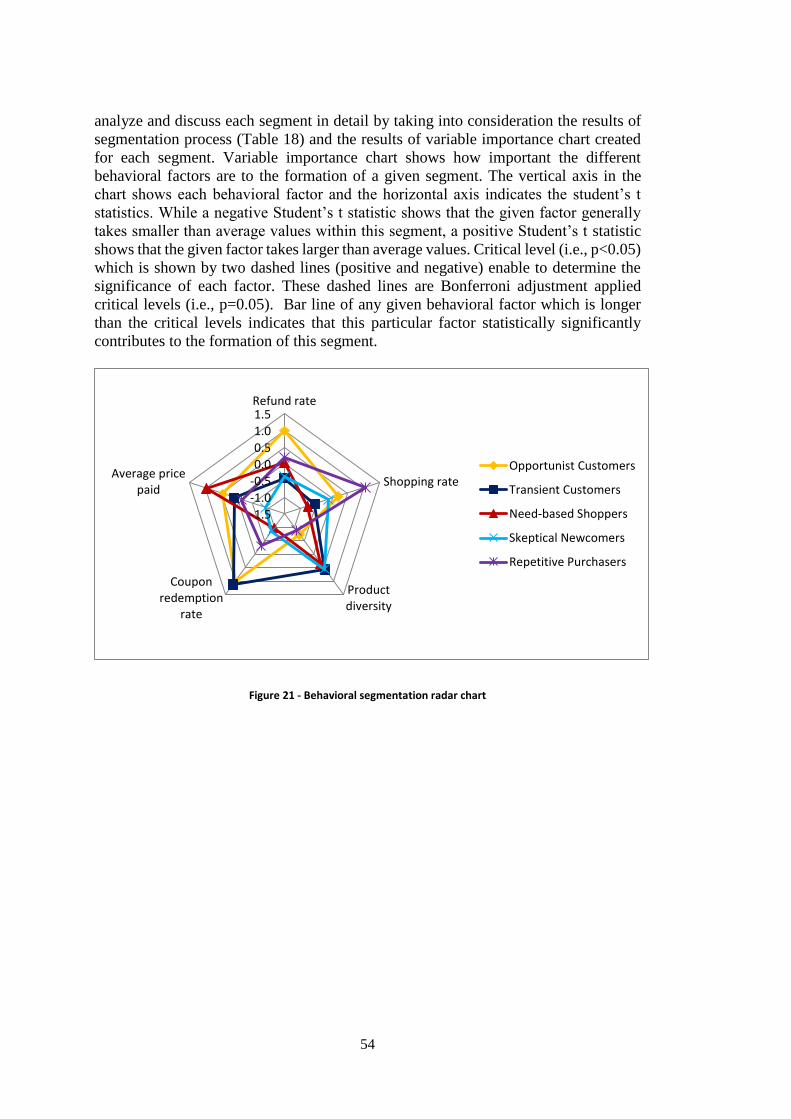
54
analyze and discuss each segment in detail by taking into consideration the results of
segmentation process (Table 18) and the results of variable importance chart created
for each segment. Variable importance chart shows how important the different
behavioral factors are to the formation of a given segment. The vertical axis in the
chart shows each behavioral factor and the horizontal axis indicates the student’s t
statistics. While a negative Student’s t statistic shows that the given factor generally
takes smaller than average values within this segment, a positive Student’s t statistic
shows that the given factor takes larger than average values. Critical level (i.e., p<0.05)
which is shown by two dashed lines (positive and negative) enable to determine the
significance of each factor. These dashed lines are Bonferroni adjustment applied
critical levels (i.e., p=0.05). Bar line of any given behavioral factor which is longer
than the critical levels indicates that this particular factor statistically significantly
contributes to the formation of this segment.
Figure 21 - Behavioral segmentation radar chart
-1.5
-1.0
-0.5
0.0
0.5
1.0
1.5Refund rate
Shopping rate
Productdiversity
Couponredemption
rate
Average pricepaid
Opportunist Customers
Transient Customers
Need-based Shoppers
Skeptical Newcomers
Repetitive Purchasers
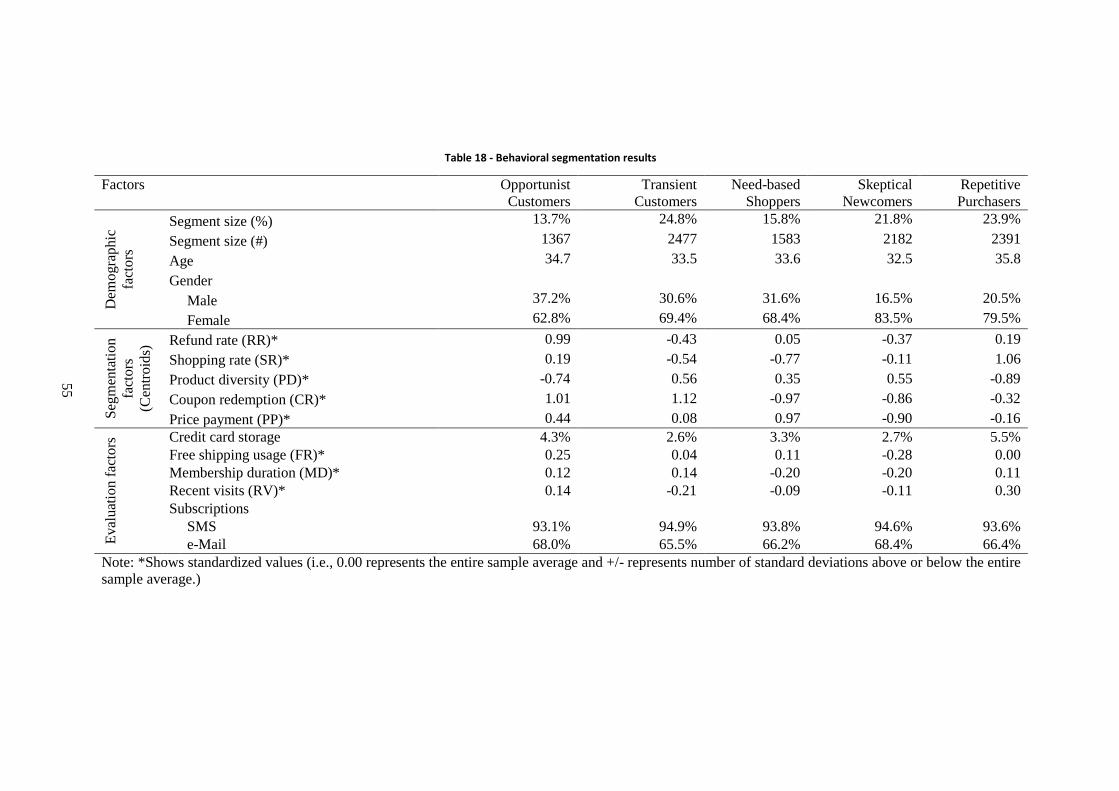
55
Table 18 - Behavioral segmentation results
Factors Opportunist
Customers
Transient
Customers
Need-based
Shoppers
Skeptical
Newcomers
Repetitive
Purchasers
Dem
ogra
phic
fact
ors
Segment size (%) 13.7% 24.8% 15.8% 21.8% 23.9%
Segment size (#) 1367 2477 1583 2182 2391
Age 34.7 33.5 33.6 32.5 35.8
Gender
Male 37.2% 30.6% 31.6% 16.5% 20.5%
Female 62.8% 69.4% 68.4% 83.5% 79.5%
Seg
men
tati
on
fact
ors
(Cen
troid
s) Refund rate (RR)* 0.99 -0.43 0.05 -0.37 0.19
Shopping rate (SR)* 0.19 -0.54 -0.77 -0.11 1.06
Product diversity (PD)* -0.74 0.56 0.35 0.55 -0.89
Coupon redemption (CR)* 1.01 1.12 -0.97 -0.86 -0.32
Price payment (PP)* 0.44 0.08 0.97 -0.90 -0.16
Ev
alu
atio
n f
acto
rs Credit card storage 4.3% 2.6% 3.3% 2.7% 5.5%
Free shipping usage (FR)* 0.25 0.04 0.11 -0.28 0.00
Membership duration (MD)* 0.12 0.14 -0.20 -0.20 0.11
Recent visits (RV)* 0.14 -0.21 -0.09 -0.11 0.30
Subscriptions
SMS 93.1% 94.9% 93.8% 94.6% 93.6%
e-Mail 68.0% 65.5% 66.2% 68.4% 66.4%
Note: *Shows standardized values (i.e., 0.00 represents the entire sample average and +/- represents number of standard deviations above or below the entire
sample average.)
55

56
Along with segmentation factors numerous behavior evaluation factors were also
utilized to understand the specific characteristics of each derived consumer segment.
Results of these behavior evaluation factors according to each segment is provided in
Table 18 and discussed in detail in the following subsections.
Figure 22 and Appendix L shows determined behavioral segment sizes according to
seven geographical region of Turkey. At first glance it can be seen that for all
geographical regions Transient Customers, Suspicious Newcomers and Repetitive
Purchasers are the top three dominant consumer segments. For all regions except
Central Anatolia, Opportunist Customers segment was found to have the smallest size.
Figure 22 - Behavioral segment sizes according to regions
5.3.1 Opportunist Customers Opportunist Customers segment is comprised of 37.2 percent of male and 62.8 percent
of female consumers. The average age of this segment is 34.7 years. Top 3
geographical regions that customers within this segment reside are Marmara (46.0%),
Central Anatolia (18.8%) and Aegean (13.2%) (Appendix L). On the other hand,
decomposition of each geographical region in terms of determined consumer segments
indicates that Central Anatolia (15.2%), Southeastern Anatolia (15.0%) and Marmara
(14.0%) are the top three regions in which the size of Opportunist Customers are at the
highest level (Figure 22).
The radar chart showing the average factors scores for Opportunist Customers segment
is given in Figure 23. Based on this radar chart and the results of segmentation process
given in Table 18, the distinguished characteristics of this segment can be stated as
follows.
0.00
5.00
10.00
15.00
20.00
25.00
30.00
35.00
Opportunist Customers Transient Customers Need-based Shoppers
Suspicious Newcomers Repetitive Purchasers
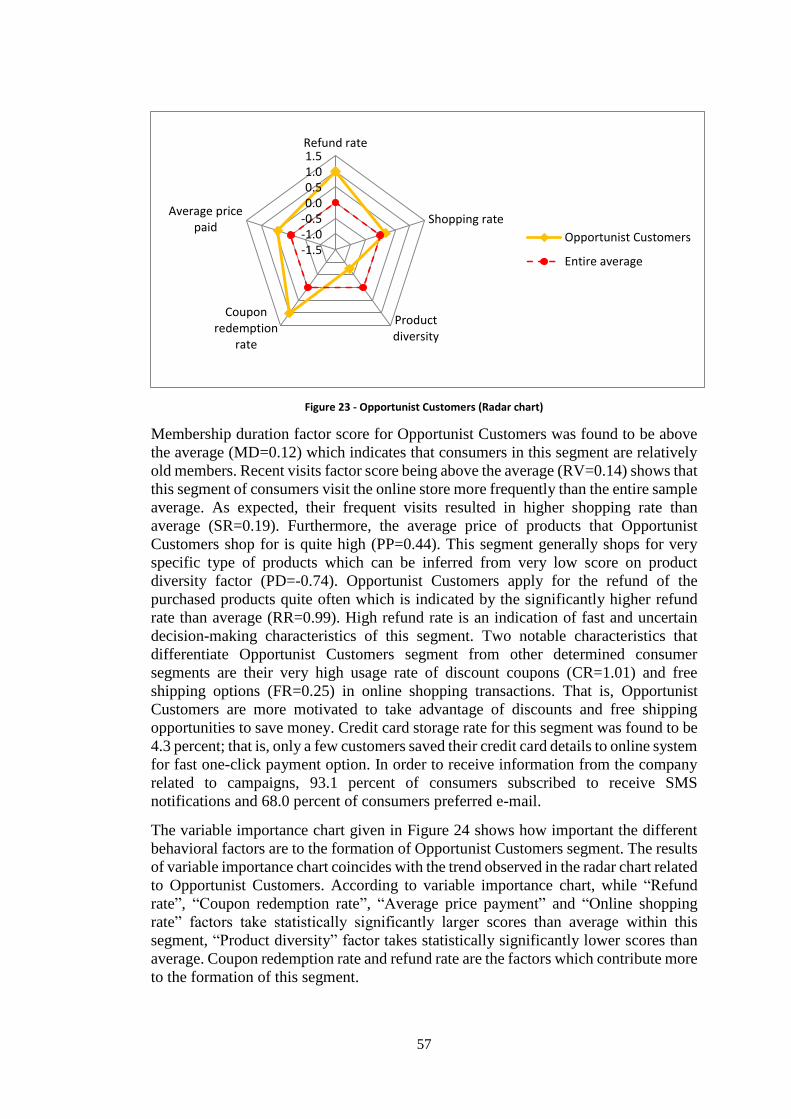
57
Figure 23 - Opportunist Customers (Radar chart)
Membership duration factor score for Opportunist Customers was found to be above
the average (MD=0.12) which indicates that consumers in this segment are relatively
old members. Recent visits factor score being above the average (RV=0.14) shows that
this segment of consumers visit the online store more frequently than the entire sample
average. As expected, their frequent visits resulted in higher shopping rate than
average (SR=0.19). Furthermore, the average price of products that Opportunist
Customers shop for is quite high (PP=0.44). This segment generally shops for very
specific type of products which can be inferred from very low score on product
diversity factor (PD=-0.74). Opportunist Customers apply for the refund of the
purchased products quite often which is indicated by the significantly higher refund
rate than average (RR=0.99). High refund rate is an indication of fast and uncertain
decision-making characteristics of this segment. Two notable characteristics that
differentiate Opportunist Customers segment from other determined consumer
segments are their very high usage rate of discount coupons (CR=1.01) and free
shipping options (FR=0.25) in online shopping transactions. That is, Opportunist
Customers are more motivated to take advantage of discounts and free shipping
opportunities to save money. Credit card storage rate for this segment was found to be
4.3 percent; that is, only a few customers saved their credit card details to online system
for fast one-click payment option. In order to receive information from the company
related to campaigns, 93.1 percent of consumers subscribed to receive SMS
notifications and 68.0 percent of consumers preferred e-mail.
The variable importance chart given in Figure 24 shows how important the different
behavioral factors are to the formation of Opportunist Customers segment. The results
of variable importance chart coincides with the trend observed in the radar chart related
to Opportunist Customers. According to variable importance chart, while “Refund
rate”, “Coupon redemption rate”, “Average price payment” and “Online shopping
rate” factors take statistically significantly larger scores than average within this
segment, “Product diversity” factor takes statistically significantly lower scores than
average. Coupon redemption rate and refund rate are the factors which contribute more
to the formation of this segment.
-1.5-1.0-0.50.00.51.01.5Refund rate
Shopping rate
Productdiversity
Couponredemption
rate
Average pricepaid
Opportunist Customers
Entire average

58
Figure 24 - Opportunist Customers (Variable importance plot)
In the light of findings presented above, it is reasonable to call this segment as
Opportunist Customers. More specifically, visiting online store more often, purchasing
online products more frequently, redeeming more coupons and preferring more free
delivery options implies that consumers in this segment are more driven by available
opportunities in online store. This type of consumers tend to take advantage of discount
coupons and free delivery options for a few product types in which they are interested.
Discount coupons are generally offered when customers spend some higher amount of
money on certain type of products. Higher than average price payment of this segment
probably is driven by the motivation to obtain discount coupons.
5.3.2 Transient Customers Transient Customers segment is comprised of 30.6 percent of male and 69.4 percent
of female consumers. The average age of this is segment is 33.5 years. Top 3
geographical regions that consumers within this segment reside are Marmara (45.6%),
Central Anatolia (18.1%) and Aegean (13.2%) (Appendix L). Decomposition of each
geographical region in terms of determined consumer segments (Figure 22) shows that
Central Anatolia (26.6), Marmara (25.1) and Black Sea (24.1) are the top three regions
in which the size of “Transient Customers” are at the highest level.
The average scores of Transient Customers segment on various behavioral factors is
shown on a radar chart in Figure 25. Based on this radar chart and the results of
segmentation process given in Table 18, the most prominent characteristics of this
segment are as follows. Transient Customers segment is composed of relatively old
members as membership duration factor score for this segment was found to be above
the average (MD=0.14). Among other segments, Transient Customers are the ones
who visit the online store very infrequently as their score on recent visits factor was

59
found to be the lowest (RV=-0.21). As a result of their infrequent visits, the shopping
rate of this type of consumers is very low (SR=-0.54).
Another notable characteristic of consumers in this segment is their very high usage of
discount coupons (CR=1.12) in their online shopping transactions. Even though online
shopping rate was found to be low in this segment, discount usage rate was found to
be high which means that in most of their product purchases, this type of customers
redeemed discount coupons. Transient Customers tend to purchase diverse type of
products as their score on this factor (PD=0.56) is higher than the average. In addition,
their product refund rate was found to be lower (RR=-0.43) which indicates that this
segment’s product decision-making process is much better than other segments.
When it comes to subscriptions to receive notification from the company related to
campaigns, 94.9 percent of consumers preferred SMS and 68.0 percent preferred e-
mail. Among other segments, this segment is the one in which credit card storage rate
for one-click payment option is at the lowest level (2.6%).
Figure 25 - Transient Customers (Radar chart)
In Figure 26, the variable importance chart depicts how important role different
behavioral factors play in the formation of Transient Customers segment. The trend
observed in the radar chart related to the characteristics of Transient Customers
coincides with the findings of variable importance chart. This chart shows that all
factors except “Average price payment” significantly contribute to the formation of
this segment. While “Coupon redemption” and “Product diversity rate” factors take
statistically significantly larger than average score within this segment, “Online
shopping rate” and “Refund rate” factors take statistically significantly lower scores
than average. Coupon redemption rate is the factor which contributes the most to the
formation of this segment.
-1.5
-1.0
-0.5
0.0
0.5
1.0
1.5Refund rate
Shopping rate
Productdiversity
Couponredemption
rate
Average pricepaid
Transient Customers
Entire average

60
Figure 26 - Transient Customers (Variable importance plot)
By considering all the findings related to the behavioral characteristics of this segment,
it makes sense to call this segment as Transient Customers. Visiting the online store
less frequently, purchasing the products less frequently and in most of their online
transactions redeeming more coupons on diverse type of products implies that
consumers of this segment are more driven by offered discount coupons. Transient
Customers do not have a habit of meeting their product needs over online stores. What
drives them to online store is some type of incentives, namely discount coupons. After
redeeming the discount coupons, this type of customers do not visit and shop in the
online store on regular basis. This segment can also be called as coupon-prone
customers.
5.3.3 Need-based Shoppers Need-based Shoppers segment is composed of 31.6 percent of male and 68.4 percent
of female consumers. The average age of this segment is 33.6 years. Consumers within
this segment are mostly from Marmara (48.8%), Central Anatolia (15.7%) and Aegean
(12.7%) geographical regions (Appendix L). Furthermore, decomposition of each
geographical region in terms of determined consumer segments (Figure22) shows that
Black Sea (17.4%), Marmara (17.1%) and Southeastern Anatolia (15.7%) are the top
three regions in which the size of “Need-based Shoppers” are at the highest level.
The radar chart showing the average factors scores for Need-based Shoppers consumer
segment is given in Figure 27. Based on this radar chart and the results of segmentation
evaluation factors given in Table 18, the distinguished characteristics of this segment
can be stated as follows. Membership duration factor score for this segment was found
to be below the average (MD=-0.20) which implies that consumers in this segment are
relatively new members. In addition, recent visits factor score was also found to be a

61
little below the average (RV=-0.09) which indicates that this segment of consumers
visits the online store a little less frequently than the entire sample average.
Figure 27 - Need-based Shoppers (Radar chart)
Compared with the entire sample average, shopping rate of Need-based Shoppers was
found to be very low (SR=-0.77). However, this segment purchase very diverse type
of products which can be understood from the high-level of product diversity score
(PD=0.35). Among other segments, Need-based Shoppers are the ones who pay the
highest amount of money to the online products on average which can be seen from
their high score on price payment factor (PP=0.97). Coupon redemption rate of this
segment was found to be well below the entire sample average (CR=-0.97). When it
comes to the refund rate (RR=0.05), this segment’s score does not differentiate from
the average.
Subscription rate to receive SMS and e-mail from the company related to the
campaigns were found to be 93.8 and 66.2 percent respectively. As in other segments,
credit card storage rate in this segment is very low. That is, only 3.3 percent of
consumers saved their credit card details to online shopping system for one-click
payment option.
The variable importance chart given in Figure 28 shows how important role different
behavioral factors play in the formation of Need-based Shoppers segment. The
variable importance chart confirms what the radar chart indicated about the
characteristics of Need-based Shoppers. According to variable importance chart, while
“Average price payment” and “Product diversity rate” factors take statistically
significantly larger scores than average within this segment, “Coupon redemption rate”
and “Online shopping rate” factors take statistically significantly lower scores than
average.
-1.5
-1.0
-0.5
0.0
0.5
1.0Refund rate
Shopping rate
Productdiversity
Couponredemption
rate
Average pricepaid
Need-based Shoppers
Entire average

62
Figure 28 - Need-based Shoppers (Variable importance plot)
By considering all the points mentioned above, it makes sense to call this segment as
Need-based Shoppers. Visiting the online store less frequently, purchasing the online
products less frequently, buying more diverse type of products and redeeming less
coupons imply that consumers in this segment are more driven by their actual product
needs. More specifically, in general, this type of consumers visit online store with
specific product in mind and look for that particular item. They do not visit online store
frequently to take advantage of special discount or redeem offered discount coupons.
5.3.4 Skeptical Newcomers Skeptical Newcomers segment is composed of 16.5 percent of male and 83.5 percent
of female consumers. This segment is the one in which the percentage of male
consumers is the lowest. The average age of this segment is 32.5 years. Consumers
within this segment are mostly from Marmara (41.6%), Central Anatolia (16.4%) and
Aegean (15.1%) geographical regions (Appendix L). Decomposition of each
geographical region in terms of determined consumer segments (Figure 22) shows that
Eastern Anatolia (32.4%), Black Sea (24.0%) and Aegean (23.9%) are the top three
regions in which the size of “Suspicious Newcomers” are at the highest level.
The radar chart showing the average factors scores for Skeptical Newcomers segment
is given in Figure 29. Based on this radar chart and the results of segmentation
evaluation factors given in Table 18, the distinguished characteristics of this segment
can be stated as follows.

63
Figure 29 - Skeptical Newcomers (Radar chart)
Skeptical Newcomers segment is composed of relatively new members as membership
duration factor score for this segment was found to be below the average (MD=-0.20).
Furthermore, this type of consumers visits the online store less frequently than the
entire sample average which can be inferred from this segment’s low score on recent
visits factor (RV=-0.11). As a result of Skeptical Newcomers’ less frequent online
store visits, online shopping rate was also found to be slightly less than average for
this segment (SR=-0.11). This type of consumers purchased more diverse type of
products which can be inferred from their higher product diversity score than average
(PD=0.55). Furthermore, significantly lower average price payment factor score (PP=-
0.90) shows that when purchasing online products this segment generally prefers low-
price items. Coupon redemption rate (CR=-0.86) and free shipping usage rate (FR=-
0.28) were also found to be very low for this segment.
Skeptical Newcomers apply for the refund of the purchased products less frequently
than the entire sample average which is indicated by the lower refund rate (RR=-0.37)
than average. Low refund rate can be considered as an indication of good decision-
making characteristics of this segment. When it comes to credit card storage rate for
one-click payment option, only 2.7 percent of consumers saved their credit card details
to the online system. In order to receive information from the company related to
campaigns, while 94.6 percent of consumers subscribed to receive SMS notifications,
68.4 percent of consumers preferred e-mail.
The variable importance chart given in Figure 30 shows that all the behavioral factors
play a significant role in the formation of Skeptical Newcomers segment. According
to this chart, all factors except “Product diversity rate” generally take larger scores
than average within this segment. Two behavioral factors that contribute the most to
the formation of this segment are “Average price payment” and “Coupon redemption
rate”. These results coincide with the patterns observed in the radar chart of Skeptical
Newcomers.
-1.5
-1.0
-0.5
0.0
0.5
1.0Refund rate
Shopping rate
Productdiversity
Couponredemption
rate
Average pricepaid
Skeptical Newcomers
Entire average

64
Figure 30 - Skeptical Newcomers (Variable importance plot)
By considering all the points mentioned above, it is reasonable to call this segment as
Skeptical Newcomers. Being relatively new members, visiting the online store from
time to time, purchasing very diverse type of low-price items imply that consumers in
this segment are newcomers who tries to get accustomed to online shopping.
5.3.5 Repetitive Purchasers Repetitive Purchasers segment is composed of 20.5 percent of male and 79.5 percent
of female consumers. The average age of this is segment is 35.8 years. Consumers
within this segment are mostly from Marmara (44.7%), Central Anatolia (15.9%) and
Aegean (14.3%) geographical regions (Appendix L). Decomposition of each
geographical region in terms of determined consumer segments (Figure 22) shows that
Mediterranean (27.7%), Southeastern Anatolia (25.3%) and Aegean (24.7%) are the
top three regions in which the size of “High-loyalty Customers” are at the highest level.
Based on the radar chart (Figure 31) and the results of segmentation process given in
Table 18, the outstanding behavioral characteristics of this segment can be stated as
follows. Repetitive Purchasers segment is composed of relatively old members which
can be understood from higher than average membership duration factor score
(MD=0.11). Very high score on recent visits factor (RV=0.30) implies that among
other segments Repetitive Purchasers segment is the one that visits the online store the
most frequently.

65
Figure 31 - Repetitive Purchasers (Radar chart)
The most notable characteristic of consumers in this segment is their very high online
shopping rate which is indicated by shopping rate factor score (SR=1.06).
Furthermore, very low product diversity factor score (PD=-0.89) shows that
consumers in this segment generally shop for narrow product types. Repetitive
Purchasers do not use many coupons in their online shopping transactions which is
indicated by lower than average coupon redemption factor score (CR=-0.32). Refund
rate factor score (RR=0.19) for this segment was found to be above the average which
points to a relatively poor product related decision-making characteristics of this
segment.
As for subscriptions to receive notification from the company related to campaigns,
93.6 percent of consumers preferred SMS and 66.4 percent preferred e-mail. Among
other segments, this segment is the one in which credit card storage rate for one-click
payment option is at the highest level (5.5%).
According to variable importance chart (Figure 32), all the behavioral factors play a
significant role in the formation of Repetitive Purchasers segment. While “Online
shopping rate” and “Refund rate” factors generally take larger scores than average
within this segment, “Product diversity rate”, “Coupon redemption rate” and “Average
price payment” factors predominantly take lower scores than average. “Online
shopping rate” and “Product diversity rate” are the factors that contribute the more to
the formation of this segment. These results corresponds with the patterns observed in
the radar chart of Repetitive Purchasers.
-1.5-1.0-0.50.00.51.01.5Refund rate
Shopping rate
Productdiversity
Couponredemption
rate
Average pricepaid
Repetitive Purchasers
Entire average
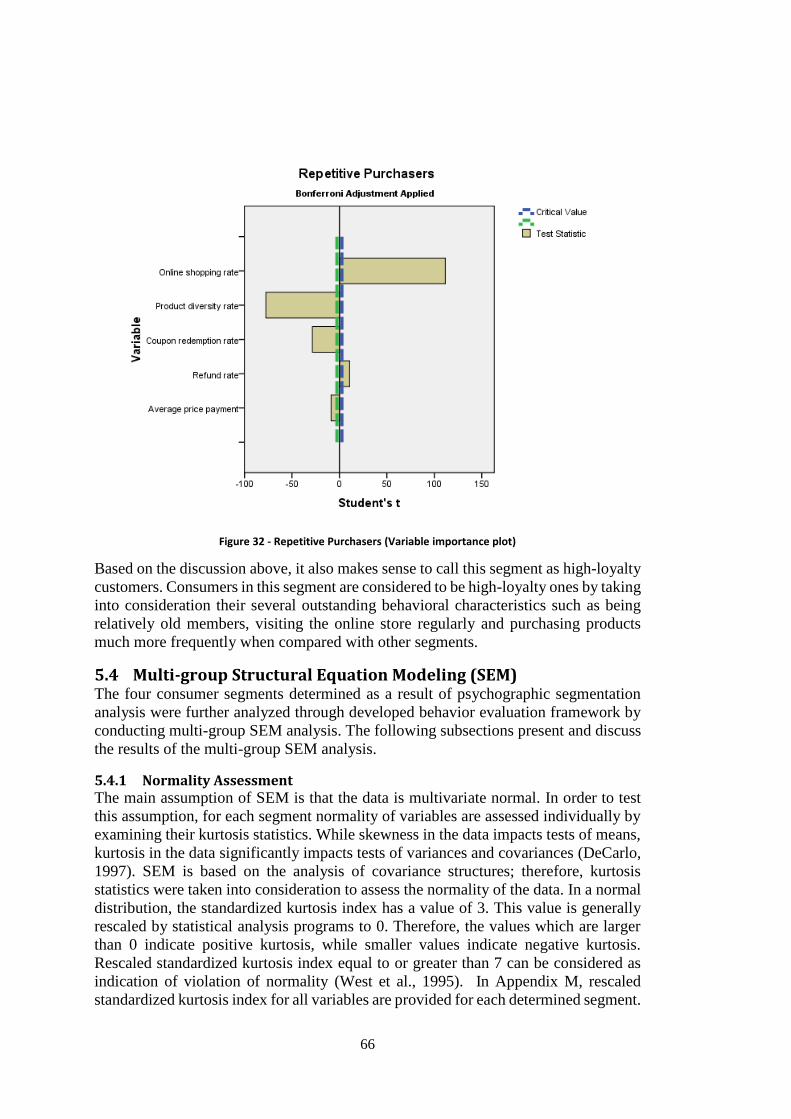
66
Figure 32 - Repetitive Purchasers (Variable importance plot)
Based on the discussion above, it also makes sense to call this segment as high-loyalty
customers. Consumers in this segment are considered to be high-loyalty ones by taking
into consideration their several outstanding behavioral characteristics such as being
relatively old members, visiting the online store regularly and purchasing products
much more frequently when compared with other segments.
5.4 Multi-group Structural Equation Modeling (SEM) The four consumer segments determined as a result of psychographic segmentation
analysis were further analyzed through developed behavior evaluation framework by
conducting multi-group SEM analysis. The following subsections present and discuss
the results of the multi-group SEM analysis.
5.4.1 Normality Assessment The main assumption of SEM is that the data is multivariate normal. In order to test
this assumption, for each segment normality of variables are assessed individually by
examining their kurtosis statistics. While skewness in the data impacts tests of means,
kurtosis in the data significantly impacts tests of variances and covariances (DeCarlo,
1997). SEM is based on the analysis of covariance structures; therefore, kurtosis
statistics were taken into consideration to assess the normality of the data. In a normal
distribution, the standardized kurtosis index has a value of 3. This value is generally
rescaled by statistical analysis programs to 0. Therefore, the values which are larger
than 0 indicate positive kurtosis, while smaller values indicate negative kurtosis.
Rescaled standardized kurtosis index equal to or greater than 7 can be considered as
indication of violation of normality (West et al., 1995). In Appendix M, rescaled
standardized kurtosis index for all variables are provided for each determined segment.
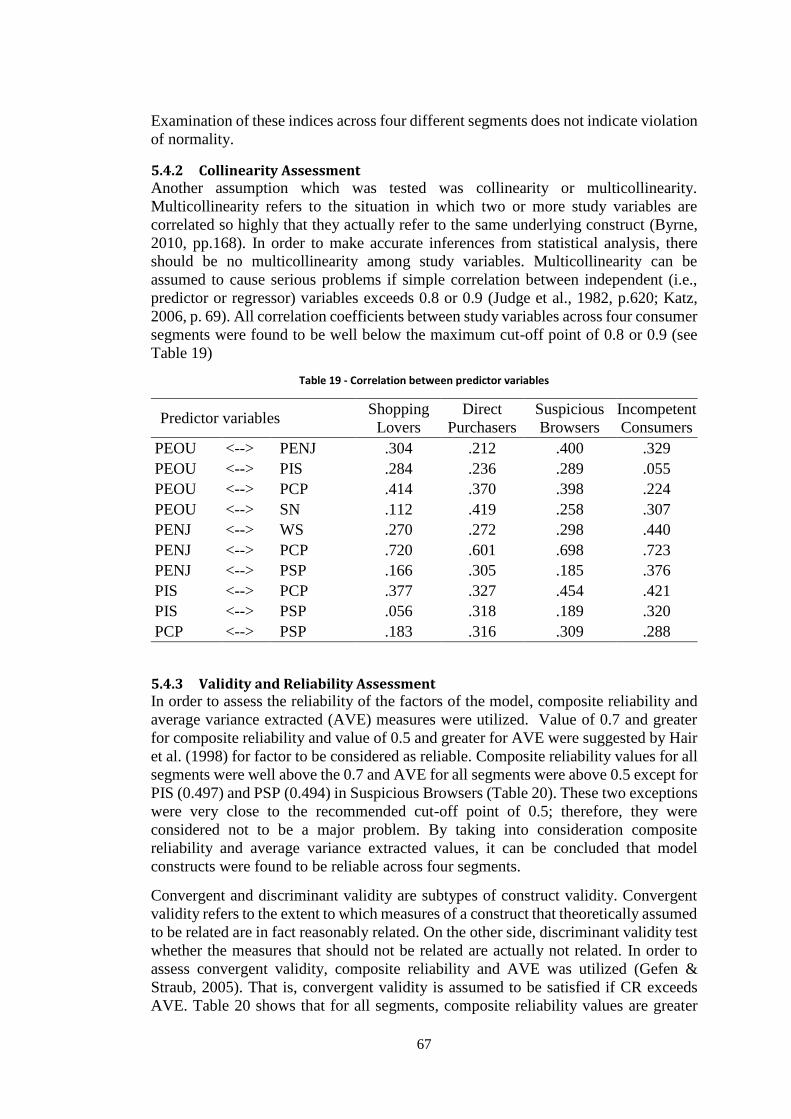
67
Examination of these indices across four different segments does not indicate violation
of normality.
5.4.2 Collinearity Assessment Another assumption which was tested was collinearity or multicollinearity.
Multicollinearity refers to the situation in which two or more study variables are
correlated so highly that they actually refer to the same underlying construct (Byrne,
2010, pp.168). In order to make accurate inferences from statistical analysis, there
should be no multicollinearity among study variables. Multicollinearity can be
assumed to cause serious problems if simple correlation between independent (i.e.,
predictor or regressor) variables exceeds 0.8 or 0.9 (Judge et al., 1982, p.620; Katz,
2006, p. 69). All correlation coefficients between study variables across four consumer
segments were found to be well below the maximum cut-off point of 0.8 or 0.9 (see
Table 19)
Table 19 - Correlation between predictor variables
Predictor variables Shopping
Lovers
Direct
Purchasers
Suspicious
Browsers
Incompetent
Consumers
PEOU <--> PENJ .304 .212 .400 .329
PEOU <--> PIS .284 .236 .289 .055
PEOU <--> PCP .414 .370 .398 .224
PEOU <--> SN .112 .419 .258 .307
PENJ <--> WS .270 .272 .298 .440
PENJ <--> PCP .720 .601 .698 .723
PENJ <--> PSP .166 .305 .185 .376
PIS <--> PCP .377 .327 .454 .421
PIS <--> PSP .056 .318 .189 .320
PCP <--> PSP .183 .316 .309 .288
5.4.3 Validity and Reliability Assessment In order to assess the reliability of the factors of the model, composite reliability and
average variance extracted (AVE) measures were utilized. Value of 0.7 and greater
for composite reliability and value of 0.5 and greater for AVE were suggested by Hair
et al. (1998) for factor to be considered as reliable. Composite reliability values for all
segments were well above the 0.7 and AVE for all segments were above 0.5 except for
PIS (0.497) and PSP (0.494) in Suspicious Browsers (Table 20). These two exceptions
were very close to the recommended cut-off point of 0.5; therefore, they were
considered not to be a major problem. By taking into consideration composite
reliability and average variance extracted values, it can be concluded that model
constructs were found to be reliable across four segments.
Convergent and discriminant validity are subtypes of construct validity. Convergent
validity refers to the extent to which measures of a construct that theoretically assumed
to be related are in fact reasonably related. On the other side, discriminant validity test
whether the measures that should not be related are actually not related. In order to
assess convergent validity, composite reliability and AVE was utilized (Gefen &
Straub, 2005). That is, convergent validity is assumed to be satisfied if CR exceeds
AVE. Table 20 shows that for all segments, composite reliability values are greater

68
than AVE which means that convergent validity was satisfied. In order to assess
discriminant validity correlation between exogenous variables were analyzed . In the
literature, a between-factor correlation has been used quite commonly to assess the
discriminant validity. Discriminant validity ensures that there exists low correlation
between factors that assumed to be different (Straub, 1989). Low correlation rate
among different constructs is an indication of the fact that each construct differs from
the other (Kline, 1998). Table 19 shows that the majority of correlation factors are well
below .75 which implies that discriminant validity can be assumed.
Table 20 - Construct reliability assessment
Factors Composite reliability Variance extracted
Shop.
Lov.
Direct
Purch.
Susp.
Brow.
Incomp.
Cons.
Shop.
Lov.
Direct
Purch.
Susp.
Brow.
Incomp.
Cons.
ATT 0.845 0.877 0.850 0.825 0.651 0.706 0.656 0.613
PEOU 0.837 0.888 0.773 0.792 0.723 0.800 0.630 0.656
PENJ 0.822 0.867 0.848 0.821 0.608 0.686 0.652 0.606
PU 0.735 0.783 0.758 0.799 0.582 0.643 0.610 0.665
PIS 0.830 0.849 0.829 0.867 0.501 0.533 0.497 0.568
PCP 0.856 0.861 0.861 0.876 0.678 0.681 0.679 0.705
PSP 0.749 0.748 0.736 0.778 0.514 0.507 0.494 0.540
INT 0.838 0.853 0.820 0.834 0.635 0.660 0.604 0.628
5.4.4 The Baseline Model The first step in multi-group SEM analysis is the determination of the baseline model.
Determination of the baseline model is not subject to the between-group constraints;
therefore, its data analysis can be carried out separately for each determined consumer
segments (Byrne, 2010, p.200). Single-group analyses which were carried out on each
segment resulted in a hypothesized model in which 27 items were retained to assess
each segments’ behavioral intention toward B2C e-commerce.
The hypothesized model is depicted in Figure 33. The hypothesized model which is
given in Figure 33 was obtained after several re-specifications and re-estimations
based on modification indices which were supplied by SPSS AMOS version 22 for
each determined consumer segment. This hypothesized model is called final baseline
model and it is used in equivalence tests across four determined consumer segments.
The main objective of confirmatory factor analysis (CFA) is to assess the extent to
which the observed variables are connected to their respective underlying latent factors
(Byrne, 2010, p.6). For that purpose, the strength of regression paths (i.e., factor
loadings) from latent factors to their respective observed variables were analyzed.
Appendix N shows that for each consumer segment all factor loading are highly
significant with p<0.001.

69
Figure 33 - CFA (Baseline Model)

70
Table 21 provides the goodness-of-fit statistics of baseline model for each determined
consumer segment. Provided goodness-of-fit indices are as follows: CFI (Comparative
Fit Index), TLI (Tucker-Lewis Index) and RMSEA (Root Mean Square of
Approximation). In reviewing these fit indices for each consumer segments, it can be
seen that the hypothesized baseline model was considerably well-fitting to each given
segment as indicated by a CMIN/DF values were well below the cutoff value of 3. In
addition, CFI ranging from 0.956 to 0.970 was an indication of well-fitting model.
Furthermore, RMSEA values that range from 0.048 to 0.052 were within the
recommended range of acceptability (< .05 to .08) (Byrne, 2010, pp.176). To sum up,
the review of the several fit indices showed that final baseline model was the same for
each consumer segment.
Table 21 - Goodness-of-Fit Statistics of Baseline Model
Shopping
Lovers
Direct
Purchasers
Suspicious
Browsers
Incompetent
Consumers
X2 332.731 324.468 375.163 352.374
df 219 219 219 219
CMIN/DF 1.519 1.482 1.713 1.609
CFI 0.962 0.970 0.956 0.960
TLI 0.952 0.962 0.945 0.95
RMSEA 0.048 0.045 0.052 0.049
RMSEA 90% CI .038 - .059 .034 - .055 .043 - .061 .040 - .059
5.4.5 The Configural Model Configural model can be considered as the starting point for invariance tests. The main
objective of configural model is to assess the extent to which the same number of
factors most properly represents the data for given number of groups. While testing
for multigroup equivalence, no equality constraints are enforced on any parameters of
the model. That is, exactly the same parameters which were estimated in the baseline
model for each consumer segment are again estimated in multi-group model. This
model is called the configural model and the process is called configural equivalence
test. Group differences in terms of items or the factor covariances cannot be made at
this stage as there are no equality constraints on any parameters in the model.
Multigroup model enables equivalence tests to be conducted across the four consumer
segments simultaneously. That is, parameters are estimated for four different segments
at the same time. The fit of this configural model provides the baseline value which
can later be compared with follow-up (i.e., constrained) models (Byrne, 2010, p.209).
In multigroup model analysis, only one set of fit statistics is provided for overall model
fit. Similar to single-group analysis results, goodness-of-fit results of this multigroup
analysis are expected to exhibit a good fit to the data for four different segments.
Multigroup model testing for configural equivalence resulted in the following
goodness-of-fit statistics: 2= 1384.741 with 876 degree of freedom,
CMIN/DF=1.581, CFI= 0.962, TLI=0.952 and RMSEA=0.024. By taking into
consideration these goodness-of-fit statistics, it can be stated that the hypothesized
multigroup model of consumer behavior evaluation structure is considerably well-
fitting across four determined consumer segments.

71
5.4.6 Testing for Measurement and Structural Invariance In configural equivalence testing, the main objective was to see whether the number
of factors and the pattern of their structure exhibit similarity across four different
consumer segments. In contrast, the main objective of measurement and structural
invariance testing is to assess whether the parameters in the measurement and
structural components of the model are invariant across the four segments. Configural
model creates a baseline against which all follow-up tests (i.e., measurement,
structural) for invariance are compared. Non-invariance is assumed if total change in
the value of certain goodness-of-fit statistics (e.g., CFI, RMSEA) is statistically
significant. The main steps involved in invariance testing are as follows. In the first
step, namely measurement model, factor loading are constrained to be equal and a
model is run. If total change in the value of goodness-of-fit indices provides enough
evidence that groups are equivalent in terms of factor loadings then the second step is
taken. In the second step, namely structural model, factor loading along with factor
variances and covariances are constrained equal and model is run. Once again total
change in the value of goodness-of-fit indices is checked to conclude whether groups
are equivalent in terms of variance and covariance structures.
Goodness-of-fit statistics for multigroup invariance testing is provided in Table 22.
Nested testing hierarchy suggested by (Bollen, 1989) was utilized in this study. While
assessing the invariance of factor loading (i.e., measurement invariance), Model A,
configural baseline model which is free from any constraints was compared with
Model B in which only factor loadings were constrained to be equal. On the other
hand, to assess equivalence of variance and covariance structure (i.e., structural
invariance) across groups, Model B was compared with Model C.
Table 22 - Goodness-of-fit indices of multiple-group CFA invariance testing
Model A Model B Model C
X2 1384.741 1472.318 1736.539
df 876 916 1024
p .000 .000 .000
CMIN/DF 1.581 1.607 1.696
CFI .962 .958 .947
TLI .952 .950 .943
RMSEA .024 .025 .027
Model A: configural model (unconstrained baseline model).
Model B: measurement model (factor loadings are constrained to be equal).
Model C: structural model (factor loadings, factor variances, and factor covariances are constrained
to be equal).
Cheung and Rensvold (2002) and Chen (2007) recommended using CFI, TLI and
RMSEA in assessing the measurement and structural invariance. Cheung and
Rensvold (2002) recommended that in order to ensure invariance across groups, total
change in the value of CFI (ΔCFI) should not exceed .01. Chen (2007) stated that a
change of .01 or more in CFI (ΔCFI) and TLI (ΔTLI), and a change of .015 or more in
RMSEA (ΔRMSEA) are indications of non-invariance across groups. The CFI
difference between Model A and Model B was .004 and this value met Cheung and
Rensvold’s (2002) recommended benchmark point of 0.01 for CFI change. The
changes in the value of TLI and RMSEA were .001 and 0.002 respectively and these
changes met the recommended benchmark points proposed by Chen (2007). These

72
changes in the value of CFI, TLI and RMSEA implied that the factor loadings were
the same for the four determined consumer segments. The TLI and RMSEA difference
between Model B and Model C were .007 and .002 respectively. These differences
met the recommended benchmarks of Chen (2007) and implied that factor variance
and covariance structure were invariant across four consumer segments.
5.4.7 Testing for the Invariance of a Causal Structure Measurement and structural invariance tests showed that factor loadings and variance
and covariance structures were the same across four determined consumer segments.
After ensuring measurement and structural invariance across groups, the next step
involves testing for the invariance of causal paths across four segments. This test
ensures that strength of relationships among model factors holds across four
determined consumer segments. Initially, unconstrained model, Model A, was
estimated without imposing any constraints on any model parameters. Later,
constrained model, Model B, was estimated by imposing equality constraint on all
causal paths across four consumer segments. Goodness-of-fit statistics of
unconstrained Model A were above the recommended thresholds (see Table 23). That
is, CFI>.95, TLI>.95 and RMSEA<.05 imply that the current structural model applies
well across four consumer segments. The difference of CFI (ΔCFI) between Model A
and Model B were found to be .003 (i.e., less than .01) which means that causal path
structure were the same across four consumer segments.
Table 23 - Goodness-of-fit indices of multigroup SEM analysis for causal structure
Model A Model B
X2 1404.192 1527.759
df 888 981
p .000 .000
CMIN/DF 1.579 1.557
CFI .962 .959
TLI .952 .954
RMSEA .024 .024 Model A: unconstrained model.
Model B: causal (i.e., structural) paths are constrained to be equal.
5.4.8 Hypotheses Testing This research makes use of unstandardized coefficients (i.e., unstandardized regression
weights) to discuss the results of the study. When carrying out comparisons across
different groups, the variances of the variables may exhibit differences. In this
situation, using unstandardized coefficients are more meaningful as they are expressed
in terms of construct’s scale (i.e., its variance) and enable to carry out comparisons
across various groups (Hair et al., 1998). On the other hand, standardized coefficients
are expressed in terms of standard deviation units and they are useful in determining
the relative importance of variables in the structural model. However, standardized
coefficients are sample specific which makes it meaningless in multigroup
comparisons. Therefore, in the structural model given in Figure 34, only
unstandardized coefficients and their significance levels were provided. While
unstandardized coefficients and significance levels were provided on arrows, squared
multiple correlations were given inside the latent variables. Squared multiple
correlation shows the percent of variance explained in dependent variable by
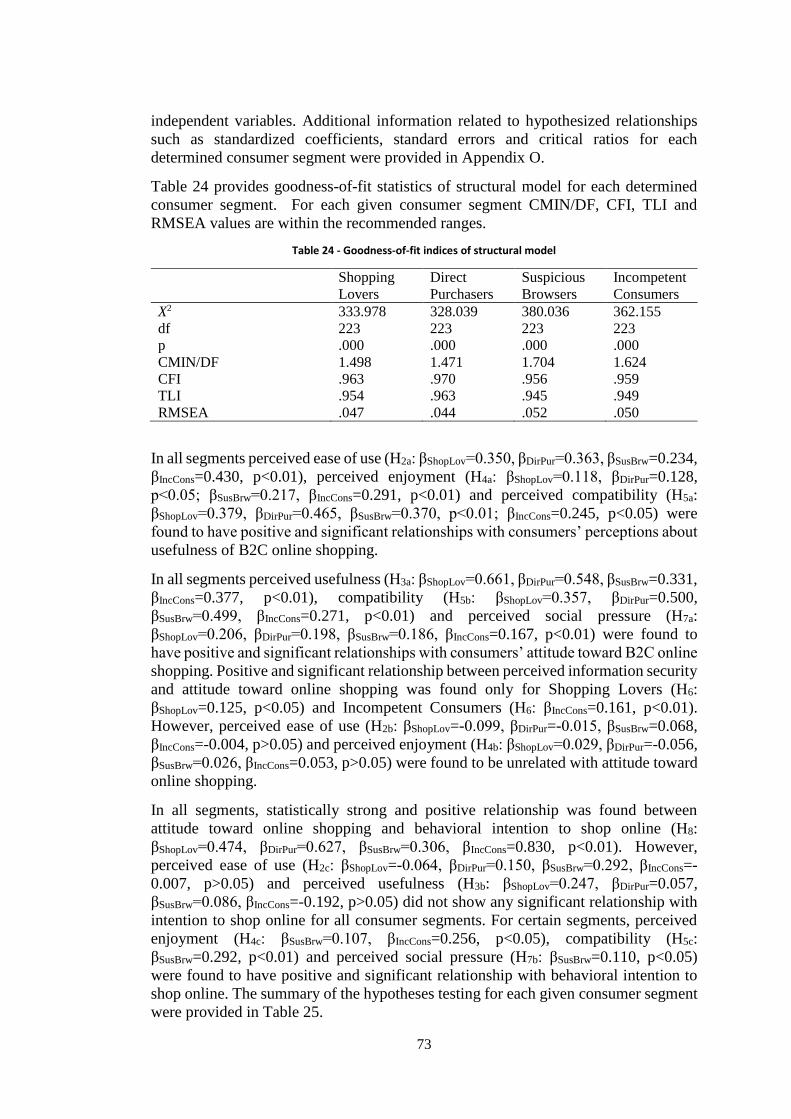
73
independent variables. Additional information related to hypothesized relationships
such as standardized coefficients, standard errors and critical ratios for each
determined consumer segment were provided in Appendix O.
Table 24 provides goodness-of-fit statistics of structural model for each determined
consumer segment. For each given consumer segment CMIN/DF, CFI, TLI and
RMSEA values are within the recommended ranges.
Table 24 - Goodness-of-fit indices of structural model
Shopping
Lovers
Direct
Purchasers
Suspicious
Browsers
Incompetent
Consumers
X2 333.978 328.039 380.036 362.155
df 223 223 223 223
p .000 .000 .000 .000
CMIN/DF 1.498 1.471 1.704 1.624
CFI .963 .970 .956 .959
TLI .954 .963 .945 .949
RMSEA .047 .044 .052 .050
In all segments perceived ease of use (H2a: βShopLov=0.350, βDirPur=0.363, βSusBrw=0.234,
βIncCons=0.430, p<0.01), perceived enjoyment (H4a: βShopLov=0.118, βDirPur=0.128,
p<0.05; βSusBrw=0.217, βIncCons=0.291, p<0.01) and perceived compatibility (H5a:
βShopLov=0.379, βDirPur=0.465, βSusBrw=0.370, p<0.01; βIncCons=0.245, p<0.05) were
found to have positive and significant relationships with consumers’ perceptions about
usefulness of B2C online shopping.
In all segments perceived usefulness (H3a: βShopLov=0.661, βDirPur=0.548, βSusBrw=0.331,
βIncCons=0.377, p<0.01), compatibility (H5b: βShopLov=0.357, βDirPur=0.500,
βSusBrw=0.499, βIncCons=0.271, p<0.01) and perceived social pressure (H7a:
βShopLov=0.206, βDirPur=0.198, βSusBrw=0.186, βIncCons=0.167, p<0.01) were found to
have positive and significant relationships with consumers’ attitude toward B2C online
shopping. Positive and significant relationship between perceived information security
and attitude toward online shopping was found only for Shopping Lovers (H6:
βShopLov=0.125, p<0.05) and Incompetent Consumers (H6: βIncCons=0.161, p<0.01).
However, perceived ease of use (H2b: βShopLov=-0.099, βDirPur=-0.015, βSusBrw=0.068,
βIncCons=-0.004, p>0.05) and perceived enjoyment (H4b: βShopLov=0.029, βDirPur=-0.056,
βSusBrw=0.026, βIncCons=0.053, p>0.05) were found to be unrelated with attitude toward
online shopping.
In all segments, statistically strong and positive relationship was found between
attitude toward online shopping and behavioral intention to shop online (H8:
βShopLov=0.474, βDirPur=0.627, βSusBrw=0.306, βIncCons=0.830, p<0.01). However,
perceived ease of use (H2c: βShopLov=-0.064, βDirPur=0.150, βSusBrw=0.292, βIncCons=-
0.007, p>0.05) and perceived usefulness (H3b: βShopLov=0.247, βDirPur=0.057,
βSusBrw=0.086, βIncCons=-0.192, p>0.05) did not show any significant relationship with
intention to shop online for all consumer segments. For certain segments, perceived
enjoyment (H4c: βSusBrw=0.107, βIncCons=0.256, p<0.05), compatibility (H5c:
βSusBrw=0.292, p<0.01) and perceived social pressure (H7b: βSusBrw=0.110, p<0.05)
were found to have positive and significant relationship with behavioral intention to
shop online. The summary of the hypotheses testing for each given consumer segment
were provided in Table 25.

74
1
Figure 34 - Structural Equation Model
1 Unstandardized path coefficients are given on the arrows for four consumer segments. Squared
multiple correlations are given inside the latent variables. Path coefficient and squared multiple
correlations are given in the following order: Shopping Lovers, Direct Purchasers, Suspicious Browsers,
Incompetent Consumers. **p<0.01, *p<0.05.
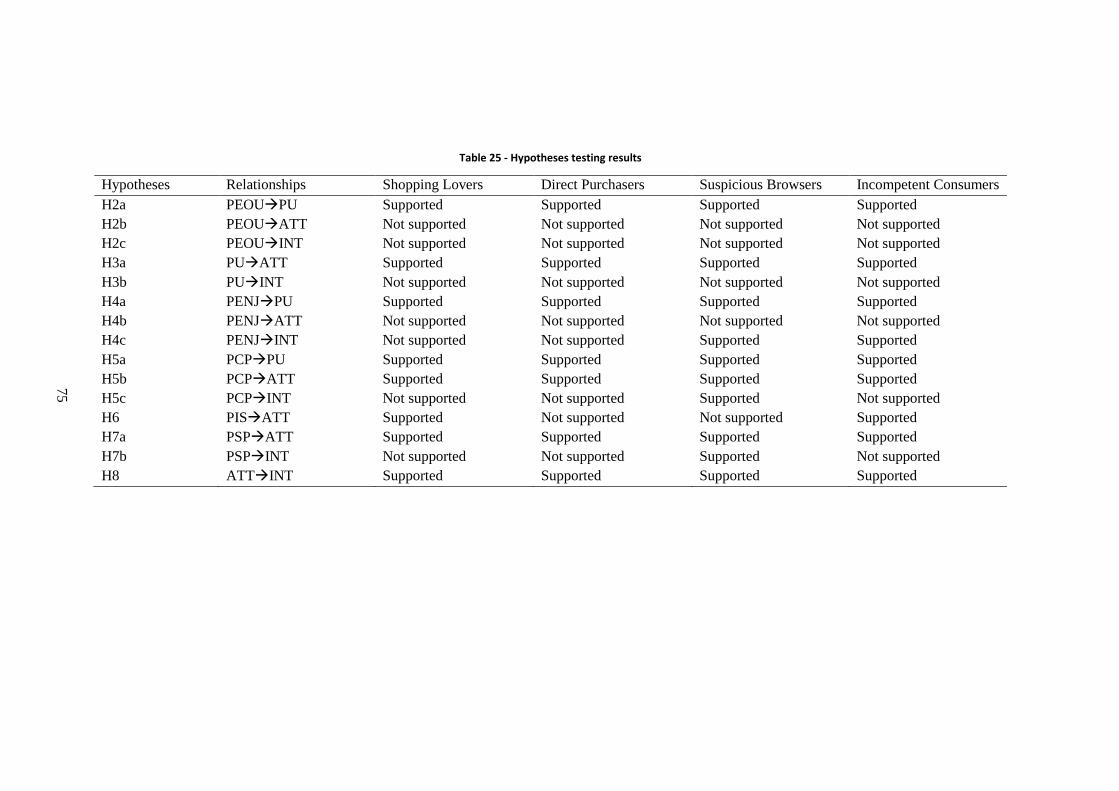
75
Table 25 - Hypotheses testing results
Hypotheses Relationships Shopping Lovers Direct Purchasers Suspicious Browsers Incompetent Consumers
H2a PEOUPU Supported Supported Supported Supported
H2b PEOUATT Not supported Not supported Not supported Not supported
H2c PEOUINT Not supported Not supported Not supported Not supported
H3a PUATT Supported Supported Supported Supported
H3b PUINT Not supported Not supported Not supported Not supported
H4a PENJPU Supported Supported Supported Supported
H4b PENJATT Not supported Not supported Not supported Not supported
H4c PENJINT Not supported Not supported Supported Supported
H5a PCPPU Supported Supported Supported Supported
H5b PCPATT Supported Supported Supported Supported
H5c PCPINT Not supported Not supported Supported Not supported
H6 PISATT Supported Not supported Not supported Supported
H7a PSPATT Supported Supported Supported Supported
H7b PSPINT Not supported Not supported Supported Not supported
H8 ATTINT Supported Supported Supported Supported
75

76
77
CHAPTER VI
DISCUSSION AND CONCLUSION
6.1 Practical Business Implications In this study, psychographic segmentation analysis was conducted on the basis of
“Internet Shoppers Lifestyle Scale” of Swinyard and Smith (2003) and on three
different themes of Internet usage. “Internet Shoppers Lifestyle Scale” is a very robust
scale which has a cross-cultural validation. In psychographic segmentation analysis
self-reports of 1027 volunteer student participants were utilized. The consumer
segments determined as a result of psychographic segmentation analysis were further
analyzed through developed behavior evaluation model by conducting multi-group
SEM analysis. Testing the developed study model on each determined segment helped
to understand for a particular segment which factors influence consumers’ attitudes
and behavioral intentions toward online shopping.
In addition to psychographic segmentation analysis, behavioral segmentation analysis
was also carried out in this study. In order to reinforce the findings of psychographic
segmentation analysis, this study carried out behavioral segmentation analysis which
was based on online consumers real shopping behaviors instead of their self-reports.
That is, behavioral segmentation analysis was conducted on the basis of online
shopping related behavioral factors which were extracted from real e-commerce
transaction records of 10.000 unique online customers. Findings of this research have
practical implications to the online retailers which are discussed in detail in the
following subsections.
6.1.1 Psychographic Segments As a result of psychographic segmentation analysis, four different online consumer
segments were determined. These segments are Shopping Lovers, Direct Purchasers,
Suspicious Browsers and Incompetent Consumers. Each of these determined
consumer segment was found to have unique characteristics that distinguished it from
other segments. In addition to differences, there are also similarities between different
consumer segment in terms of their perceptions about online shopping. The following
paragraphs discuss each segment separately.
78
Shopping Lovers are very important to online retailers as they are the main source of
profits. This segment of consumers enjoys spending money on shopping whether it is
in online or physical stores. Among other segments, this segment is the one with the
highest rate of e-commerce transaction. Shopping Lovers perceive online stores to be
very secure and convenient in terms of purchasing products. This type of consumers
also thinks that online stores have better prices and offers than physical stores.
Shopping Lovers also enjoy spending time on online windows shopping which is an
act of looking at online products with no intent to buy. Most probably, this type of
consumers’ habit of online window shopping lead them to make impulse purchases.
Impulse purchase refers to the buying of products or services without planning to do
so in advance. Online retailers can further increase the impulse shopping rate of this
segment by making necessary modifications to their online stores. Enhancing online
stores with product recommender systems which make suggestions to customers based
on their shopping behavior can be very effective in increasing the impulse shopping
rate of this segment. For this segment, especially collaborative filtering type of
recommender system can be very effective as study of Hostler et al. (2011) showed
that collaborative filtering recommender systems increase customers’ satisfaction with
the online store and it also increases the rate of unplanned online purchases. Rather
than making random product suggestions, in collaborative filtering recommender
systems, items are suggested to customers based on the ratings given by other
customers with similar tastes. Furthermore, improvements made to online store design
and navigation functions were found to influence impulse buying behavior of online
customers (Floh and Madlberger, 2013). Compared to textual information, image
interactivity, graphical information and animation within online stores can also
increase the occurrences of impulse purchases (Fiore and Jin, 2003; Adelaar et al.,
2003). The above mentioned findings show that Shopping Lovers already have strong
favorable attitudes toward online shopping. That’s why they tend to purchase more
and more products and services online. Online retailers are recommended to work
toward maintaining and even strengthening the positive impressions in the mind of this
type of consumers toward online shopping. Shopping Lovers spend too much time on
the Internet to watch videos, listen music, surf on social networks and play games. For
this segment, entertainment and social networking channels can be very effective in
reaching this type of consumers to inform them about products, services and
promotions.
After the Shopping Lovers, Direct Purchasers are the second profitable segment for
online retailers as their online shopping frequency is quite high. In contrast to
Shopping Lovers, this segment of consumers does not like shopping at physical stores.
Therefore, they mostly prefer online stores to physical stores in meeting their shopping
needs. Consumers in this segment are good at finding what they want on online stores
and they know well how to place online orders. They also are not concerned about the
security of their private and financial information in online transactions. In contrast to
Shopping Lovers, Direct Purchasers do not have a habit of online window shopping.
This segment of consumers most of the time visit online shopping stores with the aim
of purchasing products or services which they have previously decided on. That is,
impulse online purchases (i.e., unplanned purchases) are not among the behavioral
characteristics of this segment. Therefore, rather than encouraging Direct Purchasers
to make impulse purchases, online retailers are recommended to leave good impression
on them through provided services. Online retailers can improve content, design and
functionality of their websites in order to satisfy this type of customers. From content
79
perspective, higher level of information quality, broad product variety, from functional
perspective website customization, ease of searching process, ease of transaction
processing and from design perspective, good visual aspects, ambience, atmosphere
can increase online consumers’ satisfaction levels and loyalty intentions toward online
retailers (Liu et al., 2008; Ha, 2012; Mummalaneni, 2005; Kim and Niehm, 2009;
Clemes et al., 2014; Chang and Chen, 2008; Jiang et al., 2013; Tsai and Huang, 2007).
Direct Purchasers spend very little time on online entertainment and social networking
platforms. Therefore, for this segment utilization of entertainment and social
networking platforms as an advertisement channel will not bring desired effects. This
segment generally use news portals, search engines and email services on the Internet.
Therefore, for this segment, online retailers are recommended to focus on such online
services to advertise their products, services and inform customers about promotions.
Suspicious Browsers are the group of consumers who generally tend to use online
stores for looking at offered products or learning about latest trends in the market but
not for making online purchases. Even though consumers in this segment perceive
online stores to be convenient in terms of shopping, their certain types of online
shopping related concerns prevent them from purchasing products from online stores.
Among other segments, Suspicious Browsers segment is the one that concerns most
about the security of their financial and personal information on online shopping
platforms. Furthermore, this segment of consumers also have major concerns related
to delivery and refund process of products purchased online. In a survey study
conducted by Huseynov and Yıldırım (2016b), it was found that privacy of personal
information and security of financial information are among the major concerns of the
respondents with using the Internet. In this survey study respondents were also asked
what would convince them to make online purchases and among the major driving
factors there were security of personal and financial information, refund guarantee and
on-time product delivery. In the same survey study, majority of respondents also
reported that they will not consider shopping online if there is no refund guarantee and
if there is no free shipping service available for returned items. In the light of above
mentioned findings, several recommendations can be made to online retailers so that
they can increase the online shopping frequency of Suspicious Browsers. Online
retailers are recommended to take all necessary measures to protect the privacy of
personal information and security of financial transactions of their customers in their
online shopping platforms and they are also advised to inform customers about how
their privacy and security are being protected. In addition, online retailers are advised
to put necessary security and privacy seals in their online stores, as these seals were
found to increase consumers’ trust levels in online retailers (Huseynov and Yıldırım,
2016b). Online retailers are also advised to provide money-back guarantee if buyers
are not satisfied with purchased products and they are urged to meet the shipping
charges of returned products. From advertisement point of view, online retailers can
utilize news portals, search engines, email services, entertainment portals and social
networking platforms as this group of consumers were found to spend more time on
such services on the Internet.
Incompetent Consumers are the group of consumers whose online shopping rate are
very low. This group of consumers are not good at finding what they want on online
stores, they do not know much about using online stores and they perceive online
product ordering process to be hard to understand and use. In contrast to Shopping
Lovers and Suspicious Browsers, this group of consumers do not even use the online

80
stores for just looking at offered products without purchasing intent. According to
them online stores do not provide convenience in term of shopping. Incompetent
Consumers also worried about their privacy and security in online shopping platforms.
Consumers in this group tend to shop more at physical stores mainly because they like
the energy and helpfulness of physical stores. They also enjoy shopping with their
friends at physical stores. Shopping with their friends in physical stores enable them
to ask for advice on products they want to purchase. Based on the above mentioned
behavioral characteristics of this segment, several recommendations can be made to
online retailers for attracting this group of consumers to online stores. Online retailers
are advised to make this group of consumers feel that their privacy and security are
protected in their online stores. Online retailers can address difficulties that
Incompetent Consumers encounter while searching and ordering online products by
integrating knowledge-based product recommender systems to their online stores. In
such intelligent systems, customers specify their needs and the system searches the
database and shows the most suitable products to the customers. In such systems, there
exist continuous interaction between customer and system until the customer finishes
his or her order. Since this group of consumers enjoy shopping with their friends,
online retailers can provide the same experience to this group of consumers by
enhancing their stores with collaborative shopping functions. Collaborative shopping
functions create an environment where customers can share their shopping experience
with friends. By using such functions, customers can view products and chat about
brands, products and services (Laudon and Laudon, p426). This segment of consumers
generally spend their time on entertainment and social networking platforms on the
Internet. Therefore, for this segment online retailers are advised to consider such online
services as an advertisement channels. Summary of the practical business implications
for four online consumer segments that were identified as a result of psychographic
segmentation analysis is provided in Table 26.
Behavior evaluation model developed in this study was tested on each determined
consumer segment in order to see which factors influence different consumer
segments’ attitudes and behavioral intentions toward online shopping. Results showed
that in all segments positive attitudes toward online shopping play an important role
in the formation of online shopping intention. Therefore, if online retailers can develop
positive attitudes in the mind of consumers toward online shopping, they can also
increase the online shopping rate of these consumers. This research also presented
interesting findings related to the determinants of attitude toward online shopping. The
results showed that in all segments, consumers’ perceptions about usefulness of online
shopping, compatibility of online shopping with consumers’ lifestyle and perceived
social pressure to engage in online shopping are positively related to formation of
favorable attitudes toward online shopping. In Shopping Lovers and Incompetent
Consumers segment, perceived information security was found to be positively related
with consumers’ attitudes toward online shopping. That is, consumers in these two
segments form positive attitude toward online shopping when they believe that online
stores are secure for conducting online transactions. However, in Direct Purchasers
and Suspicious Browsers segments perceived information security was not found to
have any influence on consumers’ attitudes toward online shopping. In all segments,
factors positively influence consumers’ perceptions about usefulness of online
shopping are perceived ease of online stores’ use, perceived enjoyment and perceived
compatibility of online shopping with consumer’s existing values and lifestyle.

81
It was also interesting to find that in different consumer segments, there exist factors
(i.e., other than attitude) that directly influence consumers’ behavioral intention to
shop online. In Suspicious Browsers and Incompetent Consumers segments, perceived
enjoyment was found to be a significant predictor of online shopping intention.
Perceived compatibility of online shopping with consumers existing lifestyle was
found to be a significant predictor of online shopping intention in Suspicious Browsers
segment. Perceived social pressure was found to have significant effect in the
formation of intention to shop online in Suspicious Browsers segment. By
disseminating positive word-of-mouth messages through social networks and
spreading positive impressions through popular press can be very effective in
increasing the online shopping intention of this segment.

82
Table 26 - Practical Business Implications (Psychographic Segments)
PSYCHOGRAPHIC ONLINE CONSUMER SEGMENTS
Shopping Lovers Direct Purchasers Suspicious Browsers Incompetent Consumers
SIZE 22.3% 25.1% 27.2% 25.4%
E-COMMERCE
EXPERIENCE 98.7% 97.7% 91.8% 68.6%
GENDER
DOMINATION
Female
Male
Female
Female
SEGMENT’S
PROFITABILITY
Very high
High
Medium
Low
SEGMENT’S
MAIN GOALS
Enjoy shopping
Meet specific needs
Window Shopping
No major goals
SEGMENT’S
MAIN CONCERNS
No major concerns
Out-of-stock
Privacy & Security
How to use; Privacy & Security
MARKETING
COSTS
Low
Medium
High
Very high
ADVERTISEMENT
CHANNELS
*Entertainment portals
*Social networks
*News portals
*Search engines
*Email services
*News portals
*Search engines
*Email services
*Entertainment portals
*Entertainment portals
*Social networks
82

83
*Social networks
RETAILER’S
PRIMARY FOCUS
*Maintain or strengthen
existing good relationships
*Convert to loyal
customers
*Reduce distrust level in
online shopping
*Educate on how to place online
orders
* Reduce distrust level in online
shopping
RETAILER’S
PRIMARY
ACTION
*Develop positive attitudes
in the mind of consumers
toward online shopping
*Enhance the security
features of e-store
*Further reinforce the
loyalty levels
*Develop effective loyalty
programs
*Give customers advanced
access to new products,
special sales coupons and
free items.
*Stimulate impulse
purchases
*Install collaborative
filtering recommender
system
*Improve online store’s
design and navigation
functions
*Develop positive
attitudes in the mind of
consumers toward online
shopping
*Leave good impression
through provided services
*Solve the out-of-stock
problems
*If possible implement
Just-in-time (JIT)
inventory strategy
*Increase information
quality and product variety
*Improve e-store
customization functions,
searching process and
transaction processing
*Improve e-store’s visual
aspects, ambience and
atmosphere
*Develop positive attitudes
in the mind of consumers
toward online shopping
*Spreading positive
impressions through social
media and popular press.
*Take measures to
overcome privacy and
security fears
*Inform customers about
how their privacy and
security are being protected
*Put necessary security and
privacy seals in online
stores
*Simplify and ease the
refund process
*Provide money-back
guarantee
*Meet the shipping charges
of returned products
*Develop positive attitudes in the
mind of consumers toward online
shopping
*Take measures to overcome
privacy and security fears
*Make this segment feel secure
while shopping online.
*Simplify online product searching
and ordering process
*Integrate knowledge-based
product recommender systems to
online store
*Enhancing online stores with
collaborative shopping functions
*Create an environment where
customers can share their shopping
experience with friends
*Synchronous or asynchronous
communications tools (e.g., live
chat or electronic mail
communication with customer
representatives)
83
84
6.1.2 Behavioral Segments
As a result of behavioral segmentation analysis, five different online consumer
segments were determined. These segments are Opportunist customers, Transient
customers, Need-based shoppers, Skeptical newcomers and Repetitive purchasers.
Each determined consumer segment was found to have unique characteristics that
differentiated it from other segments.
Opportunist customers regularly visit and shop at online store. They tend to take
advantage of discount coupons and free shipping offers during their online purchases.
In order to increase the online shopping frequency of Opportunist customers, free
shipping offers and discount coupons can be very effective incentives. Product refund
rate of Opportunist customers was also found to be high which indicates their poor
decision-making characteristic in online product selection. Integration of intelligent
shopping tools to online stores can help these customers improve the decision-making
process as such tools were found to significantly improve consumers’ decision quality
and product selection process while shopping online (Haubl and Murray, 2006;
Huseynov et al., 2016).
Transient customers segment is the largest segment in size which makes it worthwhile
to go after. Transient customers were found to be coupon-prone customers who redeem
a relatively large number of discount coupons. Transient customers’ online shopping
rate is low but their discount coupon redemption rate is high which means that most of
their online product purchases were triggered by offered coupons. Promotional
discounts and attractive discount coupons can play an important role in driving these
consumers to the retailer’s online store. However, they can be easily lost to competitors
who offer similar or better promotions. For this segment, it is important to identify
customers who can be persuaded by promotions and discount coupons to make
incremental purchases and become frequent visitors of online store.
Need-based shoppers purchase very diverse types of online products. This type of
customers are driven by a specific product need. They visit the online store with a
specific product in their minds and look whether they can have that need filled in a
better manner. Need-based shoppers generally purchase very diverse type of products
which are very high in price. Customers usually get worried while purchasing high
price items from the Internet due to several reasons. In a survey study, majority of the
respondents stated that while shopping online, they were concerned that they might
not get what they actually ordered and the product they purchased might get lost on
delivery (Huseynov and Yıldırım, 2016b). Probably, consumers in this segment prefer
purchasing high price items from online store due to perceived benefits of online
shopping such as shopping convenience, broader product selection, attractiveness of
prices and etc. These perceived benefits were found to be positively correlated with
the amount of money spent online (Forsythe et al., 2006). Therefore, broad product
selection, competitive prices and timely shipping can be good strategies to prevent this
type of customers from switching to competitors. Discount coupons redemption rate
of Need-based shoppers was found to be significantly low which implies that coupon-
based incentives might not be effective in making them repetitive purchasers.
Skeptical newcomers segment is composed of consumers who are relatively new to
the online store. This type of consumers purchase very diverse type of products whose
prices are very low. Study of Forsythe et al. (2006) showed that product related risks

85
and risk of incurring financial losses negatively and statistically significantly
correlated with online purchasing frequency and amount of money spent online.
Product and financial risks refer to consumers concerns such as inability in examining
the online product, choosing the wrong size of clothes, distrust to online seller, being
overcharged and even not getting the ordered product. Survey study showed that in
online shopping context, perceived product and perceived financial risks were among
the major concerns of consumers (Huseynov and Yıldırım, 2016b). Majority of
participants in this survey worried that difficulty of examining quality of online
products, possibility of receiving malfunctioning products and risk of not getting
purchased product can cause them to incur financial losses. Probably, due to perceived
product and perceived financial risks, Skeptical Newcomers tend to purchase low price
items. In order to increase shopping rate of these customers, it is important that online
sellers reduce this type of consumers’ risk perceptions related to online shopping.
Similar to Need-based shoppers, coupon redemption rate of Skeptical newcomers is
also very low. Therefore, discount coupon rewards may not have any significant
effects on their online spending rate.
Repetitive purchasers are predominantly old members who visit the online store on
frequent basis and purchase online products significantly higher than all other
segments. Study of Forsythe et al. (2006) showed that frequency of online store visits
and frequency of online purchases are statistically significantly and positively
correlated with perceived benefits of online shopping. Perceived benefits can be
shopping convenience, broader product selection, ease of shopping and enjoyment.
Frequent online store visits and high online shopping rate indicate that consumers in
this segment perceive the online stores to be convenient and useful in terms of
shopping. This type of consumers is highly loyal to the online seller. Loyalty in online
e-commerce context refers to customer’s favorable attitude toward the online retailer
that leads to repeat buying behavior (Anderson and Srinivasan, 2003). Loyal
consumers are the main source of profits and they also drive new customers to the
company by disseminating positive word-of-mouth messages about the company.
Therefore, it is important that the company maintains good relationship with loyal
customers as they are very important to the company’s long term success. Researchers
found that high degree of information quality, system quality, service quality,
customization, interactivity and functional look-and-feel in online stores are associated
with higher customer satisfaction and higher customer satisfaction in turn is associated
with higher customer loyalty (Chang and Chen, 2008; Chen et al., 2015). That is, if
online sellers can improve their online stores’ functional and visual features along with
service and information quality, they can increase the loyalty level of not only
repetitive purchasers but also all other determined consumer segments.
Beside the differences, all determined consumer segments have similarities in different
aspects. In all segments, the sizes of female consumers are significantly higher than
male consumers. Online retailers are advised to take necessary measures to attract
more male consumers to shop online. Furthermore, for all segments, the subscription
rates to SMS notifications of the company are higher than e-mail subscription rates.
Moreover, for one-click payment option, the storage rates of credit card details to the
online system are very low in all consumer segments. These findings show that
consumers in all segments have concerns about the security of their financial details
in online shopping systems. These findings coincide with the findings of a survey study
which show that in online shopping platforms, the majority of consumers fear that their

86
credit-card details may not be secure and may be misused (Udo, 2011; Huseynov and
Yıldırım, 2016b). Online retailers are recommended to take necessary security and
privacy measures in their online stores to protect personal and financial details of
customers and they are also advised to inform customers about how their security and
privacy are being protected in their online stores. Summary of the practical business
implications of five online consumer segments that were identified as a result of
behavioral segmentation analysis is provided in Table 27.

87
Table 27 - Practical Business Implications (Behavioral Segments)
BEHAVIORAL ONLINE CONSUMER SEGMENTS
Transient Customers Need-based Shoppers Skeptical Newcomers Opportunist
Customers
Repetitive Purchasers
SIZE 24.8% 15.8% 21.8% 13.7% 23.9%
E-COMMERCE
EXPERIENCE Low Low Low High High
GENDER
DOMINATION
Female
Female
Female
Female
Female
SEGMENT’S
PROFITABILITY
Very Low
Low
Medium
High
Very high
SEGMENT’S
MAIN GOALS
Attractive discount
coupons
Specific product needs
Purchase low-priced
items
Free shipping offers &
discount coupons
Enjoy online shopping
MARKETING
COSTS
Very high
High
Medium
Low
Very low
RETAILER’S
PRIMARY
FOCUS
*Attract customers to
online store through
various types of
incentives
*Meet customers
diverse product needs
*Provide such a service
that instill trust on
customers
*Convert to regular
shopper and eventually
to loyal customers
*Reinforce already
existing good
relationships
87
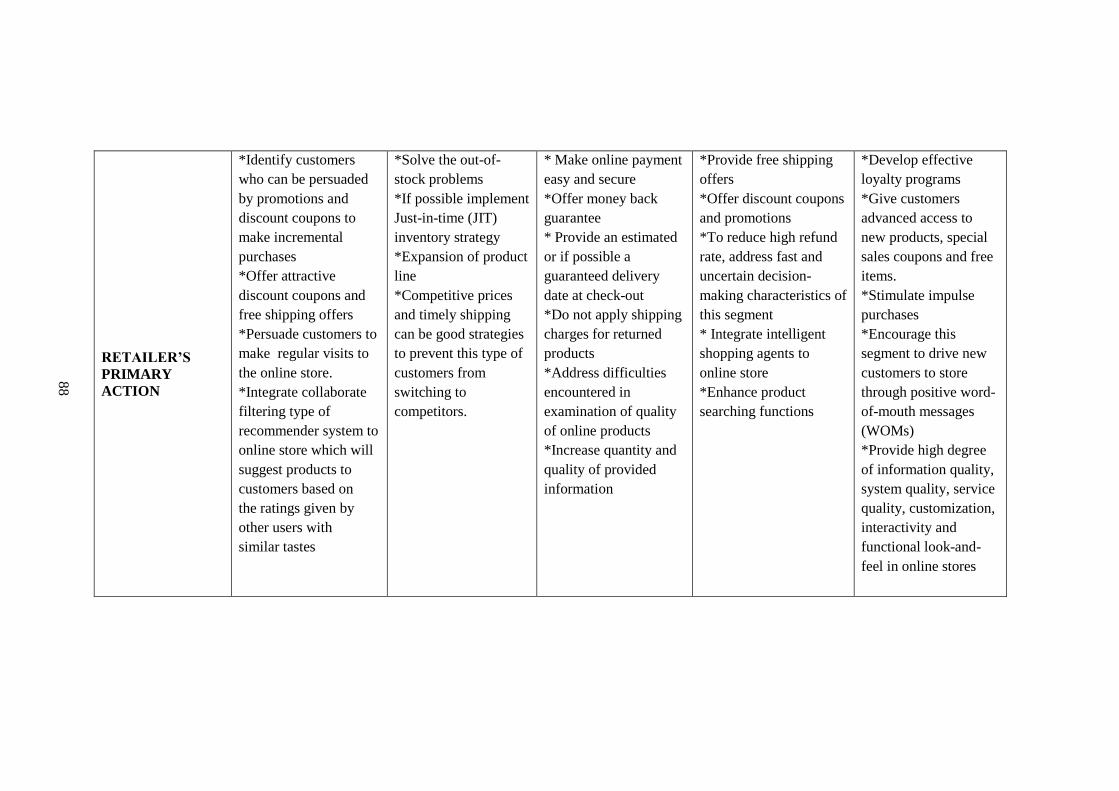
88
RETAILER’S
PRIMARY
ACTION
*Identify customers
who can be persuaded
by promotions and
discount coupons to
make incremental
purchases
*Offer attractive
discount coupons and
free shipping offers
*Persuade customers to
make regular visits to
the online store.
*Integrate collaborate
filtering type of
recommender system to
online store which will
suggest products to
customers based on
the ratings given by
other users with
similar tastes
*Solve the out-of-
stock problems
*If possible implement
Just-in-time (JIT)
inventory strategy
*Expansion of product
line
*Competitive prices
and timely shipping
can be good strategies
to prevent this type of
customers from
switching to
competitors.
* Make online payment
easy and secure
*Offer money back
guarantee
* Provide an estimated
or if possible a
guaranteed delivery
date at check-out
*Do not apply shipping
charges for returned
products
*Address difficulties
encountered in
examination of quality
of online products
*Increase quantity and
quality of provided
information
*Provide free shipping
offers
*Offer discount coupons
and promotions
*To reduce high refund
rate, address fast and
uncertain decision-
making characteristics of
this segment
* Integrate intelligent
shopping agents to
online store
*Enhance product
searching functions
*Develop effective
loyalty programs
*Give customers
advanced access to
new products, special
sales coupons and free
items.
*Stimulate impulse
purchases
*Encourage this
segment to drive new
customers to store
through positive word-
of-mouth messages
(WOMs)
*Provide high degree
of information quality,
system quality, service
quality, customization,
interactivity and
functional look-and-
feel in online stores
88

89
6.2 Limitations and Future Research Suggestions As every research, this study also has its limitations. Firstly, this study utilized
convenience sampling method in the psychographic segmentation process; that is,
participants of the study were selected based on their ease of access. Secondly,
participants in psychographic segmentation analysis were limited to university
students living in a single city area. According to the Internet Word Stats (2015), 46.4
percent of world population actively uses Internet and demographic profile of Internet
users indicates that university students constitute very large portion of active Internet
users. Even though student participants can be considered as limitation,
generalizability power of the study results does not decrease with student participants
by considering the demographic profile of active Internet users. Yet, future studies are
recommended to carry out similar analyses with non-student participants and with
expanded geographical area in order to increase the generalizability of the study
findings. Thirdly, psychographic segmentation process was based on the respondents’
self-reported data. Self-reported data sometimes does not reflect the respondents’
actual behaviors.
Finally, in the behavioral segmentation process, this study utilized e-commerce log
data of a single type of B2C e-commerce platform. Future studies are recommended
to utilize e-commerce data of different types of e-commerce platforms such as market
creators. Furthermore, future studies are recommended to carry out behavioral
segmentation analysis by using different behavioral factors from the ones used in this
study. By this way, how segment types and their characteristics differ according to
different e-commerce platforms and different behavioral factors will be understood.

90
91
REFERENCES
Adelaar, T., Chang, S., Lancendorfer, K.M., Byoungkwan Lee, K.M., Morimoto, M.,
2003. Effects of media formats on emotions and impulse buying intent.
Journal of Information Technology 18, 247–266.
Alam, S. S., Bakar, Z., Ismail, H. B., & Ahsan, M. N. (2008). Young consumers online
shopping: an empirical study. Journal of Internet Business, 5, 81-98.
Albăstroiu I (2007) Contribution of the E-Commerce to the Economic Development.
In: International Conference on Business Excellence, Brasov, Romania, pp.
3-8.
Aljukhadar, M., & Senecal, S. (2011). Segmenting the online consumer market.
Marketing Intelligence & Planning, 29(4), 421-435.
Al-Ajam, A. S., & Nor, K. M. (2013). Influencing factors on behavioral intention to
adopt Internet banking service. World Applied Sciences Journal, 22(11),
1652-1656.
Al-Jabari, M. A., Othman, S. N., & Nik Mat, N. K. (2012). Actual online shopping
behavior among Jordanian customers. American Journal of Economics,
Special Issue, 125-129. DOI: 10.5923/j.economics.20120001.28
Ajzen, I. (1985). From intentions to actions: A theory of planned behavior. In J. Kuhl
& J. Beckmann (Eds.), Action control: From cognition to behavior (pp. 11-
39). Heidelberg: Springer.
Ajzen, I. (1991). The theory of planned behavior. Organizational Behavior and Human
Decision Processes, 50, 179-211.
Bae, S., & Lee, T. (2011). Product type and consumers’ perception of online consumer
reviews. Electronic Markets, 21, 255–266.
Bai, B., Law, R., & Wen, I. (2008). The impact of website quality on customer
satisfaction and purchase intentions: Evidence from Chinese online visitors.
International Journal of Hospitality Management, 27, 91–402.
Bartikowski, B., & Singh, N. (2014). Doing E-Business in France: Drivers of Online
Trust in Business-to-Consumer Websites. Global Business and
Organizational Excellence, 28-36.
92
Bashar, A., & Wasiq, M. (2013). E-satisfaction and E-loyalty of Consumers Shopping
Online. Global Sci- Tech, 5(1), 6-19.
Belanger, F., Hiller, J. S., & Smith, W. J. (2002). Trustworthiness in electronic
commerce: the role of privacy, security, and site attributes. Journal of
Strategic Information Systems, 11, 245-270.
Bhatnagar, A. (2007). Do determinants of online shopping differ for personal shoppers
and professional shoppers? EuroMed Journal of Business, 2(1), 87-102.
Bhattacherjee, A. (2000). Acceptance of e-commerce services: The case of electronic
brokerages. IEEE Transactions on Systems, Man, and Cybernetics—Part A:
Systems And Humans, 3(4), 411-420.
Bigné-Alcaniz, E., Ruiz-Mafé, C., Aldàs-Manzano, J. & Sanz-Blaz, S. (2008).
Influence of Online Shopping Information Dependency and Innovativeness
on Internet Shopping Adoption. Online Information Review, 32 (5), 648-667.
Blake, B. F., Neuendorf, K. A., & Valdiserri, C. M. (2005). Tailoring new websites to
appeal to those most likely to shop online. Technovation, 25, 1205–1214.
Bollen KA. (1989). Structural equations with latent variables. New York: Wiley.
Bosnjak, M., Galesic, M., & Tuten, T. (2007). Personality determinants of online
shopping: Explaining online purchase intentions using a hierarchical
approach. Journal of Business Research, 60, 597-605
Broekhuizen, T., & Huizingh, E. K. R. E (2009). Online purchase determinants Is their
effect moderated by direct experience? Management Research News, 32(5),
440-457
Brown, M., Pope, N. & Voges, K. (2003). Buying or Browsing? An Exploration of
Shopping Orientations and Online Purchase Intention. European Journal of
Marketing, 37 (11/12), 1666-1685.
Brengman, M., Geuens, M., & Weijters, B. (2005). Segmenting Internet shoppers
based on their web-usage-related lifestyle: a cross-cultural validation. Journal
of Business Research, 58, 79-88. DOI: 10.1016/S0148-2963(02)00476-9
Bridges E and Florsheim R (2008) Hedonic and utilitarian shopping goals: The online
experience. Journal of Business Research, 61, 309–314.
Buttner, O. B., & Goritz, A. S. (2008). Perceived trustworthiness of online shops.
Journal of Consumer Behaviour, 7, 35–50.
Byrne, B. M. (2010). Structural equation modeling with AMOS: Basic concepts,
applications, and programming. Routledge.
Cha, J. (2011). Exploring the Internet as a unique shopping channel to sell both real
and virtual items: a comparison of factors affecting purchase intention and
consumer characteristics. Journal of Electronic Commerce Research, 12(2),
115-132.
93
Chang, H. H., & Chen, S. W. (2008). The impact of customer interface quality,
satisfaction and switching costs on e-loyalty: Internet experience as a
moderator. Computers in Human Behavior, 24, 2927–2944.
Chattaraman, V., Kwon, W. S., & Gilbert, J. E. (2012). Virtual agents in retail web
sites: Benefits of simulated social interaction for older users. Computers in
Human Behavior, 28, 2055–2066.
Chau, P. Y. K., Cole, M., 45, A. P. M. (2002). Montoya-Weiss, M. and O'keefe, R. M.,
"Cultural Differences in the Online Behavior of Consumers,"
Communications of the ACM, 45(10), 138-143.
Chellappa, R., & Sin, R. (2005). Personalization versus Privacy: An Empirical
Examination of the Online Consumer’s Dilemma. Information Technology
and Management, 6, 181–202.
Chen, F.F. (2007). Sensitivity of Goodness of Fit Indexes to Lack of Measurement
Invariance. Structural Equation Modeling, 14(3), 464-504.
Chen, C. W., & Cheng, C. Y. (2013). How online and offline behavior processes affect
each other: Customer behavior in a cyber-enhanced bookstore. Quality &
Quantity Journal, 47, 2539–2555.
Chen, Y., Hsu, I., & Lin, C. (2010). Website attributes that increase consumer purchase
intention: A conjoint analysis. Journal of Business Research, 63, 1007–1014.
Chen, Y. K., Shang, R. A., & Kao, C. Y. (2009). The effects of information overload
on consumers’ subjective state towards buying decision in the Internet
shopping environment. Electronic Commerce Research and Applications, 8,
48–58.
Chen, J., Yen, D., Pornpriphet, W., & Widjaja, A. (2014). E-commerce web site
loyalty: A cross cultural comparison. Information Systems Frontiers.
Chen, S. Y., & Macredie, R. D. (2005). The assessment of usability of electronic
shopping: A heuristic evaluation. International Journal of Information
Management, 25, 516–532.
Chen, J., Yen, D., Pornpriphet, W., & Widjaja, A. (2014). E-commerce web site
loyalty: A cross cultural comparison. Information Systems Frontiers 17 (6),
DOI: 10.1007/s10796-014-9499-0
Chen, M. Y., & Teng, C. I. (2013). A comprehensive model of the effects of online
store image on purchase intention in an e-commerce environment. Electronic
Commerce Research, 13, 1-23. DOI 10.1007/s10660-013-9104-5
Cheung, C. M. K., & Lee, M. K. O. (2006). Understanding Consumer Trust in Internet
Shopping: A Multidisciplinary Approach. Journal of The Amerıcan Society
For Information Science and Technology, 57(4), 479–492.
Cheung, G. W., & Rensvold, R. B. (2002). Evaluating goodness-of-fit indexes for
testing measurement invariance. Structural Equation Modeling: A
Multidisciplinary Journal, 9, 233–255.

94
Chiu CM, Wang ETG, Fang YH and Huang HY (2014) Understanding customers’
repeat purchase intentions in B2C e-commerce: The roles of utilitarian value,
hedonic value and perceived risk. Information Systems Journal, 24, 85–114.
Chung, K., & Shin, J. (2010). The antecedents and consequents of relationship quality
in Internet shopping. Asia Pacific Journal of Marketing and Logistics, 22(4),
473-491.
Clemes, M. D., Gan, C., & Zhang, J. (2014). An empirical analysis of online shopping
adoption in Beijing, China. Journal of Retailing and Consumer Services, 21,
364–375.
Close, A.G., & Kinney, M.K. (2010). Beyond buying: Motivations behind consumers’
online shopping cart use. Journal of Business Research, 63, 986–992.
Crespo, A. H. & Bosque, I. R. (2008). The effect of innovativeness on the adoption of
B2C e-commerce: A model based on the Theory of Planned Behavior.
Computers in Human Behavior, 24, 2830-2847.
Crespo, A. H., & Bosque, I. R. (2010). The influence of the commercial features of the
Internet on the adoption of e-commerce by consumers. Electronic Commerce
Research and Applications, 9, 562–575.
Davis, F. (1989). Perceived usefulness, perceived ease of use, and user acceptance of
information technology. MIS Quarterly, 13 (3), 319-340.
Davis, L., Wang, S. & Lindridge, A. (2008). Culture influences on emotional responses
to on-line store atmospheric cues. Journal of Business Research, 61, 806–812.
Davis, R., Lang, B. & Diego, J.S. (2014). How gender affects the relationship between
hedonic shopping motivation and purchase intentions? Journal of Consumer
Behaviour, 13, 18–30.
DeCarlo, L. T. (1997). On the meaning and use of kurtosis. Psychological Methods, 2,
292–307.
Ding, C. G., & Lin, C. H. (2012). How does background music tempo work for online
shopping? Electronic Commerce Research and Applications, 11, 299–307.
Eri, Y., Islam, Md. A. & Daud K. A. K. (2011). Factors that Influence Customers'
Buying Intention on Shopping Online. Intemational Joumal of Marketing
Studies, 3(1), 128-139
Ethier, J., Hadaya, P., Talbot, J., & Cadieux, J. (2006). B2C web site quality and
emotions during online shopping episodes: An empirical study. Information
& Management, 43, 627–639.
EuroStat (2013). Internet Use and Skills. Retrieved from https://ec.europa.eu/digital-single-market/sites/digital-agenda/files/DAE%20SCOREBOARD%202013%20-%203-INTERNET%20USE%20AND%20SKILLS.pdf
Fasolo, B., Misuraca, R., McClelland, G. H., & Cardaci, M. (2006). Animation
Attracts: The Attraction Effect in an On-line Shopping Environment.
Psychology & Marketing, 23(10), 799–811.

95
Field, A. (2013). Discovering Statistics Using IBM SPSS Statistics. Thousand Oaks:
SAGE Publication.
Fiore, A.M., Jin, H.-J. (2003). Influence of image interactivity on approach responses
towards an online retailer. Internet Research: Electronic Networking
Applications and Policy 13, 38–48.
Flavian, C., & Guinaliu, M. (2006). Consumer trust, perceived security and privacy
policy Three basic elements of loyalty to a web site. Industrial Management
& Data Systems, 106(5), 601-620.
Floh, A., & Madlberger, M. (2013). The role of atmospheric cues in online impulse-
buying behavior. Electronic Commerce Research and Applications, 12, 425–
439.
Forsythe, S., Liu, C., Shannon, D., & Gardner, L. C. (2006). Development of A Scale
to Measure The Perceived Benefits And Risks Of Online Shopping. Journal
of Interactive Marketing, 20(2), 55-75.
Gao, J., Zhang, C., Wang, K., & Ba, S. (2012). Understanding online purchase decision
making: The effects of unconscious thought, information quality, and
information quantity. Decision Support Systems, 53, 772–781.
Garbarino, E., & Strahilevitz, M. (2004). Gender differences in the perceived risk of
buying online and the effects of receiving a site recommendation. Journal of
Business Research, 57, 768– 775.
Ganesh, J., Reynolds, K. E., Luckett, M., & Pomirleanu, N. (2010). Online shopper
motivations, and e-store attributes: An examination of online patronage
behavior and shopper typologies. Journal of Retailing, 86(1), 106–115.
Ghasemaghaei, M., Ranjbarian, B. & Monadjemi, S.A., (2009), Effective factors on
Iranian consumers behavior in Internet shopping: A soft computing approach,
Journal of Computer Science, 5 (3), 172-176.
Ghibuţiu, A. (2003). Electronic Commerce – Integration and Development Factor:
Challenges for Romania. Oeconomica, 3, 165-194.
Gefen, D., & Straub, D. W. (2005). A practical guide to factorial validity using PLS-
GRAPH: Tutorial and annotated example. Communications of the
Association for Information Systems, 16, 91-109.
Gehrt, K. C., Rajan, M. N., Shainesh, G., Czerwinski, D., & O’Brien, M. (2012).
Emergence of online shopping in India: Shopping orientation segments.
International Journal of Retail & Distribution Management, 40(10), 742-758.
George, J.F. (2002). Influences on the intent to make Internet purchases. Internet
Research, Vol. 12 No. 2, pp. 165-80.
George, J. F. (2004). The theory of planned behavior and Internet purchasing. Internet
Research, 14(3), 198–212.
Gliem, J. A., & Gliem, R. R. (2003). Calculating, interpreting, and reporting
Cronbach’s alpha reliability coefficient for Likert-type scales. Midwest

96
Research to Practice Conference in Adult, Continuing, and Community
Education.
Gong, W., Stump, R. L., & Maddox, L. M. (2013). Factors influencing consumers’
online shopping in China. Journal of Asia Business Studies, 7(3), 214-230.
DOI:10.1108/JABS-02-2013-0006
Gregg, D. G., & Walczak, S. (2010). The relationship between website quality, trust
and price premiums at online auctions. Electronic Commerce Research, 10,
1-25.
Gumussoy, C. A., Calisir, F., & Bayram, A. (2007). Understanding the behavioral
intention to use ERP systems: An extended technology acceptance model.
IEEE International Conference on Industrial Engineering and Engineering
Management, 2024-2028. DOI: 10.1109/IEEM.2007.4419547
Ha, H.Y. (2012). The effects of online shopping attributes on satisfaction–purchase
intention link: A longitudinal study. International Journal of Consumer
Studies, 36, 327–334.
Ha, S., & Stoel, L. (2009). Consumer e-shopping acceptance: Antecedents in a
technology acceptance model. Journal of Business Research, 62, 565-571.
Hair, J.F., Anderson, R.E., Tatham, R.L., Black, W.C. (1998). Multivariate data
analysis with readings. 5th ed., Englewood Cliffs, NJ: Prentice-Hall.
Hansen, T.(2008). Consumer values, the theory of planned behaviour and online
grocery shopping. International Journal of Consumer Studies, 32, 128-137.
Hill, W. W., Beatty, S. E., & Walsh, G. (2013). A segmentation of adolescent online
users and shoppers. Journal of Services Marketing, 27(5), 347–360.
Hong, I. B., & Cha, H. S. (2013). The mediating role of consumer trust in an online
merchant inpredicting purchase intention. International Journal of
Information Management, 33, 927– 939.
Hostler, R. E., Yoon, V. Y., & Guimaraes, T. (2012). Recommendation agent impact
on consumer online shopping: The Movie Magic case study. Expert Systems
with Applications, 39, 2989–2999.
Hostler, R. E., Yoon, V. Y., Guo, Z., Guimaraes, T., & Forgionne, G. (2011).
Assessing the impact of recommender agents on on-line consumer unplanned
purchase behavior. Information & Management, 48, 336–343.
Hsu, C. W. (2006). Privacy concerns, privacy practices and web site categories toward
a situational paradigm. Online Information Review, 30(5), 569–586.
Hsu, C. L., Chang, K. C., & Chen, M. C. (2012). Flow Experience and Internet
Shopping Behavior: Investigating the Moderating Effect of Consumer
Characteristics. Systems Research and Behavioral Science, 29, 317–332.
Huang, Y., & Kuo, F. (2011). An eye-tracking investigation of Internet consumers’
decision deliberateness. Internet Research, 21(5), 541-561.

97
Huang, W., Schrank, H. & Dubinsky, A.J. (2006). Effect of brand name on consumers’
risk perceptions of online shopping. Journal of Consumer Behaviour, 4(1),
40–50.
Huseynov, F. & Yıldırım, S.O. (2016a). Behavioral issues in B2C e-commerce: The-
state-of-the-art. Information Development, 32(5), 1343-1358. DOI:
10.1177/0266666915599586.
Huseynov, F. & Yıldırım, S.O. (2016b). Internet users’ attitudes toward business-to-
consumer online shopping: A survey. Information Development, 32(3), 452-
465. DOI: 10.1177/0266666914554812.
Huseynov, F., Huseynov, S.Y. & Özkan, S. (2016). The influence of knowledge-based
e-commerce product recommender agents on online consumer decision-
making. Information Development, 32, 81-90. DOI:
10.1177/0266666914528929
Internet World Stats (2015). Internet usage statistics. Retrieved from
http://www.Internetworldstats.com/stats.htm
Järveläinen, J. (2007), Online purchase intentions: an empirical testing of a multiple-
theory model, Journal of Organizational Computing and Electronic
Commerce, 17(1), 53-74.
Javadi , M., Dolatabadi, H.. Nourbakhsh , M. Poursaeedi, A., & Asadollahi, A. (2012),
“An Analysis of Factors Affecting on Online Shopping Behaviour of
consumers”, International Journal of Marketing Studies; 4(5), 81-98
Jayawardhena, C., Wright, L. T., & Dennis, C. (2007). Consumers online: Intentions,
Orientations and Segmentation. International Journal of Retail and
Distribution Management, 35(6), 515-599.
Jiang, P., Jones, D. B., & Javie, S. (2008). How Third-Party Certification Programs
Relate to Consumer Trust in Online Transactions: An Exploratory Study.
Psychology & Marketing, 25(9), 839–858.
Jiang, L. A., Yang, Z., & Jun, M. (2013). Measuring consumer perceptions of online
shopping convenience. Journal of Service Management, 23(2), 191-214.
Judge, G.G., Hill, R.C., Griffiths, W., Lutkepohl, H., Lee, T.C. (1982). Introduction to
the theory and practice of econometrics. New York: Wiley.
Juniwati, (2014). Influence of Perceived Usefulness, Ease of Use, Risk on Attitude and
Intention to Shop Online. European Journal of Business and Management,
6(27), 218-228.
Katz, M. H. (2006). Multivariable analysis: a practical guide for clinicians: Cambridge
University Press.
Keating, B. W., Quazi, A. M., & Kriz, A. (2009). Financial risk and its impact on new
purchasing behavior in the online retail setting. Electronic Markets, 19, 237–
250.
98
Keeling, K., McGoldrick, P., & Beatty, S. (2010). Avatars as salespeople:
Communication style, trust, and intentions. Journal of Business Research, 63,
793–800.
Kim, J., Fiore, A. M., & Lee, H. H. (2007). Influences of online store perception,
shopping enjoyment, and shopping involvement on consumer patronage
behavior towards an online retailer. Journal of Retailing and Consumer
Services, 14, 95–107
Kim, J., Jin, B. & Swinney, J. (2008). The role of e-tail quality, e-satisfaction and e-
trust in online loyalty development process. Journal of Retailing and
Consumer Services, 16, 239–247.
Kim, J., & Lennon, S. J. (2013). Effects of reputation and website quality on online
consumers’ emotion, perceived risk and purchase intention: Based on the
stimulus-organism-response model. Journal of Research in Interactive
Marketing, 7(1), 33-56.
Kim, H. B., Kim, T. T., & Shin, S. W. (2009). Modeling roles of subjective norms and
eTrust in customers’ acceptance of airline B2C eCommerce websites.
Tourism Management, 30, 266-277. DOI:10.1016/j.tourman.2008.07.001
Kim, H. & Niehm, L.S. (2009). The impact of website quality on information quality,
value, and loyalty intentions in apparel retailing. Journal of Interactive
Marketing, 23, 221–233.
Kim, J. B. (2012). An empirical study on consumer first purchase intention in online
shopping: Integrating initial trust and TAM. Electronic Commerce Research,
12, 125-150. DOI 10.1007/s10660-012-9089-5
Kim, C., Galliers, R.D., Shin, N., Ryoo, J.H. & Kim, J. (2012). Factors influencing
Internet shopping value and customer repurchase intention. Electronic
Commerce Research and Applications, 11, 374–387.
Kinney, M. K., & Close, A. G. (2010). The determinants of consumers’ online
shopping cart abandonment. Journal of the Academy of Marketing Science,
38, 240–250.
Kshetri, N. (2007). Barriers to E-Commerce and Competitive Business Models in
Developing Countries: A Case Study. Electronic Commerce Research and
Applications, 6(4), 443–452.
Kline, R. B. (1998). Principles and practice of structural equation modeling. New
York: Guilford Press.
Ko, H., Jung, J., Kim, J., & Shim, S. W. (2004). Cross-cultural differences in perceived
risk of online shopping. Journal of Interactive Advertising, 4(2), 20-29.
Koo, D. M. (2006). The fundamental reasons of e-consumers loyalty to an online store.
Electronic Commerce Research and Applications, 5, 117–130.
Komiak, S.Y.X., and Benbasat, I. (2006). The Impact of Personalization and
Familiarity on Trust and Adoption of Recommendation Agents. MIS
Quarterly, 30(4), 941-960.

99
Korgaonkar, P. A., & Karson, E. J. (2007). The Influence of Perceived Product Risk
on Consumers’ e-Tailer Shopping Preference. Journal of Business and
Psychology, 22, 55–64.
Lantz, B., & Hjort, K. (2013). Real e-customer behavioural responses to free delivery
and free returns. Electronic Commerce Research, 13, 183–198.
Laohapensang, O. (2009). Factors influencing Internet Shopping Behavior: a survey
of consumers in Thailand. Journal of Fashion Marketing and Management,
13(4), 501-513.
Laudon, K. C., & Laudon, J. P. (2014). Management Information Systems: Managing
the Digital Firm (13th ed.). England: Pearson Publications.
Lee, H., Choi, S. Y., & Kang, Y. S. (2009). Formation of e-satisfaction and repurchase
intention: Moderating roles of computer self-efficacy and computer anxiety.
Expert Systems with Applications, 36, 7848–7859
Lee, H. H., Fiore, A. M., & Kim, J. (2006). The role of the technology acceptance
model in explaining effects of image interactivity technology on consumer
responses. International Journal of Retail & Distribution Management, 34(8),
621-644.
Lee, K. C., & Kwon, S. (2008). Online shopping recommendation mechanism and its
influence on consumer decisions and behaviors: A causal map approach.
Expert Systems with Applications, 35, 1567–1574.
Lee, H. H., Kim, J., & Fiore, A. M. (2010). Affective and Cognitive Online Shopping
Experience: Effects of Image Interactivity Technology and Experimenting
With Appearance. International Textile & Apparel Association, 28(2), 140-
154.
Lian, J., & Lin, T. (2008). Effects of consumer characteristics on their acceptance of
online shopping: Comparisons among different product types. Computers in
Human Behavior, (24), 48-65.
Lian, J. W., & Yen, D. C. (2013). To buy or not to buy experience goods online:
Perspective of innovation adoption barriers. Computers in Human Behavior,
29, 665–672.
Liao, Z., & Cheung, M. T. (2001). Internet-based e-shopping and consumer attitudes:
an empirical study. Information & Management, (38), 299-306.
Liao, T. H., & Keng, C. J. (2013). Online shopping delivery delay: Finding a
psychological recovery strategy by online consumer experiences. Computers
in Human Behavior, 29, 1849–1861.
Liao, C., Palvia, P., & Lin, H. N. (2006). The roles of habit and web site quality in e-
commerce. International Journal of Information Management, 26, 469-483.
DOI:10.1016/j.ijinfomgt.2006.09.001
Liao, C., Palvia, P., & Lin, H. N. (2010). Stage antecedents of consumer online buying
behavior. Electronic Markets, 20, 53–65.
100
Liebermann, Y., & Stashevsky, S. (2009). Determinants of Online Shopping:
Examination of an Early-Stage Online Market. Canadian Journal of
Administrative Sciences, 26(4), 316–331.
Lim, Y. M., Yap, C. S., & Lee, T. H. (2011). Intention to shop online: A study of
Malaysian baby boomers. African Journal of Business Management, 5(5),
1711-1717.
Lim, W., M. & Ting, D., H. (2012). E-shopping: an Analysis of the Technology
Acceptance Model. Journal of Modern Applied Science, 6(4), 49-62
Lin, H. (2007). Predicting consumer intentions to shop online: An empirical test of
competing theories. Electronic Commerce Research and Applications, 6,
433–442.
Liu, M. T., Brock, J. L., Shi, G. C., Chu, R., & Tseng, T. H. (2013). Perceived benefits,
perceived risk, and trust: Influences on consumers’ group buying behaviour.
Asia Pacific Journal of Marketing and Logistics, 25(2), 225-248.
Liu, X., He, M., Gao, F., & Xie, P. (2008). An empirical study of online shopping
customer satisfaction in China: A holistic perspective. International Journal
of Retail & Distribution Management, 36(11), 919-940.
Liu, Y., Li, H., Peng, G., Lv, B., & Zhang, C. (2015). Online purchaser segmentation
and promotion strategy selection: Evidence from Chinese E-commerce
market. Annals of Operations Research, 233, 263-279. DOI 10.1007/s10479-
013-1443-z
López, I., & Ruiz, S. (2011). Explaining website effectiveness: The hedonic–utilitarian
dual mediation hypothesis. Electronic Commerce Research and Applications,
10, 49–58.
Lu, L. C., Chang, H. H., & Yu, S. T. (2013). Online shoppers’ perceptions of e-
retailers’ ethics, cultural orientation, and loyalty: An exploratory study in
Taiwan. Internet Research, 23(1), 47-68.
Mazursky, D., & Vinitzky, G. (2005). Modifying consumer search processes in
enhanced on-line interfaces. Journal of Business Research, 58, 1299 – 1309.
Moshref Javadi, M. H., Dolatabadi, H. R., Nourbakhsh, M., Poursaeedi, A. &
Asadollahi, A. R. (2012). An Analysis of Factors Affecting on Online
Shopping Behavior of Consumers. International Journal of Marketing
Studies. 4(5), 81-98.
Mummalaneni, V. (2005). An Empirical Investigation of Web Site Characteristics,
Consumer Emotional States and On-line Shopping Behaviors. Journal of
Business Research, 58, 526-532.
Naiyi, Y. (2004). Dimensions of consumer’s perceived risk in online shopping. Journal
of Electronic Science and Technology of China, 2(3), 177–182.
Nazir, S., Tayyab, A., Sajid, A., Rashid, H., & Javed, I. (2012). How Online Shopping
is Affecting Consumers Buying Behavior in Pakistan?. IJCSI International
Journal of Computer Science Issues, 9, 3(1), 486-495.

101
Noort, G. V., Kerkhof, P., & Fennis, B. M. (2008). The Persuasıveness of Online
Safety Cues: The Impact of Prevention Focus Compatibility of Web Content
On Consumers’ Risk Perceptions, Attitudes, And Intentions. Journal of
Interactive Marketing, 22(4), 58-72.
O’Cass, A., & Fenech, T. (2003). Web Retailing Adoption: Exploring the Nature of
Internet Usersweb Retailing Behavior. Journal of Retailing and Consumer
Services, 10(2), 81-94.
Ogonowski, A., Montandon, A., Botha, E., & Reyneke, M. (2014). Should new online
stores invest in social presence elements? The effect of ocial presence on
initial trust formation. Journal of Retailing and Consumer Services, 21, 482–
491.
Ou, C. X., & Sia, C. L. (2010). Consumer trust and distrust: An issue of website design.
Int. J.Human-Computer Studies, 68, 913-934.
Overby, J.W. & Lee, E.J. (2006). The effects of utilitarian and hedonic online shopping
value on consumer preference and intentions. Journal of Business Research
59, 1160–1166.
Pan, Y., & Zinkhan, G.M. (2006). Exploring the impact of online privacy disclosures
on consumer trust. Journal of Retailing, 82(4), 331-338.
Park, C., & Jun, J. K. (2003). A cross-cultural comparison of Internet buying behavior:
Effects of Internet usage, perceived risks, and innovativeness. International
Marketing Review, 20(5), 534-553.
Parra, J. F., & Ruiz, S. (2009). Consideration sets in online shopping environments:
The effects of search tool and information load. Electronic Commerce
Research and Applications, 8, 252–262.
Pechpeyrou, P. (2009). How consumers value online personalization: A longitudinal
experiment. Direct Marketing: An International Journal, 3(1), 35-51.
Pei, Z., Paswan, A., & Yan, R. (2014). E-tailer's return policy,consumer's perception
of return policy fairness and purchase intention. Journal of Retailing and
Consumer Services, 21, 249–257.
Pew Research Center (2011). Search and email still top the list of most popular online
activities. Retrieved from http://pewInternet.org/Reports/2011/Search-and-email.aspx
Pew Research Center (2014). Online Activities in Emerging and Developing Nations.
Retrieved from: http://www.pewglobal.org/2015/03/19/2-online-activities-
in-emerging-and-developing-nations/
Punj, G. (2012). Consumer Decision Making on the Web: A Theoretical Analysis and
Research Guidelines. Psychology and Marketing, 29(10), 791–803.
Rajamma, R. K., Paswan, A. K., & Hossain, M. M. (2009). Why do shoppers abandon
shopping cart? Perceived waiting time, risk, and transaction inconvenience.
Journal of Product & Brand Management, 18(3), 188–197.
102
Ranganathan, C. and Ganapathy, S. (2002). Key dimensions of business-to-consumer
web sites. Information and Management, Vol. 39, No. 6: 457-465.
Rezaei, S. (2015). Segmenting consumer decision-making styles (CDMS) toward
marketing practice: A partial least squares (PLS) path modeling approach.
Journal of Retailing and Consumer Services, 22, 1–15.
Riquelme, I. P., & Roman, S. (2014). The relationships among consumers’ ethical
ideology, risk aversion and ethically-based distrust of online retailers and the
moderating role of consumers’ need for personal interaction. Ethics and
Information Technology, 16, 135–155.
Riquelme, I. P., & Roman, S. (2014). Is the influence of privacy and security on online
trust the same for all type of consumers? Electronic Markets, 24, 135–149.
Rogers, E. M., 1995. Diffusion of innovations. USA: New York, The Free Press, pp.
212-251.
Roman, S. (2010). Relatioal Consequences of Perceived Deception in Online
Shopping: The Moderating Roles of Type of Product, Consumer's Attitude
Toward the Internet and Consumer's Demographics. Journal of Business
Ethics, 95, 373-391.
Salehi, M. (2012). Consumer Buying Behavior towards Online Shopping Stores in
Malaysia, International Journal of Academic Research in Business and Social
Sciences, 2(1), 393-403.
Sahney, S., Ghosh, K., & Shrivastava, A. (2013). Conceptualizing consumer ‘‘trust’’
in online buying behaviour: An empirical inquiry and model development in
Indian context. Journal of Asia Business Studies, 7(3), 278-298.
Scarpi, D., Pizzi, G., & Visentin, M. (2014). Shopping for fun or shopping to buy: Is
it different online and offline? Journal of Retailing and Consumer Services,
21, 258–267.
Sha, W. (2009). Types of structural assurance and their relationships with trusting
intentions in business-to-consumer e-commerce. Electronic Markets, 19, 43–
54.
Shang, R. A., Chen, Y. C., & Shen, L. (2005). Extrinsic versus intrinsic motivations
for consumers to shop on-line. Information & Management, 42, 401-413.
DOI:10.1016/j.im.2004.01.009
Shankar, V., Smith, A., & Rangaswamy, A. (2003). Customer satisfaction and loyalty
in online and offline environments. International Journal of Research in
Marketing, 20(2), 153-175. http://dx.doi.org/10.1016/S0167-8116(03)00016-
8
Shergill, G.S. & Chen, Z. (2005). Web-based shopping: consumers’ attitudes towards
online shopping in New Zealand. Journal of Electronic Commerce Research,
6, (2), 79-94.
Shim, S. I., & Lee, Y. (2011). Consumer’s perceived risk reduction by 3D virtual
model. International Journal of Retail & Distribution Management, 39(12),
945-959.

103
Shin, J. I., Chung, K. H., Oh, J. S., & Lee, C. W. (2013). The effect of site quality on
repurchase intention in Internet shopping through mediating variables: The
case of university students in South Korea. International Journal of
Information Management, 33, 453– 463.
Shun, C., & Yunjie, X. (2006). Effects of outcome, process and shopping enjoyment
on online consumer behaviour. Electronic Commerce Research and
Applications, 5, 272–281.
Smith, R., Deitz, G., Royne, M. B., Hansen, J. D., Grünhagen, M., & Witte, C. (2013).
Cross-cultural examination of online shopping behavior: A comparison of
Norway, Germany, and the United States. Journal of Business Research, 66,
328-335. DOI:10.1016/j.jbusres.2011.08.013
Smith, H. J., Milberg, S. J., & Burke, S. J. (1996). Information privacy: Measuring
individuals’ concerns about organizational practices. MIS Quarterly, 20(2),
167–196.
Smith, R., & Shao, J. (2007). Privacy and e-commerce: A consumer-centric
perspective. Electronic Commerce Research, 7, 89–116.
Soopramanien, D. (2011). Conflicting attitudes and scepticism towards online
shopping: The role of experience. International Journal of Consumer Studies,
35, 338–347.
Soopramanien, D. G. R., & Robertson, A. (2007). Adoption and usage of online
shopping: An empirical analysis of the characteristics of ‘‘buyers’’
‘‘browsers’’ and ‘‘non-Internet shoppers’’. Journal of Retailing and
Consumer Services, 14, 73–82.
SPSS Inc. (2001). The SPSS TwoStep cluster component. A scalable component to
segment your customers more effectively. White paper – technical report,
Chicago. http://www.spss.ch/upload/1122644952_The%20SPSS%20TwoStep%20Cluster%20Component.pdf
Stern, B. B., Royne, M. F., Stafford, T. F., & Bienstock, C. C. (2008). Consumer
Acceptance of Online Auctions: An Extension and Revision of the TAM.
Psychology & Marketing, 25(7), 619–636.
Stevens J.P. (2002). Applied Multivariate Statistics for the Social Sciences. (4th ed).
Taylor and Francis.
Straub, D. W. (1989). Validating instruments in MIS research. MIS Quarterly , 13 (2),
147-169.
Su, D., & Huang, X. (2011). Research on online shopping intention of undergraduate
consumer in china--based on the theory of planned behavior. International
Business Research, 4(1), 86-92.
Swinyard, W. R., & Smith, S. M. (2003). Why people (don’t) shop online: A lifestyle
study of the Internet consumer. Psychology & Marketing, 20(7), 567-597.
doi: 10.1002/mar.10087

104
Taylor, S., & Todd, P. A. (1995). “Understanding Information Technology Usage: A
Test of Competing Models,” Information Systems Research (6:4), 144-176.
Teo, T. S. H.(2002). Attitudes toward online shopping and the Internet. Behaviour &
Information Technology. 21(4), 259-271
Teo, T. S. H., & Liu, J. (2007). Consumer trust in e-commerce in the United States,
Singapore and China. Omega, 35, 22-38.
Teo, T. S. H., & Yu, Y. (2005). Online buying behavior: a transaction cost economics
perspective. Omega, 33, 451 – 465.
To, P.L., Liao, C. & Lin, T.H. (2007). Shopping motivations on Internet: A study based
on utilitarian and hedonic value. Technovation, 27, 774–787.
Tsai, H. T., & Huang, H. C. (2007). Determinants of e-repurchase intentions: An
integrative model of quadruple retention drivers. Information &
Management, 44, 231–239.
TUBISAD & DELOITTE (2015). Türkiye’de e-Ticaret: 2014 pazar büyüklüğü.
Retrieved from: http://www2.deloitte.com/tr/tr/pages/technology-media-and-telecommunications/articles/turkiyede-eticaret-2014-pazar-buyuklugu.html
Turban, E., Rainer, R.K. & Potter, R.E. (2005). Introduction to Information
Technology. Third Edition. Hoboken: John Wiley & Sons.
Udo, G. J. (2001). Privacy and security concerns as major barriers for e-commerce: a
survey study. Information Management & Computer Security, 9(4), 165-174.
Vijayasarathy, L. R. (2004). Predicting consumer intentions to use on-line shopping:
The case for an augmented technology acceptance model.Information &
Management, 41, 747-762.
Vinaja, R. (2003). The Economic and Social Impact of Electronic Commerce in
Developing Countries. Hershey, Idea Group, 22-32.
Wang, H. C., Pallister, J. G., & Foxall, G. R. (2006). Innovativeness and involvement
as determinants of website loyalty: II. Determinants of consumer loyalty in
B2C e-commerce. Technovation, 26, 1366–1373.
Wang, H. C., Pallister, J. G., & Foxall, G. R. (2006). Innovativeness and Involvement
as Determinants of Website Loyalty: I. A test of the style/involvement model
in the context of Internet buying. Technovation, 26, 1357–1365.
Wang, Q., Yang, S., Liu, M., Cao, Z., & Ma, Q. (2014). An eye-tracking study of
website complexity from cognitive load perspective. Decision Support
Systems, 62, 1-10.
Wirtz, J., Lwin, M. O., & Williams, J. D. (2007). Causes and consequences of
consumer online privacy concern. International Journal of Service Industry
Management, 18(4), 326-348.
West, S. G., Finch, J. F., & Curran, P. J. (1995). Structural equation models with
nonnormal variables: Problems and remedies. In R. H. Hoyle (Ed.), Structural
equation modeling: Concepts, issues, and applications. Thousand Oaks, CA:
Sage.

105
Wu, G., Hu, X., & Wu, Y. (2010). Effects of Perceived Interactivity, Perceived Web
Assurance and Disposition to Trust on Initial Online Trust. Journal of
Computer-Mediated Communication, 16, 1–26.
Wu, J., Wang, S., & Lin, L. (2007). Mobile computing acceptance factors in the
healthcare industry: a structural equation model. International Journal of
Medicine Informatics, 76, 67-77.
Wu, L., Cai, Y., & Liu, D. (2011). Online shopping among Chinese consumers: An
exploratory investigation of demographics and value orientation.
International Journal of Consumer Studies, 35, 458–469.
Wu, W. Y., Lee, C. L., Fu, C. S., & Wang, H. C. (2014). How can online store layout
design and atmosphere influence consumer shopping intention on a website?
International Journal of Retail & Distribution Management, 42(1), 4-24.
Xia, L. (2010). An examination of consumer browsing behaviors. Qualitative Market
Research: An International Journal, 13(2), 154-173.
Xie, E., Teo, H. H., & Wan, W. (2006). Volunteering personal information on the
Internet: Effects of reputation, privacy notices, and rewards on online
consumer behavior. Marketing Letters, 17, 61–74.
Ye, Q., Li, G., & Gu, B. (2011). A cross-cultural validation of the web usage-related
lifestyle scale: An empirical investigation in china. Electronic Commerce
Research and Applications, (10), 304-312.
Yoo, J., & Kim, M. (2012). Online product presentation: The effect of product
coordination and a model’s face. Journal of Research in Interactive
Marketing, 6(1), 59-72.
Yoon, C. (2009) The Effects of National Culture Values on Consumer Acceptance of
Ecommerce: Online Shoppers in China. Information & Management, 46, 5,
294-301. DOI:10.1016/j.im.2009.06.001
Yoon, V. Y., Hostler, R. E., Guo, Z., & Guimaraes, T. (2013). Assessing the
moderating effect of consumer product knowledge and online shopping
experience on using recommendation agents for customer loyalty. Decision
Support Systems, 55, 883–893.
Yu, U. J., Lee, H. H., & Damhorst, M. L. (2012). Exploring Multidimensions of
Product Performance Risk in the Online Apparel Shopping Context: Visual,
Tactile, and Trial Risks. Clothing and Textiles Research Journal, 30(4), 251-
266.
Zhang, G., & Liu, Z. (2011). Effects of influential factors on consumer perceptions of
uncertainty for online shopping. Nankai Business Review International, 2(2),
158-171.
Zhou, L., Dai, L. & Zhang, D. (2007) Online Shopping Acceptance Model - A Critical
Survey of Consumer Factors in Online Shopping. Journal of Electronic
Commerce Research, 8, 41-62.
106
Zhou, T., Lu, Y., & Wang, B. (2014). Examining online consumers’ initial trust
building from an elaboration likelihood model perspective. Information
Systems Frontiers, DOI: 10.1007/s10796-5.
Zo, H., & Ramamurthy, K. (2009). Consumer Selection of E-Commerce Websites in
a B2C Environment: A Discrete Decision Choice Model. IEEE Transactıons
on Systems, Man, and Cybernetıcs—Part A: Systems and Humans, 39(4),
819-839.
Zviran, M., Glezer, C., & Avni, I. (2006). User satisfaction from commercial web sites:
The effect of design and use. Information & Management, 43, 157–178.

107
APPENDICES
APPENDIX A – LIST OF REVIEWED JOURNALS
Journal Name
# of
Articles
Cum.
#
Cum.
%
Journal of Business Research 18 18 8.7
Electronic Commerce Research and Applications 14 32 15.4
Computers in Human Behavior 11 43 20.7
International Journal of Retail & Distribution Management 11 54 26.0
Journal of Retailing and Consumer Services 10 64 30.8
Electronic Commerce Research 8 72 34.6
Information & Management 8 80 38.5
Electronic Markets 7 87 41.8
International Journal of Information Management 7 94 45.2
Information Systems and e-Business Management 5 99 47.6
Internet Research 5 104 50.0
Journal of Fashion Marketing and Management 4 108 51.9
Decision Support Systems 4 112 53.8
Direct Marketing: An International Journal 3 115 55.3
International Journal of Consumer Studies 4 119 57.2
Journal of Consumer Behaviour 4 123 59.1
Journal of Research in Interactive Marketing 4 127 61.1
Journal of Retailing 4 131 63.0
Journal of Services Marketing 4 135 64.9
Psychology and Marketing 4 139 66.8
Technovation 4 143 68.8
Asia Pacific Journal of Marketing and Logistics 3 146 70.2
Expert Systems with Applications 3 149 71.6
Journal of Interactıve Marketing (Wiley) 3 152 73.1
Journal of Interactive Marketing (Elsevier) 3 155 74.5
Clothing & Textiles Research Journal 2 157 75.5
European Journal of Marketing 2 159 76.4
IEEE Transactions on Engineering Management 2 161 77.4
Information Development 2 163 78.4
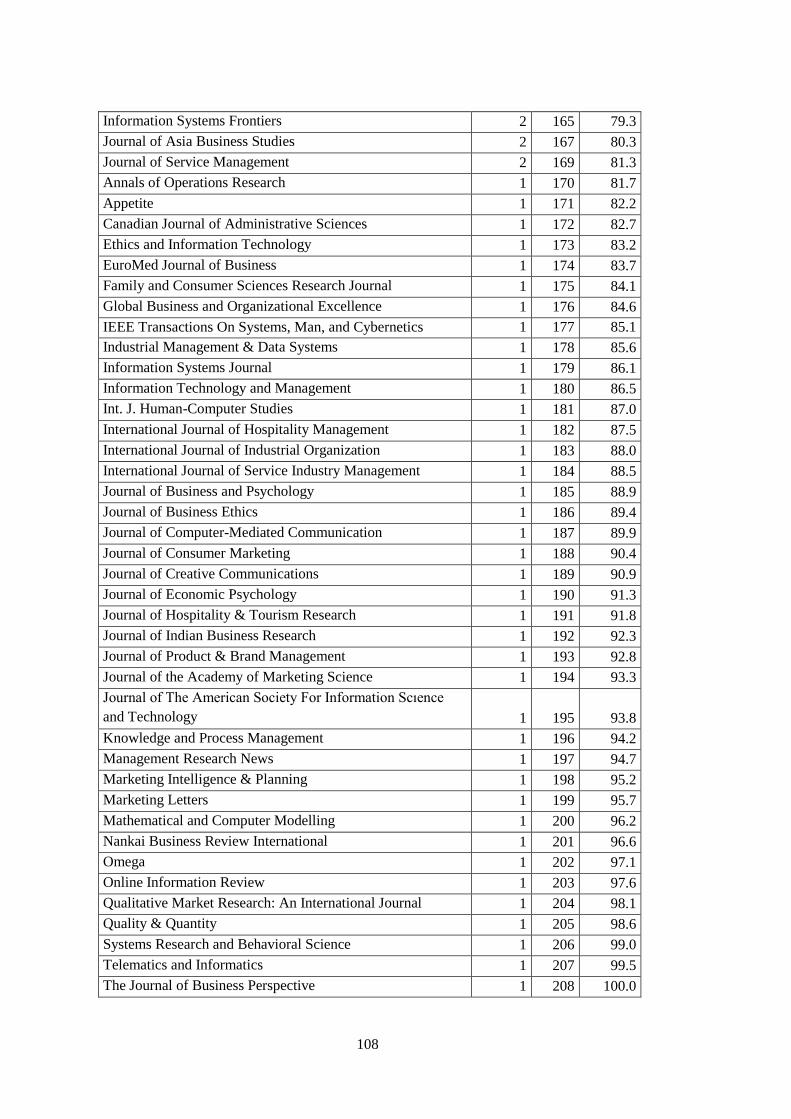
108
Information Systems Frontiers 2 165 79.3
Journal of Asia Business Studies 2 167 80.3
Journal of Service Management 2 169 81.3
Annals of Operations Research 1 170 81.7
Appetite 1 171 82.2
Canadian Journal of Administrative Sciences 1 172 82.7
Ethics and Information Technology 1 173 83.2
EuroMed Journal of Business 1 174 83.7
Family and Consumer Sciences Research Journal 1 175 84.1
Global Business and Organizational Excellence 1 176 84.6
IEEE Transactions On Systems, Man, and Cybernetics 1 177 85.1
Industrial Management & Data Systems 1 178 85.6
Information Systems Journal 1 179 86.1
Information Technology and Management 1 180 86.5
Int. J. Human-Computer Studies 1 181 87.0
International Journal of Hospitality Management 1 182 87.5
International Journal of Industrial Organization 1 183 88.0
International Journal of Service Industry Management 1 184 88.5
Journal of Business and Psychology 1 185 88.9
Journal of Business Ethics 1 186 89.4
Journal of Computer-Mediated Communication 1 187 89.9
Journal of Consumer Marketing 1 188 90.4
Journal of Creative Communications 1 189 90.9
Journal of Economic Psychology 1 190 91.3
Journal of Hospitality & Tourism Research 1 191 91.8
Journal of Indian Business Research 1 192 92.3
Journal of Product & Brand Management 1 193 92.8
Journal of the Academy of Marketing Science 1 194 93.3
Journal of The American Society For Information Scıence
and Technology 1 195 93.8
Knowledge and Process Management 1 196 94.2
Management Research News 1 197 94.7
Marketing Intelligence & Planning 1 198 95.2
Marketing Letters 1 199 95.7
Mathematical and Computer Modelling 1 200 96.2
Nankai Business Review International 1 201 96.6
Omega 1 202 97.1
Online Information Review 1 203 97.6
Qualitative Market Research: An International Journal 1 204 98.1
Quality & Quantity 1 205 98.6
Systems Research and Behavioral Science 1 206 99.0
Telematics and Informatics 1 207 99.5
The Journal of Business Perspective 1 208 100.0
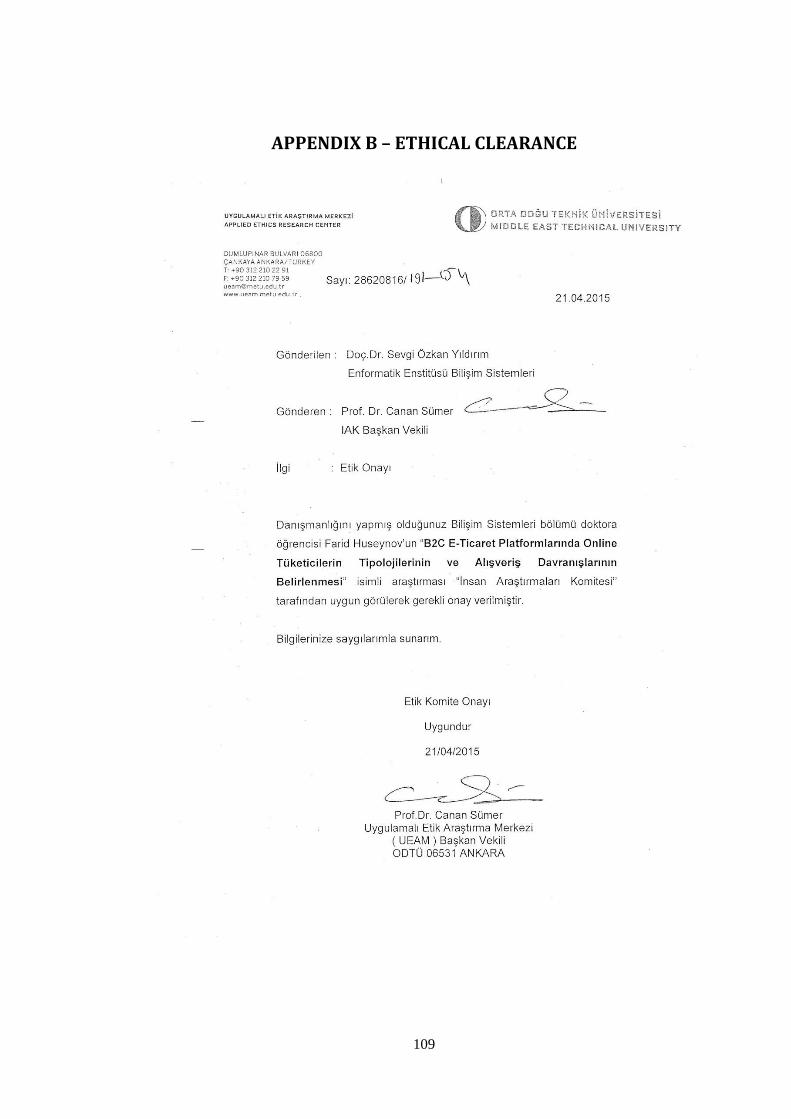
109
APPENDIX B – ETHICAL CLEARANCE
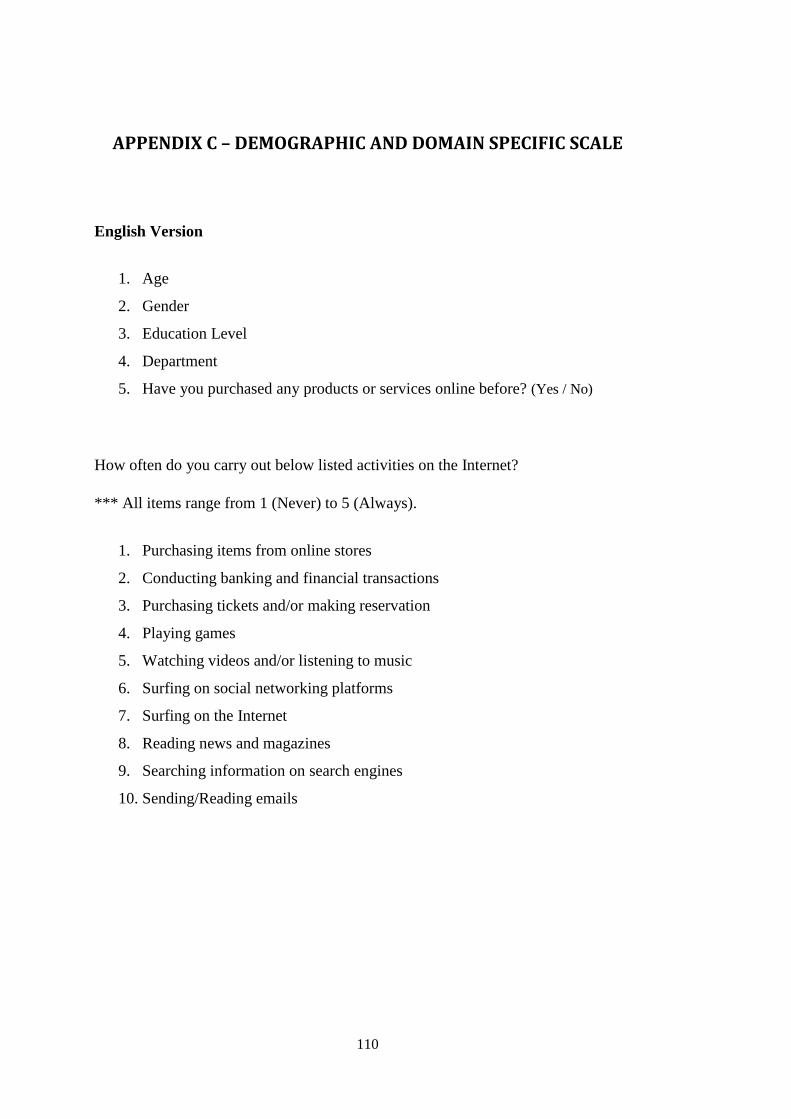
110
APPENDIX C – DEMOGRAPHIC AND DOMAIN SPECIFIC SCALE
English Version
1. Age
2. Gender
3. Education Level
4. Department
5. Have you purchased any products or services online before? (Yes / No)
How often do you carry out below listed activities on the Internet?
*** All items range from 1 (Never) to 5 (Always).
1. Purchasing items from online stores
2. Conducting banking and financial transactions
3. Purchasing tickets and/or making reservation
4. Playing games
5. Watching videos and/or listening to music
6. Surfing on social networking platforms
7. Surfing on the Internet
8. Reading news and magazines
9. Searching information on search engines
10. Sending/Reading emails
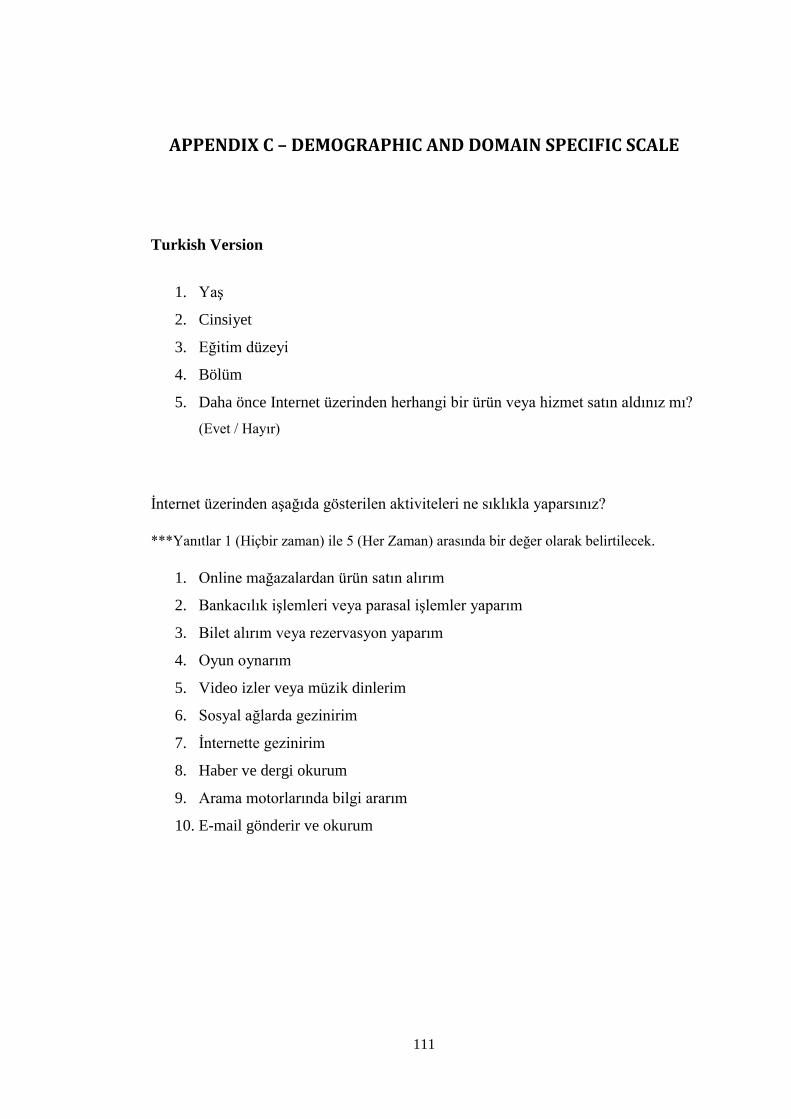
111
APPENDIX C – DEMOGRAPHIC AND DOMAIN SPECIFIC SCALE
Turkish Version
1. Yaş
2. Cinsiyet
3. Eğitim düzeyi
4. Bölüm
5. Daha önce Internet üzerinden herhangi bir ürün veya hizmet satın aldınız mı?
(Evet / Hayır)
İnternet üzerinden aşağıda gösterilen aktiviteleri ne sıklıkla yaparsınız?
***Yanıtlar 1 (Hiçbir zaman) ile 5 (Her Zaman) arasında bir değer olarak belirtilecek.
1. Online mağazalardan ürün satın alırım
2. Bankacılık işlemleri veya parasal işlemler yaparım
3. Bilet alırım veya rezervasyon yaparım
4. Oyun oynarım
5. Video izler veya müzik dinlerim
6. Sosyal ağlarda gezinirim
7. İnternette gezinirim
8. Haber ve dergi okurum
9. Arama motorlarında bilgi ararım
10. E-mail gönderir ve okurum

112
APPENDIX D – INTERNET PSYCHOGRAPHICS SCALE
*** All items range from 1 (Strongly Disagree) to 5 (Strongly Agree)
Item Code Description
DisTr1 I worry about my credit card number being stolen on the Internet
İnternet üzerinden kredi kartı bilgimin çalınması beni
endişelendiriyor.
DisTr2 I don’t want to give a computer my credit-card number
Bir bilgisayara kredi kartı numaramı vermeyi istemiyorum.
DisTr3 Buying things on the Internet scares me
İnternet üzerinden ürün almak beni korkutuyor.
DisTr4 I just don’t trust Internet retailers
İnternet satıcılarına güvenmiyorum.
Conv1 I like that no car is necessary on Internet
Internet üzerinde alışverişte araba gerekli olmamasını seviyorum.
Conv2 I like not having to leave home when shopping
İnternet üzerinden alışveriş yaparken evden ayrılmak zorunda
olmamayı seviyorum.
Conv3 Internet shopping is easier than local
İnternet üzerinden alışveriş fiziksel mağazadan daha kolay.
Conv4 I like having merchandise delivered to me at home
Ürünün evime kadar getirilmesini seviyorum.
Phys1 I like to go shopping with my friends
Arkadaşlarımla alışverişe çıkmayı severim.
Phys2 I like the energy at local retail stores
Fiziksel mağazalardaki enerjiyi seviyorum.
Phys4 I like helpfulness at local stores
Fiziksel mağazalardaki yardımseverliği seviyorum.
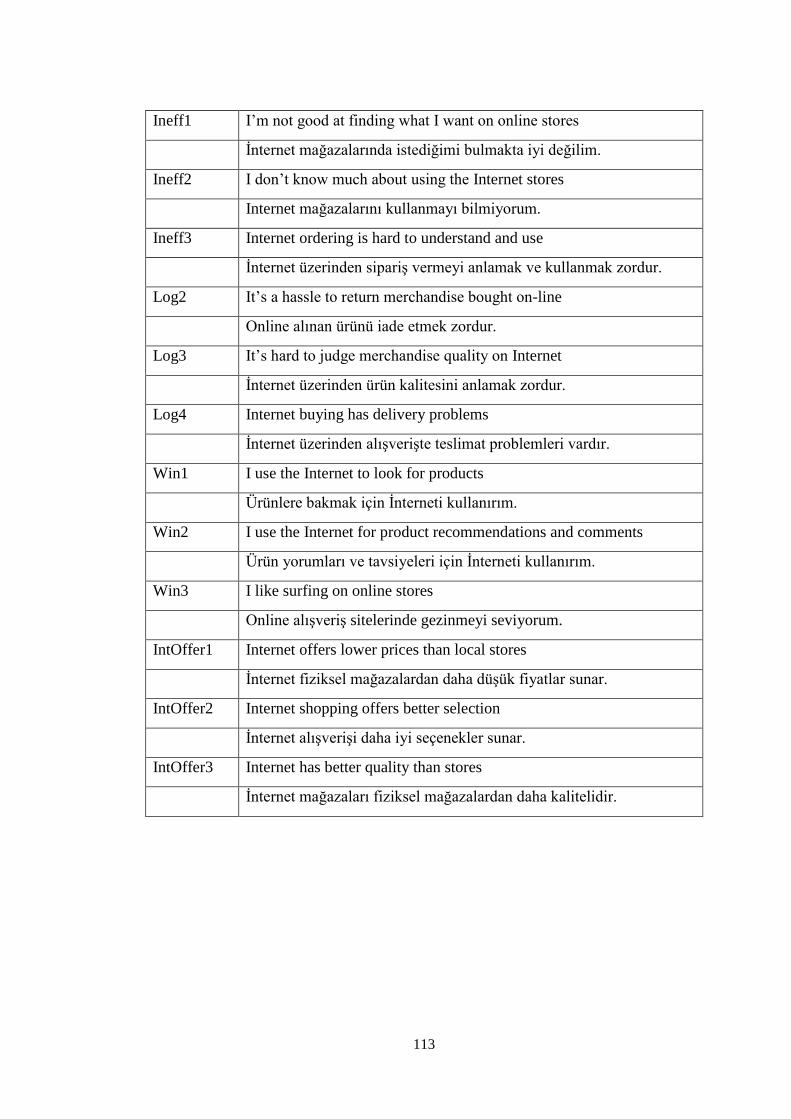
113
Ineff1 I’m not good at finding what I want on online stores
İnternet mağazalarında istediğimi bulmakta iyi değilim.
Ineff2 I don’t know much about using the Internet stores
Internet mağazalarını kullanmayı bilmiyorum.
Ineff3 Internet ordering is hard to understand and use
İnternet üzerinden sipariş vermeyi anlamak ve kullanmak zordur.
Log2 It’s a hassle to return merchandise bought on-line
Online alınan ürünü iade etmek zordur.
Log3 It’s hard to judge merchandise quality on Internet
İnternet üzerinden ürün kalitesini anlamak zordur.
Log4 Internet buying has delivery problems
İnternet üzerinden alışverişte teslimat problemleri vardır.
Win1 I use the Internet to look for products
Ürünlere bakmak için İnterneti kullanırım.
Win2 I use the Internet for product recommendations and comments
Ürün yorumları ve tavsiyeleri için İnterneti kullanırım.
Win3 I like surfing on online stores
Online alışveriş sitelerinde gezinmeyi seviyorum.
IntOffer1 Internet offers lower prices than local stores
İnternet fiziksel mağazalardan daha düşük fiyatlar sunar.
IntOffer2 Internet shopping offers better selection
İnternet alışverişi daha iyi seçenekler sunar.
IntOffer3 Internet has better quality than stores
İnternet mağazaları fiziksel mağazalardan daha kalitelidir.

114
APPENDIX E – MAIN SURVEY ITEMS
*** All items range from 1 (Strongly Disagree) to 7 (Strongly Agree)
Code Description Source
PERCEIVED EASE OF USE
PEOU 2 Internet shopping is (would be) easy to use Cha, 2011
Juniwati, 2014 Internet üzerinden alışverişi kullanmak kolaydır.
PEOU 3 It is easy to access online shopping sites
Online alışveriş sitelerine erişim kolaydır.
PERCEIVED ENJOYMENT
PENJ1 I (would) find shopping at online stores to be
enjoyable
Shun & Yunjie,
2006
Cha, 2011
Internet üzerinden alışverişi zevkli buluyorum.
PENJ2 I (would) find shopping at online stores to be
interesting
Internet üzerinden alışverişi ilginç buluyorum.
PENJ4 Shopping at online stores are a very nice time
out
Online alışveriş yaparak vakit geçirmek hoşuma
gidiyor.
PERCEIVED USEFULNESS
PU1 Shopping at online stores makes (would make)
my life easier
Cha, 2011
Juniwati, 2014
İnternet üzerinden alışveriş yapmak hayatımı
kolaylaştırır.
PU2 Online shopping provides many product
alternatives
Online alışveriş bir çok ürün alternatifi sağlar.
PERCEIVED INFORMATION SECURITY
PIS1 I feel secure sending personal / financial info
across the Internet
O'Cass & Fenech,
2003
Flavian & Guinaliu,
2006
Kişisel ve finansal bilgilerimi Internet üzerinden
göndermeyi güvenli buluyorum.
PIS2 I feel safe providing personal / financial info
about me to online retailers

115
Kişisel ve finansal bilgilerimi Internet
satıcılarına vermeyi güvenli buluyorum.
PIS3 I think online stores have mechanisms to ensure
the safe transmission of its users’
Online alışveriş sitelerinin kullanıcı bilgilerini
güvenli aktarmak için bir mekanizması
olduğunu düşünüyorum.
PIS4 When I send data to online stores, I am sure that
they will not be intercepted by unauthorized
third parties
Online alışveriş sitelerine bilgi verdiğimde,
bunların yetkisiz üçüncü şahıslarca
ulaşılamayacağından eminim.
PIS5 Online retailers implement security measures to
protect Internet shoppers
Internet satıcıları müşterilerini korumak için
güvenlik önlemleri uygularlar.
PERCEIVED COMPATIBILITY
PCP2 Using the online stores to shop fit (will fit) with
my lifestyle
Taylor & Todd,
1995
Alışveriş için Interneti kullanmak yaşam tarzıma
uygundur.
PCP3 Shopping online fits well with my shopping
style
Online alışveriş, alış veriş yapma tarzıma
uygundur.
PCP4 Shopping online for any product fits well with
my shopping needs
Bir ürünü online satın almak alışveriş
ihtiyaçlarımı karşılamada yeterlidir.
PERCEIVED SOCIAL PRESSURE
PSP1 Online shopping is common in my circle of
friends
Järveläinen, 2007
Lim et al 2011
Arkadaş çevremde online alışveriş yaygındır.
PSP3 The popular press has a positive review towards
online shopping
Popüler basının görüşü online alışverişe karşı
olumludur.
PSP5 My friends’ attitudes are positive towards online
shopping
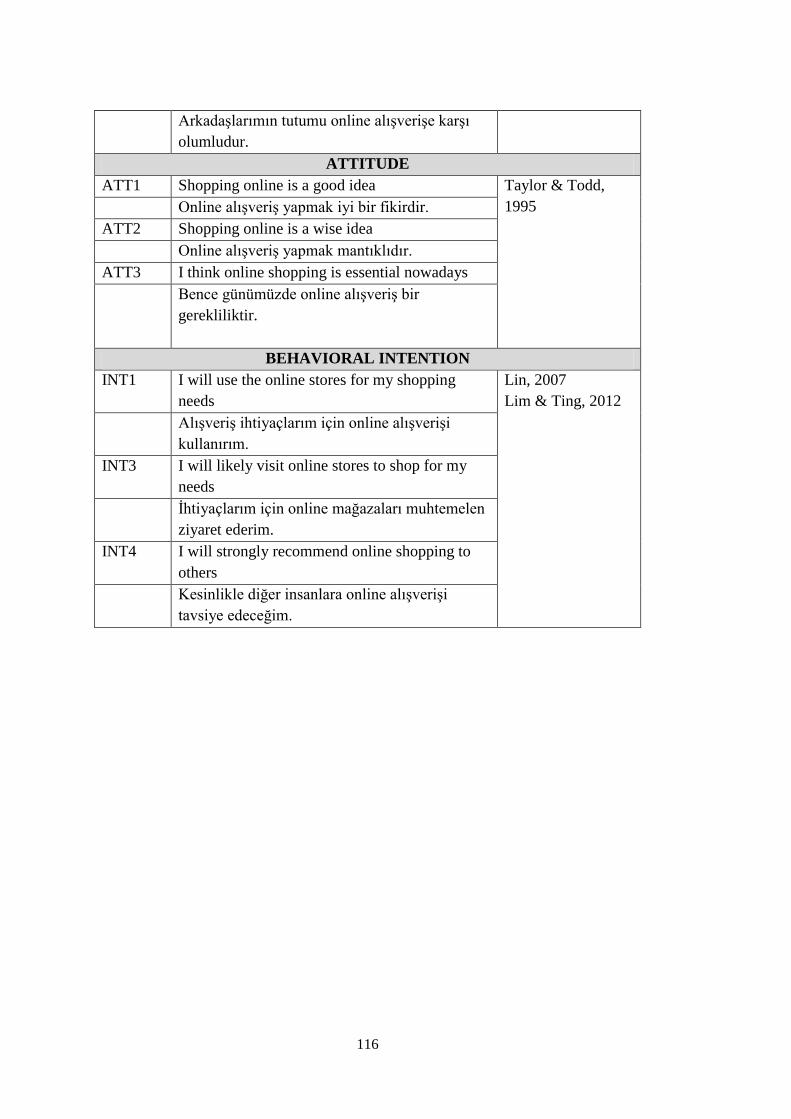
116
Arkadaşlarımın tutumu online alışverişe karşı
olumludur.
ATTITUDE
ATT1 Shopping online is a good idea Taylor & Todd,
1995
Online alışveriş yapmak iyi bir fikirdir.
ATT2 Shopping online is a wise idea
Online alışveriş yapmak mantıklıdır.
ATT3 I think online shopping is essential nowadays
Bence günümüzde online alışveriş bir
gerekliliktir.
BEHAVIORAL INTENTION
INT1 I will use the online stores for my shopping
needs
Lin, 2007
Lim & Ting, 2012
Alışveriş ihtiyaçlarım için online alışverişi
kullanırım.
INT3 I will likely visit online stores to shop for my
needs
İhtiyaçlarım için online mağazaları muhtemelen
ziyaret ederim.
INT4 I will strongly recommend online shopping to
others
Kesinlikle diğer insanlara online alışverişi
tavsiye edeceğim.
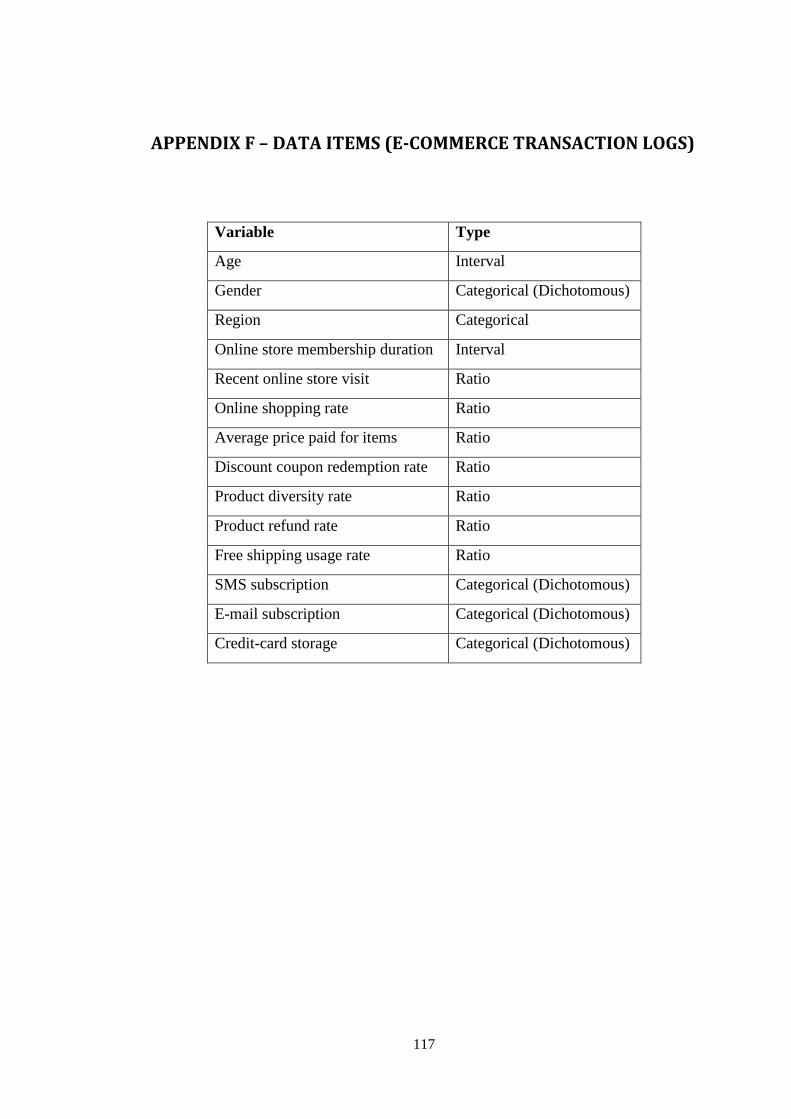
117
APPENDIX F – DATA ITEMS (E-COMMERCE TRANSACTION LOGS)
Variable Type
Age Interval
Gender Categorical (Dichotomous)
Region Categorical
Online store membership duration Interval
Recent online store visit Ratio
Online shopping rate Ratio
Average price paid for items Ratio
Discount coupon redemption rate Ratio
Product diversity rate Ratio
Product refund rate Ratio
Free shipping usage rate Ratio
SMS subscription Categorical (Dichotomous)
E-mail subscription Categorical (Dichotomous)
Credit-card storage Categorical (Dichotomous)

118
APPENDIX G – CORRELATION MATRIX (INTERNET ACTIVITIES)
Correlation Matrixa
Shop1 Shop2 Shop3 Fun1 Fun2 Fun3 Fun4 Info1 Info2 Info3
Correlation
Shop1 1.000 .336 .346 .146 .239 .149 .235 .228 .242 .256
Shop2 .336 1.000 .506 .016 .029 -.029 .075 .213 .223 .298
Shop3 .346 .506 1.000 .023 .166 .135 .223 .268 .298 .404
Fun1 .146 .016 .023 1.000 .309 .223 .280 .076 .049 -.035
Fun2 .239 .029 .166 .309 1.000 .483 .518 .245 .286 .231
Fun3 .149 -.029 .135 .223 .483 1.000 .570 .186 .171 .156
Fun4 .235 .075 .223 .280 .518 .570 1.000 .306 .365 .284
Info1 .228 .213 .268 .076 .245 .186 .306 1.000 .405 .343
Info2 .242 .223 .298 .049 .286 .171 .365 .405 1.000 .566
Info3 .256 .298 .404 -.035 .231 .156 .284 .343 .566 1.000
Sig. (1-tailed)
Shop1
.000 .000 .000 .000 .000 .000 .000 .000 .000
Shop2 .000
.000 .307 .177 .176 .008 .000 .000 .000
Shop3 .000 .000
.227 .000 .000 .000 .000 .000 .000
Fun1 .000 .307 .227
.000 .000 .000 .008 .057 .130
Fun2 .000 .177 .000 .000
.000 .000 .000 .000 .000
Fun3 .000 .176 .000 .000 .000
.000 .000 .000 .000
Fun4 .000 .008 .000 .000 .000 .000
.000 .000 .000
Info1 .000 .000 .000 .008 .000 .000 .000
.000 .000
Act_Info2 .000 .000 .000 .057 .000 .000 .000 .000
.000
Act_Info3 .000 .000 .000 .130 .000 .000 .000 .000 .000
a. Determinant = .081

119
APPENDIX H – ANTI IMAGE MATRICES (INTERNET ACTIVITIES)
Anti-image Matrices
Shop1 Shop2 Shop3 Fun1 Fun2 Fun3 Fun4 Info1 Info2 Info3
Anti-image Covariance
Shop1 .786 -.145 -.102 -.071 -.072 -.003 -.028 -.043 -.024 -.028
Shop2 -.145 .685 -.264 -.025 .047 .059 .015 -.048 -.016 -.053
Shop3 -.102 -.264 .639 .027 -.011 -.030 -.030 -.042 -.008 -.120
Fun1 -.071 -.025 .027 .856 -.141 -.020 -.095 -.002 .012 .089
Fun2 -.072 .047 -.011 -.141 .627 -.158 -.130 -.036 -.049 -.033
Fun3 -.003 .059 -.030 -.020 -.158 .617 -.237 -.012 .044 -.008
Fun4 -.028 .015 -.030 -.095 -.130 -.237 .530 -.062 -.096 -.024
Info1 -.043 -.048 -.042 -.002 -.036 -.012 -.062 .771 -.142 -.058
Info2 -.024 -.016 -.008 .012 -.049 .044 -.096 -.142 .594 -.253
Info3 -.028 -.053 -.120 .089 -.033 -.008 -.024 -.058 -.253 .595
Anti-image Correlation
Shop1 .868a -.197 -.144 -.086 -.102 -.004 -.044 -.055 -.036 -.040
Shop2 -.197 .714a -.398 -.032 .071 .091 .025 -.065 -.024 -.083
Shop3 -.144 -.398 .778a .036 -.017 -.048 -.052 -.059 -.012 -.195
Fun1 -.086 -.032 .036 .754a -.193 -.027 -.142 -.002 .016 .125
Fun2 -.102 .071 -.017 -.193 .829a -.254 -.226 -.052 -.080 -.053
Fun3 -.004 .091 -.048 -.027 -.254 .744a -.414 -.018 .073 -.013
Fun4 -.044 .025 -.052 -.142 -.226 -.414 .791a -.097 -.170 -.042
Info1 -.055 -.065 -.059 -.002 -.052 -.018 -.097 .896a -.210 -.085
Info2 -.036 -.024 -.012 .016 -.080 .073 -.170 -.210 .776a -.425
Info3 -.040 -.083 -.195 .125 -.053 -.013 -.042 -.085 -.425 .782a
a. Measures of Sampling Adequacy(MSA)
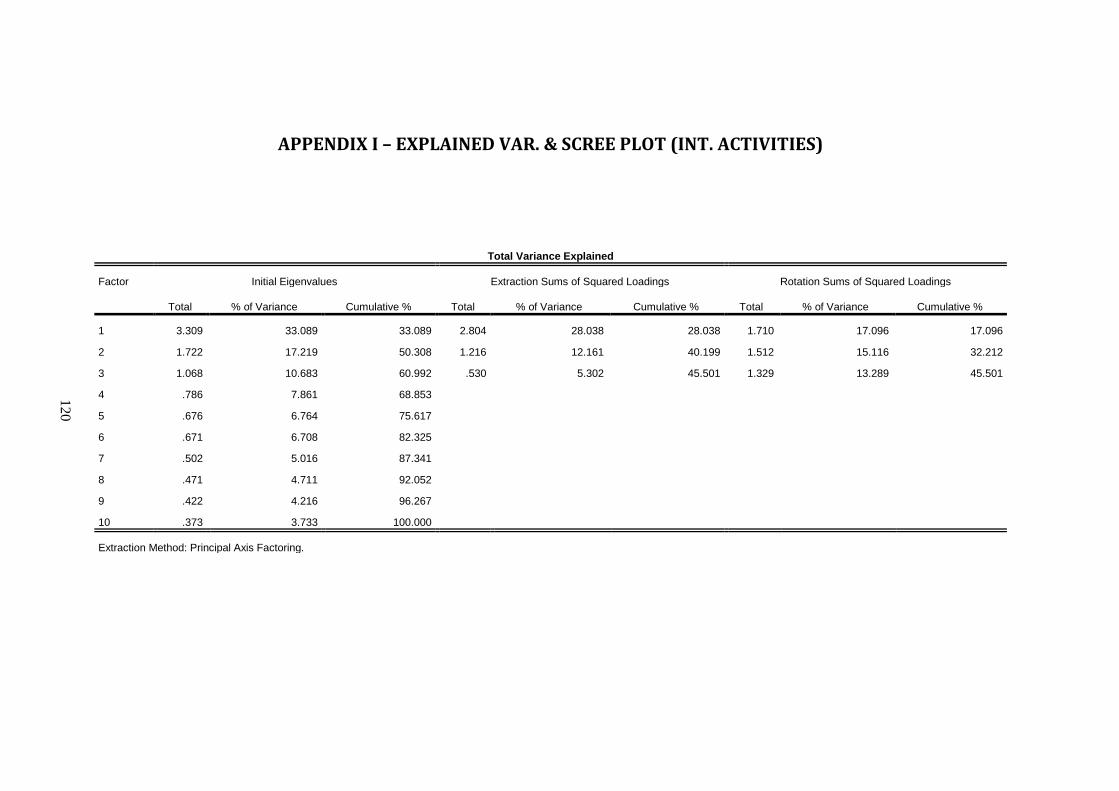
120
APPENDIX I – EXPLAINED VAR. & SCREE PLOT (INT. ACTIVITIES)
Total Variance Explained
Factor Initial Eigenvalues Extraction Sums of Squared Loadings Rotation Sums of Squared Loadings
Total % of Variance Cumulative % Total % of Variance Cumulative % Total % of Variance Cumulative %
1 3.309 33.089 33.089 2.804 28.038 28.038 1.710 17.096 17.096
2 1.722 17.219 50.308 1.216 12.161 40.199 1.512 15.116 32.212
3 1.068 10.683 60.992 .530 5.302 45.501 1.329 13.289 45.501
4 .786 7.861 68.853
5 .676 6.764 75.617
6 .671 6.708 82.325
7 .502 5.016 87.341
8 .471 4.711 92.052
9 .422 4.216 96.267
10 .373 3.733 100.000
Extraction Method: Principal Axis Factoring.
120
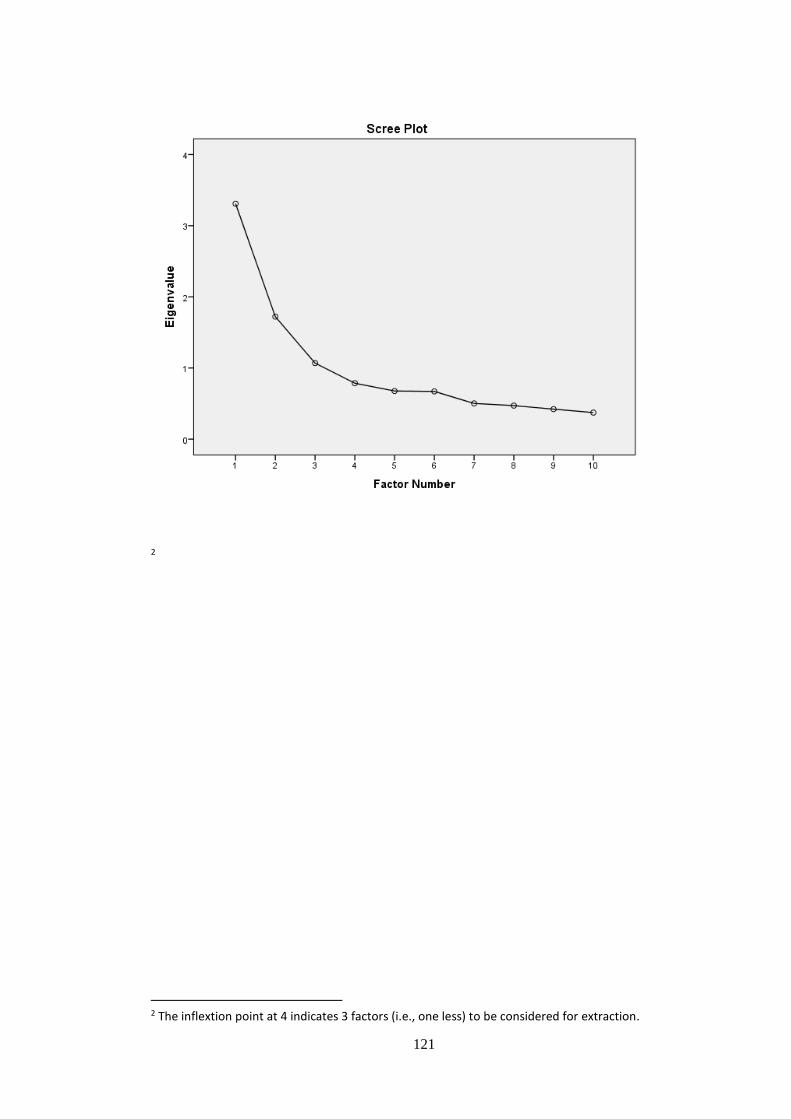
121
2
2 The inflextion point at 4 indicates 3 factors (i.e., one less) to be considered for extraction.
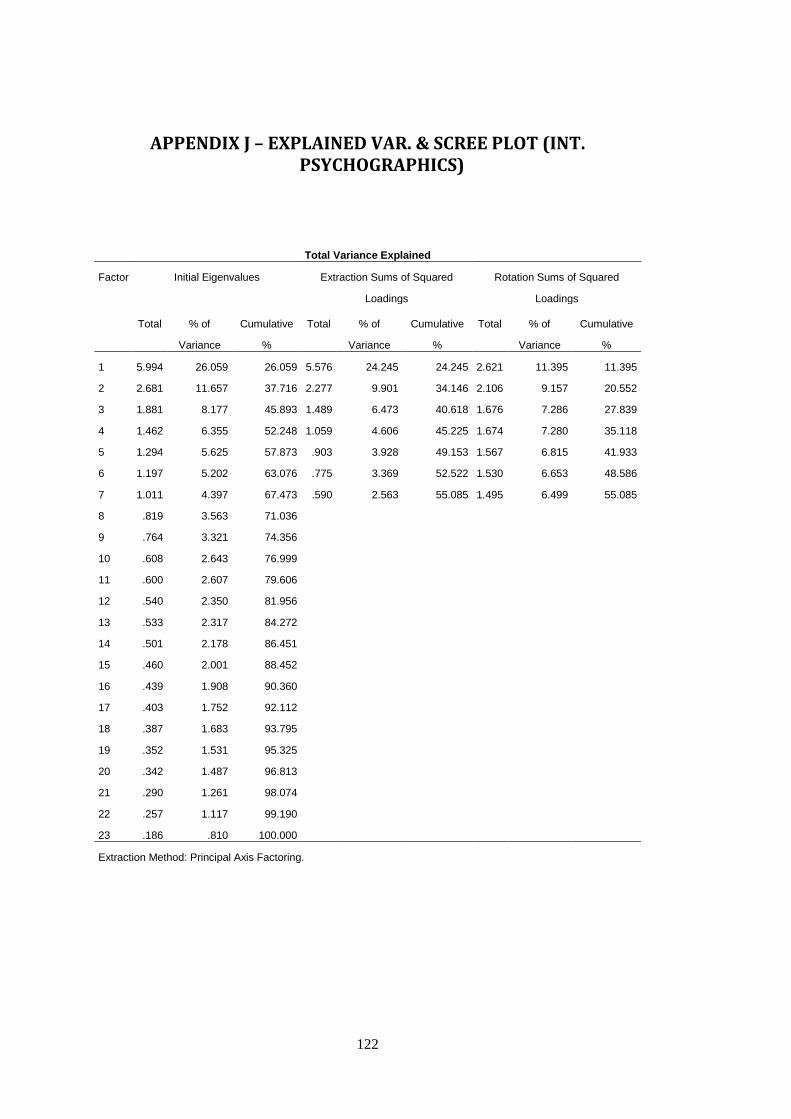
122
APPENDIX J – EXPLAINED VAR. & SCREE PLOT (INT. PSYCHOGRAPHICS)
Total Variance Explained
Factor Initial Eigenvalues Extraction Sums of Squared
Loadings
Rotation Sums of Squared
Loadings
Total % of
Variance
Cumulative
%
Total % of
Variance
Cumulative
%
Total % of
Variance
Cumulative
%
1 5.994 26.059 26.059 5.576 24.245 24.245 2.621 11.395 11.395
2 2.681 11.657 37.716 2.277 9.901 34.146 2.106 9.157 20.552
3 1.881 8.177 45.893 1.489 6.473 40.618 1.676 7.286 27.839
4 1.462 6.355 52.248 1.059 4.606 45.225 1.674 7.280 35.118
5 1.294 5.625 57.873 .903 3.928 49.153 1.567 6.815 41.933
6 1.197 5.202 63.076 .775 3.369 52.522 1.530 6.653 48.586
7 1.011 4.397 67.473 .590 2.563 55.085 1.495 6.499 55.085
8 .819 3.563 71.036
9 .764 3.321 74.356
10 .608 2.643 76.999
11 .600 2.607 79.606
12 .540 2.350 81.956
13 .533 2.317 84.272
14 .501 2.178 86.451
15 .460 2.001 88.452
16 .439 1.908 90.360
17 .403 1.752 92.112
18 .387 1.683 93.795
19 .352 1.531 95.325
20 .342 1.487 96.813
21 .290 1.261 98.074
22 .257 1.117 99.190
23 .186 .810 100.000
Extraction Method: Principal Axis Factoring.

123
3
3 The inflextion point at 8 indicates 7 factors (i.e., one less) to be considered for extraction.

124
APPENDIX K – CENTROIDS (SEGMENTATION FACTORS)
Centroids (Psychographic Factors)
Cluster
Shopping
Lovers
Direct
Purchasers
Suspicious
Browsers
Incompetent
Consumers Combined
Entertainment activities (EA) Mean .6115643 -.9663981 .3163373 .0805531 .0000000
Std.Dev. .49575241 .85902354 .71272929 1.04308175 1.00000000
Information gathering (IG) Mean .3281012 -.1615879 .6557623 -.8291310 .0000000
Std.Dev. .63293835 .83567489 .59901057 1.11741810 1.00000000
eCommerce transaction rate
(ETR)
Mean .8223320 .4432768 -.4687510 -.6586126 .0000000
Std.Dev. .69997154 .74501965 .81248754 .89453910 1.00000000
Privacy and Security Fears
(PSF)
Mean -.8412237 -.4099359 .7571881 .3339012 .0000000
Std.Dev. .87846038 .91110720 .58838590 .74936468 1.00000000
eCommerce convenience
(EC)
Mean .2979448 -.1175562 .1514038 -.3070555 .0000000
Std.Dev. .85406026 .92477545 1.01291126 1.07378047 1.00000000
Shopping at physical stores
(SPS)
Mean .2515726 -.5285660 .0268134 .2730995 .0000000
Std.Dev. .94857120 .96614414 1.06102870 .78873787 1.00000000
eCommerce inefficacy (EI) Mean -.3288855 -.2083510 -.3055236 .8211127 .0000000
Std.Dev. .63393938 .69545502 .80582135 1.22720261 1.00000000
eCommerce logistics issues
(ELI)
Mean -.3436127 -.0699402 .2924551 .0579958 .0000000
Std.Dev. 1.13692759 1.02857753 .79664188 .94037084 1.00000000
Internet window shopping
(IWS)
Mean .4746561 -.1338159 .2453133 -.5464144 .0000000
Std.Dev. .68395978 .68757651 .78741129 1.35099331 1.00000000
eCommerce offers (EO) Mean .3454328 -.2540552 -.1005547 .0555436 .0000000
Std.Dev. .91932958 1.00668227 1.00989655 .96421014 1.00000000

125
Centroids (Behavioral Factors)
Cluster
Opportunist
Customers
Transient
Customers
Need-based
Shoppers
Skeptical
Newcomers
Repetitive
Purchasers Combined
Online shopping
rate
Mean .194286 -.544132 -.765385 -.111658 1.061259 .000000
Std.Dev. .8878105 .7525797 .7174993 .8976785 .4649115 1.0000500
Refund rate Mean .99241 -.43327 .04845 -.37276 .18957 .00000
Std.Dev. .515057 .900781 1.053410 .927972 .865612 1.000050
Product diversity Mean -.73563 .55935 .34471 .54725 -.88652 .00000
Std.Dev. .638673 .834824 .957851 .766697 .559528 1.000050
Average price paid Mean .439679 .082215 .970653 -.899925 -.157923 .000000
Std.Dev. .8898875 .9923490 .4920676 .5376158 .8839264 1.0000500
Coupon
redemption rate
Mean 1.01415 1.11737 -.97063 -.85462 -.31484 .00000
Std.Dev. .498556 .497202 .312827 .413970 .540882 1.000050
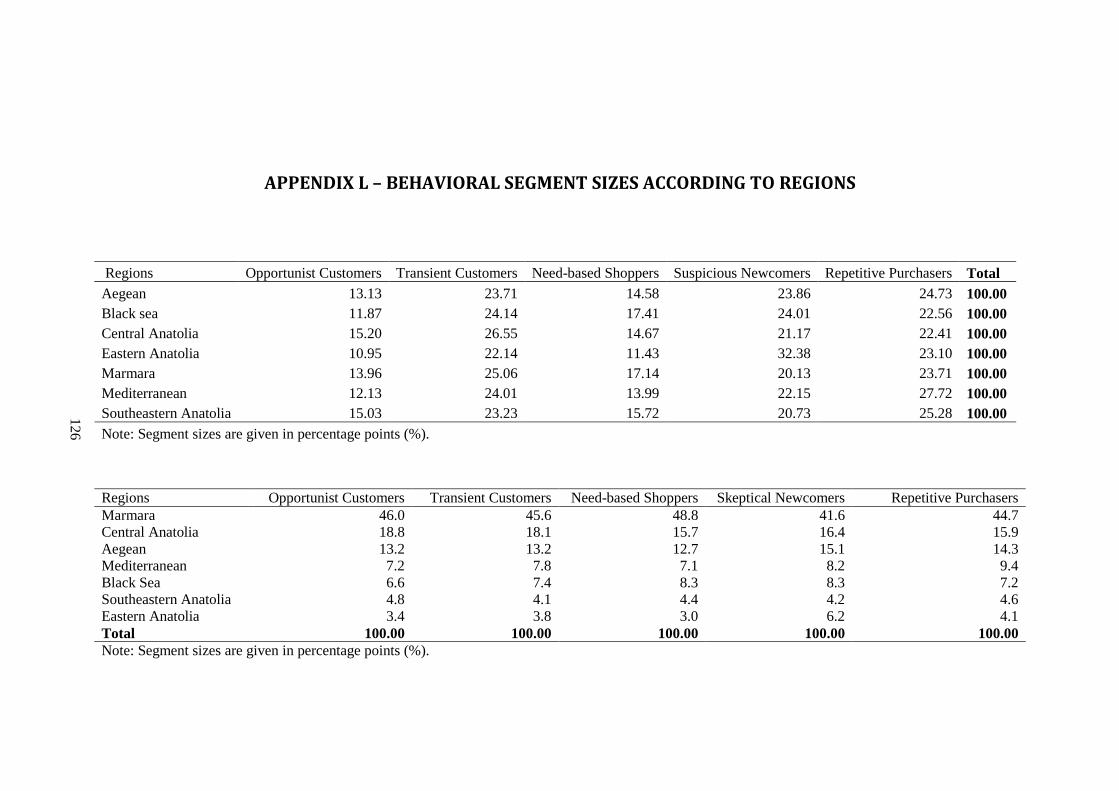
126
APPENDIX L – BEHAVIORAL SEGMENT SIZES ACCORDING TO REGIONS
Regions Opportunist Customers Transient Customers Need-based Shoppers Suspicious Newcomers Repetitive Purchasers Total
Aegean 13.13 23.71 14.58 23.86 24.73 100.00
Black sea 11.87 24.14 17.41 24.01 22.56 100.00
Central Anatolia 15.20 26.55 14.67 21.17 22.41 100.00
Eastern Anatolia 10.95 22.14 11.43 32.38 23.10 100.00
Marmara 13.96 25.06 17.14 20.13 23.71 100.00
Mediterranean 12.13 24.01 13.99 22.15 27.72 100.00
Southeastern Anatolia 15.03 23.23 15.72 20.73 25.28 100.00
Note: Segment sizes are given in percentage points (%).
Regions Opportunist Customers Transient Customers Need-based Shoppers Skeptical Newcomers Repetitive Purchasers
Marmara 46.0 45.6 48.8 41.6 44.7
Central Anatolia 18.8 18.1 15.7 16.4 15.9
Aegean 13.2 13.2 12.7 15.1 14.3
Mediterranean 7.2 7.8 7.1 8.2 9.4
Black Sea 6.6 7.4 8.3 8.3 7.2
Southeastern Anatolia 4.8 4.1 4.4 4.2 4.6
Eastern Anatolia 3.4 3.8 3.0 6.2 4.1
Total 100.00 100.00 100.00 100.00 100.00
Note: Segment sizes are given in percentage points (%).
126
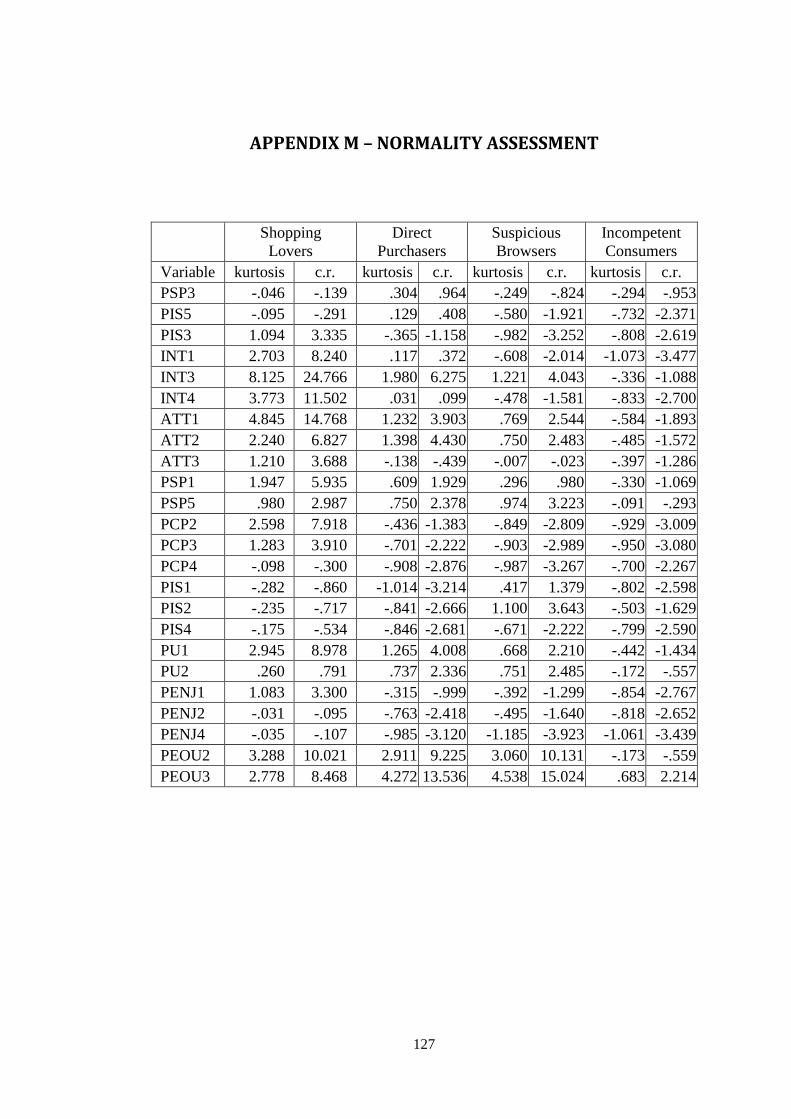
127
APPENDIX M – NORMALITY ASSESSMENT
Shopping
Lovers
Direct
Purchasers
Suspicious
Browsers
Incompetent
Consumers
Variable kurtosis c.r. kurtosis c.r. kurtosis c.r. kurtosis c.r.
PSP3 -.046 -.139 .304 .964 -.249 -.824 -.294 -.953
PIS5 -.095 -.291 .129 .408 -.580 -1.921 -.732 -2.371
PIS3 1.094 3.335 -.365 -1.158 -.982 -3.252 -.808 -2.619
INT1 2.703 8.240 .117 .372 -.608 -2.014 -1.073 -3.477
INT3 8.125 24.766 1.980 6.275 1.221 4.043 -.336 -1.088
INT4 3.773 11.502 .031 .099 -.478 -1.581 -.833 -2.700
ATT1 4.845 14.768 1.232 3.903 .769 2.544 -.584 -1.893
ATT2 2.240 6.827 1.398 4.430 .750 2.483 -.485 -1.572
ATT3 1.210 3.688 -.138 -.439 -.007 -.023 -.397 -1.286
PSP1 1.947 5.935 .609 1.929 .296 .980 -.330 -1.069
PSP5 .980 2.987 .750 2.378 .974 3.223 -.091 -.293
PCP2 2.598 7.918 -.436 -1.383 -.849 -2.809 -.929 -3.009
PCP3 1.283 3.910 -.701 -2.222 -.903 -2.989 -.950 -3.080
PCP4 -.098 -.300 -.908 -2.876 -.987 -3.267 -.700 -2.267
PIS1 -.282 -.860 -1.014 -3.214 .417 1.379 -.802 -2.598
PIS2 -.235 -.717 -.841 -2.666 1.100 3.643 -.503 -1.629
PIS4 -.175 -.534 -.846 -2.681 -.671 -2.222 -.799 -2.590
PU1 2.945 8.978 1.265 4.008 .668 2.210 -.442 -1.434
PU2 .260 .791 .737 2.336 .751 2.485 -.172 -.557
PENJ1 1.083 3.300 -.315 -.999 -.392 -1.299 -.854 -2.767
PENJ2 -.031 -.095 -.763 -2.418 -.495 -1.640 -.818 -2.652
PENJ4 -.035 -.107 -.985 -3.120 -1.185 -3.923 -1.061 -3.439
PEOU2 3.288 10.021 2.911 9.225 3.060 10.131 -.173 -.559
PEOU3 2.778 8.468 4.272 13.536 4.538 15.024 .683 2.214
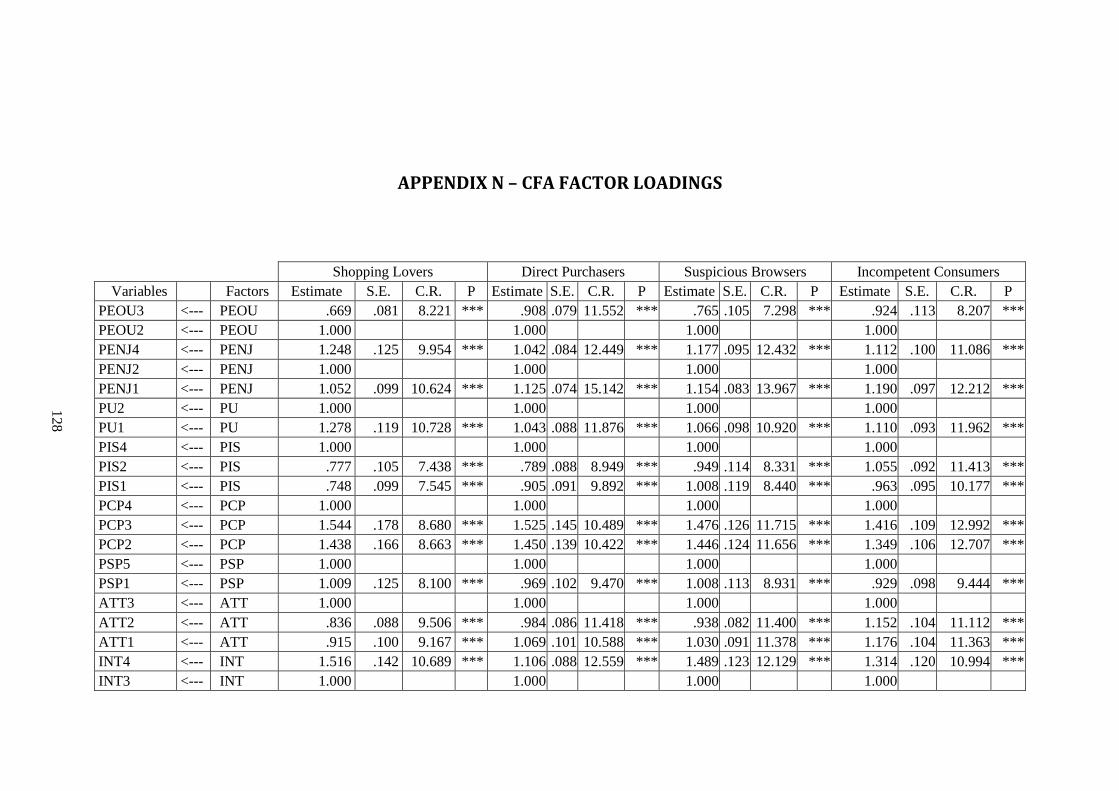
128
APPENDIX N – CFA FACTOR LOADINGS
Shopping Lovers Direct Purchasers Suspicious Browsers Incompetent Consumers
Variables Factors Estimate S.E. C.R. P Estimate S.E. C.R. P Estimate S.E. C.R. P Estimate S.E. C.R. P
PEOU3 <--- PEOU .669 .081 8.221 *** .908 .079 11.552 *** .765 .105 7.298 *** .924 .113 8.207 ***
PEOU2 <--- PEOU 1.000 1.000 1.000 1.000
PENJ4 <--- PENJ 1.248 .125 9.954 *** 1.042 .084 12.449 *** 1.177 .095 12.432 *** 1.112 .100 11.086 ***
PENJ2 <--- PENJ 1.000 1.000 1.000 1.000
PENJ1 <--- PENJ 1.052 .099 10.624 *** 1.125 .074 15.142 *** 1.154 .083 13.967 *** 1.190 .097 12.212 ***
PU2 <--- PU 1.000 1.000 1.000 1.000
PU1 <--- PU 1.278 .119 10.728 *** 1.043 .088 11.876 *** 1.066 .098 10.920 *** 1.110 .093 11.962 ***
PIS4 <--- PIS 1.000 1.000 1.000 1.000
PIS2 <--- PIS .777 .105 7.438 *** .789 .088 8.949 *** .949 .114 8.331 *** 1.055 .092 11.413 ***
PIS1 <--- PIS .748 .099 7.545 *** .905 .091 9.892 *** 1.008 .119 8.440 *** .963 .095 10.177 ***
PCP4 <--- PCP 1.000 1.000 1.000 1.000
PCP3 <--- PCP 1.544 .178 8.680 *** 1.525 .145 10.489 *** 1.476 .126 11.715 *** 1.416 .109 12.992 ***
PCP2 <--- PCP 1.438 .166 8.663 *** 1.450 .139 10.422 *** 1.446 .124 11.656 *** 1.349 .106 12.707 ***
PSP5 <--- PSP 1.000 1.000 1.000 1.000
PSP1 <--- PSP 1.009 .125 8.100 *** .969 .102 9.470 *** 1.008 .113 8.931 *** .929 .098 9.444 ***
ATT3 <--- ATT 1.000 1.000 1.000 1.000
ATT2 <--- ATT .836 .088 9.506 *** .984 .086 11.418 *** .938 .082 11.400 *** 1.152 .104 11.112 ***
ATT1 <--- ATT .915 .100 9.167 *** 1.069 .101 10.588 *** 1.030 .091 11.378 *** 1.176 .104 11.363 ***
INT4 <--- INT 1.516 .142 10.689 *** 1.106 .088 12.559 *** 1.489 .123 12.129 *** 1.314 .120 10.994 ***
INT3 <--- INT 1.000 1.000 1.000 1.000
128

129
4 ***: p<0.001
INT1 <--- INT 1.525 .145 10.530 *** 1.192 .081 14.758 *** 1.443 .126 11.495 *** 1.232 .125 9.875 ***
PIS3 <--- PIS .997 .093 10.724 *** 1.003 .083 12.128 *** 1.431 .138 10.338 *** 1.002 .081 12.369 ***
PIS5 <--- PIS .911 .085 10.678 *** .965 .080 12.117 *** 1.183 .119 9.965 *** .913 .080 11.416 ***
PSP3 <--- PSP .585 .099 5.881 *** .556 .080 6.943 *** .547 .082 6.655 *** .869 .091 9.563 ***4
129

130
APPENDIX O – ESTIMATED STRUCTURAL COEFFICIENTS
Variables Shopping Lovers Direct Purchasers Suspicious Browsers Incompetent Consumers
Depend.
Var.
Independ.
Var.
R2 U.Est. S.Est. S.E. C.R. R2 U.Est. S.Est. S.E. C.R. R2 U.Est. S.Est. S.E. C.R. R2 U.Est. S.Est. S.E. C.R.
PU PEOU 0.72 .350 .355 .076 4.611 0.58 .363 .325 .074 4.884 0.55 .234 .211 .083 2.809 0.55 .430 .429 .075 5.720
PCP .379 .487 .089 4.273 .465 .463 .091 5.093 .370 .404 .090 4.097 .245 .232 .102 2.387
PENJ .118 .193 .059 1.986 .128 .170 .057 2.228 .217 .276 .076 2.875 .291 .301 .102 2.861
ATT PEOU 0.69 -.099 -.068 .116 -.855 0.71 -.015 -.011 .080 -.186 0.71 .068 .052 .084 .806 0.70 -.004 -.005 .076 -.057
PU .661 .448 .235 2.811 .548 .463 .121 4.525 .331 .283 .112 2.967 .377 .407 .098 3.852
PCP .357 .311 .139 2.566 .500 .422 .110 4.560 .499 .465 .110 4.526 .271 .277 .092 2.951
PENJ .029 .032 .079 .362 -.056 -.063 .057 -.984 .026 .028 .075 .339 .053 .059 .093 .567
PIS .125 .137 .052 2.417 -.037 -.038 .050 -.743 .074 .064 .067 1.109 .161 .202 .051 3.173
PSP .206 .217 .054 3.810 .198 .187 .065 3.067 .186 .177 .061 3.072 .167 .187 .063 2.673
INT PU 0.78 .247 .253 .157 1.574 0.82 .057 .053 .119 .479 0.85 .086 .091 .085 1.012 0.71 -.192 -.195 .124 -1.545
PCP -.014 -.018 .086 -.163 .150 .138 .099 1.509 .292 .338 .088 3.314 .007 .007 .107 .068
PENJ -.007 -.012 .047 -.147 .029 .036 .048 .619 .107 .144 .054 1.996 .256 .270 .102 2.508
PSP .030 .047 .038 .774 .045 .046 .057 .778 .110 .130 .047 2.353 -.019 -.020 .075 -.259
ATT .474 .716 .116 4.092 .627 .685 .133 4.716 .306 .379 .096 3.174 .830 .780 .184 4.520
PEOU -.064 -.066 .069 -.932 .067 .056 .066 1.024 .023 .022 .059 .386 -.018 -.018 .080 -.227
R2: Squared multiple correlation
U.Est: Unstandardized estimate
S.Est: Standardized estimate
S.E.: Standard error
C.R.: Critical ratio
130
131
CURRICULUM VITAE
FARID HUSEYNOV
Middle East Technical University
Informatics Institute, Information Systems Department
Inönü Bulvarı. 06800, Çankaya, ANKARA, Turkey
Email: [email protected]
EDUCATION
PhD, Information Systems
Middle East Technical University (METU), Ankara, Turkey
2013-2016
MSc, Information Systems
Middle East Technical University (METU), Ankara, Turkey
2010-2013
B.S., Business Administration
Middle East Technical University (METU), Ankara, Turkey
2004-2009
SCHOLARSHIPS
Azerbaijan Republic Government Scholarship for PhD studies Full Scholarship
2013-2016
JATCAFA Scholarship for PhD Studies Japan Turkey and Central Asia Friendship Association Scholarship
2013-2015
Azerbaijan Republic Government Scholarship for MSc studies Full Scholarship
2010-2013
JATCAFA Scholarship for MSc Studies Japan Turkey and Central Asia Friendship Association Scholarship
2010-2012

132
PUBLICATIONS
Huseynov, F. (2015). Implementation of Ubiquitous Computing Technologies in
Supply Chain Management. American Academic & Scholarly Research Journal, 7
(4), pp. 24-32.
Huseynov, F., Huseynov, S.Y. & Özkan, S. (2016). The influence of knowledge-
based e-commerce product recommender agents on online consumer decision-
making. Information Development, 32, 81-90. DOI: 10.1177/0266666914528929
Huseynov, F. & Yıldırım, S.O. (2016). Behavioral issues in B2C e-commerce: The-
state-of-the-art. Information Development, 32(5), 1343-1358. DOI:
10.1177/0266666915599586
Huseynov, F. & Yıldırım, S.O. (2016). Internet users’ attitudes toward business-to-
consumer online shopping: A survey. Information Development, 32(3), 452-465.
DOI: 10.1177/0266666914554812
Huseynov, F. & Yıldırım, S.O. Online Consumer Typologies and Their Shopping
Behaviors in B2C E-Commerce Platforms. (Manuscript submitted for publication,
under review)
Huseynov, F. & Yıldırım, S.O. Behavioral Segmentation Analysis of Online
Consumer Audience in Turkey by Using Real E-Commerce Transaction Data.
(Manuscript submitted for publication, under review)