determinants of toothpaste brand choice in urban
TRANSCRIPT

DETERMINANTS OF TOOTHPASTE BRAND CHOICE IN URBAN PHILIPPINES
Ben Paul B. Gutierrez*
This paper investigates toothpaste brand choice behavior of consumers in urban Philippines. It proceeds from an earlier paper which utilized discriminant analysis and discusses another approach to the problem using logistic regression. Consumers’ evaluation of toothpaste brands and their preferred brands were used to estimate logit models. With the exception of Colgate brand, the goodness of fit of the estimated models is generally high as shown by the prediction rates and Akaike Information Criterion (AIC) numbers. Finally, the comparable prediction rates, AICs, and Schwartz Criterion (SC) numbers have also shown that the last brand bought is a significant predictor of brand choice. This variable can also replace the brand most frequently purchased as a dependent variable of the brand choice models.
I. INTRODUCTION
In an earlier paper, it was argued that discriminant analysis as a useful classification tool has a limitation because of its assumption of normality. Although nonparametric discriminant methods have overcome this problem, there are several reasons that make logistic modeling more advantageous. Besides having no assumption of normality, the multinomial logit model relates two brands to each other. Finally, a more compelling reason is that the use of a much wider range of predictors such as categorical variables is not possible with discriminant analysis.
Logistic regression is more appropriate to use when the dependent variable can have only two values––an event occurring or not occurring. Brand choice is an example of a limited dependent variable where logit modeling is appropriate. A system of logit models differentiates several brands. Each logit model within the system describes the relationship between any two brands. Moreover, being regression models, some
definitive statements can be made about the causality of the explanatory variables.
Logistic regression requires fewer assumptions than discriminant analysis. It does not require the assumption of multivariate normality of the independent variables. Hence, the categorical variables can be utilized freely in a logit model. In addition, homogeneity of variances is not required.
A major assumption of logit modeling is that consumers are assumed to follow compensatory decision rules when choosing brands. However, most psychologists assume that consumers use information selectively and sequentially eliminate brands from their choice set (Restle, 1961; Tversky, 1972) which led to the development of attribute-based processing models. Another assumption of linear logit models is Luce’s (1959) independence of irrelevant alternatives (IIA) property. This paper begins with the description of the independent variables in Section II
Philippine Management Review 2005, Vol. 12, pp. 45-71.
________________________ * Professor of Marketing at the College of Business Administration, University of the Philippines,
Diliman, Quezon City.
DETERMINANTS OF TOOTHPASTE BRAND CHOICE IN URBAN PHILIPPINES
46
followed by a review of model estimation and interpretation in Section III. Sections IV and V present and discuss the multinomial and binary models’ results, respectively. In Section VI, the models are validated through
the prediction rates and the Akaike Information Criterion (AIC) and Schwartz Criterion (SC) numbers, while Section VII concludes the paper.
II. LOGIT MODEL FORMULATION
The general form of the logistic regression model is:
y = f (attributes, profiles, demographic variables)
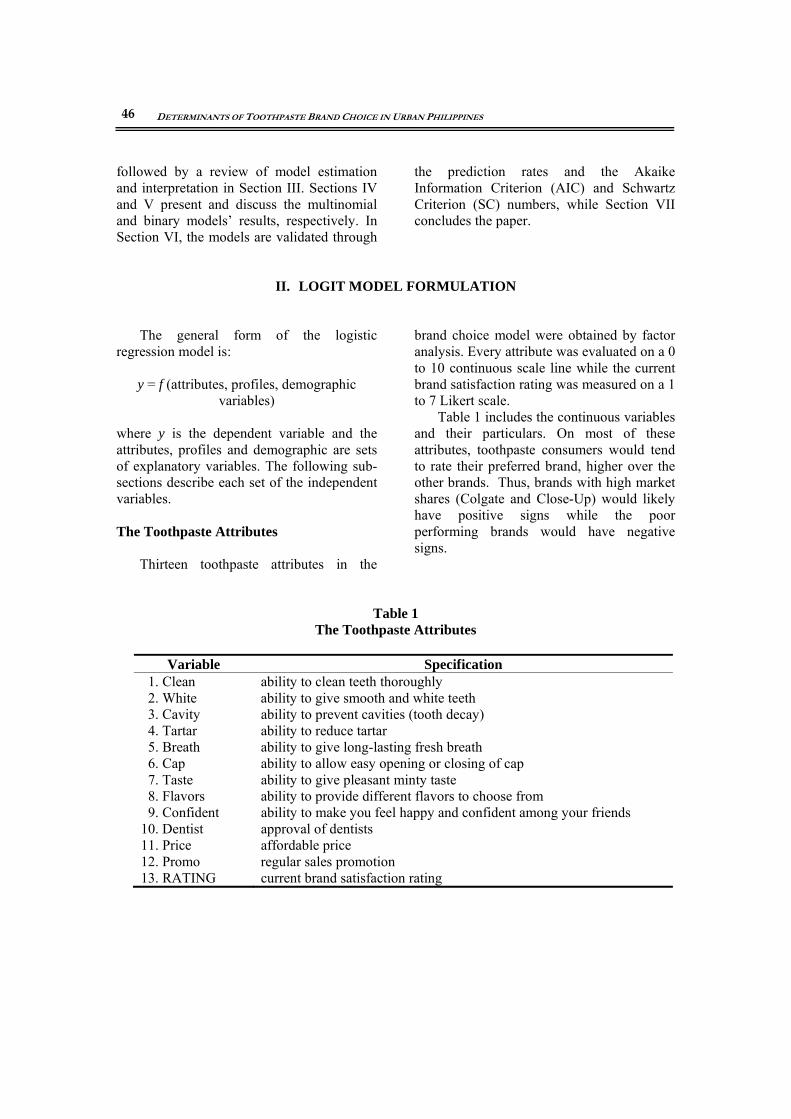
where y is the dependent variable and the attributes, profiles and demographic are sets of explanatory variables. The following sub-sections describe each set of the independent variables. The Toothpaste Attributes Thirteen toothpaste attributes in the
brand choice model were obtained by factor analysis. Every attribute was evaluated on a 0 to 10 continuous scale line while the current brand satisfaction rating was measured on a 1 to 7 Likert scale. Table 1 includes the continuous variables and their particulars. On most of these attributes, toothpaste consumers would tend to rate their preferred brand, higher over the other brands. Thus, brands with high market shares (Colgate and Close-Up) would likely have positive signs while the poor performing brands would have negative signs.
Table 1
The Toothpaste Attributes
Variable Specification 1. Clean ability to clean teeth thoroughly 2. White ability to give smooth and white teeth 3. Cavity ability to prevent cavities (tooth decay) 4. Tartar ability to reduce tartar 5. Breath ability to give long-lasting fresh breath 6. Cap ability to allow easy opening or closing of cap 7. Taste ability to give pleasant minty taste 8. Flavors ability to provide different flavors to choose from 9. Confident ability to make you feel happy and confident among your friends 10. Dentist approval of dentists 11. Price affordable price 12. Promo regular sales promotion 13. RATING current brand satisfaction rating

BEN PAUL B. GUTIERREZ
47
The Consumer Attitudinal Profiles
The second set of explanatory variables in the brand choice model are two consumer-attitudinal profiles. They provide a contextual description of the consumers choosing a particular brand of toothpaste. As
these predictors are characteristics of the decision maker rather than of alternative brands, they enter the model as dummy variables. Table 2 gives the explanatory attitudinal variables and their dummy assignments.
Table 2 The Consumer Attitudinal Variables
Variable Specification
1. SWITCH 1 if classified as a brand switcher, and 0 otherwise 2. INVOLVE 1 if classified as highly involved in purchase decision,
and 0 otherwise Brand switching and purchase decision involvement were chosen to be the best attitudinal variables for the Philippine situation. Unfortunately, the results from the brand switching and variety seeking scales have to be discarded, because of low internal consistency. However, the brand switching variable was introduced in the model using direct consumer responses to a brand loyalty measure. A positive sign in brand switching and purchase involvement is expected for brands with high market shares (Colgate and Close-Up), while the brands with low market shares would likely have negative signs. The Demographic Variables
Traditional microeconomic models of brand choice available from panel data literature (i.e., based on Guadagni and Little, 1983) do not usually account for demographic variables. Later models using scanner panel data have incorporated demographic variables such as family size, presence of children, and income (Gupta and Chintagunta, 1994; Kalyanam and
Putler, 1997). The third set of predictors contains three demographic variables which were measured using a categorical scale and four variables treated as if they were continuous variables. Similar to the attitudinal profiles, demographic variables characterize the decision maker rather than the choice. Dummy variables represent the categorical demographic variables in the logit model. Table 3 provides the assignment of the demographic dummy variables and their specifications. The small sample size of this study prevented the use of more dummy variables in the models. Li (1977) estimated a logit model, explaining the probability of owning a home, with eleven dummy variables. However, Li’s (1977) study utilized more than 400,000 households, far exceeding the 30 observations per cell recommended by Amemiya (1981). However, Kalyanam and Putler (1997) utilized as many as 63 parameters in one set of their logit models on a sample of 661 households for ketchup and 279 households for coffee.

DETERMINANTS OF TOOTHPASTE BRAND CHOICE IN URBAN PHILIPPINES
48
Table 3 The Categorical Demographic Variables
Variable Specification 1. FEMALE 1 when respondent is female, 0 if male 2. STATUS 1 when respondent is unmarried, and 0 otherwise 3. CHILD 1 when respondent has children, and 0 otherwise
To further reduce the number of
parameters in the model, the standard linear hypothesis, as described by Amemiya (1981, p. 1500), was employed. Table 4 outlines the modifications made with categorical variables: age, education, family size, and
income. These variables are interval variables when the exact values are elicited from the respondents. However, to simplify data collection, ordered categories were utilized during the survey.
Table 4 The Modified Demographic Variables
Variable Specification
1. AGE (in years)
12.0, when respondent is aged under 15 years; 20.5, when respondent is aged between 16-25 years; 30.5, when respondent is aged between 26-35 years; 40.5, when respondent is aged between 36-45 years; 55.0, when respondent is aged over 45 years.
2. EDUC (in years)
6.0, when respondent has completed elementary school; 10.0, when respondent has completed high school; 14.0, when respondent has completed a college degree; 17.0, when respondent has completed a masters or PhD degree.
3. FSIZE
2, when family size is one to two individuals; 4, when family size is three to four individuals; 6, when family size is five to six individuals; 8, when family size is seven to eight individuals; 10, when family size is over eight individuals.
4. INC (in A$)
125, when average monthly income is below A$250; 500, when average monthly income is between A$250-750; 1,000, when average monthly income is between A$750-1,250; 1,875, when average monthly income is between A$1,250-2,500; 3,000, when average monthly income exceeds A$2,500.
A unique independent variable that does not belong to either of the three groups is the last brand bought. As a dummy variable, LastBrand, has a value of 1, when the subject brand being modeled was the last brand
bought by the consumer. When another brand was previously purchased, the dummy variable is zero. Thus, LastBrand measures the lagged brand choice (Rajendran and Tellis, 1994).

BEN PAUL B. GUTIERREZ
49
To summarize, there are twenty-three predictors in the toothpaste brand choice models resulting from the combination of attributes, attitudinal profiles, demographic
variables, and last brand bought. All of these predictors were jointly introduced in building the models.
III. MODEL ESTIMATION
The general form of the logit model is:
Sj
je X
e X
je Vj
e Vi
S
i
j
i
,
Pr
(1)
where Xi’s are the attribute weights that vary across alternatives or choices. Let Wi contain the characteristics of the decision maker which is the same for all the choices. By incorporating this into the model the equation becomes:
j
wXe
wXe
jYrPj
i
)(
(2)
This is now a mixed logit model containing both the characteristics of the chooser and the characteristics of the choices. Originally referred to by McFadden (1974) as a conditional logit model, it is now usually called the multinomial logit model. To estimate the model, the equation is modified by taking logarithm on both sides into:
)(
)(log
1njni
N
nn
ojoij
ie
XXa
aaP
P
(3)
where i = 1, j = 2 (binomial case), i = 1, 2,..., M-1 (multinomial case), Pi = probability of selecting
alternative i, M = number of alternatives,
N = number of attributes or
variables, Xni = value of nth attribute for
alternative i, and a’s = parameters to be estimated. Since the explanatory variables that are classified as characteristics of choice distinguish the alternative brands, the attribute score (Xnj) of the base brand, j is subtracted from attribute score (Xni) of the subject brand. Agresti (1990) described that two methods are available in fitting logit models: the simultaneous and separate fitting approaches. Generalized logit models are fitted by maximizing the likelihood while simultaneously satisfying J-1 equations that specify the model. Simultaneous fitting uses convergence iterative procedures such as Newton-Raphson method. An alternative approach fits logit models separately for J-1 pairings of responses treating each pair as a binary model. The separate fitting method utilizes procedures such as iteratively reweighted least squares (IRLS) algorithm.
The estimators using the separate fitting approach are less efficient than those of the logit model fitted simultaneously. However, Begg and Gray (1984) claimed that estimates are not very inefficient unless the probability of classification in the baseline category is very small. They advocated that when there is no natural baseline category, it is best to use the response category with the highest occurrence as the baseline in the separate fitting approach. The investigation employed the separate fitting approach because it is

DETERMINANTS OF TOOTHPASTE BRAND CHOICE IN URBAN PHILIPPINES
50
commonly used by many researchers and it is available in many software packages. The SAS Logistic Procedure fits linear logistic regression models for binary response or ordinal response data. It uses iteratively reweighted least squares (IRLS) algorithm to compute the parameter estimates of the model. To estimate the models, all selection methods available in the SAS Logistic Procedure were utilized. The simplest is the default method which fits the basic logistic model. The other three methods are forward for forward selection, backward for backward elimination, and stepwise for stepwise selection. The investigator can choose the best method by comparing the three criteria calculated by the logistic procedure. These three statistical criteria consist of -2 Log Likelihood (-2 Log L), Akaike Information Criterion (AIC), and Schwartz Criterion (SC). Lower values of the statistic indicate that the model is more desirable. When the best model is chosen, it is necessary to check for any multicollinearity and nonlinearity in all the continuous variables. Multicollinearity was evaluated by inspecting the correlation matrices of all the models. There is collinearity between any two predictors when the correlation coefficient is greater than 0.80. Since no multicollinearity was found in the models, interaction terms were not required.
When quasi or complete separation occurs in a model, this indicates that the maximum likelihood may not or does not exist. It is necessary to identify the confounding variable/s causing the separation problem by performing univariate analyses on each of the explanatory variables as recommended by Hosmer and Lemeshow (1989). During the study only predictor variables having a p-value less than 0.25 were selected for multivariate analysis. Some researchers who used the value of 0.25 as screening criterion for selection of candidate variables are Bendel and Afifi (1977) for linear regression, and Mickey and Greenland
(1989) for logistic regression. They demonstrated that utilizing a more traditional level (such as 0.05) often fails to identify variables known to be important.
Upon estimating the multinomial logit models, it is now easy to derive the relationships between any two brands among brands 2 to 8. Suppose:
CLEANBOD cbaPP
2121211
2log
(4)
CLEANBODY cbaPP
3131311
3log
(5)
then the relationship between brands 2 and 3 is
CLEANBODY ccbb
aaPP
)()(
)(log
21312131
21312
3
(6)
where brand 2 now becomes the base brand. Furthermore, one can analyze brand 1 by simply reversing the relationship into:
PP
PP
2
1
1
2 loglog (7)
The interpretation of any fitted model enables the researcher to draw practical inferences from the estimated coefficients in the model. Hosmer and Lemeshow (1989) identified two critical issues in the interpretation. Firstly, determine the functional relationship between dependent variable and the predictor variable (the link function) and secondly, appropriately define the unit of change for the predictor variable. To apply these interpretation issues, consider first the linear regression model. The link function is simply the identity function since the dependent variable is linear in the parameters (where y=y). For any value of x, the slope coefficient is the difference between the value of dependent variable at x+1 and the value of the dependent variable at x. Therefore, the linear model coefficient is interpreted as the

BEN PAUL B. GUTIERREZ
51
resulting change in the measurement scale of the dependent variable for a unit change in the independent variable.
However, in the logistic regression model, the link function is the logit transformation g(x) = ln{(x)/[1-(x)]} = β0+β1x. Thus in the logistic model β1= g(x+1)–g(x), the slope coefficient represents the change in the logit for every unit change in the independent variable x. While the interpretation of the linear regression model coefficients is straightforward, extra care
must be observed in interpreting the logit model coefficients. The odds ratio, denoted by psi (), is the ratio of the odds for g(x+1) to the odds for g(x). Such measure of association approximates how more likely (or unlikely for a negative coefficient) is the outcome to be present among those with predictor x+1 than among those with predictor x. The odds ratio value is simply found by taking the exponent of the parameter estimate.
IV. MODEL RESULTS – MULTINOMIAL MODELS Beam was assigned as the reference
brand because it has fewer variants and low price positioning. On the other hand, the four remaining toothpaste brands have different product positioning because of more flavor variants. Hence, the four multinomial logit models were estimated for brands 2 to 5.
The dataset was randomly divided into two parts: the calibration data (Part 1) and the validation data (Part 2). The dependent variable of the first two models is the most frequently bought brand. On the other hand, the dependent variable of the third model is the last brand bought to test the question whether it could serve as a surrogate to brand choice or not.
Tables 5 to 10 summarize the parameter estimates of the multinomial models. Tables 5 to 7 contain the logit models for part 1 data
while Tables 8 to 10 have models for part 2 data. The tables only include the independent variables that are significant up to ninety percent. There are interesting observations about the variables explaining the brand choice. In Table 5, flavor variants and ability to give confident feeling are very significant attributes (at =0.01) affecting the choice between Close-Up and Beam. It is 1.710 times more likely that Close-Up would be chosen over Beam when Close-Up is rated one scale higher for its ability to give a confident feeling after brushing. It is reasonable to assume that Close-Up is chosen 1.201 times over Beam when it is rated one scale higher for its dental endorsement. Females appear to be 0.520 times more unlikely selecting Close-Up over Beam.

DETERMINANTS OF TOOTHPASTE BRAND CHOICE IN URBAN PHILIPPINES
52
Table 5
Multinomial Logit Models Parameter Estimates and Odds Ratios: Toothpaste Part 1 Data
Dependent Variable - Frequently Used Brand
PARAMETER P2/P1* CLOSEUP
P3/P1 COLGATE
P4/P1 HAPEE
P5/P1 PEPSODENT
INTERCEPT
-0.6393 (0.8065) -0.2122 (0.5282) 2.9424 (2.5539) -39.460c (22.370)
4 TARTAR 0.5661b (0.2642) 1.761
6 CAP 0.6265a (0.1913) 1.871
7 TASTE -0.3943c (0.2297) 0.674
8 FLAVOR -0.6106a (0.2014) 0.543
9 CONFIDENT 0.5364a (0.1619) 1.710
10 DENTISTS 0.1833c (0.1057) 1.201
11 PRICE 0.3432c (0.2060) 1.409
12 PROMO -0.5455b (0.2414) 0.580
SWITCH -0.6630b (0.3005) 0.515
AGE 0.0435b (0.0192) 1.044
FEMALE -0.6540c (0.3582) 0.520
EDUC -0.3389b (0.1698) 0.713
FSIZE 1.5609c (0.8555) 4.763
DF 8 7 8 3
SCORE 35.367 (p = 0.0001)
16.983 (p = 0.0175)
35.502 (p = 0.0001)
11.523 (p = 0.0092)
AIC 225.950 299.370 108.008 18.491 SC 256.970 326.944 139.029 32.278 -2 LOG L 207.950 283.370 90.008 10.491 *Base brand, P1= Beam; aSignificant at = 0.01; bSignificant at = 0.05; cSignificant at = 0.10 First row items are parameter estimates. Items in parenthesis are asymptotic t-statistics. Second row items are odds ratios.

BEN PAUL B. GUTIERREZ
53
Table 6 Multinomial Logistic Regression Models
Parameter Estimates and Odds Ratios: Toothpaste Part 1 Data With Last Brand Bought as Predictor
PARAMETER P2/P1*
CLOSEUP P3/P1
COLGATE P4/P1
HAPEE P5/P1
PEPSODENT INTERCEPT
-2.9157a (1.0215) 0.0478 (0.3521) 2.7983 (3.1193) -14.7710a(5.1473)
LAST BRAND 4.7664a (0.6606) 117.499
3.0653a (0.4051) 21.440
4.4082a (0.9330) 82.125
4.2805c (2.3047) 72.279
2 WHITE -0.8271c (0.4377) 0.437
3 CAVITY 1.0875b (0.4890) 2.967
6 CAP 0.5416b (0.2281) 1.719
8 FLAVOR -0.6098a (0.2034) 0.543
9 CONFIDENT 0.8490a (0.2278) 2.337
10 DENTISTS 0.5851a (0.1835) 1.795
12 PROMO -0.6557b (0.2962) 0.519
EDUC -0.5166b (0.2171) 0.597
FSIZE 1.3665b (0.6444) 3.922
CHILD -1.1189b (0.5690) 0.327
1.9616c (1.0254) 7.111
INC -0.0018c (0.0011) 0.988
DF 10 4 11 3 SCORE
119.761 (p = 0.0001)
80.933 (p = 0.0001)
62.072 (p = 0.0001)
26.034 (p = 0.0001)
AIC 141.290 222.821 86.814 18.902 SC 179.204 240.055 128.175 32.689 -2 LOG L 119.290 212.821 62.814 10.902 *Base brand, P1= Beam; aSignificant at = 0.01; bSignificant at = 0.05; cSignificant at = 0.10 First row items are parameter estimates. Items in parenthesis are asymptotic t-statistics. Second row items are odds ratios.

DETERMINANTS OF TOOTHPASTE BRAND CHOICE IN URBAN PHILIPPINES
54
Table 7 Multinomial Logistic Regression Models
Parameter Estimates and Odds Ratios: Toothpaste Part 1 Data Dependent Variable - Last Brand Bought
PARAMETER P2/P1*
CLOSEUP P3/P1
COLGATE P4/P1
HAPEE P5/P1
PEPSODENT INTERCEPT 0.2101 (1.1329) -3.2586a (1.0999)
-1.1750 (0.8365) 1.2570 (3.4896)
1 CLEAN 0.1656c (0.0960) 1.180
4 TARTAR 0.1668c (0.0932) 1.182
6 CAP 0.2249b (0.1101) 1.252
-0.1918a (0.0775) 0.826
0.3710a (0.1482) 1.449
7 TASTE 0.2755c (0.1444) 1.317
-0.5494a (0.1597) 0.577
8 FLAVOR -0.2999b (0.1451) 0.741
0.2659b (0.1114) 1.305
9 CONFIDENT -0.2946 (0.1774) 0.745
10 DENTISTS 0.4940b (0.2394) 1.639
11 PRICE 0.1463c (0.0809) 1.157
RATING 0.2932c (0.1635) 1.341
-3.5571a (1.3327) 0.029
SWITCH 0.7381b (0.3842) 2.092
3.3593c (1.8314) 28.768
AGE 0.0507a (0.0182) 1.052
EDUC 1.0343b (0.4893) 2.813
FEMALE 0.7371c (0.4562) 2.090
STATUS -1.0515b (0.4468) 0.349
-2.4969b (1.2893) 0.082
CHILD -1.3399b (0.6723) 0.262
1.1884a (0.4553) 3.282
-1.8354b (0.8471) 0.160
INC -0.0069c (0.0036) 0.993
DF 11 9 10 7 SCORE 27.811(p=0.0035) 30.435(p=0.0004) 38.500(p=0.0001) 39.892(p=0.0001) AIC 229.858 308.703 179.790 41.335 SC 271.219 343.170 217.704 68.909 -2 LOG L 205.858 288.703 157.790 25.335 *Base brand, P1= Beam; aSignificant at = 0.01; bSignificant at = 0.05; cSignificant at = 0.10 First row items are parameter estimates. Items in parenthesis are asymptotic t-statistics. Second row items are odds ratios.

BEN PAUL B. GUTIERREZ
55
Table 8 Multinomial Logistic Regression Models
Parameter Estimates and Odds Ratios: Toothpaste Part 2 Data Dependent Variable - Frequently Used Brand
PARAMETER P2/P1*
CLOSEUP P3/P1
COLGATE P4/P1
HAPEE P5/P1
PEPSODENT INTERCEPT
-0.7837 (1.6672)
-1.6389 (0.9885)
-1.0632 (1.0386)
-6.4899a (1.4797)
2 WHITE 0.3967a (0.1581) 1.487
3 CAVITY -0.3450c (0.1840) 0.708
6 CAP 0.2204a (0.0758) 1.247
-0.1890b (0.0849) 0.828
9 CONFIDENT 0.2030b (0.0951) 1.225
12 PROMO 0.2150c (0.1239) 1.240
RATING 0.3790c (0.2023) 1.461
AGE -0.0692b (0.0427) 0.933
0.0825b (0.0386) 1.086
EDUC -0.1628c (0.0894) 0.850
FEMALE 0.5228c (0.2941) 1.687
FSIZE -0.2673a (0.1067) 0.765
DF 5 7 7 1 SCORE
30.083 (p = 0.0001)
16.452 (p = 0.0213)
25.410 (p = 0.0006)
5.770 (p = 0.0163)
AIC 213.482 288.030 129.578 39.970 SC 233.816 315.142 156.691 46.748 -2 LOG L 201.482 272.030 113.578 35.970 *Base brand, P1= Beam; aSignificant at = 0.01; bSignificant at = 0.05; cSignificant at = 0.10 First row items are parameter estimates. Items in parenthesis are asymptotic t-statistics. Second row items are odds ratios.

DETERMINANTS OF TOOTHPASTE BRAND CHOICE IN URBAN PHILIPPINES
56
Table 9 Multinomial Logistic Regression Models
Parameter Estimates and Odds Ratios: Toothpaste Part 2 Data with Last Brand Bought as Predictor
PARAMETER P2/P1*
CLOSEUP P3/P1
COLGATE P4/P1
HAPEE P5/P1
PEPSODENT INTERCEPT
-2.8170a (0.5478)
-0.4649 (1.1134)
-7.5671a (2.1824)
-10.2705a(3.5562)
LAST BRAND 4.6764a (0.6040) 107.378
4.2964a (0.5697) 73.436
4.1831a (0.7042) 65.567
6.0895a (2.1559) 441.220
2 WHITE 0.3205c (0.1677) 1.378
0.2609b (0.1319) 1.298
8 FLAVOR -0.2425b (0.1242) 0.785
9 CONFIDENT 0.5143a (0.1627) 1.673
AGE 0.1406c (0.0743) 1.151
FEMALE -1.0840c (0.5880) 0.338
1.1403a (0.4344) 3.128
DF
5 9 4 2
SCORE 130.682 (p = 0.0001)
106.494 (p = 0.0001)
92.894 (p = 0.0001)
58.075 (p = 0.0001)
AIC
118.059 178.974 84.613 24.513
SC
138.393 212.864 101.558 34.680
-2 LOG L 106.059 158.974 74.613 18.513 *Base brand, P1= Beam; aSignificant at = 0.01; bSignificant at = 0.05; cSignificant at = 0.10 First row items are parameter estimates. Items in parenthesis are asymptotic t-statistics. Second row items are odds ratios.

BEN PAUL B. GUTIERREZ
57
Table 10 Multinomial Logistic Regression Models
Parameter Estimates and Odds Ratios: Toothpaste Part 2 Data Dependent Variable - Last Brand Bought
PARAMETER P2/P1*
CLOSEUP P3/P1
COLGATE P4/P1
HAPEE P5/P1
PEPSODENT INTERCEPT
-0.6015 (1.6242)
-2.5336 (0.9472)
-0.1954 (1.3704)
-3.1892a (0.7094)
1 CLEAN -0.4362c (0.2421) 0.646
2 WHITE 0.2895b (0.1275) 1.336
6 CAP 0.2553a (0.0671) 1.291
-0.1385b (0.0688) 0.871
11 PRICE 0.0859c (0.0518) 1.090
-0.1991c (0.1161) 0.819
12 PROMO 0.4093a (0.1374) 1.506
RATING 0.4686b (0.2106) 1.598
EDUC -0.1995b (0.0891) 0.819
0.1481b (0.0686) 1.160
-0.2287b (0.1164) 0.796
STATUS -1.2052c (0.7408) 0.300
FSIZE -0.2208b (0.1017) 0.802
0.1313c (0.0795) 1.140
INC 1.3750a (0.5480) 3.955
DF 5 5 7 4 SCORE
27.210 (p = 0.0001)
13.073 (p = 0.0227)
27.860 (p = 0.0002)
5.815 (p = 0.2134)
AIC 222.967 302.064 151.545 78.783 SC 243.302 322.399 178.658 95.728 -2 LOG L 210.967 290.064 135.545 68.783 *Base brand, P1 = Beam; aSignificant at = 0.01; bSignificant at = 0.05; cSignificant at = 0.10 First row items are parameter estimates. Items in parenthesis are asymptotic t-statistics. Second row items are odds ratios.
Table 8 using the Part 2 data is a
different model describing the CloseUp-Beam relationship. In this case, the estimates of Cap, RATING, EDUC, and FSIZE are significant. Thus, it is highly likely that Close-Up would be chosen over Beam when Close-Up’s closure and brand satisfaction rating is rated one scale higher. However, more educated individuals and those belonging to bigger families would more unlikely choose Close-Up over Beam.
At 95 percent level, Table 5 shows that SWITCH and AGE are significant predictors in the choice of Colgate over Beam. Brand switchers would more unlikely choose Colgate over Beam, but older individuals would prefer Colgate. Moreover, Table 8 shows that Cap, ability to give confident feeling, and FEMALE are significant. The negative sign for Cap is quite surprising considering that Colgate, being the market leader, is a more popular brand with a high

DETERMINANTS OF TOOTHPASTE BRAND CHOICE IN URBAN PHILIPPINES
58
quality image. However, FEMALE has the expected positive sign. This finding reinforces Colgate’s image as a family brand that is purchased by most mothers (Personal Communication 2, 1996). Hapee’s tartar prevention, cap, taste, price, and sales promotions are significant attributes in the choice of Hapee over Beam (Table 5). It is 1.871 times more likely that Hapee is chosen over Beam when its cap is rated one scale higher. Unlike Beam, Hapee has the advantage of having a fliptop cap which does not need manual unscrewing. More educated people would unlikely choose Hapee over Beam. The demographic variables reveal important characteristics of Hapee users. At 95 percent level of significance, the validation model in Table 8 indicates that Hapee is 0.933 times more unlikely preferred over Beam by older individuals. Hapee and Beam are dominant players in the low priced toothpaste segment. The findings confirm the general preference of consumers for Hapee over Beam and this is also shown in the market shares. Hapee has 18 percent while Beam only has 5 percent. Although, income (INC) is not significant, the demographic variables summarize the typical household with limited disposable income: younger and less educated people.
In the calibration model of Table 5, family size (FSIZE) is the only significant (at =0.10) distinguishing attribute between Pepsodent and Beam users. It is 4.763 times more likely that Pepsodent is preferred over Beam by people belonging to bigger families. However, the validation model in Table 8 shows that age as the significant variable. Older individuals would prefer Pepsodent over Beam by 1.086 times.
The second set of models has last brand bought as one of the predictors. As a dummy variable, a value of 1 means that the last brand bought is the same as the brand most frequently purchased. LastBrand is a very significant (at =0.01) predictor in all the models of Tables 6 and 9 with odds ratios
ranging from 21.44 to 441.22. Since LastBrand is measured in such a way that both the dependent variable and predictor refer to the same brand, the odds ratios may serve as an indication of brand loyalty when the other brand toothpaste brand is Beam. Hence for the sample, Close-Up users have very high brand loyalty while Colgate and Hapee users may have intermediate brand loyalty.
The addition of last brand bought as a predictor produces a more externally valid model for Colgate in Table 9. The positive coefficients of attributes such as the ability to give a confident feeling after brushing and FEMALE are more consistent with Colgate’s image.
To confirm the finding that the last brand bought is equivalent to brand choice, it is used as the dependent variable. There appears to be some similarities between the significant explanatory variables in the models. For instance, for Close-Up, flavor is significant, although at varying degrees, and have the same signs in the calibration models in Tables 7 and 10. Both cap and taste are attributes that remain significant in the choice of Hapee over Beam. Colgate’s model becomes even more valid with the appearance of attributes like tartar prevention, brand satisfaction rating and AGE. The addition of last brand bought as predictor produces other significant variables in the choice of Pepsodent and Beam. Such variables are: DENTISTS, RATING, SWITCH, EDUC, STATUS and INC. Similarly, the same conclusions may be drawn by comparing the significant variables in the validation models found in Tables 8 and 10. The prediction rates given in Section 6 provide a more superior comparison of the performance of last brand bought as a predictor or as a dependent variable.
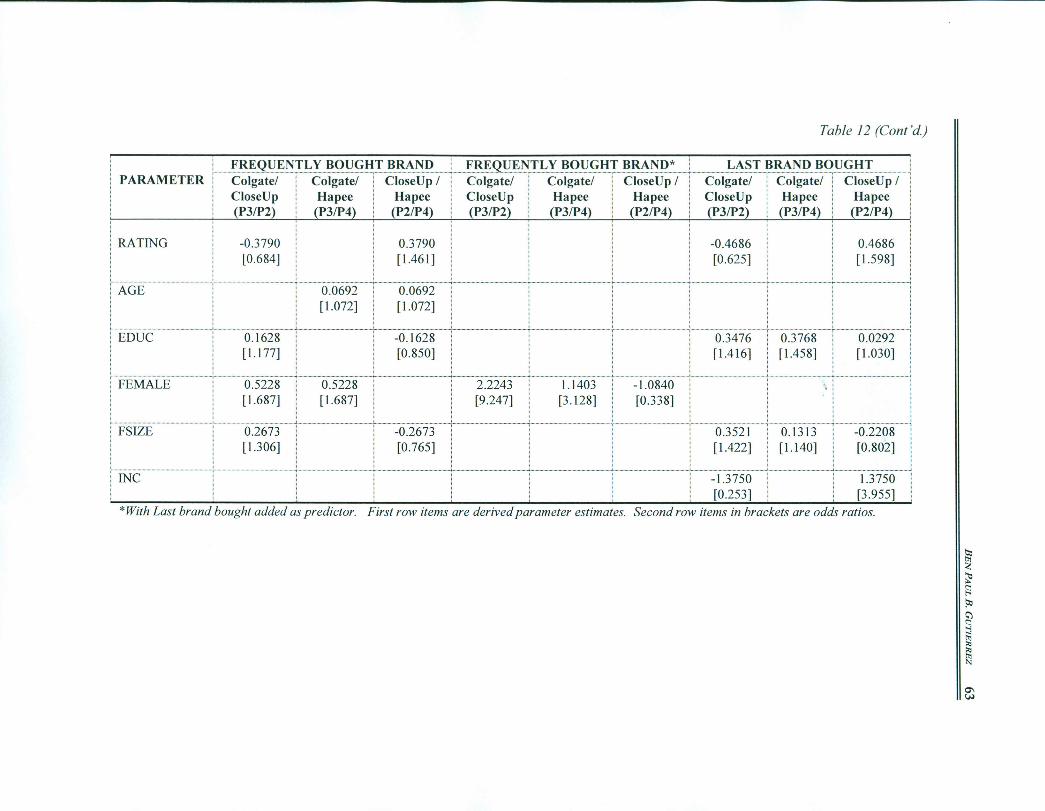
Paired comparisons among the three toothpaste brands with highest markets shares will be examined. Tables 11 and 12 contain the parameter estimates and odds ratios for the brand choice models.

BEN PAUL B. GUTIERREZ
59
When the brand choice is the frequently purchased brand, Table 11 shows that Colgate is significantly preferred over Close-Up for its availability of flavor variants, and chosen by older individuals, and females. Close-Up is preferred over Colgate in terms of ability to give confident feeling, dental approval, and brand switchers. More educated people (EDUC) prefer either Colgate or Close-Up over Hapee. Colgate is chosen over Hapee for its regular sales promotions and minty taste. Conversely, Hapee is preferred over Colgate for its tartar prevention, cap, and price. On the other hand, Close-Up is preferred over Hapee by respondents with higher education (EDUC) and for attributes such as taste, ability to give confident feeling, dental endorsement, and sales promotion. When Colgate was the last brand bought, Colgate is 0.182 times more unlikely preferred over Close-Up, and 0.261 times more unlikely chosen over Hapee. By contrast, Close-Up is 1.431 times the probable brand choice over Hapee when it was the previous brand bought. This shows
that incidence of brand switching among Colgate users may be higher than among Close-Up and Hapee users.
When last brand bought is the dependent variable, the odds ratios of the demographic variables need to be highlighted. Table 11 shows that for individuals with children (CHILD), Colgate is 12.532 times preferred over Close-Up and 20.569 times chosen over Hapee. Older respondents prefer Colgate over Close-Up by 1.052 times. In addition, Table 12 indicates that FSIZE has positive sign in the choice between Colgate and Close-Up, or Colgate and Hapee. These findings are consistent with Colgate’s image as a family brand. This section has shown that logit models can explain the brand choice of toothpaste. It is possible to make paired comparisons between any two brands after estimating the system of models using a single reference brand. The last brand bought is the most significant predictor of brand choice. The next section discusses the more general binary models.


DETERMINANTS OF TOOTHPASTE BRAND CHOICE IN URBAN PHILIPPINES
64
V. MODEL RESULTS – BINARY MODELS Since binary models have no specific
reference brand, they estimate the probability of choosing a particular brand over all other brands. The results are immediately discussed. Table 13 provides the binary model estimates for Colgate brand using the total dataset in the analysis.
When brand choice is the frequently bought brand, Table 13 shows that the significant (at =0.01) unweighted attributes are cleaning ability and tartar prevention. Colgate is chosen 1.296 times over all other brands for its cleaning ability and 1.440 times for preventing tartar. When LastBrand is added to the model, it is a significant predictor of brand choice with an odds ratio of 1.0772. Tartar prevention, fresh breath, and ability to give confident feeling become significant explanatory variables.
When the attributes are weighted by values, cleaning ability, tartar prevention, cap, and ability to give confident feeling are significant. The model where the last brand bought is the dependent variable only
identifies cleaning ability, price, and AGE as significant. On the other hand, using ranks as importance ratings highlight more variables than when using values. Cavity prevention, fresh breath, and regular sales promotion are the additional variables.
Generally, the significant variables of the models weighted by values are similar to models with unweighted variables. On the other hand, models with variables weighted by ranks appear to contain more significant variables. Moreover, an examination of the Akaike Information Criterion (AIC) and Schwartz Criterion (SC) numbers shows that three models are equivalent. The AIC numbers indicate that assigning ranks is slightly better than allocating values. By contrast, the SC values reveal a different finding that values are better. Two lessons from this experience are: using only one importance rating system would suffice, and researchers need not collect importance rating data as this would not largely affect the findings.


DETERMINANTS OF TOOTHPASTE BRAND CHOICE IN URBAN PHILIPPINES
68
VI. LOGIT MODEL VALIDATION AND DIAGNOSTICS
Tables 14 and 15 include the prediction
rates of two models when the dependent variable is the frequently purchased brand. The prediction rates are generally high except for Colgate. It seems that the predictors introduced in the models are not good enough to explain the brand choice of Colgate. Other choice factors such as brand equity may not have been captured by the logit model. For a discussion on measuring brand equity applied to toothpaste and mouthwash refer to Park and Srinivasan (1994), and Swait, et al. (1993).
As the first toothpaste brand in the Philippines, Colgate had the first-mover advantage of having “Colgate” brand name as generic with toothpaste. The association is so predominant to the extent that when a consumer thinks of toothpaste, the word “Colgate” comes to mind. It is not unusual
even now for a consumer to mention the word “Colgate” while intending to buy another toothpaste brand. In a small neighborhood store a rough English translation of the buyer’s language would be, “I would like to buy a Colgate named Close-Up.” which actually means “I would like to buy a toothpaste with a Close-Up brand name”.
The market share of the brands is also related to the predictive accuracy. In a small sample, brands with larger market shares would tend to have lower predictive accuracy because the probability of brand switching would most likely come from high-market-share brands. Thus, in Tables 14 to 16, the brands were arranged in descending order, starting with Colgate, the brand with the largest market share.
Table 14 Predictive Accuracy of Samples
Dependent Variable: Frequently Purchased Brand
Sample One Parameters Used Sample Two Parameters Used Logit Model* Sample One
Predictions Sample Two Predictions
Sample One Predictions
Sample Two Predictions
Colgate 66.4 45.2 60.3 63.9 Close-Up 77.2 74.9 79.9 73.0 Hapee 91.4 84.0 90.0 91.8 Pepsodent 99.1 97.7 98.2 98.7
*Reference brand is Beam.
BEN PAUL B. GUTIERREZ
69
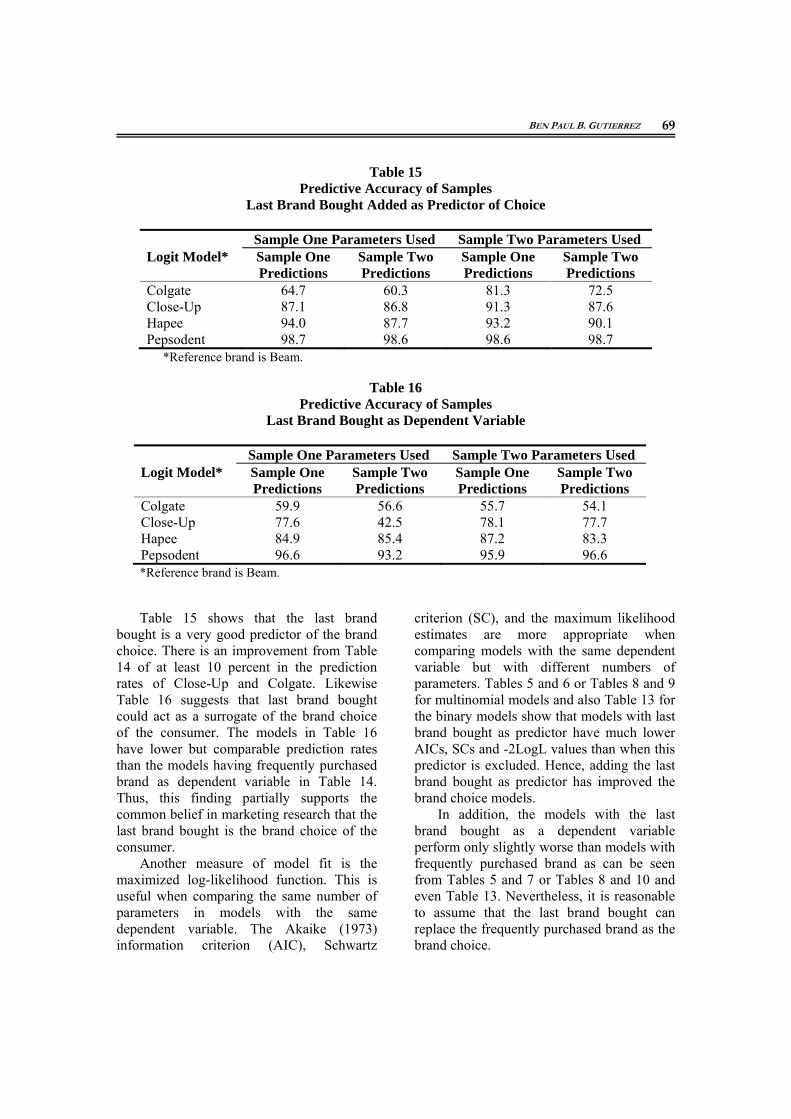
Table 15 Predictive Accuracy of Samples
Last Brand Bought Added as Predictor of Choice
Sample One Parameters Used Sample Two Parameters Used Logit Model* Sample One
Predictions Sample Two Predictions
Sample One Predictions
Sample Two Predictions
Colgate 64.7 60.3 81.3 72.5 Close-Up 87.1 86.8 91.3 87.6 Hapee 94.0 87.7 93.2 90.1 Pepsodent 98.7 98.6 98.6 98.7
*Reference brand is Beam.
Table 16 Predictive Accuracy of Samples
Last Brand Bought as Dependent Variable
Sample One Parameters Used Sample Two Parameters Used Logit Model* Sample One
Predictions Sample Two Predictions
Sample One Predictions
Sample Two Predictions
Colgate 59.9 56.6 55.7 54.1 Close-Up 77.6 42.5 78.1 77.7 Hapee 84.9 85.4 87.2 83.3 Pepsodent 96.6 93.2 95.9 96.6 *Reference brand is Beam.
Table 15 shows that the last brand bought is a very good predictor of the brand choice. There is an improvement from Table 14 of at least 10 percent in the prediction rates of Close-Up and Colgate. Likewise Table 16 suggests that last brand bought could act as a surrogate of the brand choice of the consumer. The models in Table 16 have lower but comparable prediction rates than the models having frequently purchased brand as dependent variable in Table 14. Thus, this finding partially supports the common belief in marketing research that the last brand bought is the brand choice of the consumer.
Another measure of model fit is the maximized log-likelihood function. This is useful when comparing the same number of parameters in models with the same dependent variable. The Akaike (1973) information criterion (AIC), Schwartz
criterion (SC), and the maximum likelihood estimates are more appropriate when comparing models with the same dependent variable but with different numbers of parameters. Tables 5 and 6 or Tables 8 and 9 for multinomial models and also Table 13 for the binary models show that models with last brand bought as predictor have much lower AICs, SCs and -2LogL values than when this predictor is excluded. Hence, adding the last brand bought as predictor has improved the brand choice models.
In addition, the models with the last brand bought as a dependent variable perform only slightly worse than models with frequently purchased brand as can be seen from Tables 5 and 7 or Tables 8 and 10 and even Table 13. Nevertheless, it is reasonable to assume that the last brand bought can replace the frequently purchased brand as the brand choice.

DETERMINANTS OF TOOTHPASTE BRAND CHOICE IN URBAN PHILIPPINES
70
VII. CONCLUSIONS AND IMPLICATIONS TO MANAGEMENT
This paper has presented the logit model results for toothpaste. There are nine attributes that discriminate between the brands namely cleaning ability, cap, cavity protection, confident feeling, dentists’ approval, flavor variants, tartar reduction, taste, and whitening power.
The multinomial logit model results describe each brand in terms of the important predictors and to what extent these variables can influence choice through the odds ratios. With the exception of Colgate, the goodness of fit of the estimated models is generally high as shown by the prediction rates and Akaike Information Criterion (AIC) numbers. Binary model results validate the finding that models having unweighted attributes are still useful because they are comparable to those weighted by ranks or values. Finally, the comparable prediction rates, AICs, and Schwartz Criterion (SC) numbers have also shown that the last brand bought is a significant predictor of brand choice. This variable can also replace the brand most frequently purchased as a dependent variable of the brand choice models.
Knowing which attributes consumers perceive to be important or salient to brand choice may prove useful in the concept development of marketing communications such as television and radio advertisements. For toothpaste, communicating therapeutic benefits such as cavity protection and tartar control and providing assurance on product quality is critical. Cosmetic benefits and lifestyles may be more appropriate for Close-Up, rather than Colgate. Moreover, research and development teams may benefit by
knowing the important consumer attributes as they develop new product formulations and packaging.
Some caveats are warranted here. First, some caution should be observed in projecting the results of the study to rural areas of the country because data from which the models are estimated was collected in Metro Manila. Compared to the rural areas, urban communities have higher market potential. The Metropolitan Manila region accounts for at least forty percent of the sales of most companies. The findings of the study will apply to the rapidly urbanizing areas of the country, such as the cities of Cebu and Davao, to a lesser degree.
Finally, the mathematical choice models may guide management in explaining and predicting brand choice of competing brands and support them in developing competitive strategies. However, management must not consider these models to be the truly representing the brand choice because of some assumptions inherent in the use of the mathematical modeling techniques. The models’ diagnostics must be validated by other methods, and further refinements may need to be made.
The models developed in this study should serve as an initial analysis of the toothpaste market in urban Philippines. It should lead to a regular, model-based monitoring-and-control procedure, possibly on an annual basis. Management must avoid modeling myopia––the feeling that once model-based analysis is done, further modeling in future periods is no longer necessary.

BEN PAUL B. GUTIERREZ
71
REFERENCES Agresti, A. (1990), Categorical Data Analysis, John Wiley, New York.
Amemiya, T. (1981), “Qualitative Response Models: A Survey,” Journal of Economic Literature, 19, pp. 1483-1536.
Begg, C.B. and R. Gray (1984), “Calculation of Polychotomous Logistic Regression Parameters Using Individualized Regressions,” Biometrika, 71, pp. 11-18.
Bendel, R.B. and A.A. Afifi (1977), “Comparison of Stopping Rules in Forward Regression,” Journal of the American Statistical Association, 72, pp. 46-53.
Guadagni, P.M. and J.D.C. Little (1983), “A Logit Model of Brand Choice Calibrated on Scanner Data,” Marketing Science, 2, pp. 203-238.
Gupta, S. and P.K. Chintagunta (1994), “On Using Demographic Variables to Determine Segment Membership in Logit Mixture Models,” Journal of Marketing Research, 32, pp. 17-29.
Hosmer, D.W. and S. Lemeshow (1989), Applied Logistic Regression, John Wiley, New York.
Kalyanam, K. and D.S. Putler (1997), “Incorporating Demographic Variables in Brand Choice Models: An Indivisible Alternatives Framework,” Marketing Science, 16, pp. 166-181.
Li, M. M. (1977), “A Logit Model of Homeownership,” Econometrica, July, pp. 1081-1098.
Luce, R. D. (1959), Individual Choice Behavior: A Theoretical Analysis, John Wiley, New York.
McFadden, D. (1974), “Conditional Logit Analysis of Qualitative Choice Behavior,” in Frontiers in Econometrics, (ed.) Zarembka, P., Academic Press, New York, pp. 105-142.
Mickey, J. and S. Greenland (1989), “A Study of the Impact of Confounder-Selection Criteria on Effect Estimation,” American Journal of Epidemiology, 129, pp. 125-137.
Park, C.S. and V. Srinivasan (1994), “A Survey-Based Method for Measuring and Understanding Brand Equity and its Extendibility,” Journal of Marketing Research, 31, pp. 271-288.
Rajendran, K.N. and G.J. Tellis (1994), “Contextual and Temporal Components of Reference Price,” Journal of Marketing, 58, pp. 22-34.
Restle, F. (1961), Psychology of Judgment and Choice: A Theoretical Essay, John Wiley, New York.
Swait, J., T. Erdem, J. Louviere, and C. Dubelaar (1993), “The Equalization Price: A Measure of Consumer-Perceived Brand Equity,” International Journal of Research in Marketing, 10, pp. 23-45.
Tversky, A. (1972), “Elimination by Aspects: A Theory of Choice,” Psychological Review, 79 (4), pp. 281-299.