exercising choice: the economic determinants of...
TRANSCRIPT
This is a repository copy of Exercising choice: The economic determinants of physical activity behaviour of an employed population.
White Rose Research Online URL for this paper:http://eprints.whiterose.ac.uk/110874/
Version: Accepted Version
Article:
Brown, H. and Roberts, J. orcid.org/0000-0003-2883-7251 (2011) Exercising choice: The economic determinants of physical activity behaviour of an employed population. Social Science and Medicine, 73 (3). pp. 383-390. ISSN 0277-9536
https://doi.org/10.1016/j.socscimed.2011.06.001
Article available under the terms of the CC-BY-NC-ND licence (https://creativecommons.org/licenses/by-nc-nd/4.0/)
[email protected]://eprints.whiterose.ac.uk/
Reuse
This article is distributed under the terms of the Creative Commons Attribution-NonCommercial-NoDerivs (CC BY-NC-ND) licence. This licence only allows you to download this work and share it with others as long as you credit the authors, but you can’t change the article in any way or use it commercially. More information and the full terms of the licence here: https://creativecommons.org/licenses/
Takedown
If you consider content in White Rose Research Online to be in breach of UK law, please notify us by emailing [email protected] including the URL of the record and the reason for the withdrawal request.
Exercising choice: The economic determinants of physicalactivity behaviour of an employed population
Heather Browna,* and Jennifer Robertsb
aHealth Economics Research Unit, University of Aberdeen, Polwarth Building, Room 1:048Foresterhill, Aberdeen, United Kingdom
bDepartment of Economics, University of Sheffield, United Kingdom
AbstractLack of physical activity is a major contributing factor to the worldwide obesity epidemic, and tothe overall burden of disease. The deindustrialisation of developed economies and move to moresedentary employment has impacted on the opportunities of working individuals to participate inphysical activity. This can have negative effects on productivity and worker health potentiallyinfluencing economic growth. Thus, it is important to determine the factors influencing thefrequency of participation in physical activity for employed individuals. This paper uses amodified time allocation framework to explore this issue. We use data from the first six waves ofthe Household Income and Labour Dynamics of Australia survey (HILDA). The analysisexamines frequency of participation in physical activity using a generalised random effectsordered probit model. We control for non-parallel cut-points between the physical activitycategories and individual heterogeneity, as well as exploring differences across gender. The resultsindicate that there is a time trade-off between non-market work, market work, and the frequencyof physical activity participation. This effect is moderated by gender. For example, dependentchildren have a larger negative effect on the frequency of physical activity participation forwomen. Education and marriage have a larger negative effect on the frequency of participation formen. The findings suggests that policies which make exercise more convenient, and hencedecrease the opportunity cost of exercise, will help to encourage more frequent participation inphysical activity for working adults.
Keywords
Australia; Physical activity; Time allocation; Health; Built environment; Employment
Introduction
Approximately 1.9 million deaths worldwide are attributable to physical inactivity (WorldHealth Organisation – WHO, 2009). In Australia, where the data in this paper comes from,physical inactivity was the fourth leading cause of burden of disease in 2003, responsible forapproximately 7% of the total burden of disease (Begg et al., 2007). At least 30 min ofmoderate physical activity1 five days a week reduces the risk of coronary heart disease,stroke, type II diabetes, and, specifically for women, the risk of colon and breast cancer
© 2011 Elsevier Ltd. All rights reserved.*Corresponding author. Tel.: +44 1224 555 170. [email protected]. .1Moderate physical activity is defined as an activity that uses large muscle groups and is at least equivalent to brisk walking. Someexamples are dancing, cycling, gardening, and swimming (CDC, 1996).
Europe PMC Funders GroupAuthor ManuscriptSoc Sci Med. Author manuscript; available in PMC 2011 August 26.
Published in final edited form as:Soc Sci Med. 2011 August ; 73(3): 383–390. doi:10.1016/j.socscimed.2011.06.001.
Europe P
MC
Funders A
uthor Manuscripts
Europe P
MC
Funders A
uthor Manuscripts
(Center for Disease Control (CDC), 1996; WHO, 2009). A lack of physical activity has alsobeen found to have a negative effect on worker productivity. Workers who are physicallyinactive have higher rates of absenteeism than physically active workers. This affect ismagnified in workers in sedentary occupations (van den Heuvel et al., 2005 and vanAmelsvoort, Spigt, Swaen, & Kant, 2006). Evidence from Australia suggests that around70% of adults are participating in less physical activity than this recommended amount, andthat almost 50% of adults reported none or virtually no exercise in the past two weeks(Australian Bureau of Statistics, 2006).
It has been found that efforts to promote participation in physical activity are more effectiveif they address the needs of a particular target group (Booth, Bauman, Owen, & Gore, 1997).For this reason we focus on employed individuals who are more likely to be cash rich andtime poor. A better understanding of how economic and demographic factors influence thefrequency of physical activity participation for working individuals can help policy makersand firms to design better tools to increase participation, reducing the disease burden andincreasing productivity. To determine which factors influence physical activity participationa modified time allocation framework based upon the seminal work of Becker (1965) andthe Cawley (2004) ‘SLOTH’ framework2 is applied to an unbalanced panel of individualsaged 18–65 from the first six waves of the Household Income and Labour Dynamics ofAustralia (HILDA) survey (2001–2006). The physical activity variable is an ordinal measureof physical activity on a six point scale ranging from no reported activity to participation inphysical activity on a daily basis.
Individuals have a finite amount of time to devote to market work, non-market work andleisure, which includes both sedentary activities and more active pursuits. There are timeand cost inputs associated with these activities. The basic assumption is that as theopportunity cost of physical activity increases due to work or home commitments,individuals are less likely to exercise. The analysis controls for manual workers who willhave a different opportunity cost of physical activity than employees in more sedentaryemployment.
Evidence suggests that time constraints are a significant barrier to physical activityparticipation for women (Verhoef & Love, 1994; Welch, McNaughton, Hunter, Hume, &Crawford, 2008). Working mothers who juggle employment and motherhood may perceivethat they do not have the time to participate in physical activity, negatively impacting ontheir health and productivity. Thus, it is important to separately analyse the determinants ofphysical activity participation for working men and women who may face different timeconstraints impacting on the opportunity cost of physical activity participation.
A small number of papers have considered the economic determinants of physical activityparticipation. Farrell and Shields (2002) examine the influence of the family, income, andethnicity utilising a binary variable for sporting participation and data from the HealthSurvey of England. The binary variable is equal to one if the respondent participated in anepisode of physical activity that lasted for at least 15 min over the last four weeks and iszero otherwise. Eberth and Smith (2010) use the Scottish Health Survey to investigate therelationship between participation and duration after controlling for a number of economicand demographic factors. Humphreys and Ruseski (2007, 2009), use data from the USBehavioural Risk Factor Surveillance System to look at the decision to participate and theamount of time allocated to physical activity, and also the effects of state level spending onparks and recreation. Downward (2007) explores the economic choice to participate in sportusing the UK General Household Survey. The general findings from these studies are that
2SLOTH stands for Sleep, Leisure, Occupation, Transportation and Home Based Activities (Cawley, 2004).
Brown and Roberts Page 2
Soc Sci Med. Author manuscript; available in PMC 2011 August 26.
Europe P
MC
Funders A
uthor Manuscripts
Europe P
MC
Funders A
uthor Manuscripts

people with children, married people, employed people and women do less exercise, whilethose with higher incomes do more.
Our study makes a number of important contributions to the literature. Firstly, we focus onworkers who have an easily identifiable opportunity cost of time measured by the observedwage rate. We can use this information to investigate how time and budget constraintsinfluence the frequency of physical activity participation and if this differs by gender. Timepressures associated with employment may increase the time and cost burden of non-marketrelated activities for employed individuals especially women. This may change themagnitude and the significance of the demographic and economic factors included inprevious studies that focused on the general adult population. This has important policyimplications for effective tools to increase participation for this important sub-group.Secondly, given that the variable we use to measure participation in physical activity is anordinal one, we employ a generalised random effects ordered probit framework. This allowsus to test the parallel regression assumption of the standard ordered probit model bypermitting the shift into different physical activity categories to vary by individualcharacteristics. This aspect of potential heterogeneity in frequency has not been explored inprevious work. Thirdly, unlike the existing studies, we have a physical activity questionbased upon weekly, rather than monthly, participation thus reducing recall bias.
Theoretical framework
The theoretical framework is based on the model described in Humphreys and Ruseski(2009). The basic idea is that given time and budget constraints, individuals choose how toallocate their time between leisure (including physical activity), market work, and non-market work, in order to maximise a given utility function comprising consumption ofcommodities and leisure. In equilibrium the marginal value of household production, themarginal rate of substitution between consumption and leisure activities (including physicalactivity) and the market wage rate are equal. Due to data limitations regarding types ofphysical activity in the data source, it is assumed that the physical activity encapsulated inboth non-market and market work is fixed. Thus, our focus is on how the amount ofdiscretionary/leisure time available influences the frequency of physical activityparticipation.
Physical activity participation requires inputs of both time and market goods. Assuming anindividual chooses the amount of time they work, then the wage rate will determine howmuch time individuals devote to market work, non-market work, and leisure. This willinfluence the opportunity cost of participating in physical activity. The more time constraintsfaced by an individual the less likely they will devote time to frequent physical activityparticipation. It is expected that working men and women may have different timeconstraints as traditionally women tend to be the primary caregiver for dependent children.This suggests that time pressures may affect the optimal frequency of weekly physicalactivity participation differently for men and women. The time allocation frameworksuggests there may be a role for supporting and promoting workplace physical activityprograms that reduce the opportunity cost of participating in frequent physical activity.
Econometric framework
Physical activity (Pit) is a an ordinal variable of participation measured on a six point scaleranging from no activity to daily activity for individual i in period t. Participation in eachphysical activity category is influenced by how individuals divide their time betweenmarket, non-market work, and leisure, represented by a vector of individual characteristics(X it) including age, sex, marital status, and income; geographical area variables (Rit) forexample, urban and rural identifiers such that:
Brown and Roberts Page 3
Soc Sci Med. Author manuscript; available in PMC 2011 August 26.
Europe P
MC
Funders A
uthor Manuscripts
Europe P
MC
Funders A
uthor Manuscripts
(1)
Where m=1,…5 and M=6 (the categories in the dependent variable, Pit).
The model is estimated using a random generalised ordered probit (REGOP). Thisframework allows for non-parallel cut-points. The REGOP model estimates a set ofcoefficients for each of the M−1 points at which the dependent variable can bedichotomised; this includes the constant term. The effects of the explanatory variables inEquation (1) can vary with the point at which the categories of the dependent variable aredichotomised. The standard normal distribution function that employs F(.) as the cumulativedistribution is used to estimate the model. It is assumed that the individual effects arenormally distributed with a zero mean and variance ͵2. If this assumption does not hold thenthe results will be biased and inconsistent.
One solution would be to remove the individual effects using a fixed effect model. However,there are many computational problems when estimating a fixed effects generalised orderedprobit. The one dimensional parameters have to be re-estimated as a potentially limitlessnumber of (n+K)−n parameters. Therefore, to estimate the parameters of the model it will benecessary to compute the possibly huge number of constant terms at the same time. Thispresents a practical obstacle to the estimation of the model as there is a need to invert apotentially large second derivative matrix (Greene, 2003). For this reason, a fixed effectapproach is not applied.
We test the normality of the individual effects in two ways. Firstly, the residuals from theindividual effects are plotted on a graph. This method shows the residuals for all six physicalactivity categories to be normally distributed. Secondly, the predicted residuals from theindividual effects are compared to the predicted residuals where normality is imposed on thepredicted residuals. The numbers should be similar if the residuals are normally distributed.This appears to be the case. For example the mean predicted residuals for participating inphysical activity three times a week is 0.293, with normality imposed the mean of predictedresiduals are 0.297. Both methods show the residuals to be normally distributed suggestingour results should be consistent.
The random effects estimation framework assumes the independence of the unobservedeffects (ͣ i) and the explanatory variables contained in vectors X and R in Equation (1). Ifthis assumption is violated the resulting coefficient estimates are inconsistent. To addressthis problem we use the Mundlak (1978) method. This methodology takes the group meansof the time explanatory variables to remove the time invariant individual effects from themodel allowing for unbiased estimation.
The model is estimated using the user-written command regoprob in STATA v.11 (Boes,2006).
We assume in the theoretical framework that economic and demographic factors willinfluence the frequency of physical activity participation differently for men and women.This informs our decision to estimate Equation (1) separately for men and women. To testthis hypothesis we implement a Chow-type test. A dummy variable for being female is
Brown and Roberts Page 4
Soc Sci Med. Author manuscript; available in PMC 2011 August 26.
Europe P
MC
Funders A
uthor Manuscripts
Europe P
MC
Funders A
uthor Manuscripts
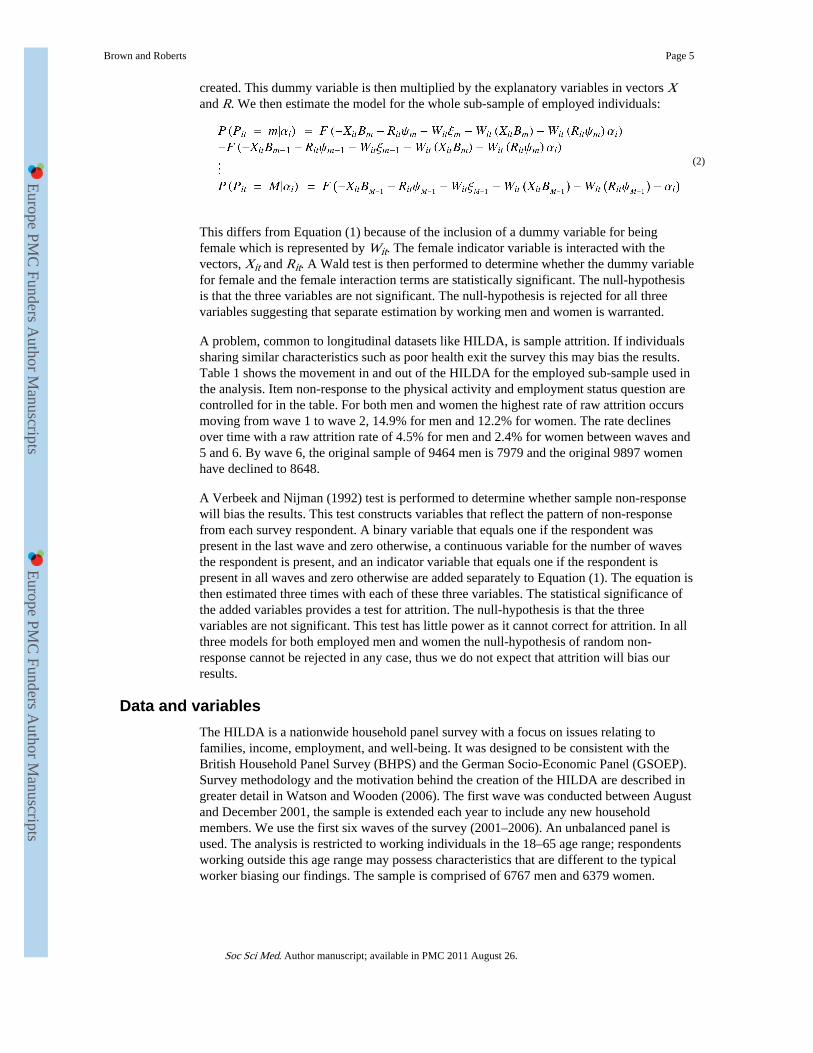
created. This dummy variable is then multiplied by the explanatory variables in vectors Xand R. We then estimate the model for the whole sub-sample of employed individuals:
(2)
This differs from Equation (1) because of the inclusion of a dummy variable for beingfemale which is represented by Wit. The female indicator variable is interacted with thevectors, X it and Rit. A Wald test is then performed to determine whether the dummy variablefor female and the female interaction terms are statistically significant. The null-hypothesisis that the three variables are not significant. The null-hypothesis is rejected for all threevariables suggesting that separate estimation by working men and women is warranted.
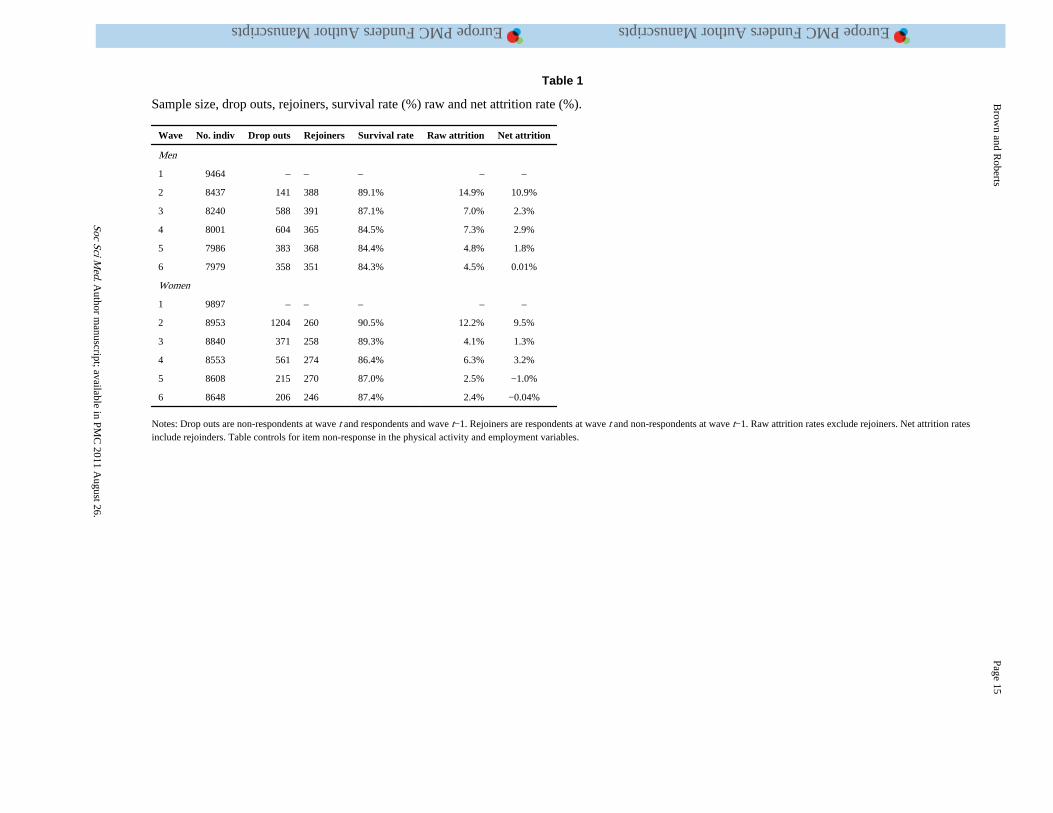
A problem, common to longitudinal datasets like HILDA, is sample attrition. If individualssharing similar characteristics such as poor health exit the survey this may bias the results.Table 1 shows the movement in and out of the HILDA for the employed sub-sample used inthe analysis. Item non-response to the physical activity and employment status question arecontrolled for in the table. For both men and women the highest rate of raw attrition occursmoving from wave 1 to wave 2, 14.9% for men and 12.2% for women. The rate declinesover time with a raw attrition rate of 4.5% for men and 2.4% for women between waves and5 and 6. By wave 6, the original sample of 9464 men is 7979 and the original 9897 womenhave declined to 8648.
A Verbeek and Nijman (1992) test is performed to determine whether sample non-responsewill bias the results. This test constructs variables that reflect the pattern of non-responsefrom each survey respondent. A binary variable that equals one if the respondent waspresent in the last wave and zero otherwise, a continuous variable for the number of wavesthe respondent is present, and an indicator variable that equals one if the respondent ispresent in all waves and zero otherwise are added separately to Equation (1). The equation isthen estimated three times with each of these three variables. The statistical significance ofthe added variables provides a test for attrition. The null-hypothesis is that the threevariables are not significant. This test has little power as it cannot correct for attrition. In allthree models for both employed men and women the null-hypothesis of random non-response cannot be rejected in any case, thus we do not expect that attrition will bias ourresults.
Data and variables
The HILDA is a nationwide household panel survey with a focus on issues relating tofamilies, income, employment, and well-being. It was designed to be consistent with theBritish Household Panel Survey (BHPS) and the German Socio-Economic Panel (GSOEP).Survey methodology and the motivation behind the creation of the HILDA are described ingreater detail in Watson and Wooden (2006). The first wave was conducted between Augustand December 2001, the sample is extended each year to include any new householdmembers. We use the first six waves of the survey (2001–2006). An unbalanced panel isused. The analysis is restricted to working individuals in the 18–65 age range; respondentsworking outside this age range may possess characteristics that are different to the typicalworker biasing our findings. The sample is comprised of 6767 men and 6379 women.
Brown and Roberts Page 5
Soc Sci Med. Author manuscript; available in PMC 2011 August 26.
Europe P
MC
Funders A
uthor Manuscripts
Europe P
MC
Funders A
uthor Manuscripts

Physical activity
The physical activity measure is a categorical variable constructed from the question:
“In general how often do you participate in moderate or intense physical activityfor at least 30 min? Moderate physical activity will cause a slight increase inbreathing and heart rate such as brisk walking.”
The response choices are: 1)Not at all; 2) less than once a week; 3) 1–2 times a week; 4) 3times a week; 5) more than three times a week but not everyday; 6) everyday.
Fig. 1 shows the distribution of physical activity participation by gender. A higherpercentage of women compared to men never participate in physical activity or participateless than once a week. A higher percentage of men compared to women participate in themore frequent physical activity categories of more than three times a week and everyday.
Similar to other physical activity measures from secondary datasets there are weaknessesassociated with the physical activity measure. The question does not specify the type orduration of physical activity. Thus, we cannot determine whether different types of physicalactivity affect the frequency of participation differently. We are also unable to analyse therelationship between frequency and duration of activity. The self-reported nature of thephysical activity measure means that it may be subject to measurement error. Controlling forindividual heterogeneity should remove some of this bias. To compare the HILDA withother Australian surveys, a binary variable that equals one if the respondent participates inthe recommended amount of physical activity (3 or more times a week) and zero otherwisewas constructed for the whole HILDA sample. In the whole HILDA sample, 52.7% of menand 46.5% of women participate in physical activity three or more times a week. This iscomparable to other national and regionally representative samples. For example, in theNew South Wales Population Survey 2002–2005, 52.6%of men and 43.8% of women reportparticipation in moderate or vigorous activity, three days a week or more, for at least 30 min,over the past seven days (Chau et al., 2008).
Covariates
The explanatory variables included in this analysis are used to explore how time allocationinfluences the frequency of physical activity participation. Age and age squared are includedin the model. It is possible that the relationship between age and physical activityparticipation is concave thus we allow for a non-linear relationship between age andfrequency of participation in physical activity. Education is controlled for in the modelsbecause higher levels of education may increase the potential wage rate. If physical activityis a normal good, individuals with more education may substitute active leisure for paidwork, ceteris paribus. However, individual preferences and knowledge about the healthbenefits of physical activity may suggest a positive association between physical activityparticipation and education. An indicator variable for marital status is included in allequations. Married individuals may have more time commitments, such as familyobligations, which increases the amount of time allocated to non-market work comparedwith single respondents. Farrell and Shields (2002) and Humphreys and Ruseski (2009)found a negative effect of being married on physical activity and sporting participation forboth genders. Three indicator variables for having dependent children four and under,children between the ages of five and fifteen, and fifteen and older are included in themodels. The age of dependent children will influence how much leisure time is availablewhich will effect physical activity participation. For example, Farrell and Shields (2002)find that having dependent infants reduces the likelihood of sporting participation for bothmen and women. Non-labour income is expected to increase participation in physical
Brown and Roberts Page 6
Soc Sci Med. Author manuscript; available in PMC 2011 August 26.
Europe P
MC
Funders A
uthor Manuscripts
Europe P
MC
Funders A
uthor Manuscripts
activity and this is supported by findings from the previous literature (Farrell & Shields,2002 and Humphreys & Ruseski, 2009).
To capture how individual preferences influence participation in physical activity a timesatisfaction variable is included in the model. Welch et al. (2008) found, amongst a sampleof 1521 Australian women, that 73% reported time pressures as a barrier to physical activityparticipation. While actual total time available to an individual is fixed at 24 h per day,perception of time available can vary, and perception of the amount of available leisure timemay impact on physical activity participation. If individuals devote what they perceive as alarge proportion of their total time to market and non-market work, resulting indissatisfaction with the amount of leisure time available, they may be less likely to devotepart of this leisure time to physical activity. Thus we expect a negative effect from thevariable that identifies people who are dissatisfied with the amount of leisure time they have.The time satisfaction variable may be correlated with some of the other explanatoryvariables such as age of dependent children possibly affecting the interpretation of theregression results. Multicollinearity between the potentially correlated explanatory variablesis checked by calculating a Pearson correlation coefficient between time satisfaction andeach of the three dummy variables for dependent children. The correlation coefficient fortime satisfaction and children was approximately 0.13 for women and 0.09 and insignificantfor men suggesting multicollinearity should not be a serious problem.
The built environment may influence both the time and cost of participating in physicalactivity. There is some evidence that the built environment may act as a barrier toparticipating in physical activity if individuals do not have local access to parks, cycling andwalking paths, and other sports facilities (Committee on Physical Activity, Health,Transportation and Land Use, 2005). The character of the neighbourhood may influence thelikelihood of participating in outdoor physical activity. Saelens, Sallis, Black, and Chen(2003) found that neighbourhoods with high crime rates, boarded up shop fronts, and poorlymaintained infrastructure discouraged walking and cycling. Two built environment variablesare included in the analysis. The first variable controls for living in an urban environmentand the other variable controls for the socio-economic disadvantage of the local area.
Labour market variables such as number of hours worked, and the wage rate, will affect theposition of the budget constraint. We assume that working full-time will increase theopportunity cost of participating in physical activity. Nomaguchi and Bianchi (2004) findthat full-time workers participate in less physical activity than their part-time counterparts.van den Heuvel et al., 2005 and van Amelsvoort et al. (2006) find evidence of increasedproductivity of physically active employees. Physical activity has also been found toimprove emotional well-being (WHO, 2009). Therefore, participating in regular physicalactivity may have productivity effects which could lead to a higher wage rate, resulting in anupward bias on the coefficients on the wage variable. However, if physical activity is anormal good, then a higher wage rate will cause individuals to substitute physical activityfor paid work. Empirically, it may be possible that these two effects cancel each other.Another factor impacting on physical activity for employed respondents is the type ofindustry in which they are employed. The physical activity question in the HILDA does notexplicitly distinguish between leisure and work based physical activity. Individualsemployed in manual labour will participate in more work-related physical activity whichmay lead them to report that they are physically active, even though this activity is in worktime rather than leisure time. Thus, the model controls for employment in a more physicallyactive job.
Brown and Roberts Page 7
Soc Sci Med. Author manuscript; available in PMC 2011 August 26.
Europe P
MC
Funders A
uthor Manuscripts
Europe P
MC
Funders A
uthor Manuscripts
Results
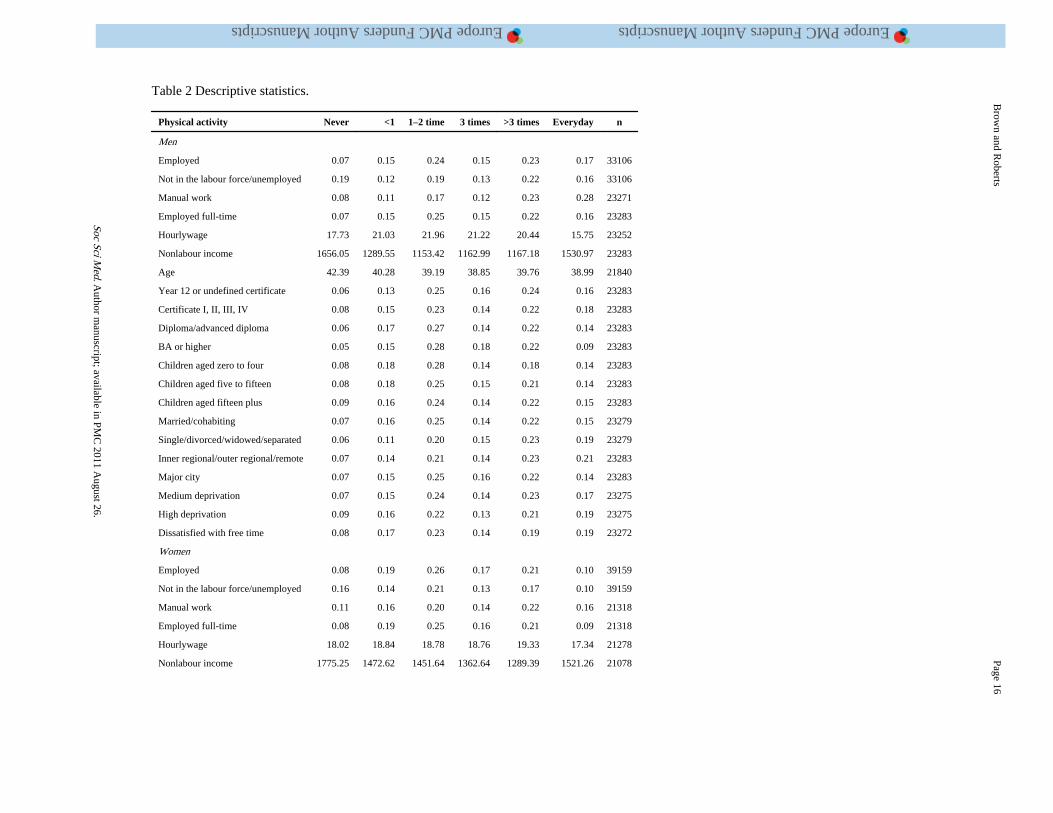
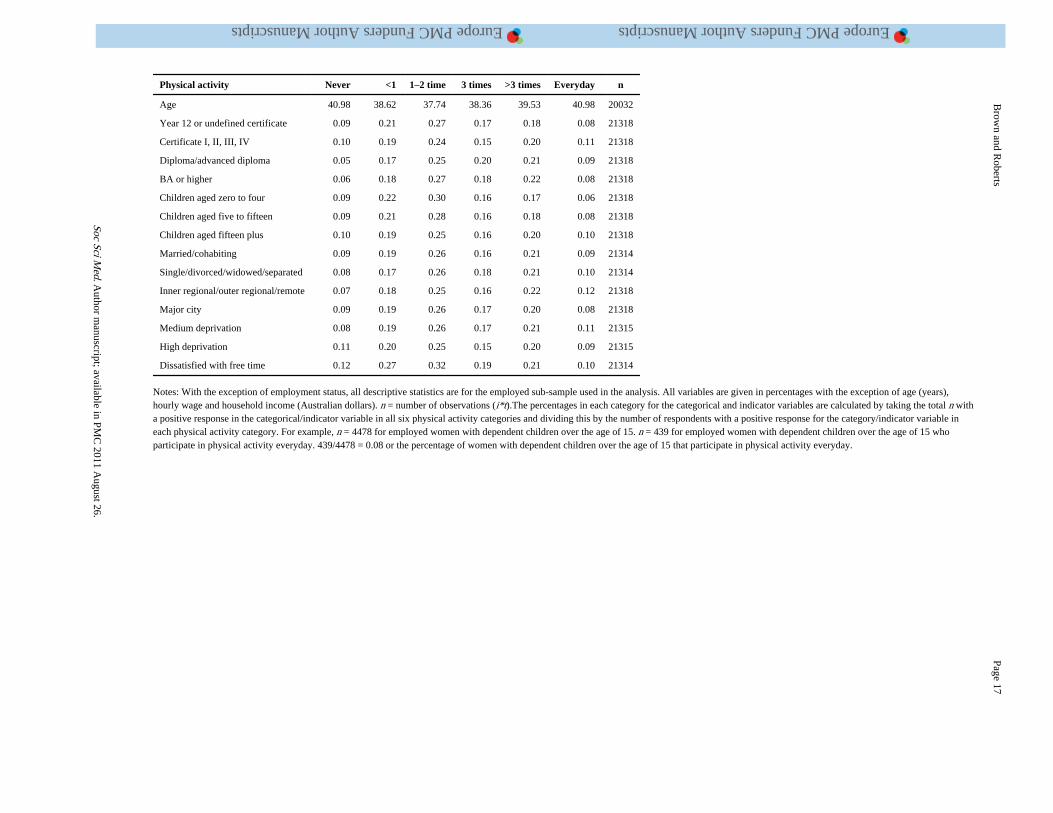
Table 2 shows the descriptive statistics for the sample used in the empirical analysis. Exceptfor employment status all descriptive statistics are only for the employed sub-sample used inthe analysis. The statistics are divided by frequency of participation in physical activity, andshown separately for men and women. The first category is defined as no weekly physicalactivity participation. The second category of less than once a week suggests that mostweeks these respondents do not participate in physical activity; their participation isinfrequent. The remaining three categories of one to two times a week, three times a week,between 4 and 6 times a week, and everyday show the frequency of physical activityparticipation for those respondents who choose to participate in exercise on a regular basis.After controlling for participation, differences can be observed in the distribution of thefrequency of physical activity participation. For many of the economic and demographicvariables there seems to be a glut of respondents reporting participating in one to two daysof physical activity. For most of the variables there are a higher percentage of men thanwomen reporting participation in physical activity everyday. For example only 6% ofworking mother with children under the age of four report participating in physical activityeveryday compared with 14% of working fathers with children in this age group. Thissuggests time constraints may affect the frequency of physical activity participationdifferently for working men and women.
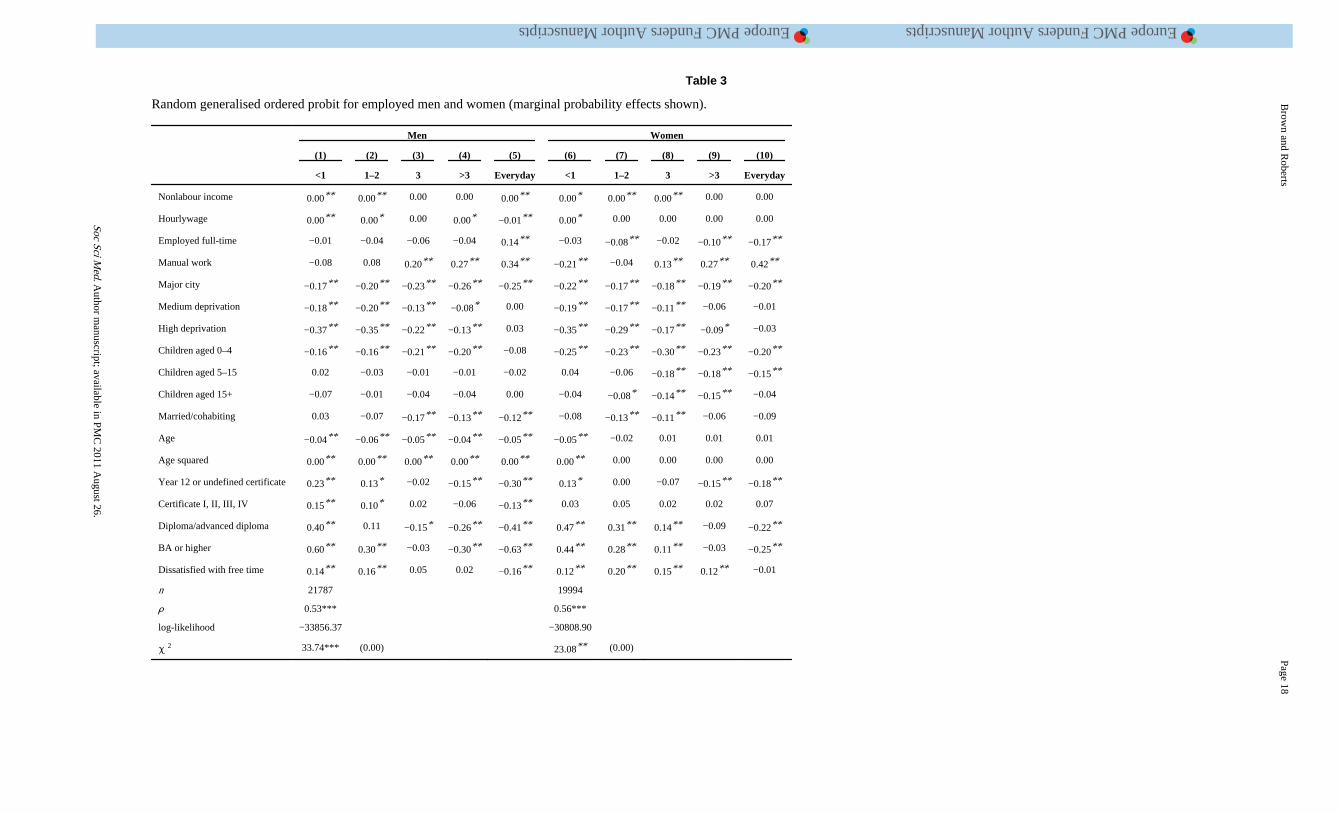
Table 3 presents the marginal probability effects for employed men and women from theREGOP model. The coefficients show how marginal changes in the explanatory variablesimpact on the frequency of participation. For the dummy variables included in the analysisthis change is moving from the base category to a positive response (a value of one). Thebase category in the dependent variable is never participating in moderate physical activity.The coefficients can be interpreted as percentages.
The REGOP framework allows the shift to be non-parallel between physical activitycategories for all explanatory variables. This assumption is tested for each explanatoryvariable individually and the full model using a Wald 2 test. The null-hypothesis is that theparallel line assumption is violated. The bottom row in Table 3, column (1) for men andcolumn (6) for women shows the 2 test-statistics for the full model, the p-values are shownin columns (2) for men and (7) for women. The null-hypothesis cannot be rejected for eithermen or women suggesting the REGOP is an appropriate model specification compared withan ordered probit model with parallel cut-point shifts. The Wald 2 for the individualvariables is not shown. The null-hypothesis is rejected for school age children (p = 0.77) andchildren fifteen plus (p = 0.49) for men. For women, the null-hypothesis is rejected for thesecond education dummy (Certificate I, II, III, IV) (p = 0.81) and the urban indicatorvariable (p = 0.68). The null-hypothesis of non-parallel cut-points between the physicalactivity categories holds for the other explanatory variables.
For ease in explaining the effect of the explanatory variables on the frequency of physicalactivity participation, we will explain how the marginal probability changes across columns(1–5) for men and (6–10) for women for each explanatory variable. The percent changeswill be compared between men and women.
The magnitude of the marginal effects on non-labour income, hourly wage, and age squaredare extremely small for both men and women and for ease of exposition are rounded to zeroin Table 3.For example, for men in column (1) the marginal effect of non-labour income onparticipating in physical activity less than once a week is −0.00002 and in column (5) formen the marginal effect for participating in physical activity everyday compared to the basecategory of no physical activity is 0.00002. The magnitude of the marginal effects on non-
Brown and Roberts Page 8
Soc Sci Med. Author manuscript; available in PMC 2011 August 26.
Europe P
MC
Funders A
uthor Manuscripts
Europe P
MC
Funders A
uthor Manuscripts
labour income is similar for women in columns 6–10. For both genders, only in the finalcolumn, (column (5) for men and column (10) for women), participating in physical activityeveryday compared to the base category of no physical activity participation is there apositive coefficient on non-labour income. The marginal effects on hourly wage for men incolumn (1) is 0.0004, the marginal effect switches signs to negative in column (3),(−0.00007) and is negative in columns (4) and (5). The marginal effect on hourly wage forwomen in column (6) is 0.00002 and the sign of the marginal effect changes to negative incolumn (10) only, (−0.0002). The small magnitude of the non-labour income and hourlywage marginal effects suggests that monetary subsidies to promote physical activityparticipation may only lead to less than a 1% change in more frequent physical activityparticipation compared to the base category of no physical activity participation.
Full-time employment compared to part-time employment has a positive effect onparticipating in daily physical activity for men in column (5). This contradicts our timeallocation framework. However, men may choose to work part-time because of healthreasons which could explain these counterintuitive findings. Full-time employmentcompared to part-time employment has a negative and significant effect on more frequentphysical activity participation for women which can be seen in columns (7), (9), and (10).
Manual work compared to the base category of non-manual occupations has a positive andsignificant effect on reporting more frequent physical activity participation. This suggestsmanual workers incorporate occupational physical activity when answering this surveyquestion. The opportunity cost of physical activity is different for manual workers comparedto employees in more sedentary occupations. Approximately 10% of men and 7% of womenare employed in manual work suggesting the difference in the opportunity cost of physicalactivity participation for manual workers should not bias our findings on the impact ofeconomic and demographic factors on the frequency of physical activity participation. Thesefindings highlight a weakness of our analysis. The physical activity question in the HILDAwhich does explicitly ask respondents about type of physical activity limits our ability tofully identify the impact of the explanatory variables on the frequency of physical activityparticipation.
Compared to the base category of living in a rural area, living in an urban area has anegative and significant effect on participating in more frequent physical activity for bothmen and women. This negative and significant effect holds across all columns of increasingfrequency of participation. Living in areas of higher deprivation compared to the basecategory of living in the least deprived areas has a negative effect on participating inphysical activity less than once a week to participating between 4 and 6 days for men incolumns (1–4) and women in columns (6–9). The magnitude of this effect is larger for menthan women. These findings suggest the built environment may play a role in the frequencyof physical activity participation. Or more generally the built environment may influence thelikelihood of participating in physical activity. This issue should be addressed in futurework.
The impact of children on the frequency of physical activity participation is gender specific.For example, having a dependent child under the age of four compared to having no childrenin this age group decreases the likelihood of participating in physical activity three times aweek compared to the base category of no physical activity by 21% for men (column 3) and30% for women (column 8). Older children in the five to fifteen age groups and fifteen pluscompared to having no children in these age groups only have a negative and significanteffect on the frequency of physical activity participation for women. This suggests that childcare is a significant burden on the likelihood that women participate in more frequent
Brown and Roberts Page 9
Soc Sci Med. Author manuscript; available in PMC 2011 August 26.
Europe P
MC
Funders A
uthor Manuscripts
Europe P
MC
Funders A
uthor Manuscripts
physical activity. This issue needs to be addressed when developing policy to increaseworking women’s physical activity participation.
Compared to single, widowed or divorced respondents, marriage has a negative andsignificant impact for more frequent physical activity participation for men. This can be seenin columns (3–5). This is consistent with our theoretical framework that the additional non-market work associated with marriage increases the opportunity cost of participating in morefrequent physical activity. Compared to the base category of no physical activityparticipation, marriage only has a negative and significant effect on participating in physicalactivity one to two days a week (column 7) and three times a week (column 8) for women.Child care rather than other non-market work associated with marriage may be a largerburden on time influencing the time allocated to physical activity for women.
The base category for the education dummies are no educational qualifications. We willfocus on the result for respondents with a bachelor degree or higher. Interestingly a tertiarydegree has a positive and significant effect on lower levels of physical activity participationcompared to the base category of no physical activity participation. See columns (1–2) formen and columns (6–8) for women. The effect is larger for men than women. However, thesign of the coefficient changes when moving into more frequent participation categories.Males with tertiary degree are 30% less likely to participate in physical activity between 4and 6 days a week and 63% less likely to participate in physical activity everyday comparedto the base category of no physical activity participation. Similarly women with tertiarydegree are 25% less likely to participate in physical activity everyday. This adds support toour hypothesis that the rising opportunity cost of physical activity participation impacts onthe frequency of participation. Highly educated individuals are likely to know about thehealth benefits of physical activity. Thus, they may choose to participate in physical activity.These individuals are more likely to have highly skilled sedentary jobs. The timecommitments associated with work and other non-market commitments suggests that theopportunity cost of physical activity may limit their weekly physical activity opportunities.Workplace physical activity opportunities may benefit this group and increase the frequencyof physical activity participation.
Finally, being dissatisfied with the amount of free time available compared to being satisfiedhas a positive effect on lower levels of frequency (columns 1–2) and a negative andsignificant effect on daily physical activity participation for men (column 5). This isconsistent with the theoretical framework that time perception will influence the opportunitycost of physical activity. However, for women there is a positive effect of being dissatisfiedwith free time on the frequency of physical activity participation (columns 6–9). This isinconsistent with our hypothesis suggesting that for working women time perception maynot factor into the frequency of physical activity participation.
Discussion
There are some important policy implications that can be drawn from this research. Non-labour income has an extremely small impact on the frequency of physical activityparticipation suggesting that subsidies for physical activity participation or other paymentschemes for exercise may not be an effective policy tool to increase the frequency ofparticipation for working adults. The negative impact of non-market responsibilities such aschild care and marriage suggests there may be a trade-off between these activities andphysical activity participation. These findings are similar to other research in the areastudying the general population (Eberth & Smith, 2010; Humphreys & Ruseski, 2009, andFarrell & Shields, 2002)The negative impact of higher levels of education on the frequencyof physical activity participation implies that there may be a time trade-off between working
Brown and Roberts Page 10
Soc Sci Med. Author manuscript; available in PMC 2011 August 26.
Europe P
MC
Funders A
uthor Manuscripts
Europe P
MC
Funders A
uthor Manuscripts
and physical activity. The impact of non-labour income and education differs from findingsin the previous literature which focused on the general population (Eberth & Smith, 2010and Farrell & Shields, 2002). For employed individuals time constraints may be moreimportant than budgetary constraints on the frequency of physical activity participation.
Workplace physical activity programs may be an effective way to increase the frequency ofphysical activity for time poor working people. Child friendly physical activity programsmay be an effective way to increase working women’s physical activity participation. Suchpolicies can also help to foster good habits in children improving their health. The resultssuggest that the built environment has a significant impact on the frequency of physicalactivity participation. Ensuring the built environment encourages physical activityparticipation is important for town planners, local and national governments. This areashould be further investigated in future work.
There are several limitations to this study. The nature of the physical activity question limitsthe interpretation of our results. We cannot explicitly distinguish between leisure based andwork based physical activity. Therefore, we can only provide an approximation of how timeallocation influences physical activity participation. The majority of the sample is employedin more sedentary employment suggesting that our results should provide a reasonableapproximation on how time allocation influences the frequency of leisure based physicalactivity participation. Secondly, the physical activity question does not explicitly askrespondents about duration and vigour. Therefore, we cannot determine if participation inmoderate versus vigorous physical activity and duration impacts on the frequency ofphysical activity participation.
Conclusion
Frequent physical activity participation is important for promoting a healthy population.Understanding the economic and demographic factors which influence the frequency ofphysical activity participation will help policy makers target at risk groups. The role of workon the frequency of physical activity participation has not been investigated in the previousliterature. This paper aimed to uncover the economic and demographic factors whichinfluence the frequency of physical activity participation for working adults in Australiausing a modified time allocation framework and a REGOP model that allows a non-parallelshift point between physical activity categories.
The findings suggest that economic and demographic factors that influence how time isallocated between non-market work, leisure, and market work have a significant impact onthe frequency of physical activity participation for working men and women. Many of thesefactors are moderated by gender. For example, marriage has a larger negative effect on thefrequency of participation for men than women. Dependent children have a larger negativeeffect on the frequency of physical activity participation for women compared to men.
Acknowledgments
“This paper uses unit record data from the Household, Income and Labour Dynamics in Australia (HILDA) Survey.The HILDA Project was initiated and is funded by the Australian Government Department of Families, Housing,Community Services and Indigenous Affairs (FaHCSIA) and is managed by the Melbourne Institute of AppliedEconomic and Social Research (Melbourne Institute). The findings and views reported in this paper, however, arethose of the author and should not be attributed to either FaHCSIA or the Melbourne Institute.” This work wasfunded by the Medical Research Council/Economic and Social Research Council/National Institute of HealthResearch under grant G0802291.
Brown and Roberts Page 11
Soc Sci Med. Author manuscript; available in PMC 2011 August 26.
Europe P
MC
Funders A
uthor Manuscripts
Europe P
MC
Funders A
uthor Manuscripts
References
Australian Bureau of Statistics. Selected 2006 census facts and figures. 2006. Viewed May 2009.http://www.abs.gov.au
Becker GS. A theory of the allocation of time. Economic Journal. 1965; 75:493–517.
Begg, S.; Vos, T.; Barker, B.; Stevenson, C.; Stanley, L.; Lopez, AD. The burden of disease and injuryin Australia, 2003. AIHW; Canberra: 2007. PHE 82
Boes, S. REGOPROB: Stata module to estimate random effects generalized ordered probit models,Statistical Software Components S456604. Boston College Department of Economics; 2006.
Booth ML, Bauman A, Owen N, Gore CJ. Physical activity preferences, preferred sources ofassistance, and perceived barriers to increased activity among physically inactive Australians.Preventative Medicine. 1997; 26:131–137.
Cawley J. An economic framework for understanding physical activity and eating behaviour.American Journal of Preventive Medicine. 2004; 27:117–125. [PubMed: 15450622]
Center for Disease Control and Prevention (CDC). Physical activity and health: A report of thesurgeon general. Department of Health and Human Services; Washington D.C: 1996.
Chau J, Smith BJ, Bauman A, Merom D, Eyeson-Annan M, Chey T, et al. Recent trends in physicalactivity in New South Wales. Is the tide of inactivity turning? Australia and New Zealand Journal ofPublic Health. 2008; 32:82–85.
Committee on Physical Activity, Health, Transportation, and Land Use. Does the built environmentinfluence physical activity: Examining the evidence. Transportation Research Bureau; WashingtonD.C: 2005.
Downward PM. Exploring the economic choice to participate in sport: results from the 2002 generalhousehold survey. International Review of Applied Economics. 2007; 21:633–653.
Eberth B, Smith MD. Modelling the participation decision and duration of sporting activity inScotland. Economic Modelling. 2010; 27:822–834. [PubMed: 20640033]
Farrell L, Shields MA. Investigating the economic and demographic determinants of sportingparticipation in England. Journal of Royal Statistical Society. 2002; 165 A:335–348.
Greene, WH. Econometric analysis. Prentice Hall; Upper Saddle River, NJ: 2003.
Humphreys BR, Ruseski JE. Participation in physical activity and government spending on parks andrecreation. Contemporary Economic Policy. 2007; 25:538–552.
Humphreys, BR.; Ruseski, JE. The economics of participation and time spent in physical activity.Department of Economics, University of Alberta; 2009. Working Paper Series, Paper No. 2009–09
Mundlak Y. On the pooling of time series and cross-section data. Econometrica. 1978; 46:69–85.
Nomaguchi KM, Bianchi SM. Exercise time: gender differences in the effects of marriage, parenthood,and employment. Journal of Marriage and Family. 2004; 66:413–430.
Saelens BE, Sallis JF, Black JB, Chen D. Neighbourhood-based differences in physical activity: anenvironment scale evaluation. American Journal of Public Health. 2003; 93:1152–1158.
van Amelsvoort LGP, Spigt MG, Swaen GMH, Kant I. Leisure time physical activity and sicknessabsenteeism; a prospective study. Occupational Medicine. 2006; 56:210–212. [PubMed:16641504]
van den Heuvel SG, Boshuizen HC, Hilderbrandt VH, Blatter BM, Ariens GA, Bongers PM. Effect ofsporting activity on absenteeism in a working population. British Journal of Sports Medicine.2005; 39 doi:10.1136/bjsm.2004.013052.
Verbeek M, Nijman T. Testing for selectivity bias in panel data models. International EconomicReview. 1992; 33:681–703.
Verhoef MJ, Love EJ. Women and exercise participation: the mixed blessings of motherhood. HealthCare Women International. 1994; 15:297–306.
Watson N, Wooden M. Modelling longitudinal survey response: The experience of the HILDA survey.2006HILDA Project Discussion Paper Series
Welch N, McNaughton SA, Hunter W, Hume C, Crawford D. Is the perception of time pressure abarrier to healthy eating and physical activity among women? Public Health Nutrition. 2008; 23:1–8.
Brown and Roberts Page 12
Soc Sci Med. Author manuscript; available in PMC 2011 August 26.
Europe P
MC
Funders A
uthor Manuscripts
Europe P
MC
Funders A
uthor Manuscripts
World Health Organisation (WHO). Physical activity. 2009. viewed April 2009. http://www.who.int/dietphysicalactivity/pa/en/index.html
Brown and Roberts Page 13
Soc Sci Med. Author manuscript; available in PMC 2011 August 26.
Europe P
MC
Funders A
uthor Manuscripts
Europe P
MC
Funders A
uthor Manuscripts
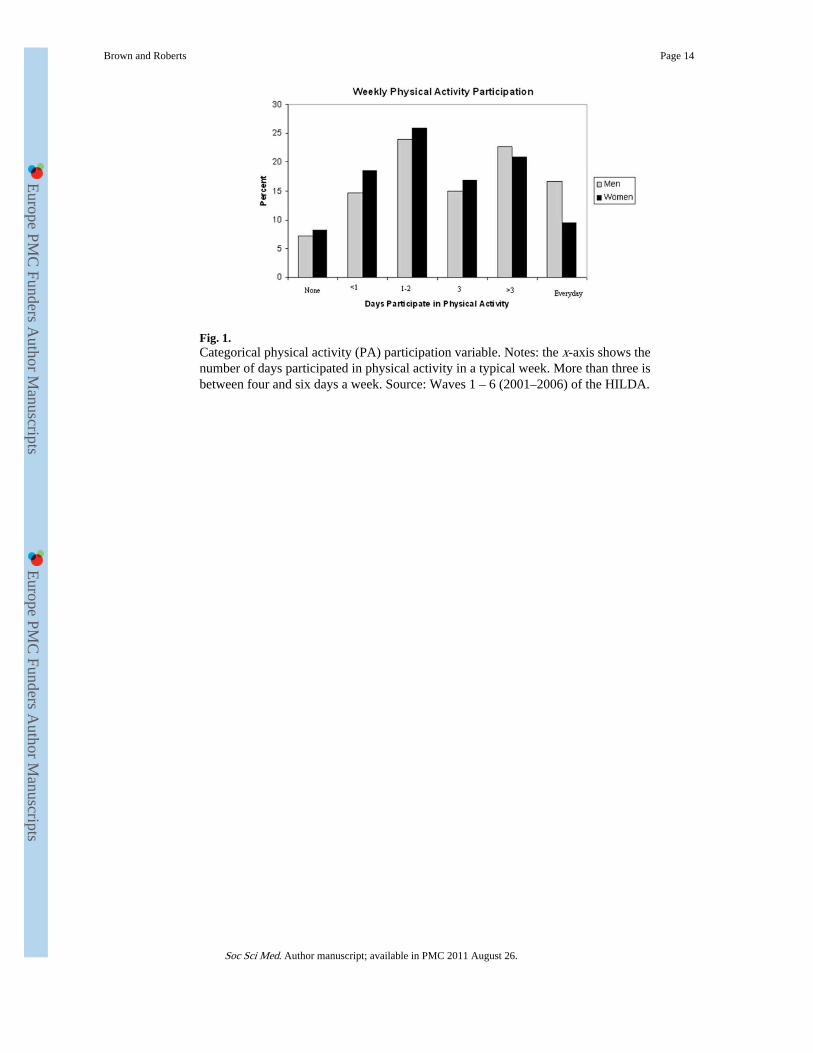
Fig. 1.Categorical physical activity (PA) participation variable. Notes: the x-axis shows thenumber of days participated in physical activity in a typical week. More than three isbetween four and six days a week. Source: Waves 1 – 6 (2001–2006) of the HILDA.
Brown and Roberts Page 14
Soc Sci Med. Author manuscript; available in PMC 2011 August 26.
Europe P
MC
Funders A
uthor Manuscripts
Europe P
MC
Funders A
uthor Manuscripts
Europe PMC Funders Author Manuscripts Europe PMC Funders Author Manuscripts
Brow
n and Roberts
Page 15
Table 1
Sample size, drop outs, rejoiners, survival rate (%) raw and net attrition rate (%).
Wave No. indiv Drop outs Rejoiners Survival rate Raw attrition Net attrition
Men
1 9464 – – – – –
2 8437 141 388 89.1% 14.9% 10.9%
3 8240 588 391 87.1% 7.0% 2.3%
4 8001 604 365 84.5% 7.3% 2.9%
5 7986 383 368 84.4% 4.8% 1.8%
6 7979 358 351 84.3% 4.5% 0.01%
Women
1 9897 – – – – –
2 8953 1204 260 90.5% 12.2% 9.5%
3 8840 371 258 89.3% 4.1% 1.3%
4 8553 561 274 86.4% 6.3% 3.2%
5 8608 215 270 87.0% 2.5% −1.0%
6 8648 206 246 87.4% 2.4% −0.04%
Notes: Drop outs are non-respondents at wave t and respondents and wave t−1. Rejoiners are respondents at wave t and non-respondents at wave t−1. Raw attrition rates exclude rejoiners. Net attrition ratesinclude rejoinders. Table controls for item non-response in the physical activity and employment variables.
Soc S
ci Med. A
uthor manuscript; available in P
MC
2011 August 26.
Europe PMC Funders Author Manuscripts Europe PMC Funders Author Manuscripts
Brow
n and Roberts
Page 16
Table 2 Descriptive statistics.
Physical activity Never <1 1–2 time 3 times >3 times Everyday n
Men
Employed 0.07 0.15 0.24 0.15 0.23 0.17 33106
Not in the labour force/unemployed 0.19 0.12 0.19 0.13 0.22 0.16 33106
Manual work 0.08 0.11 0.17 0.12 0.23 0.28 23271
Employed full-time 0.07 0.15 0.25 0.15 0.22 0.16 23283
Hourlywage 17.73 21.03 21.96 21.22 20.44 15.75 23252
Nonlabour income 1656.05 1289.55 1153.42 1162.99 1167.18 1530.97 23283
Age 42.39 40.28 39.19 38.85 39.76 38.99 21840
Year 12 or undefined certificate 0.06 0.13 0.25 0.16 0.24 0.16 23283
Certificate I, II, III, IV 0.08 0.15 0.23 0.14 0.22 0.18 23283
Diploma/advanced diploma 0.06 0.17 0.27 0.14 0.22 0.14 23283
BA or higher 0.05 0.15 0.28 0.18 0.22 0.09 23283
Children aged zero to four 0.08 0.18 0.28 0.14 0.18 0.14 23283
Children aged five to fifteen 0.08 0.18 0.25 0.15 0.21 0.14 23283
Children aged fifteen plus 0.09 0.16 0.24 0.14 0.22 0.15 23283
Married/cohabiting 0.07 0.16 0.25 0.14 0.22 0.15 23279
Single/divorced/widowed/separated 0.06 0.11 0.20 0.15 0.23 0.19 23279
Inner regional/outer regional/remote 0.07 0.14 0.21 0.14 0.23 0.21 23283
Major city 0.07 0.15 0.25 0.16 0.22 0.14 23283
Medium deprivation 0.07 0.15 0.24 0.14 0.23 0.17 23275
High deprivation 0.09 0.16 0.22 0.13 0.21 0.19 23275
Dissatisfied with free time 0.08 0.17 0.23 0.14 0.19 0.19 23272
Women
Employed 0.08 0.19 0.26 0.17 0.21 0.10 39159
Not in the labour force/unemployed 0.16 0.14 0.21 0.13 0.17 0.10 39159
Manual work 0.11 0.16 0.20 0.14 0.22 0.16 21318
Employed full-time 0.08 0.19 0.25 0.16 0.21 0.09 21318
Hourlywage 18.02 18.84 18.78 18.76 19.33 17.34 21278
Nonlabour income 1775.25 1472.62 1451.64 1362.64 1289.39 1521.26 21078
Soc S
ci Med. A
uthor manuscript; available in P
MC
2011 August 26.
Europe PMC Funders Author Manuscripts Europe PMC Funders Author Manuscripts
Brow
n and Roberts
Page 17
Physical activity Never <1 1–2 time 3 times >3 times Everyday n
Age 40.98 38.62 37.74 38.36 39.53 40.98 20032
Year 12 or undefined certificate 0.09 0.21 0.27 0.17 0.18 0.08 21318
Certificate I, II, III, IV 0.10 0.19 0.24 0.15 0.20 0.11 21318
Diploma/advanced diploma 0.05 0.17 0.25 0.20 0.21 0.09 21318
BA or higher 0.06 0.18 0.27 0.18 0.22 0.08 21318
Children aged zero to four 0.09 0.22 0.30 0.16 0.17 0.06 21318
Children aged five to fifteen 0.09 0.21 0.28 0.16 0.18 0.08 21318
Children aged fifteen plus 0.10 0.19 0.25 0.16 0.20 0.10 21318
Married/cohabiting 0.09 0.19 0.26 0.16 0.21 0.09 21314
Single/divorced/widowed/separated 0.08 0.17 0.26 0.18 0.21 0.10 21314
Inner regional/outer regional/remote 0.07 0.18 0.25 0.16 0.22 0.12 21318
Major city 0.09 0.19 0.26 0.17 0.20 0.08 21318
Medium deprivation 0.08 0.19 0.26 0.17 0.21 0.11 21315
High deprivation 0.11 0.20 0.25 0.15 0.20 0.09 21315
Dissatisfied with free time 0.12 0.27 0.32 0.19 0.21 0.10 21314
Notes: With the exception of employment status, all descriptive statistics are for the employed sub-sample used in the analysis. All variables are given in percentages with the exception of age (years),hourly wage and household income (Australian dollars). n = number of observations (i*t ).The percentages in each category for the categorical and indicator variables are calculated by taking the total n witha positive response in the categorical/indicator variable in all six physical activity categories and dividing this by the number of respondents with a positive response for the category/indicator variable ineach physical activity category. For example, n = 4478 for employed women with dependent children over the age of 15. n = 439 for employed women with dependent children over the age of 15 whoparticipate in physical activity everyday. 439/4478 = 0.08 or the percentage of women with dependent children over the age of 15 that participate in physical activity everyday.
Soc S
ci Med. A
uthor manuscript; available in P
MC
2011 August 26.
Europe PMC Funders Author Manuscripts Europe PMC Funders Author Manuscripts
Brow
n and Roberts
Page 18
Table 3
Random generalised ordered probit for employed men and women (marginal probability effects shown).
Men Women
(1) (2) (3) (4) (5) (6) (7) (8) (9) (10)
<1 1–2 3 >3 Everyday <1 1–2 3 >3 Everyday
Nonlabour income 0.00** 0.00** 0.00 0.00 0.00** 0.00* 0.00** 0.00** 0.00 0.00
Hourlywage 0.00** 0.00* 0.00 0.00* −0.01** 0.00* 0.00 0.00 0.00 0.00
Employed full-time −0.01 −0.04 −0.06 −0.04 0.14** −0.03 −0.08** −0.02 −0.10** −0.17**
Manual work −0.08 0.08 0.20** 0.27** 0.34** −0.21** −0.04 0.13** 0.27** 0.42**
Major city −0.17** −0.20** −0.23** −0.26** −0.25** −0.22** −0.17** −0.18** −0.19** −0.20**
Medium deprivation −0.18** −0.20** −0.13** −0.08* 0.00 −0.19** −0.17** −0.11** −0.06 −0.01
High deprivation −0.37** −0.35** −0.22** −0.13** 0.03 −0.35** −0.29** −0.17** −0.09* −0.03
Children aged 0–4 −0.16** −0.16** −0.21** −0.20** −0.08 −0.25** −0.23** −0.30** −0.23** −0.20**
Children aged 5–15 0.02 −0.03 −0.01 −0.01 −0.02 0.04 −0.06−0.18** −0.18** −0.15**
Children aged 15+ −0.07 −0.01 −0.04 −0.04 0.00 −0.04 −0.08* −0.14** −0.15** −0.04
Married/cohabiting 0.03 −0.07 −0.17** −0.13** −0.12** −0.08 −0.13** −0.11** −0.06 −0.09
Age −0.04** −0.06** −0.05** −0.04** −0.05** −0.05** −0.02 0.01 0.01 0.01
Age squared 0.00** 0.00** 0.00** 0.00** 0.00** 0.00** 0.00 0.00 0.00 0.00
Year 12 or undefined certificate 0.23** 0.13* −0.02 −0.15** −0.30** 0.13* 0.00 −0.07 −0.15** −0.18**
Certificate I, II, III, IV 0.15** 0.10* 0.02 −0.06 −0.13** 0.03 0.05 0.02 0.02 0.07
Diploma/advanced diploma 0.40** 0.11 −0.15* −0.26** −0.41** 0.47** 0.31** 0.14** −0.09 −0.22**
BA or higher 0.60** 0.30** −0.03 −0.30** −0.63** 0.44** 0.28** 0.11** −0.03 −0.25**
Dissatisfied with free time 0.14** 0.16** 0.05 0.02 −0.16** 0.12** 0.20** 0.15** 0.12** −0.01
n 21787 19994
ͳ 0.53*** 0.56***
log-likelihood −33856.37 −30808.90
2 33.74*** (0.00) 23.08** (0.00)
Soc S
ci Med. A
uthor manuscript; available in P
MC
2011 August 26.

Europe PMC Funders Author Manuscripts Europe PMC Funders Author Manuscripts
Brow
n and Roberts
Page 19
Notes: The base category in the model is never participating in moderate physical activity. Columns (1) for men and (6) for women then show a marginal change in the explanatory variables influencing the likelihood of participating in less than one day a week of physicalactivity compared to never participating in physical activity. Columns (2) for men and (7) for women show how a marginal change in the explanatory variables influence the likelihood of participating in 1–2 two days of physical activity compared to the base category of no
physical activity, the same line of reasoning can be used to explain the interpretation of the marginal probabilities in columns (3–5) for men and (8–10) for women. The coefficients can be interpreted as percentages. The Wald 2 is for the parallel line assumption test for the fullmodel. The p-value for the test is in column (2) for men and column (7) for women. The null-hypothesis is the parallel line assumption is violated.
**Indicates significance at the 1% level
*Indicates significance at the 5% level.
Soc S
ci Med. A
uthor manuscript; available in P
MC
2011 August 26.