detailed project report on energy efficient...
TRANSCRIPT

DETAILED PROJECT REPORT
ON
ENERGY EFFICIENT MOTOR - CRUSHER SECTION (ORISSA SPONGE IRON CLUSTER)
Bureau of Energy Efficiency
Prepared By
Reviewed By

ENERGY EFFICIENT MOTOR FOR CRUSHER SECTION-25HP
ORISSA SPONGE IRON CLUSTER

BEE, 2011
Detailed Project Report on Efficient Motors in Crusher Section
Sponge Iron Cluster, Orissa, (India)
New Delhi: Bureau of Energy Efficiency;
Detail Project Report No.: Orissa/Sponge/EEP/01
For more information
Bureau of Energy Efficiency (BEE)
(Ministry of Power, Government of India)
4th Floor, Sewa Bhawan
R. K. Puram, New Delhi – 110066
Telephone +91-11-26179699
Fax+91-11-26178352
Websites: www.bee-india.nic.in
Email: [email protected]/ [email protected]

vii
Acknowledgement We sincerely appreciate the efforts of industry, energy auditors, equipment manufacturers,
technology providers, consultants and other experts in the area of energy conservation for
joining hands with Bureau of Energy Efficiency (BEE), Ministry of Power, and Government
of India for preparing the Detailed Project Report (DPR) under BEE SME Program in
SMEs clusters. We appreciate the support of suppliers/vendors for providing the adoptable
energy efficient equipments/technical details to the SMEs.
We have received very encouraging feedback for the BEE SME Program in various SME
Clusters. Therefore, it was decided to bring out the DPR for the benefits of SMEs. We
sincerely thank the officials of BEE, Executing Agencies and ISTSL for all the support and
cooperation extended for preparation of the DPR. We gracefully acknowledge the diligent
efforts and commitments of all those who have contributed in preparation of the DPR.

viii
Contents
List of Annexure vii
List of Tables vii
List of Figures viii
List of Abbreviation viii
Executive summary ix
About BEE’S SME program xi
1 INTRODUCTION ........................................................................................................1
1.2 Energy performance in existing situation ....................................................................2
1.2.1 Fuel and electricity consumption of a typical unit in the cluster ...................................2
1.2.2 Average production by a typical unit in the cluster ......................................................3
1.2.3 Specific Energy Consumption .....................................................................................3
1.3 Existing technology/equipment ...................................................................................4
1.3.1 Description of existing technology ...............................................................................4
1.3.2 Its role in the whole process .......................................................................................5
1.4 Establishing the baseline for the equipment ................................................................5
1.4.1 Design and operating parameters ...............................................................................5
1.4.2 Electricity consumption in existing system ..................................................................5
1.4.2 Operating efficiency of the existing motor ...................................................................5
1.5 Barriers for adoption of new and energy efficient technology / equipment ...................5
1.5.1 Technological Barriers ................................................................................................5
1.5.2 Financial Barrier ..........................................................................................................6
1.5.3 Skilled manpower .......................................................................................................6
1.5.4 Other barrier(s) ...........................................................................................................6
2. TECHNOLOGY/EQUIPMENT FOR ENERGY EFFICIENCY IMPROVEMENTS .........7
2.1 Detailed description of technology/equipment selected ...............................................7
2.1.1 Description of equipment ............................................................................................7
2.1.2 Technology /Equipment specifications ........................................................................7

ix
2.1.3 Justification of the technology selected & Suitability ...................................................8
2.1.4 Superiority over existing technology/equipment ..........................................................8
2.1.5 Availability of the proposed technology/equipment ......................................................9
2.1.6 Source of technology/equipment for the project ............................................................9
2.1.7 Service/technology providers ......................................................................................9
2.1.8 Terms of sales ............................................................................................................9
2.1.9 Process down time during implementation ..................................................................9
2.2 Life cycle assessment and risks analysis ....................................................................9
2.3 Suitable unit/plant size in terms of capacity/production ............................................. 10
3. ECONOMIC BENEFITS OF NEW ENERGY EFFICIENT TECHNOLOGY ................ 11
3.1 Technical benefits ..................................................................................................... 11
3.1.1 Fuel savings per year................................................................................................ 11
3.1.2 Electricity savings per year ....................................................................................... 11
3.1.3 Improvement in product quality ................................................................................. 11
3.1.4 Increase in production............................................................................................... 11
3.1.5 Reduction in raw material consumption .................................................................... 11
3.1.6 Reduction in other losses .......................................................................................... 11
3.2 Monetary benefits ..................................................................................................... 11
3.3 Social benefits .......................................................................................................... 11
3.3.1 Improvement in working environment in the plant ..................................................... 11
3.3.2 Improvement in skill set of workers ........................................................................... 11
3.4 Environmental benefits ............................................................................................. 12
3.4.1 Reduction in effluent generation ............................................................................... 12
3.4.2 Reduction in GHG emission such as CO2, NOx, etc ................................................. 12
3.4.3 Reduction in other emissions like SOx ...................................................................... 12
4. INSTALLATION OF NEW ENERGY EFFICIENT MOTOR ........................................ 13
4.1 Cost of technology/equipment implementation .......................................................... 13
4.1.1 Cost of technology/equipments ................................................................................. 13

x
4.1.2 Other costs ............................................................................................................... 13
4.2 Arrangement of funds ............................................................................................... 13
4.2.1 Entrepreneur’s contribution ....................................................................................... 13
4.2.2 Loan amount ............................................................................................................. 13
4.2.3 Terms & conditions of loan ....................................................................................... 13
4.3 Financial indicators ................................................................................................... 13
4.3.1 Cash flow analysis .................................................................................................... 13
4.3.2 Simple payback period .............................................................................................. 14
4.3.3 Net Present Value (NPV) .......................................................................................... 14
4.3.4 Internal rate of return (IRR) ....................................................................................... 14
4.3.5 Return on investment (ROI) ...................................................................................... 14
4.4 Sensitivity analysis in realistic, pessimistic and optimistic scenarios ......................... 14
4.5 Procurement and implementation schedule .............................................................. 14
ANNEXURE ........................................................................................................................... 15
Annexure 1: Detailed technology assessment report – EE Motor ........................................... 15
Annexure 2: Detailed financial calculations & analysis ........................................................... 16
Profit before tax .................................................................................................................... 17
Add: Book depreciation ....................................................................................................... 17
Less: WDV depreciation ...................................................................................................... 17
Taxable profit ........................................................................................................................ 17
Income Tax ........................................................................................................................... 17
Annexure 3: Details of procurement and implementation plan ................................................ 20
Annexure 4: Details of technology/equipment and service providers ...................................... 21
ANNEXURE 5: QUOTATIONS OR TECHNO-COMMERCIAL BIDS FOR NEW
TECHNOLOGY/EQUIPMENT ................................................................................................ 22
List of Table
Table 1.1: Energy consumption of typical units.......................................................................... 2
Table 1.2: Specific energy consumption for typical unit ............................................................. 3

xi
Table 1.3 Existing motor specifications...................................................................................... 4
Table 1.4 Electricity consumption .............................................................................................. 5
Table 2.1: Energy Efficient motor Specifications ........................................................................ 8
Table 4.1: Project detail cost ................................................................................................... 13
Table 4.2: Sensitivity analysis ................................................................................................. 14
Lists of Abbreviations
BEE - Bureau of Energy Efficiency
DPR - Detailed Project Report
DSCR - Debt Service Coverage Ratio
GHG - Green House Gases
HP - Horse Power
IRR - Internal Rate of Return
MoP - Ministry of Power
MoSME - Micro Small and Medium Enterprises
NPV - Net Present Value
ROI - Return On Investment
SIDBI - Small Industrial Development Bank of India
SME - Small and Medium Enterprises

xii
EXECUTIVE SUMMARY
Bureau of Energy Efficiency (BEE) appointed Andhra Pradesh Industrial Technical
Consultancy Organisation Limited as the executing agency for Orissa Sponge Iron Cluster
under BEE’s SME programme. Under this project, the executing agency carried out
studies in the Sponge Iron Cluster of Orissa. Out of a total of 107 Sponge Iron Units,
energy efficiency study was conducted in selected 30 units.
Based on the energy audits, the executing agency submitted their report to BEE in form of
a cluster manual with recommendations for energy conservation & savings potentials in
the Sponge Iron Cluster units. The recommendations made in the cluster manual are listed
below:
Power Generation from Waste Heat Recovery System
Fuel Economizer for Raw material preheating
Preheating kiln for Raw material preheating
Energy Efficient Motors
The DPR highlights the details of the study conducted for assessing the potential for
reducing electricity consumption by installing new efficient motor for in various units of the
cluster, possible electricity savings and its monetary benefit, availability of the
technologies/design, local service providers, technical features and proposed equipment
specifications, various barriers in implementation, environmental aspects, estimated GHG
reductions, capital cost, financial analysis, and schedule of project Implementation.
Total investment required and financial indicators calculated such as debt equity ratio,
monetary saving, IRR, NPV, DSCR and ROI etc for proposed technology is furnished in
Table below:
S. No. Particular Unit Value
1 Project cost (in Lakh) 0.65
2 Electricity Savings kWh/annum 6814
3 Monetary benefit (in Lakh) 0.27
4 Simple payback period Months 2.45
5 NPV (in Lakh) 0.22
6 IRR %age 21.49
7 ROI %age 31.24
8 Average DSCR Ratio 1.72

xiii
The projected profitability and cash flow statements indicate that the project
implementation i.e. installation of energy efficient motor will be financially viable and
technically feasible solution for the cluster.
xiv
ABOUT BEE’S SME PROGRAM
Bureau of Energy Efficiency (BEE) is implementing a BEE-SME Programme to improve
the energy performance in 29 selected SMEs clusters. Orissa Sponge Iron Cluster is one
of them. The BEE’s SME Programme intends to enhance the energy efficiency awareness
by funding/subsidizing need based studies in SME clusters and giving energy
conservation recommendations. For addressing the specific problems of these SMEs and
enhancing energy efficiency in the clusters, BEE will be focusing on energy efficiency,
energy conservation and technology up-gradation through studies and pilot projects in
these SMEs clusters.
Major activities in the BEE -SME program are furnished below:
Activity 1: Energy use and technology audit
The energy use technology studies would provide information on technology status, best
operating practices, gaps in skills and knowledge on energy conservation opportunities,
energy saving potential and new energy efficient technologies, etc for each of the sub
sector in SMEs.
Activity 2: Capacity building of stake holders in cluster on energy efficiency
In most of the cases SME entrepreneurs are dependent on the locally available
technologies, service providers for various reasons. To address this issue BEE has also
undertaken capacity building of local service providers and entrepreneurs/ Managers of
SMEs on energy efficiency improvement in their units as well as clusters. The local service
providers will be trained in order to be able to provide the local services in setting up of
energy efficiency projects in the clusters
Activity 3: Implementation of energy efficiency measures
To implement the technology up-gradation project in the clusters, BEE has proposed to
prepare the technology based detailed project reports (DPRs) for a minimum of five
technologies in three capacities for each technology.
Activity 4: Facilitation of innovative financing mechanisms for implementation of
energy efficiency projects
The objective of this activity is to facilitate the uptake of energy efficiency measures
through innovative financing mechanisms without creating market distortion

Energy Efficient Motor for Crusher
1
1 INTRODUCTION
Orissa is one of the States in India. It is located between the parallels of 17.49'N and
22.34'N latitudes and meridians of 81.27'E and 87.29'E longitudes. It is bounded by the
Bay of Bengal on the east; Madhya Pradesh on the west and Andhra Pradesh on the
south
The following resources are available in Orissa State.
1.1 Natural Resources
The state is a rich in minerals and natural resources. It is often said that Orissa has
everything under the sky, meaning its forest and agricultural wealth, lots under the earth,
an obvious reference to its mineral reserves and a coastline that is a dream come true.
Bauxite, chrome, iron ore, coal, manganese, etc mineral are available in Orissa .The
state's unique geographical position also endows it with abundant forest resources
1.1.1. Iron Ore
Orissa's iron reserves have always invited attention. The total Iron Ore reserves in the
state is estimated at 4177 million tones ore which is 33.91% of the country's deposit. The
Iron Ore mining operations in the State are open cast and mechanized. Most of the
mechanized mines have crushing and screening facilities. At present 46.06milion tonnes
of iron ore (2004-05) are produced in the sate. In view of growing world wide demand for
steel, there has been a major surge of interest in this sector. Due to rich in Iron ore
deposits in the state, reputed national /International steel makers have shown interest to
establish steel plants in the State.
Due to availability of rich iron ore in the state many mineral resource base industries are
established i.e. Iron making in the stale like Rourkela Steel Plant (RSP), aluminium plants
by INDAL and National Aluminium Company (NALCO), three charge chrome plants at
Bahmanipal, Bhadrak and Choudwar by Orissa Mining Corporation (OMC), Ferro Alloys
Corporation (FACOR) and Indian Charge Chrome Ltd. (ICCL). At Theruvalli in Rayagada
district, Indian Metals and Ferro-Alloys (IMFA) had set up a plant for production of charge
chrome / ferro chrome
1.1.2 Coal
There are 57 Gondawana & 14 Tertiary coalfields for the national inventory of coal and
Orissa state has only two coalfields. Yet their shares in the reserve are so far established
in the country amounts to 24.78%. The geographical reserves in the two coal fields under
the state are given below.

Energy Efficient Motor for Crusher
2
IB River Coal Field - 22.23 bt
Talcher Coal Field - 35.78 bt
Due to availability of rich content of Iron Ore and coal, many Sponge Iron Plants are
established in Orissa State under SME and large Industries. These industries are spread
over all parts of Orissa state where raw material are available.
1.2 Energy performance in existing situation
1.2.1 Fuel and electricity consumption of a typical unit in the cluster
The following energy is required for manufacturing of sponge Iron from Iron Ore.
Thermal Energy
Electrical Energy
Major energy consumption in Sponge Iron Plants is thermal followed by electrical energy Thermal Energy
All sponge Iron units are operated the rotary kiln and operated with coal based. Coal is
used as a fuel for heating the Iron Ore and as well as reaction agent in process. The
Temperature required for heating of Iron Ore is 700-900 C which is below the Iron melting
point. The required coal for major sponge Iron Plants are procured from Mahanadi Coal
and few plants are used both local and imported coal mix.
Electrical Energy
Another form of energy required for the Sponge Iron Plant is electrical energy. The
electrical Energy is used to operate the different equipments involved in Sponge Iron
Plants. The electrical energy is used to prepare the raw material, rotating the kilns and
cooler kilns. The source of electrical energy is from Western Electricity Supply Company of
Orissa Ltd (WESCO). The energy consumption of a typical Sponge Iron Manufacturing
unit in the cluster using low efficiency motors is furnished in Table 1.1 below:
Table 1.1: Energy consumption of typical units
S.No Name of Industries TPD 50 100 Annual Production
Annual Electrical
energy consumption (millions
of kWh)
Annual Coal consumption (Tons/annum)
1 Bajrang Ispat Limited 100 2 29900 2.89 40210
2 Bhagbati Steels Pvt Ltd 50 1 11200 0.8 15062
3 Jaganath Sponge Private Limited
50 1 14800 1.56 20086
4 Kendriya Ispat Pvt .Ltd 50 1 11850 1.45 15936
Energy Efficient Motor for Crusher
3
S.No Name of Industries TPD 50 100 Annual Production
Annual Electrical
energy consumption (millions
of kWh)
Annual Coal consumption (Tons/annum)
5 Maa Shakamburi Sponge ltd.
100 1 29651 2.9 46124
6 Maa Tarani Industries Private Ltd
100 2 27400 3.47 36848
7 Maha Kali Ispat Private Limited
50 1 14000 2.2 19000
8 Meta Sponge Private Limited
100 2 26400 3.25 35503
9 Pavan jay Sponge Limited 100 2 27200 3.14 36579
10 Shri Balaji Metallics Pvt Ltd 100 2 28900 3.48 38533
11 Swastik Ispat Pvt Ltd 50 11200 1.6 15348
12 Utkal Metallic Limited 100 2 25689 3.12 34547
13 Vishal Metallic Limited 100 1 28000 4.1 44091
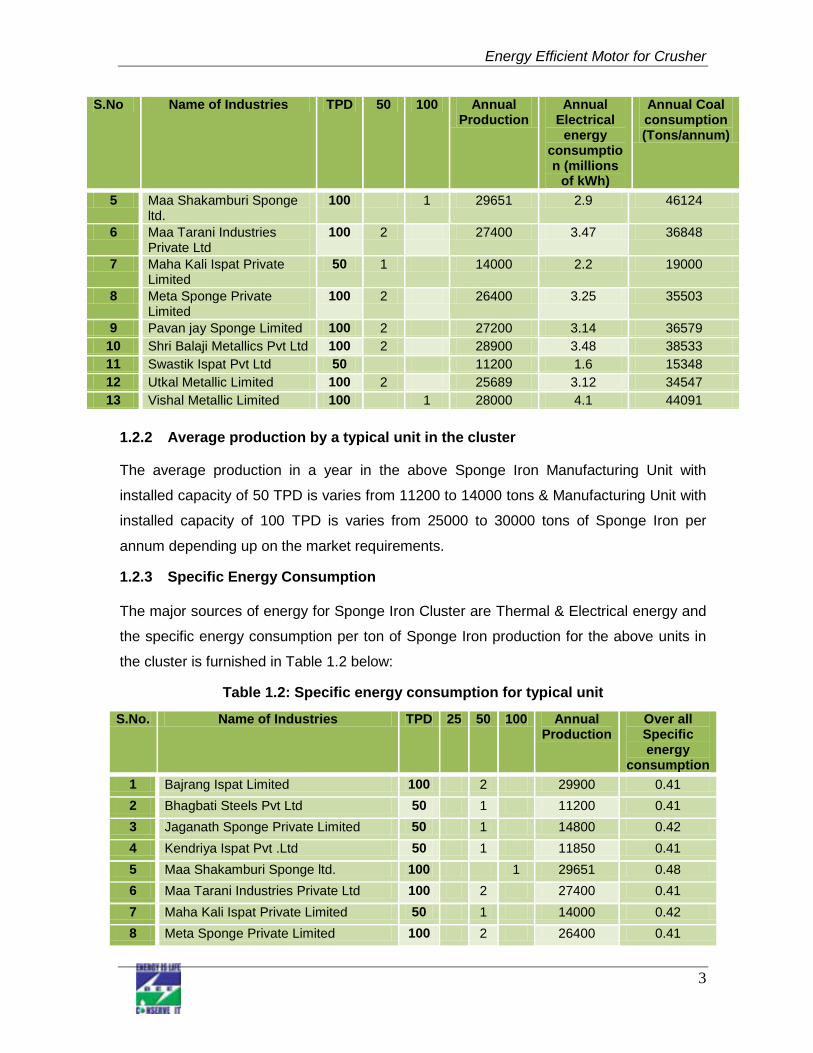
1.2.2 Average production by a typical unit in the cluster
The average production in a year in the above Sponge Iron Manufacturing Unit with
installed capacity of 50 TPD is varies from 11200 to 14000 tons & Manufacturing Unit with
installed capacity of 100 TPD is varies from 25000 to 30000 tons of Sponge Iron per
annum depending up on the market requirements.
1.2.3 Specific Energy Consumption
The major sources of energy for Sponge Iron Cluster are Thermal & Electrical energy and
the specific energy consumption per ton of Sponge Iron production for the above units in
the cluster is furnished in Table 1.2 below:
Table 1.2: Specific energy consumption for typical unit
S.No. Name of Industries TPD 25 50 100 Annual Production
Over all Specific energy
consumption
1 Bajrang Ispat Limited 100 2 29900 0.41
2 Bhagbati Steels Pvt Ltd 50 1 11200 0.41
3 Jaganath Sponge Private Limited 50 1 14800 0.42
4 Kendriya Ispat Pvt .Ltd 50 1 11850 0.41
5 Maa Shakamburi Sponge ltd. 100 1 29651 0.48
6 Maa Tarani Industries Private Ltd 100 2 27400 0.41
7 Maha Kali Ispat Private Limited 50 1 14000 0.42
8 Meta Sponge Private Limited 100 2 26400 0.41

Energy Efficient Motor for Crusher
4
S.No. Name of Industries TPD 25 50 100 Annual Production
Over all Specific energy
consumption
9 Pavan jay Sponge Limited 100 2 27200 0.41
10 Shri Balaji Metallics Pvt Ltd 100 2 28900 0.41
11 Swastik Ispat Pvt Ltd 50 2 11200 0.42
12 Utkal Metallic Limited 100 2 25689 0.41
13 Vishal Metallic Limited 100 1 28000 0.49
1.3 Existing technology/equipment
1.3.1 Description of existing technology
The motors presently installed for driving the Crusher in the units are very old and
inefficient. As per the detailed studies undertaken in various units of the cluster and based
on the discussions with the plant engineers, the motors installed for crushers application
are re-winded a number of times due to failure and is a common practice for all SME
owners. It is well known fact that the re-winded motors will have less efficiency and hence
increasing power consumption.
Power costs will certainly continue to rise and further escalate motor operating expense.
So the question of how repair affects motor efficiency is an important one. Some claim a
rewound motor is never as efficient as the original; others say a well-executed rewind can
be better than the original design. These differences in perception suggest there may be
several factors involved. Armed with the right information, understanding the factors that
affect rewind performance does not need to be complicated. The ability of the repair shop
to analyze and replace those parts, which most influence losses, such as the stator core,
the windings, and the rotor, will affect the outcome of a rewind.
A detail of existing Crusher motor is given in the Table 1.3 below:
Table 1.3 Existing motor specifications
S.No Details Crusher motor
1 Rated HP 25
2 Voltage 415
3 Rated Amps 30
4 Frequency 50 Hz
5 Power Consumption (kW) 17KW
6 RPM 975

Energy Efficient Motor for Crusher
5
1.3.2 Its role in the whole process
All Sponge Iron plants required iron ore and coal for production of sponge iron. The size of
iron ore and coal from the mines are available in the form of lumps. It is essential to
reduce the size up to 8-18mm size of iron ore and coal of size 5-18mm which is required
for the reduction in rotary kilns. Coal and iron ore crushers are installed in all plants to
reduce the required size of raw materials. The crushers are operated by motors and the
capacity of motor depends on the capacity of raw material process. The operation of
crusher depends on the rate of production in the plant and operated around 10- 12 hours
in a day
1.4 Establishing the baseline for the equipment
1.4.1 Design and operating parameters
The present power consumption of a motor is 19.89 kW. The motor is operated for 12
hours in a day.
1.4.2 Electricity consumption in existing system
The electricity consumption of Crusher motors in the two selected Plants of 50 TPD & 100
TPD Sponge Iron Units is furnished in Table 1.4 below:
Table 1.4 Electricity consumption
S. No Name of the unit TPD HP Actual Power consumption
in Kwh
1 Balaji Metallics Pvt Ltd 100 25 19.89
2 Kendriya Ispat Pvt Ltd 50 25 18.54
1.4.2 Operating efficiency of the existing motor
The detailed energy audit studies had been undertaken in various units of the cluster to
evaluate the motor efficiencies. Based on the age and number of the times, the motor is re
winded, the efficiency of the motor will be around 85%, against 92.2% efficiency standard
motors available.
1.5 Barriers for adoption of new and energy efficient technology / equipment
1.5.1 Technological Barriers
The major technical barriers that prevented the implementation of the energy efficient
motors in the cluster are:

Energy Efficient Motor for Crusher
6
Dependence on local equipment suppliers and availability of the motors at lower
cost.
Lack of awareness of the energy efficient motors.
1.5.2 Financial Barrier
The replacement of bigger size motors requires high investment and the repair and
rewinding of the motor will cost very less. Hence, many of the owners don’t show interest
due to high initial investment and lack of financial strength to invest. Further, the lack of
awareness of the losses and monetary benefit of energy efficient motors also one of the
major factor for implementing the energy efficient motors.
Energy Efficiency Financing Schemes such as SIDBI’s, if focused on the cluster, will play
a catalytic role in implementation of identified energy conservation projects & technologies.
The cluster has significant potential for implementing energy efficiency motors.
1.5.3 Skilled manpower
Not applicable
1.5.4 Other barrier(s)
Information on the energy efficient technologies not available among cluster unit owners,
though the suppliers are available locally of energy efficient motors, the information was
not disseminated among cluster units.
Energy Efficient Motor for Crusher
7
2. TECHNOLOGY/EQUIPMENT FOR ENERGY EFFICIENCY IMPROVEMENTS
2.1 Detailed description of technology/equipment selected
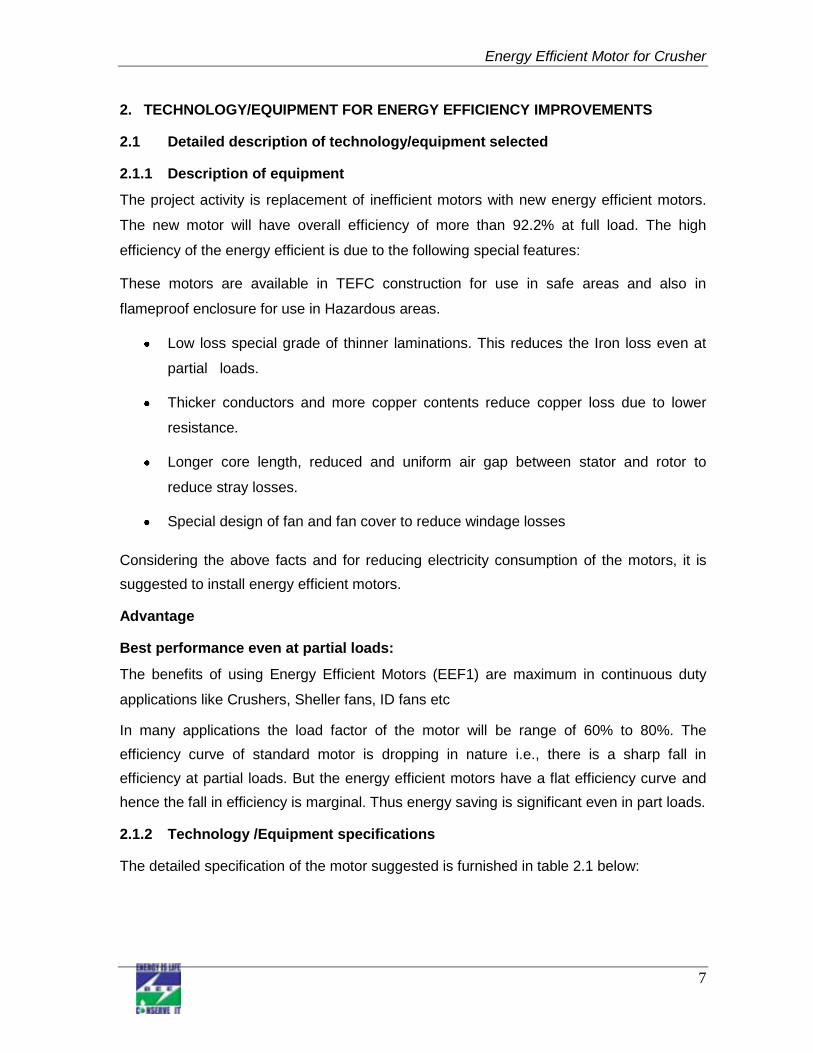
2.1.1 Description of equipment
The project activity is replacement of inefficient motors with new energy efficient motors.
The new motor will have overall efficiency of more than 92.2% at full load. The high
efficiency of the energy efficient is due to the following special features:
These motors are available in TEFC construction for use in safe areas and also in
flameproof enclosure for use in Hazardous areas.
Low loss special grade of thinner laminations. This reduces the Iron loss even at
partial loads.
Thicker conductors and more copper contents reduce copper loss due to lower
resistance.
Longer core length, reduced and uniform air gap between stator and rotor to
reduce stray losses.
Special design of fan and fan cover to reduce windage losses
Considering the above facts and for reducing electricity consumption of the motors, it is
suggested to install energy efficient motors.
Advantage
Best performance even at partial loads:
The benefits of using Energy Efficient Motors (EEF1) are maximum in continuous duty
applications like Crushers, Sheller fans, ID fans etc
In many applications the load factor of the motor will be range of 60% to 80%. The
efficiency curve of standard motor is dropping in nature i.e., there is a sharp fall in
efficiency at partial loads. But the energy efficient motors have a flat efficiency curve and
hence the fall in efficiency is marginal. Thus energy saving is significant even in part loads.
2.1.2 Technology /Equipment specifications
The detailed specification of the motor suggested is furnished in table 2.1 below:

Energy Efficient Motor for Crusher
8
Table 2.1: Energy Efficient motor Specifications
S. No Parameter Unit Value
1 Rated Capacity HP 25
2 Rated Current Amps 30
3 Speed RPM 975 rpm
4 Efficiency percentage 92.2 %
5 Power Factor Percentage 0.89
2.1.3 Justification of the technology selected & Suitability
The Crusher motors are major energy consuming equipment in Sponge Iron Units Cluster.
Based on the detailed energy audits conducted for motors installed in the cluster units, the
motors are old and re winded number of times leading reduction in efficiency and high
power consumption. Whereas, the new energy efficient motors will have overall efficiency
of 92.2 %( at full load). The following are the reasons for selection of this technology
The following benefits are possible for selection of this technology
Energy efficient motors will reduce electricity consumption
It reduces the GHG emissions
Lower payback period for Continuous Operation
High power factor
Flat efficiency curve for at all loads
Higher Motor life
2.1.4 Superiority over existing technology/equipment
The following are the superior features of energy efficient motors over existing motors
Improved efficiency is available from 60% to 100% load. The efficiency curve is
almost flat resulting in higher energy savings as in most of the cases the motor
is not always fully loaded
The special design features also result in lower operating temperatures which
enhance the life of motor and reduce the maintenance costs.
Energy Efficient Motor for Crusher
9
These motors have inherently low noise and vibration and help in conservation
of environment.
These motors are with highest power factor in the industry due the special
exclusive design.
The higher power factor reduces the currents in the cables supplying power to
motor and this reduces cable loss,
Improving the system efficiency sometimes by even 2%, sometimes this allows
even a lower cable size saving tremendously on capital costs.
Saving is also made by reducing capacitors required to improve power factor
2.1.5 Availability of the proposed technology/equipment
The energy efficient motor suppliers are available at Bhubaneswar and Rourkela. All the
major energy efficient motors suppliers like Crompton Greaves, SIEMENS, NGEF, etc are
manufacturing energy efficient motors. The details of the suppliers are provided in
Annexure-4.
2.1.6 Source of technology/equipment for the project
The source of the technology is indigenous and is locally available.
2.1.7 Service/technology providers
A detail of energy efficient motors suppliers has been furnished in Annexure 4.
2.1.8 Terms of sales
No any specific terms and conditions
2.1.9 Process down time during implementation
The process down time for installation of energy efficient motor is considered two days for
dismantling the existing motor and installation of new motor and providing electrical
connections to the motor.
2.2 Life cycle assessment and risks analysis
The life of the energy efficient motor is considered at 20 years. There is no risk involved as
the motor are technology proven and are successfully in operation in other industries of
the country.

Energy Efficient Motor for Crusher
10
2.3 Suitable unit/plant size in terms of capacity/production
The motors are selected similar to the existing capacity of the motor and actual power
drawn at full load based on energy audits carried out plus 20% margin to overcome
sudden load and also as recommended by the Crusher supplier.

Energy Efficient Motor for Crusher
11
3. ECONOMIC BENEFITS OF NEW ENERGY EFFICIENT TECHNOLOGY
3.1 Technical benefits
3.1.1 Fuel savings per year
No fuel saving is possible
3.1.2 Electricity savings per year
The efficiency of the new energy efficiency motor is more than the existing motor and
hence reduces electricity consumption. The power savings due to installation of new
energy efficient motor is 6814 kWh per annum.
3.1.3 Improvement in product quality
There is no significant impact on the product quality.
3.1.4 Increase in production
There is no significant effect on production capacity.
3.1.5 Reduction in raw material consumption
Not Applicable
3.1.6 Reduction in other losses
Due to improved power factor of new energy efficient motor, the distribution losses may
also reduce.
3.2 Monetary benefits
The monetary benefit due to installation of new energy efficient motors is estimated as Rs.
0.27 lakhs per annum due to reduction in electricity consumption:
3.3 Social benefits
3.3.1 Improvement in working environment in the plant
As installation of new efficient motor may lessen the breakdowns and hence working
environment may improve.
3.3.2 Improvement in skill set of workers
The technology selected for the implementation is new and energy efficient motor will
create the awareness among the workforce on energy efficiency in motors and how it will
reduce the power consumption.

Energy Efficient Motor for Crusher
12
3.4 Environmental benefits
3.4.1 Reduction in effluent generation
None
3.4.2 Reduction in GHG emission such as CO2, NOx, etc
The major GHG emission reduction source is CO2. The technology will reduce grid
electricity consumption and emission reductions are estimated at 12 tons of CO2 per
annum due to implementation of the project activity.
3.4.3 Reduction in other emissions like SOx
No significant impact on SOx emissions.

Energy Efficient Motor for Crusher
13
4. INSTALLATION OF NEW ENERGY EFFICIENT MOTOR
4.1 Cost of technology/equipment implementation
4.1.1 Cost of technology/equipments
The total cost for motor is estimated at 0.66 lakh, which includes motor cost and other
charges and discounts as per the Quotation in Annexure 5.
4.1.2 Other costs
Other charges include cabling and panel modification. Project cost details are furnished in
Table 4.1 below:
Table 4.1: Project detail cost S No. Particular Unit Value
1 New Energy Efficient motor Rs in Lakh 0.65
2 Panel, Switch & Cabling, Elec. and Modifications etc.
Rs in Lakh 0.01
3 Total Investment Rs in Lakh 0.66
4.2 Arrangement of funds
4.2.1 Entrepreneur’s contribution
The entrepreneur’s contribution is 25% of total project cost, which works out at 0.17 lakh.
4.2.2 Loan amount
The term loan is 75% of the total project, which is 0.50 lakh.
4.2.3 Terms & conditions of loan
The interest rate is considered at 10.0% which is prevailing interest rate of SIDBI for
energy efficiency related projects. The loan tenure is 5 years and the moratorium period is
6 months.
4.3 Financial indicators
4.3.1 Cash flow analysis
Considering the above discussed assumptions, the net cash accruals starting with 0.18
lakh in the first year operation and increases to 0.49 at the end of Fifth year.

Energy Efficient Motor for Crusher
14
4.3.2 Simple payback period
The total project cost of the proposed technology is Rs.0.65 lakhs and monetary savings
due to reduction in electricity consumption is Rs. 0.27 lakhs and the simple payback period
works out to be Two Year & Four Months
4.3.3 Net Present Value (NPV)
The Net present value of the investment at 10.0% interest rate works out to be 0.22 lakh.
4.3.4 Internal rate of return (IRR)
The after tax Internal Rate of Return of the project works out to be 21.49%. Thus the
project is financially viable.
4.3.5 Return on investment (ROI)
The average return on investment of the project activity works out at 31.24%. The average
DSCR is 1.72
4.4 Sensitivity analysis in realistic, pessimistic and optimistic scenarios
A sensitivity analysis has been worked out to ascertain how the project financials would
behave in different situations like there is an increase in power savings or decrease. For
the purpose of sensitive analysis, two scenarios are considered are.
Increase in power savings by 10%
Decrease in power savings by 10%
In each scenario, other inputs are assumed as constant. The financial indicators in each of
the above situation are indicated along with standard indicators.
Table 4.2: Sensitivity analysis
Particulars DSCR IRR
Normal 1.72 21.49%
10% increase in power savings 1.88 25.76%
10% decrease in power savings 1.55 17.09%
4.5 Procurement and implementation schedule
The project is expected to be completed in 2 weeks from the date of release of purchase
order. The detailed schedule of project implementation is furnished in Annexure 5.

Energy Efficient Motor for Crusher
15
ANNEXURE
Annexure 1: Detailed technology assessment report – EE Motor
Parameter Unit Crusher Motor
Present installed capacity hp 25
Present installed capacity kW 18.65
Present Power consumption kW 19.89
Motor load factor 90.31
Estimated efficiency at present operating Conditions % 86
Proposed capacity of New Motor kW 18.65
Proposed efficiency of energy efficiency motor (eff1) % 92.2
Expected Power Consumption of New Motor kW 18.27
Reduction Power consumption kW 1.62
No of days operation (assumption) Days 350
Working hours per day hours 12
Energy Charges Rs./kWh 3.9
Estimated savings potential kWh/annum 6814
Estimated cost savings Rs./annum 26573
Initial Investment Rs. 65000
Payback Period Years 2.45

Energy Efficient Motor for Crusher
16
Annexure 2: Detailed financial calculations & analysis
Assumptions Name of the Technology Energy Efficient Electric Motor
Rated Capacity 25 HP
Details Unit Value Basis
Installed Capacity HP 25
No of working days Days 350
No of Shifts per day Shifts 1
Capacity Utilization Factor %age
Proposed Investment
Plant & Machinery Rs. (in lakh) 0.65
Panel, Switch & Cabling etc. Rs. (in lakh) 0.01
Total Investment Rs. (in lakh) 0.66
Financing pattern
Own Funds (Equity) Rs. (in lakh) 0.17 Feasibility Study
Loan Funds (Term Loan) Rs. (in lakh) 0.50 Feasibility Study
Loan Tenure Years 5 Assumed
Moratorium Period Months 3 Assumed
Repayment Period Months 63 Assumed
Interest Rate %age 10.00% SIDBI Lending rate
Estimation of Costs
O & M Costs % on Plant & Equip 2.00 Feasibility Study
Annual Escalation %age 5.00 Feasibility Study
Estimation of Revenue
Electricity Saving kWh/Year 6814
Cost of electricity Rs./kWh 3.9
St. line Depn. %age 5.28 Indian Companies Act
IT Depreciation %age 80.00 Income Tax Rules
Income Tax %age 33.99 Income Tax
Estimation of Interest on Term Loan Rs. (in lakh)
Years Opening Balance Repayment Closing Balance Interest
1 0.50 0.02 0.47 0.05
2 0.47 0.09 0.38 0.05
3 0.38 0.09 0.28 0.04
4 0.28 0.09 0.19 0.03
5 0.19 0.09 0.09 0.02
6 0.09 0.09 0.00 0.01
Total 0.50
WDV Depreciation Rs. (in lakh)
Particulars / years 1 2 3 4 5 6
Plant and Machinery
Cost 0.66 0.53 0.11 0.02 0.00 0.00
Depreciation 0.03 0.03 0.03 0.03 0.03 0.03
WDV 0.53 0.11 0.02 0.00 0.00 0.00

Energy Efficient Motor for Crusher
17
Projected Profitability Rs. (in lakh)
Particulars / Years 1 2 3 4 5 6 Total
Fuel savings 0.27 0.27 0.27 0.27 0.27 0.27 1.59
Total Revenue (A) 0.27 0.27 0.27 0.27 0.27 0.27 1.59
Expenses
O & M Expenses 0.01 0.01 0.01 0.01 0.01 0.01 0.08
Total Expenses (B) 0.01 0.01 0.01 0.01 0.01 0.01 0.08
PBDIT (A)-(B) 0.25 0.25 0.25 0.25 0.25 0.25 1.52
Interest 0.05 0.05 0.04 0.03 0.02 0.01 0.19
PBDT 0.20 0.21 0.21 0.22 0.23 0.24 1.32
Depreciation 0.03 0.03 0.03 0.03 0.03 0.03 0.21
PBT 0.17 0.17 0.18 0.19 0.20 0.21 1.12
Income tax 0.00 0.03 0.07 0.07 0.08 0.08 0.34
Profit after tax (PAT) 0.17 0.14 0.11 0.11 0.12 0.13 0.78
Computation of Tax Rs. (in lakh)
Particulars / Years 1 2 3 4 5 6
Profit before tax 0.17 0.17 0.18 0.19 0.20 0.21
Add: Book depreciation 0.03 0.03 0.03 0.03 0.03 0.03
Less: WDV depreciation 0.53 0.11 0.02 0.00 0 0
Taxable profit 0.00 0.10 0.19 0.22 0.23 0.24
Income Tax 0.00 0.03 0.07 0.07 0.08 0.08
Projected Balance Sheet Rs. (in lakh)
Particulars / Years 1 2 3 4 5 6
Share Capital (D) 0.17 0.17 0.17 0.17 0.17 0.17
Reserves & Surplus (E) 0.17 0.30 0.42 0.53 0.65 0.78
Term Loans (F) 0.47 0.38 0.28 0.19 0.09 0.00
Total Liabilities (D)+(E)+(F) 0.80 0.85 0.87 0.89 0.91 0.94
Assets 1 2 3 4 5 6
Gross Fixed Assets 0.66 0.66 0.66 0.66 0.66 0.66
Less Accm. Depreciation 0.03 0.07 0.10 0.14 0.17 0.21
Net Fixed Assets 0.63 0.59 0.56 0.52 0.49 0.45
Cash & Bank Balance 0.18 0.26 0.31 0.37 0.43 0.49
TOTAL ASSETS 0.80 0.85 0.87 0.89 0.91 0.94
Net Worth 0.33 0.47 0.58 0.70 0.82 0.94
Debt Equity Ratio 2.86 2.29 1.71 1.14 0.57 0.00
Projected Cash Flow Rs. (in lakh)
Particulars / Years 0 1 2 3 4 5 6
Sources
Share Capital 0.17
-
-
-

Energy Efficient Motor for Crusher
18
Term Loan 0.50
Profit After tax 0.17 0.14 0.11 0.11 0.12 0.13
Depreciation 0.03 0.03 0.03 0.03 0.03 0.03
Total Sources 0.66 0.20 0.17 0.15 0.15 0.15 0.16
Application
Capital Expenditure 0.66
Repayment Of Loan -
0.02
0.09
0.09
0.09
0.09
0.09
Total Application 0.66
0.02
0.09
0.09
0.09
0.09
0.09
Net Surplus -
0.18
0.08
0.05
0.06
0.06
0.07
Add: Opening Balance -
-
0.18
0.26
0.31
0.37
0.43
Closing Balance -
0.18 0.26 0.31 0.37 0.43 0.49
IRR Rs. (in lakh) Particulars /
months 0 1 2 3 4 5 6
Profit after Tax 0.17 0.14 0.11 0.11 0.12 0.13
Depreciation 0.03 0.03 0.03 0.03 0.03 0.03
Interest on Term Loan
0.05 0.05 0.04 0.03 0.02 0.01
Cash outflow (0.66) - - - - - -
Net Cash flow (0.66) 0.25 0.22 0.19 0.18 0.17 0.17
IRR 21.49%
NPV 0.22
Break Even Point Rs. (in lakh)
Particulars / Years 1 2 3 4 5 6
Variable Expenses
Oper. & Maintenance Exp (75%) 0.01 0.01 0.01 0.01 0.01 0.01
Sub Total(G) 0.01 0.01 0.01 0.01 0.01 0.01
Fixed Expenses
Oper. & Maintenance Exp (25%) 0.00 0.00 0.00 0.00 0.00 0.00
Interest on Term Loan 0.05 0.05 0.04 0.03 0.02 0.01
Depreciation (H) 0.03 0.03 0.03 0.03 0.03 0.03
Sub Total (I) 0.09 0.09 0.08 0.07 0.06 0.05
Sales (J) 0.27 0.27 0.27 0.27 0.27 0.27
Contribution (K) 0.26 0.26 0.26 0.26 0.26 0.26
Break Even Point (L= G/I) 34.26% 33.34% 29.65% 25.97% 22.28% 18.60%
Cash Break Even {(I)-(H)} 20.64% 19.72% 16.03% 12.35% 8.66% 4.98%
Break Even Sales (J)*(L) 0.09 0.09 0.08 0.07 0.06 0.05
Return on Investment Rs. (in lakh) Particulars / Years 1 2 3 4 5 6 Total
Net Profit Before Taxes 0.17 0.17 0.18 0.19 0.20 0.21 0.91
Net Worth 0.33 0.47 0.58 0.70 0.82 0.94 2.90
31.24%

Energy Efficient Motor for Crusher
19
Debt Service Coverage Ratio Rs. (in lakh)
Particulars / Years 1 2 3 4 5 6 Total
Cash Inflow
Profit after Tax 0.17 0.14 0.11 0.11 0.12 0.13 0.78
Depreciation 0.03 0.03 0.03 0.03 0.03 0.03 0.21
Interest on Term Loan 0.05 0.05 0.04 0.03 0.02 0.01 0.19
Total (M) 0.25 0.22 0.19 0.18 0.17 0.17 1.18
DEBT
Particulars / Years 1 2 3 4 5 6 Total
Cash Inflow
Interest on Term Loan 0.05 0.05 0.04 0.03 0.02 0.01 0.19
Repayment of Term Loan 0.02 0.09 0.09 0.09 0.09 0.09 0.50
Total (N) 0.07 0.14 0.13 0.12 0.11 0.10 0.69
Average DSCR (M/N) 1.72
Sensitivity Analysis
Factors Variation* IRR DSCR
power savings 0% 21.49% 1.72
Factor Variation Variation IRR DSCR Variation Variation
IRR DSCR IRR DSCR
-10% -10% +10% +10%
power savings 17.09% 1.55 21.49% 1.72 25.76% 1.88

Energy Efficient Motor for Crusher
20
Annexure 3: Details of procurement and implementation plan
Project Implementation schedule
S. No Activity Weeks
1 2 3 4
1 Placement of Orders for Equipment
2 Supply of motor
3 Installation of the motor
4 Trial runs
Process down time
S. No Activity Weeks
1 2 3 4
1 Dismantling of the existing motor
2 Electricity connections and modification of the pipe lines
3 Installation of the motor
4 Trial runs
The process down time is considered for only two days.

Energy Efficient Motor for Crusher
21
Annexure 4: Details of technology/equipment and service providers
Equipment details Source of technology Service/technology providers
Energy Efficient motors M/s .CROMPTON GREEVES LIMITED Bhubaneswar Branch Jan path Tower ,3rd Floor, Ashok Nagar , Unit II ,Bhubaneswar -751009, Orissa

Energy Efficient Motor for Crusher
22
ANNEXURE 5: QUOTATIONS OR TECHNO-COMMERCIAL BIDS FOR NEW
TECHNOLOGY/EQUIPMENT

India SME Technology Services Ltd DFC Building, Plot No.37-38, D-Block, Pankha Road, Institutional Area, Janakpuri, New Delhi-110058 Tel: +91-11-28525534, Fax: +91-11-28525535 Website: www.techsmall.com
Bureau of Energy Efficiency (BEE) (Ministry of Power, Government of India) 4th Floor, Sewa Bhawan, R. K. Puram, New Delhi – 110066 Ph.: +91 – 11 – 26179699 (5 Lines), Fax: +91 – 11 – 26178352
Websites: www.bee-india.nic.in, www.energymanagertraining.com
APITCO Limited 8th FLOOR, PARISRAMA BHAVAN, BASHEERBAGH, HYDERABAD 500 004 Phones: +91- 040-23237333, 23237981, Fax: +91-40-23298945 e-mail: [email protected] Website: www.apitco.org