detailed project report on energy efficient …sameeeksha.org/pdf/dpr/surat_150kg.pdf · detailed...
TRANSCRIPT
DETAILED PROJECT REPORT
ON ENERGY EFFICIENT PUMP FOR JET DYEING
MACHINE (150 KG)
(SURAT TEXTILE CLUSTER)
Bureau of Energy Efficiency
Prepared By Reviewed By
ENERGY EFFICIENT PUMP FOR JET MACHINE
(150 KG)
SURAT TEXTILE CLUSTER
BEE, 2010
Detailed Project Report on Energy Efficient Pump For Jet
Machine (150 kg)
Textile SME Cluster, Surat, Gujrat (India)
New Delhi: Bureau of Energy Efficiency;
Detail Project Report No.: SRT/TXT/EEP/08
For more information
Bureau of Energy Efficiency
Ministry of Power, Government of India
4th Floor, Sewa Bhawan, Sector - 1
R. K. Puram, New Delhi -110066
Ph: +91 11 26179699 Fax: 11 26178352
Email: [email protected]
WEB: www.bee-india.nic.in
Acknowledgement
We are sincerely thankful to the Bureau of Energy Efficiency, Ministry of Power, for giving us
the opportunity to implement the ‘BEE SME project in “Surat Textile Cluster, Surat”. We
express our sincere gratitude to all concerned officials for their support and guidance during the
conduct of this exercise.
Dr. Ajay Mathur, Director General, BEE
Smt. Abha Shukla, Secretary, BEE
Shri Jitendra Sood, Energy Economist, BEE
Shri Pawan Kumar Tiwari, Advisor (SME), BEE
Shri Rajeev Yadav, Project Economist, BEE
Zenith Energy Services Pvt. Ltd. is also thankful to “Shri Mahesh Malpani, Chairman, PEPL
and Surat Textile Manufacturers Association” for their valuable inputs, co-operation, support
and identification of the units for energy use and technology audit studies and facilitating the
implementation of BEE SME program in Surat Textile Cluster.
We take this opportunity to express our appreciation for the excellent support provided by
Textile Unit Owners, Local Service Providers, and Equipment Suppliers for their active
involvement and their valuable inputs in making the program successful and in completion of
the Detailed Project Report (DPR).
ZESPL is also thankful to all the SME owners, plant in charges and all workers of the SME
units for their support during the energy use and technology audit studies and in
implementation of the project objectives.
Zenith Energy Services Pvt. Ltd.
Hyderabad
Contents
List of Annexure vii
List of Tables vii
List of Figures vii
List of Abbreviation viii
Executive summary ix
About BEE’S SME program x
1 INTRODUCTION .......................................................................................................... 1
1.1 About the Surat textile cluster ....................................................................................... 1
1.1.1 Production process ...................................................................................................... 1
1.2.1 Fuel and electricity consumption of a typical unit .......................................................... 4
1.2.2 Average production by a typical unit in the cluster ........................................................ 4
1.3 Identification of technology/equipment to be upgraded ................................................. 4
1.3.1 Existing/Conventional technology/equipment ............................................................... 4
1.3.2 Role in process ............................................................................................................ 4
1.4 Establishing the baseline .............................................................................................. 4
1.4.1 Design and operating parameters ................................................................................ 4
1.4.2 Quantity of hot drained water ....................................................................................... 5
1.5 Barriers for proposed energy efficient equipment ......................................................... 5
1.5.1 Technological Barriers .................................................................................................. 5
1.5.2 Financial Barrier ........................................................................................................... 5
1.5.3 Skilled manpower ......................................................................................................... 5
1.5.4 Other barrier (If any) ..................................................................................................... 5
2 TECHNOLOGY/EQUIPMENT FOR ENERGY EFFICIENCY IMPROVEMENTS .......... 6
2.1 Detailed description of equipment selected .................................................................. 6
2.1.1 Description of equipment .............................................................................................. 6
2.1.2 Equipment specifications .............................................................................................. 6
2.1.3 Replacement of pump with existing pump .................................................................... 6
2.1.4 Superiority over existing equipment .............................................................................. 6
2.1.5 Availability of the proposed equipment ......................................................................... 7
2.1.6 Source of equipment for the project .............................................................................. 7
2.1.7 Service/technology providers ....................................................................................... 7
2.1.8 Terms and condition in sales of equipment. ................................................................. 7
2.1.9 Process down time during implementation ................................................................... 7
2.2 Life cycle assessment and risks analysis ..................................................................... 7
2.3 Suitable unit for implementation of proposed equipment .............................................. 7
3 ECONOMIC BENEFITS OF PROPOSED EQUIPMENT .............................................. 8
3.1 Technical benefits ........................................................................................................ 8
3.1.1 Fuel saving ................................................................................................................... 8
3.1.2 Electricity saving .......................................................................................................... 8
3.1.3 Improvement in product quality .................................................................................... 8
3.1.4 Increase in production .................................................................................................. 8
3.1.5 Reduction in raw material consumption ........................................................................ 8
3.1.6 Reduction in other losses ............................................................................................. 8
3.2 Monetary benefits ......................................................................................................... 8
3.3 Social benefits .............................................................................................................. 9
3.3.1 Improvement in working environment in the plant ......................................................... 9
3.3.2 Improvement in skill set of workers ............................................................................... 9
3.4 Environmental benefits ................................................................................................. 9
3.4.1 Reduction in effluent generation ................................................................................... 9
3.4.2 Reduction in GHG emission ......................................................................................... 9
3.4.3 Reduction in other emissions like SOx .......................................................................... 9
4 IMPLEMENTATION OF PROPOSED EQUIPMENT .................................................. 10
4.1 Cost of equipment implementation ............................................................................. 10
4.1.1 Cost of equipment ...................................................................................................... 10
4.1.2 Other costs ................................................................................................................. 10
4.2 Arrangement of funds ................................................................................................. 10
4.2.1 Entrepreneur’s contribution ........................................................................................ 10

4.2.2 Loan amount .............................................................................................................. 10
4.2.3 Terms & conditions of loan ......................................................................................... 10
4.3 Financial indicators .................................................................................................... 10
4.3.1 Cash flow analysis ..................................................................................................... 10
4.3.2 Simple payback period ............................................................................................... 11
4.3.3 Net Present Value (NPV) ........................................................................................... 11
4.3.4 Internal rate of return (IRR) ........................................................................................ 11
4.3.5 Return on investment (ROI) ........................................................................................ 11
4.4 Sensitivity analysis in realistic, pessimistic and optimistic scenarios ........................... 11
4.5 Procurement and implementation schedule ................................................................ 12

vii
List of Annexure
Annexure 1 Baseline establishment and energy saving .............................................. 13
Annexure 2 Process flow diagram .............................................................................. 14
Annexure 3 Technology Assessment Report – Energy Efficient Pump ....................... 15
Annexure 4 Detailed financial calculations & analysis ................................................ 16
Annexure 5 Procurement and Implementation plan schedule ..................................... 20
Annexure 6 Details of equipment and service providers ............................................. 21
Annexure 7 Quotations or Techno-commercial bids for proposed equipment ............. 22
List of Tables
Table 1.1: Energy consumption of a typical unit ........................................................... 4
Table 1.2 Electricity consumption of typical units .......................................................... 5
Table 3.1 Energy and Monetary Benefit due to Project Implementation........................ 8
Table 4.1 Details of Proposed Equipment Installation Cost ........................................ 10
Table 4.2 Sensitivity analysis at different scenarios .................................................... 11
List of Figures
Figure 1.1 Process Flowchart of Surat Textile Cluster ....................................................... 3

viii
List of Abbreviations
kWh kilo Watt Hour
FD Forced Draft
ID Induced Draft
MoMSME Ministry of Micro Small and Medium Enterprises
GHG Green House Gas
EE Energy Efficient
BEE Bureau of Energy Efficiency
DPR Detailed Project Report
O&M Operational & Maintenance
NPV Net Present Values
ROI Return on Investment
IRR Internal Rate of Return
DSCR Debt Service Coverage Ratio
PBT Profit Before Tax
PAT Profit After Tax
SIDBI Small Industries Development of India

ix
EXECUTIVE SUMMARY
Zenith Energy Services Pvt. Ltd is executing BEE-SME program in Surat textile cluster,
supported by Bureau of Energy Efficiency (BEE) with an overall objective of improving
the energy efficiency in cluster units.
Surat textile cluster is one of the largest textile clusters in India; accordingly this cluster
was chosen for energy efficiency improvements by implementing energy efficient
measures/technologies, so as to facilitate maximum replication in other textile clusters
in India.
The main energy forms used in the cluster units are electricity and fuel such as wood,
coal, natural gas and other biomass product. Mostly used in boilers, thermopac, Jet
dying, stenter, loop machine, scouring, bleaching, Jiggers, Jumbo, hydro extractor,
small pumps and lighting.
Installation of Energy Efficient Pump with Jet dying machine or Jigger or Jumbo will
reduces electricity consumption & production cost and also reduces the
environmentally harmful green house gases emission.
Project implementation i.e. installation of energy efficient pump (150 kg) for jet machine
will lead to reduction in electricity consumption by 61740 kWh per annum however; this
intervention will not have any effect on the existing consumption pattern of fossil fuel.
This bankable DPR also found eligible for subsidy scheme of MoMSME for
“Technology and Quality Upgradation Support to Micro, Small and Medium
Enterprises” under “National Manufacturing and Competitiveness Programme”. The
key indicators of the DPR including the Project cost, debt equity ratio, monetary benefit
and other necessary parameters are given in table:
S.No Particular Unit Value
1 Project cost `(in lakh) 4.40
2 Electricity saving kWh / year 61740
3 Monetary benefit `(in lakh) 3.46
4 Debit equity ratio ratio 3:1
5 Simple payback period years 1.27
6 NPV `(in lakh) 8.47
7 IRR %age 59.54
8 ROI %age 27.74
9 DSCR ratio 3.71
10 Process down time day 1
The projected profitability and cash flow statements indicate that the project
implementation will be financially viable and technically feasible
x
ABOUT BEE’S SME PROGRAM
Bureau of Energy Efficiency (BEE) is implementing a BEE-SME Programme to
improve the energy performance in 25 selected SMEs clusters. Surat Textile Cluster is
one of them. The BEE’s SME Programme intends to enhance the energy efficiency
awareness by funding / subsidizing need based studies in SME clusters and giving
energy conservation recommendations. For addressing the specific problems of these
SMEs and enhancing energy efficiency in the clusters, BEE will be focusing on energy
efficiency, energy conservation and technology up-gradation through studies and pilot
projects in these SMEs clusters.
Major activities in the BEE -SME program are furnished below:
Energy use and technology audit
The energy use technology studies would provide information on technology status,
best operating practices, gaps in skills and knowledge on energy conservation
opportunities, energy saving potential and new energy efficient technologies, etc for
each of the sub sector in SMEs.
Capacity building of stake holders in cluster on energy efficiency
In most of the cases SME entrepreneurs are dependent on the locally available
technologies, service providers for various reasons. To address this issue BEE has
also undertaken capacity building of local service providers and entrepreneurs/
Managers of SMEs on energy efficiency improvement in their units as well as clusters.
The local service providers will be trained in order to be able to provide the local
services in setting up energy efficiency projects in the clusters
Implementation of energy efficiency measures
To implement the technology up-gradation projects in clusters, BEE have proposed to
prepare the technology based detailed project reports (DPRs) for a minimum of five
technologies in three capacities for each technology.
Facilitation of innovative financing mechanisms for implementation of energy
efficiency projects
The objective of this activity is to facilitate the uptake of energy efficiency measures
through innovative financing mechanisms without creating market distortion.

Energy Efficient Pump For Jet Machine (150 kg)
1
1 INTRODUCTION
1.1 About the Surat textile cluster
The products manufactured in Surat Textile Cluster are synthetic sarees and dress
materials and the products are renowned in the country and abroad. The main raw
material for the cluster units is grey cloth and is procured from local weaving units and
agents. The cost of energy (electrical and thermal energy) as percentage of
manufacturing cost varies between 12 and 15%.
Majority of the cluster units are of integrated type, where the raw material “grey cloth”
is processed in-house to the final product like sarees and dress materials. Most of the
units of the cluster are working on Job basis, where the textile agents will provide
design and grey cloth and the unit’s process as per design provided by the clients. The
energy cost is next to the raw materials cost.
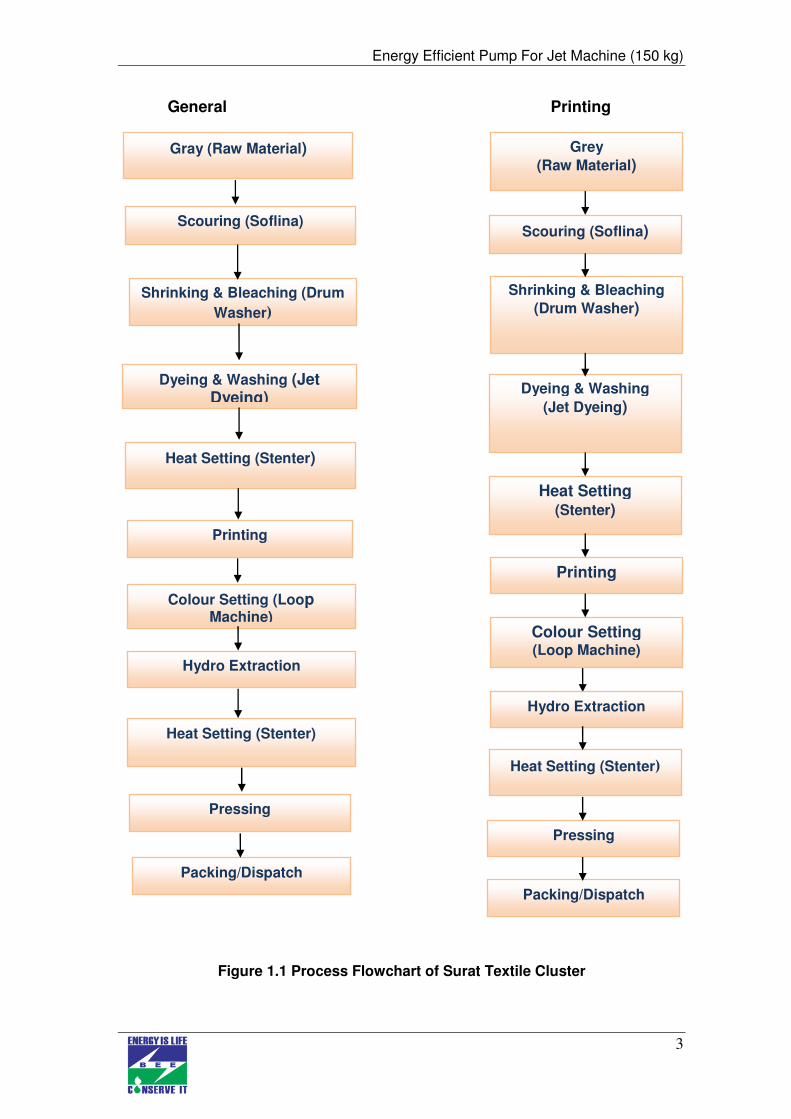
1.1.1 Production process
The main process operation for dyeing and printing process of synthetic sarees and
dress materials adopted in cluster units are as follows:
Fabric pre-treatment
The main purpose of the fabric pre-treatment process is to remove oil, grease and
other materials and to whiten the grey cloth though bleaching. The various process
adopted in pre-treatment are scouring, bleaching and shrinking process.
Dyeing
Dyeing is the process of imparting colors to the material through a dye (color). In which
a dye is applied to the substrate in a uniform manner to obtain an even shade with a
performance and fastness appropriate to its final use. This process is mainly performed
in Jet Dyeing Machines and Jigger machines
Dyeing of fabric is carried out in jet dyeing machines. The temperature of the solution
is raised to 50°C. Concentrated dyestuff solution is prepared separately and is added
to the liquor. After the addition of dyes, the temperature is raised to 130°C and
maintained for about 60 minutes.
After whitening/dyeing, the fabric is unloaded from the machine and taken to the
folding and rolling machines for improving the width of cloth, which gets shrunk during
the washing and dyeing process.

Energy Efficient Pump For Jet Machine (150 kg)
2
Printing
In Surat cluster three types printing methods are used. Most of the units are use flat
bed printing, rotary printing and some units follows hand printing. Hand printing is the
old method to print the fabric. The flat bed printing has provision for printing 10 to 14
colors simultaneously. The color print paste prepared is fed onto the screens from
which it is transferred to the fabric fed in. The fabric after print paste transfer is passed
through a drying chamber at 145°C. The dried and printed fabric is taken for further
processing.
Drying and Finishing
After printing, the drying process is performed in loop machine, where the temperature
is maintained between 130°C to 170°C for better colour setting. After passing through
the loop machines, the printed fabric is washed in a series of normal water and hot
water washing in the presence of chemicals for colour setting. After completion of the
washing process, the printed and washed fabric is subjected to heat setting process in
Stenter and then pressing and finishing treatments.
Energy Efficient Pump For Jet Machine (150 kg)
3
Gray (Raw Material)
Scouring (Soflina)
Shrinking & Bleaching (Drum
Washer)
Dyeing & Washing (Jet Dyeing)
Heat Setting (Stenter)
Printing
Colour Setting (Loop Machine)
Hydro Extraction
Heat Setting (Stenter)
Pressing
Packing/Dispatch
Grey
(Raw Material)
Scouring (Soflina)
Shrinking & Bleaching
(Drum Washer)
Dyeing & Washing
(Jet Dyeing)
Heat Setting (Stenter)
Printing
Colour Setting (Loop Machine)
Hydro Extraction
Heat Setting (Stenter)
Pressing
Packing/Dispatch
General Printing
Figure 1.1 Process Flowchart of Surat Textile Cluster
Energy Efficient Pump For Jet Machine (150 kg)
4
1.2 Energy performance in existing situation
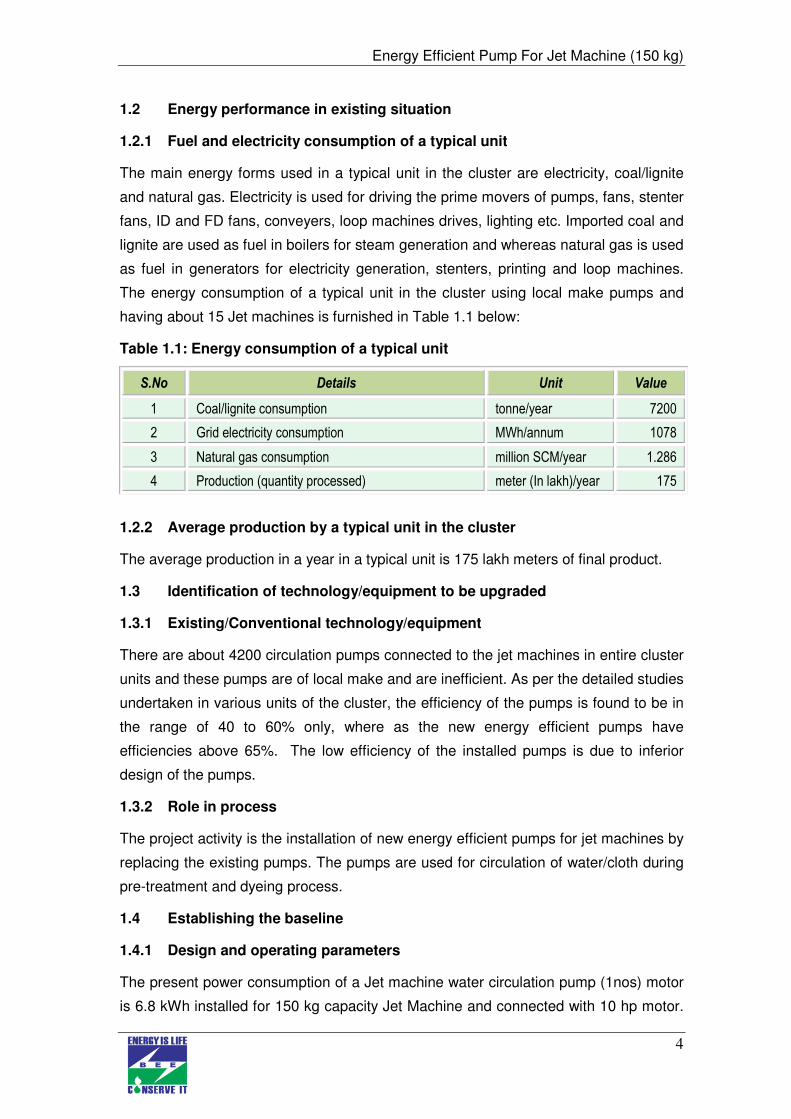
1.2.1 Fuel and electricity consumption of a typical unit
The main energy forms used in a typical unit in the cluster are electricity, coal/lignite
and natural gas. Electricity is used for driving the prime movers of pumps, fans, stenter
fans, ID and FD fans, conveyers, loop machines drives, lighting etc. Imported coal and
lignite are used as fuel in boilers for steam generation and whereas natural gas is used
as fuel in generators for electricity generation, stenters, printing and loop machines.
The energy consumption of a typical unit in the cluster using local make pumps and
having about 15 Jet machines is furnished in Table 1.1 below:
Table 1.1: Energy consumption of a typical unit
S.No Details Unit Value
1 Coal/lignite consumption tonne/year 7200
2 Grid electricity consumption MWh/annum 1078
3 Natural gas consumption million SCM/year 1.286
4 Production (quantity processed) meter (In lakh)/year 175
1.2.2 Average production by a typical unit in the cluster
The average production in a year in a typical unit is 175 lakh meters of final product.
1.3 Identification of technology/equipment to be upgraded
1.3.1 Existing/Conventional technology/equipment
There are about 4200 circulation pumps connected to the jet machines in entire cluster
units and these pumps are of local make and are inefficient. As per the detailed studies
undertaken in various units of the cluster, the efficiency of the pumps is found to be in
the range of 40 to 60% only, where as the new energy efficient pumps have
efficiencies above 65%. The low efficiency of the installed pumps is due to inferior
design of the pumps.
1.3.2 Role in process
The project activity is the installation of new energy efficient pumps for jet machines by
replacing the existing pumps. The pumps are used for circulation of water/cloth during
pre-treatment and dyeing process.
1.4 Establishing the baseline
1.4.1 Design and operating parameters
The present power consumption of a Jet machine water circulation pump (1nos) motor
is 6.8 kWh installed for 150 kg capacity Jet Machine and connected with 10 hp motor.

Energy Efficient Pump For Jet Machine (150 kg)
5
The average production is 750 kg/day per machine. The jet machines are operated for
24 hours in a day.
1.4.2 Quantity of hot drained water
The power consumption of various jet machines water circulation pump of three cluster
units is furnished in Table 1.2 below:
Table 1.2 Electricity consumption of typical units
S. No Name of the unit Jet Machines Capacity (kg)
Power consumption (kWh/day)
Efficiency of pump (%)
1 Navanidhi Dyeing and Printing Mills Pvt Ltd
150 136 42.5
2 Niharika Dyeing and Printing Mills Pvt Ltd
150 124 53.7
3 Akashaganga Processors Pvt Ltd
150 112 58.0
1.5 Barriers for proposed energy efficient equipment
1.5.1 Technological Barriers
The major technical barriers that prevented the implementation of the energy efficient
pump in the cluster are:
• Lack of awareness of energy efficient pumps
• Dependence on local equipment suppliers, who doesn’t have technical
knowledge
1.5.2 Financial Barrier
The lack of awareness of the losses and monetary benefit of energy efficient pumps
1.5.3 Skilled manpower
Not applicable
1.5.4 Other barrier (If any)
Information on the energy efficient technologies not available among cluster unit
owners, though the suppliers are available locally of energy efficient pumps, the
information was not disseminated among cluster units.

Energy Efficient Pump For Jet Machine (150 kg)
6
2 TECHNOLOGY/EQUIPMENT FOR ENERGY EFFICIENCY IMPROVEMENTS
2.1 Detailed description of equipment selected
2.1.1 Description of equipment
The project activity is replacement of jet machine conventional pumps with new energy
efficient pumps. The new pumps will have overall efficiency more than 65%. The
energy efficient pumps will have critically designed impellers, volute, eye and casing.
The impeller is made of Stainless Steel material and are resistant to corrosion and
scale formation.
In Surat Textile Cluster units, the pumps installed for jet machines have efficiencies in
the range of 40% to 60% only due to inferior design of pumps and mismatch selection.
Considering the above facts and for reducing electricity consumption of Jet machine
pumps, it is suggested to install new energy efficient pumps. The details of power
consumption of various pumps installed for jet machines and efficiency levels are
provided in Annexure 1.
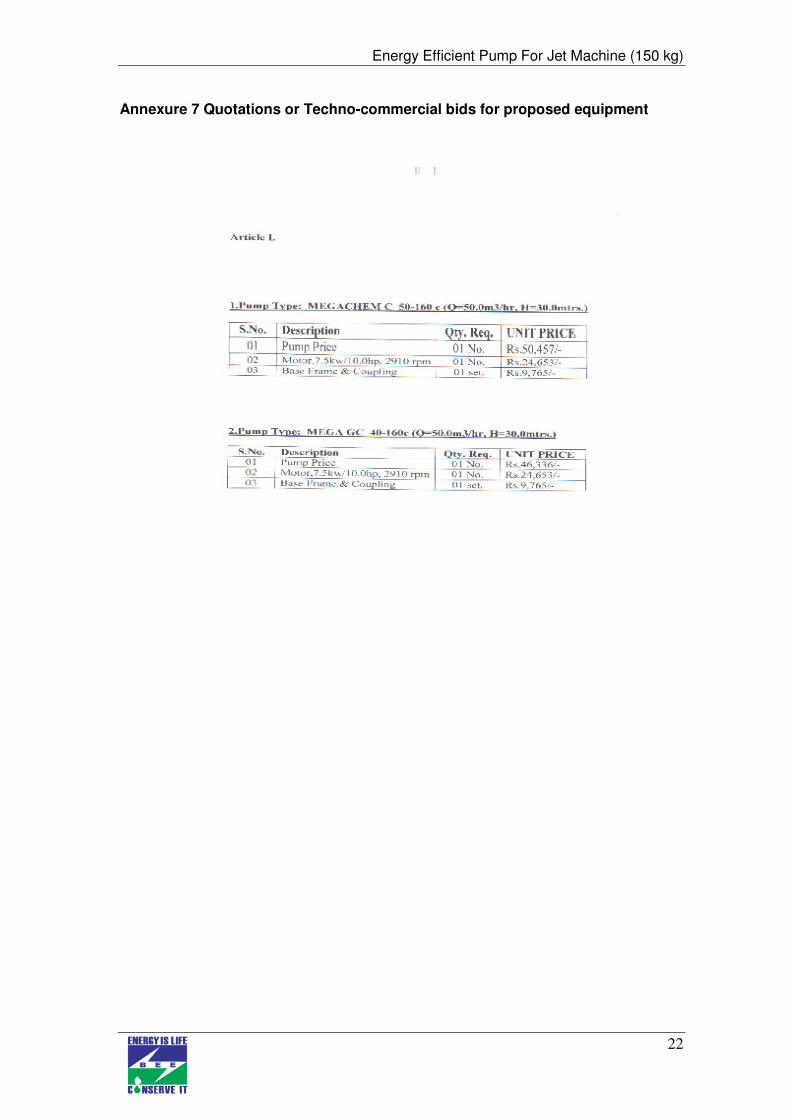
2.1.2 Equipment specifications
The detailed specification of the pump suggested is furnished in the Annexure 7.
2.1.3 Replacement of pump with existing pump
The efficiency of the present pumps installed is of low efficiency (40 to 60%) and
efficiency of the energy efficient pumps will be of 65%. Replacing the conventional
pumps with new energy efficient pumps will reduce power consumption and reduces
production cost.
The pump selected will have same flow and pressure and can be installed to the
present Jet machine.
2.1.4 Superiority over existing equipment
The new energy efficient pumps are superior to the existing pumps for the following
features:
• Will have constant flow and pressure throughout the life of the pump
• Lower break downs due to special mechanical sealing
• Low operation and maintenance cost
• Life of the equipment is multifold than the present pumps

Energy Efficient Pump For Jet Machine (150 kg)
7
2.1.5 Availability of the proposed equipment
The new energy efficient pump make dealers are available in Surat and the details of
the suppliers are provided in Annexure 6.
2.1.6 Source of equipment for the project
This technology is locally available
2.1.7 Service/technology providers
The service providers are locally available and contact details of service providers are
given in Annexure 6.
2.1.8 Terms and condition in sales of equipment.
The terms of sales of the equipment supplier are:
2.1.9 Process down time during implementation
The process down time is considered only one day, as it requires only assembling
2.2 Life cycle assessment and risks analysis
The operational life of the new energy efficient pumps is considered to be 15 years.
2.3 Suitable unit for implementation of proposed equipment
The proposed pump will give the same output w.r.t existing pumps and suitable for Jet
machine having 150 kg capacity.
Energy Efficient Pump For Jet Machine (150 kg)
8
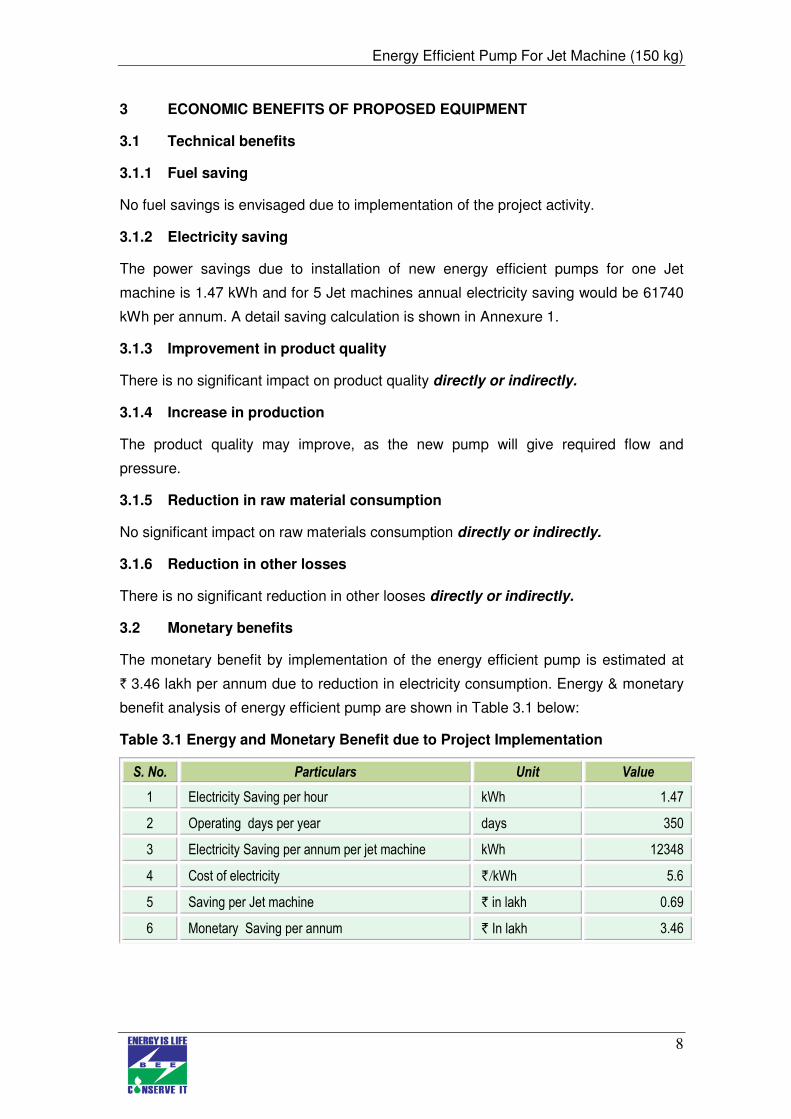
3 ECONOMIC BENEFITS OF PROPOSED EQUIPMENT
3.1 Technical benefits
3.1.1 Fuel saving
No fuel savings is envisaged due to implementation of the project activity.
3.1.2 Electricity saving
The power savings due to installation of new energy efficient pumps for one Jet
machine is 1.47 kWh and for 5 Jet machines annual electricity saving would be 61740
kWh per annum. A detail saving calculation is shown in Annexure 1.
3.1.3 Improvement in product quality
There is no significant impact on product quality directly or indirectly.
3.1.4 Increase in production
The product quality may improve, as the new pump will give required flow and
pressure.
3.1.5 Reduction in raw material consumption
No significant impact on raw materials consumption directly or indirectly.
3.1.6 Reduction in other losses
There is no significant reduction in other looses directly or indirectly.
3.2 Monetary benefits
The monetary benefit by implementation of the energy efficient pump is estimated at
` 3.46 lakh per annum due to reduction in electricity consumption. Energy & monetary
benefit analysis of energy efficient pump are shown in Table 3.1 below:
Table 3.1 Energy and Monetary Benefit due to Project Implementation
S. No. Particulars Unit Value
1 Electricity Saving per hour kWh 1.47
2 Operating days per year days 350
3 Electricity Saving per annum per jet machine kWh 12348
4 Cost of electricity `/kWh 5.6
5 Saving per Jet machine ` in lakh 0.69
6 Monetary Saving per annum ` In lakh 3.46

Energy Efficient Pump For Jet Machine (150 kg)
9
3.3 Social benefits
3.3.1 Improvement in working environment in the plant
The project activity identified will utilize state-of-the-art technologies to ensure energy
efficiency and energy conservation of non renewable fuels and the project activity
reduce the breakdowns and leakages hence improves working environment
3.3.2 Improvement in skill set of workers
The equipment selected for the implementation is new and energy efficient. The
equipment implemented will create awareness among the workforce and improves the
skill of the workers.
3.4 Environmental benefits
3.4.1 Reduction in effluent generation
The project activity will reduce effluent generation, as with new pumps, the leakages
may reduce.
3.4.2 Reduction in GHG emission
The major GHG emission reduction source is CO2. The technology will reduce grid
electricity consumption and emission reductions are estimated at 52 tonne of CO2 per
annum due to implementation of the project activity.
3.4.3 Reduction in other emissions like SOx
The equipment reduces the coal consumption and also reduces SOx emissions.

Energy Efficient Pump For Jet Machine (150 kg)
10
4 IMPLEMENTATION OF PROPOSED EQUIPMENT
4.1 Cost of equipment implementation
4.1.1 Cost of equipment
The total cost for 5 pumps is estimated at ` 4.15 lakh (` 4.04 lakh+0.11 lakh), which
includes motor, pump and base coupling.
4.1.2 Other costs
The total cost of implementation of the energy efficient pump is estimated at ` 4.40
lakh. The above cost includes cost of equipment / machinery, cost of fabrication
(and/or) commissioning charges and the details are furnished below:
Table 4.1 Details of Proposed Equipment Installation Cost
S. No Particulars Unit Cost
1 Equipment Cost ` (In Lakh) 4.15
2 Panel, switch & cabling, Elec.modi etc ` (In Lakh) 0.25
3 Interest during Implementation ` (In Lakh) 0.00
4 Total Cost ` (In Lakh) 4.40
4.2 Arrangement of funds
4.2.1 Entrepreneur’s contribution
The entrepreneur’s contribution is 25% of total project cost, which works out at ` 1.10
lakh.
4.2.2 Loan amount
The term loan is 70% of the total project, which is `3.30 lakh.
4.2.3 Terms & conditions of loan
The interest rate is considered at 10% which is SIDBI’s rate of interest for energy
efficient projects. The loan tenure is 5 years excluding initial moratorium period is 6
months from the date of first disbursement of loan.
4.3 Financial indicators
4.3.1 Cash flow analysis
Considering the above discussed assumptions, the net cash accruals starting with `
2.74 lakh in the first year operation gradually increases to ` 14.38 lakh at the end of
eighth year.

Energy Efficient Pump For Jet Machine (150 kg)
11
4.3.2 Simple payback period
The total project cost of the proposed technology is ` 4.40 lakh and monetary savings
due to reduction in electricity consumption is ` 3.46 lakh and the simple payback
period works out to be 16 months.
4.3.3 Net Present Value (NPV)
The Net present value of the investment at 10.00% interest rate works out to be ` 8.47
lakh.
4.3.4 Internal rate of return (IRR)
The after tax Internal Rate of Return of the project works out to be 59.54%. Thus the
project is financially viable.
4.3.5 Return on investment (ROI)
The average return on investment of the project activity works out at 27.74% for an
investment of ` 4.40 lakh. The average debt service coverage ratio works out at 3.71.
4.4 Sensitivity analysis in realistic, pessimistic and optimistic scenarios
A sensitivity analysis has been worked out to ascertain how the project financials
would behave in different situations like there is an increase in electricity savings or
decrease in electricity savings. For the purpose of sensitive analysis, two scenarios are
considered are.
• Increase in electricity savings by 5%
• Decrease in electricity savings by 5%
In each scenario, other inputs are assumed as constant. The financial indicators in
each of the above situation are indicated along with standard indicators are shown in
Table 4.2 below:
Table 4.2 Sensitivity analysis at different scenarios
Particulars IRR NPV ROI DSCR
Normal 59.54 8.47 27.74 3.71
5% decrease in electricity savings 55.90 7.81 27.60 3.52
5% increase in electricity savings 63.17 9.13 27.87 3.90

Energy Efficient Pump For Jet Machine (150 kg)
12
The project is highly sensitive to electricity savings, the debt service coverage ratio
works out to be 3.52 times in worst scenario, which indicates the strength of the
project.
4.5 Procurement and implementation schedule
The project is expected to be completed in 1 week from the date of financial closure.
The detailed schedule of project implementation is furnished in Annexure 6.

Energy Efficient Pump For Jet Machine (150 kg)
13
Annexure
Annexure 1 Baseline establishment and energy saving
S No Parameter Units Details
1 Present electricity consumption @ 51 % efficiency kWh 6.8
2 Electricity consumption in new pump @ 65 % efficiency kWh 5.33
3 Electricity Saving per hour per jet machine kWh 1.47
4 Operating hours per day hr 24
5 Operating days per year days 350
6 Electricity Saving per annum per jet machine kWh 12348
7 Cost of electricity `/kWh 5.6
8 Saving per jet machine `/ Jet machine 0.69
9 Monetary Saving per annum (5 jet Machine) ` In lakh 3.46
10 Total investment ` In lakh 4.40
11 Payback period Years 1.27

Energy Efficient Pump For Jet Machine (150 kg)
14
Annexure 2 Process flow diagram
Energy Efficient Pump For Jet Machine (150 kg)
15
Annexure 3 Technology Assessment Report – Energy Efficient Pump
The jet machines are the most commonly found equipment in the cluster units and
considerable quantities of hot water or colour water is required for the dyeing process
and this water is supplied by the water pump which consumes lot of electricity. This
study was carried out in 75 industries, and all the units are using conventional pump for
supply of water with high electricity consumption.
The Installation of energy efficient pump will reduce the electricity consumption and
also reduces the green house gas emission.
Basis for Selection of Equipment
The various factors influence the selection of the energy efficient pump. The following
were considered:
- Efficiency and electricity consumption of conventional water pump.
- Space availability
- Cost economics

Energy Efficient Pump For Jet Machine (150 kg)
16
Annexure 4 Detailed financial calculations & analysis
Assumption
Name of the Technology Jet Machine Pumps
Rated Capacity 150 Kg
Flow and head 50 cum/hr and 30 m H
No. of pumps to be replaced 5
Details Unit Value Basis
No of working days Days 350
Proposed Investment
Plant & Machinery ` (in lakh) 4.15
Erection & Commissioning ` (in lakh) 0.25
Total Investment ` (in lakh) 4.40
Financing pattern
Own Funds (Equity) ` (in lakh) 1.10 Feasibility Study
Loan Funds (Term Loan) ` (in lakh) 3.30 Feasibility Study
Loan Tenure years 5 Assumed
Moratorium Period Months 6 Assumed
Repayment Period Months 66 Assumed
Interest Rate % 10.00 SIDBI Lending rate
Estimation of Costs
O & M Costs % on Plant & Equip 4.00 Feasibility Study
Annual Escalation % 5.00 Feasibility Study
Estimation of Revenue
Power Saving kWh 61740
Cost `/ KWh 5.6
St. line Depn. %age 5.28 Indian Companies Act
IT Depreciation %age 80.00 Income Tax Rules
Income Tax %age 33.99 Income Tax
Estimation of Interest on Term Loan (`̀̀̀ in lakh)
Years Opening Balance Repayment Closing Balance Interest
1 3.30 0.24 3.06 0.30 2 3.06 0.48 2.58 0.28
3 2.58 0.56 2.02 0.24
4 2.02 0.68 1.34 0.18
5 1.34 0.86 0.48 0.10
6 0.48 0.48 0.00 0.01
3.30
WDV Depreciation
Particulars / years 1 2
Plant and Machinery
Cost 4.40 0.88
Depreciation 3.52 0.70
WDV 0.88 0.18

Energy Efficient Pump For Jet Machine (150 kg)
17
Projected Profitability
Particulars / Years 1 2 3 4 5 6 7 8
Revenue through Savings
Power savings 3.46 3.46 3.46 3.46 3.46 3.46 3.46 3.46
Total Revenue (A) 3.46 3.46 3.46 3.46 3.46 3.46 3.46 3.46
Expenses
O & M Expenses 0.18 0.18 0.19 0.20 0.21 0.22 0.24 0.25
Total Expenses (B) 0.18 0.18 0.19 0.20 0.21 0.22 0.24 0.25
PBDIT (A)-(B) 3.28 3.27 3.26 3.25 3.24 3.23 3.22 3.21
Interest 0.30 0.28 0.24 0.18 0.10 - - -
PBDT 2.98 2.99 3.03 3.08 3.14 3.23 3.22 3.21
Depreciation 0.23 0.23 0.23 0.23 0.23 0.23 0.23 0.23
PBT 2.75 2.76 2.79 2.85 2.91 3.00 2.99 2.98
Income tax - 0.78 1.03 1.05 1.07 1.10 1.10 1.09
Profit after tax (PAT) 2.75 1.98 1.77 1.80 1.84 1.90 1.89 1.89
Computation of Tax `̀̀̀ (in lakh)
Particulars / Years 1 2 3 4 5 6 7 8
Profit before tax 2.75 2.76 2.79 2.85 2.91 3.00 2.99 2.98
Add: Book depreciation 0.23 0.23 0.23 0.23 0.23 0.23 0.23 0.23
Less: WDV depreciation 3.52 0.70 - - - - - -
Taxable profit (0.54) 2.28 3.03 3.08 3.14 3.23 3.22 3.21
Income Tax - 0.78 1.03 1.05 1.07 1.10 1.10 1.09
Projected Balance Sheet
`̀̀̀ (in lakh)
Particulars / Years 1 2 3 4 5 6 7 8
Liabilities
Share Capital (D) 1.10 1.10 1.10 1.10 1.10 1.10 1.10 1.10
Reserves & Surplus (E) 2.75 4.73 6.50 8.30 10.14 12.04 13.93 15.82
Term Loans (F) 3.06 2.58 2.02 1.34 0.48 0.00 0.00 0.00
Total Liabilities D)+(E)+(F) 6.91 8.41 9.62 10.74 11.72 13.14 15.03 16.92
Assets
Gross Fixed Assets 4.40 4.40 4.40 4.40 4.40 4.40 4.40 4.40
Less: Accm. Depreciation 0.23 0.46 0.70 0.93 1.16 1.39 1.63 1.86
Net Fixed Assets 4.17 3.94 3.70 3.47 3.24 3.01 2.77 2.54
Cash & Bank Balance 2.74 4.48 5.91 7.26 8.48 10.13 12.26 14.38
Total Assets 6.91 8.41 9.62 10.74 11.72 13.14 15.03 16.92
Net Worth 3.85 5.83 7.60 9.40 11.24 13.14 15.03 16.92
Dept equity ratio 2.78 2.35 1.84 1.22 0.44 0.00 0.00 0.00

Energy Efficient Pump For Jet Machine (150 kg)
18
Projected Cash Flow: ` ` ` ` (in lakh)
Particulars / Years 0 1 2 3 4 5 6 7 8
Sources
Share Capital 1.10 - - - - - - - -
Term Loan 3.30
Profit After tax 2.75 1.98 1.77 1.80 1.84 1.90 1.89 1.89
Depreciation 0.23 0.23 0.23 0.23 0.23 0.23 0.23 0.23
Total Sources 4.40 2.98 2.21 2.00 2.03 2.08 2.13 2.13 2.12
Application
Capital Expenditure 4.40
Repayment of Loan - 0.24 0.48 0.56 0.68 0.86 0.48 - -
Total Application 4.40 0.24 0.48 0.56 0.68 0.86 0.48 - -
Net Surplus - 2.74 1.73 1.44 1.35 1.22 1.65 2.13 2.12
Add: Opening Balance - - 2.74 4.48 5.91 7.26 8.48 10.13 12.26
Closing Balance - 2.74 4.48 5.91 7.26 8.48 10.13 12.26 14.38
Calculation of Internal Rate of Return
` ` ` ` (in lakh) Particulars / months 0 1 2 3 4 5 6 7 8
Profit after Tax 2.75 1.98 1.77 1.80 1.84 1.90 1.89 1.89
Depreciation 0.23 0.23 0.23 0.23 0.23 0.23 0.23 0.23
Interest on Term Loan 0.30 0.28 0.24 0.18 0.10 - - -
Cash outflow - - - - -
Net Cash flow (4.40) - - - - - - - -
IRR 59.54%
NPV 8.47
Break Even Point ` ` ` ` (in lakh)
Particulars / Years 1 2 3 4 5 6 7 8
Variable Expenses
Oper. & Maintenance Exp (75%)
0.13 0.14 0.15 0.15 0.16 0.17 0.18 0.19
Sub Total (G) 0.13 0.14 0.15 0.15 0.16 0.17 0.18 0.19
Fixed Expenses
Oper. & Maintenance Exp 0.04 0.05 0.05 0.05 0.05 0.06 0.06 0.06 Interest on Term Loan 0.30 0.28 0.24 0.18 0.10 0.00 0.00 0.00
Depreciation (H) 0.23 0.23 0.23 0.23 0.23 0.23 0.23 0.23 Sub Total (I) 0.57 0.56 0.52 0.46 0.39 0.29 0.29 0.29
Sales (J) 3.46 3.46 3.46 3.46 3.46 3.46 3.46 3.46
Contribution (K) 3.33 3.32 3.31 3.30 3.30 3.29 3.28 3.27
Break Even Point (L= G/I) 17.27%
16.95%
15.65%
13.88%
11.68%
8.77%
8.88%
8.99%
Cash Break Even {(I)-(H)} 10.28% 9.95% 8.63% 6.85% 4.64%
1.71%
1.80%
1.89%
Break Even Sales (J)*(L) 0.60 0.59 0.54 0.48 0.40 0.30 0.31 0.31
Energy Efficient Pump For Jet Machine (150 kg)
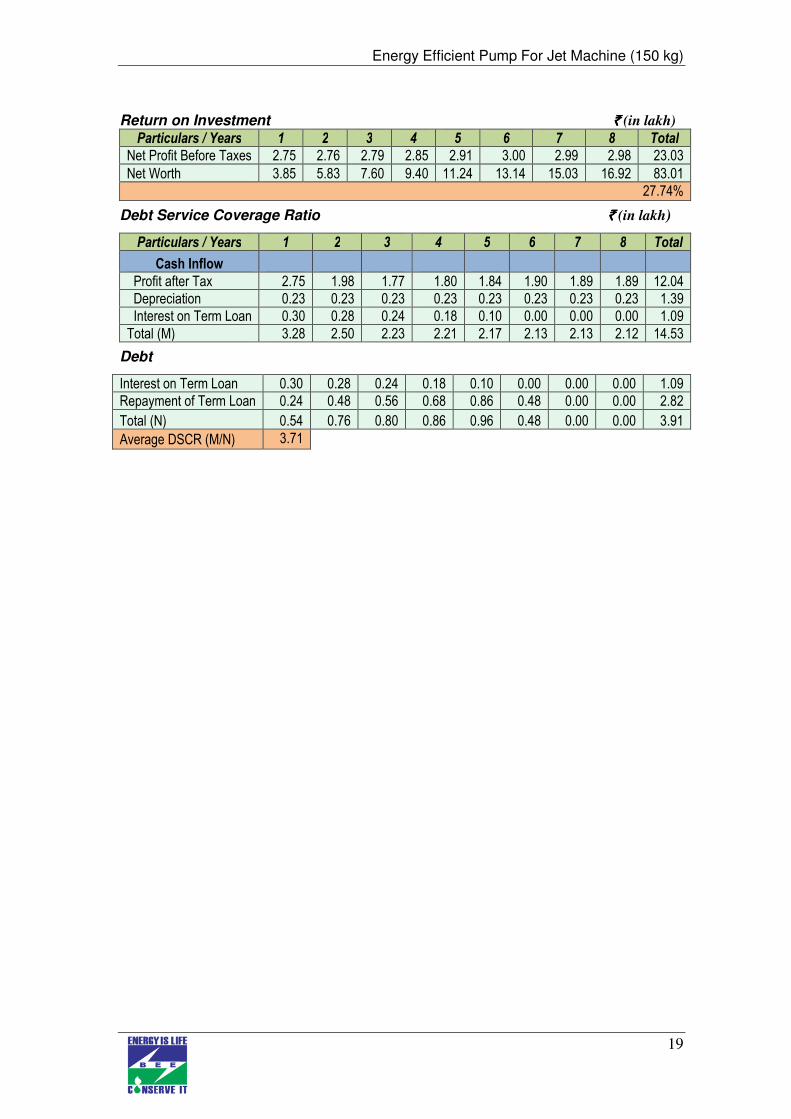
19
Return on Investment ` ` ` ` (in lakh)
Particulars / Years 1 2 3 4 5 6 7 8 Total
Net Profit Before Taxes 2.75 2.76 2.79 2.85 2.91 3.00 2.99 2.98 23.03
Net Worth 3.85 5.83 7.60 9.40 11.24 13.14 15.03 16.92 83.01
27.74%
Debt Service Coverage Ratio `̀̀̀ (in lakh)
Particulars / Years 1 2 3 4 5 6 7 8 Total
Cash Inflow
Profit after Tax 2.75 1.98 1.77 1.80 1.84 1.90 1.89 1.89 12.04
Depreciation 0.23 0.23 0.23 0.23 0.23 0.23 0.23 0.23 1.39
Interest on Term Loan 0.30 0.28 0.24 0.18 0.10 0.00 0.00 0.00 1.09
Total (M) 3.28 2.50 2.23 2.21 2.17 2.13 2.13 2.12 14.53
Debt
Interest on Term Loan 0.30 0.28 0.24 0.18 0.10 0.00 0.00 0.00 1.09
Repayment of Term Loan 0.24 0.48 0.56 0.68 0.86 0.48 0.00 0.00 2.82
Total (N) 0.54 0.76 0.80 0.86 0.96 0.48 0.00 0.00 3.91
Average DSCR (M/N) 3.71
Energy Efficient Pump For Jet Machine (150 kg)
20
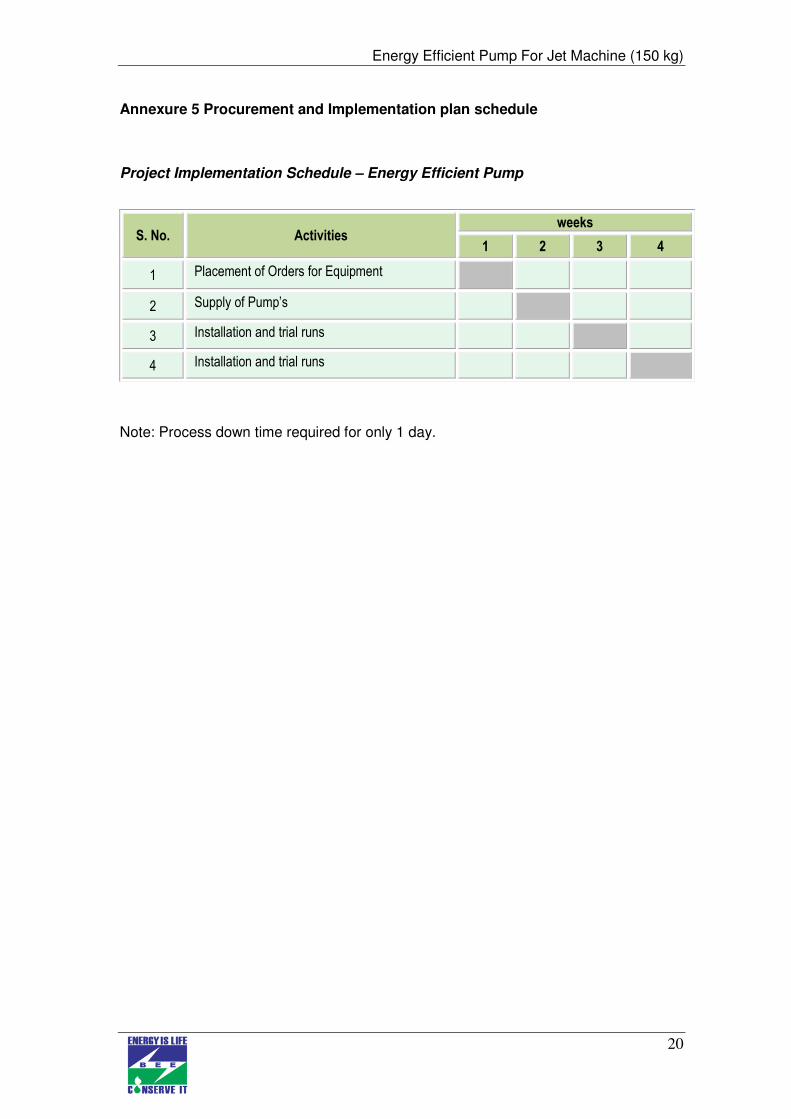
Annexure 5 Procurement and Implementation plan schedule
Project Implementation Schedule – Energy Efficient Pump
S. No. Activities weeks
1 2 3 4
1 Placement of Orders for Equipment
2 Supply of Pump’s
3 Installation and trial runs
4 Installation and trial runs
Note: Process down time required for only 1 day.

Energy Efficient Pump For Jet Machine (150 kg)
21
Annexure 6 Details of equipment and service providers
Equipment details Source of technology Service/technology providers
Energy Efficient Pumps
Deraz Engineers 6-3-1177/90, Deraz house, BS Maktha, Begumpet India-500016 E-mail: [email protected] Mobile:+91 9948353601 Telefax:+040 23412165
Energy Efficient Pump For Jet Machine (150 kg)
22
Annexure 7 Quotations or Techno-commercial bids for proposed equipment

Energy Efficient Pump For Jet Machine (150 kg)
23

Energy Efficient Pump For Jet Machine (150 kg)
24

Bureau of Energy Efficiency (BEE) (Ministry of Power, Government of India) 4th Floor, Sewa Bhawan, R. K. Puram, New Delhi – 110066 Ph.: +91 – 11 – 26179699 (5 Lines), Fax: +91 – 11 – 26178352
Websites: www.bee-india.nic.in, www.energymanagertraining.com
Zenith Energy Services Pvt. Ltd 10-5-6/B, My Home Plaza, Masab Tank HYDERABAD, AP 500 028 Phone: 040 23376630, 31, Fax No.040 23322517
Website: www.zenithenergy.com
India SME Technology Services Ltd DFC Building, Plot No.37-38, D-Block, Pankha Road, Institutional Area, Janakpuri, New Delhi-110058 Tel: +91-11-28525534, Fax: +91-11-28525535 Website: www.techsmall.com