designing integrated education model for heis in india: an
TRANSCRIPT

Designing integrated education model for HEIs in India: An action outcome study of UoH
E-Learning Centre University of Hyderabad
2018

Page: 1
University of Hyderabad (UoH) was established by an Act of Parliament in 1974. It is largely devoted to postgraduate and research programmes. The university offers Uni-disciplinary and Inter-disciplinary programmes across various fields’ knowledge such as Humanities, Social Sciences and Sciences. It offers post-graduate diplomas and short-term courses by distance mode. Authors: Prof. Jandhyala Prabhakar Rao Prof. Siva Prasad Rambhatla Prof. Vasuki Belavadi This publication is a part of a joint Project “Designing integrated education model for HEIs in India: an action-outcome study of UoH” of University of Hyderabad and Commonwealth Educational Media Centre for Asia, New Delhi.
Copyright © E-Learning Centre, University of Hyderabad, 2018.
The publication entitled Student Support Services and Employability in the University of Hyderabad: A Baseline Study is made available under a Creative Commons Attribution-Share Alike 4.0 License (international): http://creativecommons.org/licenses/by-sa/4.0/. Acknowledgement: The project is supported by the Commonwealth Educational Media Centre for Asia (CEMCA), New Delhi. The Commonwealth Educational Media Centre for Asia (CEMCA) is an international organization established by the Commonwealth of Learning (COL), Vancouver, Canada, to promote the meaningful, relevant and appropriate use of ICTs to serve the educational and training needs of Commonwealth member states of Asia. CEMCA receives diplomatic privileges and immunities in India under section 3 of the United Nations (privileges and immunities) Act, 1947. For further information, contact: Director, E-Learning Centre, University of Hyderabad, Telangana, India [email protected] Printed and published by: E-Learning Centre, University of Hyderabad www.elcuoh.in

Page: 2
Objectives: 1. To enhance capacity of academic & non-academic, educational
leaders for the development of course materials and its delivery for the teaching-learning.
2. To develop strategies for sustainability and employability of learners. 3. To increase access to learning for marginalised youths and women. 4. To develop innovative quality mechanisms to measure learning
materials, teaching-learning process and learning outcomes.
Project Team Prof. J. Prabhakar Rao, Project Director
Director, e-Learning Centre University of Hyderabad, India
Prof. Vasuki Belavadi, Member
Deputy-Director, e-Learning Centre University of Hyderabad, India
Prof. R. Siva Prasad, Member
Honorary Professor e-Learning Centre
University of Hyderabad, India
Dr. Manas Panigrahi, Member Programme Officer, Education
CEMCA, New Delhi, India Project Supported by:
Commonwealth Educational Media Centre for Asia (CEMCA)
7/8, Sarvapriya Vihar, New Delhi, India www.cemca.org.in
CEMCA-UoH Project: Designing integrated education model for HEIs in
India: an action-outcome study of UoH

Page: 3
Acknowledgements The E-Learning Centre, University of Hyderabad would like to acknowledge CEMCA, New Delhi for its support in carrying out this study. Students, faculty members and administrators of University of Hyderabad actively participated in the study conducted over a period of four months. We would like to place on record our thanks to all of them. Dr. Manas Panagrahi, Programme Officer, Education, CEMCA, New Delhi deserves a special mention in this report for guiding us throughout the study. The E-Learning Centre would also like to acknowledge the hard work put in by Mr. Saicharan, Research Assistant, in obtaining responses from across the university campus, for the study.

Page: 4
Table of Contents
Sl. No Section Page
1 Summary 7
2 Introduction 8
3 Methodology 8
4 Students’ Feedback 10
5 Teachers’ Feedback 37
6 Administrators’ Feedback 55
7 Major Findings: Students 55
8 Major Findings: Teachers 56
9 Major Findings: Administrators 57
10 Conclusions 57
Page: 5
List of Tables
Sl. No Table Page
1 Respondents’ reasons for pursuing higher education 13
2 Respondents’ sources of information 18

Page: 6
List of Diagrams
Sl. No. Diagram Page STUDENT RESPONDENTS 1 Respondents by gender 11 2 Respondents by age 11 3 Academic/ Disciplinary background of respondents 12 4 Respondents by research awards 12 5 Respondents reasons for pursuing higher education,
5.1—5.7 13
6 The Admission process, 6.0-6.1 16
7 Rating the academic programmes, 7.0 17 8 Sources of information/ updates, 8.0-8.7 18 9 Access to computer, internet and students capability,
9.0 22
10 Student regularity & follow up of academics, 10 23 11 Students’ rating of teachers, infrastructure & staff,
11.0-11.4 24
12 Feedback of students on teachers & teaching, 12.0-12.3
26
13 Students’ views on courses taught, 13.0-13.8 28 14 Course requirements, 14.0 32 15 Teaching-Learning process, 15.0 32 16 Attitude of students towards E/M-Learning, 16.0-
16.9 33
TEACHER RESPONDENTS 1 Age & gender profile, 1.0 & 2.0 32 2 Professional profile, 3.0-5.0 38 3 About the university, 6.0-7.1 40 4 Availability & use of technology, 8.0-8.3 41 5 Teaching of courses, 9.0-9.17 43 6 Teachers’ attitude towards E/M-Learning, 10.0-10.9 50

Page: 7
Summary
The E-Learning Centre of University of Hyderabad, took up this project with support from CEMCA with an aim to enhance capacity of academic & non-academic, educational leaders for the development of course materials and its delivery for the teaching-learning. The two other significant objectives are to develop strategies for sustainability and employability of learners even while increasing access to learning for marginalized youth and women. In order to achieve these objectives, the university conducted an online survey among students and administrators, the results of which are presented in this report. While the survey threw up encouraging results, it also provided pointers to areas of improvement. The administrators have committed to improve on some indicators. During the project period emphasis will be on developing innovative quality mechanisms and student support systems that will also help measure the teaching-learning process and learning outcomes. The university will also develop a number of innovative online courses that will add value to the students’ education on the campus.

Page: 8
Introduction: The baseline study of the University was conducted, both online and offline, at the level of administrators (Vice Chancellor, Finance Officer, Controller of Examinations, Deans and Heads of the Departments or Centres), teachers and students as a part of project in partnership with CEMCA, Common Wealth of Learning (COL). Justification: This baseline survey will help to monitor the trajectory of progress of the University and test the working of the model being implemented in the university as part of UoH – CEMCA, COL project. Research Questions: 1. Whether students are satisfied with the process of admission and enrolment? 2. Are the students satisfied with the courses, content, its delivery, etc.? 3. What is the opinion of the students about student support services, including use of ICT? 4. Are the teachers well versed with the use of technology in their pedagogy? 5. Do the teachers update their knowledge and courses regularly? 6. How students use technology in learning and updating their knowledge and skills? 7. Do the University administration effectively implement e-governance? 8. How students are involved in decision making bodies of the University? Objectives: The project has the broader objectives as mentioned below: • To enhance capacity of academic and non-academic personnel, and
educational leaders, for the development of course materials and its delivery for augmenting the teaching-learning from the learner’s perspective.
• To develop strategies for sustainability and employability of learners. • To increase access to learning for marginalised youths and women. • To develop innovative quality mechanisms to measure learning materials,
teaching-learning process and learning outcomes. METHODOLOGY • Sample and Sampling
The target was to reach at least 5% of the universe of students and faculty. It was also attempted to cover as many of the administrators in the University as possible, specifically the VC, Pro-VCs, FO, CE, Registrar, the Deans and Heads of the Departments or Centres.
• Tools and Techniques Separate online questionnaires were designed for students, teachers and administrators, both online and offline. They were piloted before the instrument was finalised. These questionnaires were placed in the

Page: 9
Google Docs of the e-Learning website. The data thus obtained were analysed through Google Docs.
• Data Collection Procedure The questionnaire was placed in the e-Learning platform of the University website using the Google Docs. All the students and faculty of the University were contacted through emails. The administrators – Vice Chancellor, Pro-Vice Chancellors (1 & 2), Finance Officer, Controller of Examinations, Registrar, Deans of the Schools, and Heads of the Departments or Centres – were contacted through emails as well as individually.
ANALYSIS AND INTERPRETATIONS This report is organised into three broad sections: 1) Students; 2) Teachers; and 3) Administrators. In this section we analyse the responses of the students:
Page: 10
I
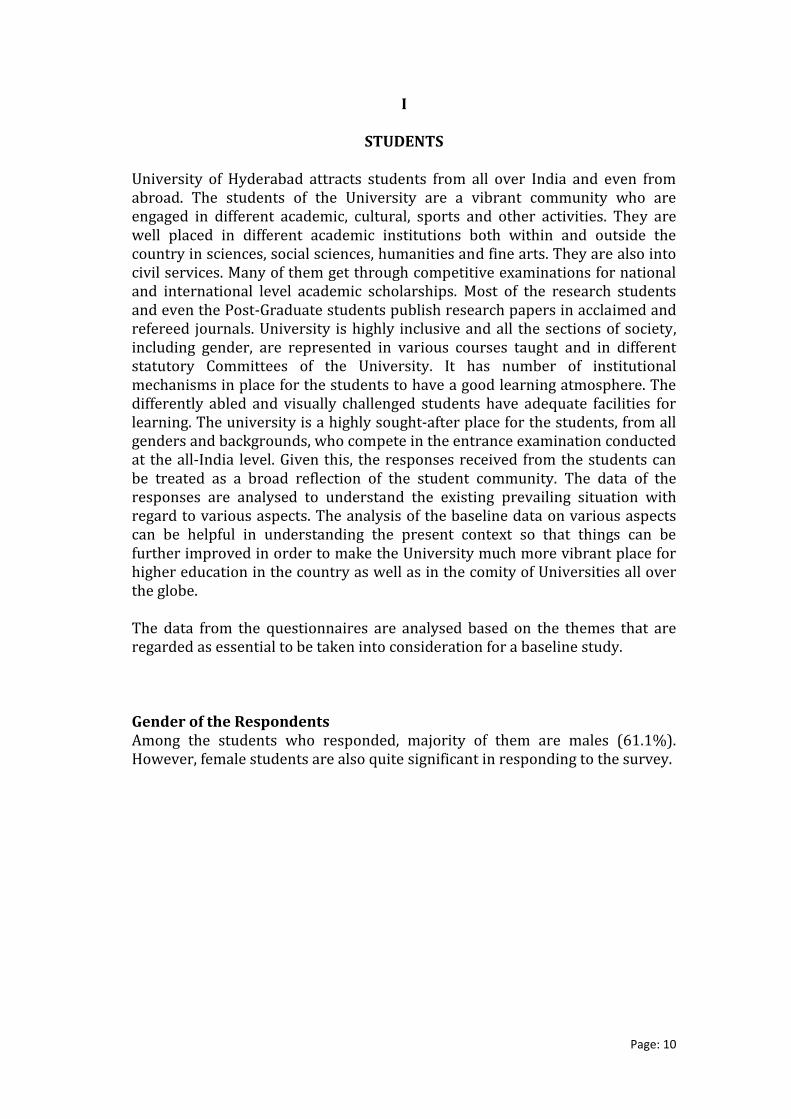
STUDENTS University of Hyderabad attracts students from all over India and even from abroad. The students of the University are a vibrant community who are engaged in different academic, cultural, sports and other activities. They are well placed in different academic institutions both within and outside the country in sciences, social sciences, humanities and fine arts. They are also into civil services. Many of them get through competitive examinations for national and international level academic scholarships. Most of the research students and even the Post-Graduate students publish research papers in acclaimed and refereed journals. University is highly inclusive and all the sections of society, including gender, are represented in various courses taught and in different statutory Committees of the University. It has number of institutional mechanisms in place for the students to have a good learning atmosphere. The differently abled and visually challenged students have adequate facilities for learning. The university is a highly sought-after place for the students, from all genders and backgrounds, who compete in the entrance examination conducted at the all-India level. Given this, the responses received from the students can be treated as a broad reflection of the student community. The data of the responses are analysed to understand the existing prevailing situation with regard to various aspects. The analysis of the baseline data on various aspects can be helpful in understanding the present context so that things can be further improved in order to make the University much more vibrant place for higher education in the country as well as in the comity of Universities all over the globe. The data from the questionnaires are analysed based on the themes that are regarded as essential to be taken into consideration for a baseline study. Gender of the Respondents Among the students who responded, majority of them are males (61.1%). However, female students are also quite significant in responding to the survey.
Page: 11
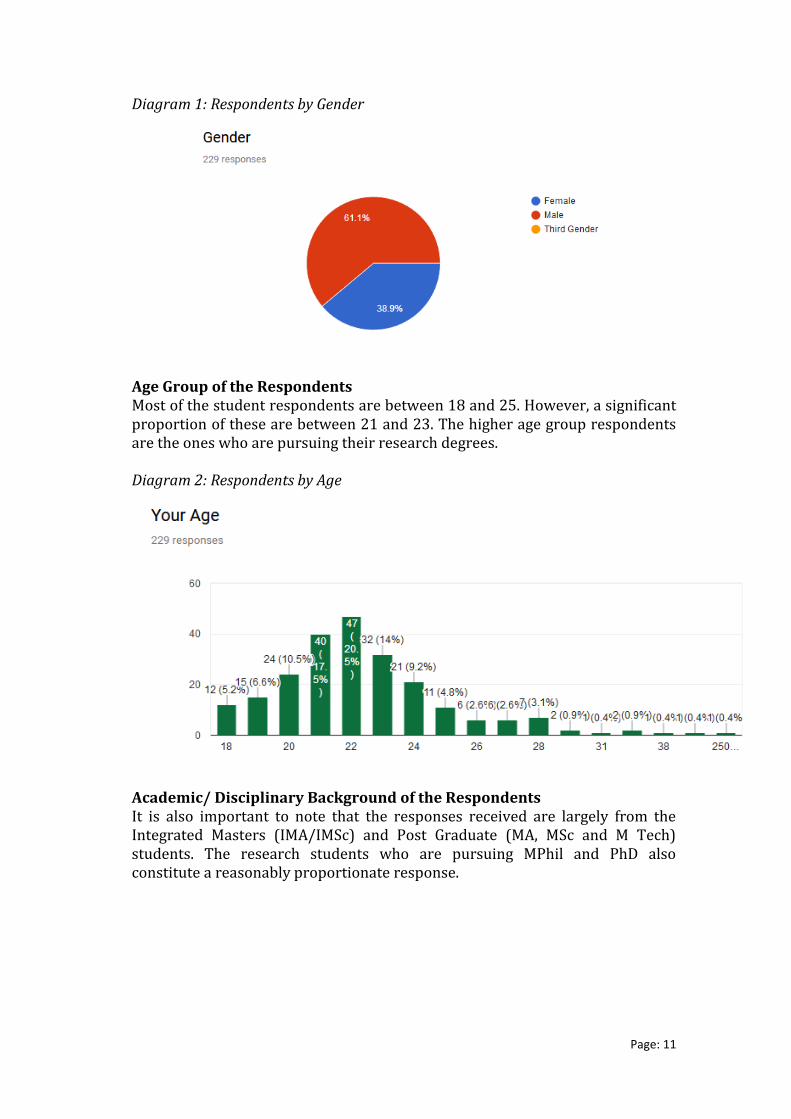
Diagram 1: Respondents by Gender
Age Group of the Respondents Most of the student respondents are between 18 and 25. However, a significant proportion of these are between 21 and 23. The higher age group respondents are the ones who are pursuing their research degrees. Diagram 2: Respondents by Age
Academic/ Disciplinary Background of the Respondents It is also important to note that the responses received are largely from the Integrated Masters (IMA/IMSc) and Post Graduate (MA, MSc and M Tech) students. The research students who are pursuing MPhil and PhD also constitute a reasonably proportionate response.

Page: 12
Diagram 3: Respondents’ Disciplinary Background
Respondents by Research Awards Among the students – Integrated Masters and Masters, and research, almost all of them receive some financial assistance to pursue their studies. Many of these fellowships / scholarships are from different public funding sources that are granted based on competition or on the basis of parental income or for students from underprivileged background. Diagram 4: Respondents with Diverse Research Awards
Among the research students, most of them receive fellowships from different sources of public funding. These vary across disciplines of knowledge. However, a few pursue their research without public funding.

Page: 13
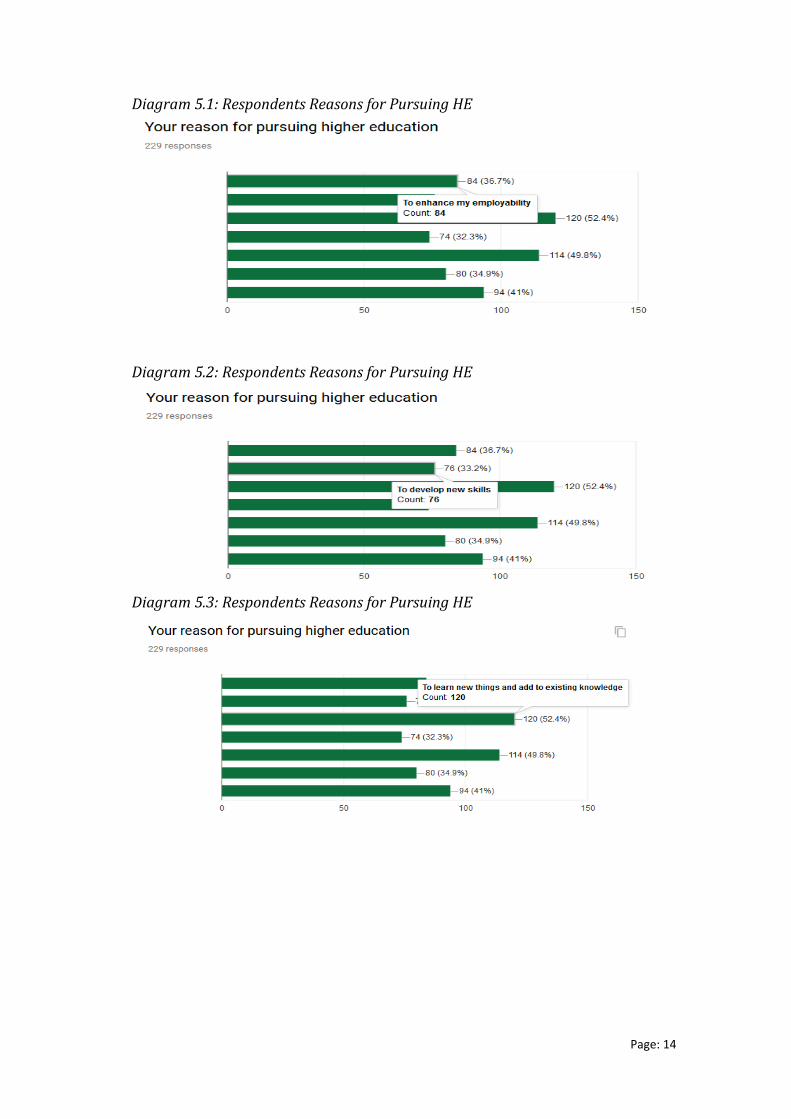
Reasons for Pursuing HE The reasons for pursuing higher education, obviously, varied across the spectrum of students. Some of them are multiple responses. However, most of them pursue their education to improve their skills and knowledge, to pursue a career, to become an expert in the field and also to enhance their employability. Table 1: Respondents Reasons for Pursuing Higher Education
Reason for pursuing HE Responses N=229
%
To enhance employability 84 36.7 To develop new skills 76 33.2 To learn new things and add to the existing knowledge
120 52.4
To increase learning potential 74 32.3 To pursue a career of interest that requires special skills
114 49.8
A sense of personal fulfilment 80 34.9 To become an expert in the concerned discipline 94 41.0
Diagram 5: Respondents Reasons for Pursuing HE
13%
12%
19%
11%
18%
12%
15%
Responses N=229
To enhance employability
To develop new skills
To learn new things and add tothe existing knowledge
To increase learning potential
To pursue a career of interestthat requires special skills
A sense of personal fulfilment
Page: 14
Diagram 5.1: Respondents Reasons for Pursuing HE
Diagram 5.2: Respondents Reasons for Pursuing HE
Diagram 5.3: Respondents Reasons for Pursuing HE

Page: 15
Diagram 5.4: Respondents Reasons for Pursuing HE
Diagram 5.5: Respondents Reasons for Pursuing HE
Diagram 5.6: Respondents Reasons for Pursuing HE

Page: 16
Diagram 5.7: Respondents Reasons for Pursuing HE
The Admission Process Majority of the students feel that their admission into the University was smooth. They largely agree that they received initial orientation and also got their registration number and library membership well within time. They have been informed about their rights and responsibilities also. In case of those who expressed their disagreement, though minor, there is a need to take note of the issues to improve the process further. Diagram 6: The Process of Admission

Page: 17
Diagram 6.1: The Process of Admission
Rating the Academic Programmes It is important to note that the students largely rated most of the academic programmes either as good or excellent. However, it is essential to analyse which of the academic programmes need to be improved and what are the specific aspects that need to be looked into in order to improve these programmes. Diagram 7: Rating of the Academic Programmes

Page: 18
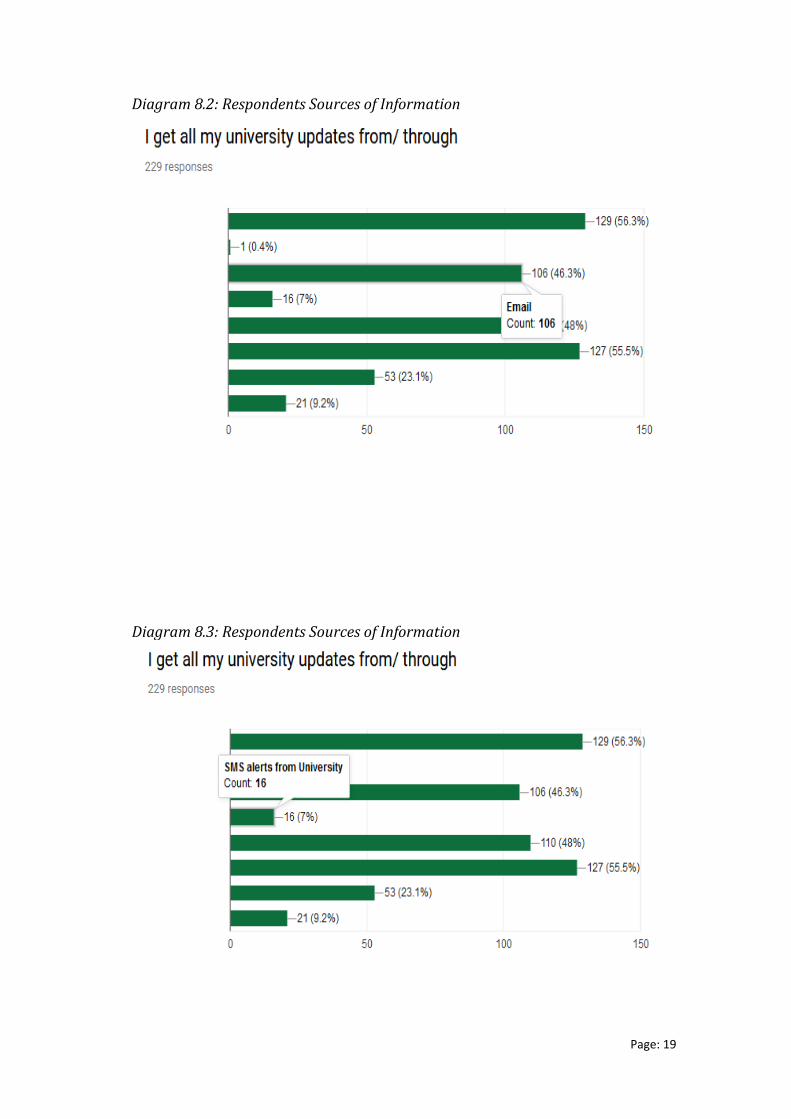
Sources of Information / University Updates Majority of the respondents receive updates through different media, such as University website, social media, email, notice board and department staff. In a sense, they frequently apprise themselves about the developments relating to their academic programme, and other important matters. Table 2: Respondents' Sources of Information
Source of Information Response N=229 % University Website 129 56.3 University Mobile App 1 0.4 Email 106 46.3 SMS alerts from the University 16 7.0 Social Media (Facebook, Twitter, WhatsApp, etc.
110 48.0
Notice Board 96 41.9 Department Staff 66 28.8 Others 19 8.3
Diagram 8: Respondents' Sources of Information
Diagram 8.1: Respondents Sources of Information
Page: 19
Diagram 8.2: Respondents Sources of Information
Diagram 8.3: Respondents Sources of Information

Page: 20
Diagram 8.4: Respondents Sources of Information
Diagram 8.5: Respondents Sources of Information

Page: 21
Diagram 8.6: Respondents Sources of Information
Diagram 8.7: Respondents Sources of Information

Page: 22
Access to Computer, Internet and capability of Respondents in using them Most of the respondents have regular access to computer and internet. Apart from that, they are quite aware of browsing, downloading and saving of the downloaded files. Quite a few of them are also capable of downloading and installing software and also in trouble shooting. They are equally conversant in using mobile devices. They also access learning materials through computers and mobiles. In other words, they are quite computer savvy. Diagram 9: Access to Computer, Mobile, Internet and Capability in using them
Page: 23
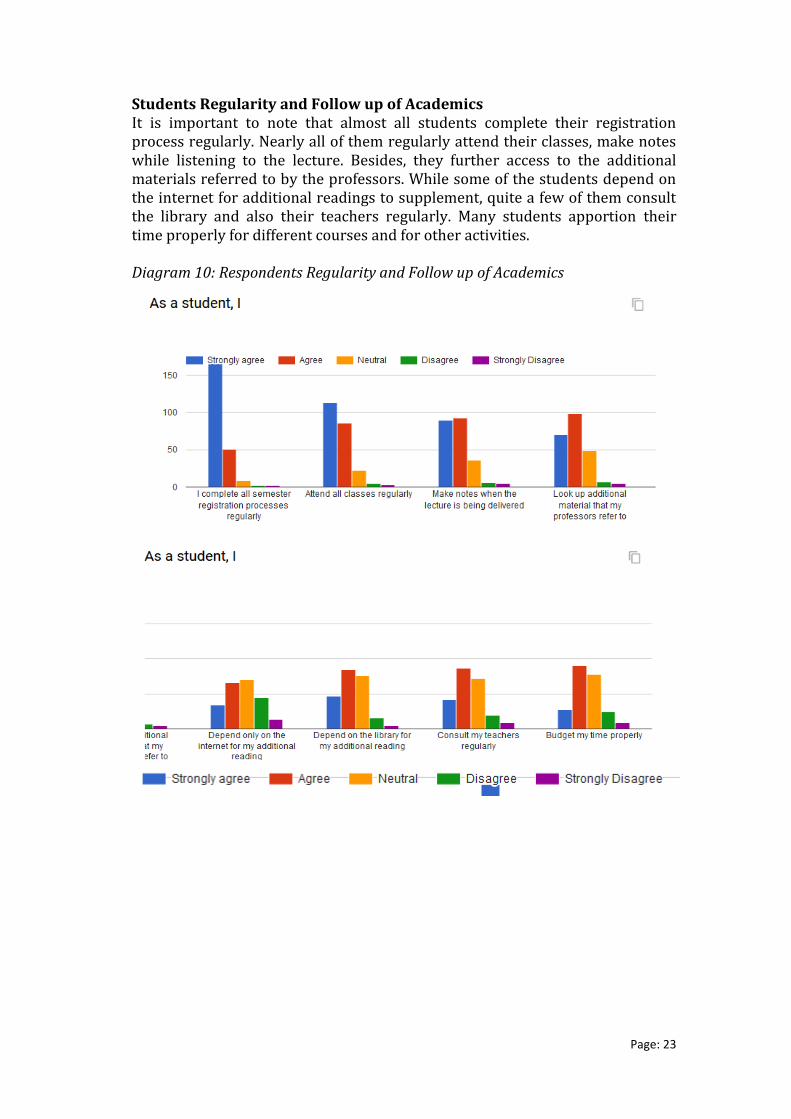
Students Regularity and Follow up of Academics It is important to note that almost all students complete their registration process regularly. Nearly all of them regularly attend their classes, make notes while listening to the lecture. Besides, they further access to the additional materials referred to by the professors. While some of the students depend on the internet for additional readings to supplement, quite a few of them consult the library and also their teachers regularly. Many students apportion their time properly for different courses and for other activities. Diagram 10: Respondents Regularity and Follow up of Academics

Page: 24
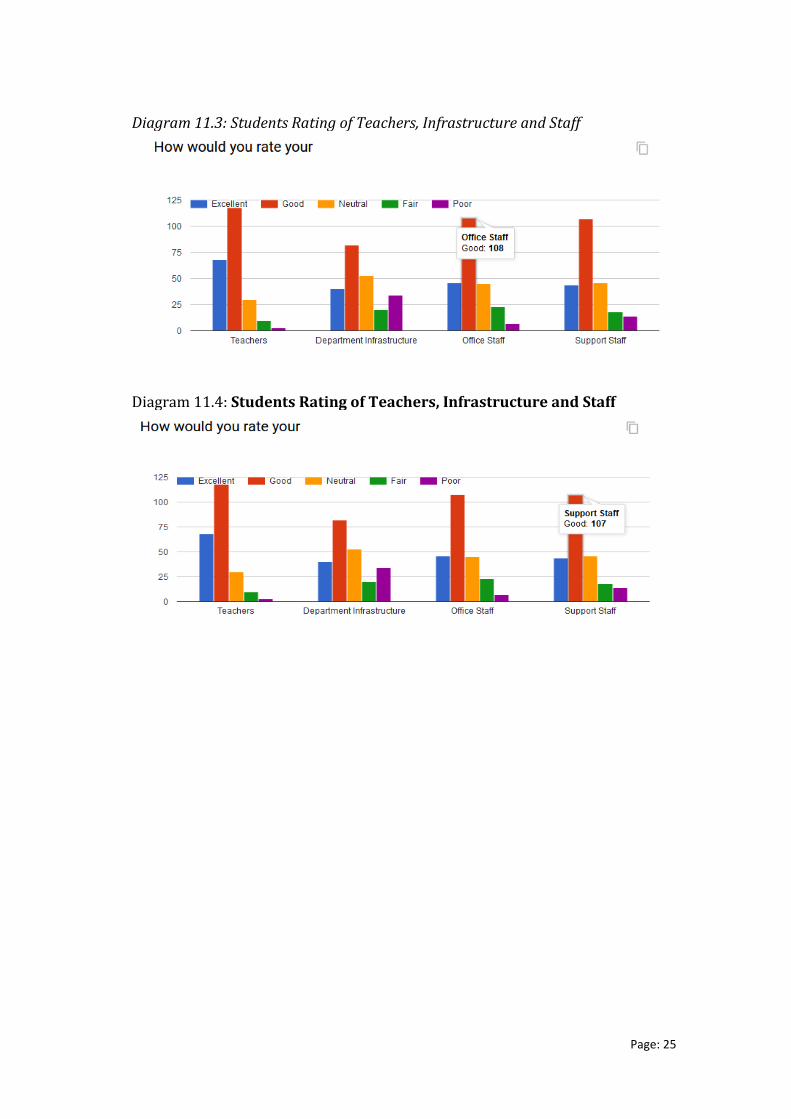
Students Rating of Teachers, Infrastructure and Staff By and large, the students rate their teachers as good and excellent. Their rating of office and supporting staff is also better. However, their rating of the department infrastructure reflects that there is a need to upgrade the infrastructure. Diagram 11: Students Rating of Teachers, Infrastructure and Staff
Diagram 11.1: Students Rating of Teachers, Infrastructure and Staff
Diagram 11.2: Students Rating of Teachers, Infrastructure and Staff
Page: 25
Diagram 11.3: Students Rating of Teachers, Infrastructure and Staff
Diagram 11.4: Students Rating of Teachers, Infrastructure and Staff

Page: 26
Feedback of Students on Teachers and Teaching Large majority of the students agreed that they receive the course content at the beginning of the course from their teachers and they are informed about the relevance of the course in today’s context. They also agreed that the course contents are upgraded regularly by the teachers and the teachers offer additional academic help by way of providing reference materials, etc. They also observed that the teachers use technology in their classroom teaching, adopt innovative approaches in teaching and try to make every class interesting. They also felt that the teachers encourage them to use technology; give them relevant and innovative assignments, provide them sufficient time to complete their assignments and also help them in completing the task. Despite this, the teachers are strict about their attendance. The teachers also spend additional time with slow learners. However, much more needs to be done in this regard to make them learn effectively. Diagram 12: Students Opinion on Teachers and Teaching
Diagram 12.1: Students Opinion on Teachers and Teaching

Page: 27
Diagram 12.2: Students Opinion on Teachers and Teaching
Diagram 12.3: Students Opinion on Teachers and Teaching

Page: 28
Students Views on Courses Taught Most students agree that their courses are highly subsidised. The courses are very relevant and they help them in achieving the learning outcomes. They also help them in building additional skills required in the field as the teachers are very interactive and engage them in undertaking additional research. They viewed that some of the courses require to interact with the wider society. Teachers also motivate them strongly to get into research and help them to face competitive exams with confidence. Diagram 13: Views on Courses Taught
Diagram 13.1: Views on Courses Taught

Page: 29
Diagram 13.2: Views on Courses Taught
Diagram 13.3: Views on Courses Taught
Diagram 13.4: Views on Courses Taught

Page: 30
Diagram 13.5: Views on Courses Taught
Diagram 13.6: Views on Courses Taught
Diagram 13.7: Views on Courses Taught

Page: 31
Diagram 13.8: Views on Courses Taught

Page: 32
Course Requirements While many of the courses do not require internship largely, there are some who informed that their courses require completion of internship. Diagram 14: Requirement of the Courses
Teaching-Learning Process The respondents largely agree that the teachers are competent to teach the assigned courses. The teachers provide enough explanation to make the students learn the concepts. The students felt that the teachers are cordial and sympathetic to them. Teachers answer the queries of the students during the course and they also provide feedback on the students' assignments. Diagram 15: Teaching-Learning Process

Page: 33
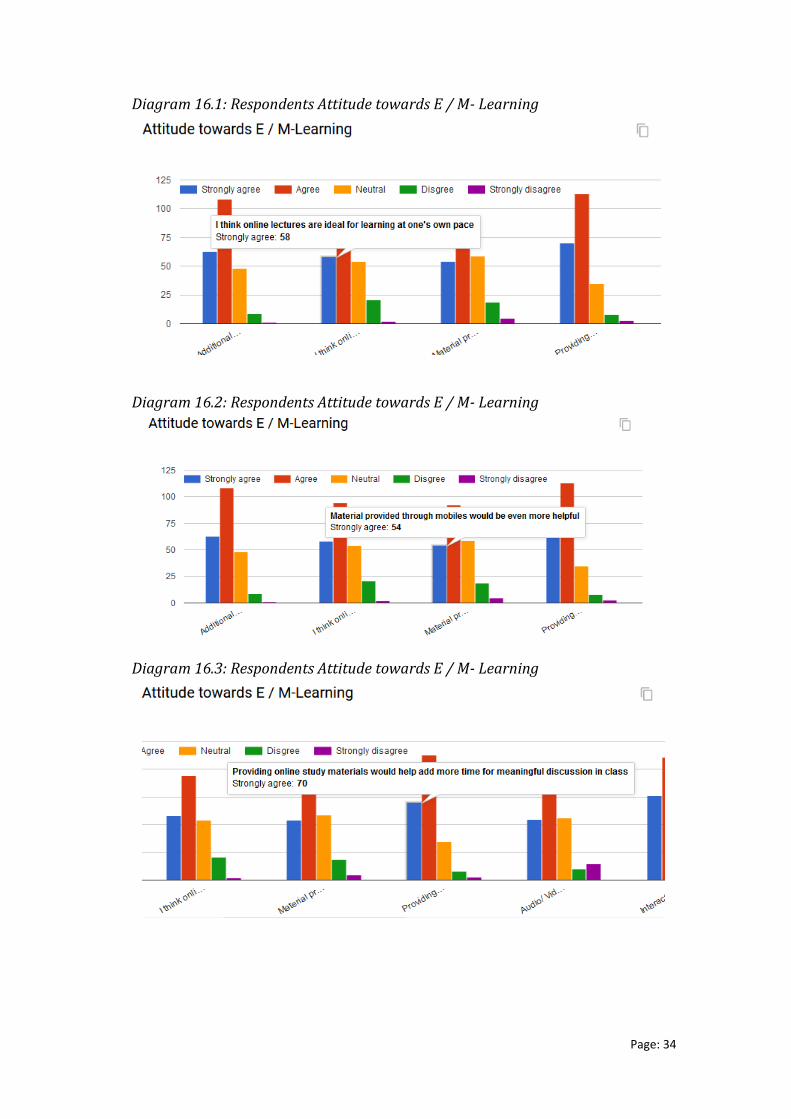
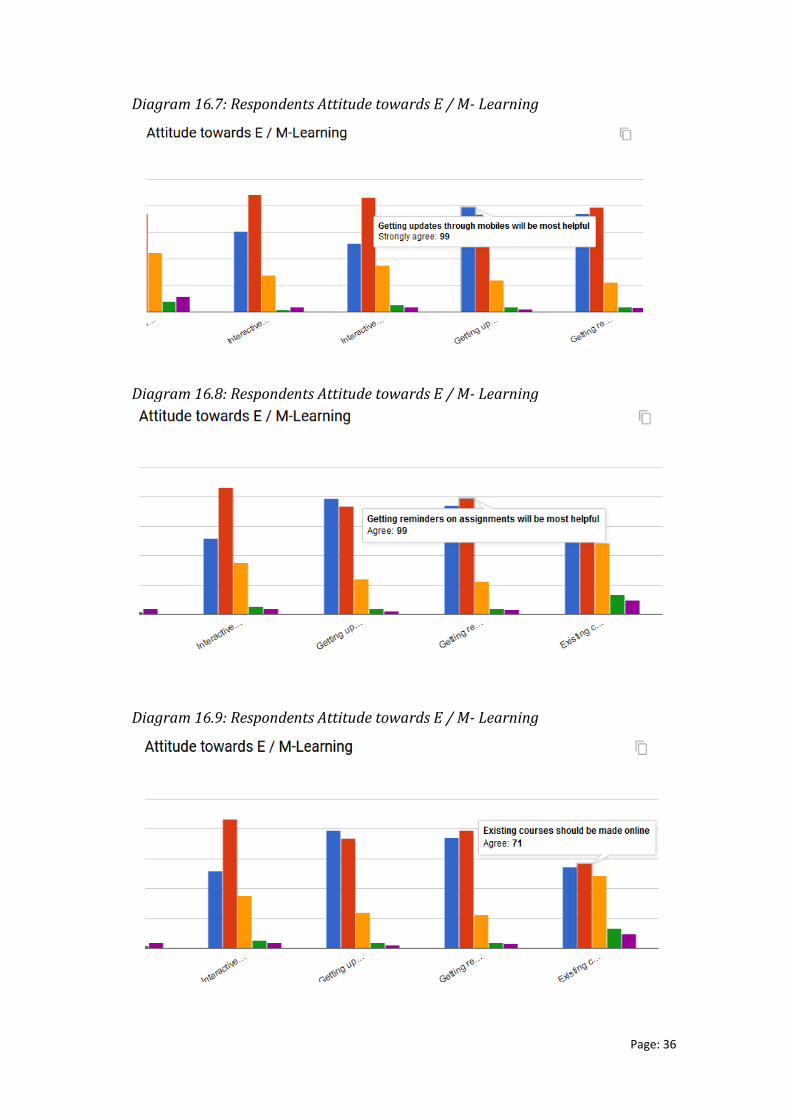
Attitude of the students towards E / M- Learning Students strongly feel that additional online lectures or materials can supplement classroom teaching, as they regard them ideal for the students to learn at their own pace. They also think that if the materials are provided through mobile phones it would be much more beneficial. They also feel that if online materials are provided before the class it would help them in better classroom discussions. They believe that audio/ video lectures with interactive multimedia will be more effective than mere class room lectures. They opine that even lab-based components can be effectively taught through the use of interactive multimedia. Students think that mobile updates, and reminders for assignments will be quite useful. They believe that all the existing courses can be made online. Diagram 16: Respondents Attitude towards E / M- Learning
Page: 34
Diagram 16.1: Respondents Attitude towards E / M- Learning
Diagram 16.2: Respondents Attitude towards E / M- Learning
Diagram 16.3: Respondents Attitude towards E / M- Learning

Page: 35
Diagram 16.4: Respondents Attitude towards E / M- Learning
Diagram 16.5: Respondents Attitude towards E / M- Learning
Diagram 16.6: Respondents Attitude towards E / M- Learning
Page: 36
Diagram 16.7: Respondents Attitude towards E / M- Learning
Diagram 16.8: Respondents Attitude towards E / M- Learning
Diagram 16.9: Respondents Attitude towards E / M- Learning

Page: 37
II
Teachers
Faculty are the pillars of an academic institution. The profile of the faculty, its alertness to the developments in the respective fields of academics; its willingness to update, upgrade and excel in the chosen domain area of knowledge; its keenness in imparting the knowledge to the students, in training them to become leaders in the area chosen, and in imparting the skills of logical thinking and research skills among them. University of Hyderabad is known for its academic excellence and the academic calibre of the Faculty. This baseline survey reflects the matter of fact situation in the Univerwsity with regard to different aspects that are important for learning and imparting knowledge. It will provide clues about the areas of concern for improvement. As noted in the section on students, the students have expressed their views on the teachers, teaching-learning environment, keenness in the adoption of education technologies to sharpen their learnings, skills, etc. This section will reflect on the teachers’ views on different aspects, such as the University, updates about the University, courses taught, use of educational technology in teaching, training students, online educational courses, etc. Age and Gender Profile of the Respondent Teachers: Most of the teachers who responded to the baseline survey are between 30 and 50 age group. They are from different academic backgrounds. Among the respondents, many are males. However, the proportion of female respondents is also quite significant. Diagram 1: Age Profile

Page: 38
Diagram 2: Gender Profile
Professional Profile: The respondents belong to all the three categories, Professors, Associate Professors, and Assistant Professors. Among them a significant proportion represent Professors and Associate Professors. Many teachers are well qualified and have PhD degree. The teachers are engaged in teaching and training Integrated Masters, Masters, and MPhil/ PhD students. Diagram 3: Professional Profile
66.7%
33.3%
Male
Female
Third Gender

Page: 39
Diagram 4: Programmes Taught
Diagram 5: Qualification of the Teachers

Page: 40
About the University: All the teachers consider the University as excellent and good (Diagram 6). This belief in the excellence of the University enthuses its faculty to work more vigorously to excel. They get the updates about the University through the emails, University website, and the other media Diagram 7). They use these media effectively also to communicate with the students (Diagram 7.1). Diagram 6: Grading the University
Diagram 7: Updates about University Activities
Page: 41
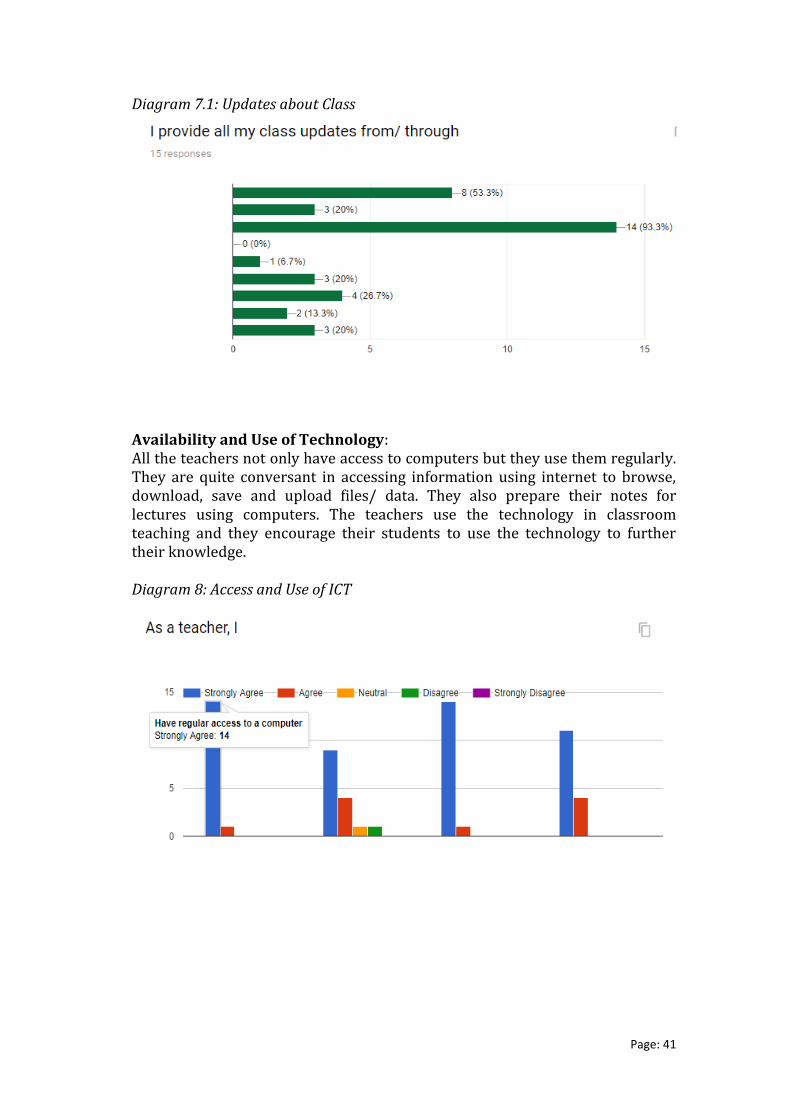
Diagram 7.1: Updates about Class
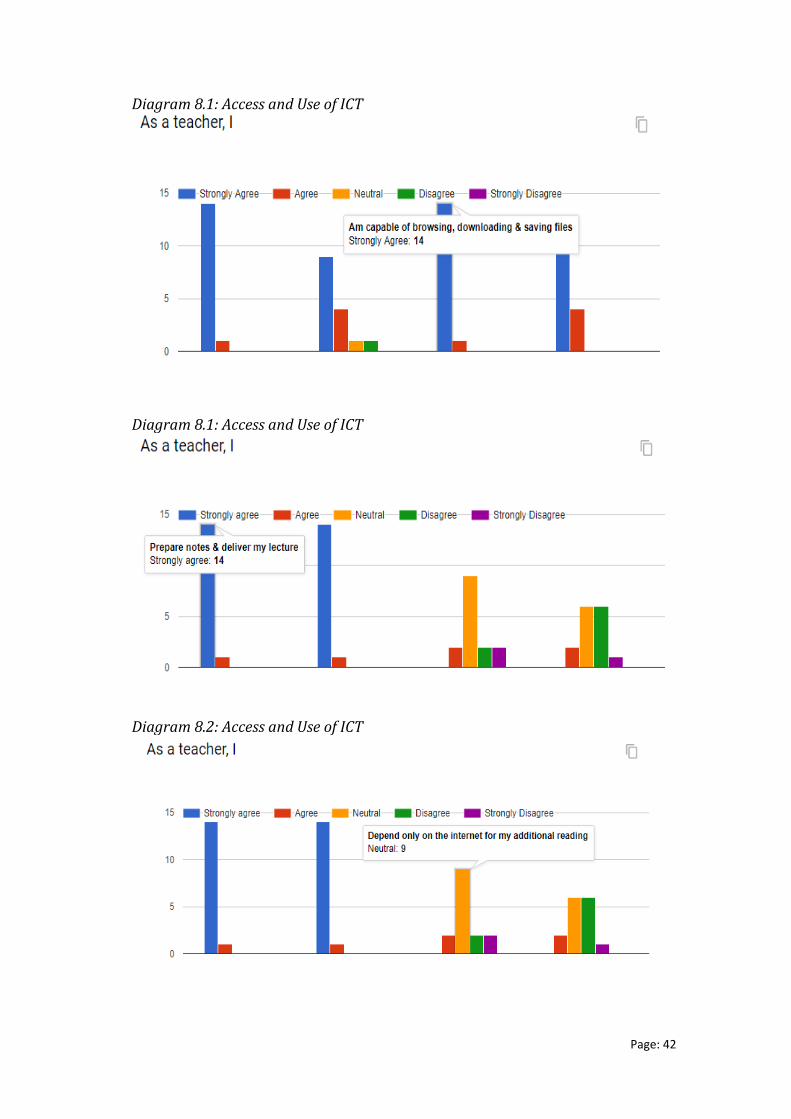
Availability and Use of Technology: All the teachers not only have access to computers but they use them regularly. They are quite conversant in accessing information using internet to browse, download, save and upload files/ data. They also prepare their notes for lectures using computers. The teachers use the technology in classroom teaching and they encourage their students to use the technology to further their knowledge. Diagram 8: Access and Use of ICT
Page: 42
Diagram 8.1: Access and Use of ICT
Diagram 8.1: Access and Use of ICT
Diagram 8.2: Access and Use of ICT

Page: 43
Teaching of Courses: The courses taught by the teachers are usually well structured that clearly state the learning outcomes, the method of evaluation, etc. Almost all the teachers provide the students at the beginning of the semester the course content and also mention to them the relevance and significance of the course in the present day context. The teachers update the contents regularly. They provide additional academic assistance to the students and also inculcate in them attitude towards research. Most of the teachers use technology in teaching and also encourage their students use technology to upgrade their skills and knowledge. They spend more time on slow learners. They are strict in enforcing regularity of the students to classes by strictly adhering to the attendance. The teachers give assignments to students to enhance their skills in the discipline and they give them sufficient time to complete the assignments. They guide them in the entire process. They encourage students to engage in research activities. The teachers feel that the system permits them to update and upgrade their courses, adopting innovative methods of teaching and evaluation, and involve students in curricular activities. The teaching method adopted is interactive and encourages students to participate in the classroom discussions. Most of the courses taught by the teachers do not require internship. Diagram 9: Teaching of Courses

Page: 44
Diagram 8.2: Access and Use of ICT
Diagram 8.3: Access and Use of ICT
Diagram 8.4: Access and Use of ICT

Page: 45
Diagram 8.5: Access and Use of ICT
Diagram 8.6: Access and Use of ICT
Diagram 8.7: Access and Use of ICT

Page: 46
Diagram 8.8: Access and Use of ICT
Diagram 8.9: Access and Use of ICT
Diagram 8.10: Access and Use of ICT

Page: 47
Diagram 8.11: Access and Use of ICT
Diagram 8.12: Access and Use of ICT
Diagram 8.13: Access and Use of ICT

Page: 48
Diagram 8.14: Access and Use of ICT
Diagram 8.15: Access and Use of ICT
Diagram 8.16: Access and Use of ICT

Page: 49
Diagram 8.17: Access and Use of ICT
Diagram 8.18: Access and Use of ICT

Page: 50
Teachers’ Attitude towards e / M – Learning: Almost all the teachers who responded feel that additional online materials or lectures would be helpful in supplementing classroom teaching, as they would help students to learn things better. They further feel that online courses help students to learn on their own pace. They also feel that providing learning materials through mobiles and internet would help the students better and they can come prepared to the class so that they can have more active participation in the discussions. The teachers opined that the University provided infrastructure to use technology very effectively which has created a positive atmosphere to further teaching-learning process. This also facilitates to encourage the students to use technology in their learning process. The teachers feel that interactive multimedia can assist learning very effectively. They also feel that a blend of teaching-learning by using technology and face to face interaction is quite ideal to teach and train the students. What is quite significant is that the teachers are more open to learning and adopting teaching-learning technologies. The teachers largely feel that to convert the existing courses online they need help and will be eager to learn to convert the regular courses into online courses. Diagram 9: Attitude towards E / M-Learning

Page: 51
Diagram 9.1: Attitude towards E / M-Learning
Diagram 9.2: Attitude towards E / M-Learning
Diagram 9.3: Attitude towards E / M-Learning

Page: 52
Diagram 9.4: Attitude towards E / M-Learning
Diagram 9.5: Attitude towards E / M-Learning
Diagram 9.6: Attitude towards E / M-Learning

Page: 53
Diagram 9.6: Attitude towards E / M-Learning
Diagram 9.7: Attitude towards E / M-Learning

Page: 54
Diagram 9.8: Attitude towards E / M-Learning

Page: 55
III Administrators including the Vice-Chancellor, Controller of Examinations and Finance Officer while appreciating the procedures and processes in place for academic administration are of the general view that online teaching is the future. They are also of the view that a comprehensive student support system that goes beyond just academics should be further strengthened. A policy to set up a comprehensive and inclusive Student Support System is on the cards and the administrators are fully committed to facilitating the same. The university has already declared its intent to convert its Foundation and Elective courses online to suit the blended teaching mode in the first phase. Alongside, the Vice-Chancellor has committed himself to supporting the teachers and the E-Learning Centre (ELC) in adopting the Online Education Policy in letter and spirit. While the university is committed to enhancing the capacities of the ELC in order to extend support to teachers and students. The university has also written to MHRD to provide funding in order to do so. MAJOR FINDINGS Students: • Most of the student respondents are on average of 22 and many of them
are pursuing Integrated Masters, PG and research • The research students, by and large, receive national level scholarships/
fellowships. However, students from economically and socially deprived sections receive financial assistance
• Most of the students pursue education to improve skills, knowledge, and gain expertise in the chosen field. They pursue education for enhancing their employability and careers.
• Students feel that the process of admission is smooth. • Students rated academic programmes, by and large, good and excellent. • Students regularly update their academic programme and other important
maters through University website, email, social media and notice board. • Students access and use computer and mobile devises in learning process. • Students regularly attend classes and take notes of the lectures. They
access reference materials from the internet as well as the library • The overall rating of teachers by students is good and excellent. The office
and supporting staff are rated better. • The department infrastructure need up-gradation. • Students receive course content in the beginning and are informed about
its relevance in today's context. They receive updated contents and academic help from the teachers.
• Teachers use technology in classroom teaching and they encourage students to use technology.
• Teachers spend time in explaining concepts and devote more time to slow learners.

Page: 56
• Students feel that the courses are relevant and help them in achieving learning outcomes and in building additional skills. Teachers involve them in undertaking additional research
• Students opined that teachers are competent to teach the courses. They are cordial and sympathetic to the students.
• Teachers give innovative assignments, provide feedback and help them in completing the assignments.
• Students feel that the existing courses can be converted into online courses.
• Online lectures and materials can supplement classroom teaching and also can help them in better learning.
Teachers: • Most of the teachers on an average are around 45 years and majority of
them are males. • Significant proportion of the respondents are Professors and Assistant
Professors. • Majority of them teach PG, Ph. D and Integrated Masters. • Almost all of them have Ph. D. • Majority rate the University as excellent and good. • The updates about the University are received through emails, University
website and other media. • They use email and other media to communicate with the students
effectively. • Almost all faculty use computers regularly and access information through
internet. • They use ICT in their pedagogy and encourage students to use technology. • Courses are well structured with clear learning outcomes and methods of
evaluation. • Teachers provide the course content, which is periodically revised, in the
beginning of the semester. • They assist students and inculcate attitude towards research. • Assignments are given to enhance the skills in the discipline. • They feel that the system permits updating and up-gradation of courses. • They adopt innovative methods of teaching and evaluation. • They adopt interactive methods of teaching. • Teachers feel that providing additional online materials and lectures can
supplement classroom teaching as it helps students to learn better. • They concur that providing online material through mobile and internet
would help students to come to the class prepared and participate in the classroom discussion actively.
• University provided infrastructure to use technology effectively. This helped in creating a positive atmosphere in teaching learning process.
• Teachers feel that a blend of using technology and face to face interaction is ideal to teach and train students.

Page: 57
• Teachers are willing to convert the existing courses online and they seek help in this regard.
Administrators: • Online teaching is future • A comprehensive student support system should be further strengthened. • A policy to set up comprehensive and inclusive student support system is
committed by the administration and is being facilitated. • University is converting foundation and elective courses online. • University is committed to strengthen e-Learning Centre and strengthen
the capacities of teachers and students. CONCLUSIONS The University has motivated students, highly qualified and competent faculty, and very supportive administration. Besides, it has required infrastructure and other supporting ecosystems. Moreover, the faculty as well as students are well versed with the use of technology in teaching and learning. The courses offered in the University are tuned towards strengthening the skills, knowledge base and capabilities of the students which enhances their employability further. However, efforts are needed to further strengthen the existing ecosystems of the University to effectively use technology in both pedagogy and governance in order to enhance University Industry links for employability. It continues to achieve international excellence by continuously updating its curriculum, introducing innovative courses and being a thought leader in the education space. ###