designing a successful transportation project · pdf filedesigning a successful transportation...
TRANSCRIPT

Designing a Successful Transportation Project
Lessons Learned from the Clean Cities American Recovery and Reinvestment Act Projects

Table of Contents
Acknowledgments .....................................................................................................................................................3
Introduction ...............................................................................................................................................................4
Project Objectives .................................................................................................................................................5
Project Impacts .........................................................................................................................................................5
Vehicles...............................................................................................................................................................5
Infrastructure ......................................................................................................................................................5
Project Partnerships ...................................................................................................................................................6
Number of Partners ..............................................................................................................................................6
Fleet Size ............................................................................................................................................................6
Fleet Type (Public/Private) .....................................................................................................................................7
Technology Selection ............................................................................................................................................7
Project Focus .............................................................................................................................................................8
Impacts ...............................................................................................................................................................9
Project Funding Priorities.............................................................................................................................................9
Funding Strategies ...............................................................................................................................................9
Incremental Cost Limits ........................................................................................................................................9
Project Management and Administrative Costs .......................................................................................................9
Training Costs ....................................................................................................................................................10
Marketing and Outreach Costs ............................................................................................................................10
Project Administrative Considerations ........................................................................................................................10
Conclusion...............................................................................................................................................................12
References ..............................................................................................................................................................13
VEHICLE TECHNOLOGIES OFFICE | cleancities.energy.gov2
DESIGNING A SUCCESSFUL TRANSPORTATION PROJECT

Acknowledgments
This work was supported by the U.S. Department of Energy (DOE) under Contract No. DE-AC36- 08GO28308 with Alliance for Sustainable Energy, LLC, the Manager and Operator of the National Renewable Energy Laboratory. This work was made possible through funding provided by National Clean Cities Program Director and DOE Vehicle Technologies Office Deployment Manager Dennis Smith.
This publication is part of a series. For other lessons learned from the Clean Cities American Recovery and Reinvestment (ARRA) projects, please refer to the following publications:
• American Recovery and Reinvestment Act – Clean Cities Project Awards (DOE/GO-102016-4855 - August 2016)
• What Fleets Need to Know About Alternative Fuel Vehicle Conversions, Retrofits, and Repowers (DOE/GO-102017-5039 - September 2017)
Authors
Kay Kelly and Mark Singer, National Renewable Energy Laboratory
DESIGNING A SUCCESSFUL TRANSPORTATION PROJECT
VEHICLE TECHNOLOGIES OFFICE | cleancities.energy.gov3
DESIGNING A SUCCESSFUL TRANSPORTATION PROJECT
VEHICLE TECHNOLOGIES OFFICE | cleancities.energy.gov4
IntroductionGrowing our nation’s economy requires transportation, and transportation requires energy. The U.S. Department of Energy’s Vehicle Technologies office (VTO) seeks to provide affordable, secure, and efficient energy technologies for the transport of people and goods across America. It supports a balanced portfolio of early-stage research and works directly with its nationwide network of Clean Cities coalitions to enable the widespread use of alternative fuels and energy efficient technologies that reduce transportation energy costs for busi-nesses and consumers.
Clean Cities coalitions bring together local businesses, fuel providers, government agencies, and community organizations for a boots-on-the-ground approach to alternative fuel and vehicle use that takes advantage of unique opportunities in the area they serve. VTO leadership at the national level enables the sharing of data, information, and lessons learned that has proven essential to local and regional success.
Since 1993, VTO has funded more than 600 Clean Cities-related projects nationwide. Selected through an open and competitive funding opportunity process, each project is cost-shared, with every federal dollar matched, or in many cases doubled, by funds and in-kind contributions from project partners. These seed local markets and significantly increase the availability of alternative fuels and infrastructure, enabling a growing number of fleets to choose alternative fuel vehicles for the first time. The program has distributed nearly $400 million in project awards, which have leveraged nearly an additional $800 million from outside organizations (U.S. Department of Energy, Vehicle Technologies Office).
The largest source of funding for Clean Cities projects in the program’s history came from the American Recovery and Reinvestment Act (Recovery Act). In 2009, the 25 cost-shared projects totaled nearly $300 million in federal government investment. This effort included the involvement of 50 Clean Cities coalitions and their nearly 700 stakeholder partners who provided an additional $500 million in matching funds to support projects in their local communities.
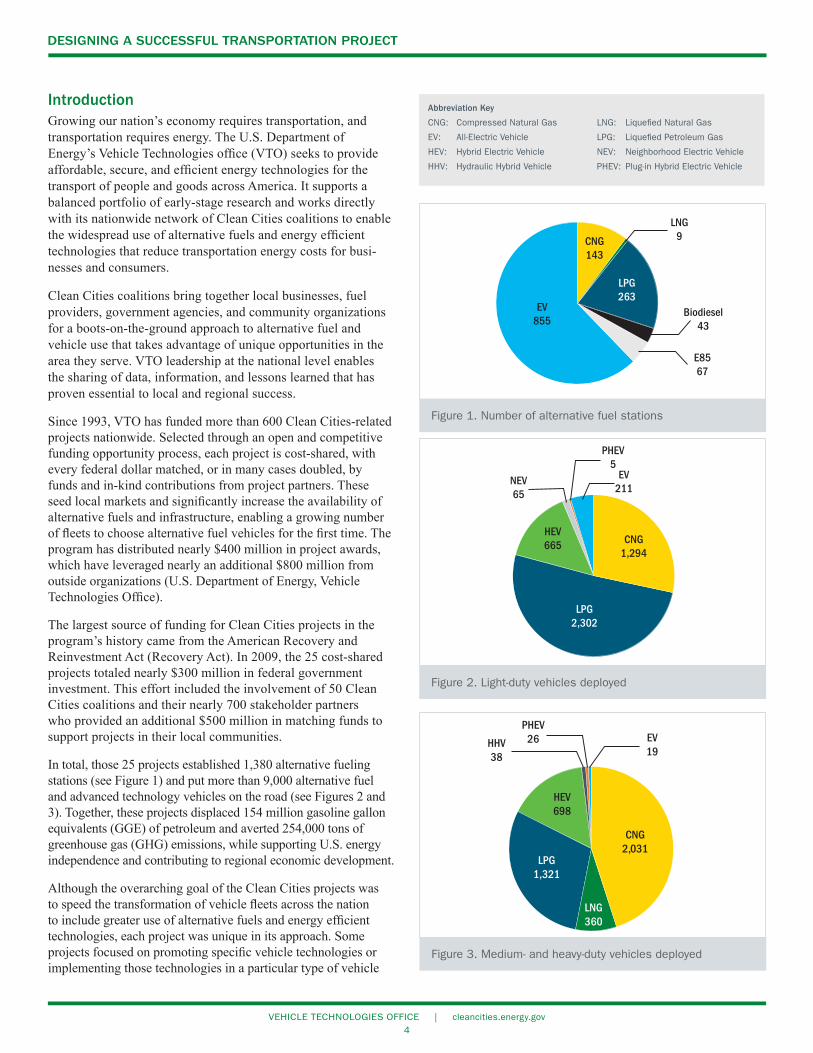
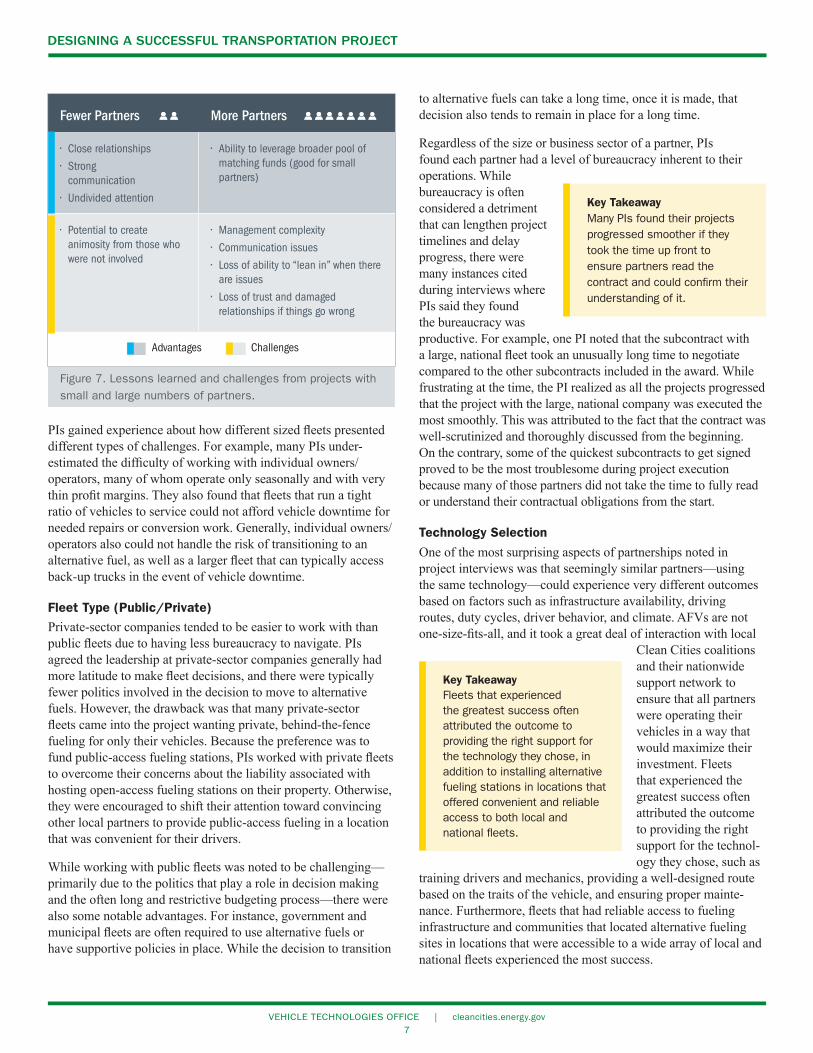
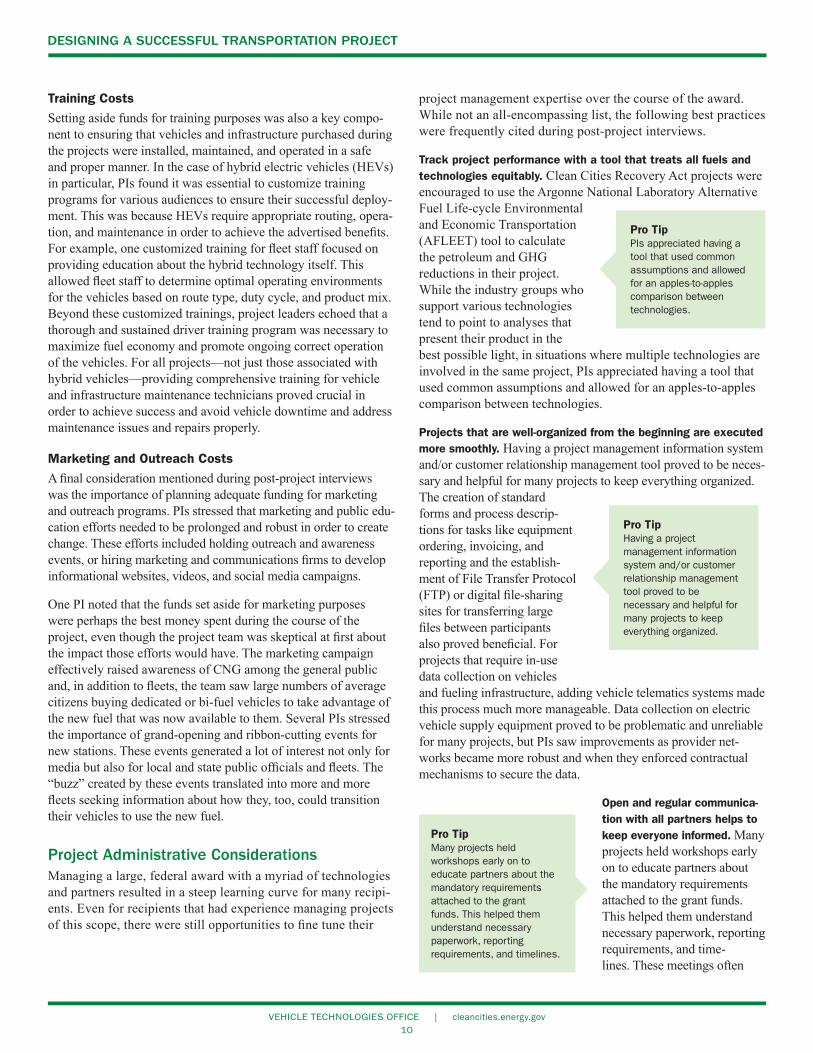
In total, those 25 projects established 1,380 alternative fueling stations (see Figure 1) and put more than 9,000 alternative fuel and advanced technology vehicles on the road (see Figures 2 and 3). Together, these projects displaced 154 million gasoline gallon equivalents (GGE) of petroleum and averted 254,000 tons of greenhouse gas (GHG) emissions, while supporting U.S. energy independence and contributing to regional economic development.
Although the overarching goal of the Clean Cities projects was to speed the transformation of vehicle fleets across the nation to include greater use of alternative fuels and energy efficient technologies, each project was unique in its approach. Some projects focused on promoting specific vehicle technologies or implementing those technologies in a particular type of vehicle
NEV65
PHEV5
CNG1,294
LPG2,302
HEV665
EV211
Figure 2. Light-duty vehicles deployed
LNG360
LPG1,321
HEV698
HHV38
PHEV26 EV
19
CNG2,031
Figure 3. Medium- and heavy-duty vehicles deployed
Fig. 5
CNG143
E8567
LPG263
EV855
Biodiesel43
LNG9
Figure 1. Number of alternative fuel stations
Abbreviation Key
CNG: Compressed Natural Gas
EV: All-Electric Vehicle
HEV: Hybrid Electric Vehicle
HHV: Hydraulic Hybrid Vehicle
LNG: Liquefied Natural Gas
LPG: Liquefied Petroleum Gas
NEV: Neighborhood Electric Vehicle
PHEV: Plug-in Hybrid Electric Vehicle

VEHICLE TECHNOLOGIES OFFICE | cleancities.energy.gov5
DESIGNING A SUCCESSFUL TRANSPORTATION PROJECT
fleet (e.g., refuse haulers and school buses), while other projects cast a broader net that included deploying multiple fuels and types of vehicles for various end users.
Project ObjectivesEach project within the Clean Cities Recovery Act portfolio began with the same set of initial objectives:
1. To increase the use of alternative fuel vehicles (AFVs) and advanced technology vehicles as a means to reduce U.S. dependence on imported petroleum, increase fuel economy, and improve emissions.
2. To install infrastructure that supports AFVs and advanced technology vehicles.
3. To ensure that vehicles capable of using alternative fuels do so to the greatest extent possible.
4. To provide appropriate training for individuals associated with the project and in the larger community about the benefits of AFVs and advanced technology vehicles, as well as offer strategies to help them maximize those benefits.
5. To measure the success of the projects by collecting the corresponding vehicle, infrastructure, and training information data related to each.
6. To create and retain jobs.
All fuels and technologies contributed to the overall success of the Clean Cities projects, however, some had a greater impact than others depending on the end goal the principal investigator (PI) chose for a project. Many PIs defined their individual project success differently—with some projects focusing on petroleum displacement or air quality improvements, while others focused on economic development or another combination.
During post-project interviews, project leaders consistently cited a number of key components—ranging from technical and logis-tical factors, to administrative capabilities—for accomplishing an effective and impactful project. Common themes that emerged from these discussions included the strength and diversity of partnerships; funding strategies; appropriate vehicle selection based on drive cycle and duty cycle; the availability of fueling infrastructure; the organizational skills of project leaders and participants; and the importance of effective training, education, and outreach.
Project Impacts Beyond simply deploying vehicles and establishing fueling infrastructure, the Clean Cities projects also brought substantial and meaningful change to their respective communities. Projects expanded public fueling options, supported regional economic growth, and advanced important conversations within communi-ties about transportation energy.
VehiclesA large number of the vehicles supported by the Clean Cities projects (45%) were compressed natural gas vehicles (CNG), which led to the displacement of more than 28 million GGEs of petroleum. Notably, heavy-duty liquefied natural gas (LNG) vehicles accounted for only 4% of the total number of vehicles but were responsible for 19% of vehicle-related petroleum displacement. All of the LNG vehicles supported under the Recovery Act were long-haul Class-8 trucks that accumulated significant mileage, allowing for the high amount of petroleum displacement. For vehicle-related GHG reductions, medium- and heavy-duty hybrid vehicles accounted for only 8% of the total vehicles supported but were responsible for 66% of GHG reductions (see Figures 9 and 10). Hybrid vehicles typically produce lower tailpipe emissions than conventional vehicles (U.S. Department of Energy 2016), and the high mileage driving of medium- and heavy-duty applications demonstrated the GHG-reduction benefits of hybrid technology.
Infrastructure While CNG stations only represented 10% of stations established, they accounted for 65% of infrastructure-related petroleum displacement. Again, CNG demonstrates significant promise for displacing petroleum consumption. When considering infrastruc-ture-related GHG reductions, CNG stations also performed well, representing 40% of the GHG impacts, with a significant portion of GHG benefits resulting from a single renewable natural gas (RNG) station that was part of the Indiana Office of Energy Development project at the Fair Oaks Dairy Farm. This single station represented 40% of the CNG station GHG reductions and demonstrates the significant impact RNG can have on GHG reductions.
Biofuel stations also performed well from a GHG perspective. Biodiesel and E85 stations comprised only 8% of total infra-structure combined but were responsible for more than 50% of infrastructure-related GHG reductions (see Figures 4 and 5).
Fig. 6
Biodiesel5
EV0.3
CNG64
LNG4
LPG12
E8514
Figure 4. Petroleum reduced by station fuel type (million GGEs)

VEHICLE TECHNOLOGIES OFFICE | cleancities.energy.gov6
DESIGNING A SUCCESSFUL TRANSPORTATION PROJECT
Project PartnershipsMost Clean Cities projects included multiple partners who led sub-projects that focused on meeting specific fleet and commu-nity needs. In total, nearly 700 partners were involved in these projects—ranging from large national companies to small private fleets and municipalities. While some sub-projects were complex endeavors involving the construction of fueling infrastructure and the purchase of large quantities of vehicles, most sub-projects involved relatively small actions, such as one fleet purchasing a few vehicles. The average amount of federal funding allocated to a sub-project was $368,000, with 74% of sub-projects receiving federal funds of $250,000 or less. The vast majority of sub-proj-ects (91%) received less than $1 million in federal funds, while only 13 sub-projects received more than $3 million in federal funds. Overwhelmingly, Clean Cities efforts demonstrated that many small actions can significantly influence and transform markets in communities across the United States (see Figure 6).
Number of PartnersPIs cited partnerships in general as being critical to project success, although preferences varied when it came to the quantity and types of partners that should be included in a project. Some PIs who advocated for fewer partners determined that it gave them the opportunity to develop strong relationships and focus their attention on only one or two partners. They asserted that this led to uncomplicated communication channels and minimal management complexity. In some cases, however, PIs said this approach had the potential to create animosity from other stakeholders who were not involved in the project.
There were advantages and challenges to having greater numbers of partners—usually exceeding 10 or more—in a project as well. PIs cited the primary advantage of leading projects with more partners as being able to leverage a very broad pool of resources that benefitted everyone involved in the project. This was especially advantageous for small partners who often did not have much financial capital to bring to the project but who could still participate thanks to the ability of larger partners to provide more than the minimum cost-share requirement.
Larger partners benefitted from the participation of smaller partners, too. Having more people in the alternative fuel market increased demand for vehicles and fuel. This contributed to econ-omies of scale that decreased overall costs and led to improved community awareness of alternative fuel options, helping to further market growth. In addition, higher concentrations of vehi-cles in a given area meant improved access to fueling locations and increased availability of complementary resources, such as trained maintenance technicians.
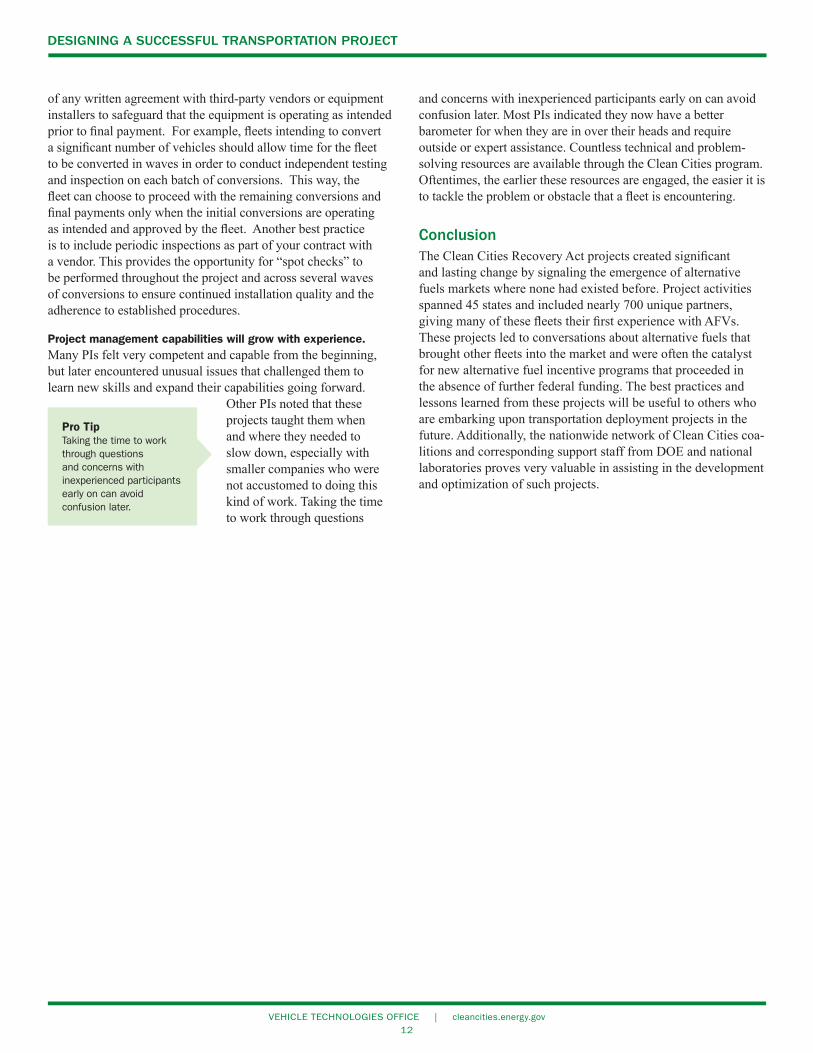
The disadvantages of having a lot of partners were primarily associated with the increased complexity of project manage-ment. When a project included dozens of partners across a large geographic area, communication became challenging due to the sheer volume of people involved and the inability to devote large amounts of time to any single partner. Sometimes, when issues arose, project leaders felt like they were spread too thin and were not able to devote the necessary time and attention to resolve the problems as quickly as they would have liked. In some cases, poor communication damaged the relationships and trust between the PI and the partners (see Figure 7).
Fleet SizePIs had widely different views on the merits of including small versus large fleets. Some focused their efforts entirely on large fleets because they tended to drive their vehicles many miles, and switching these fleets to an alternative fuel was viewed to be more impactful. Others focused their efforts entirely on small fleets because of their ability to relate to more of the general driv-ing public. Their idea was that if it could work for a small fleet, it could work for anyone. Furthermore, some thought because there are far more small fleets than large fleets in the country, over time the benefits of working with small fleets would outweigh the quick hit of working with a large fleet.
LNG7,191
Natural Gas73,922
Biodiesel46,278
E8549,391
EV811
LPG7,738
CNG 45,093RNG 28,829
Figure 5. GHGs reduced by station fuel type (tons GHG)
Fede
ral F
undi
ng A
ward
ed
to E
ach
Sub-
Proj
ect (
Mill
ions
)
$0$1$2$3$4$5$6$7$8
0 100 200 300 400 500 600 700
74% 91%
of Sub-Awards were less than $1M
$368,102.87
Average Sub-Award Value
of Sub-Awards were less than $250K
Number of Sub-Projects
= 1 Sub-Project
Figure 6. Clean Cities sub-project values
VEHICLE TECHNOLOGIES OFFICE | cleancities.energy.gov7
DESIGNING A SUCCESSFUL TRANSPORTATION PROJECT
PIs gained experience about how different sized fleets presented different types of challenges. For example, many PIs under-estimated the difficulty of working with individual owners/operators, many of whom operate only seasonally and with very thin profit margins. They also found that fleets that run a tight ratio of vehicles to service could not afford vehicle downtime for needed repairs or conversion work. Generally, individual owners/operators also could not handle the risk of transitioning to an alternative fuel, as well as a larger fleet that can typically access back-up trucks in the event of vehicle downtime.
Fleet Type (Public/Private)Private-sector companies tended to be easier to work with than public fleets due to having less bureaucracy to navigate. PIs agreed the leadership at private-sector companies generally had more latitude to make fleet decisions, and there were typically fewer politics involved in the decision to move to alternative fuels. However, the drawback was that many private-sector fleets came into the project wanting private, behind-the-fence fueling for only their vehicles. Because the preference was to fund public-access fueling stations, PIs worked with private fleets to overcome their concerns about the liability associated with hosting open-access fueling stations on their property. Otherwise, they were encouraged to shift their attention toward convincing other local partners to provide public-access fueling in a location that was convenient for their drivers.
While working with public fleets was noted to be challenging—primarily due to the politics that play a role in decision making and the often long and restrictive budgeting process—there were also some notable advantages. For instance, government and municipal fleets are often required to use alternative fuels or have supportive policies in place. While the decision to transition
to alternative fuels can take a long time, once it is made, that decision also tends to remain in place for a long time.
Regardless of the size or business sector of a partner, PIs found each partner had a level of bureaucracy inherent to their operations. While bureaucracy is often considered a detriment that can lengthen project timelines and delay progress, there were many instances cited during interviews where PIs said they found the bureaucracy was productive. For example, one PI noted that the subcontract with a large, national fleet took an unusually long time to negotiate compared to the other subcontracts included in the award. While frustrating at the time, the PI realized as all the projects progressed that the project with the large, national company was executed the most smoothly. This was attributed to the fact that the contract was well-scrutinized and thoroughly discussed from the beginning. On the contrary, some of the quickest subcontracts to get signed proved to be the most troublesome during project execution because many of those partners did not take the time to fully read or understand their contractual obligations from the start.
Technology SelectionOne of the most surprising aspects of partnerships noted in project interviews was that seemingly similar partners—using the same technology—could experience very different outcomes based on factors such as infrastructure availability, driving routes, duty cycles, driver behavior, and climate. AFVs are not one-size-fits-all, and it took a great deal of interaction with local
Clean Cities coalitions and their nationwide support network to ensure that all partners were operating their vehicles in a way that would maximize their investment. Fleets that experienced the greatest success often attributed the outcome to providing the right support for the technol-ogy they chose, such as
training drivers and mechanics, providing a well-designed route based on the traits of the vehicle, and ensuring proper mainte-nance. Furthermore, fleets that had reliable access to fueling infrastructure and communities that located alternative fueling sites in locations that were accessible to a wide array of local and national fleets experienced the most success.
Key TakeawayFleets that experienced the greatest success often attributed the outcome to providing the right support for the technology they chose, in addition to installing alternative fueling stations in locations that offered convenient and reliable access to both local and national fleets.
Key TakeawayMany PIs found their projects progressed smoother if they took the time up front to ensure partners read the contract and could confirm their understanding of it.
Figure 7. Lessons learned and challenges from projects with small and large numbers of partners.
Fewer Partners More Partners
• Close relationships
• Strong communication
• Undivided attention
• Ability to leverage broader pool of matching funds (good for small partners)
• Potential to create animosity from those who were not involved
• Management complexity
• Communication issues
• Loss of ability to “lean in” when there are issues
• Loss of trust and damaged relationships if things go wrong
Advantages Challenges

VEHICLE TECHNOLOGIES OFFICE | cleancities.energy.gov8
DESIGNING A SUCCESSFUL TRANSPORTATION PROJECT
Project FocusSome projects focused on a single fuel or technology (e.g., hybrid school buses or natural gas refuse trucks) and other projects cast a wide net, including as many as six different fuels in their efforts. While many of the same benefits and drawbacks associated with the number of partners held true for the number of fuels and technologies represented, PIs also drew some unique conclusions regarding whether a narrow or broad project focus was optimal (see Figure 8).
When a project was narrowly focused and involved only one or two technologies, PIs had the advantage of developing specialized knowledge and expertise on the particular fuel that they chose. During these types of projects, PIs were able to focus their
undivided attention on only one or two fuels, resulting in deep knowledge and industry contacts that many of the more broadly focused projects did not have the resources to cultivate. However, narrowly focused projects were often faced with a great deal of pushback from other fuel-specific industry groups that were left out and the fleets that did not feel like the fuel they selected was a good fit for their operations. For example, during a couple of projects that were focused solely on implementing CNG, PIs experienced resistance from fleets who preferred to use biodiesel or wanted a lower entry cost with propane. However, because the project scope was limited to a single fuel, fleets who felt like they would be better served with a different fuel choice were unable to participate.
Broadly focused projects with many technologies were labor intensive and required greater administrative support but were generally more appealing to the community because they offered something for everyone. Similar to projects with a lot of partners, the broadly focused projects were able to leverage a larger pool of matching funds and, perhaps most importantly, were able to engage in a great deal of dialogue with their community about which fuel options worked best for particular applications. By being less prescriptive in their funding, they enabled broad input about what would work best. Petroleum displacement and GHG-reduction data reported from these types of projects also showed a broader focus generally created more petroleum displacement (see Figures 9 and 10).
Having a Clean Cities coalition involved in a project was often cited as a critical factor in its success. Clean Cities coalitions are well-positioned within local markets to not only have access to willing participants who are ready to move forward with deploying alternative fuels within their fleet but also possess the knowledge and access to resources to help partners successfully overcome the challenges they may face during implementation. Coordinators are experts at developing relationships and cultivating trust with their stakeholders, putting them in an ideal position to assist fleets that have questions or run into issues. In the event of a problem, fleets are generally more comfortable discussing it with a coordinator because their personal relationship gives them confidence that they will stand by them and help them find a solution.
Coordinators also have access to a national network of other coordinators and experts within DOE and at national laboratories who are available to help fleets identify credible sources of information and make educated decisions about how to best get projects back on track.
Narrow Focus Broad Focus
• Development of specialized knowledge and expertise
• Undivided attention on a single technology
• Ability to leverage broader pools of partners/matching funds
• Something for everyone
• Increased public awareness of many alt fuel options
• Potential to create animosity from those who were not involved
• Management complexity
• Necessitates more staff
• Loss of ability to “lean in” when there are issues
Advantages Challenges
Figure 8. Lessons learned and challenges from projects with a narrow and broad focus
30
25
20
15
10
5
0CNG LPG LNG HEV EV HHV PHEV NEV
Medium and Heavy-duty Light-duty
Mill
ion
GG
Es R
educ
ed
Petroleum Gasoline Gallon Equivalents Reduced by Vehicle Fuel Type
Figure 9. Petroleum reduced by deployed vehicles
60,000
50,000
40,000
30,000
20,000
10,000
0CNG EV HEV LNG LPG NEV PHEV
Medium and Heavy-duty Light-duty
GH
Gs
redu
ced
(ton
s)
GHGs Reduced by Vehicle Fuel Type
Figure 10. GHGs reduced by deployed vehicles

VEHICLE TECHNOLOGIES OFFICE | cleancities.energy.gov9
DESIGNING A SUCCESSFUL TRANSPORTATION PROJECT
ImpactsWhen asked what the most unexpected aspect of their projects was, several PIs noted that they ended up building alternative fuel markets that they did not intend to build. This was especially true of the propane markets that sprouted in conjunction with CNG markets. Three separate PIs in particular noted that because their projects had funding allocated specifically for CNG vehicles and infrastructure, they devoted a great deal of effort to educating their stakeholders about the fuel. In the course of achieving their goal to build a CNG market, they also ended up having a surprising number of fleets commit to propane. They attributed this to starting general conversations about alternative fuels. The projects created a lot of buzz in their community, and fleets were excited to try something other than conventional gasoline or diesel. By raising awareness of a particular alternative fuel, the project team encouraged greater conversation about the avail-ability of all alternative fuels. Fleets selected the fuel best suited to their needs and budget—in many cases opting for propane because of its low implementation cost. Some of these fleets might have never considered an alternative fuel at all—let alone propane—without the education and presentations about all the available alternative fuels that were part of the project.
Project Funding PrioritiesWhile DOE selected the 25 Clean Cities projects for funding based upon the priorities set forth in the funding opportunity announcement, each project had its own unique focus and way of prioritizing the allocation of the funds they received. For example, some projects focused primarily on funding fueling infrastructure while others focused primarily on assisting with the purchase of vehicles.
Funding StrategiesFor projects that focused on vehicle purchases, in many cases there were commitments in place from infrastructure providers that would support infrastructure expansion as vehicles were deployed and fueling demand increased. This turned out to be a successful strategy, and infrastructure did expand as promised.
In other cases, infrastructure funding was prioritized over vehicle purchases. These projects tended to have fleets that were already committed to purchasing certain vehicles. The vehicles were used as matching funds so that the grant funding could cover as much of the infrastructure cost as possible. This also proved to be a successful strategy.
Incremental Cost LimitsWhile 100% of infrastructure costs could be funded through the federal award, the funding opportunity announcement set forth limits about how much federal funding could be used to purchase specific vehicle types. The funding limits ranged from $2,000 per vehicle for a light-duty hybrid electric vehicle to incremental cost coverage of up to $500,000 per vehicle for medium- and heavy-duty electric vehicles. In many cases, partners supplied the
base cost of the vehicle as their cost share. Funding limits were often generous enough that federal funds could be used to cover 100% of the incremental costs of the alternative fuel option for that vehicle.
While some projects adhered strictly to the incremental cost limits set forth in the funding opportunity, other projects went beyond those guidelines and required project participants to bear more of the incremental cost burden. Only a couple projects designed their programs around providing less incremental cost coverage, which was strategic in order to make their application stand out to the selection panel. These projects tended to have greater petroleum displacement and GHG reductions because they were able to purchase more vehicles with the same amount of federal funds.
The vast majority of projects ended up covering 100% of the incremental costs for AFVs. In the beginning, the project teams
saw this as a great incen-tive to get fleets that were already purchasing vehi-cles to try something new and have the opportunity to purchase AFVs for no additional cost instead. In retrospect, many projects regretted that decision. In interviews, several PIs said in the future their projects
would provide less incremental cost coverage. There were count-less incidents of fleets that essentially received the alternative fuel option on their vehicles for free, and as a result, did not appear to care for the vehicle as well as they would have if they had been required to contribute more. PIs overwhelmingly agreed that a better outcome could have been achieved if fleets had a greater financial stake and had been tasked with more responsibility for researching vehicle types before final selections were made. Expecting them to contribute more of their own funding toward a vehicle of their choice ultimately forced them to be more thought-ful in the technologies they selected.
Project Management and Administrative CostsPIs also stressed the importance of budgeting for an appropriate level of project management and administrative costs in their applications. Many projects underestimated the time and cost required to administer a federal grant of this magnitude, which caused an increased burden as the projects wore on. In some cases, geographic dispersion of sub-recipients made project over-sight challenging and necessitated costly travel. In other cases, consultants were required to supplement existing staff. In all cases, having competent project management staff was noted to be essential to overall success. Planning and budgeting appropri-ately from the beginning for project management and administra-tive costs was noted as the most critical step to ensuring qualified staff received competitive wages, incentivizing them to stay with the project for its duration.
Key TakeawayIn interviews, several PIs said in the future their projects would provide less incremental cost coverage to encourage more of an up-front funding committment from partners.
VEHICLE TECHNOLOGIES OFFICE | cleancities.energy.gov10
DESIGNING A SUCCESSFUL TRANSPORTATION PROJECT
project management expertise over the course of the award. While not an all-encompassing list, the following best practices were frequently cited during post-project interviews.
Track project performance with a tool that treats all fuels and technologies equitably. Clean Cities Recovery Act projects were encouraged to use the Argonne National Laboratory Alternative Fuel Life-cycle Environmental and Economic Transportation (AFLEET) tool to calculate the petroleum and GHG reductions in their project. While the industry groups who support various technologies tend to point to analyses that present their product in the best possible light, in situations where multiple technologies are involved in the same project, PIs appreciated having a tool that used common assumptions and allowed for an apples-to-apples comparison between technologies.
Projects that are well-organized from the beginning are executed more smoothly. Having a project management information system and/or customer relationship management tool proved to be neces-sary and helpful for many projects to keep everything organized. The creation of standard forms and process descrip-tions for tasks like equipment ordering, invoicing, and reporting and the establish-ment of File Transfer Protocol (FTP) or digital file-sharing sites for transferring large files between participants also proved beneficial. For projects that require in-use data collection on vehicles and fueling infrastructure, adding vehicle telematics systems made this process much more manageable. Data collection on electric vehicle supply equipment proved to be problematic and unreliable for many projects, but PIs saw improvements as provider net-works became more robust and when they enforced contractual mechanisms to secure the data.
Open and regular communica-tion with all partners helps to keep everyone informed. Many projects held workshops early on to educate partners about the mandatory requirements attached to the grant funds. This helped them understand necessary paperwork, reporting requirements, and time-lines. These meetings often
Training CostsSetting aside funds for training purposes was also a key compo-nent to ensuring that vehicles and infrastructure purchased during the projects were installed, maintained, and operated in a safe and proper manner. In the case of hybrid electric vehicles (HEVs) in particular, PIs found it was essential to customize training programs for various audiences to ensure their successful deploy-ment. This was because HEVs require appropriate routing, opera-tion, and maintenance in order to achieve the advertised benefits. For example, one customized training for fleet staff focused on providing education about the hybrid technology itself. This allowed fleet staff to determine optimal operating environments for the vehicles based on route type, duty cycle, and product mix. Beyond these customized trainings, project leaders echoed that a thorough and sustained driver training program was necessary to maximize fuel economy and promote ongoing correct operation of the vehicles. For all projects—not just those associated with hybrid vehicles—providing comprehensive training for vehicle and infrastructure maintenance technicians proved crucial in order to achieve success and avoid vehicle downtime and address maintenance issues and repairs properly.
Marketing and Outreach CostsA final consideration mentioned during post-project interviews was the importance of planning adequate funding for marketing and outreach programs. PIs stressed that marketing and public edu-cation efforts needed to be prolonged and robust in order to create change. These efforts included holding outreach and awareness events, or hiring marketing and communications firms to develop informational websites, videos, and social media campaigns.
One PI noted that the funds set aside for marketing purposes were perhaps the best money spent during the course of the project, even though the project team was skeptical at first about the impact those efforts would have. The marketing campaign effectively raised awareness of CNG among the general public and, in addition to fleets, the team saw large numbers of average citizens buying dedicated or bi-fuel vehicles to take advantage of the new fuel that was now available to them. Several PIs stressed the importance of grand-opening and ribbon-cutting events for new stations. These events generated a lot of interest not only for media but also for local and state public officials and fleets. The “buzz” created by these events translated into more and more fleets seeking information about how they, too, could transition their vehicles to use the new fuel.
Project Administrative ConsiderationsManaging a large, federal award with a myriad of technologies and partners resulted in a steep learning curve for many recipi-ents. Even for recipients that had experience managing projects of this scope, there were still opportunities to fine tune their
Pro TipMany projects held workshops early on to educate partners about the mandatory requirements attached to the grant funds. This helped them understand necessary paperwork, reporting requirements, and timelines.
Pro TipPIs appreciated having a tool that used common assumptions and allowed for an apples-to-apples comparison between technologies.
Pro TipHaving a project management information system and/or customer relationship management tool proved to be necessary and helpful for many projects to keep everything organized.

VEHICLE TECHNOLOGIES OFFICE | cleancities.energy.gov11
DESIGNING A SUCCESSFUL TRANSPORTATION PROJECT
continued on a quarterly basis throughout the project. By holding these meetings in advance of the deadlines outlined in the master agreement with DOE, it ensured that partner data were received and discussed prior to the DOE reporting deadline. In fact, one PI had the novel idea to hold a workshop where all project partici-pants could present their project plans to one another. This work-shop was described as a “gut check” to make sure that participants had thought through their plans carefully and were confident that they were making sound decisions. Several project participants found the workshop to be thought provoking and decided to refine or adjust their plans upon hearing what others were doing.
Project roles and responsibilities need to be defined and each role needs to be staffed appropriately. Consistent roles and responsi-bilities make it easy for project partners to know who to contact.
Many projects established an effective division of labor by creating a “good cop/bad cop” system. Clean Cities coordi-nators were often placed in the “good cop” role by always making themselves visible and
available to partners. They performed site visits, cultivated trust, and handled marketing and promotion work. Other administrative staff handled items that tended to be more difficult or divisive, such as contracts, invoices, and reporting. In some cases, PIs found it necessary to hire consultants to supplement their exper-tise. In these situations, it was also important for project staff to understand the work of the consultants they were overseeing to ensure it was being executed to the standards set forth in their consultant agreement.
Auditors and legal experts play an important role in projects and their services should be readily engaged. Many PIs were hesitant to engage auditors but eventually found the additional set of eyes on their operations and processes to be extremely beneficial. Many project teams were able to make important and lasting changes to their accounting systems and practices based upon the feedback of trusted auditors that they felt would strengthen their capabilities going forward. Legal experts were able to significantly strengthen contractual language that made it easier for project managers to enforce reporting requirements and enact penalties for non-compliance.
Project staff can never do too much due diligence when it comes to project partners, technology suppliers, and equipment vendors. Risk assessments should be performed on all project participants to assess level of commitment to the project and ensure financial solvency, appropriate accounting system controls, and administrative capabilities to manage their project
obligations. One PI noted that new technologies for fleets are not necessarily riskier, but that the small, start-up companies that sell them often are. Fleets that transition to alternative fuels using equipment sold or manufactured by small, start-up companies need to be extra cautious to ensure they understand how the system works and that the equipment will be supported for the long term.
Have a backup plan. Even when due diligence and risk assess-ments are performed, unforeseen circumstances can still arise that threaten project success. A number of PIs reported partners dropping out at the last minute and having to recruit new partners to take their place. One PI noted that there were so many fluctua-tions with partner commitments in the early stages of the project, that they decided to start making partner selections for preferred projects and backup projects at the same time. This allowed them to quickly move down the list of qualified applicants should anyone opt to not partic-ipate. It also prevented lengthy project delays associated with waiting for subsequent meetings and agenda openings with their board of directors.
In most cases, Clean Cities coalitions were well positioned within their communities to know of other fleets that were ready to proceed with a project and who could backfill an opening as a replacement partner. Because of their close relationship to DOE and national lab experts, Clean Cities coalitions were also instrumental in helping partners find replacement vendors or arrange technical assistance in the event that original vendors went out of business or were unable to develop satisfactory solutions to issues.
Use of strong contractual language and performance payments can help to ensure quality work is performed on time, every time. Including contractual terms and conditions specific to infrastructure and equip-ment installation will help to ensure that work is performed correctly, safely, and to the satisfaction of the customer. It is a best practice to include an evaluation period as part
Pro TipConsistent roles and responsibilities make it easy for project partners to know who to contact.
Pro TipLegal experts were able to significantly strengthen contractual language that made it easier for project managers to enforce reporting requirements and enact penalties for non-compliance.
Pro TipKeep a list of qualified fleets that may be interested in a project if an opening for a replacement partner comes available. Also, be ready to help project partners find replacement vendors or arrange technical assistance in the event that original vendors go out of business or are unable to develop satisfactory solutions to issues.
Pro TipInclude an evaluation period as part of any written agreement with third-party vendors or equipment installers to safeguard that the equipment is operating as intended prior to final payment.
Pro TipBe extra cautious to ensure fleets understand how the system works and that they are able to find continued support for their vehicles.
VEHICLE TECHNOLOGIES OFFICE | cleancities.energy.gov12
DESIGNING A SUCCESSFUL TRANSPORTATION PROJECT
of any written agreement with third-party vendors or equipment installers to safeguard that the equipment is operating as intended prior to final payment. For example, fleets intending to convert a significant number of vehicles should allow time for the fleet to be converted in waves in order to conduct independent testing and inspection on each batch of conversions. This way, the fleet can choose to proceed with the remaining conversions and final payments only when the initial conversions are operating as intended and approved by the fleet. Another best practice is to include periodic inspections as part of your contract with a vendor. This provides the opportunity for “spot checks” to be performed throughout the project and across several waves of conversions to ensure continued installation quality and the adherence to established procedures.
Project management capabilities will grow with experience. Many PIs felt very competent and capable from the beginning, but later encountered unusual issues that challenged them to learn new skills and expand their capabilities going forward.
Other PIs noted that these projects taught them when and where they needed to slow down, especially with smaller companies who were not accustomed to doing this kind of work. Taking the time to work through questions
and concerns with inexperienced participants early on can avoid confusion later. Most PIs indicated they now have a better barometer for when they are in over their heads and require outside or expert assistance. Countless technical and problem-solving resources are available through the Clean Cities program. Oftentimes, the earlier these resources are engaged, the easier it is to tackle the problem or obstacle that a fleet is encountering.
ConclusionThe Clean Cities Recovery Act projects created significant and lasting change by signaling the emergence of alternative fuels markets where none had existed before. Project activities spanned 45 states and included nearly 700 unique partners, giving many of these fleets their first experience with AFVs. These projects led to conversations about alternative fuels that brought other fleets into the market and were often the catalyst for new alternative fuel incentive programs that proceeded in the absence of further federal funding. The best practices and lessons learned from these projects will be useful to others who are embarking upon transportation deployment projects in the future. Additionally, the nationwide network of Clean Cities coa-litions and corresponding support staff from DOE and national laboratories proves very valuable in assisting in the development and optimization of such projects.
Pro TipTaking the time to work through questions and concerns with inexperienced participants early on can avoid confusion later.

DESIGNING A SUCCESSFUL TRANSPORTATION PROJECT
VEHICLE TECHNOLOGIES OFFICE | cleancities.energy.gov13
ReferencesJohnson, C., Singer, M. (2016). Clean Cities 2015 Annual Metrics Report. Golden, CO: National Renewable Energy Laboratory.
U.S. Department of Energy. Emissions from Hybrid and Plug-in Electric Vehicles. Retrieved February 13, 2017, from Alternative Fuels Data Center: http://www.afdc.energy.gov/vehicles/electric_emissions.php
U.S. Department of Energy, Vehicle Technologies Office. (n.d.). Clean Cities Goals and Accomplishments. Retrieved September 26, 2016, from Clean Cities: https://cleancities.energy.gov/accomplishments/


For more information, visit: cleancities.energy.gov
Clean Cities Technical Response Service 800-254-6735 • [email protected]
To view this and other Clean Cities publications online, visit cleancities.energy.gov/publications.
Prepared by the National Renewable Energy Laboratory (NREL), a national laboratory of the U.S. Department of Energy, Office of Energy Efficiency and Renewable Energy; NREL is operated by the Alliance for Sustainable Energy, LLC.
DOE/GO-102017-4955 • September 2017
Cover photo by Samantha Bingham/The Chicago Area Alternative Fuel Deployment Project, NREL 42821