designer buildings: an evaluation of the price impacts of signature architects franz fuerst, pat...
TRANSCRIPT

Designer Buildings: An Evaluation of the Price
Impacts of Signature ArchitectsFranz Fuerst, Pat McAllister and Claudia Murray
University of ReadingHenley Business School
School of Real Estate and Planning

Research Question
Do offices designed by architects who have won the AIA Gold Medal and/or the Pritzker Prize command a rental premium?
More specifically: Whether, ceteris paribus, commercial offices designed
by signature architects achieve rental premiums compared to commercial offices designed by non-signature architects

DEFIN
ITION
S: ARCHITECTU
RE AND
FAME
AwardsCompetitions.
Publications.Buildings
Focus?Size?Client?

DEF
INIT
ION
S: A
WAR
DS
PRIT
ZKER
PRI
ZEAI
A G
OLD
M
EDAL
To honour a living architect whose built work demonstrates a combination of those qualities of talent, vision, and commitment, who has produced consistent and significant contributions to humanity and the built environment through the art of architecture.
The Gold Medal is the highest honor that the American Institute of Architects can bestow on an individual. It is conferred by the national AIA Board of Directors in recognition of a significant body of work of lasting influence on the theory and practice of architecture.
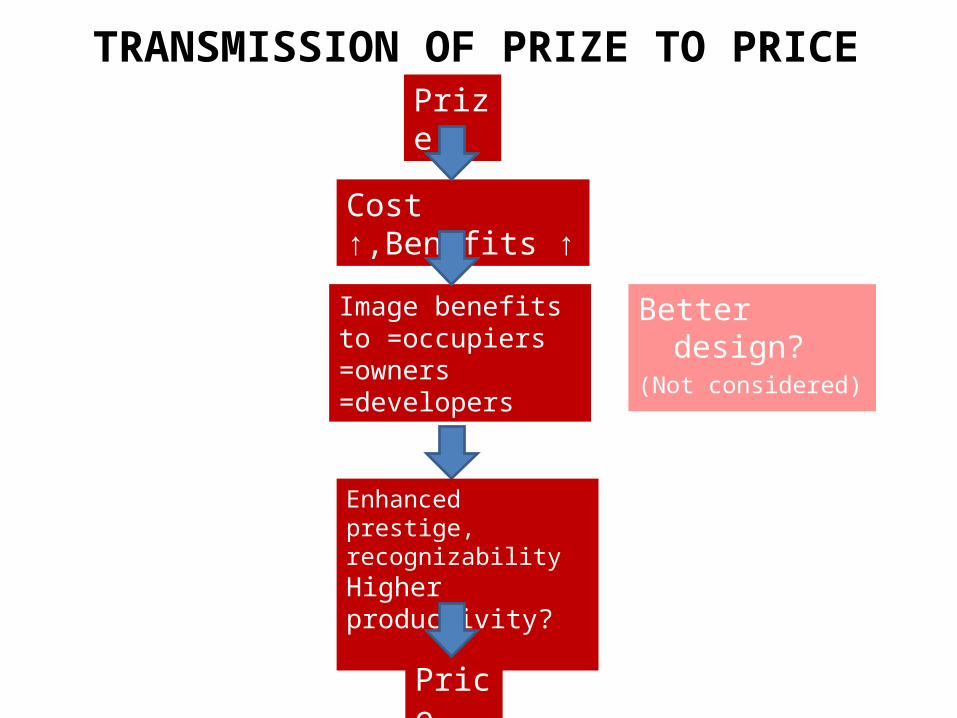
TRANSMISSION OF PRIZE TO PRICE
Better design?(Not considered)
Cost ↑,Benefits ↑
Prize
Image benefits to =occupiers=owners=developers
Enhanced prestige, recognizability Higher productivity?
Price

PREVIOU
S EMPIRICAL RESEARCH
Hough and Kratz (1983) Sample: Rents 139 National and/or Chicago designated landmarks in Chicago. Method: Hedonic regressionFindings: Premium only for newer landmark offices , for older buildings the coefficient was negative in all model specifications but insignificant.
Vandell and Lane (1989) Sample: Rents and vacancy rates of 55 Class A office buildings in Boston and Cambridge, Massachusetts. Method: Examined the relationship between aesthetic qualities and rents/vacancy rates. Findings: Buildings rated in the highest quintile in terms of aesthetics had rents that were 22% higher than buildings rated in the lowest quintile controlling for differences in location, number of stories etc.
Gat (1998) Sample: 50 office buildings in Tel Aviv, rents, physical and location features. Method: Hedonic regression, rating of building and design quality by architects. Findings: Marginal contribution of quality of architecture variable of 5.4% ---highest of a non-location variable in the model.

RESE
ARCH
MET
HO
DS
AN
D D
ATA This study draws on CoStar's comprehensive national database
We have identified 490 office buildings designed by signature architects.
In order to identify a control sample against which to compare the sample of buildings designed by signature architects, we have drawn upon the CoStar database (10,500 properties with full set of variables in our sample).
(1) Hedonic regression modeling enables researchers to isolate the relative contribution of an attribute (or a bundle of attributes) and estimate the price effects.
(2) Logistic regression: can be used to identify a suitable peer group based on probability scores.
(3) Manual selection from database. Requires close inspection of property details and available comparables.
DAT
A:
C
oSta
rM
ETH
OD
OLO
GY
MET
HO
DO
LOG
ICAL
ISSU
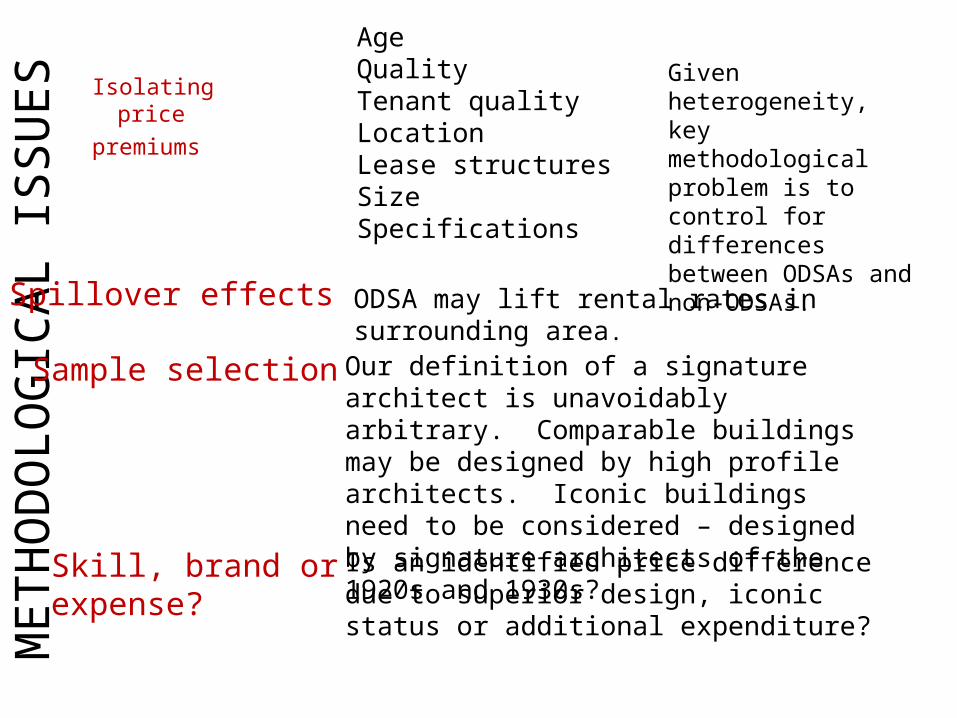
ESIsolating pricepremiums
AgeQualityTenant qualityLocationLease structuresSizeSpecifications
Given heterogeneity, key methodological problem is to control for differences between ODSAs and non-ODSAs.
ODSA may lift rental rates in surrounding area.Spillover effects
Sample selection Our definition of a signature architect is unavoidably arbitrary. Comparable buildings may be designed by high profile architects. Iconic buildings need to be considered – designed by signature architects of the 1920s and 1930s?
Skill, brand or expense?
Is an identified price difference due to superior design, iconic status or additional expenditure?
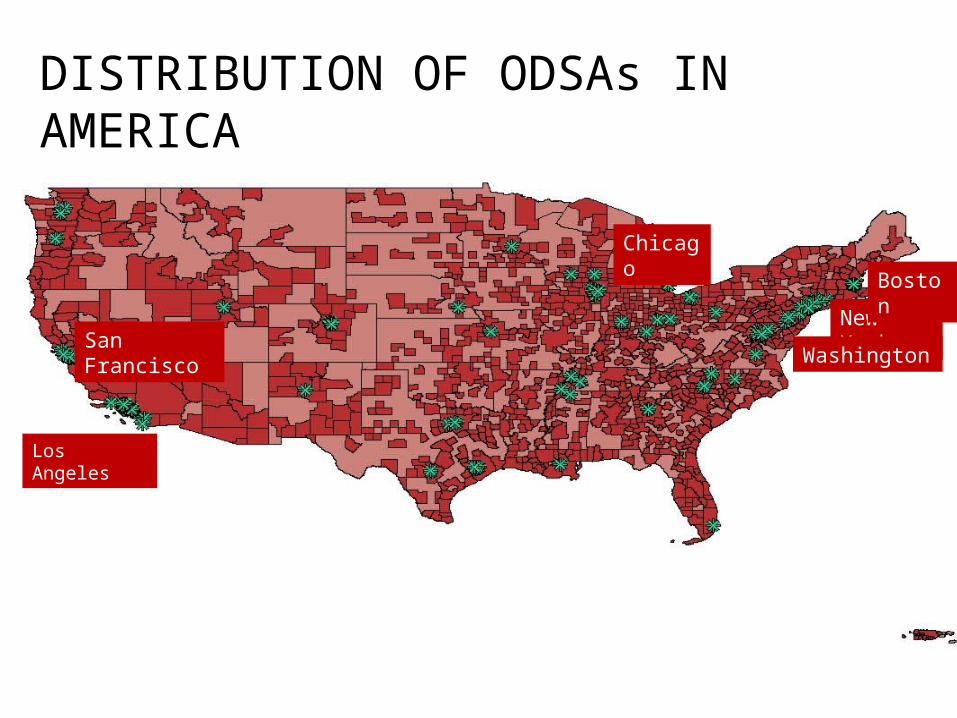
New York
DISTRIBUTION OF ODSAs IN AMERICA
Los Angeles
Washington
Chicago
Boston
San Francisco
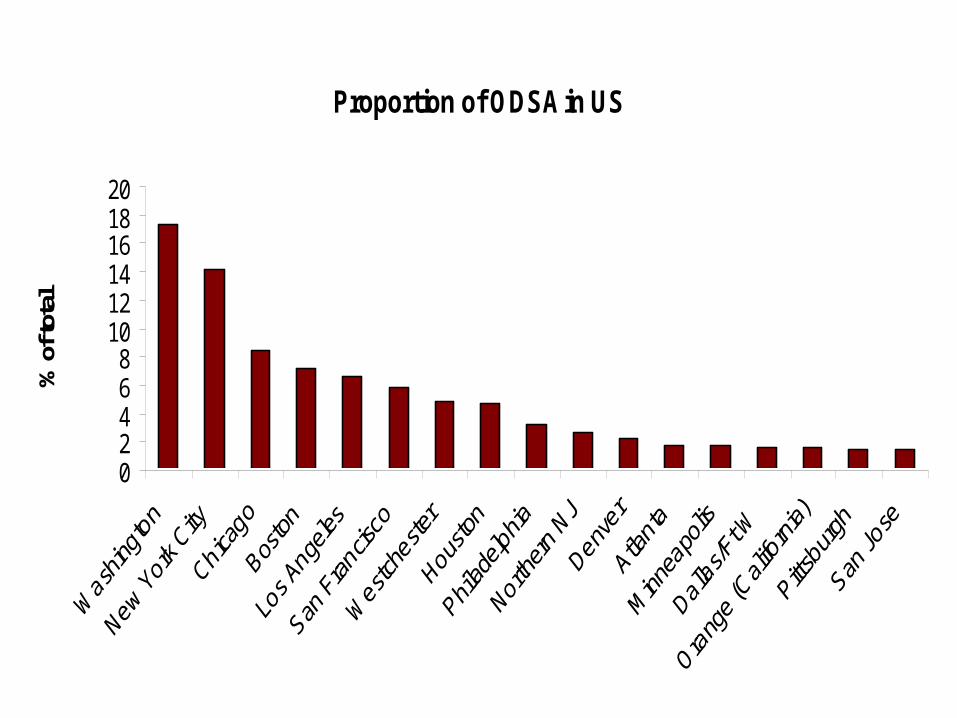
Proportion of ODSA in US
02468
101214161820
% o
f tot
al

BASIC DESCRIPTIVE STATS
ODSA (median) Non-ODSA (median)
Rent psf $26.7 $18
Price psf $215 $115
Size 362,771 10,800
Storey 16 2
Age 21 23
Plot Size 1.54 1.16
Occupancy Rate 93.7 79.8
N Variable Variable
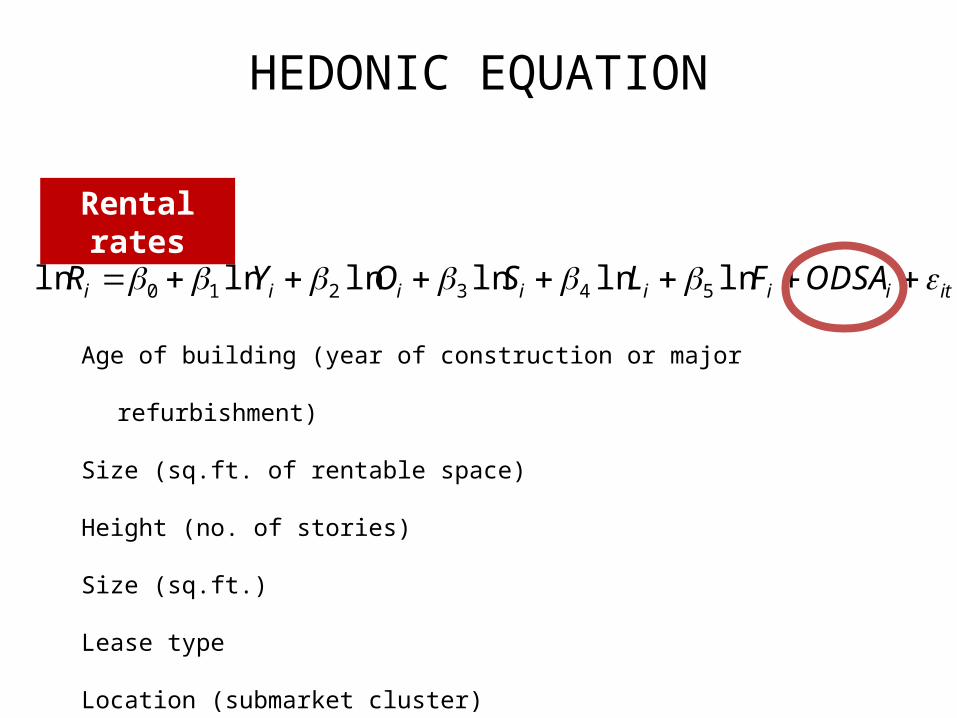
HEDONIC EQUATION
itiiiiiii ODSAFLSOYR lnlnlnlnlnln 543210
Rental rates
Age of building (year of construction or major refurbishment)
Size (sq.ft. of rentable space)
Height (no. of stories)
Size (sq.ft.)
Lease type
Location (submarket cluster)
Building quality
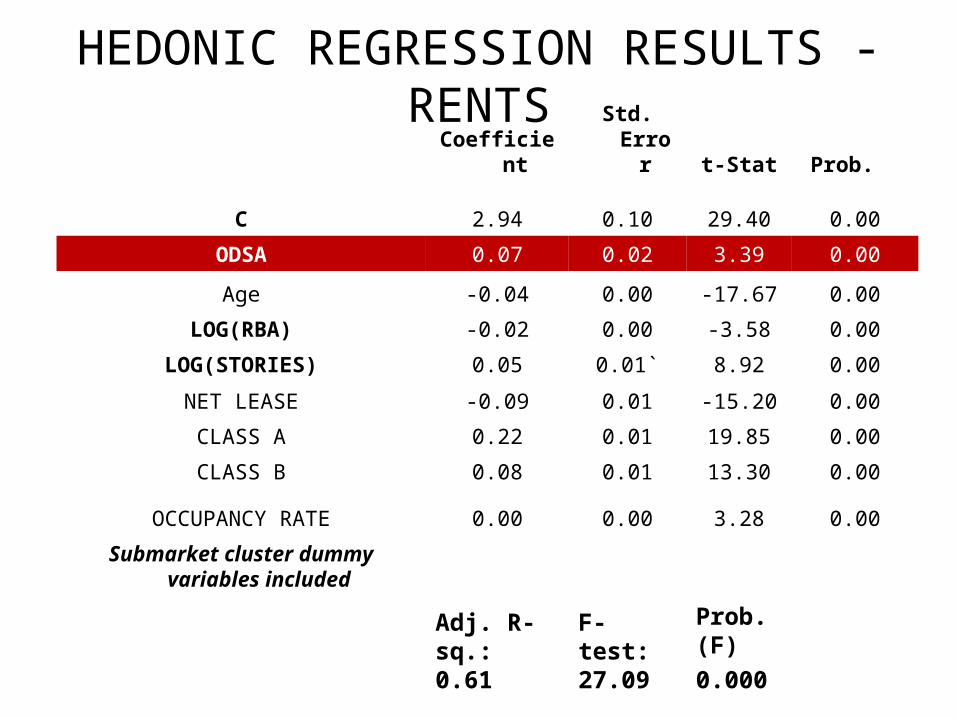
HEDONIC REGRESSION RESULTS - RENTSCoefficient Std. Error t-Stat Prob.
C 2.94 0.10 29.40 0.00
ODSA 0.07 0.02 3.39 0.00
Age -0.04 0.00 -17.67 0.00
LOG(RBA) -0.02 0.00 -3.58 0.00
LOG(STORIES) 0.05 0.01` 8.92 0.00
NET LEASE -0.09 0.01 -15.20 0.00
CLASS A 0.22 0.01 19.85 0.00
CLASS B 0.08 0.01 13.30 0.00
OCCUPANCY RATE 0.00 0.00 3.28 0.00
Submarket cluster dummy variables included
Adj. R-sq.: 0.61
F-test: 27.09
Prob. (F)0.000

REGRESSION RESULTS – MID-TOWN RENTSCoefficient Std. Error t-Stat Prob.
C 3,43 1.09 3.15 0.00
ODSA 0.09 0.08 1.10 0.27
AGE -0.11 0.06 -1.79 0.08
LOG(RBA) 0.00 0.06 0.05 0.96
LOG(STORIES) 0.02 0.11` 0.17 0.87
OCCUPANCY RATE 0.18 0.20 0.91 0.37
Submarket cluster dummy variables included
N=80Adj. R-sq.: 0.32
F-test: 2.14
Prob. (F)0.02
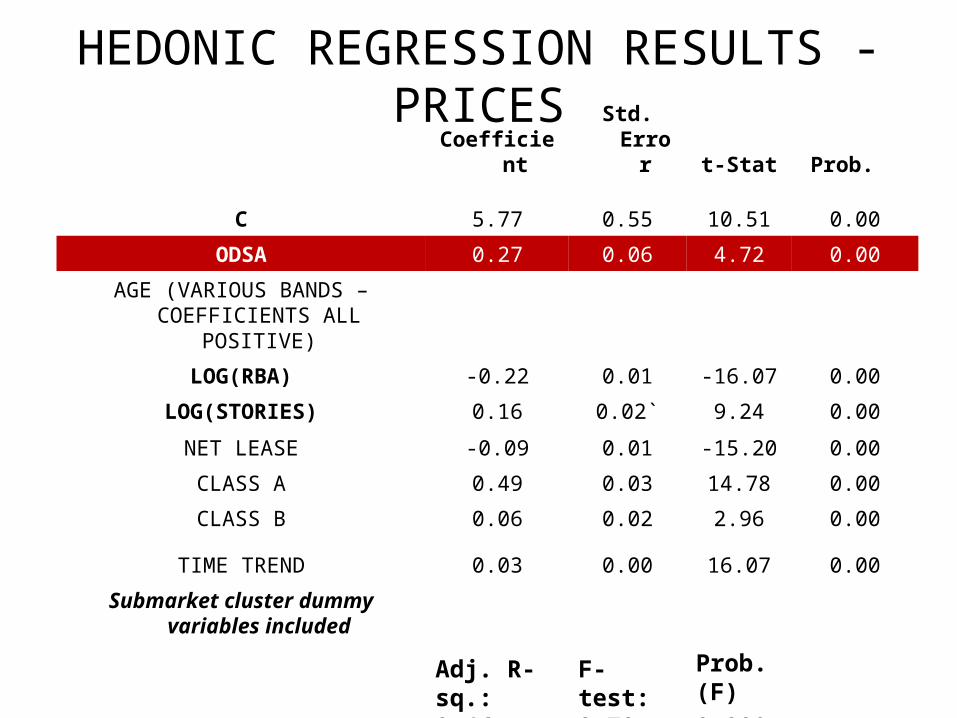
HEDONIC REGRESSION RESULTS - PRICESCoefficient Std. Error t-Stat Prob.
C 5.77 0.55 10.51 0.00
ODSA 0.27 0.06 4.72 0.00
AGE (VARIOUS BANDS – COEFFICIENTS ALL POSITIVE)
LOG(RBA) -0.22 0.01 -16.07 0.00
LOG(STORIES) 0.16 0.02` 9.24 0.00
NET LEASE -0.09 0.01 -15.20 0.00
CLASS A 0.49 0.03 14.78 0.00
CLASS B 0.06 0.02 2.96 0.00
TIME TREND 0.03 0.00 16.07 0.00
Submarket cluster dummy variables included
Adj. R-sq.: 0.46
F-test: 8.70
Prob. (F)0.000

Logit function
0.0
0.2
0.4
0.6
0.8
1.0Probability of ODSA
xLogistic regression: Maximum likelihood function, probability (P) constrained between 0 and 1

Results of Logistic Regression
Observed
Predicted
signaturePercentage
Correct0 1Step 1 signature
0 11,015 86 99.2 1 176 201 53.3
Overall Percentage97.7
a. The cut value is .500

Results of Logistic Regression
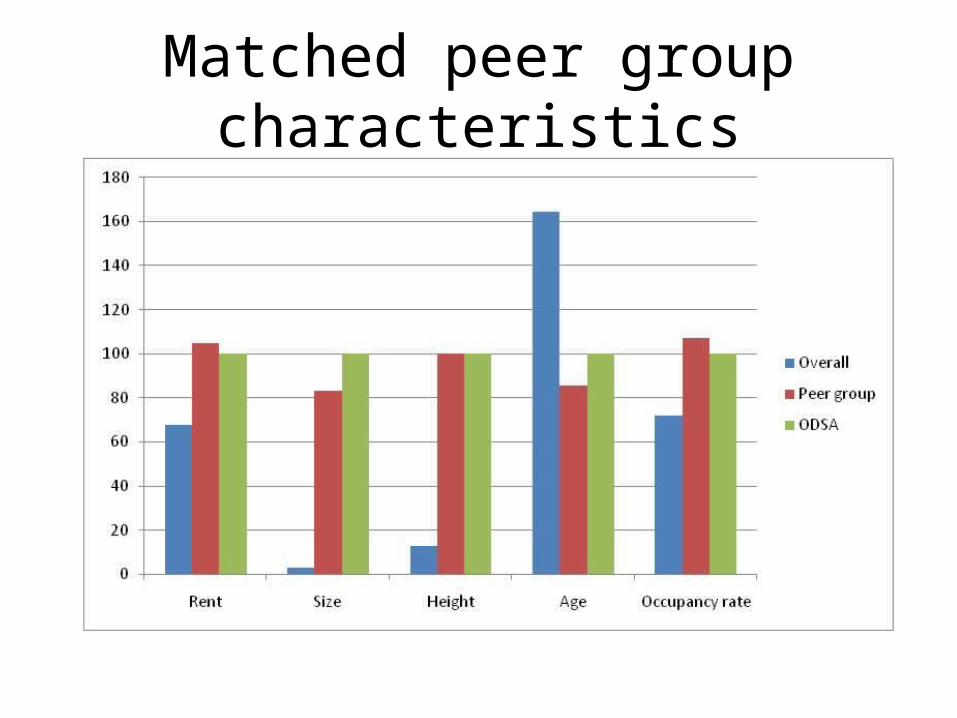
Matched peer group characteristics

RESULTS USING LOGIT GENERATED SAMPLE
ODSA sample
Rent Size (sq.ft.) Stories Year built Year renovated
Land area
% leased
N 276 479 478 472 109 480 480
Mean 33.67 543,071 22.42 1980 1993 6.58 88.79
Median 26.65 378,538 16.00 1984 1995 1.55 93.70
Matched sample (p>0.13)
Rent Size (sq.ft.) Stories Year built Year renovated
Land area % leased
N 277 408 408 408 123 408 408
Mean 34.7 502,191 19.76 1982 1996 4.76 88.42
Median 27.94 315,749 16.00 1986 1998 1.81 95.72
CONCLUSIONS/ FURTHER WORK
• Hedonic analysis suggests a rent premium but peer group analysis based on results of logit model is inconclusive (raw averages vs. probability weighted)
• Model sales transaction prices• Obtaining close comparables by manually selecting
suitable properties from the CoStar database for each ODSA (case studies of NYC, LA and Chicago)
• More in-depth study of specific contribution of signature architects required

CONCLUSIONS/ FURTHER WORK
• More comprehensive assessment of overall added value of signature architecture: Neighbourhood externalities, quality of interior space etc.