design of seed coatings connecting polymer properties with...
TRANSCRIPT

Design of Seed Coatings –
Connecting polymer properties with overall performance through method development
Master of Science Thesis
Jana-Kathrin Roth Department of Chemical and Biological Engineering Division of Applied Surface Chemistry CHALMERS UNIVERSITY OF TECHNOLOGY Gothenburg, Sweden, 2014

Master of Science Thesis
Design of Seed Coatings –
Connecting polymer properties with overall performance through method development
Jana-Kathrin Roth
Examiner: Prof. Krister Holmberg Supervisor 1: Dr. Peter Westbye
Supervisor 2: Mikael Widell
This work was performed at AkzoNobel Surface Chemistry, Agro Applications
in Stenungsund, Sweden
Department of Chemical and Biological Engineering CHALMERS UNIVERSITY OF TECHNOLOGY
Gothenburg, Sweden 2014

Abstract
This thesis is supposed to provide information about possible film-forming polymers which can come
into consideration as suitable candidates for seed treatment formulations which perform preferably
well at low concentrations and to find out which properties are important for a good coating. The
major aim with a seed coating is to reduce the amount of agrochemicals needed and to improve the
properties in comparison to the already existing coatings.
Another task in this thesis was to find a surface which can serve as a model surface for seeds to carry
out surface treatment tests and as doing so simplifies film homogeneity and adhesion evaluation of
the film. To find a possible surface morphologies and roughnesses were determined with an AFM for
different surfaces, contact angle measurements were taken through and absorption tests were
implemented.
For the surface tests thirty different polymers and copolymers as possible candidates in seed
treatment were tested on a fatty acid surface at concentrations of 0.5 % and 5 % in a fungicide
dispersion. These polymers are mainly based on polyacrylates, polystyrenes or starch. In order to
obtain the properties of these polymers molecular weights, glass transitions, gloss, rheology-profiles
and moisture-uptake were determined. To get an overview of the huge amount of data and connect
the film properties (homogeneity and adhesion) to the polymer properties MVDA was used.
As best film-former polymers concerning film homogeneity and adhesion at concentrations of 0.5 %
a.i. PMAA-bA-MMA, PMMA-N-HM, PMA-AA-N and Alcoxylate resulted in giving the best results (but
also high viscosity polymers like PAA 3 and 4, Cellulose-polymer 1 and 2 gave good results). At 5 % a.i.
the results were also better for PUR-PAA, PAA 2, PAA-PS, PAA-HM-N and PAA-MA-N 2 in addition to
the already mentioned ones at 0.5 % a.i.. These results are based on a score in adhesion and
homogeneity giving at least a 10 in a sum where both can have a score between 0 and 7 and have at
least 4 in one of these for coming in consideration.

Table of Contents
1. Introduction .................................................................................................................... 1
2. Theory ........................................................................................................................... 2
2.1 Seed treatment ....................................................................................................... 2
2.2 Coating of seeds ..................................................................................................... 2
2.3 Seed surface composition and morphology ............................................................ 3
2.4 Adhesion mechanisms and film formation ............................................................... 4
2.4.1 Mechanical interlocking .................................................................................... 4
2.4.2 Chain entanglement ......................................................................................... 4
2.4.3 Electrostatic interactions .................................................................................. 4
2.4.4 Chemical adhesion .......................................................................................... 4
2.4.5 Film formation .................................................................................................. 5
2.4.6 Block copolymer films ...................................................................................... 5
2.4.7 Parameters which influence film formation ....................................................... 6
2.5 Multivariate Data Analysis ....................................................................................... 7
2.5.1 Principal Components Analysis (PCA) ............................................................. 8
2.5.2 Projections to latent structures by means of partial least square (PLS) ............ 9
3 Materials and Methods ................................................................................................. 10
3.1 Materials ............................................................................................................... 10
3.1.1 Model surfaces .............................................................................................. 10
3.1.2 Polymer film formers ...................................................................................... 10
3.1.3 Agrochemical Active ...................................................................................... 11
3.2 Methods ................................................................................................................ 11
3.2.1 DSC – Determination of Tg ............................................................................. 11
3.2.2 SEC – Determination of Mw and Mn ................................................................ 11
3.2.3 Moisture pick-up test ...................................................................................... 12
3.2.4 Dynamic Contact Angle ................................................................................. 12
3.2.5 Atomic Force Microscopy ............................................................................... 12
3.2.6 Dry-in time of water droplets on the surfaces and absorption ......................... 13
3.2.7 Karl-Fischer Titration – Determination of water content .................................. 13
3.2.8 Rheology ....................................................................................................... 13
3.2.9 Film applicator ............................................................................................... 13
3.2.10 Tape adhesion test and evaluation ................................................................ 14
3.2.11 Film homogeneity evaluation ......................................................................... 15

3.2.12 Gloss ............................................................................................................. 16
4 Results and Discussion ................................................................................................ 17
4.1. Seed surface and model surface investigation .......................................................... 17
4.1.1 Surface morphologies of the seed and different substrates ............................ 17
4.1.2 Contact angles, Dry-in time and Absorption on the surfaces .......................... 18
4.2 Film formers and their properties .......................................................................... 19
4.2.1 Adhesion and Film homogeneity .................................................................... 19
4.2.2 Glass transition Tg, Molecular weight Mw, Mn, PDI and Gloss ........................ 21
4.2.3 Moisture pick-up ............................................................................................ 24
4.2.4 Rheology behaviour at different water contents ............................................. 26
4.3 Multivariate Data analysis ..................................................................................... 28
4.3.1 PLS – Film homogeneity ................................................................................ 28
4.3.2 PLS – Adhesion ............................................................................................. 31
5 Conclusion ................................................................................................................... 34
6 Future Work ................................................................................................................. 35
7 Acknowledgement ........................................................................................................ 36
8 References .................................................................................................................. 37

1
1. Introduction In times of increasing world population and with that the need of increased production rates the
market for seed treatment is increasing continuously, especially for fungicides. Concerning the world
production of oil seeds soybeans reach an amount of 56 % (2009) which make them to one of the
most important crop. Especially in North-and South America and Asia the production rate is high for
soybeans and they are used beside industrial applications in “food preparation and animal feed”.
Therefore it is important to improve the harvest by for instance more efficient seed treatments
(Pratap, et al., 2012) and the usage of pre-coating application which is more environmentally friendly
than the previous used methods. The seed treatment should be suitable for many kinds of seeds.
Even the variety in anatomies among seeds is huge soybeans are at least comparable to pea seeds.
(Niemann, 2013) On the other hand the composition of the outer seed coats should be similar for all
kinds of seeds since they have to fulfil the same function.
Not that much research has been done in the area of seed coating application yet and therefore it is
important to focus more on the improvement of seed treatment formulations with the aim to
achieve formulations which are effective and have a low impact on the environment to guarantee
sustainability. As additives for agrochemicals polymers and copolymers are promising candidates for
seed coatings which are supposed to improve the adhesion and homogeneous distribution of the
agrochemical active on the seeds and reduce dust formation. (Silva, et al., 2013) Moreover, seed
coating in pre-treatment should result in less need of agrochemicals because of fewer losses in
comparison to the spray application on the field. (Knowles, 2005) Important is that seed coating
does not influence the activity of the active ingredient and the process of germination. (Silva, et al.,
2013)

2
2. Theory In order to develop a seed treatment formulation the surfaces of seeds have to be understood and
the properties of the formulations have to be connected to the seed surface. That contains a deeper
knowledge about the interactions which can take place at the surface and therefore the chemical
composition of a seed surface has to be studied. Also the surface structure has to be taken into
consideration since it influences the distribution of the seed treatment formulation and in which
extend mechanical adhesion can take place.
2.1 Seed treatment To prevent seeds from fungal decay which can also result in infection of other seeds and finally in a
poor harvest, pesticides are used to ensure a high production rate. The aim is a better protection of
the seeds with influencing the environment as little as possible.
A relatively new method in seed treatment is the usage of coating application instead of spray
coating. The major reason for this is that less agrochemical have to be used to get the same effect
since fewer losses are present which can be explained by that spray happens directly on the field
which results in that the agrochemical is not just targeting the plants but also the soil and smaller
droplets can be transported to neighbouring fields by drifting processes. In pre-treatment the seeds
are mixed with a pesticide suspension before they are spread on the field. The impact on the field
area of the pre-treated seeds in comparison to the spray-coated seeds is by one hundred
magnitudes less which is not just better for the environment but also reduces with that the wastage
of the agrochemical which reduces costs. (Knowles, 2005)
2.2 Coating of seeds Seed coating means that a seed treatment formulation is applied to a seed surface usually together
with polymer or copolymer film former by mixing the seeds with the suspension. Beside the already
mentioned issue that less agrochemical active is needed it should also result in better adhesion of
the agrochemical active on the seed surface and less dust formation when seed friction occurs
during transport. Moreover, the adhesion between the seeds should be supressed by the coating, so
that increased humidity is not resulting in agglomeration of the seeds. Therefore the film former
should also not be hygroscopic. Important is also that the polymer is not affecting the efficiency of
the agrochemical active in a negative way and that the germination of the seed is not supressed.
(International Speciality Products Inc.)

3
2.3 Seed surface composition and morphology The composition and surface structure of seeds is of great importance in order to understand the
surface properties of seeds. According to Shao et. al. the outer seed coat cutin contains mainly out
of fatty acids (C16, C18*), 2-hydroxy fatty acids (C16*) and -hydroxyl fatty acids (C16*) and the
average ratio between fatty acid content and hydroxylated fatty acids content was determined as
1/1.1 for soybeans and should be similar for other kinds of beans. In comparison to most other
plants’ cutins mid-chain hydroxylated fatty acids are absent in soy bean seed coats. On the other
hand the outer cuticle wax’ main components are fatty acids (C16, C18, C20*), n-alkanes (C27, C29,
C31*), 1-alkanoles (C26, C28*) but just traces of hydroxylated fatty acids could be found here. (Shao,
et al., 2007). (Niemann, 2013). The total amount of the cuticular waxes of a pea seed coat is 1.34
µg/cm-1 and 2.5 µg/cm-1 for soybeans which is much lower than in their leaves. In total the lipid
content reaches 320 µg per seed coat in a pea seed. (Niemann, et al., 2013). (*The chain lengths
were determined for a pea seed.)
A cross section through the seed surface shows which cell layers are present in the seed coat (fig. 1).
The outermost layer is the cuticle which covers the palisade cells which are dead cells as well as the
following hourglass cells. The next layers consist of crushed parenchyma, aleurone and finally
crushed endosperm cells. (Shao, et al., 2007) The palisade layer is the critical layer which determines
the permeability of water by causing small cracks in the cuticle having a diameter of 1-5 µm and a
length of 20–200 µm which are creating a pathway for water. According to Ma these cracks are
caused by stress on the palisade layer for instance by humidity and/or temperature. Cracks are just
present on soft seeds. (Ma, et al., 2004)
Concerning the surface structure of soybean seeds previous studies have been done with SEM by
Shao et. al.. As can be seen in fig. 2 there are endocarp deposits on the surface. (Shao, et al., 2007)
Figure 1: SEM image of a soybean seed surface, * = cuticle, ► = endocarp material (scale 15 µm) (Shao, et al., 2007)
Figure 2: Cell layer section through a soybean seed coat: c=cuticle layer, p=palisade layer, h=hourglass layer, pa=compressed parenchyma cells, a=aleurone, em: crushed endosperm (Moïse, et al., 2005) (Niemann, et al., 2013).
c

4
2.4 Adhesion mechanisms and film formation Adhesion is of major importance at the interface between a surface and an applied film and different
contributions have to be fulfilled to obtain a good and lasting adhesion. The first step is that the
wettability of the surface is high for the film which is a result of a low contact angle of the film
forming fluid and with that a homogenous distribution of the film. The possible adhesion
mechanisms will be described in the following.
Figure 3: (A) Mechanical interlocking, (B) Interdiffusion, (C) Electrostatic interactions, (D) Chemical adhesion (Garbassi, et al., 1998)
2.4.1 Mechanical interlocking
Mechanical interlocking occurs when the surface has a rough and/or porous structure which gives
the film forming polymer the opportunity of building a solid anchor in these pores after drying.
(fig. 3a) (Garbassi, et al., 1998)
2.4.2 Chain entanglement
Chain entanglement means that long chains or segments of the surface and the applied film
interdiffuse (fig. 3b). The condition therefore is that the polymers have to be above their Tg or in
solution to make such movements possible whereas the degree of interdiffusion is also strongly
dependent on their compatibility. (Garbassi, et al., 1998)
2.4.3 Electrostatic interactions
Electrostatic interactions exist in a form of a double layer which builds up at the interface and results
in an attractive force between the surfaces (fig 3c). Therefore an imbalance of charges between the
surfaces is required. Depending on the availability of charge carriers these interactions can be in the
range of Van der Waals forces or even stronger. (Garbassi, et al., 1998)
2.4.4 Chemical adhesion
Beside the more mechanical adhesion mechanisms, chemical interactions are of great importance
(fig. 3d). They can consist of interactions between the surfaces like Van der Waals Forces which are
considered as dispersion forces, dipole-dipole interactions or dipole-dipole induced interactions but
they are of higher range but of much lower strength than ionic and covalent bonds. These bonds
cause the highest strength in chemical adhesion. Hydrogen bonds have a similar strength as Van-der
Waals forces and also a higher range than ionic and covalent bonds but attraction happens at closer
distances of the surfaces than Van-der Waals forces. (Garbassi, et al., 1998)
(A) (B ) (C) (D)

5
2.4.5 Film formation
Film formation of polymers is strongly depending on which polymer is chosen meaning how
interactions between the chains are taking place. In solution the polymer particles are separated
arising from stabilizing and/or electrostatic forces. By the evaporation of water the particles are
forced to approach each other to form a film. This process can be divided into three steps which are
shown in fig. 4. After applying the polymer solution on a surface the first step is the evaporation of
water which results in concentration of the particles. In step II the particles have reached such close
contact that this condition is irreversible and the evaporation of water is no longer linear. Here,
particle deformation takes place until the process of coalescence is completed. In the final step the
remaining water removes through channels and diffuses through the polymer surface where it
evaporates. Besides, interdiffusion of polymer chains occurs and a homogenous film is formed.
(Steward, et al., 2000)
Figure 4: Water loss during film formation (Steward, et al., 2000)
2.4.6 Block copolymer films
Block copolymers consist in comparison to homopolymers of different monomer units. Because of
their different chemistry they tend to self-assembly into microdomains. This process is driven by the
positive enthalpy and low mixing entropy of the blocks. To build up a homogenous film they have to
fulfil certain conditions. A homogenous film is obtained if a copolymer which is consisting of for
instance block A and block B and one block segregates to the surface and the other one to the
interface (fig 5(A)) then the film thickness can be determined by h = (n+1/2)L0 where n is an integer
and L0 is the period of the microdomain morphology. Moreover, a homogenous film is obtained if a
copolymer have A or B at the surface and interface (fig 5(B)). Then the film thickness can be
determined by h = nL0. If either the first or the second formula is satisfied the film will be smooth and
considered symmetric wetting otherwise the film is consisting of holes, islands or builds up a
bicontinous phase which can be considered as asymmetric wetting (fig 5(C)-(F)). (Wang, et al., 2008)

6
Figure 5: (A ) and (B): symmetric wetting, (C): asymmetric wetting (D)-(F): surface topographies if asymmetric wetting is the case (Wang, et al., 2008)
2.4.7 Parameters which influence film formation
There are parameters which have an influence on film formation meaning they influence for
instance the possibility of chain movements by a low glass transition temperature. Also molecular
weight, viscosity and functional groups which are able to pick up water are of importance. In the
following possible effects are be mentioned.
Concerning the glass transition temperature Tg, which is the temperature where the polymer
transfers from a glassy to a rubberlike state, the chains in the polymer are able to move fast above
this temperature but becoming slower the closer the polymer comes to its glass transition
temperature since the thermal energy is not sufficient enough to “overcome the rotational energy
barriers in the chain” anymore. (Cowie & Arrighi, 2008) As a result the polymer chain diffusion is
very low in the glassy state which is of disadvantage during film formation and makes film
homogeneity more difficult (Soleimani, et al., 2012). However, water can still work as a plasticizer
and as the polymer is in solution it is not a problem as long as enough water is present. Moreover, if
the Tg value is not that much higher than the user temperature it can have a positive influence on
the film formation since there is a certain movement of chains below the Tg since the glass transition
is a slow process from movement of some chains to movement of all chains where the Tg value is
just a mean value. (Cowie & Arrighi, 2008)
7
Furthermore functional groups matters for film homogeneity, not only for creating bonds among
each other but also for picking up water. To be able to absorb water hydrophilic groups like –OH, –
NH2, –CONH–, –CONH2, –COOH and –SO3H have to present which have different tendencies to form
hydrogen bonds depending on the hydrophilicity (Thijs, et al., 2007). The reason for the high ability
to pick up water for the sodium acrylates and methacrylates called “super-absorber” is the hydration
of sodium which promote a gel structure and the formation of hydration shells around the polymer
which cause uncoiling of the chains. This leads to a softening of the film according to the plasticizing
effect and results in a certain tackiness which means that the seeds coated with this polymer would
have a higher tendency to stick together during storage. (Nunes, et al., 2000) (Thijs, et al., 2007)
Agglomeration is not wished since they have to be spread separately on the field to avoid hindrances
during growing of the plant.
Looking at the molecular weight of polymers then according to Arda and Pekcan low molecular
weight polymers have a higher packing coefficient because they are more able to close voids with
their shorter chains. As a result wetting can take place easier and interdiffusion of polymer chains
across the interfaces occurs faster (Arda & Pekcan, 2001) On the other hand high Mw polymers have
a better ability to decrease in viscosity meaning their shear thinning effect is higher than for low Mw
polymers during film application due to the decrease of entanglements. (Soleimani, et al., 2012)
Concerning the viscosity of high and low Mw polymers the ones with shorter chains can easily
orientate in flow direction when stress is applied whereas polymers with longer chains need time to
disentangle and show therefore a shear-thinning effect. (Mezger, 2006).
2.5 Multivariate Data Analysis The amount of data concerning properties of substances can be high and it is not possible to
compare them easily and draw a conclusion because of too many dimensions. In this case MVDA is a
good method to solve this problem by summarizing many dimensions in a model of just two
dimensions. (Everitt & Hothorn, 2011) Therefore all measured values are normalized to the same
length and centred (fig. 6). After that procedure two models can be used: The Principal Component
Analysis (PCA) and the Projections to latent structures by means of partial least square (PLS) whereas
the latter builds upon the first one. (Eriksson, et al., 2006)

8
Figure 6: Centering of data (Eriksson, et al., 2006)
2.5.1 Principal Components Analysis (PCA)
The first step in PCA after centering of the data is to find the first principal component (PC1). This
can be defined as a line called score in a coordination system which approximates the data as good
as possible in a matter of least squares. In order to model the systematic variation data in a
satisfying way a second principal component (PC2) is needed which is orthogonal to the first one.
The two components cross each other in the average point and form a plane containing the scores
which are the observations projected on the plane (fig. 7a) resulting in a plot that is called a score
plot. Observations which are close to each other in the plot have similar behaviours and
observations far away from the origin are very different from the average. To get aware of which
variables cause the position of the observations a loading plot is needed which displays the
X-variables (principal component loadings) in the plane of PC1 and PC2. This plot can be divided into
four quadrants whereas opposite ones of the origin include an inverse correlation to each other. In
addition, the further away the loading is from the origin the bigger the impact on the model. As
visualized in fig. 7b the direction of each PC is given by the cosine of three angles α1, α2 and α3
(loading values) which are reflecting the relation to the original variables x1, x2 and x3. (Eriksson, et
al., 2006)
(A) (B)
Figure 7: (A) Plane formed by PC1 and PC2 containing scores, (B) Plane formed by PC1 and PC2 containing the angles which describe the connection of the direction of PC1 to the originial variables

9
To obtain a conclusive plot, the second principle component should be an improvement of the first
one concerning goodness of fit (R2X) and goodness of prediction (Q2X). The first parameter always
increases with the number of components used since the model becomes better with more
coordinates until it reaches the maximum number of 1 where the amount of coordinates is equal to
the number of different descriptors. The second parameter should increase from the first to the
second component but it normally decreases later with the number of components due to cross-
validation. (Eriksson, et al., 2006)
2.5.2 Projections to latent structures by means of partial least square (PLS)
PLS is a further development out of PCA with the difference that at least one Y-variable is added and
all X-variables are related to this one. The loading plot provides information about which descriptors
also called predictors should have a low value and which ones should be high depending on the
position of Y in the plot to obtain good results for the responses Y. From the Y-variable a line can be
drawn through the origin. The closer the X-variables to this line the more important they are for the
Y-variable. The X-variables of the quadrant opposite of the origin to the Y-variable have an inverse
impact on the Y-variable. The X-variables which are furthest away from the origin and close to the
line have the greatest impact on the model. (Eriksson, et al., 2006)
2.5.2.1 Coefficient Plot
A coefficient plot shows in which extent the X-variables have a negative or positive influence on the
Y-variable and their standard deviations. (Eriksson, et al., 2006) This observation can also be done by
comparing the loading plot with the VIP-plot.
2.5.2.2 VIP-plot
A Variable Importance for Projection-plot shows how important a certain X-variable is for the model.
The average VIP is 1, a value lower than 0.5 means that the value is not important. Also the standard
deviation should not be higher than the VIP itself. (Eriksson, et al., 2006)

10
3 Materials and Methods
3.1 Materials
3.1.1 Model surfaces
Different surfaces were chosen for testing the film former-Tebuconazole dispersions with focus on
similarities of the surfaces to a seed surface concerning composition, contact angle, absorption
behaviour and surface morphology. Therefore tefacid tallow has been selected as a promising
surface since fatty acids are one of the major components in the outermost seed layer containing
mostly C16 and C18 fatty acids. (Shao, et al., 2007). Tests were also done with tefacid kokos, mostly
containing C12 and C14 fatty acids which is as doing so a little bit more hydrophilic than tefacid
tallow. Other surfaces like polyethylene foil, sealed paper and parafilm were also chosen to compare
the behaviours of the surfaces in comparison to the seed.
3.1.2 Polymer film formers
For the experiments Tebuconzole SC dispersions were used containing 0.5 % and 5 % active content
of the polymers listed in table 1:

10
Table 1: Film formers: compositions and solid contents (AA=acrylic aid, HEMA=2-hydroxyethylmethacrylate, MA=maleic acid, MAA=methacrylic acid, MMA= methylmethaccrylate,
PS=Polystyrene, PUR=Polyurethane, PVA=Polyvinylacrylate, PVP=Polyvinylpyrrolidone)
Polymer Composition and mole% solids [%]
PAA 1 PAA-Na+/ClO- 44.6
PAA 2 PAA-Na+ 45 PAA 3 PAA-Na+ 13.4 PAA 4 PAA-Na+ (higher MW than PAA 3) 16.3 PAA-HM AA/2-ethylhexyl MAA/2-acrylamido-2-methyl propane sulfonic acid (AMPS), 75/20/5, Na-salt 14 PAA-HM-N AA/ benzyl MAA/2-acrylamido-2-methyl propane sulfonic acid 69/25/6, Na-salt 13.7 PAA-MA???? AA/monomethyl fumarate/HEMA, 88/7/5 35 PAA-MA-N 1 AA/MA/Acrylamide 67/31/2 41 PAA-MA-N 2 AA/MA/Acrylamide 67/31/2 (higher pH than PAA-MA-N 1) 41.2 PAA-MA-VAc AA/MA/Vinylacetat 39/59/2 Na+ 40 PAA-PS PAA/PS 50/50, Na salt 40 PAA-S-MA 1 MA/AA/MMA/ sodium salt of 2-Acrylamido-2-methylpropane sulfonic acid (AMPS-Na+)/Na 19/40/3/4/35 40
PAA-S-MA 2 MA/AA/MMA/ sodium salt of 2-Acrylamido-2-methylpropane sulfonic acid (AMPS-Na+)/ Na 19/40/3/4/35 (higher MW than PAA-S-MA 1)
42.4
PAA-HP AA/hypophoshite 95 PAA-starch AA/ DE 42 corn syrup 88/12 40 PMAA-Polymer PMAA-Na+ 40 PMAA-bA-MMA Emulsion copolymer of MAA/butylacrylate/MMA 12.2 PMMA-N-HM t-Octyl Acrylamide/MMA/hydroxypropyl MAA/t-butyl amino MMA 22/35/11/31 10 PMA-AA-N t-Octyl Acrylamide/Isobutyl MAA/AA 21/46/34 10.3 PUR-PAA PUR/PAA blend 25 PVP-PVA PVP/PVA 54/46 50 Starch-AA-MA DE 10 Maltodextrin/AA-Na+/MA-Na+, Hybrid polymer, 55/10/35 38 PVP-starch PVP/Maltodextrin 58/42 25 Starch derivative modified amylose starch 13.3 Cellulose-pol. 1 Ethylhydroxyethyl cellulose 100 Cellulose-pol. 2 Ethylhydroxyethyl cellulose (higher Mw than Cellulose-pol. 1) 100 Xanthan gum Xanthan gum 100 Alcoxylate Ethylene oxide/Propylene oxide blockcopolymer., butanol 51/45/3 100 PS-S 1 sulfonated PS 30 PS-S 2 sulfonated PS (higher Mw than PS-S 1) 25

11
3.1.3 Agrochemical Active
The film formers were mixed with Tebuconazole SC, a fungicide dispersion containing the chemicals
listed in table 2 whereas Morwet® naphthalene sulfonate serves as wetting and dispersion agent. To
this dispersion an amount of 5 % dye (Neeligran brilliant blue FC granular) was added to mark the
seeds as treated and easily distinguishable from non-treated seeds. (AkzoNobel, 2012)
Table 2: Recipe of Tebuconzole SC
Chemical Percentage
Tebuconazole 25.0 wt%
Morwet® D-425 2.5 wt%
Rhodorsil® Antifoam 426 R 0.2 wt%
Water to 100 wt%
The suspension was prepared with the chemicals listed in table 2. A premixing was done with a rod
mixer to obtain a homogenous distribution of the particles before they were milled to a particle size
of 2-3 µm. Therefore the suspension had to be rinsed seven times through the milling machine
Dyno®-Mill which contains glass beads of a size of 1.5 mm in diameter. The particle size was
measured with a Malvern Mastersizer Microplus which determines the mean diameter of the total
particle volume D (v 0.5). The values before and after milling are listed in table 3.
Table 3: Particle size before and after milling in µm
D(v 0.1) D(v 0.5) D(v 0.9)
Before milling 1.40 7.61 17.31 After milling 0.95 2.94 7.59
3.2 Methods
3.2.1 DSC – Determination of Tg
To get to know if the film former polymers or copolymers are in their glassy or rubberlike state at
user temperature, the Tg was determined for all film formers as far as it was possible with the
METTLER TOLEDO DSC 1. A temperature range from -15°C to 200°C was chosen with a heating rate
of 10°C per minute. The Tg was obtained with the STARe Software therefore
3.2.2 SEC – Determination of Mw and Mn
The molecular weight was determined by size exclusion chromatography. The calibration was
preceded with polyacrylate standards having molecular weights of 1250, 1770, 2500, 7500, 28000,
62 900 g/mol. As eluent a phosphate buffer system containing 5.999 g NaH2PO4 and 7.098 g Na2HPO4
in 2 liters of milli-Q water was prepared and an amount of 30-40 mg of each polymer was solved in

12
10 ml of this solvent. A certain amount of each solution was filled in 1 ml clear glass shell vials for
fitting into the SEC instrument.
For the measurements the following columns where used:
Precolumn: TSKgel PWxI 40x60
Columns: TSKgel 300x7.8 mm (G6000PWxI, G4000PWxI, G3000PWxI, G2500PWxI)
Before running the standards two blank samples were measured to obtain a baseline. After that
every sample was measured two times to be aware of the reproducibility of the measurements. The
flow rate of the eluent was 1 ml/min. The volume taken from each sample was 120 µl. Finally the
standards were measured again. Out of the standards-measurements a calibration curve was
obtained. The size was detected by a refractive index detector.
To get access to the Mw and Mn the areas below the obtained curves (weight vs. time) were
integrated after setting a baseline and a peak area. At retention times higher than 36.5 min only the
solvent peaks could be seen.
3.2.3 Moisture pick-up test
The film formers are weighed in a dried and weighed aluminium pan so that an amount of active
content of approximately 0.5 g is reached. The samples (3 replicates of each film former) are stored
for at least 15 h at 105°C in the oven. After drying, the samples are weighed again and then stored in
a desiccator at 55±5 % RH (magnesium nitrate). The samples are weighed every 24 h if possible until
the weight remained constant. The hygroscopicity is important since high water-uptake can result in
agglomeration of the coated seeds but also can be an indication on the hydrophilicity of the polymer
films, which could have an influence on film adhesion to the substrate.
3.2.4 Dynamic Contact Angle
The dynamic contact angle instrument was used to determine the contact angles of the different
surfaces which might come into consideration for a model surface. Therefore pictures with the video
system FTÅ 200 were taken and the software Fta32 V2.0 was used to determine the contact angle.
The contact angle after 10 s using water as testing liquid was used as equilibrium contact angle.
3.2.5 Atomic Force Microscopy
With AFM (Digital Instruments Santa Barbara, USA) the surface morphology of seeds and surfaces
which come into consideration as a model surface were investigated to find out if the morphology
and roughness of the surfaces are comparable. This aspect is important concerning mechanical
adhesion and film formation property. The measurements were preceded in the tapping mode.
Areas of 15x15 m were measured and surface roughnesses were calculated.
13
3.2.6 Dry-in time of water droplets on the surfaces and absorption
The ability of water-uptake and drying time of a water droplet was evaluated by placing five droplets
with comparable size with a syringe on each of the chosen surfaces. The water was coloured with 1%
dye (Neeligran brilliant blue FC granular) to make it non-transparent. The time until the droplets
were dry was measured and the removability of the dried droplets was evaluated to see if
absorption into the surface has taken place.
3.2.7 Karl-Fischer Titration – Determination of water content
To investigate the drying in effects of different film former-Tebuconazole suspensions on rheology
water had to be evaporated from the solutions. The remaining water content was measured with a
701 KF Titrino (Methrohm). The aim was to obtain solutions with 50 % water content, having an
active content of 0.5 % at the beginning. Therefore samples with different viscosity behaviour where
chosen like shear-thinning, non-shear-thinning and reference samples as well as the pure
Tebuconazole dispersion. The aim was to find out more about the drying in effects of the polymers
by measuring the storage modulus G’ and loss modulus G’’ at different shear stresses with the AR-G2
Rheometer to get knowledge about which behaviour is preferable for obtaining a good film.
3.2.8 Rheology
All film formers were investigated concerning their viscosity behaviour with an AR-G2 Rheometer
produced by TA instruments. Therefore film former-Tebuconazole dispersions with an active content
of 0.5 % and 5 % were prepared for the measurements. The viscosity was monitored between a
continuous decrease in shear stress from 10 Pa to 0.1 Pa. Moreover certain samples were exposed
to an oscillating increasing stress to investigate the dry-in effect by determing G’ and G’’ mentioned
in 3.2.7.
3.2.9 Film applicator
Films were applied with a wet film applicator (10 m) by using the Elcometer 4340 Automatic Film
Applicator (fig. 8) at a speed of 1.5 cm/s with the film former-Tebuconazole dispersions with active
contents of the polymer of 0.5% and 5%. The tafacid tallow (Tm =42°C) heated to 40-50°C and tefacid
kokos (Tm = 29°C) heated to 30-40°C respectively were applied with a speed of 1 cm/s and a film
thickness of 10 m on paper which was placed on a heated surface at 60°C and 50°C respectively.
After applying the fatty acid the papers were stored for 1 hour in an oven at 54°C.

14
Figure 8: Elcometer 4340 Automatic Film Applicator [own picture]
3.2.10 Tape adhesion test and evaluation
In order to evaluate the adhesion ability of the films on the substrates relative to each other the
ASTM Method D3359-09 (Standard Test Method for Measuring Adhesion by Tape Test) was modified.
The tape test was carried out 24 h hours after applying the film. Then tapes (invisible adhesive tapes,
Staples) with a length of approximately 13 cm were prepared whereas the last part was folded to
have a part to pull the tape. The final length of the sticking part of the tape should be 10 cm and
fixed on the surface with a rubber eraser of the same width as the tape and at a constant pressure.
After a time of 10 s the tape is removed within a time range of 3 s.
The mechanism can be seen in fig. 9 where removal of coating occurs when the tensile forces along
the coating/substrate interface is becoming bigger than the cohesive bond strength of the coating or
the bond strength between the coating and the substrate. (Anon., 2010)
Figure 9: Tape test method mechanism (Anon., 2010)
15
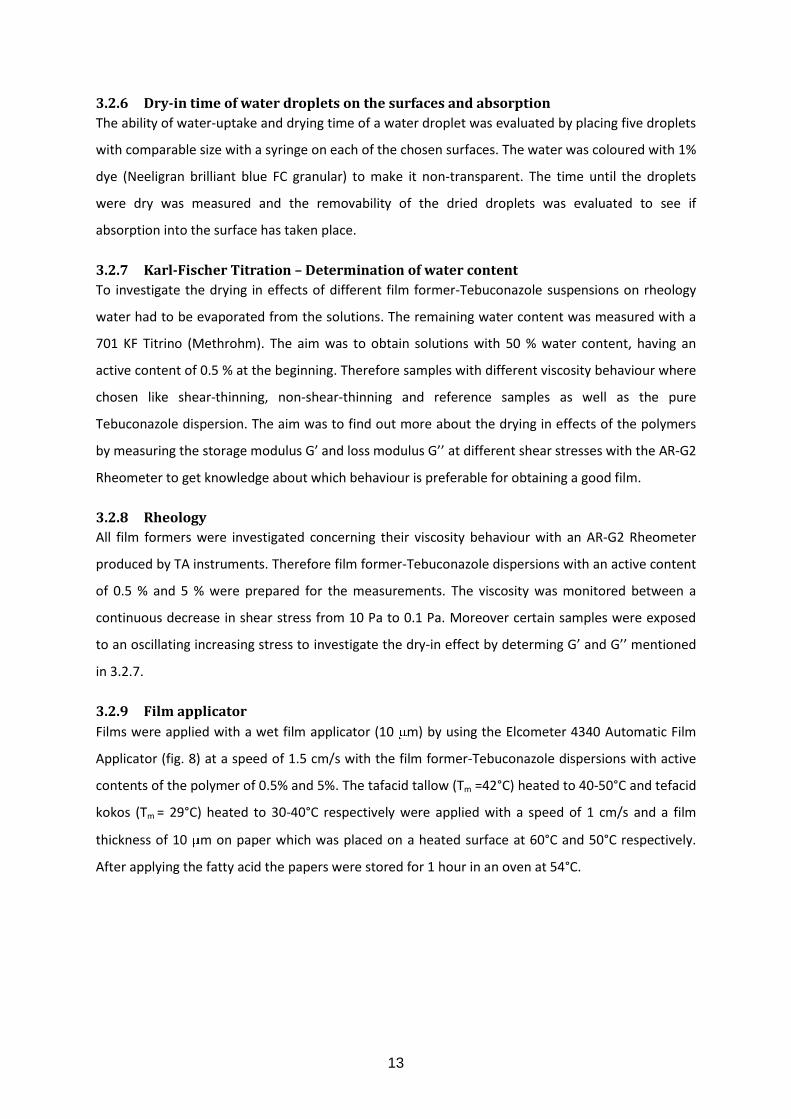
The results were evaluated concerning amount of film former-Tebuconazole on the tape and
appearance of the tested surface. A scale from 0 to 7 was chosen whereas 0 means no adhesion at
all and 7 which is related to best adhesion as can be seen in table 4.
Table 4: Adhesion scale (Tape was removed from left side first)
Evaluation number Tape appearance
0 -
1
2
3
4
5
6
7
3.2.11 Film homogeneity evaluation
Compatible to the adhesion the film homogeneity was also ranked in a scale of 0 to 7 whereas 0
means no homogeneity at all and 7 means perfect homogeneity. The scale can be seen in table 5.

16
Table 5: Film homogeneity scale (Film was applied from left to right)
Evaluation number Film appearance
0
1
2
3
4
5
6
7
3.2.12 Gloss
Gloss measurements were taken out with a gloss meter to determine the reflection of the surface.
The measurements were peformed at an angle of 85° at 5 different places on the surface. To
compare the surfaces among each other the films were measured at the same time i.e. 24 h after
film application since the surface appearance changes with time. It is important that the samples are
kept away from sun because the colour changes from light blue to dark blue.

17
4 Results and Discussion
4.1. Seed surface and model surface investigation In the following subchapters different possible surfaces as model surface will be compared to the
seed surface concerning surface morphology, contact angle, dry-in time of water and absorption
behaviour.
4.1.1 Surface morphologies of the seed and different substrates
The topographical pictures obtained by AFM can be seen in fig. 10-15.
Figure 10: Seed surface Figure 11: Seed surface of a swollen cutin
Figure 13: PE surface
Figure 12: Sealed paper surface

18
It can be seen that different surfaces are obtained depending on which area or seed was chosen.
Whereas the seed surface in fig. 10 appears quite rough, the surface of another seed (fig. 11)
appears smoother. Comparing the fatty acid surfaces, the sealed paper and the polyethylene surface
with the seed surface then none of these seem to have a similar surface. The roughness of the fatty
acid coated papers mainly arises from fibers of the paper. On the other hand Polyethylene seems to
be most similar to the seeds concerning the topography of the surface whereas sealed paper on
which first film tests were proceeded is perfectly smooth and represents the lowest similarity to the
seed surface also concerning to the roughness value (table 6). Average roughnesses for the other
surfaces are more comparable with the seed but for the fatty acid surfaces also strongly dependent
on the measured area.
4.1.2 Contact angles, Dry-in time and Absorption on the surfaces
In table 6 results for the contact angle measurements, absorption tests and roughness values from
the AFM samples are listed for different surfaces:
Table 6: Surfaces and their properties, * second value = another seed, *2 first value = smooth area, second value = whole
area
surfaces Contact angle after 10 s [°] Dry-in time of a droplet
[min]
Absorption Roughness [nm]
soy bean 77 ± 1 55 ± 4 low 67.3; 58,4* sealed paper 72 63 ± 1 very low 1.4
PE 86 ± 1 ~ 71 no abs. 53.4 Tefacid kokos on paper 72 ± 1 71 ± 2 low 61.5; ~100*
2
Tefacid tallow coated paper 78 ± 1 60 ± 2 medium 21.6; 101.5*2
Parafilm 99 89 ± 5 very low N.A. Paper N.A. 5 ± 1 high N.A.
Figure 14: tefacid kokos surface Figure 15: tefacid tallow surface

19
Soybean seeds have a contact angle of approximately 77° which make them low hydrophobic. Since
their main composition in the outermost layer is out of fatty acids and the tefacid acid coated papers
results in a reproducible contact angle of ~78° after 10 s it can be closely related to a seed surface.
But it has to be mentioned that the contact angle strongly depends on the phenotype (dull, shiny,
bloom) and the protein content in the seed surface and can as doing so not be referred to all kinds
of seeds. (Gijzen, et al., 1999) The major difference between the fatty acid coated papers and the
seed is the swelling behaviour since it absorbs faster. Since the results for film homogeneity on the
tefacid kokos paper were less comparable further experiments were not done.
The dry-in time of a droplet depends on the relative humidity of the surrounding and can as so not
be seen can be seen as a dry in time in general. It seems to be closely related to the absorption
behaviour and contact angle. The droplets dry faster the higher the ability of absorption is and the
lower the contact angle. The latter is due to lower volume of the droplet which results in faster
drying. The fatty acid coated paper with its medium absorption ability is as so a good compromise to
complete non-absorbing surface. The reason for the lower absorbance of tefcid kokos an be due to
less voids in the surface than tefacid tallow which is maybe not that closed packed. The contact
angle is also lower as it could be seen by setting a droplet on the surface. Previous contact angle
measurements contradict this but a repetition of the measurement was not possible because the
computer attached to the contact angle instrument was broken.
4.2 Film formers and their properties
4.2.1 Adhesion and Film homogeneity
Tab. 7 shows the results for the film evaluation. It can be seen that in general there is an
improvement of the film from 0.5 % to 5 % active content. This can be explained by that the more
film former is present the closer the polymer chains can be to each other and are able to form a
closer network and the gel formation can start earlier. To come into consideration for a good film
the sum of the evaluation from film homogeneity and adhesion should be at least 9 and at least 4 for
each of them. The evaluation is subjective so it can vary from person to person.
The best results at 0.5 % a.c. of the polymer in the dispersion were achieved for PMAA-bA-MMA
(11)(13), PMMA-N-HM (11)(14), PMA-AA-N (11)(14) and Alcoxylate (11)(14) but are also high
viscosity polymers like PAA 3 (10)(12) and 4 (9)(12), Cellulose-polymer 1 (9) and 2 (9) gave good
results. The first number in brackets shows the value for quality of the film for 0.5 % a.c., the second
number the value for 5 % a.c. At 5 % a.c. also the following polymers perform well: PUR-PAA (9), PAA
2 (11), PAA-PS (12), PAA-HM-N (12) and PAA-MA-N 2 (13).

20
Table 7: Evaluation of film homogeneity and adhesion at different concentrations (error ± 1)
active content [%] 0.5 5
Adhesion Film homogeneity Sum Adhesion Film homogeneity Sum
PAA 1 2 1 3 3 2 5
PAA 2 2 1 3 5 6 11
PAA 3 4 6 10 7 5 12
PAA 4 4 5 9 7 5 12
PAA-HM 3 5 8 7 3 10
PAA-HM-N 3 2 5 7 6 13
PAA-MA 3 2 5 3 3 6
PAA-MA-N 1 4 1 5 3 2 5
PAA-MA-N 2 5 4 9 6 7 13
PAA-MA-VAc 4 1 5 4 2 6
PAA-PS 1 7 8 5 7 12
PAA-S-MA 1 3 1 4 4 2 6
PAA-S-MA 2 3 1 4 3 2 5
PAA-HP 3 1 4 2 2 4
PAA-starch 3 1 4 3 1 4
PMAA-Polymer 2 1 3 5 4 9
PMAA-bA-MMA 4 7 11 7 6 13
PMMA-N-HM 4 7 11 7 7 14
PMAA-AA-N 4 7 11 7 7 14
PUR-PAA 3 1 4 5 7 12
PVP-PVA 3 2 5 4 4 8
Starch-AA-MA 3 1 4 4 2 6
PVP starch 3 3 6 4 5 9
Starch derivative 3 2 5 7 3 10
Cellulose-pol. 1 4 5 9 - - -
Cellulose-pol. 2 4 5 9 - - -
Xanthan gum 3 5 8 - - -
Alcoxylate 6 5 11 7 7 14
PS-S 1 3 2 5 4 3 7
PS-S 2 3 1 4 5 3 8

21
4.2.2 Glass transition Tg, Molecular weight Mw, Mn, PDI and Gloss
Table 8: Tg, Mw, Mn, PDI, Gloss
Polymer Tg Mw Mn
PDI
Gloss [GU] at 0.5 % a.c.
Gloss [GU] at 5 % a.c.
PAA 1 44 N.A. N.A. N.A. 4.2 4.3 PAA 2 N.A. 7933 947 8 6 5.4 PAA 3
51 (1738077) (1490) (1167) 3.6 3.9
PAA 4 46 (1939059) (32736) (59) 3.3 3.5 PAA-HM 75 12686
12686 1268
12686 12686
856 15 4.3 2.7 PAA-HM-N 62 5107 351 15 4.6 3
PAA-MA 76 N.A. N.A. N.A. 4.5 4.5 PAA-MA-N 1 90 N.A. N.A. N.A. 3.9 4.5 PAA-MA-N 2 148 N.A. N.A. N.A. 4.0 4.4 PAA-MA-VAc 63 N.A. N.A. N.A. 4.1 4.5
PAA-PS N.A. 2243 167 13 7.6 4.7 PAA-S-MA 1 98 N.A. N.A. N.A. 4.2 4.1 PAA-S-MA 2 88 N.A. N.A. N.A. 5.2 4.5
PAA-HP 71 N.A. N.A. N.A. 4.7 5.2 PAA-starch 48 N.A. N.A. N.A. 4.4 4.5
PMAA-Polymer
122 11963 1463 8 5.8 5.8 PMAA-bA-
MMA N.A 26664 372 72 4.3 4.4
PMMA-N-HM
75 47259 715 66 2.9 3.5 PMAA-AA-N 77
14905 461 32 4.3 4.1
PUR-PAA 35 (186396) (7384) (25) 4.8 3.0 PVP-PVA 103 N.A. N.A. N.A. 5.1 4.2
Starch-AA-MA
87 N.A. N.A. N.A. 4.7 4.8 PVP-starch 138
3999 994 4 5.9 4.4
Starch derivative
N.A.
(735152) (1308) (562) 4.2 3.1 Cellulose-pol.
1 50 N.A.
N.A. N..
N.A. 6.1 N.A. Cellulose-pol.
2 48 N.A. N.A. N.A. 6.2 N.A.
Xanthan gum N.A.
N.A. N.A. N.A. 5.6 N.A. Alcoxylate N.A. N.A. N.A. N.A. 3.4 3.7
PS-S 1 N.A. 19252 566 34 4.3 3.7 PS-S 2 N.A. (312402) (12006)
(26) 5.7 5.8
*(..) = possibly to high values due to variation from standard curve
Comparing the Tg values with the performance of the film no reliable trends can be observed. Thus,
its value does not seem to be of great importance for the film formation which can be due to that no
polymer seems to have a Tg below user rate temperature (22°C ±2°C) where the film application
takes place PAA 3, PAA 4, Cellulose-Pol. 1 and 2 as well as PUR-PAA have a Tg close to the user rate
according to the measurements and are quite good in film formation but on the other hand PAA 1
for instance has also a low Tg and performs bad. (Compare table 7). To draw conclusions other
parameters have to be taken into consideration.
The results for the molecular weight Mw show that there are some polymers which are good at low
Mw values but also some with higher values. As mentioned in 1.4.5.2 low or high Mw can be good for

22
film homogeneity which can explain why there are polymers resulting in good film homogeneity at
low Mw and others at high molecular weight. Other parameters like interactions might be of bigger
importance so that it cannot be said that high or low values are good in general.
Looking at the polydispersity, film formation seems to be better for higher polydispersities. The
polymers having a low PDI value like PMAA-Polymer, PAA 2, PVP starch perform worse in film
homogeneity in comparison to those with higher values. But not enough values are determined to
proof this.
Looking at the gloss values which were determined with the gloss meter 24 h after film application
one can see that all GU values are below 8 GU which is a very low value. The reproducibility of these
values is not enough tested and can be influenced by absorbed humidity. In general low viscosity
films seem to have lower GU-values and vice versa.
The viscosities of the polymer-Tebuconazole-dispersions were compared with the pure
Tebuconazole. The pure Tebuconazole shows a shear thinning behavior (fig. 16) with increasing
stress due to agglomeration of the particles in the suspension. This process causes a decrease of
interactions which results in shear-thinning. (Mezger, 2006)
Figure 13: Viscosity behaviour of Tebuconazole-dispersions produced by different persons
That just some polymers show shear-thinning behaviour can be explained by that they contain
longer chains which disentangle while orientating into the flow direction. If the concentration is low
as it is in the dispersions complete disentanglement is taking place. On the other hand polymers
0,00E+00
5,00E-03
1,00E-02
1,50E-02
2,00E-02
2,50E-02
3,00E-02
3,50E-02
4,00E-02
4,50E-02
0,1 1 10
η [
Pas
]
shear stress [Pa]
Rheology of Tebuconazole-dispersion
Tebuconazole 1
Tebuconazole 2
Tebuconazole 3

23
containing short chains are not entangled so that they just orientate into the flow direction without
showing any difference in viscosity depending on the shear stress. This is the case for most of the
polymers at a concentration of 0.5 % where the curve does not differ much from the curve for pure
Tebuconazole dispersion as can be seen in table 9 (Mezger, 2006). The values are normalized to
Tebuconazole which means that a polymer-Tebuconazole dispersion with a viscosity of 1 behaves
exactly like the pure Tebuconazole dispersion for a specific shear stress. A higher value means that
the polymer-dispersion is more viscous at this applied shear stress; a lower value means the
polymer-dispersion is less viscous than the pure Tebuconazole-dispersion. The high values for
Cellulose Pol. 1 and 2, PAA-3 and PAA-4 as well as Xanthan-gum can be explained by their high Mw.
A reason for no shear-thinning behaviour of polymer-Tebuconazole-dispersions can be that they are
highly diluted because of low solid content so that less Tebuconazole particles are present like it is
the case for PMAA-bA-MMA, PMMA-N-HM and PMA-AA-N.
The shear rate during application can be calculated by γ=v/h [(m/s)/m] where v is the velocity of the
applicator and h is the distance between applicator and paper. (Mezger, 2006) With a gap between
coated paper and applicator of 10 µm and a velocity of 1.5 cm/s the shear rate results in 1500 s-1
which is according to the results at quite different shear stresses for each polymer which makes it
harder to compare the results properly since not for all polymers the viscosity for this shear rate was
determined. For most of the polymers this is achieved between 7 Pas and 10 Pas.
Table 9: normalized rheologies of the polymers at different shear stresses
active content [%] 0.5 5
viscosity [Pas] (normalized)
η (0.1 Pas) η (1 Pas) η (10 Pas) η (0.1 Pas) η (1 Pas) η (10 Pas)
PAA 1 1.43 1.15 1.09 15.56 2.14 1.55
PAA 2 11.97 1.27 1.13 28.11 4.59 2.61
PAA 3 6.29 25.96 28.15 144.33 571.84 496.37
PAA 4 4.52 8.31 40.93 - 39679.14 4581.67
PAA-HM 0.13 0.83 1.10 0.16 1.10 1.39
PAA-HM-N 0.21 1.44 1.68 0.12 0.85 1.15
PAA-MA 1.12 1.11 1.07 1.92 1.96 1.96
PAA-MA-N 1 2.57 1.13 1.07 12.51 1.84 1.47
PAA-MA-N 2 1.93 1.07 1.05 8.70 1.74 1.49
PAA-MA-VAc 2.16 1.11 1.06 15.56 2.14 1.55
PAA-PS 3.05 1.28 1.20 0.85 1.39 1.47
PAA-S-MA 1 1.61 1.00 0.99 17.12 2.23 1.56
PAA-S-MA 2 2.72 1.22 1.08 19.36 2.66 1.78
PAA-HP 1.34 1.07 1.01 15.77 2.10 1.60
PAA-starch 1.21 1.00 1.00 2.26 1.36 1.27
PMAA-Polymer 14.18 1.48 2.12 34.67 9.29 4.16

24
PMAA-bA-MMA 0.14 0.85 1.10 0.16 1.06 1.35
PMMA-N-HM 0.15 0.95 1.25 0.26 1.49 1.89
PMA-AA-N 0.46 1.58 1.81 0.33 1.03 1.14
PUR-PAA 0.94 1.06 1.07 0.24 0.96 1.16
PVP-PVA 0.18 0.84 1.13 0.44 2.90 3.76
Starch-AA-MA 1.21 1.03 1.01 2.17 1.53 1.42
PVP starch 2.19 1.31 1.24 0.51 3.18 3.89
Starch derivative 1.62 1.67 1.53 7.38 34.05 28.25
Cellulose-pol. 1 2.38 12.75 12.49 - - -
Cellulose-pol. 2 176.87 660.99 274.76 - - -
Xanthan gum - 36613.19 64.03 - - -
Alcoxylate 0.11 0.71 0.97 0.49 1.73 1.97
PS-S 1 2.07 1.30 1.20 17.23 3.22 2.62
PS-S 2 9.04 2.73 3.13 243.49 23.96 15.6
4.2.3 Moisture pick-up
Looking at the results in fig. 17 huge differences between the polymers concerning water uptake can
be seen whereas most samples remained constant in weight after 6 days in relative humidity of
55 ±3%. Mentionable is also that the samples which have a high moisture uptake like the
polyacrylates lose weight quite fast after leaving the atmosphere with high humidity and it cannot
be compensated within one day which can be seen by the fluctuations (PAA-2 to 4 and PMAA).
Moreover, the diagram indicates that polymers with just or high amounts of sodium acrylates absorb
a lot more water in comparison to samples which contain more hydrophobic groups. The high
amount of water-uptake in the polystyrene polymers PS-1 and PS-2 close to 20 % can be related to
the hydrophilic sulfonate group attached to the benzyl ring.

25
Figure 14: Moisture pick-up of the different polymers and copolymers
All in all, polymers with a higher weight gain than 20% at equilibrium contain at least 50 sodium
acrylate or methacrylate groups per 100 monomers. In general it can be assumed that polymers with
hydrogen-bonds accepting groups like COO- have a higher tendency to pick up water than the ones
which do not have these groups or contain hydrogen-bond-donating groups like –OH. (Thijs, et al.,
2007).
0
10
20
30
40
50
60
-1 1 3 5 7 9
We
igh
t ga
in [
%]
Days
Moisture pick-up PMAA-Polymer
PMAA-Polymer (rep.)PAA 4
PAA 2
PAA 3
PAA-MA-N
PAA-HM-N
PAA-HM
PAA-PS
PAA-MA-Vac
PS-S 2
PS-S 1
Xanthan gum
PAA-MA-N 1
PMAA-bA-MMA
PMMA-N-HM
Starch derivative
PMA-AA-N
PVP-PVA
PVP-starch
Starch-AA-MA
Cellulose-pol. 1
Cellulose-pol. 2
PAA-S-MA 1
PUR-PAA
PAA-MA
PAA-starch
Alcoxylate
PAA-S-MA 2

26
It is possible that the water-uptake can also be influenced by different availability of surface area to
the surrounding atmosphere since some polymers build a complete or partly film on the bottom of
the aluminium pans whereas others cracked and particles where loose distributed in the pan. But
according to Thijs et al the influence of the morphology is not that important because of the
plasticizing effect of the polymers during water uptake which causes the formation of an oily-like
phase. (Thijs, et al., 2007) Moreover, the very low results can be due to insufficient drying in the
furnace.
4.2.4 Rheology behaviour at different water contents
From oscillation experiments of chosen polymer-Tebuconazole suspensions the storage modulus G’
and the loss modulus G’’ could be determined. These suspensions contain around 68 % water as it
could be determined by Karl-Fischer-Titration which can be considered as the water content at user
rate. Moreover, suspensions with a water content of 50 ±2 % were obtained.
It has to be mentioned that the film is applied with a certain shear rate which was calculated in 4.2.1
as 1500 s-1 at user rate so it is most important to compare the results for the storage modulus G’ and
the loss modulus G’’ at this shear rates which are between a shear stress of 5 Pas and 10 Pas for all
measured polymers. But it has to be mentioned that according to Mezger the calculated shear rate is
just a “rough estimation” and is as doing so not fully reliable (Mezger, 2006). The diagrams in fig. 18
and 19 show G’ and G’’ at shear stresses between 0.01 and 10 Pas for 68% and 50±2 % water
content. The latter simulates the situation where the film dried down to certain amount and no
shear stress is present so that the values at a shear stress of 0.01 Pas are the most important ones.

27
At user rate (fig. 18) all polymers are more viscous than elastic indicated by G’ being bigger than G’’.
Whereas pure Tebuconazole, the PVP-starch and PS-S-1 dispersions are constantly shear thinning at
user rate the PMAA-AA-N, PAA-HM and PVP-PVA dispersions are quite constant. At the application
shear stresses of 5-10 Pa are present and the difference between the G’ and G’’ are not significantly
which means the ability to spread over the surface is high for all dispersions at these shear stress.
At dried condition which means 50 ±2 % water content (fig. 19) the viscosity increases for all samples
whereas PVP-PVA still behaves more viscous and PVP-starch behaves almost perfectly viscoelastic
(G’~G’’) all other samples are more elastic at low shear stress indicated by G’’ being bigger than G’
which means that a gel has been formed. Pure Tebuconazole, the PS-S-1 and the PVP-starch-
dispersions show a strong shear thinning behaviour at stresses lower than 1 Pa which might be
negligible since shear stresses of these high values there should not be present. The PMAA-AA-N and
PMMA-N-HM dispersions are constant in G’/G’’ over a wider range of shear stress than the previous
mentioned ones.
0,001
0,01
0,1
1
10
100
1000
10000
0,01 0,1 1 10
G' a
nd
G''
[Pa]
stress [Pa]
Rheology at user rate (68 % water content)
0,001
0,01
0,1
1
10
100
1000
10000
0,01 0,1 1 10
G' a
nd
G''
[Pa]
stress [Pa]
Rheology at 50 ±2 % water content
PMAA-AA-N G'
PMAA-AA-N G''
PMMA-N-HM G'
PMMA-N-HM G''
PS-S 1 G'
PS-S 1 G''
Tebuconazole G'
Tebuconazole G''
PVP-starch G'
PVP-starch G''
PAA-HM G'
PAA-HM G''
PVP-PVA G'
PVP-PVA G''
Figure 15: G' and G'' versus stress of the polymer-fungicide dispersions at 68 % water content
Figure 19: G' and G'' versus stress of the polymer-fungicide dispersions at 50 ±2 % water content
28
To mention is also that at further drying the PMAA-AA-N dispersion forms a rubber like substance
already above 40 % water content whereas the PMMA-N-HM dispersion behaves like a cream
around 40 %. All other suspensions are still in a liquid state at this water content which can be
explained by the high cohesive forces within the polymers PMAA-AA-N and PMMA-N-HM indicated
by the high G’ value already at 50 % water content. (Mezger, 2006)
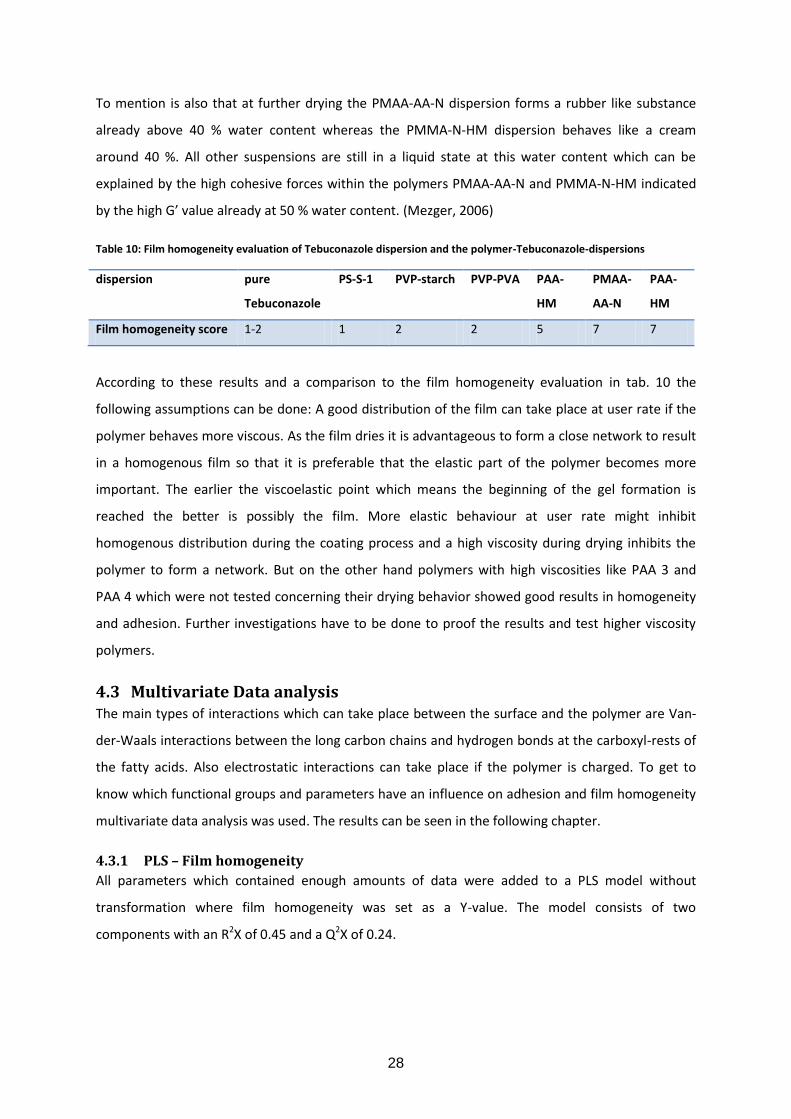
Table 10: Film homogeneity evaluation of Tebuconazole dispersion and the polymer-Tebuconazole-dispersions
dispersion pure
Tebuconazole
PS-S-1 PVP-starch PVP-PVA PAA-
HM
PMAA-
AA-N
PAA-
HM
Film homogeneity score 1-2 1 2 2 5 7 7
According to these results and a comparison to the film homogeneity evaluation in tab. 10 the
following assumptions can be done: A good distribution of the film can take place at user rate if the
polymer behaves more viscous. As the film dries it is advantageous to form a close network to result
in a homogenous film so that it is preferable that the elastic part of the polymer becomes more
important. The earlier the viscoelastic point which means the beginning of the gel formation is
reached the better is possibly the film. More elastic behaviour at user rate might inhibit
homogenous distribution during the coating process and a high viscosity during drying inhibits the
polymer to form a network. But on the other hand polymers with high viscosities like PAA 3 and
PAA 4 which were not tested concerning their drying behavior showed good results in homogeneity
and adhesion. Further investigations have to be done to proof the results and test higher viscosity
polymers.
4.3 Multivariate Data analysis The main types of interactions which can take place between the surface and the polymer are Van-
der-Waals interactions between the long carbon chains and hydrogen bonds at the carboxyl-rests of
the fatty acids. Also electrostatic interactions can take place if the polymer is charged. To get to
know which functional groups and parameters have an influence on adhesion and film homogeneity
multivariate data analysis was used. The results can be seen in the following chapter.
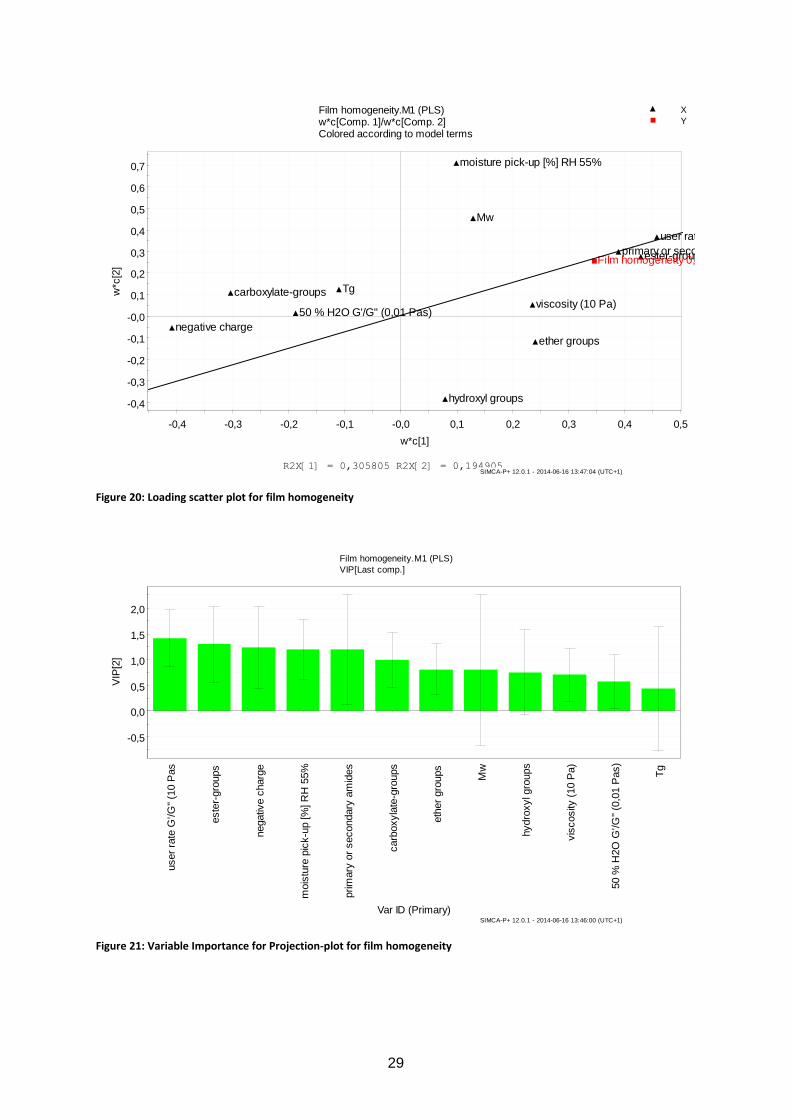
4.3.1 PLS – Film homogeneity
All parameters which contained enough amounts of data were added to a PLS model without
transformation where film homogeneity was set as a Y-value. The model consists of two
components with an R2X of 0.45 and a Q2X of 0.24.
29
Figure 20: Loading scatter plot for film homogeneity
Figure 21: Variable Importance for Projection-plot for film homogeneity
-0,4
-0,3
-0,2
-0,1
-0,0
0,1
0,2
0,3
0,4
0,5
0,6
0,7
-0,4 -0,3 -0,2 -0,1 -0,0 0,1 0,2 0,3 0,4 0,5
w*c
[2]
w*c[1]
Film homogeneity.M1 (PLS)w*c[Comp. 1]/w*c[Comp. 2]Colored according to model terms
R2X[1] = 0,305805 R2X[2] = 0,194905
X
Y
primary or secondary amides
hydroxyl groups
ester-groups
ether groups
carboxylate-groups
negative charge
Tg
Mw
moisture pick-up [%] RH 55%
viscosity (10 Pa)
user rate G'/G" (10 Pas
50 % H2O G'/G" (0,01 Pas)
Film homogeneity 0,5
SIMCA-P+ 12.0.1 - 2014-06-16 13:47:04 (UTC+1)
-0,5
0,0
0,5
1,0
1,5
2,0
user
rate
G'/G
" (1
0 P
as
este
r-gro
ups
negativ
e c
harg
e
mois
ture
pic
k-u
p [%
] R
H 5
5%
prim
ary
or
secondary
am
ides
carb
oxyla
te-g
roups
eth
er
gro
ups
Mw
hydro
xyl g
roups
vis
cosity
(10 P
a)
50 %
H2O
G'/G
" (0
,01 P
as)
Tg
VIP
[2]
Var ID (Primary)
Film homogeneity.M1 (PLS)
VIP[Last comp.]
SIMCA-P+ 12.0.1 - 2014-06-16 13:46:00 (UTC+1)

30
The five most important parameters according to fig. 21 in the model are G’/G’’ at a shear stress of
10 Pa at user rate normalized to Tebuconazole, ester-groups, negative charge, primary or secondary
amides and. Ester groups and amides have a positive effect on film homogeneity whereas negative
charge influences the homogeneity negatively according to the loading plot (fig. 20). The plot
indicates also that the polymer should have a bigger viscous to elastic part than the pure
Tebuconzole-dispersion at user rate which can cause a better distribution of the film but a lower
viscous to elastic part than the pure Tebuconazole-dispersion when dried down to 50 % water
content. Molecular weight should be high according to the model but the error bar is quite big which
can be explained by that there were not enough values measured for comparing thoroughly. On the
other hand polymers with high molecular weight always resulted in good films whereas polymers
with low molecular weight performed bad or very good. So that other parameters seems to
determine the quality of film formation at low molecular weight. Moisture bonded by hydrogen
bonds around the functional groups can influence the mobility of chains. While drying the hydrogen
bonds to water are replaced by internal hydrogen bonds between for instance hydroxyl-groups and
amide groups and can as doing so build up a close network. The Tg on the other hand is of minor
importance which can be due to that the polymer is into solution. Since the Tgs were all above user
temperature more brittle than tough films are expected. The model is not very good indicated by the
low R2X and Q2X-values so the conclusions are just a vague approximation.
Figure 22: Score scatter plot for film homogeneity
-3,0
-2,0
-1,0
0,0
1,0
2,0
3,0
-4 -3 -2 -1 0 1 2 3 4 5
t[2]
t[1]
Film homogeneity.M1 (PLS)t[Comp. 1]/t[Comp. 2]
R2X[1] = 0,305805 R2X[2] = 0,194905
Ellipse: Hotelling T2 (0,95)
PVP-starchPUR-PAA
PMAA-bA-MMA
PMMA-N-HM
PMAA-AA-NPAA-2
PAA-PS
PAA-HMPAA-HM-N
PMAA
PAA-3
PAA-4
Starch deriviate
PS-S-1
PS-S-2
PVP-PVA
Cellulose-pol. 1
Cellulose-pol. 2
PAA-S-MA-1PAA-S-MA-2
PAA-MA-N-1PAA-MA-VAc
PAA-MA-N-2
PAA-starchPAA-1PAA-HP
PAA-MA
Starch-AA-MA
Xanthan gumAlcoxylate
SIMCA-P+ 12.0.1 - 2014-06-16 13:45:29 (UTC+1)

31
The score scatter plot (fig. 22) does not contain strong outliers so that no polymer has to be
removed. PMMA-N-HM can be seen as a moderate outlier (Eriksson, et al., 2006). The copolymers
PMMA-N-HM and PMAA-AA-N, PMAA,-bA-MMA and PVP-PVA are according to the model best in
film homogeneity which is according to the film homogeneity evaluation not correct for PVP-PVA so
that the model cannot be fully trusted. The high molecular weight polymers Cellulose-pol., PAA-3, -4
and Xanthan gum are far away from the film homogeneity line through the origin but they are still
positive. All polymers which performed badly are in the opposite quadrant of the origin to good film
homogeneity like PAA-1, PS-S-1, -2, PAA-S-MA-1 and -2 which correlates with the results from the
film homogeneity evaluation.
4.3.2 PLS – Adhesion
The score scatter plot for adhesion (fig. 25) does just contain one outlier Cellulose-pol. 2 which can
be accepted for the model. It consists as the model for film homogeneity of two components with an
R2X of 0.18 and a Q2X of -0.21 which means it is bad in goodness and predictability. However, a look
at the resulting plots should be done nevertheless.
Figure 23: Loading plot for adhesion
-0,3
-0,2
-0,1
-0,0
0,1
0,2
0,3
0,4
0,5
0,6
0,7
-0,2 -0,1 -0,0 0,1 0,2 0,3 0,4 0,5 0,6 0,7
w*c
[2]
w*c[1]
Adhesion.M2 (PLS)
w*c[Comp. 1]/w*c[Comp. 2]
Colored according to model terms
R2X[1] = 0,294014 R2X[2] = 0,128992
X
Y
primary or secondary amides
hydroxyl groups
ester-groups
ether groups
carboxylate-groups
negative charge
Tg
Mw
moisture pick-up at 55 % RHviscosity (10 Pa)
user rate G'/G" (10 Pas
50 % H2O G'/G" (0,01 Pas)
Adhesion 0,5
SIMCA-P+ 12.0.1 - 2014-06-16 13:43:41 (UTC+1)

32
Figure 24: Variable Importance for Projection-plot for adhesion
The five most important parameters according to fig. 24 are Mw, G’/G’’ at user rate normalized to
pure Tebuconazole, Tg, primary and secondary amides and hydroxyl groups. According to the
loading plot (fig.23) the MW should be very high, the amount of primary and secondary amides, the
G’/G’’ at user rate should be high as well as the Tg. Negative charge caused among others by
carboxylate has a bad influence on adhesion which is also closely related to moisture pick-up.
Moisture pick-up has a plasticizing effect which can cause worse adhesion. High molecular weight
means also a high viscosity. The Tg should be low so that when the film dried down interdiffusion of
chains between the surfaces can take place at higher temperatures than the Tg. (Garbassi, et al.,
1998) Because of the big standard deviation the model cannot be trusted. Hydroxyl-groups and
amides can be important to form hydrogen bonds to the surface after water evaporation. That
means after breaking of the hydrogen bonds to water and formation of hydrogen bonds to the
carboxyl groups of the surface fatty acids but also to strengthen cohesive interactions within the
polymer.
-1,5
-1,0
-0,5
0,0
0,5
1,0
1,5
2,0
2,5
3,0
3,5
4,0
Mw
user
rate
G'/G
" (1
0 P
as
Tg
prim
ary
or
secondary
am
ides
hydro
xyl g
roups
eth
er
gro
ups
vis
cosity
(10 P
a)
carb
oxyla
te-g
roups
negativ
e c
harg
e
este
r-gro
ups
mois
ture
pic
k-u
p a
t 55 %
RH
50 %
H2O
G'/G
" (0
,01 P
as)
VIP
[2]
Var ID (Primary)
Adhesion.M2 (PLS)
VIP[Last comp.]
SIMCA-P+ 12.0.1 - 2014-06-16 13:42:44 (UTC+1)

33
Electrostatically hindered polymer chains can be responsible for the bad performance of charged
polymers so that close-packing is not possible. Since there is no positive charge in the surface which
could cause attraction, there is just repulsion between the chains.
Figure 25: Score scatter plot for adhesion
The score scatter plot (fig. 25) indicates that PMMA-N-HM, PAA-3, -4, PVP-PVA and PMAA-AA-N as
well as Alkoxylates have a good adhesion which is in accordance to the evaluation except for PVP-
PVA which performs worse than the model is predicting.
Since it was difficult to evaluate the tapes, especially the ones which were removed from
inhomogeneous films, mistakes can be caused by that. Also the range of values is not very broad
which can also affect the predictability of the model.
-3,0
-2,5
-2,0
-1,5
-1,0
-0,5
0,0
0,5
1,0
1,5
2,0
2,5
-5 -4 -3 -2 -1 0 1 2 3 4 5 6 7
t[2]
t[1]
Adhesion.M2 (PLS)t[Comp. 1]/t[Comp. 2]
R2X[1] = 0,294014 R2X[2] = 0,128992
Ellipse: Hotelling T2 (0,95)
PVP-starchPUR-PAAPMAA-bA-MMA
PMMA-N-HM
PMAA-AA-N
PAA-2
PAA-PS
PAA-HM
PAA-HM-N
PMAA
PAA-3PAA-4
Starch deriviate
PS-S-1
PS-S-2
PVP-PVA
Cellulose-pol. 1
Cellulose-pol. 2
PAA-S-MA-1
PAA-S-MA-2
PAA-MA-N-1
PAA-MA-VAc
PAA-MA-N-2
PAA-starch
PAA-1
PAA-HP
PAA-MA
Starch-AA-MA
Xanthan gum
Alcoxylate
SIMCA-P+ 12.0.1 - 2014-06-16 13:38:01 (UTC+1)
34
5 Conclusion Concerning the model surface tefacid tallow on paper one can say that model surface has satisfying
resemblance with a soybean surface except for roughness.
In the film evaluation the low viscosity polymers PMAA-bA-MMA, PMMA-N-HM, PMA-AA-N,
Alkoxylate and high viscosity polymers PAA 3 and 4, Cellulose-polymer 1 and 2 performed best at
active content of 0.5 % in the Tebuconazole dispersion. Since there are polymers performing quite
good at 0.5 % active content there is no need to use higher concentrations of polymers in the seed
treatment formulation which results in less impact on the environment at application.
The MVDA showed that it is possible to do obtain satisfying predications for parameters which are
important for film homogeneity but the model failed for adhesion. The reason why it is not possible
to get a good model can be caused by missing values like for molecular weight or further factors for
instance steric hindrance in the polymer, influence of the E-modulus and elongation at break
respectively. However the MVDA for film homogeneity showed that polymers containing amides and
ester-groups are good film formers and that negative charges seem to have a bad influence on the
film formation.
Viscosity at applied shear rate has an impact for film formation. High viscosity and high molecular
weight was always good, low viscosity and low molecular resulted not always in a good film. The
change of the position of the storage modulus G’ and the loss modulus G’’ during film drying might
be of importance.
Polymers with high content of sodium polyacrylates or -polymethacrylates are not suitable for the
application. Water has a plasticizing effect on the film which causes that the film becomes softer
meaning chains are more able to move. This can result in interdiffusion of chains between the films
so that adhesion among the coated seeds takes place.
Gloss measurements resulted in too low values to draw good conclusions out of that.
35
6 Future Work The film formers with the best results should be tested on seeds in the fungicide dispersion and
compared with seeds coated with film formers which gave bad results to proof compatibility
between the model surface and the seeds and further tests concerning dust formation have to be
performed.
Since Rheology seems to be of major importance further tests have to be done to proof the
assumptions concerning viscous behaviour at user rate and early changing to more elastic behaviour
as the water content decreases.
A more precisely method to measure the water uptake would be with TGA with a humidity chamber
for avoiding temperature and humidity fluctuations. (Thijs, et al., 2007) Moreover, to test the
behaviour of the polymers at higher humidity tests at higher RH (85 %) should be taken out. In order
to determine the absorbance on films which contain just a low amount of this polymer tests with an
electro-microbalance can be taken out. If proceeding further tests in desiccators then at least 48 h
should be between the weighting procedures.
The Mw could not be determined for all polymers since there was a problem with the pressure in the
instrument so that a comparison to the already measured samples at a higher pressure wouldn’t be
possible. The determined molecular weights which were much higher than 62900 g/mol are not
reliable values since no standards with these high values were used and high Mw-values differ from
the calibration curve.
To draw better conclusions or see a trend out of the Mw-measurements the values for more
polymers have to be determined since films were considered as good for high values (PAA 3 & 4) but
also for low values (PMMA-bA-MMA, PMMA-N-HM, PMA-AA-N).
Moreover, the elongation at break and the E-modulus of the polymers should be measured since it
provides information about toughness and brittleness respectively of the film. This can be for
importance for adhesion. Also a better method to evaluate adhesion has to be found.
In addition polymers with a Tg below user temperature should be chosen to see if there is better
interaction between surface and film and better film formation. To measure the Tg the polymers
should be grinded to small particle size and pressed to pellets to get more proper and reliable results.

36
7 Acknowledgement First, I would like to thank Peter Westbye for the great guidance and support during my master
thesis as well as I would like to thank Mikael Widell for the great support especially in the lab. I was
always welcomed to ask questions.
Krister Holmberg I would like to thank for being my examiner and visiting me at AkzoNobel Surface
Chemistry.
Martina Andersson I would like to thank for the support with the preparation of the Tebuconazole
dispersion.
For the support with the analytical instruments I would like to thank:
Mårten Andersson for the help with the AFM instrument at Chalmers. Lotta Byland for the
explanation of the SEC-instrument, support with the measurements and with the results. Bo
Karlsson for the help with the DSC instrument. Åsa Söderlund for the help with rheometer and the
support with the results.
I would like to thank Katja Eriksson for being my opponent and being such a nice office mate.
Thanks to everyone else who contributed to my master thesis and made my time at AkzoNobel
Surface Chemistry such fantastic.
Finally, I would like to thank Battal Turgut for letting me being part of his group and all members for
giving me the feeling to be a real part of the agro group despite the reorganization.

37
8 References AkzoNobel, 2012. Technical Bulletin: Dispersants and wetting agents for SC and WDG, s.l.: Akzo
Nobel Surface Chemistry LLC.
AkzoNobel, n.d. Körjournal HPLC-SEC med fosfatbuffert. s.l.:Akzo Nobel Surface Chemistry AB R& D.
Anon., 2010. Standard Test Methods for Measuring Adhesion by Tape Test. West Consohocken:
ASTM Interntional.
Arda, E. & Pekcan, Ö., 2001. Effect of Molecular Weight on Packing during Latex Formation. Journal
of Colloid and Interface Science, 234(1), pp. 72-78.
Cowie, J. & Arrighi, V., 2008. Polymers: Chemistry and Physics of Modern Materials. 3 ed. Boca Raton:
Taylor & Franci Group.
Eriksson, L. et al., 2006. Multi- and Megavariate Data Analysis: Part I Basic Principles and
Applications. Second revised and enlarged edition ed. Umeå: Umetrics AB.
Everitt, B. & Hothorn, B., 2011. An Introduction to Applied Multivariate Analysis with R. New York:
Springer Science+Business Media.
Garbassi, F., Morra, M. & Occiello, E., 1998. Polymer Surfaces: From Physics to Technology.
Chichester: John Wiley & Sohn Ltd..
Gijzen, M. et al., 1999. Hydrophobic Protein Synthesized in the Pod Endocarp. Plant Physiology,
120(4), p. 951–959.
International Speciality Products Inc., Seed Treatment
Knowles, A., 2005. New Developments in Crop Protection Product Formulation. UK: T&F Informa UK
Ltd..
Ma, F. et al., 2004. Cracks in the Palisade Cuticle of Soybean Seed Coats Correlate with their
Permeability to Water. Annals of Botany, 94(2), p. 213–228.
Mezger, T. G., 2006. The Rheology Handbook. 2 ed. Hannover: Vincentz Network.
Moïse, J. A. et al., 2005. Seed coats: Structure, development, composition, and biotechnology. In
Vitro Cellular & Developmental Biology - Plant, 41(5), pp. 620-644.
Niemann, S., 2013. Seed Coat Permeability of Active Ingredients. Würzburg: Julius-Maximilians-
Universität Würzburg.
Niemann, S., Burghardt, M., Popp, C. & Riederer, M., 2013. Aqueous pathways dominate permeation
of solutes across Pisum sativum seed coats and mediate solute transport via diffusion and bulk flow
of water. Plant, Cell & Environment , 36(5), pp. 1027-36.
Nunes, T., Guilott, G. & Bordado, J., 2000. Low-, stray-field imaging and spectroscopic studies of the
sodium polyacrylate water uptake. Polymer, 41(12), p. 4643–4649.

38
Pratap, A., Gupta, S. K., Kumar, J. & Solanki, R. K., 2012. Chapter 12: Soybean. In: S. K. Gupta, ed.
Technological Innovations in Major World Oil Crops, Volume 1: Breeding. New York: Springer Science
+ Business Media, p. 293.
Shao, S. et al., 2007. The outermost cuticle of soybean seeds: chemical composition and function
during imbibition. Journal of Experimental Botany, 58 (5), p. 1071–1082.
Silva, R., Runge, F. & Auweter, H., 2013. Evaluation of the quality of seed coating formulations by
application-oriented methods. Proc. ISAA, pp. 315-321.
Soleimani, M. et al., 2012. Effect of molecular weight distribution on polymer diffusion during film
formation of two-component high-/low-molecular weight latex particles. Polymer, 53(13), pp. 2652-
2663.
Steward, P., Hearn, J. & Wilkinson, M., 2000. An overview of polymer latex film. Advances in Colloid
and Interface Science, 86(3), pp. 195-267.
Thijs, H. M. L. et al., 2007. Water uptake of hydrophilic polymers determined by a thermal
gravimetric analyzer with a controlled humidity chamber. Journal of Materials Chemistry, 17(46), p.
4864–4871.
Wang, J.-Y., Park, S. & Russell, T. P., 2008. Copolymer Thin Films. In: O. K. C. Tsui & T. P. Russell, eds.
Block Copolymer Thin Films. Singapore: World Scientific Publishing Co. Pte. Ltd., pp. 1-25.