feasibility study: the evaluation of polymer coatings to
TRANSCRIPT
James Madison UniversityJMU Scholarly Commons
Senior Honors Projects, 2010-current Honors College
Spring 2015
Feasibility study: The evaluation of polymercoatings to prevent weathering of weak rocksLauren DistlerJames Madison University
Follow this and additional works at: https://commons.lib.jmu.edu/honors201019Part of the Civil Engineering Commons, Environmental Engineering Commons, Geology
Commons, Geotechnical Engineering Commons, and the Polymer and Organic Materials Commons
This Thesis is brought to you for free and open access by the Honors College at JMU Scholarly Commons. It has been accepted for inclusion in SeniorHonors Projects, 2010-current by an authorized administrator of JMU Scholarly Commons. For more information, please [email protected].
Recommended CitationDistler, Lauren, "Feasibility study: The evaluation of polymer coatings to prevent weathering of weak rocks" (2015). Senior HonorsProjects, 2010-current. 80.https://commons.lib.jmu.edu/honors201019/80
Feasibility Study: The Evaluation of Polymer Coatings
to Prevent Weathering of Weak Rocks
_______________________
An Honors Program Project Presented to
the Faculty of the Undergraduate
College of Integrated Science and Engineering
James Madison University _______________________
by Lauren Nicole Distler
May 2015
Accepted by the faculty of the Department of Engineering, James Madison University, in partial fulfillment of the requirements for the Honors Program. FACULTY COMMITTEE: Project Advisor: Kyle Gipson, Ph. D., Assistant Professor, Department of Engineering Reader: Yonathan Admassu, Ph. D., Assistant Professor, Department of Geology and Environmental Science Reader: Elise Barrella, Ph. D., Assistant Professor, Department of Engineering
HONORS PROGRAM APPROVAL: Philip Frana, Ph.D., Interim Director, Honors Program
PUBLIC PRESENTATION
This work is accepted for presentation, in part or in full, at the Honors Research Symposium on April 24th, 2015.

2
Table of Contents
Abstract .......................................................................................................................................... 4
Literature Review ......................................................................................................................... 5
Weathering and Undercutting ..................................................................................................... 5
Existing Slope Stabilization Techniques ..................................................................................... 6
Polyurethane Coating .................................................................................................................. 6
Self- Polymerized Dopamine Thin Film ..................................................................................... 8
Thermoplastic Polyolefin Coating .............................................................................................. 9
Polymer Evaluation and Discussion .......................................................................................... 10
Elimination of Polymer Options ............................................................................................... 12
Permeability of Polymer Coating .............................................................................................. 12
Laboratory Testing and Methods .............................................................................................. 14
Rock Sampling .......................................................................................................................... 14
Rock Characterization and Behavioral Observation ................................................................. 16
X-Ray Diffraction (XRD) ....................................................................................................... 16
Jar Slake Test ......................................................................................................................... 17
Initial (Uncoated) and Polyurethane Coated Rock Testing ....................................................... 18
24 Hour Absorption: ASTM §D6473 - 10 ............................................................................. 18
Slake Durability Index (SDI): ASTM §D4644 - 08 ................................................................ 19
Results .......................................................................................................................................... 21
Rock Characterization and Behavioral Observation ................................................................. 21
X-Ray Diffraction (XRD) ....................................................................................................... 21
Jar Slake Durability ............................................................................................................... 23
Initial (Uncoated) Rock Testing ................................................................................................ 24
24 Hour Absorption ............................................................................................................... 24
Slake Durability Index (SDI) ................................................................................................. 25
Polyurethane Coated Rock Testing ........................................................................................... 27
24 Hour Absorption ............................................................................................................... 27
Slake Durability Index (SDI) ................................................................................................. 28
Discussion .................................................................................................................................... 30

3
Conclusions .................................................................................................................................. 32
Future Work ................................................................................................................................ 33
Acknowledgements ..................................................................................................................... 34
References .................................................................................................................................... 35
Appendix A: Data Sheets for Polymer Options ....................................................................... 38
Appendix B: Uncertainty Calculations for Absorption and SDI Results .............................. 54
Appendix C: Data Sheets and SDI Photos ................................................................................ 58

4
Abstract
The weathering and erosion of weak rocks along roadways can cause dangerous and potentially
fatal rockfalls. Various slope stabilization methods exist, but each presents a set of challenges
and trade-offs. The focus of the project is to understand the feasibility of utilizing of a polymer-
based slope stabilization technique. Rock samples were collected along US Route 33 in Virginia
and West Virginia, and preliminary tests were conducted to evaluate the absorption of water (%
mass) and durability. The study evaluates three polymer options in regard to the following
criteria: adhesion to rock, layer thickness, semi-permeability, insolubility, and non-toxicity. The
polymer selection process yielded that a water-based polyurethane would present the benefits of
creating a waterproof and lightweight coating when applied to the rock analyzed as part of this
study. Polymer coated rock samples were tested in same manner as the uncoated rock samples
from the preliminary tests; where the results indicate a slight decrease in water absorption and an
increase in erosion durability. Intended future work will investigate the impact of application
technique on the durability and absorptive properties of coated rock samples.
5
Literature Review
Weathering and Undercutting
The construction of roads in mountainous regions often involves the creation of artificial slopes.
This process alters the natural slope angles, leading to possible roadside hazards. Slope failures
are especially prevalent in the Appalachian region of the Eastern United States. Among the
different types of cut slope failures affecting the Appalachian region, undercutting-induced rock
falls are among the most problematic. Rapid weathering and the subsequent erosion of weak
rock layers cause these failures. Undercutting is a process by which weak layers of shale erode
away, exposing large overhanging blocks of stronger rocks such as limestone and sandstone.
Exposed blocks of stronger rock can end up as rock falls along highways, presenting a hazard to
motorists and damage to the roadway [1]. Lanes and sometimes the entire roadway must be shut
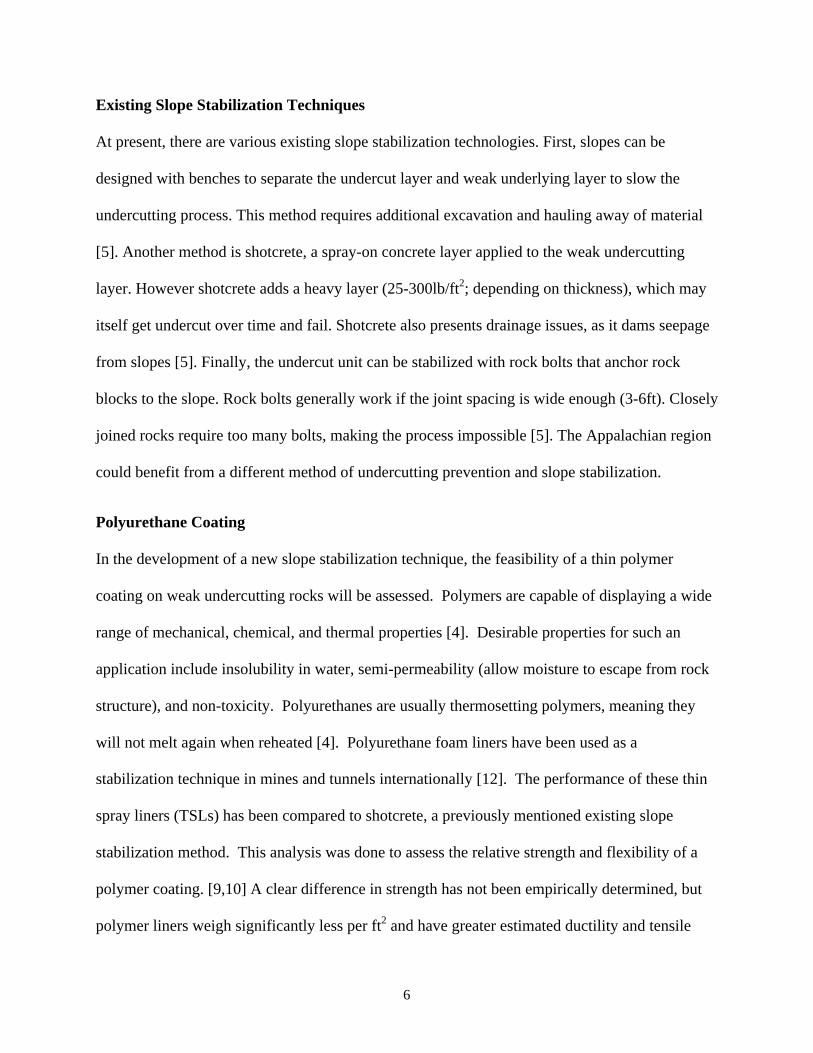
down in order to clear the rock hazard. An example of an undercutting-induced rock fall is
shown below in Figure 1.
Figure 1: Diagram of undercutting-induced rockfall (left); example of rockfall, showing weak
and strong rock layers (right)
6
Existing Slope Stabilization Techniques
At present, there are various existing slope stabilization technologies. First, slopes can be
designed with benches to separate the undercut layer and weak underlying layer to slow the
undercutting process. This method requires additional excavation and hauling away of material
[5]. Another method is shotcrete, a spray-on concrete layer applied to the weak undercutting
layer. However shotcrete adds a heavy layer (25-300lb/ft2; depending on thickness), which may
itself get undercut over time and fail. Shotcrete also presents drainage issues, as it dams seepage
from slopes [5]. Finally, the undercut unit can be stabilized with rock bolts that anchor rock
blocks to the slope. Rock bolts generally work if the joint spacing is wide enough (3-6ft). Closely
joined rocks require too many bolts, making the process impossible [5]. The Appalachian region
could benefit from a different method of undercutting prevention and slope stabilization.
Polyurethane Coating
In the development of a new slope stabilization technique, the feasibility of a thin polymer
coating on weak undercutting rocks will be assessed. Polymers are capable of displaying a wide
range of mechanical, chemical, and thermal properties [4]. Desirable properties for such an
application include insolubility in water, semi-permeability (allow moisture to escape from rock
structure), and non-toxicity. Polyurethanes are usually thermosetting polymers, meaning they
will not melt again when reheated [4]. Polyurethane foam liners have been used as a
stabilization technique in mines and tunnels internationally [12]. The performance of these thin
spray liners (TSLs) has been compared to shotcrete, a previously mentioned existing slope
stabilization method. This analysis was done to assess the relative strength and flexibility of a
polymer coating. [9,10] A clear difference in strength has not been empirically determined, but
polymer liners weigh significantly less per ft2 and have greater estimated ductility and tensile
7
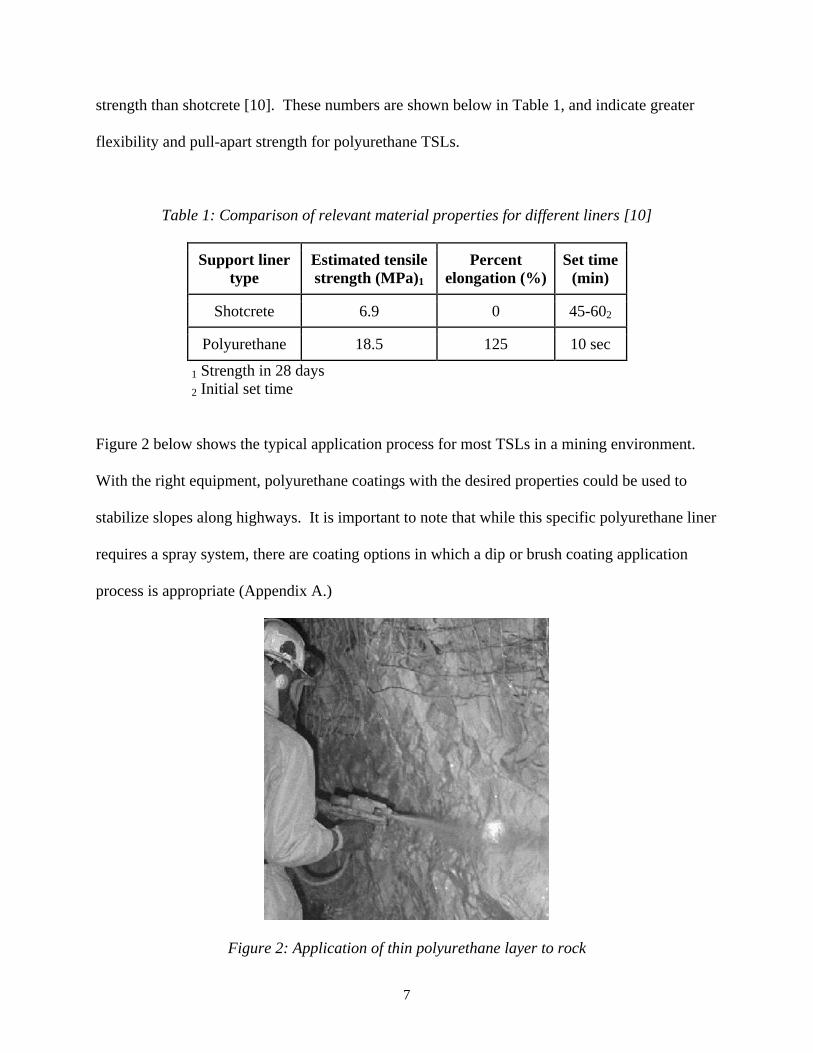
strength than shotcrete [10]. These numbers are shown below in Table 1, and indicate greater
flexibility and pull-apart strength for polyurethane TSLs.
Table 1: Comparison of relevant material properties for different liners [10]
Support liner type
Estimated tensile strength (MPa)1
Percent elongation (%)
Set time (min)
Shotcrete 6.9 0 45-602
Polyurethane 18.5 125 10 sec
1 Strength in 28 days 2 Initial set time
Figure 2 below shows the typical application process for most TSLs in a mining environment.
With the right equipment, polyurethane coatings with the desired properties could be used to
stabilize slopes along highways. It is important to note that while this specific polyurethane liner
requires a spray system, there are coating options in which a dip or brush coating application
process is appropriate (Appendix A.)
Figure 2: Application of thin polyurethane layer to rock

8
Self- Polymerized Dopamine Thin Film
As previously stated polymers can take many forms and display a wide range of properties.
Dopamine is a commonly known neurotransmitter, but it is also a key component of the sea
mussel fibers used to attach sea mussels to virtually any surface or material [16,18].
Figure 3: Mussels attached to rock (left) and teflon (right):
http://www.sciencedaily.com/releases/2007/10/071018142509.htm
Under alkaline conditions, dopamine solutions can self-polymerize to form thin films on various
surfaces [8,18]. Dopamine/ polydopamine films have proven to have promising adhesive
qualities, and have the ability to support a range of secondary treatment processes [15]. The
process by which dopamine films are formed and applied is shown on the next page, Figure 4.

9
Figure 4: Dopamine self-polymerizes in pH 8.5 and coats surface, this surface is then a reactive
platform for a wide range of applications [15]
Research focused on the material properties of dopamine thin films is limited. However,
dopamine coatings are known to be insoluble in water and its adhesive qualities prove extremely
effective in wet environments [15,17,18] This suggests that a dopamine coating may prove
effective in weathering prevention.
Thermoplastic Polyolefin Coating
Another polymeric coating typically exposed to aqueous conditions are thermoplastic
polyolefins, commonly used in pool coatings [11]. Looking closer, polyolefin coatings are
composed of both a thermoplastic polymer, and a resin to enhance performance and flexibility.
They display excellent adhesive properties to metal and concrete, and have excellent wear and
UV resistance [11]. These characteristics make Polyolefin coatings a decent candidate for
weathering and erosion protection of rocks. However these coatings require a thermal spray
application technique, shown below in Figure 5. This method may not be possible to replicate in
the laboratory due to the required equipment.

10
Figure 5: High-output polymer thermal spray application equipment for polyolefin coating [11]
Polymer Evaluation and Discussion
Each of the polymers discussed in the sections above present unique tradeoffs. Table 2 on the
next page is a summary of the project criteria and how each polymer qualifies. The data in this
table will be used to select an appropriate polymer for feasibility testing in a laboratory
environment. A specific product example of each polymer was selected for the completion of
the table (listed below), and data sheets for each product are included in Appendix A of this
document.
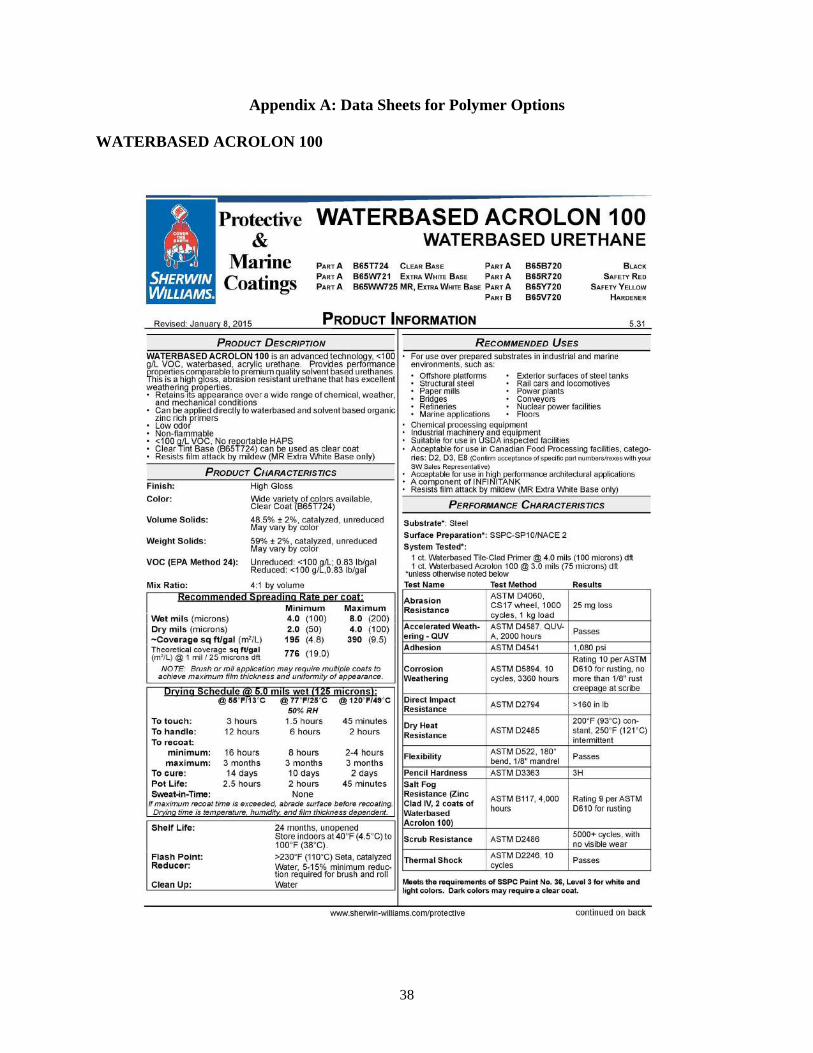
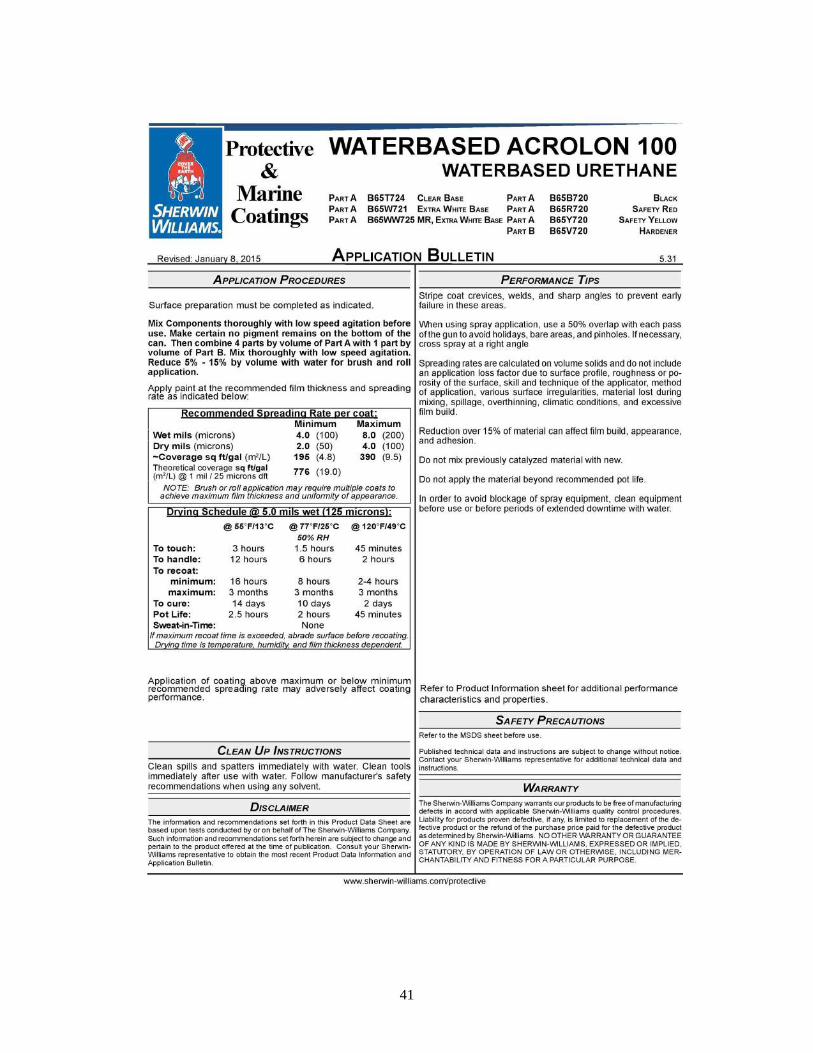
● Polyurethane: WATERBASED ACROLON 100, Sherwin Williams
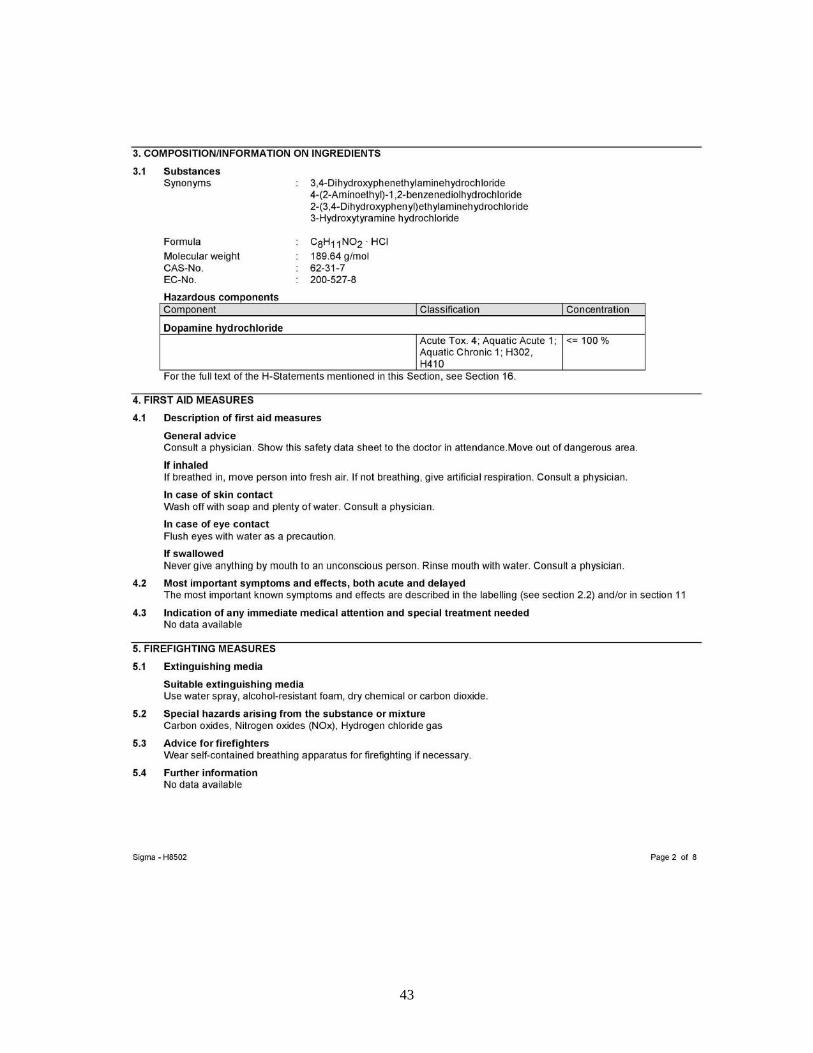
● Self-Polymerized Dopamine: Dopamine Hydrochloride, Sigma Aldrich
● Thermoplastic polyolefin: ResoCoat 301 Concrete and Fiberglass Pool and Spa Surface
Coating, Resodyn Corporation
11
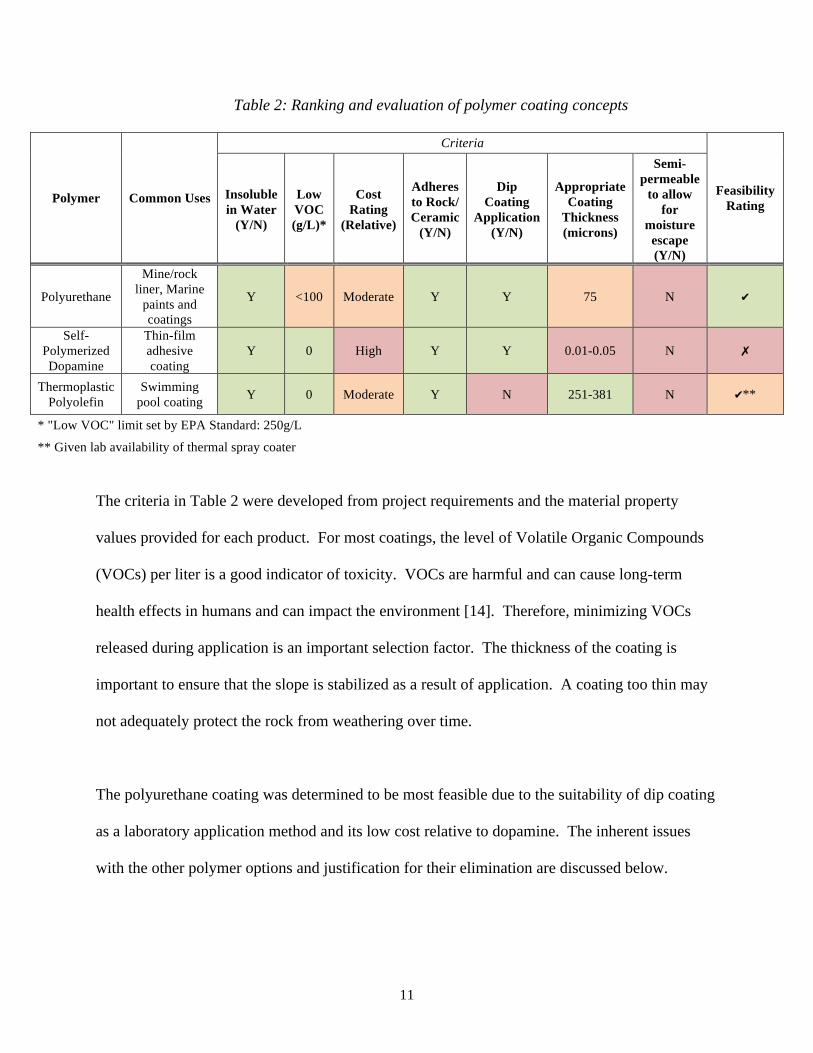
Table 2: Ranking and evaluation of polymer coating concepts
Polymer Common Uses
Criteria
Feasibility Rating
Insoluble in Water
(Y/N)
Low VOC (g/L)*
Cost Rating
(Relative)
Adheres to Rock/ Ceramic
(Y/N)
Dip Coating
Application (Y/N)
Appropriate Coating
Thickness (microns)
Semi-permeable
to allow for
moisture escape (Y/N)
Polyurethane
Mine/rock liner, Marine
paints and coatings
Y <100 Moderate Y Y 75 N ✔
Self-Polymerized Dopamine
Thin-film adhesive coating
Y 0 High Y Y 0.01-0.05 N ✗
Thermoplastic Polyolefin
Swimming pool coating
Y 0 Moderate Y N 251-381 N ✔**
* "Low VOC" limit set by EPA Standard: 250g/L
** Given lab availability of thermal spray coater
The criteria in Table 2 were developed from project requirements and the material property
values provided for each product. For most coatings, the level of Volatile Organic Compounds
(VOCs) per liter is a good indicator of toxicity. VOCs are harmful and can cause long-term
health effects in humans and can impact the environment [14]. Therefore, minimizing VOCs
released during application is an important selection factor. The thickness of the coating is
important to ensure that the slope is stabilized as a result of application. A coating too thin may
not adequately protect the rock from weathering over time.
The polyurethane coating was determined to be most feasible due to the suitability of dip coating
as a laboratory application method and its low cost relative to dopamine. The inherent issues
with the other polymer options and justification for their elimination are discussed below.

12
Elimination of Polymer Options
Self-Polymerized Dopamine ● Dopamine polymerizes to form an extremely thin film. This film is only 10-15 nm thick,
and would not be significant enough to stabilize the slope.
● Dopamine hydrochloride is a neurotransmitter, and is extremely expensive. As of March
2015, 100g of Dopamine hydrochloride costs ~$320.00. Although its adhesive properties
are significant, the cost is too high to conduct a laboratory feasibility study.
Thermoplastic Polyolefin ● As shown in the feasibility column of Table 2, the thermoplastic polyolefin is labeled
conditionally feasible. For application in a laboratory setting, high-output polymer
thermal spray equipment would be necessary for application of the polyolefin coating.
The use of specific equipment does not allow for the modification of the polymer being
applied.
Permeability of Polymer Coating
One of the main requirements for the polymer coating is permeability to liquid water. Water
naturally infiltrates through and seeps out of rock layers. The application of shotcrete involves
the installation of drainage holes to avoid water pressure buildup. This pressure buildup occurs
when water becomes trapped in rock structures due to natural infiltration and the location of the
water table. The pore size necessary for liquid water flow will depend on the level of pressure
buildup in the rock structure. This issue must be taken into account in the development of a
polymer solution as well. With the selection of polyurethane for the first feasibility test, two
concepts to create a permeable layer were researched and evaluated. The first concept involves
the creation of polyurethane foam.

13
Foams can be created either mechanically by agitation or mixing, or chemically by adding a
surfactant solution [7]. Sometimes, both are necessary to sustain a stable foam. It is unknown
how the water-based polyurethane will react to the addition of a surfactant. A simple and
inexpensive (10 USD/100g) surfactant was investigated for use in this project: Sodium dodecyl
sulfate (SDS.) SDS was selected on the basis of price and availability. Since it is not known
how the surfactant will perform, an inexpensive option (SDS) will first be assessed.
Experimentation is needed to determine the proper concentration of SDS solution to be added to
the polymer. If the bubbles are stable within the solution, it is predicted that they will be stable
once the coating has dried. Integration of the foaming process is outside the scope of this
project, and will be reserved for future work and investigation.
The second concept to create a permeable coating layer is by punching holes in the layer to allow
for drainage once the polymer has been applied. This concept stemmed from a US patent issued
in 1980, describing a protective plastic coating with one-way valve like perforations [13.] The
perforations are sized so that moisture within the underlying material can escape, but rainwater
cannot pass through to rot the material. The concept of perforations will be considered as
permeability of the polymer layer is considered. This research project proposes the investigation
of the properties of polyurethane coatings on clayey silicate rocks in order to test the feasibility
of such a solution in the realm of slope stabilization and weathering prevention. The
permeability of the polymer coating will be considered after initial testing of the polyurethane
has been completed and results verified feasible.
14
Laboratory Testing and Methods
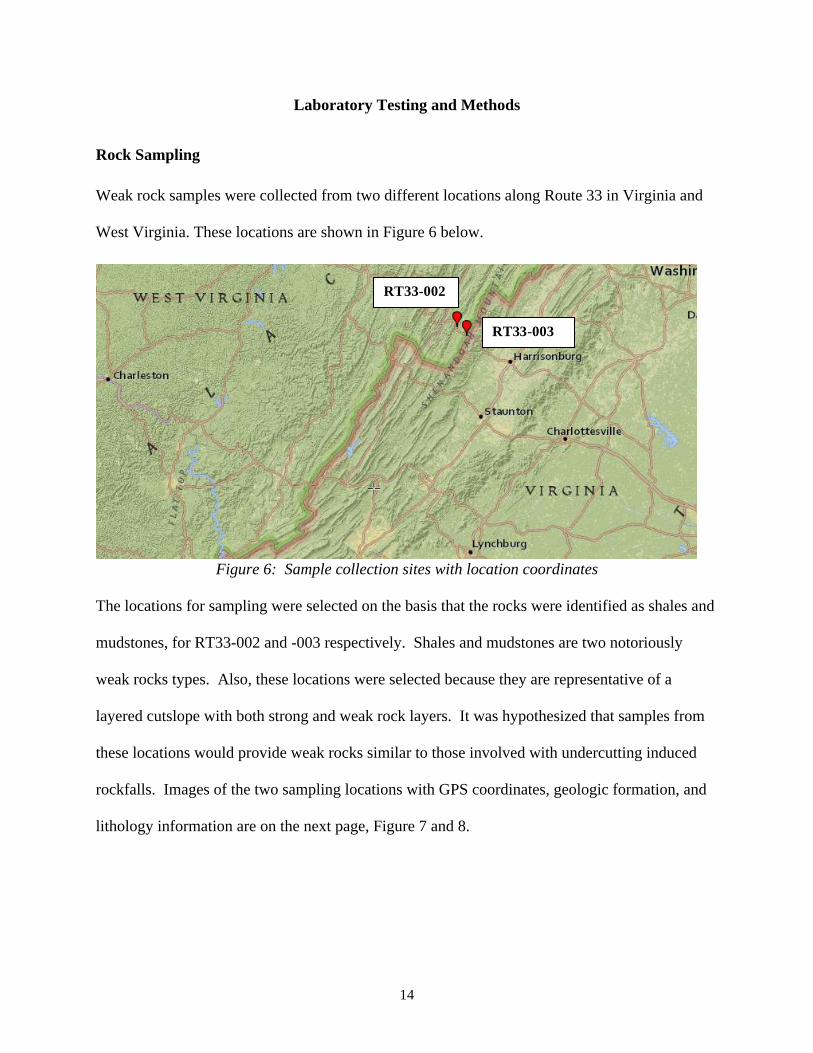
Rock Sampling Weak rock samples were collected from two different locations along Route 33 in Virginia and
West Virginia. These locations are shown in Figure 6 below.
Figure 6: Sample collection sites with location coordinates
The locations for sampling were selected on the basis that the rocks were identified as shales and
mudstones, for RT33-002 and -003 respectively. Shales and mudstones are two notoriously
weak rocks types. Also, these locations were selected because they are representative of a
layered cutslope with both strong and weak rock layers. It was hypothesized that samples from
these locations would provide weak rocks similar to those involved with undercutting induced
rockfalls. Images of the two sampling locations with GPS coordinates, geologic formation, and
lithology information are on the next page, Figure 7 and 8.
RT33-002
RT33-003

15
Figure 7: RT33-002 sampling location
Site ID: RT33-002
GPS Location: 38.6341670, -79.2308330
Geologic Formation: Millboro
Lithology: Shale
Figure 8: RT33-003 sampling location
Site ID: RT33-003
GPS Location: 38.5883330, -79.1677780
Geologic Formation: Hampshire
Lithology: Mudstone

16
Rock Characterization and Behavioral Observation
X-Ray Diffraction (XRD)
Next, each of the samples were characterized by x-ray diffraction. This was done in order to
determine the mineral composition of each sample and confirm that these rocks are in fact weak
shales and mudstones. X-rays are just below the visible light spectrum and range from .01-10
nm, meaning x-rays are high energy, high frequency, and short wavelength. Minerals have
unique atomic crystal lattices or arrangements, which can diffract x-rays in order to determine
the chemical composition of the mineral. Each mineral has characteristic d-spacing, but in order
to determine the true composition there must be enough d-spacings or peaks to form a fingerprint
of the mineral present. The fingerprint is used by a match search database that can correctly
identify the phase identity, phase purity, or percent phase composition of the sample. The
computer returns a graph, showing peaks that indicate a miller index matched to a known
mineral by the computer. The following methods were used for sample preparation and the XRD
analysis.
Sample Preparation
1. Acquire samples
2. If samples are too large to grind, use mill to get to a grindable state
3. Grind sample with pestle and mortar until a very fine powder
4. Place metal sample holder face down on glass plate.
5. Pile ground sample in the hole of sample holder until packed tightly
6. Place metal backing plate clip on sample holder
7. Rotate at least at a 45 degree angle to make sure sample is compact

17
8. Log in XRD book to keep track of when this trial occurred
9. Place in XRD and analyze
10. Clean equipment
XRD Analysis
1. Set up computer program
2. Open shutters
3. Set sample angle range and run time
4. Run sample
5. Transfer data to auto search chemical composition with the International Center for
Diffraction Database (ICDD) and Joint Committee on Powder Diffraction Standards (JCPDS.)
Jar Slake Test
A jar slake durability test was conducted for each sample type. The purpose of this test was to
observe the effect of a 24-hour water submersion on rock samples. The results indicate the
relative strength of the rock in an aqueous environment. This is important in understanding how
the rock might break down naturally, and provides a good baseline of the durability of the
samples. [6]
The samples used were approximately 50g each, completely submerged by at least 1 inch of
water. Specimens were observed at frequent intervals for the first 30 minutes, and after 24 hours
the final observations were made. The following scale (Table 3) was used to categorize the
behavior of the samples, once submerged [6.]

18
Table 3: Jar Slake Durability scale for categorizing behavior of shales [6]
Category Behavior
1 Degrades to pile of flakes or mud
2 Breaks rapidly and/or forms many chips
3 Breaks slowly and/or forms many chips
4 Breaks rapidly and/or develops few fractures
5 Breaks slowly and/or develops few fractures
6 No changes
Initial (Uncoated) and Polyurethane Coated Rock Testing
24 Hour Absorption: ASTM §D6473 - 10
The purpose of absorption testing is to determine the susceptibility of rock samples to water
influx, resulting in increased mass. Ideally, the polyurethane coating will result in reduced
absorption and mass increase. This will be achieved by first completing a set of baseline
absorption tests of uncoated rock samples. These values will then be compared to the results of a
set of comparison tests in which the rock samples have been coated with polyurethane.
Rock samples were cut to a minimum of 1kg (2.2lb) in mass. These values were recorded as
initial masses for each trial. Each specimen was air-dried and placed in water between 20 and
30°C for 24± 4hr. After 24 hours elapsed, the specimens were removed from the water and
toweled dry to remove any visible films of water. The specimens were weighed again to obtain a

19
final mass value for each trial. [3] These recorded mass values were then used to calculate the %
absorption of the samples, using Equation 1.
absorption, % = [(B - A)/A] × 100 Eq. 1
Where A= mass of air-dried test specimen, g,
B= mass of saturated-surface dry test specimen, g
As previously stated, this experiment was replicated for the polyurethane-coated samples for
comparison. A similar process was also applied to the next experiment, the slake durability test.
Slake Durability Index (SDI): ASTM §D4644 - 08
The purpose of the slake durability test described in this section is to determine how weak the
rock samples are and how well they are able to resist erosion. In this test, erosion is simulated by
two wetting cycles and abrasion. This test requires the use of a slake durability device. This
device was made available through the James Madison University Department of Geology and
Environmental Science. A schematic of the durability device is shown below, Figure 9.
Figure 9: Slake durability device, showing critical dimensions [2]

20
Each trial required ten intact and roughly equidimensional shale fragments that weigh between
40 and 60 g each. The total test specimen for each trial weighed between 450 and 550 g. The
specimens were oven-dried at 110°C for 24 hours before the first slake cycle. The trough was
filled with room temperature distilled water to a level 20mm below the drum axis (see Figure 9.)
The specimens were loaded into the drum and were rotated at 20 rpm for 10 minutes. The
specimens were removed and again oven-dried for 24 hours. An oven-dried mass was obtained
for the first cycle, and the process was repeated for a second slake cycle. [2] Photographs were
taken at each stage to show deterioration, as the slake durability index is not always
representative of the true durability of the specimen. The mass values recorded throughout the
trial were then used to calculate the slake durability index (second cycle), using Equation 2.
Id(2) = [WF/B] × 100 Eq. 2
Where Id(2) = slake durability index (second cycle),
B = mass of oven-dried specimen before the first cycle, g
WF = mass of oven-dried specimen retained after the second cycle, g
The SDI values range from 0 to 100, as they are representations of the percentage of
material/rock retained after two tumbling cycles. In addition to the calculation of SDI values for
each trial, a description of the rock fragments after the second cycle was recorded. As previously
stated this method was conducted first as a baseline test, and again after the samples had been
coated with polyurethane. The same procedure was used in both instances.

21
Results
Rock Characterization and Behavioral Observation
X-Ray Diffraction (XRD)
The results for the RT33-002 samples are below, Figure 10.
Figure 10: XRD Results for RT33-002
The results show a dramatic spike in quartz, SiO2, indicating the main mineral composition of
the sample. Additional peaks of muscovite, KAl2(AlSi3O10)(F,OH)2, and Illite, which is the
breakdown of muscovite. Feldspar and its breakdown, Kaolinite, are very common clay minerals
and were also present in this sample to some extent.
Quartz
Quartz
Kaolinite
Kaolinite
Muscovite
Muscovite
22
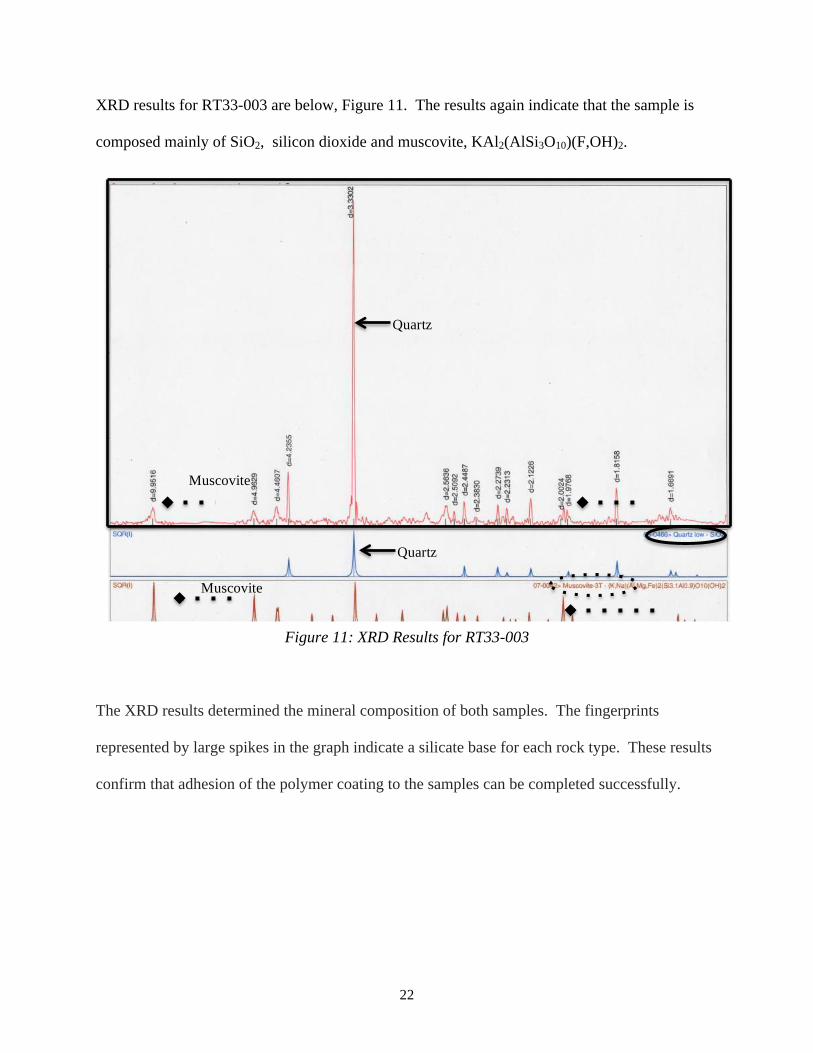
XRD results for RT33-003 are below, Figure 11. The results again indicate that the sample is
composed mainly of SiO2, silicon dioxide and muscovite, KAl2(AlSi3O10)(F,OH)2.
Figure 11: XRD Results for RT33-003
The XRD results determined the mineral composition of both samples. The fingerprints
represented by large spikes in the graph indicate a silicate base for each rock type. These results
confirm that adhesion of the polymer coating to the samples can be completed successfully.
Quartz
Quartz
Muscovite
Muscovite

23
Jar Slake Durability
Three trials were conducted for each sample type. When subjected to the jar slake durability test,
each rock type behaved similarly overall. The results for RT33-002 are below in Table 4.
Table 4: Uncoated RT33-002 Results of Jar Slake Durability
Trial Behavior (24 Hours)
1 6- No changes
2 6- No changes
3 6- No changes
The RT33-002 samples displayed no deterioration, cracking or changes whatsoever. These
results indicate that the samples collected from site RT33-002 are inherently strong shales. This
could also be due in part to the mainly silicate composition. The results for site RT33-003 are
below in Table 5.
Table 5: Uncoated RT33-003 Results of Jar Slake Durability
Trial Behavior (24 Hours)
1 6- No changes
2 5- Breaks slowly and/or develops few fractures
3 5- Breaks slowly and/or develops few fractures
The results indicate that the samples collected from site RT33-003 are slightly stronger than
those collected from RT33-002. Small fractures developed throughout the 24-hour period. This
makes RT33-003 samples more desirable for this feasibility study, due to their slightly weaker
nature.

24
Initial (Uncoated) Rock Testing
24 Hour Absorption
This section investigates results from the uncoated rock testing. At the conclusion of the 24 hour
time period, the samples were removed and weighed. It should be noted that only 1 trial was
conducted for the RT33-002 rock samples. This decision will be discussed in greater detail in
the next section of this report (Slake Durability Index (SDI).) The result is below in Table 6.
Table 6: Absorption results for uncoated RT33-002 sample
Trial # Initial Mass- air dried (g) Final Mass (g) Absorption, % 1 1226.07 1239.91 1.129%
Table 7 below shows the results for the uncoated RT33-003 samples. The mean absorption was
0.85%, with a standard deviation of 0.70%. The uncertainty due to measurement error was
calculated to be ±0.012%, as calculated in Appendix B of this report.
Table 7: Absorption results for uncoated RT33-003 samples
Trial # Initial Mass- air dried (g) Final Mass (g) Absorption, % 1 1392.24 1415.29 1.656% 2 1055.5 1061.09 0.530% 3 1037.16 1040.96 0.366%
µ = 0.851% σ = 0.702% Uncertainty, ± = 0.012%

25
Slake Durability Index (SDI)
After the second slake cycle and oven dry, the samples were weighed a final time. The SDI
results for uncoated RT33-002 samples are shown below in Table 8.
Table 8: SDI results for uncoated RT33-002 samples
Trial #
Initial Mass After Oven Dry
#1 (g) First Slake
Cycle
Mass After First Cycle
(g) Second
Slake Cycle
Mass After Second
Cycle (g)
Slake Durability
Index (SDI)
1 434.53 431.27 429.89 98.93
2 502.67 499.98 498.05 99.08
3 511.97 508.25 505.52 98.74
µ = 98.92 σ = 0.17 Uncertainty, ± = 0.029
The results for the RT33-002 samples validate the jar slake durability result from the previous
section. The shale samples collected at this location are extremely strong, as they returned SDI
values of 98.92 ± 0.03, with a standard deviation of 0.17. The strength of the RT33-002 samples
makes them less applicable to this project. Their durability also presented challenges in the
sample preparation process. The collected samples proved extremely difficult to cut with the
rock saw. Due to the sheer number of samples necessary for testing and the viability of the
RT33-003 rocks, continuing to use RT33-002 is unnecessary for the completion of this project.
Table 9 is populated with the SDI results for the uncoated RT33-003 samples.
26
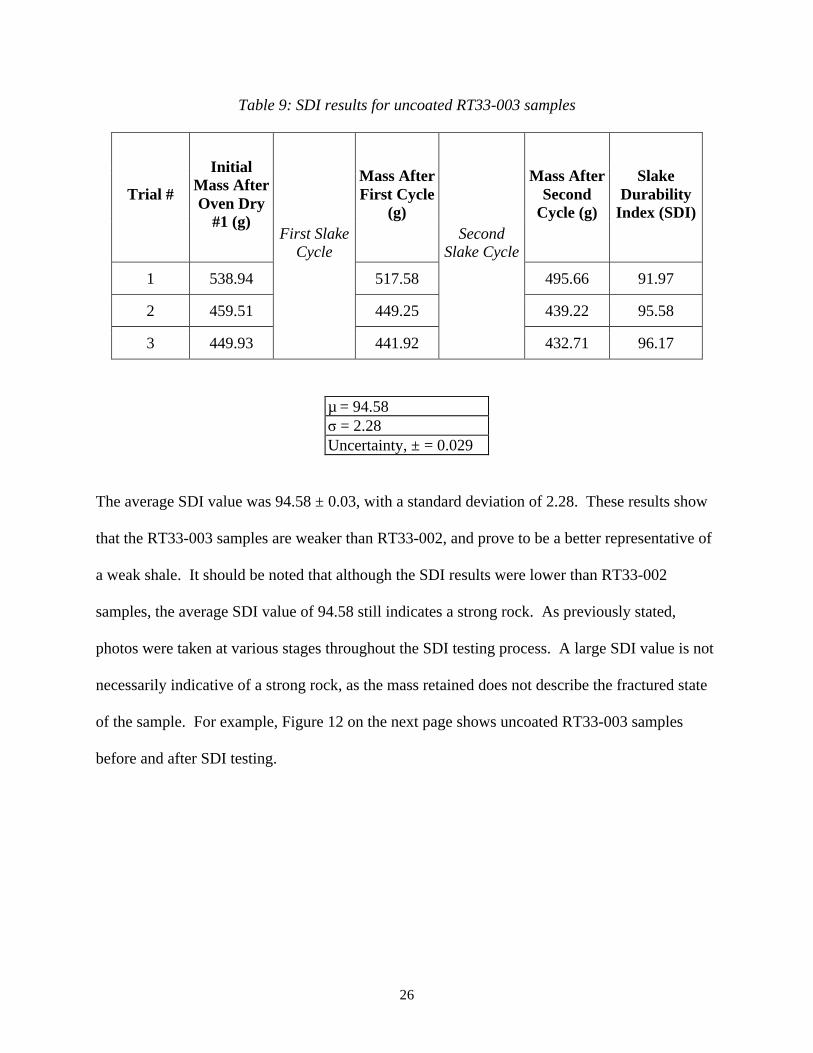
Table 9: SDI results for uncoated RT33-003 samples
Trial #
Initial Mass After Oven Dry
#1 (g) First Slake
Cycle
Mass After First Cycle
(g) Second
Slake Cycle
Mass After Second
Cycle (g)
Slake Durability
Index (SDI)
1 538.94 517.58 495.66 91.97
2 459.51 449.25 439.22 95.58
3 449.93 441.92 432.71 96.17
µ = 94.58 σ = 2.28 Uncertainty, ± = 0.029
The average SDI value was 94.58 ± 0.03, with a standard deviation of 2.28. These results show
that the RT33-003 samples are weaker than RT33-002, and prove to be a better representative of
a weak shale. It should be noted that although the SDI results were lower than RT33-002
samples, the average SDI value of 94.58 still indicates a strong rock. As previously stated,
photos were taken at various stages throughout the SDI testing process. A large SDI value is not
necessarily indicative of a strong rock, as the mass retained does not describe the fractured state
of the sample. For example, Figure 12 on the next page shows uncoated RT33-003 samples
before and after SDI testing.
27
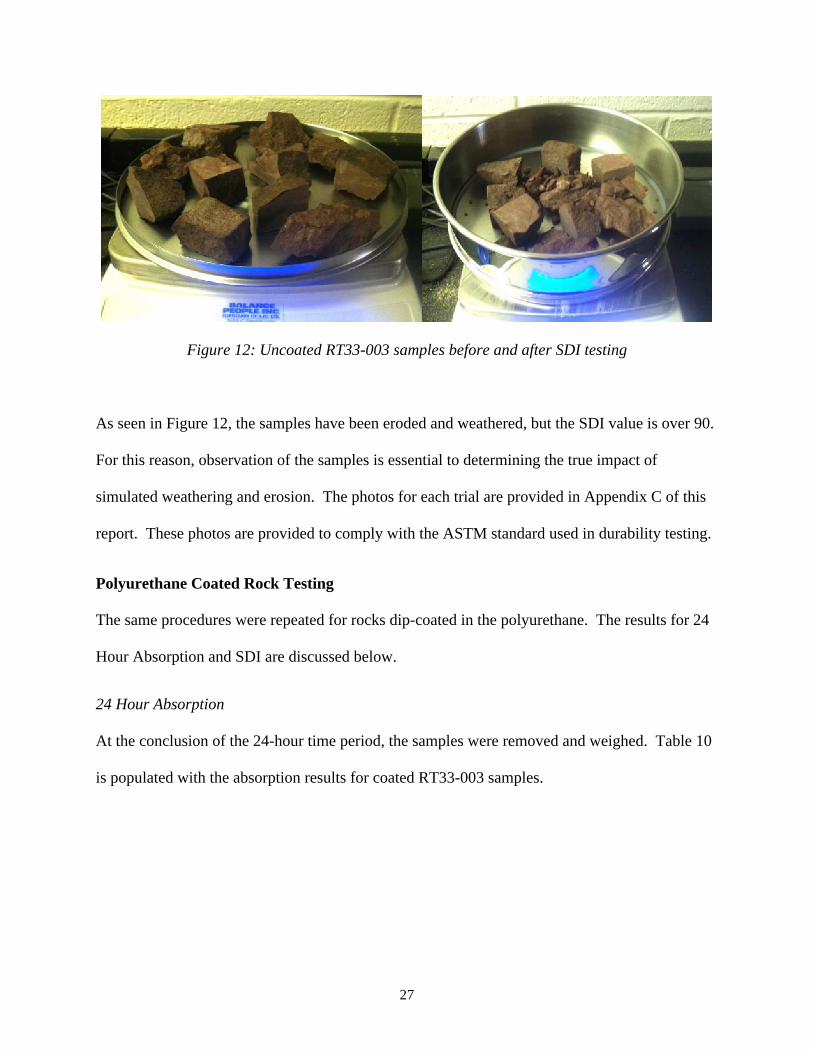
Figure 12: Uncoated RT33-003 samples before and after SDI testing
As seen in Figure 12, the samples have been eroded and weathered, but the SDI value is over 90.
For this reason, observation of the samples is essential to determining the true impact of
simulated weathering and erosion. The photos for each trial are provided in Appendix C of this
report. These photos are provided to comply with the ASTM standard used in durability testing.
Polyurethane Coated Rock Testing
The same procedures were repeated for rocks dip-coated in the polyurethane. The results for 24
Hour Absorption and SDI are discussed below.
24 Hour Absorption
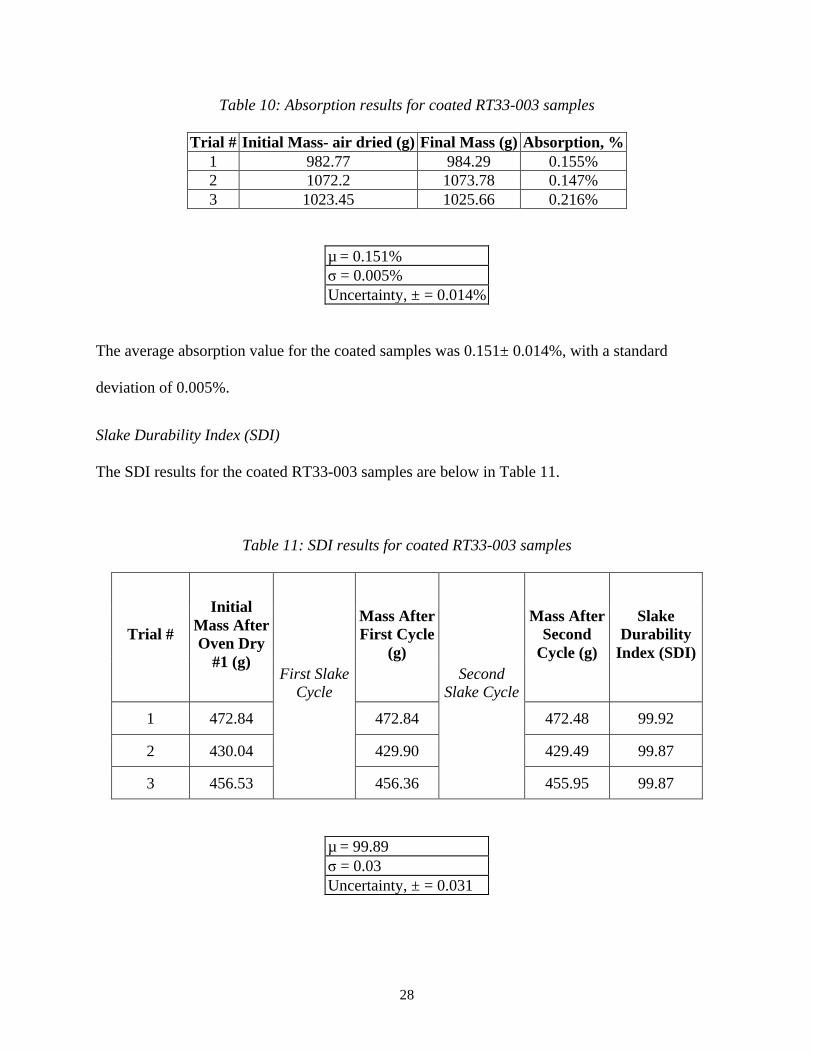
At the conclusion of the 24-hour time period, the samples were removed and weighed. Table 10
is populated with the absorption results for coated RT33-003 samples.
28
Table 10: Absorption results for coated RT33-003 samples
Trial # Initial Mass- air dried (g) Final Mass (g) Absorption, % 1 982.77 984.29 0.155% 2 1072.2 1073.78 0.147% 3 1023.45 1025.66 0.216%
µ = 0.151% σ = 0.005% Uncertainty, ± = 0.014%
The average absorption value for the coated samples was 0.151± 0.014%, with a standard
deviation of 0.005%.
Slake Durability Index (SDI)
The SDI results for the coated RT33-003 samples are below in Table 11.
Table 11: SDI results for coated RT33-003 samples
Trial #
Initial Mass After Oven Dry
#1 (g) First Slake
Cycle
Mass After First Cycle
(g) Second
Slake Cycle
Mass After Second
Cycle (g)
Slake Durability
Index (SDI)
1 472.84 472.84 472.48 99.92
2 430.04 429.90 429.49 99.87
3 456.53 456.36 455.95 99.87
µ = 99.89 σ = 0.03 Uncertainty, ± = 0.031

29
The average SDI value was 99.89 ± 0.03, with a standard deviation of 0.03. These values
indicate that the polymer coating strengthened the samples. Images of the samples before and
after SDI testing show that there was significantly less deterioration, and hardly any loss of mass
during the experiment. This is shown below, Figure 13.
Figure 13: Coated RT33-003 samples before and after SDI testing

30
Discussion
This section discusses the differences between the results of the uncoated and coated samples for
both absorption and SDI testing. Absorption values for each trial are plotted on Figure 14,
below. The large standard deviation in the uncoated samples causes a dramatic effect on the
graph, but there is still a slight difference in the smallest %mass value for uncoated samples and
the largest value for the coated samples.
Figure 14: Absorption result comparison: RT33-003 uncoated and coated samples
The SDI results are a little less variable, with standard deviations of 2.28 and 0.03 for the
uncoated and coated trials respectively. Figure 15 shows a comparison between the uncoated
and coated samples.

31
Figure 15: SDI result comparison: RT33-003 uncoated and coated samples
As previously stated, differences in the samples are also assessed by observation. The more
significant difference in deterioration is concluded from these photographs.

32
Conclusions
The purpose of this feasibility study was to compare the weathering and erosive properties of
both uncoated weak rock samples, and rock samples coated with a weather-resistant thermoset
polymer: polyurethane. It was hypothesized that a thin coating of the polyurethane polymer
would result in changes to the properties of absorption and erosion/weathering resistance of
silicate-based rock samples. Data was obtained through 24-hour water absorption tests and slake
durability testing to measure % mass increase and slake durability index (SDI) values. Uncoated
samples absorbed an average of 0.850±0.012%, and coated samples an average of 0.151±
0.014%. The average SDI value for uncoated rocks samples was 94.58 ± 0.03, and the average
SDI for the coated samples was 99.89 ± 0.03. These results indicate a slight decrease in
absorption (%mass) and an increase in SDI values of the samples. The polyurethane coating has
passed initial feasibility tests. Intended future work will consider the permeability of the
polymer coating to liquid water.

33
Future Work
As previously discussed, the next phase of this project will deal directly with the permeability of
the polyurethane coating. There are several methods by which this can be achieved. The most
promising method to investigate is the addition of a surfactant, Sodium dodecyl sulfate (SDS), to
create polyurethane foam. The Critical Micelle Concentration (CMC) of SDS in pure water is
about 8.2mM. The CMC is the concentration above which micelles are formed and continue to
form. Micelles are essential to the stability of the foam. It is unknown how the surfactant will
react with polyurethane, so experimentation will be necessary to determine the best ratio of
surfactant to solution. Experiments with 2x, 4x, 8x, and 16x the CMC concentration will be
attempted to ensure proper foamability with the presence of the urethane.
Additional work may also include the acquisition of different rock samples that are more
representative of weak and highly erodible shale. Investigating the impact of the polymer
coating on rocks with lower SDI values will be more indicative of its potential to slow
weathering and erosion.
34
Acknowledgements
This project was sponsored in part by a Madison Trust Innovation Grant, awarded in Fall 2014. I
would like to thank my advisor, Dr. Kyle Gipson of the Department of Engineering, my readers;
Dr. Yonathan Admassu of the Department of Geology and Environmental Science, and Dr. Elise
Barrella of the Department of Engineering for their support and guidance throughout the
completion of this project. Thank you to JMU geology student Caryn Martin (‘16), and JMU
engineering student Garret Brown (‘16) for their unwavering interest and laboratory assistance.
Thank you to Dr. Klebert Feitosa of the Department of Physics and Astronomy for his useful and
constructive recommendations on the continuation of this project. And a very special thanks to
Ron Phillips, Lab Manager within the Department of Geology and Environmental Science, for
his laboratory expertise, understanding, and feedback throughout this project.
35
References
[1] Admassu, Y., Shakoor, A., & Wells, N. A. (2012). Evaluating selected factors affecting the
depth of undercutting in rocks subject to differential weathering.Engineering Geology, 124, 1-11.
[2] ASTM D4644-08, Standard Test Method for Slake Durability of Shales and Similar Weak
Rocks, ASTM International, West Conshohocken, PA, 2008, www.astm.org
[3] ASTM D6473-10, Standard Test Method for Specific Gravity and Absorption of Rock For
Erosion Control, ASTM International, West Conshohocken, PA, 2010, www.astm.org
[4] Callister, W. (2007). Materials science and engineering: An introduction (7th ed.). New
York: John Wiley & Sons.
[5] Highland, L. and Bobrowsky, P. (2008). The Landslide Handbook— A Guide to
Understanding Landslides. 1st ed. [ebook] Reston, VA: United States Geological Survey
(USGS), Appendix C. Available at: http://pubs.usgs.gov/circ/1325/pdf/Sections/AppendixC.pdf
[Accessed 1 Dec. 2014].
[6] Hopkins, T. C., & Deen, R. C. (1983). Identification of shales.
[7] Joseph, D. D. (1997). Understanding foams & foaming. Journal of Fluids Engineering, May.

36
[8] Lee, H., Dellatore, S., Miller, W., & Messersmith, P. (2007). Mussel-Inspired Surface
Chemistry for Multifunctional Coatings. Science, 318(5849), 426-430.
[9] Morton, E., & Thompson, A. (2008). Static Testing of Shotcrete and Membranes for Mining
Applications. International Symposium on Ground Support in Mining and Civil Engineering
Construction, 6, 195-212.
[10] Pappas, D., & Barton, T. (2004). The Long-Term Performance of Surface Support Liners
for Ground Control in A Underground Limestone Mine. In Surface support in mining (pp. 157-
166). Australia: Australian Centre for Geomechanics.
[11] Stefanescu, E. (2013, June). Polymer Thermal Spray Polymer Thermal Spray Coatings and
Application Coatings and Application Techniques Techniques. Lecture conducted from Resodyn
Corporation.
[12] Tannant, D. (2001). Thin spray-on liners for underground rock support. International
Mining Congress and Exhibition of Turkey.
[13] Totten, C. D. (1980). U.S. Patent No. 4,181,764. Washington, DC: U.S. Patent and
Trademark Office.
[14] USEPA. (2010, February 17). An Introduction to Indoor Air Quality: Volatile Organic
Compounds (VOCs). Retrieved March 22, 2015, from http://www.epa.gov/iaq/voc.html

37
[15] Waite, J. (2008). Surface chemistry: Mussel power. Nature Materials, 7, 8-9.
[16] Wei, Q., Zhang, F., Li, J., Li, B., & Zhao, C. (2010). Oxidant-induced dopamine
polymerization for multifunctional coatings. Polymer Chemistry, 1, 1430-1433.
[17] Xi, Z., Xu, Y., Zhu, L., Wang, Y., & Zhu, B. (2009). A facile method of surface
modification for hydrophobic polymer membranes based on the adhesive behavior of
poly(DOPA) and poly(dopamine). Journal of Membrane Science, 244-253.
[18] Yang, F., & Zhao, B. (2011). Adhesion Properties of Self-Polymerized Dopamine Thin
Film. The Open Surface Science Journal, 3, 115-122.
38
Appendix A: Data Sheets for Polymer Options
WATERBASED ACROLON 100

39

40
41

42
Dopamine hydrochloride
43
44
45

46

47

48

49

50
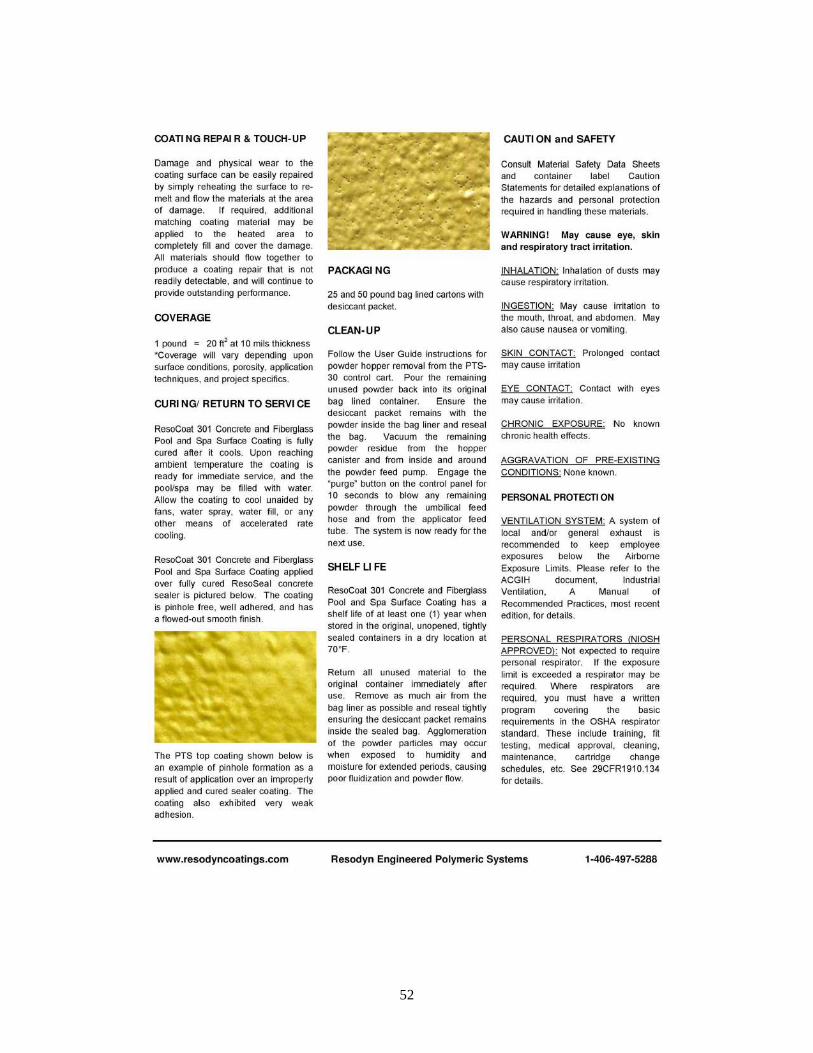
ResoCoat 301 Concrete and Fiberglass Pool and Spa Surface Coating
51
52

53
54
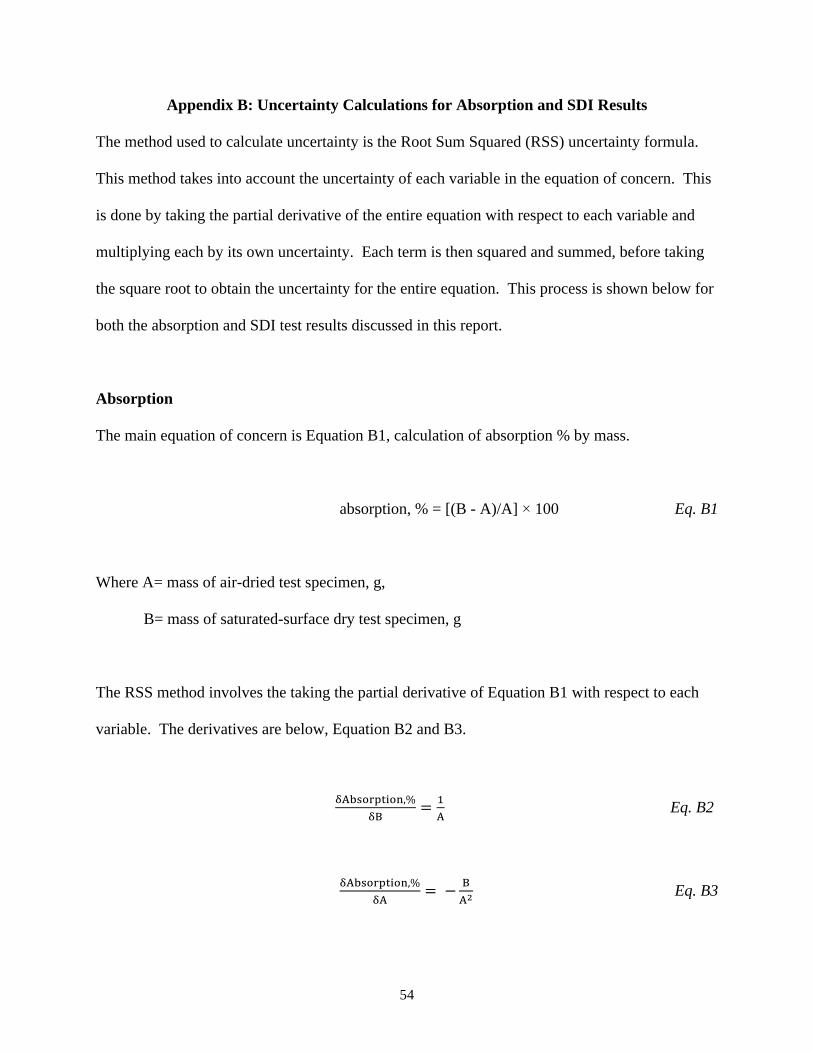
Appendix B: Uncertainty Calculations for Absorption and SDI Results
The method used to calculate uncertainty is the Root Sum Squared (RSS) uncertainty formula.
This method takes into account the uncertainty of each variable in the equation of concern. This
is done by taking the partial derivative of the entire equation with respect to each variable and
multiplying each by its own uncertainty. Each term is then squared and summed, before taking
the square root to obtain the uncertainty for the entire equation. This process is shown below for
both the absorption and SDI test results discussed in this report.
Absorption
The main equation of concern is Equation B1, calculation of absorption % by mass.
absorption, % = [(B - A)/A] × 100 Eq. B1
Where A= mass of air-dried test specimen, g,
B= mass of saturated-surface dry test specimen, g
The RSS method involves the taking the partial derivative of Equation B1 with respect to each
variable. The derivatives are below, Equation B2 and B3.
!!"#$%&'($),%!!
= !! Eq. B2
!!"#$%&'($),%!!
= − !!! Eq. B3
55
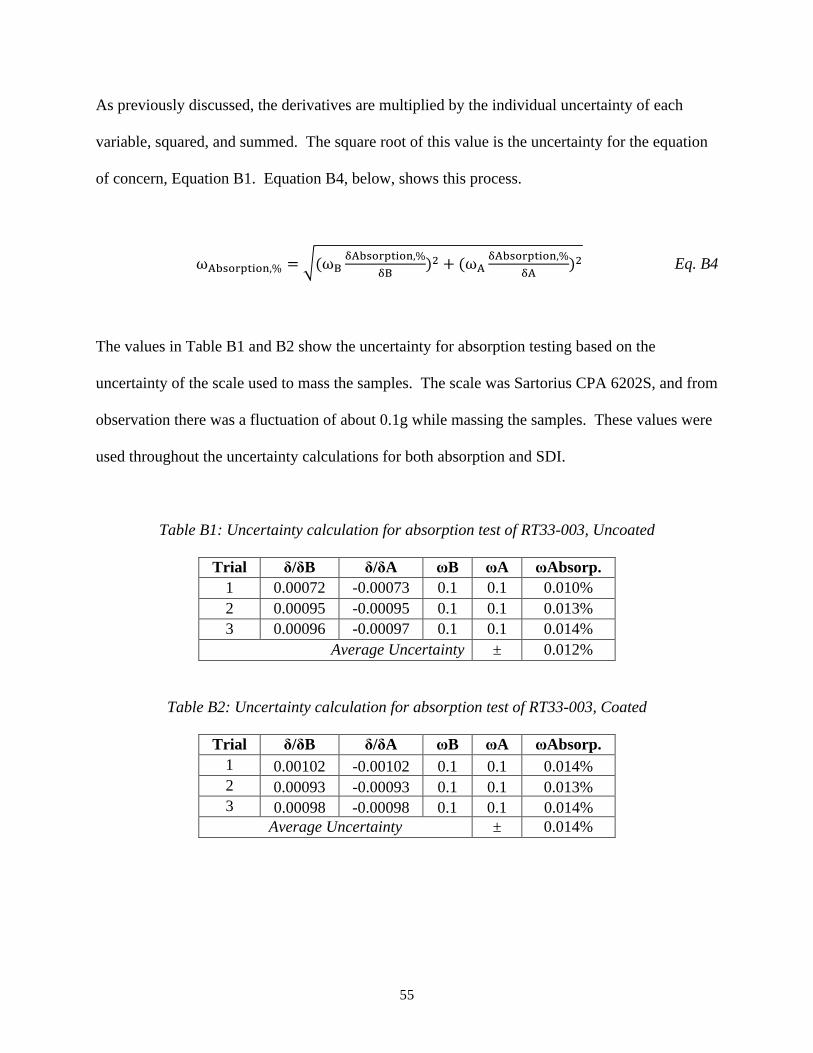
As previously discussed, the derivatives are multiplied by the individual uncertainty of each
variable, squared, and summed. The square root of this value is the uncertainty for the equation
of concern, Equation B1. Equation B4, below, shows this process.
ω!"#$%&'($),% = (ω!!!"#$%&'($),%
!!)! + (ω!
!!"#$%&'($),%!!
)! Eq. B4
The values in Table B1 and B2 show the uncertainty for absorption testing based on the
uncertainty of the scale used to mass the samples. The scale was Sartorius CPA 6202S, and from
observation there was a fluctuation of about 0.1g while massing the samples. These values were
used throughout the uncertainty calculations for both absorption and SDI.
Table B1: Uncertainty calculation for absorption test of RT33-003, Uncoated
Trial δ/δB δ/δA ωB ωA ωAbsorp. 1 0.00072 -0.00073 0.1 0.1 0.010% 2 0.00095 -0.00095 0.1 0.1 0.013% 3 0.00096 -0.00097 0.1 0.1 0.014%
Average Uncertainty ± 0.012%
Table B2: Uncertainty calculation for absorption test of RT33-003, Coated
Trial δ/δB δ/δA ωB ωA ωAbsorp. 1 0.00102 -0.00102 0.1 0.1 0.014% 2 0.00093 -0.00093 0.1 0.1 0.013% 3 0.00098 -0.00098 0.1 0.1 0.014%
Average Uncertainty ± 0.014%
56
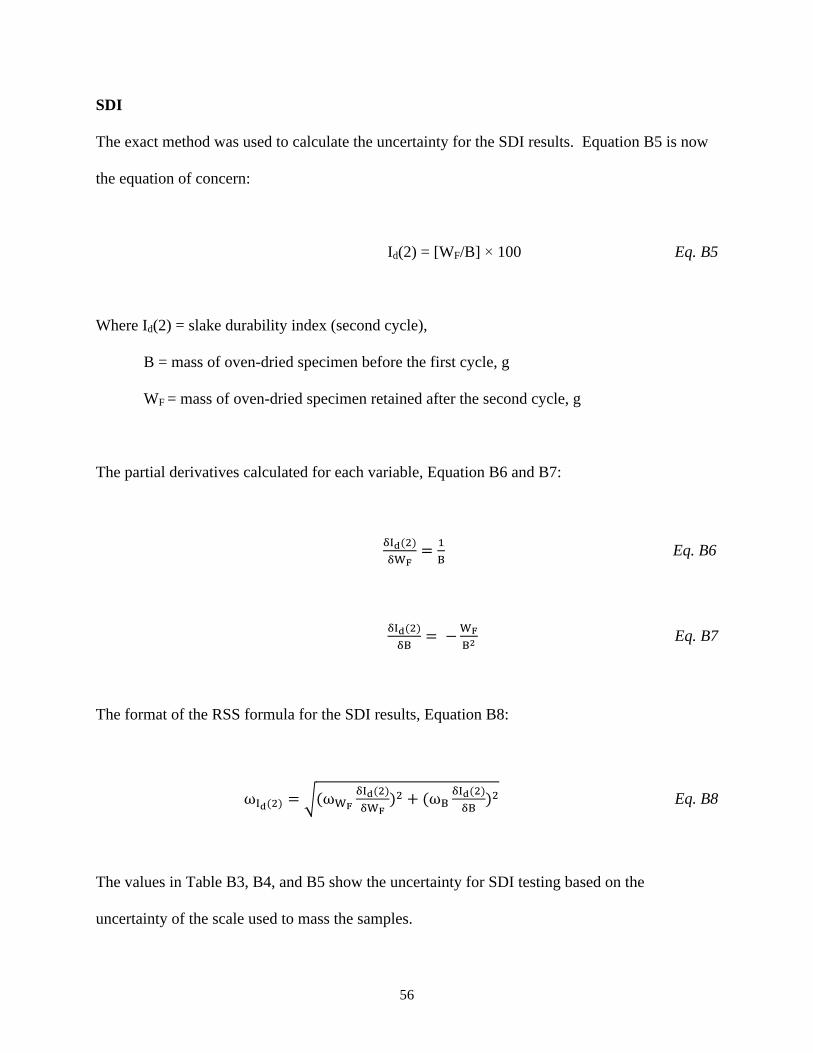
SDI
The exact method was used to calculate the uncertainty for the SDI results. Equation B5 is now
the equation of concern:
Id(2) = [WF/B] × 100 Eq. B5
Where Id(2) = slake durability index (second cycle),
B = mass of oven-dried specimen before the first cycle, g
WF = mass of oven-dried specimen retained after the second cycle, g
The partial derivatives calculated for each variable, Equation B6 and B7:
!!!(!)!!!
= !! Eq. B6
!!!(!)!!
= −!!!! Eq. B7
The format of the RSS formula for the SDI results, Equation B8:
ω!!(!) = (ω!!!!!(!)!!!
)! + (ω!!!!(!)!!
)! Eq. B8
The values in Table B3, B4, and B5 show the uncertainty for SDI testing based on the
uncertainty of the scale used to mass the samples.
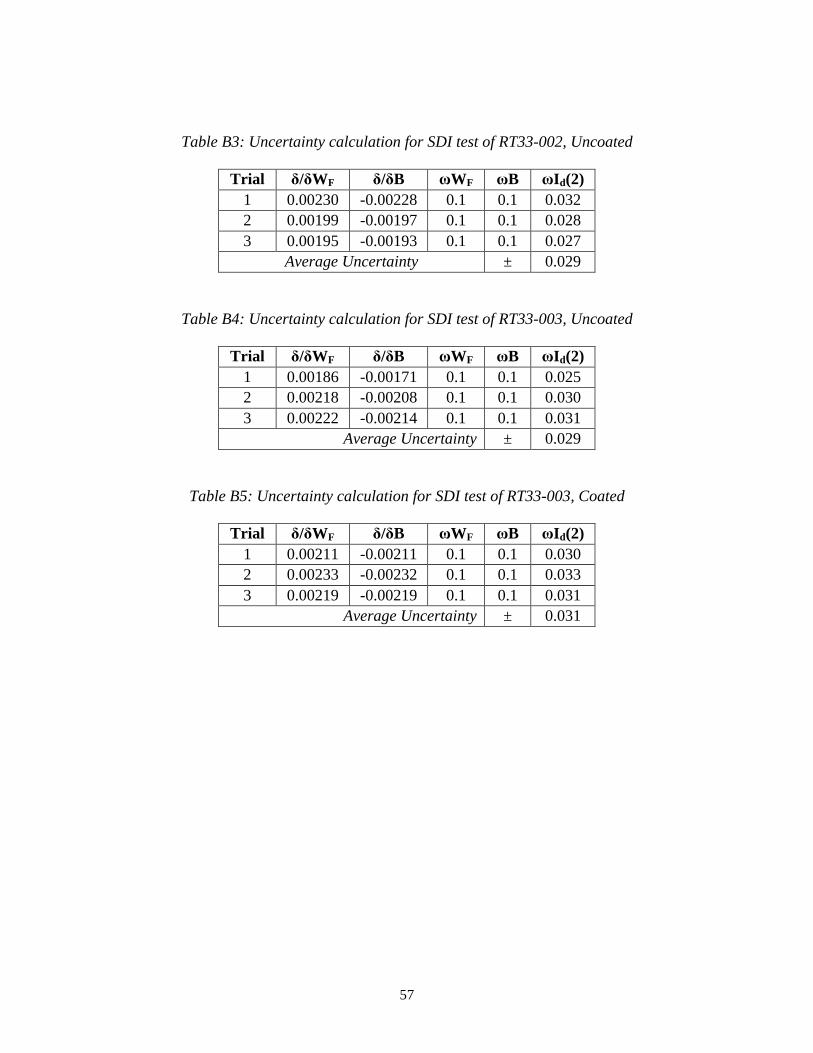
57
Table B3: Uncertainty calculation for SDI test of RT33-002, Uncoated
Trial δ/δWF δ/δB ωWF ωB ωId(2) 1 0.00230 -0.00228 0.1 0.1 0.032 2 0.00199 -0.00197 0.1 0.1 0.028 3 0.00195 -0.00193 0.1 0.1 0.027
Average Uncertainty ± 0.029
Table B4: Uncertainty calculation for SDI test of RT33-003, Uncoated
Trial δ/δWF δ/δB ωWF ωB ωId(2) 1 0.00186 -0.00171 0.1 0.1 0.025 2 0.00218 -0.00208 0.1 0.1 0.030 3 0.00222 -0.00214 0.1 0.1 0.031
Average Uncertainty ± 0.029
Table B5: Uncertainty calculation for SDI test of RT33-003, Coated
Trial δ/δWF δ/δB ωWF ωB ωId(2) 1 0.00211 -0.00211 0.1 0.1 0.030 2 0.00233 -0.00232 0.1 0.1 0.033 3 0.00219 -0.00219 0.1 0.1 0.031
Average Uncertainty ± 0.031
58
Appendix C: Data Sheets and SDI Photos
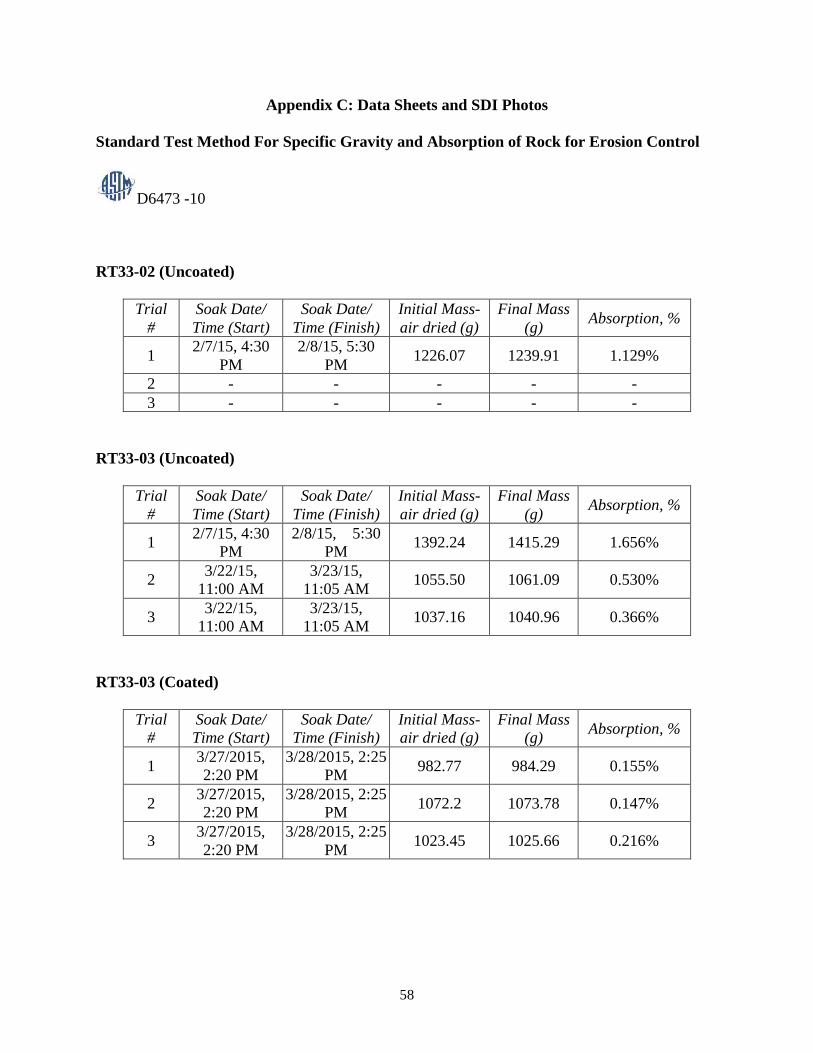
Standard Test Method For Specific Gravity and Absorption of Rock for Erosion Control
D6473 -10
RT33-02 (Uncoated)
Trial #
Soak Date/ Time (Start)
Soak Date/ Time (Finish)
Initial Mass- air dried (g)
Final Mass (g)
Absorption, %
1 2/7/15, 4:30
PM 2/8/15, 5:30
PM 1226.07 1239.91 1.129%
2 - - - - - 3 - - - - -
RT33-03 (Uncoated)
Trial #
Soak Date/ Time (Start)
Soak Date/ Time (Finish)
Initial Mass- air dried (g)
Final Mass (g)
Absorption, %
1 2/7/15, 4:30
PM 2/8/15, 5:30
PM 1392.24 1415.29 1.656%
2 3/22/15,
11:00 AM 3/23/15,
11:05 AM 1055.50 1061.09 0.530%
3 3/22/15,
11:00 AM 3/23/15,
11:05 AM 1037.16 1040.96 0.366%
RT33-03 (Coated)
Trial #
Soak Date/ Time (Start)
Soak Date/ Time (Finish)
Initial Mass- air dried (g)
Final Mass (g)
Absorption, %
1 3/27/2015, 2:20 PM
3/28/2015, 2:25 PM
982.77 984.29 0.155%
2 3/27/2015, 2:20 PM
3/28/2015, 2:25 PM
1072.2 1073.78 0.147%
3 3/27/2015, 2:20 PM
3/28/2015, 2:25 PM
1023.45 1025.66 0.216%
59
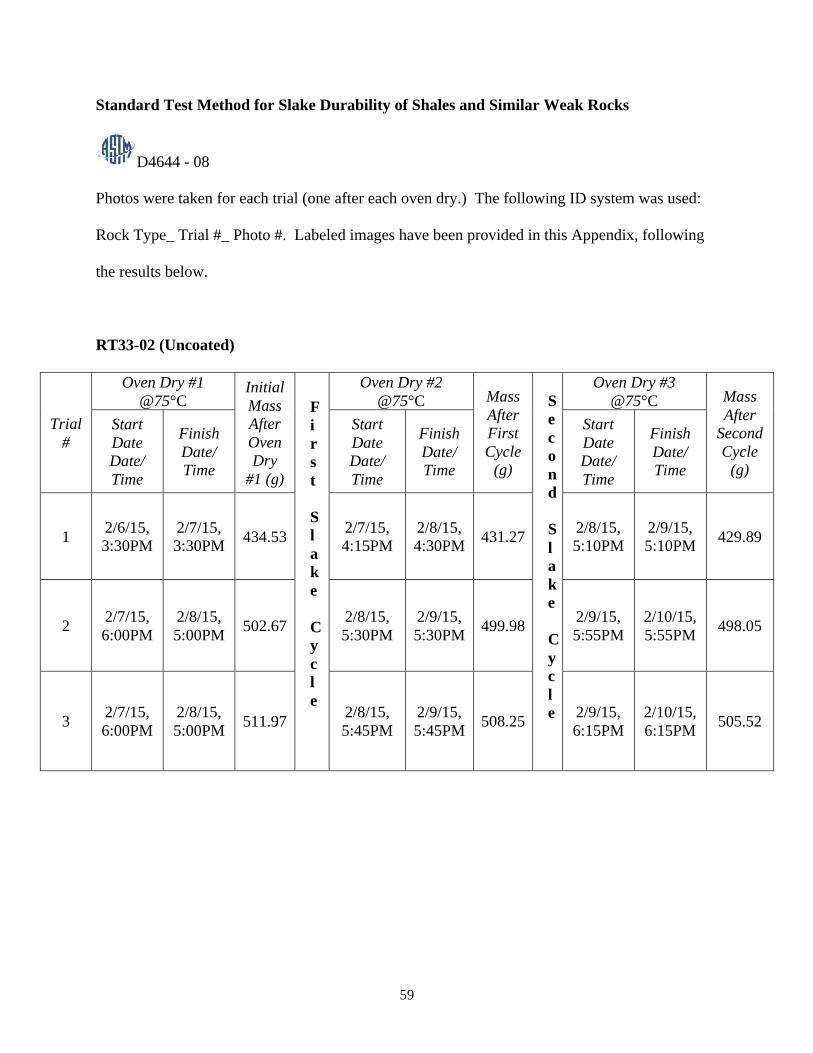
Standard Test Method for Slake Durability of Shales and Similar Weak Rocks
D4644 - 08
Photos were taken for each trial (one after each oven dry.) The following ID system was used:
Rock Type_ Trial #_ Photo #. Labeled images have been provided in this Appendix, following
the results below.
RT33-02 (Uncoated)
Trial #
Oven Dry #1 @75°C
Initial Mass After Oven Dry
#1 (g)
First Slake Cycle
Oven Dry #2 @75°C Mass
After First Cycle
(g)
Second Slake Cycle
Oven Dry #3 @75°C Mass
After Second Cycle
(g)
Start Date Date/ Time
Finish Date/ Time
Start Date Date/ Time
Finish Date/ Time
Start Date Date/ Time
Finish Date/ Time
1 2/6/15, 3:30PM
2/7/15, 3:30PM
434.53 2/7/15, 4:15PM
2/8/15, 4:30PM
431.27 2/8/15, 5:10PM
2/9/15, 5:10PM
429.89
2 2/7/15, 6:00PM
2/8/15, 5:00PM
502.67 2/8/15, 5:30PM
2/9/15, 5:30PM
499.98 2/9/15, 5:55PM
2/10/15, 5:55PM
498.05
3 2/7/15, 6:00PM
2/8/15, 5:00PM
511.97 2/8/15, 5:45PM
2/9/15, 5:45PM
508.25 2/9/15, 6:15PM
2/10/15, 6:15PM
505.52

60
RT33-03 (Uncoated)
Trial #
Oven Dry #1 @75°C
Initial Mass After Oven Dry
#1 (g)
First Slake Cycle
Oven Dry #2 @75°C
Mass After First Cycle
(g)
Second Slake Cycle
Oven Dry #3 @75°C
Mass After Secon
d Cycle
(g)
Start Date Date/ Time
Finish Date/ Time
Start Date Date/ Time
Finish Date/ Time
Start Date Date/ Time
Finish Date/ Time
1 2/6/15, 3:30PM
2/7/15, 3:30PM
538.94 2/7/15, 4:15PM
2/8/15, 4:30PM
517.58 2/8/15, 5:10PM
2/9/15, 5:10PM
495.66
2 2/7/15, 6:00PM
2/8/15, 5:00PM
459.51 2/8/15, 5:30PM
2/9/15, 5:30PM
449.25 2/9/15, 5:55PM
2/10/15, 5:55PM
439.22
3 2/7/15, 6:00PM
2/8/15, 5:00PM
449.93 2/8/15, 5:45PM
2/9/15, 5:45PM
441.92 2/9/15, 6:15PM
2/10/15, 6:15PM
432.71
RT33-03 (Coated)
Trial #
Oven Dry #1 @75°C
Initial Mass After Oven
Dry #1 (g)
First Slake Cycle
Oven Dry #2 @75°C
Mass After First Cycle
(g)
Second Slake Cycle
Oven Dry #3 @75°C Mass
After Second
Cycle (g)
Start Date Date/ Time
Finish Date/ Time
Start Date Date/ Time
Finish Date/ Time
Start Date Date/ Time
Finish Date/ Time
1 3/25/15, 2:30PM
3/27/15, 2:00PM
472.84 3/27/15, 2:00PM
3/28/15, 2:20PM
472.84 3/28/15, 2:45PM
3/28/15, 3:00PM
472.48
2 3/25/15, 2:30PM
3/27/15, 2:00PM
430.04 3/27/15, 2:00PM
3/28/15, 2:20PM
429.9 3/28/15, 2:45PM
3/28/15, 3:00PM
429.49
3 3/25/15, 2:30PM
3/27/15, 2:00PM
456.53 3/27/15, 2:00PM
3/28/15, 2:20PM
456.36 3/28/15, 2:45PM
3/28/15, 3:00PM
455.95
61
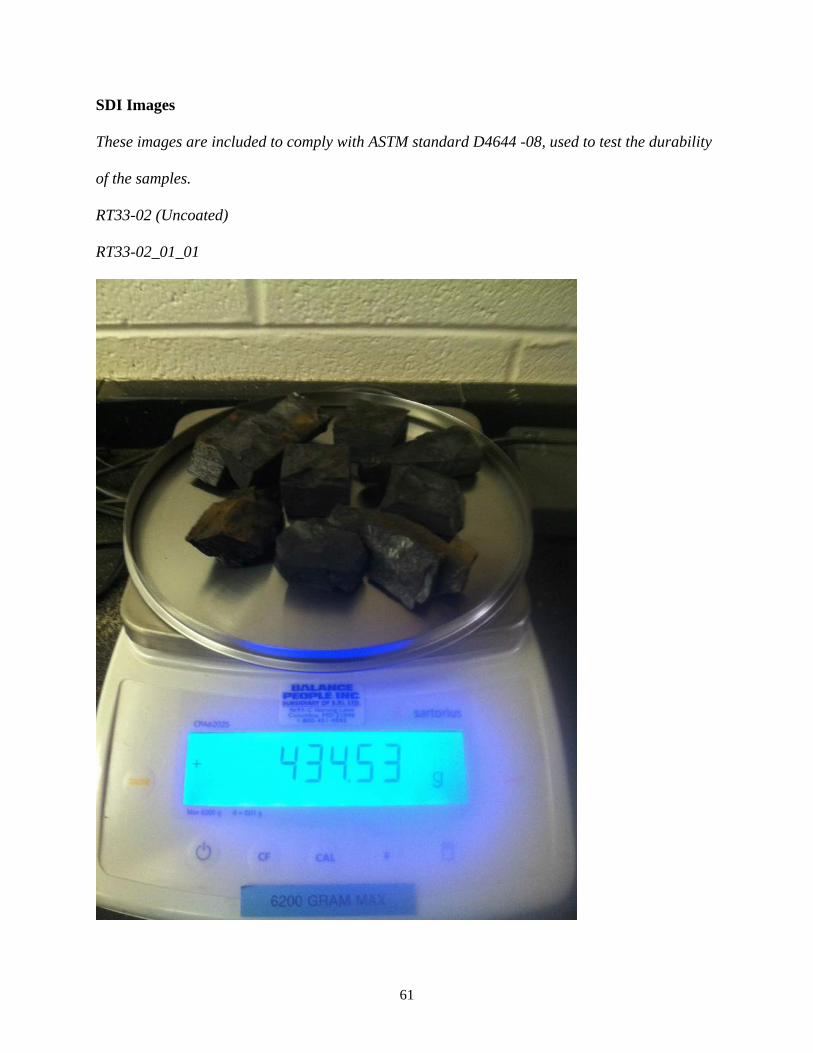
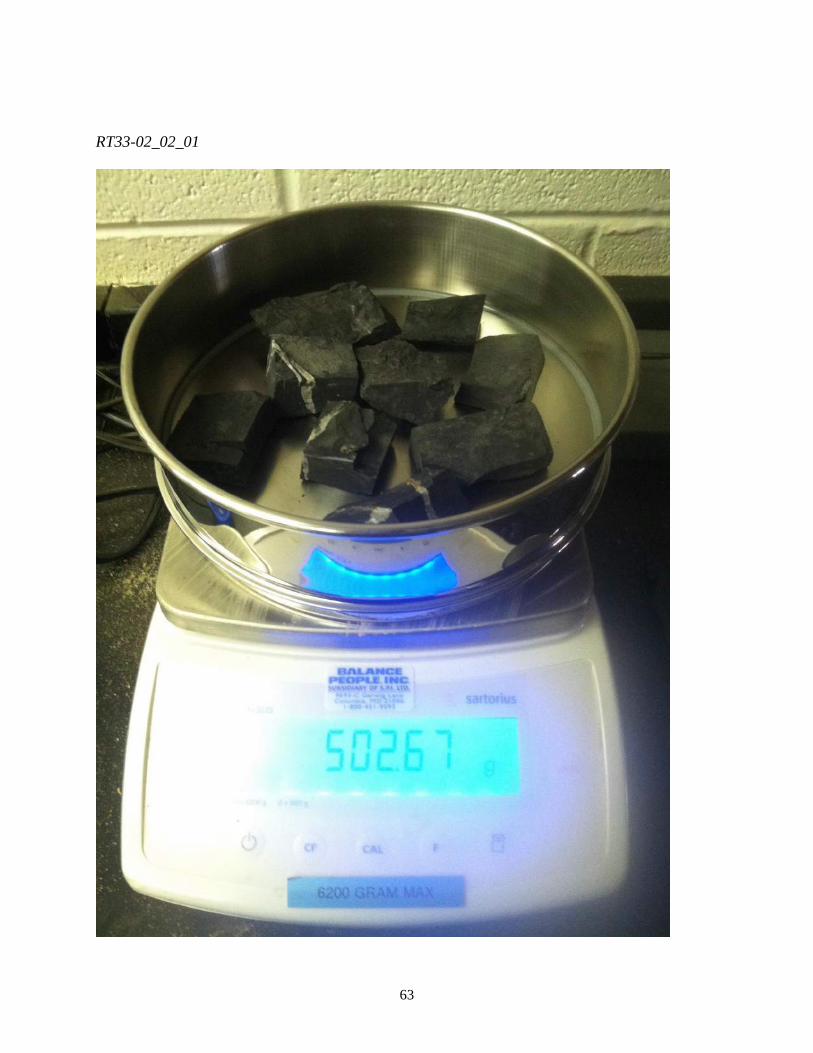
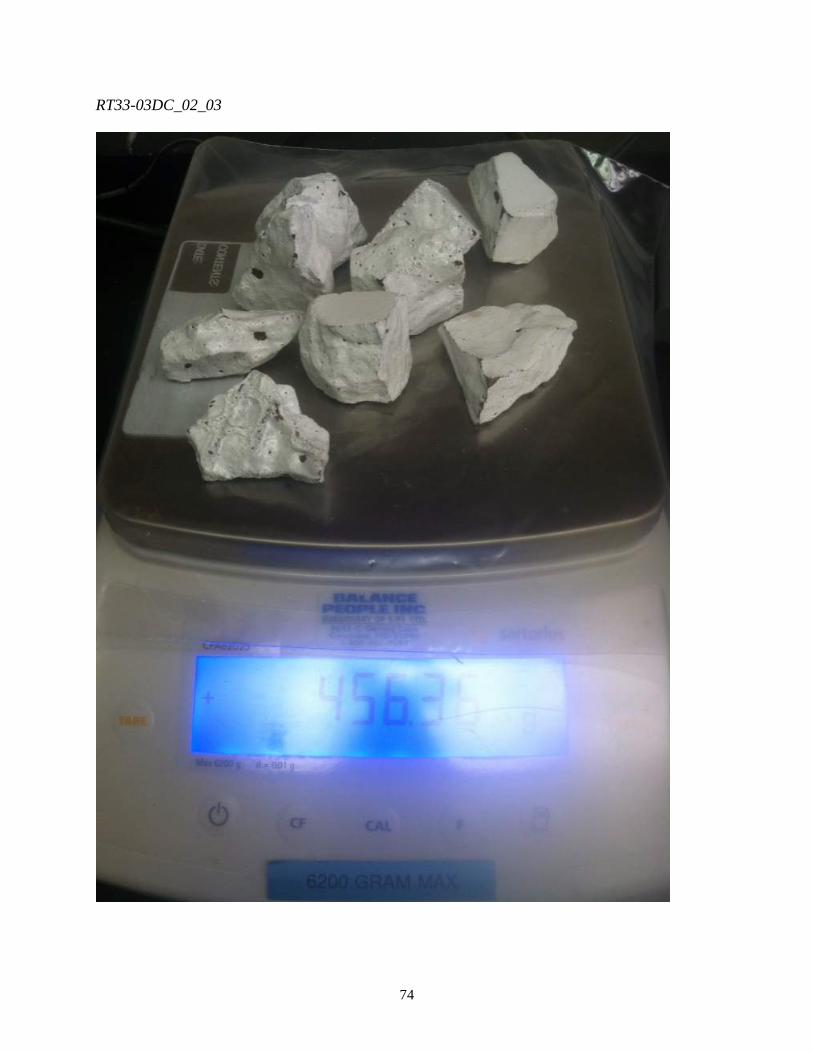
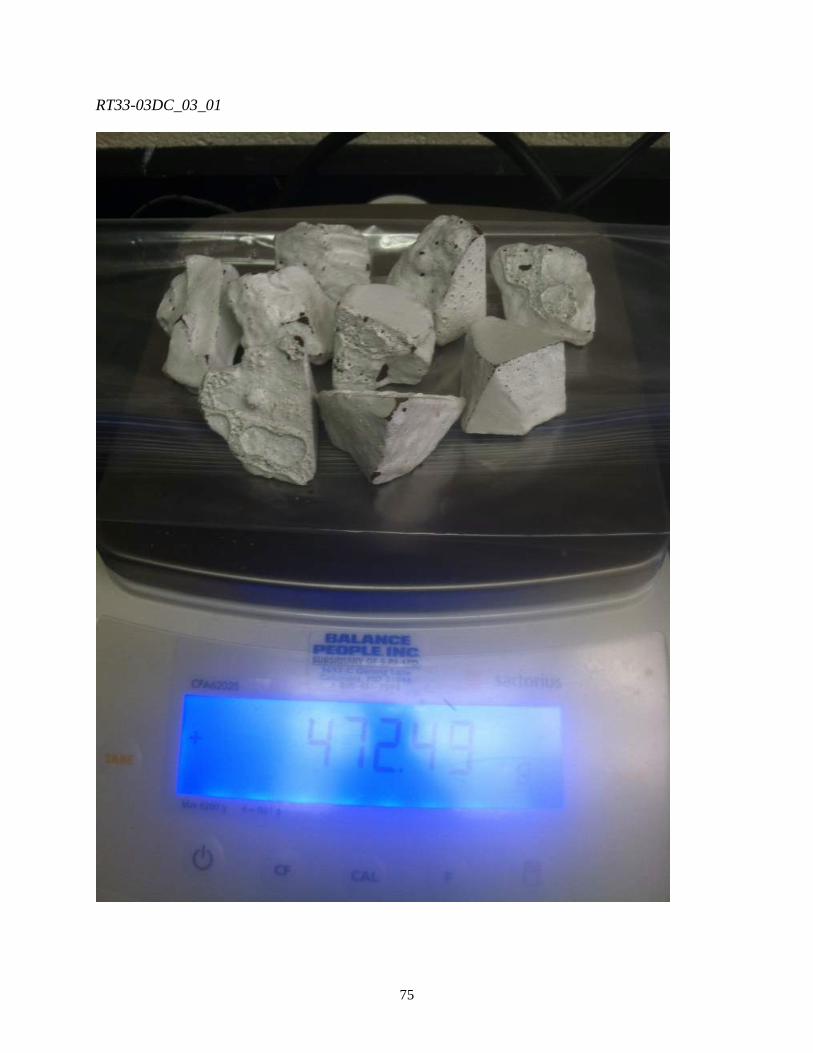
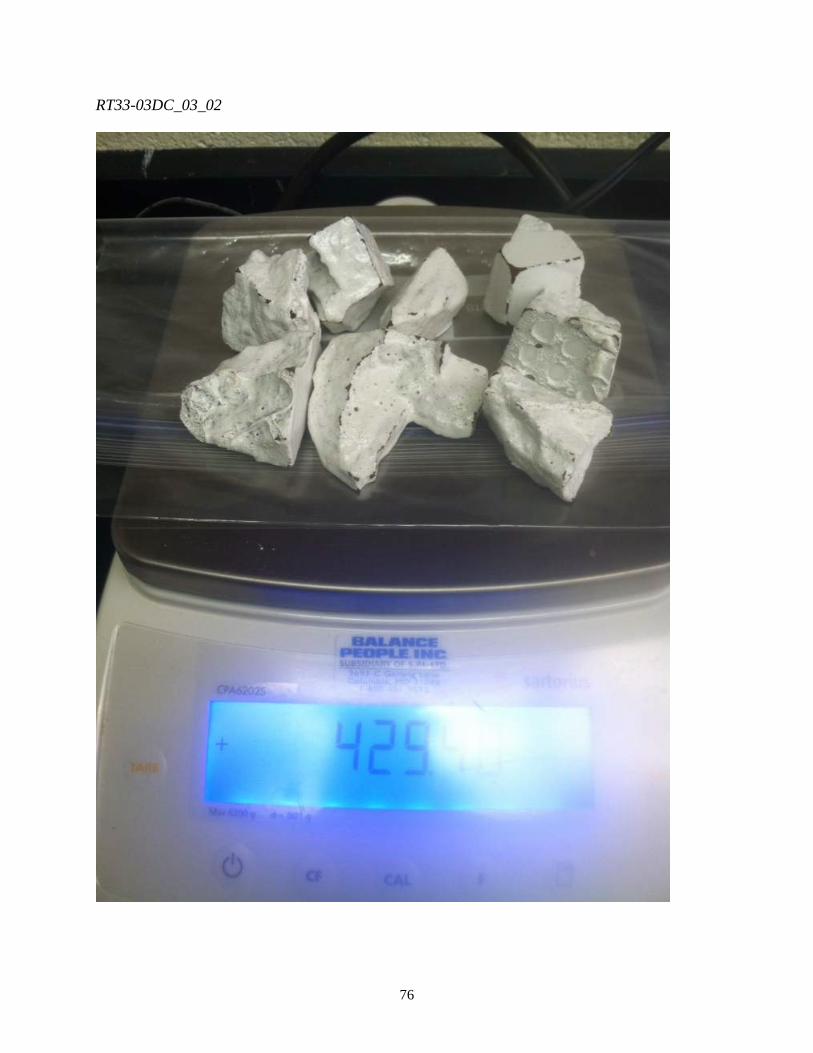
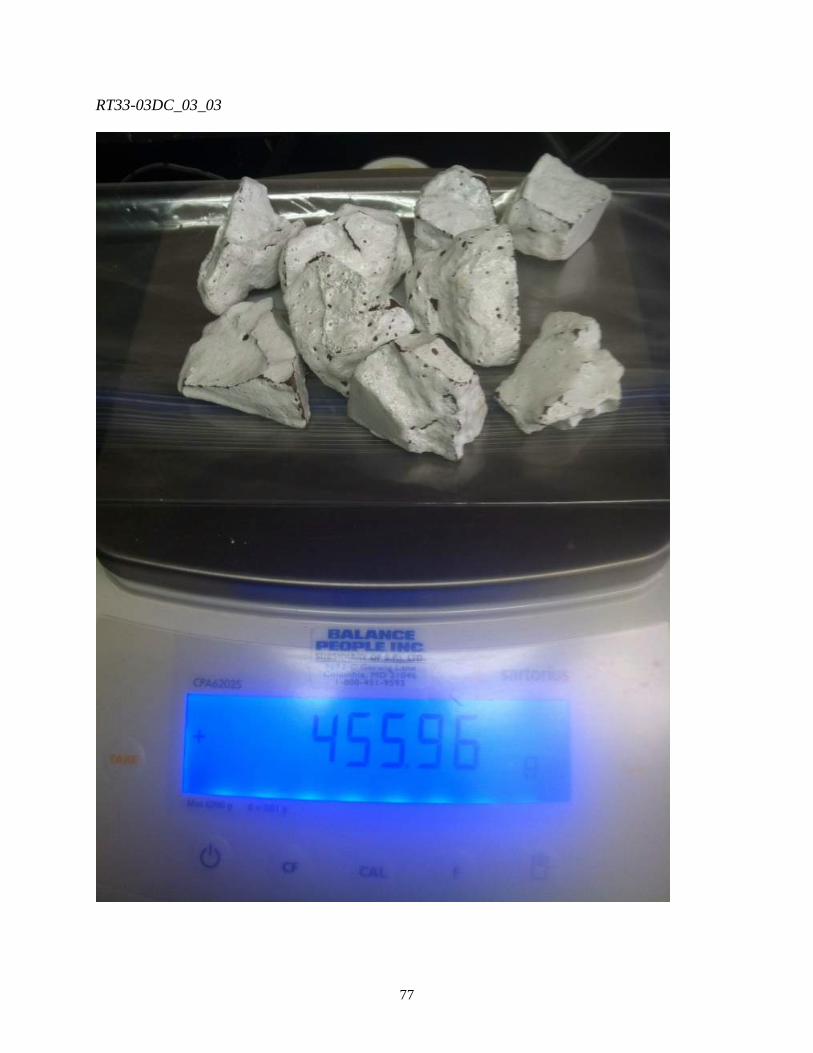
SDI Images
These images are included to comply with ASTM standard D4644 -08, used to test the durability
of the samples.
RT33-02 (Uncoated)
RT33-02_01_01

62
RT33-02_01_02
63
RT33-02_02_01

64
RT33-02_03_01

65
RT33-03 (Uncoated)
RT33-03_01_01

66
RT33-03_01_02

67
RT33-03_02_01
68
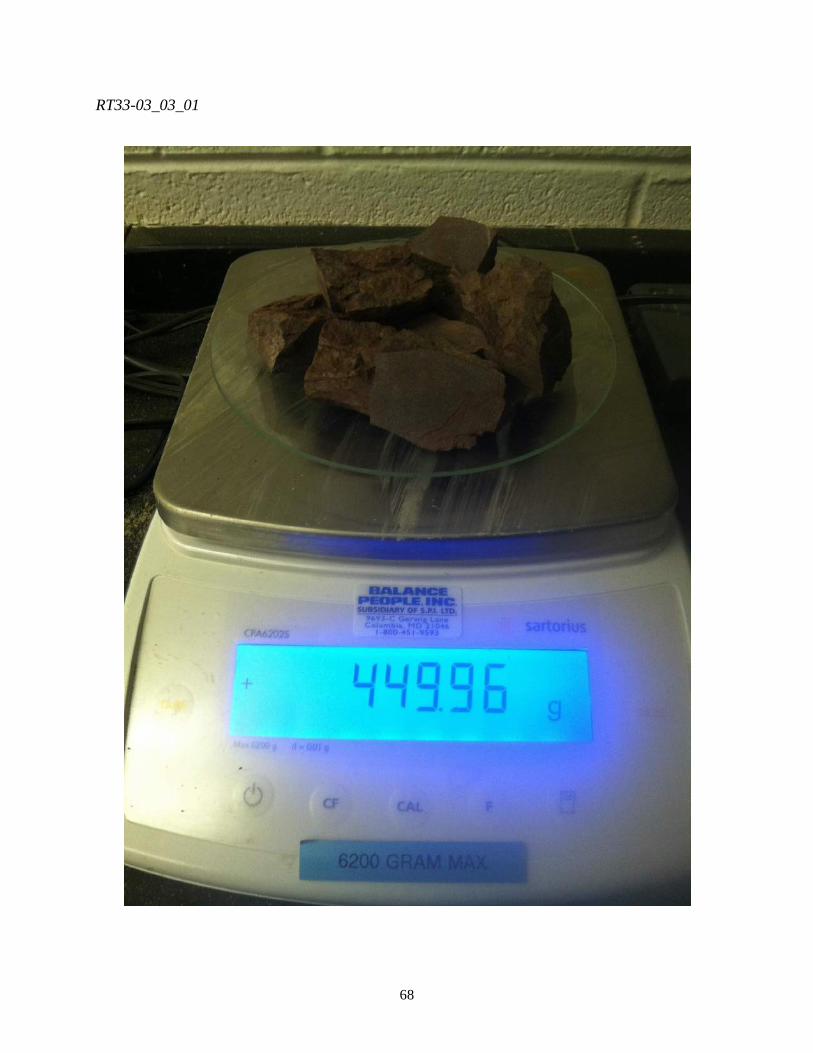
RT33-03_03_01
69
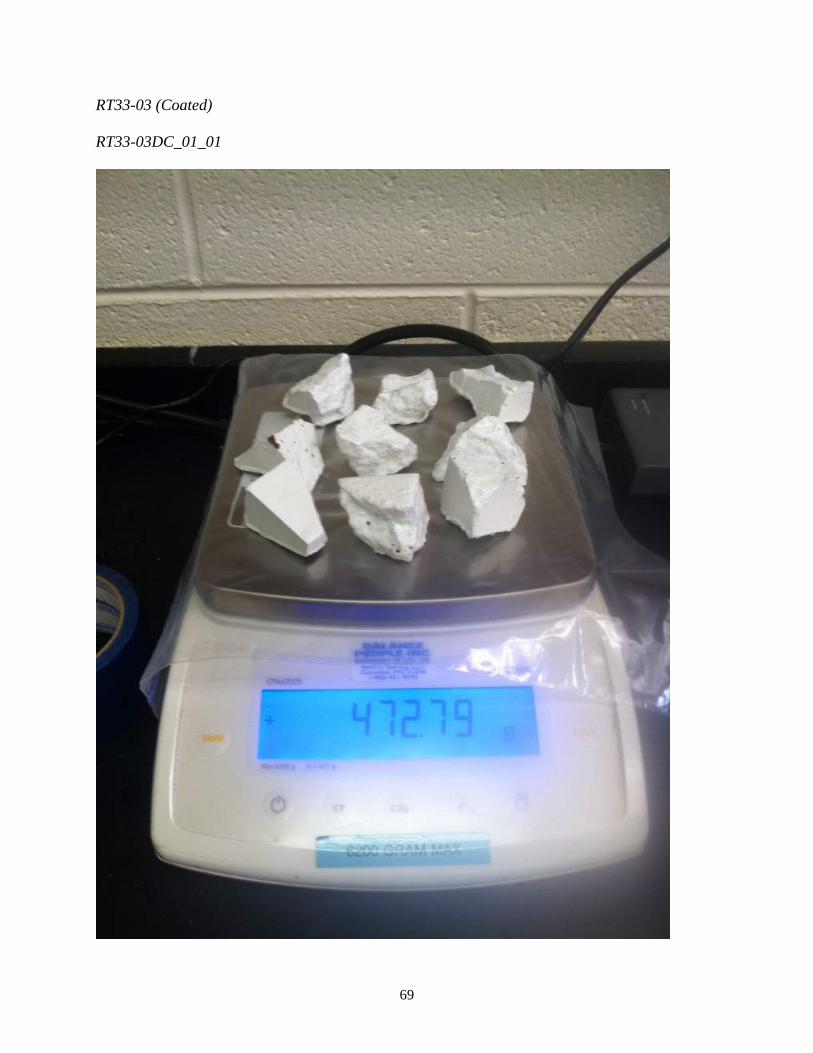
RT33-03 (Coated)
RT33-03DC_01_01

70
RT33-03DC_01_02
71
RT33-03DC_01_03

72
RT33-03DC_02_01
73
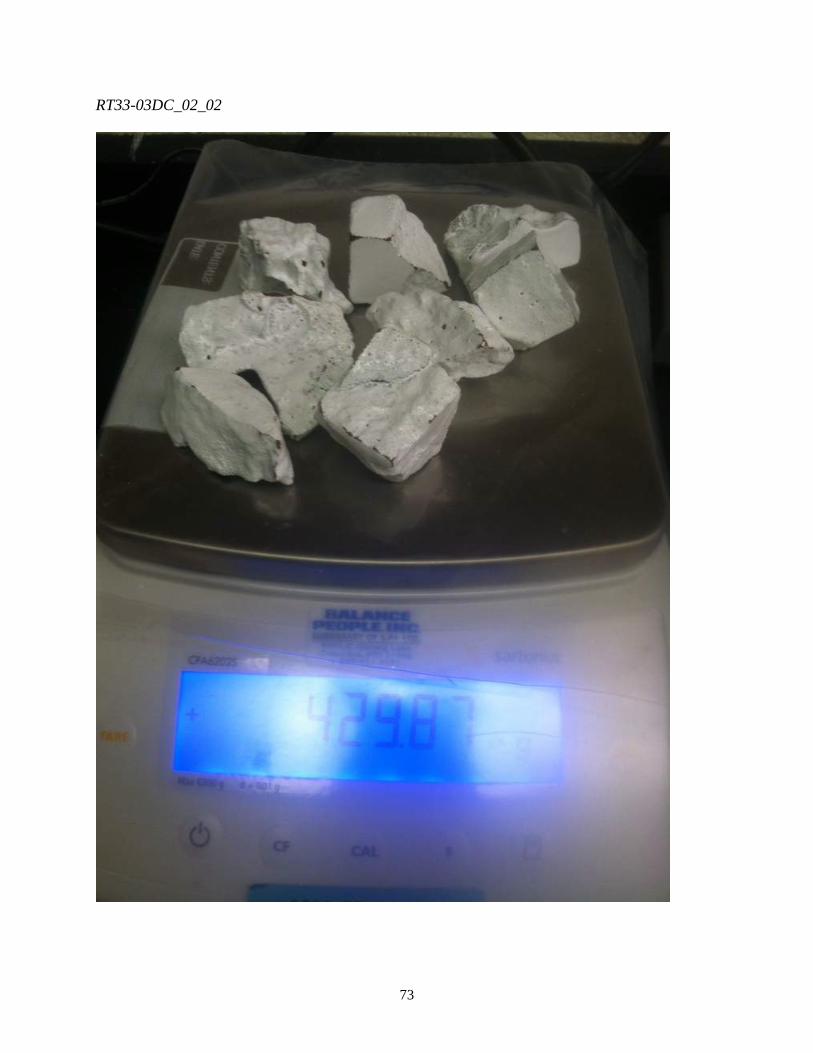
RT33-03DC_02_02
74
RT33-03DC_02_03
75
RT33-03DC_03_01
76
RT33-03DC_03_02
77
RT33-03DC_03_03