design and operation of the synthesis gas generator system
TRANSCRIPT
Design and Operation of the Synthesis Gas Generator System for Reformed Propane and Glycerin
Combustion
By
Derek Kyle Pickett
Submitted to the graduate degree program in Mechanical Engineering and the Graduate Faculty of the
University of Kansas in partial fulfillment of the requirements for the degree in Master of Science.
_______________________________
Chair: Dr. Christopher Depcik
_______________________________
Dr. Bedru Yimer
_______________________________
Dr. Edward Peltier
_______________________________
Dr. Susan Williams
Defended: December 18, 2013

ii
Design and Operation of the Synthesis Gas Generator System for Reformed Propane and Glycerin
Combustion
By
Derek Kyle Pickett
The Thesis Committee for Derek Pickett certifies that this is the approved version of the following thesis:
_______________________________
Chair: Dr. Christopher Depcik
_______________________________
Acceptance Date

iii
Abstract
Due to an increased interest in sustainable energy, biodiesel has become much more widely
used in the last several years. Glycerin, one major waste component in biodiesel production, can be
converted into a hydrogen rich synthesis gas to be used in an engine generator to recover energy from
the biodiesel production process. This thesis contains information detailing the production, testing, and
analysis of a unique synthesis generator rig at the University of Kansas.
Chapter 2 gives a complete background of all major components, as well as how they are
operated. In addition to component descriptions, methods for operating the system on pure propane,
reformed propane, reformed glycerin along with the methodology of data acquisition is described. This
chapter will serve as a complete operating manual for future students to continue research on the
project.
Chapter 3 details the literature review that was completed to better understand fuel reforming
of propane and glycerin. This chapter also describes the numerical model produced to estimate the
species produced during reformation activities. The model was applied to propane reformation in a
proof of concept and calibration test before moving to glycerin reformation and its subsequent
combustion.
Chapter 4 first describes the efforts to apply the numerical model to glycerin using the
calibration tools from propane reformation. It then discusses catalytic material preparation and glycerin
reformation tests. Gas chromatography analysis of the reformer effluent was completed to compare to
theoretical values from the numerical model. Finally, combustion of reformed glycerin was completed
for power generation. Tests were completed to compare emissions from syngas combustion and
propane combustion.
iv
Table of Contents
Nomenclature………………………………………………………………………………………………………………………………………… xi
1.1 Introduction……………………………………………………………………………………………………………………………………….1
1.2 Thesis Efforts…………………………………………………………………………………………………………………………………….. 5
Chapter 2: Detailed Description and Operating Procedure of the Syngas Rig
2.1 Background and Description of Syngas Rig Equipment……………………………………………………………………….7
2.1.1 Reformer Background and Description…………………………………………………………………………………………… 8
2.1.2 Engine Background and Description…………………………………………………………………………………………….. 11
2.1.3 Generator Background and Description……………………………………………………………………………………….. 16
2.1.4 Data Acquisition and Control Background and Description…………………………………………………….……..17
2.2 Control and Operation of the Syngas Rig…………………………………………………………………………………………. 29
2.2.1 Operating Procedure for Propane Combustion in the Engine……………………………………………………….. 30
2.2.2 Operating Procedure for Partial Combustion in the Reformer……………………………………………………….33
2.2.3 Operating Procedure for Syngas Combustion in the Engine…………………………………………………………..35
2.2.4 Operating Procedure for Glycerin Reforming and its Subsequent Combustion…………………………….. 37
2.2.5 Data Collection Procedure……………………………………………………………………………………………………………. 41
2.2.6 Shutdown Procedure……………………………………………………………………………………………………………………. 43
Chapter 3: Investigation of Propane Reforming and Syngas Combustion
3.1 Abstract…………………………………………………………………………………………………………………………………………… 45
3.2 Introduction……………………………………………………………………………………………………………………………………. 45
3.3 Modeling…………………………………………………………………………………………………………………………………………. 48
3.4 Experimental Setup…………………………………………………………………………………………………………………………. 56

v
3.5 Results and Discussion……………………………………………………………………………………………………………………..58
3.5.1 Reformer Map……………………………………………………………………………………………………………………………… 58
3.5.2 Engine Map………………………………………………………………………………………………………………………………….. 60
3.5.3 Engine Running on Reformed Propane Syngas……………………………………………………………………………… 61
3.6 Conclusion………………………………………………………………………………………………………………………………………. 65
Chapter 4: Investigation of Glycerin Reforming and Syngas Combustion
4.1 Glycerin/Water Modeling…………………………………………………………………………………………………………………67
4.2 Reformer Catalytic Material Preparation………………………………………………………………………………………….70
4.3 Glycerin/Water Reformation…………………………………………………………………………………………………………… 74
4.4 Reformed Glycerin/Water Combustion…………………………………………………………………………………………… 85
4.5 In-cylinder Pressure and Emissions Analysis……………………………………………………………………………………. 88
4.6 Application with Biodiesel Production…………………………………………………………………………………………….. 94
4.7 Conclusion………………………………………………………………………………………………………………………………………. 97
References……………………………………………………………………………………………………………………………………………. 99
vi
Table of Figures
Figure 1 - Price of glycerin and biodiesel production as a function of year………………………………………………. 2
Figure 2 – Flow structure of the synthesis gas generator rig at the University of Kansas…………………………. 4
Figure 3 – Image of syngas rig with important features indicated…………………………………………………………… 7
Figure 4 - Top section of reformer with important components indicated………………………………………………. 8
Figure 5 - Air dryer (left) and custom flow separator (right) in line before air controller…………………………. 9
Figure 6 – Image of transformer powering igniter ………………………………………………………………………………… 10
Figure 7 - General Motors engine used in the syngas rig……………………………………………………………………….. 11
Figure 8 - Engine distributor cap and how to advance or delay the spark……………………………………………… 11
Figure 9 - Crank shaft indicator tab with TDC position indicated…………………………………………………………… 12
Figure 10 - Air fuel valve, throttle valve and carburetor………………………………………………………………………… 14
Figure 11 - Mecc Alte ECO32-2L/4 generator used in the syngas rig……………………………………………………… 16
Figure 12 - GCP 20 generator controller………………………………………………………………………………………………… 17
Figure 13 - NI hardware chassis used for primary data acquisition………………………………………………………… 18
Figure 14 - Standard Omegaclad K-Type thermocouple probe used on the syngas rig…………………………… 19
Figure 15 - PX 319 pressure transducer used on the syngas rig……………………………………………………………… 20
Figure 16 - Air control system with important features indicated…………………………………………………………. 21
Figure 17 - Omega gas flow controller for propane (or other combustible gasses)………………………………… 22
Figure 18 - Glycerin control with important components indicated………………………………………………………. 23
Figure 19 - Glycerin DC motor controller………………………………………………………………………………………………. 23
Figure 20 - Glycerin control converter from pulse input to analog input……………………………………………….. 24
Figure 21 - Shielded input block for in-cylinder pressure measurements………………………………………………. 26
Figure 22 - Power supply (left) and charge amplifier (right) for in-cylinder pressure measurements……...27
Figure 23 - Encoder adapter and linkage for in-cylinder pressure measurements with
vii
important components indicated……………………………………………………………………………………….. 28
Figure 24 – Control panel and computer control…………………………………………………………………………………… 29
Figure 25 - Syngas control panel for engine combustion using pure propane…………………………………………30
Figure 26 - Control panel showing power and starter button………………………………………………………………… 31
Figure 27 - LabVIEW screenshot showing start engine button and engine dials…………………………………….. 31
Figure 28 - Propane control window showing engine combustion at no load and 1800 RPM………………… 32
Figure 29 - Air control window during reforming operations………………………………………………………………….33
Figure 30 - LabVIEW window during proper reforming operations…………………………………………………………34
Figure 31 - Backpressure valve with open position indicated………………………………………………………………… 35
Figure 32 - Control panel during reformed propane combustion……………………………………………………………35
Figure 33 - Control panel showing backpressure valve control and starter location………………………………. 36
Figure 34 - Glycerin control window during no load reformed glycerin combustion……………………………… 38
Figure 35 - Temperature of upper reactor and catalytic material during transition to
exothermic glycerin reformation…………………………………………………………………………………………. 39
Figure 36 - Post reformer exhaust drain (1), post heat exchanger exhaust drain (2), and
post back pressure valve exhaust drain (3)…………………………………………………………………………… 40
Figure 37 - Data collection window during recording procedure…………………………………………………………… 41
Figure 38 - In-cylinder pressure trace at no load 1800 RPM pure propane engine combustion
with the red line indicating the pressure during combustion (yellow line is a
motoring trace)………………………………………………………………………………………………………………………42
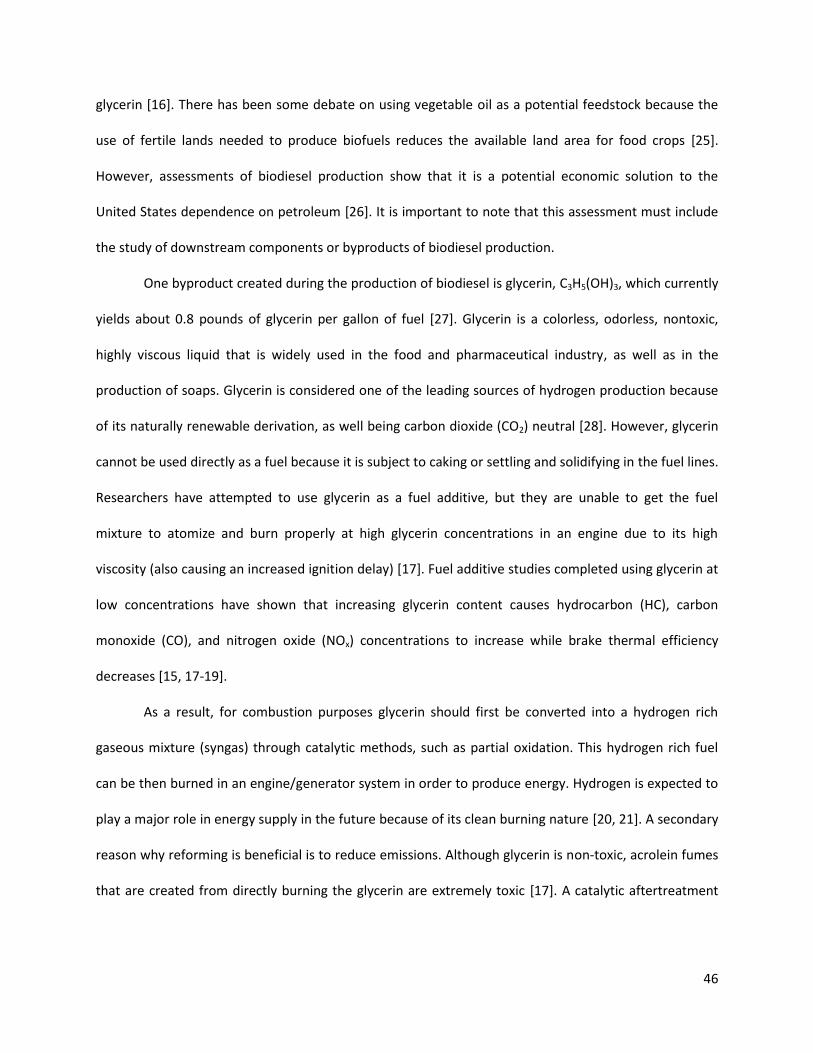
Figure 39 - Potential reaction pathways during the glycerin reforming process……………………………………..48
Figure 40 - Ideal reforming pathway for optimal hydrogen production from glycerin…………………………….48
Figure 41 - Raw data taken from the reformer temperature map…………………………………………………………. 52
Figure 42 - Matlab screenshot indicating the NASA text file production and execution………………………….53

viii
Figure 43 - Text file result from the NASA CEA program………………………………………………………………………… 54
Figure 44 - Matlab screenshot that reads the molar ratio of each species in the NASA CEA text file……… 54
Figure 45 - Complete flow structure of the reformer, engine, and generator setup………………………………. 57
Figure 46 - Map of reformer temperature in K as a function of reformer air and propane
mass flow rates……………………………………………………………………………………………………………………. 59
Figure 47 - Effective syngas LHV map in MJ/kg of RP………………………………………………………………………..…... 62
Figure 48 - RP syngas energy content in kW as a function of air and propane flow rates………………………. 63
Figure 49 - In-cylinder pressure data at no load and 1800 rpm for both PP and RP……………………………….. 64
Figure 50 - Syngas temperature as a function of glycerin/water and air flow rates
to the reformer…………………………………………………………………………………………………………………… 68
Figure 51 - Effective lower heating value of syngas exiting the reformer as a function of
glycerin/water and air flow rates…………………………………………………………………………………………. 69
Figure 52 - Prediction of generator power output based on glycerin/water and air flow
rates to the reformer……………………………………………………………………………………………………………. 69
Figure 53 - Catalytic support media before catalyst was introduced……………………………………………………… 72
Figure 54 - Catalytic support media immersed in nickel salt bath………………………………………………………….. 72
Figure 55 - Catalytic material after six hours at 800C…………………………………………………………………………… 74
Figure 56 - No load, FID calibration and sampled data……………………………………………………………………………76
Figure 57 - No load, TCD calibration and sampled data…………………………………………………………………………. 77
Figure 58 - One load, FID calibration and sampled data………………………………………………………………………… 77
Figure 59 - One load, TCD calibration and sampled data……………………………………………………………………….. 78
Figure 60 - Two loads, FID calibration and sampled data………………………………………………………………………. 78
Figure 61 - Two loads, TCD calibration and sampled data……………………………………………………………………… 79
Figure 62 - Syngas energy content and predicted combustion points with successful
ix
combustion points indicated in red………………………………………………………………………………………. 85
Figure 63 - In cylinder pressure comparison at (a) no load, (b) one load, and (c) two loads…………………… 88
Figure 64 - Power requirements for the entire biodiesel production process at
the University of Kansas………………………………………………………………………………………………………. 95
Figure 65 - Extrapolation of energy production as a function of glycerin/water flow rate………………………96

x
Table of Tables
Table 1 - Fuel optimization before and after spark timing adjustments………………………………………………….13
Table 2 - Engine temperature before and after spark timing adjustments…………………………………………….. 15
Table 3 - Syngas sensors with location and use described………………………………………………………………………24
Table 4 - PP flow requirements in order to run the engine and generator at different
speeds and loads……………………………………………………………………………………………………………………..61
Table 5 - Comparison of RP theoretical requirements and actual energy needed…………………….…………….64
Table 6 - Purified glycerin technical specifications………………………………………………………………………………….75
Table 7 - Gas chromatography results for calibration area, sample area and volume
of each species at all three generator loads……………………………………………………………………………..80
Table 8 - Gas chromatography results for species volume, adjusted species volume
and volume fraction at all three generator loads……………………………………………………………………..81
Table 9 – Gas chromatography results for volume fraction on dry and wet basis
at all three generator loads…………………………………………………………………………………………………….. 83
Table 10 – REG glycerin flow, 99% pure glycerin flow, and percent glycerin flow
rate increase for combustion at all three generator loads……………………………………………………. 86
Table 11 - Technical specifications for REG glycerin used in purified glycerin comparison tests……………..87
Table 12 - Emissions on a g/gfuel basis with standard deviation indicated in parenthesis……………………….. 92
Table 13 - Air to fuel ratio and equivalence ratio for propane and glycerin/water
at all generator loads……………………………………………………………………………………………………………..93
Table 14 – Energy requirements and glycerin/water flow rates at each stage of the
biodiesel production process……………………………………………………………………………………………….. 96

xi
Nomenclature
Abbreviation Description
A/F Air to Fuel Ratio
AFV Air Fuel Valve
ATDC After Top Dead Center
BTDC Before Top Dead Center
C3H8 Propane
CEA Chemical Equilibrium with Applications
CH4 Methane
CI Compression Ignition
CO Carbon Monoxide
CO2 Carbon Dioxide
cRIO Compact RIO
DC Direct Current
DoE Department of Energy
ECU Engine Control Unit
EGR Exhaust Gas Recirculation
EPA Environmental Protection Agency
FID Flame Ionization Detector
GC Gas Chromatograph
GM General Motors
H2 Hydrogen
H2O Water
HC Hydrocarbons
KU University of Kansas
LFE Laminar Flow Element
LHV Lower Heating Value
N2 Nitrogen
NI National Instruments
NOx Nitrogen Oxides
O2 Oxygen
PP Pure Propane
REG Renewable Energy Group
RFS Renewable Fuel Standards
RG Reformed Glycerin
RP Reformed Propane
RPM Revolutions Per Minute
SM Steam Methanation
TCD Thermal Conductivity Detector

xii
TDC Top Dead Center
TV Throttle Valve
VAC Voltage Alternating Current
VDC Voltage Direct Current
WGS Water Gas Shift
Variable Description Units
As Reformer Surface Area [m2]
a Moles Carbon Dioxide [mol]
b Moles Hydrogen [mol]
c Moles Carbon Monoxide [mol]
d Moles Water [mol]
e Moles Nitrogen [mol]
f Moles Fuel [mol]
g Moles Methane [mol]
h Molar Enthalpy [J/g]
hc Convective Heat Transfer Coefficient [W/m2/K]
KWGS Water Gas Shift Equilibrium Constant [ ]
KSM Steam Methanation Equilibrium Constant [ ]
m Mass Flow Rate [g/s]
MWSample Species Molecular Weight [g/mol]
n Molar Flow Rate [mol/s]
p Pressure [Pa]
Q Heat Transfer Rate [J/s]
QLHV Mass Based Lower Heating Value [MJ/kg]
Ru Universal Gas Constant [J/mol/K]
X Volume Fraction [ ]
Y Mass Fraction [ ]
[Sample] Species Concentration [mol/m3]
ф Equivalence Ratio [ ]
α Fuel Source Carbon Atom Count [ ]
β Fuel Source Hydrogen Atom Count [ ]
γ Fuel Source Oxygen Atom Count [ ]
1
1.1 Introduction
As petroleum prices continue to rise, there is an increasing need for non-petroleum based fuels.
The current amount of crude oil consumption is around 86 million barrels per day and is predicted to
reach 110.6 million barrels per day by 2030 [1]. One possible source of alternative fuel, biodiesel, can be
derived from biomass feedstocks (e.g., soybean). This bio-based diesel can augment or replace
petroleum based diesel with little to no modifications needed for most diesel engines [2]. Currently,
biodiesel is already being blended with traditional petroleum fuels and is used in many countries around
the world [3]. Of importance, biodiesel is the only commercially available fuel for compression ignition
(CI) engines in sufficient quantities that meets the Renewable Fuel Standards (RFS) set by the
Environmental Protection Agency (EPA) [4]. Upcoming mandates surrounding biofuels (including bio-
based ethanol) in the United States requires a dramatic increase in the supply of these alternative fuels.
The EPA requires that by 2022 at least 36 billion gallons of renewable fuels are to be used each year [4].
Tax breaks and subsidies are already in place to motivate an increased production of biodiesel; however,
the development of improved technologies is required to make biodiesel an economic solution to
petroleum-based diesel. A sustainable solution to the monetary feasibility of biodiesel involves the
analysis of its production methods.
The most common method to produce biodiesel is through transesterification. This process
refers to the catalyzed chemical reaction of a renewable lipid feedstock, such as vegetable oil or animal
fat, and an alcohol, most commonly methanol, to yield fatty acid alkyl esters (biodiesel) and glycerin [5].
In the United States, canola and soybean oil are the most common feedstocks for biodiesel production.
Other feedstock oils include rapeseed, jatropha, castor, and palm oils that all have different
compositions and fatty acid profiles [3]. Differences in composition affect the yield and quality of the
biodiesel produced; however, a study of this dissimilarity is not part of this effort. There are some
downsides to biodiesel production using vegetable oil as a feedstock even though it is a renewable

2
resource. There has been some debate regarding this option because the use of fertile lands needed to
produce biofuels reduces the available land area for food crops [6]. In addition to this competition with
food, the use of land for biodiesel feedstock also increases the destruction of natural habitats [7].
However, assessments of biodiesel production have shown that it is an economic solution to the United
States dependence on oil [8]. Similar to the petroleum industry, it is as important to investigate the
downstream components (aka byproducts) of biodiesel production when considering costs.
One significant byproduct of biodiesel production is crude glycerin. Glycerin is a colorless,
odorless, nontoxic, highly viscous liquid that is widely used in the food and pharmaceutical industry, as
well as in the production of soaps. Of importance to this effort, glycerin is considered one of the leading
sources of hydrogen production because of its naturally renewable derivation, as well being carbon
dioxide (CO2) neutral [9]. Crude glycerin can be refined into pure glycerin by refining (e.g., distillation)
and purification.
Figure 1 – Price of glycerin and biodiesel production as a function of year [10, 11].
With respect to the economic feasibility of biodiesel, it was found that as EPA mandates
promoted the dramatic growth of biodiesel production, the increased volume of glycerin saturated the
0
1000
2000
3000
4000
5000
6000
7000
8000
9000
0
100
200
300
400
500
600
700
800
900
1000
1996 1998 2000 2002 2004 2006 2008
Bio
die
sel
Pro
du
ctio
n [
ML
]
Pri
ce o
f G
lyce
rin
[U
SD
/Mg]
Year
Price of Glycerol
Biodiesel Production

3
market and the price of crude glycerin dropped dramatically [12]. Figure 1 indicates the increase in
biodiesel production and drop in glycerin cost as a function of time.
Initially, biodiesel plants were able to purify and sell the glycerin, but as prices continued to drop
it became necessary for plants to simply discard the crude glycerin. Nearly all small facilities were forced
to dispose of this by-product as a waste stream, subsequently making biodiesel less economically
competitive with traditional fuels [13]. At low costs of crude glycerin, the viability of it as a commodity
becomes a concern for the biodiesel industry. In order to provide an illustration of the magnitude of the
issue, the Department of Energy (DoE) estimates that further displacing 2% of petroleum usage with
biodiesel will result in an additional 800 million pounds of glycerin produced each year [14]. Some large-
scale biodiesel facilities continue to purify and sell glycerin, but as prices continue to fall it is becoming
less economically feasible [13]. As a result, it is necessary to find an inexpensive use for crude glycerin.
One possible option is to convert glycerin into a hydrogen rich synthesis gas through partial
oxidation and steam reforming techniques. The synthesis gas can be used in hydrogen fuel cells,
hydrocracking, upgrading to other fuels (e.g., methanol), or with an internal combustion engine.
Glycerin cannot be used directly as a fuel because it is subject to caking or settling and solidifying in the
fuel lines [15]. Researchers have attempted to use glycerin as a fuel additive, but they are unable to get
the fuel mixture to atomize and burn properly at high glycerin concentrations because of its relatively
large viscosity. Studies completed using glycerin at low concentrations as a fuel additive have shown
that rising glycerin content causes hydrocarbons (HC), carbon monoxide (CO), and nitrogen oxides (NOx)
concentrations to increase while brake thermal efficiency (i.e., fuel economy) decreases. This is because
the greater fuel viscosity, even at low glycerin concentrations, causes a reduction in fuel atomization
resulting in an increased ignition delay [15-19].
As a result, for combustion purposes, glycerin should first be converted into a hydrogen rich
gaseous mixture (syngas) through catalytic methods. This hydrogen rich fuel can be then burned in an

4
engine to create power and potentially coupled to a generator in order to produce direct energy. With
respect to hydrogen, it is expected to play a major role in energy supply in the future because of its
clean burning nature [20, 21]. A secondary reason why reforming is beneficial is to reduce emissions.
Although glycerin is non-toxic, the acrolein fumes created from directly burning glycerin are extremely
toxic [17]. A catalytic aftertreatment system could help reduce these fumes, but the syngas produced
from glycerin reforming has the potential to burn significantly cleaner in an engine.
Figure 2 – Flow structure of the synthesis gas generator rig at the University of Kansas
At the University of Kansas (KU), a unique experimental setup includes a full-scale reformer and
Chevy 350 in3 V-8 engine used to reform glycerin and create power from its subsequent syngas. A
glycerin/water mixture is supplied to the reformer and is converted to a hydrogen rich gas over a nickel
catalyst. The resulting syngas is sent to the engine for combustion and power generation with the
generator. It is also possible to supply pure propane to the engine as a way to calculate required energy
content of the fuel at all generator loads. A numerical model was written to calculate the flow rates of
the glycerin/water mixture and air that needs to be supplied to the reformer to produce syngas with
matching energy content. Before reformed glycerin combustion was achieved, the model was first used
for reformed propane combustion. This effort proved that combustion of a reformed fuel is possible, as

5
well as providing a tool to validate and calibrate the numerical model. Figure 2 indicates the different
flow patterns of the rig including pure propane combustion, reformed propane combustion, and
reformed glycerin combustion.
1.2 Thesis Efforts
Chapter 2 gives a complete description and background of the unique experimental setup,
hereto referred as the “syngas rig”, at the University of Kansas. The first part of this chapter provides a
complete description of each major device on the rig, as well as an explanation of data acquisition
components. The second section of Chapter 2 consists of control and operation of the rig including
propane combustion in the engine, fuel reformation, reformed propane combustion, reformed glycerin
combustion, data collection, and shutdown procedures. This chapter will serve as an operating manual
for the entire syngas rig for future students so they may continue research using this system.
The third chapter discusses the process of propane reforming and its subsequent combustion as
a precursor to the final goal of glycerin reforming. Literature research was completed to fully
understand the reactions taking place during conversion of glycerin. This literature study was completed
to describe the derivation of a numerical model used and its application in the experimental section.
Also described in this chapter is a discussion about calibration of the model in order to apply it directly
to glycerin reforming and its subsequent combustion.
The fourth and final chapter discusses glycerin reforming and its subsequent engine combustion
including the use of the generator. This chapter provides additional background of glycerin reforming
with respect to the fundamental reactions taking place, specifically the water gas shift reaction. Detailed
in this chapter is an application of the numerical model developed in Chapter 3 to predict the glycerin-
water mixtures that produce the syngas with the highest hydrogen content. A parametric study was
completed that calculates the products of glycerin reformation and is compared to experimental
findings. Additionally, this chapter describes the catalytic material preparation that is necessary for

6
glycerin reforming. Finally, this chapter indicates the experimental side of glycerin reforming and the
combustion of the syngas produced that includes the electrical power created by the engine and
generator system. This includes a complete emissions analysis, as well as coupling the energy generated
through the syngas system with the requirements for biodiesel production.
7
Chapter 2: Detailed Description and Operating Procedure of the Syngas Rig
2.1 Background and Description of Syngas Rig Equipment
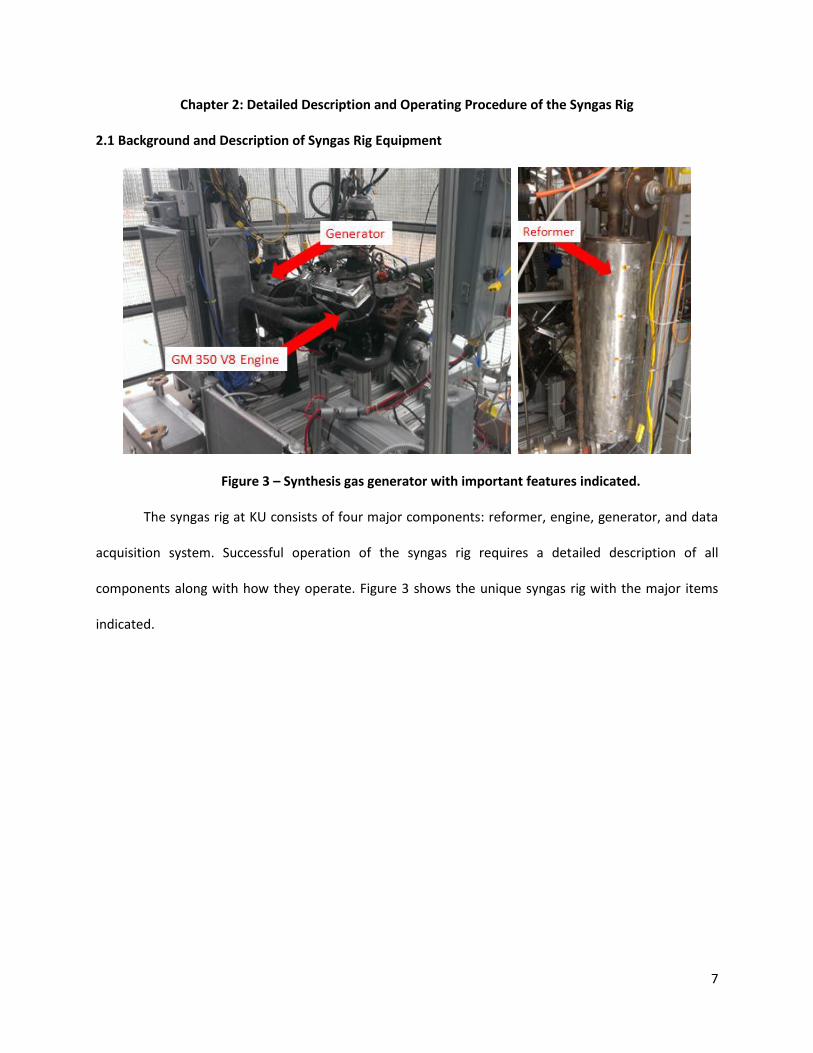
Figure 3 – Synthesis gas generator with important features indicated.
The syngas rig at KU consists of four major components: reformer, engine, generator, and data
acquisition system. Successful operation of the syngas rig requires a detailed description of all
components along with how they operate. Figure 3 shows the unique syngas rig with the major items
indicated.

8
2.1.1 Reformer Background and Description
Figure 4 - Top section of reformer with important components indicated
The first major piece to be discussed is the reformer. The reformer, indicated in Figure 4, is
where partial combustion of the different fuels (e.g., propane and glycerin) takes place resulting in the
production of syngas. There are connections to the reformer for the two types of input fuel (gaseous
and liquid phase). A quarter inch hose line connection allows bottled gas to be supplied to the reformer,
primarily propane as configured. Propane is supplied at approximately 15 psi from a 60-gallon propane
tank. The combustion of propane serves to preheat the reformer, as well as calibrate the numerical
model as discussed in Chapter 3. Typically, the air-to-fuel ratio for propane is significantly rich in order to
keep temperatures relatively low in the reformer while producing a significant amount of hydrogen and
carbon monoxide for running the engine.
Once preheating of the reformer is completed, the second fuel input source (glycerin) can be
utilized. There is a Delavan DLN WDB 30 degree nozzle with 120 mesh strainer at the top of the reformer
where glycerin can be supplied. A custom direct current (DC) motor and pump setup was created to
transport the glycerin to the reformer through a quarter inch hose from a 60-gallon tank that stores a
9
glycerin and water mixture. Note that the use of water with glycerin will be discussed later in this thesis.
Partial combustion of glycerin is typically more difficult than that of propane; hence, in order to make
combustion happen more readily, the glycerin is preheated through the pumping line by a heat
exchanger with Omegalux HTWC101-006 heating tape wrapped around the line. Glycerin requires a
temperature greater than 554 degrees Fahrenheit to vaporize [22], and the heat exchanger and heat
tape pre-heats the mixture to around 300 degrees F before reaching the nozzle. The energy supplied to
the heat exchanger is from the outlet heat of the reformer. Hence, the glycerin-water mixture is not
vaporized prior to entering the reformer; however, pre-heating this mixture does help facilitate the two-
phase (liquid & gaseous) reactions occurring within the reformer.
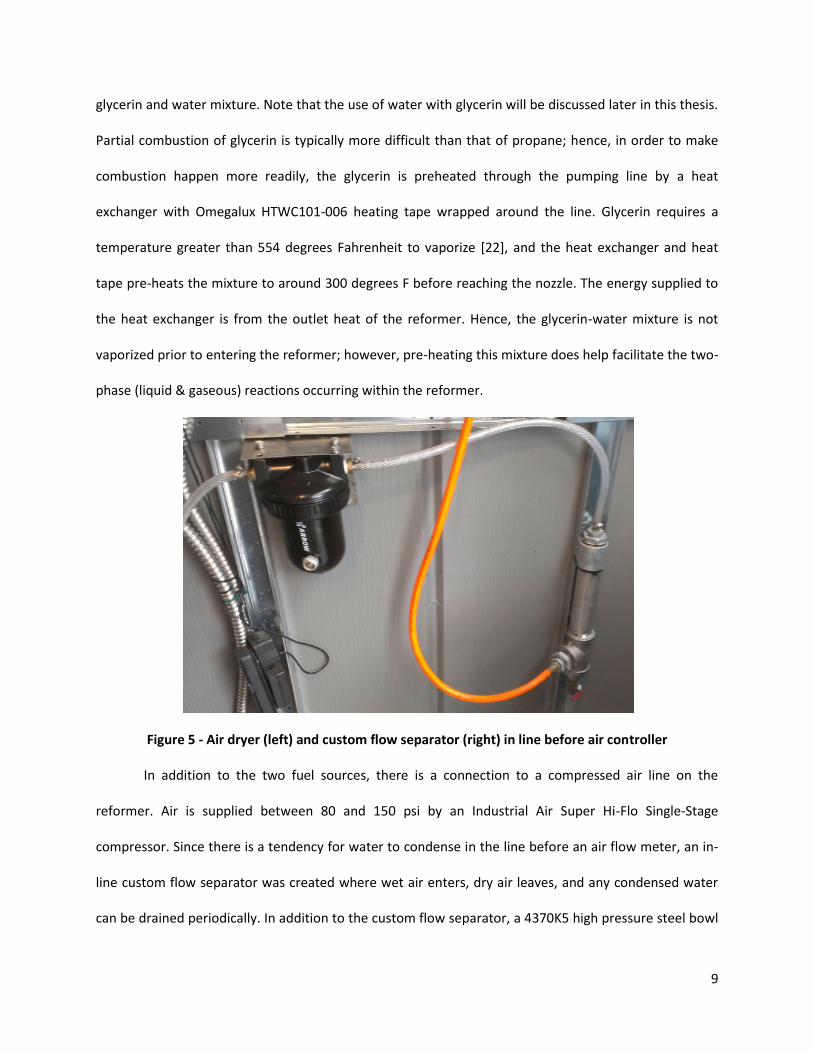
Figure 5 - Air dryer (left) and custom flow separator (right) in line before air controller
In addition to the two fuel sources, there is a connection to a compressed air line on the
reformer. Air is supplied between 80 and 150 psi by an Industrial Air Super Hi-Flo Single-Stage
compressor. Since there is a tendency for water to condense in the line before an air flow meter, an in-
line custom flow separator was created where wet air enters, dry air leaves, and any condensed water
can be drained periodically. In addition to the custom flow separator, a 4370K5 high pressure steel bowl
10
air dryer with desiccant material was purchased and placed in line before the flow meter. Both of these
devices are shown in Figure 5. The compressed air line is essential in controlling partial combustion in
the reformer. In order to maximize the production of hydrogen, combustion must take place in a rich
environment. This compressed air line allows for complete control of this process when reforming either
propane or glycerin.
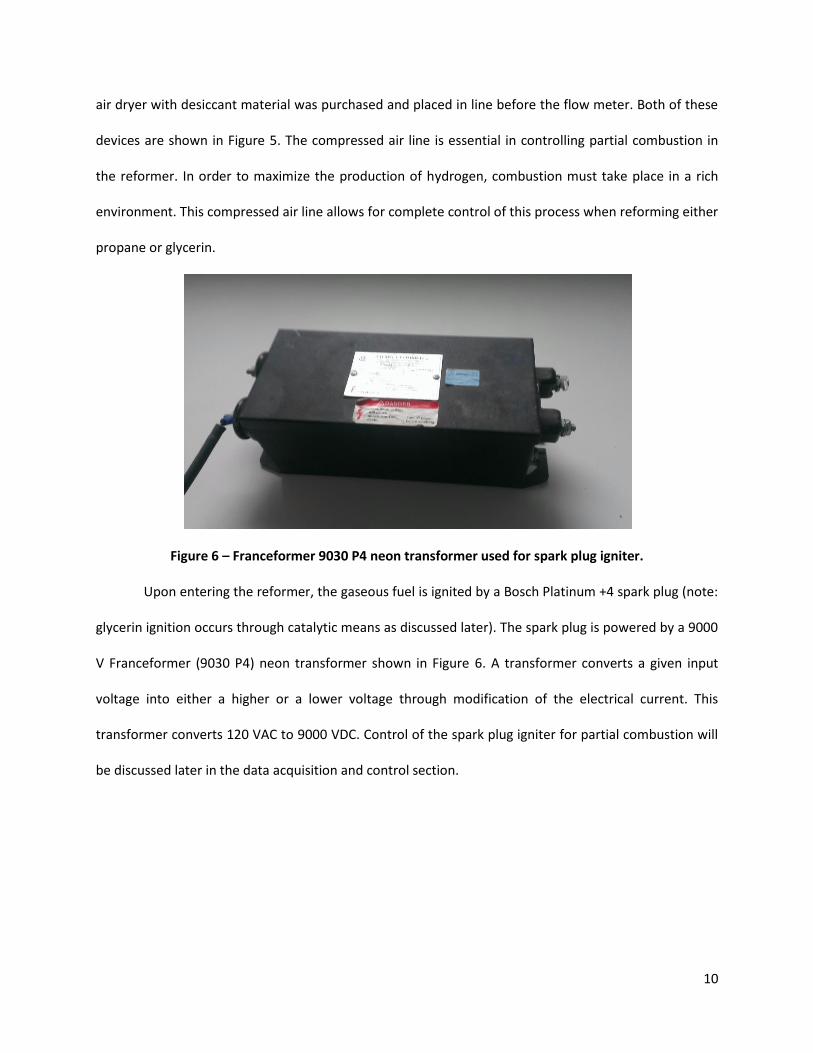
Figure 6 – Franceformer 9030 P4 neon transformer used for spark plug igniter.
Upon entering the reformer, the gaseous fuel is ignited by a Bosch Platinum +4 spark plug (note:
glycerin ignition occurs through catalytic means as discussed later). The spark plug is powered by a 9000
V Franceformer (9030 P4) neon transformer shown in Figure 6. A transformer converts a given input
voltage into either a higher or a lower voltage through modification of the electrical current. This
transformer converts 120 VAC to 9000 VDC. Control of the spark plug igniter for partial combustion will
be discussed later in the data acquisition and control section.
11
2.1.2 Engine Background and Description
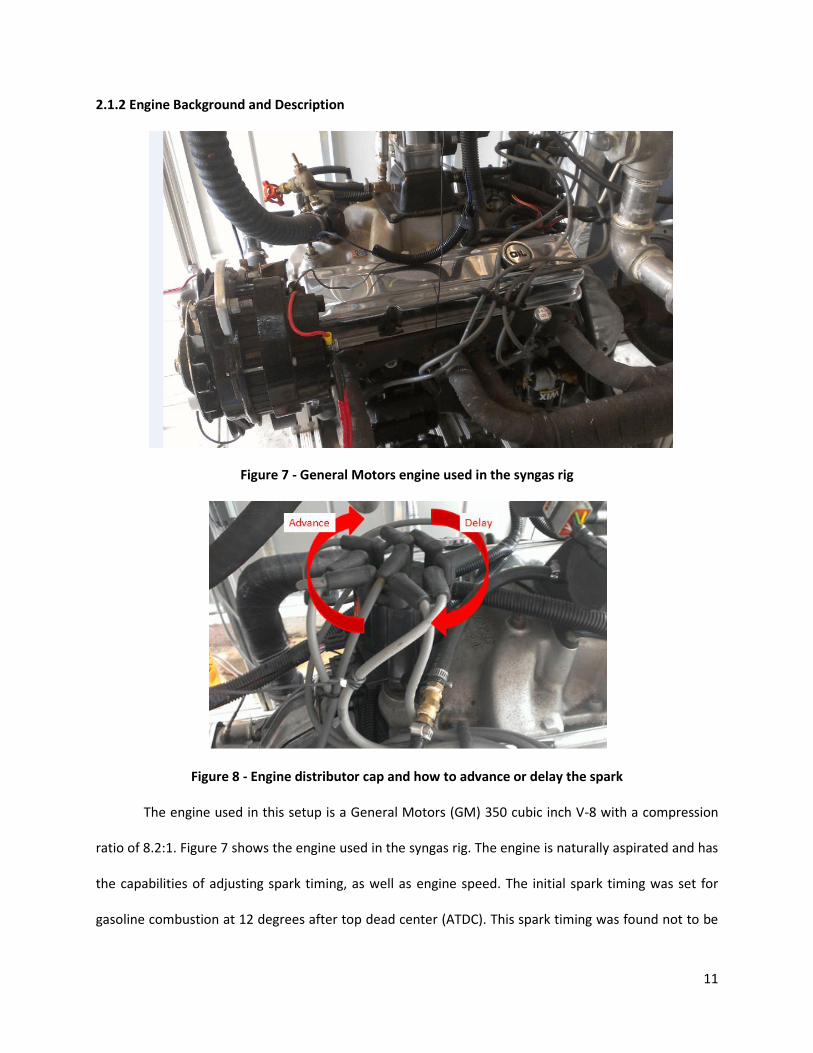
Figure 7 - General Motors engine used in the syngas rig
Figure 8 - Engine distributor cap and how to advance or delay the spark
The engine used in this setup is a General Motors (GM) 350 cubic inch V-8 with a compression
ratio of 8.2:1. Figure 7 shows the engine used in the syngas rig. The engine is naturally aspirated and has
the capabilities of adjusting spark timing, as well as engine speed. The initial spark timing was set for
gasoline combustion at 12 degrees after top dead center (ATDC). This spark timing was found not to be

12
ideal for either propane combustion or syngas combustion. Therefore, in order to reduce fuel
consumption and increase engine performance, the idle spark timing was adjusted. In particular, the
distributer cap was loosened and rotated while monitoring spark timing in real time, as shown in Figure
8.
Figure 9 - Crank shaft indicator tab with TDC position indicated
Determination of spark timing in real time occurred by removing the spark plug of the first
cylinder of the engine and the engine was manually rotated until the piston head reached the top dead
center (TDC) position. At this point, paint was applied to the crankshaft timing indicator tab. Figure 9
shows the indicator tab when the piston of the first cylinder is at TDC.
Then, a spark timing light was used to monitor the spark timing at different distributor cap
adjustments. In addition to watching the spark timing on the crankshaft indicator, in-cylinder pressure
traces were monitored in order to ensure safe engine performance. In particular, as spark timing is
advanced, the pressure rises and must stay within a safe threshold to reduce the tendency for engine
knock or excessive combustion pressures [23]. The result is that the new spark timing was set
mechanically at 18 degrees BTDC for combustion of pure propane. This timing remained the same for
the duration of this effort. Findings demonstrate that fuel consumption was drastically reduced after the

13
spark timing changes were made. Table 1 indicates fuel flow rates before and after spark optimization at
three different loads.
Table 1 - Fuel optimization before and after spark timing adjustments
Propane Flow Rate Propane Flow Rate
Before Spark Optimization After Spark Optimization
[lb/min] [lb/min]
No Load 0.6376 0.2403
One Load 0.7242 0.3404
Two Loads 0.8068 0.4288
Additional spark timing adjustments can be made digitally through use of an aftermarket
Dynamic EFI EBL Flash System Engine Control Unit (ECU) employed in the setup. Correct spark timing is
essential when operating on reformed fuels in order to ensure the most efficient combustion can take
place in the engine. Adjustments made to spark timing for syngas will be discussed further in Chapter 4.

14
Figure 10 - Air fuel valve, throttle valve and carburetor
A Woodward 8404-3002 Air-Fuel Valve (AFV) and Woodward 8404-4009 Throttle Valve (TV)
regulate the air to fuel ratio and air supplied to the engine, respectively and are shown in Figure 10.
These components allow adjustments to account for engine speed. Initially, the engine speed was set at
1800 revolutions per minute (RPM) as this speed is necessary for operating the generator at the correct
frequency. The engine speed was lowered temporarily to 1200 RPM for reformed propane combustion
in the proof of concept test discussed in Chapter 3. In addition to engine speed settings, the throttle
valve allows modifications for engine speed ramping. Changes to this setting allow a smoother transition
from zero RPM to idle speed. This speed ramp needs to be adjusted periodically throughout the year as
ambient air temperature changes. In particular, as the ambient temperature warms during the summer,

15
a more aggressive speed ramp is necessary compared to when ambient temperature is cooler in the
winter.
Initial tests of combustion with pure propane indicated engine overheating issues that needed
to be alleviated. This was caused by two primary problems: lack of air flow to the radiator and spark
timing. When operating in a vehicle, sufficient air is supplied to the radiator due to movement of the
vehicle and overheating issues are not usually a problem. With a stationary engine, this issue was fixed
by implementing a large fan to draw air from the environment and into the radiator. Moreover, as
mentioned prior, the initial spark timing set for gasoline combustion was much later than that of
propane. As a result, advancing the spark timing greatly reduced the engine temperature. When spark
timing is set too late, a significant amount of the fuel is still burning when the exhaust valve opens.
Moreover, more fuel is used to provide a required generator power reducing the efficiency of the engine
(see Table 1) while also increasing the operating temperatures [23]. Thermocouples were placed in the
coolant lines before and after the radiator, and upon making the changes mentioned previously, it was
found that the operating temperature was reduced by around 15%. Table 2 indicates the drop in engine
temperature at all of the different generator loads.
Table 2 - Engine temperature before and after spark timing adjustments
Engine Temperature Engine Temperature
Before Spark Optimization After Spark Optimization
[F] [F]
No Load 224.3 210.4
One Load 245.6 210.7
Two Loads 250.2 215.6
16
2.1.3 Generator Background and Description
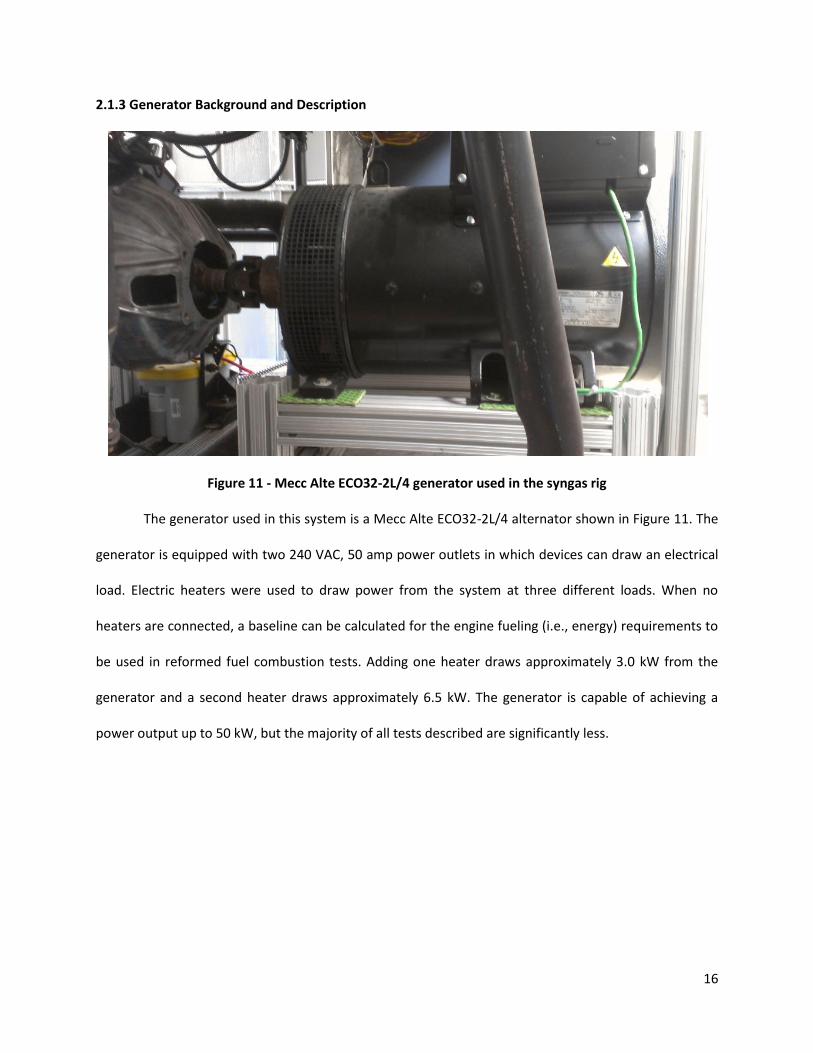
Figure 11 - Mecc Alte ECO32-2L/4 generator used in the syngas rig
The generator used in this system is a Mecc Alte ECO32-2L/4 alternator shown in Figure 11. The
generator is equipped with two 240 VAC, 50 amp power outlets in which devices can draw an electrical
load. Electric heaters were used to draw power from the system at three different loads. When no
heaters are connected, a baseline can be calculated for the engine fueling (i.e., energy) requirements to
be used in reformed fuel combustion tests. Adding one heater draws approximately 3.0 kW from the
generator and a second heater draws approximately 6.5 kW. The generator is capable of achieving a
power output up to 50 kW, but the majority of all tests described are significantly less.

17
Figure 12 - GCP 20 generator controller
A GCP 20 generator controller, as shown in Figure 12, governs the output. This allows the
generator engine speed and power output to be monitored in real time. This controller is directly
coupled to the National Instruments (NI) data acquisition device as described in the next section.
2.1.4 Data Acquisition and Control Background and Description
Data acquisition and control of the syngas rig is essential for efficient operation of the setup.
There are multiple types of data acquisition and control devices for the rig including thermocouples,
pressure transducers, humidity sensors, solenoids, and flow controllers. All of these devices are
necessary for collecting data during testing with additional experimental features that will be discussed.
The majority of all data acquisition and control is accomplished using NI hardware.
18
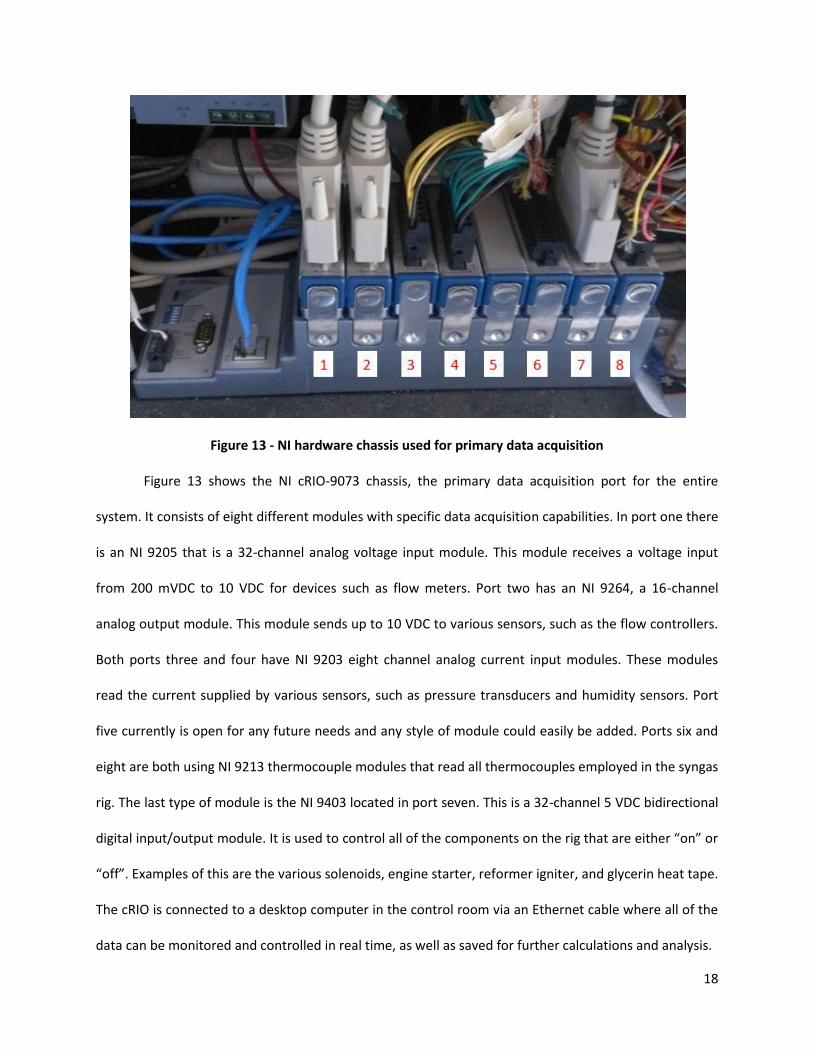
Figure 13 - NI hardware chassis used for primary data acquisition
Figure 13 shows the NI cRIO-9073 chassis, the primary data acquisition port for the entire
system. It consists of eight different modules with specific data acquisition capabilities. In port one there
is an NI 9205 that is a 32-channel analog voltage input module. This module receives a voltage input
from 200 mVDC to 10 VDC for devices such as flow meters. Port two has an NI 9264, a 16-channel
analog output module. This module sends up to 10 VDC to various sensors, such as the flow controllers.
Both ports three and four have NI 9203 eight channel analog current input modules. These modules
read the current supplied by various sensors, such as pressure transducers and humidity sensors. Port
five currently is open for any future needs and any style of module could easily be added. Ports six and
eight are both using NI 9213 thermocouple modules that read all thermocouples employed in the syngas
rig. The last type of module is the NI 9403 located in port seven. This is a 32-channel 5 VDC bidirectional
digital input/output module. It is used to control all of the components on the rig that are either “on” or
“off”. Examples of this are the various solenoids, engine starter, reformer igniter, and glycerin heat tape.
The cRIO is connected to a desktop computer in the control room via an Ethernet cable where all of the
data can be monitored and controlled in real time, as well as saved for further calculations and analysis.
19
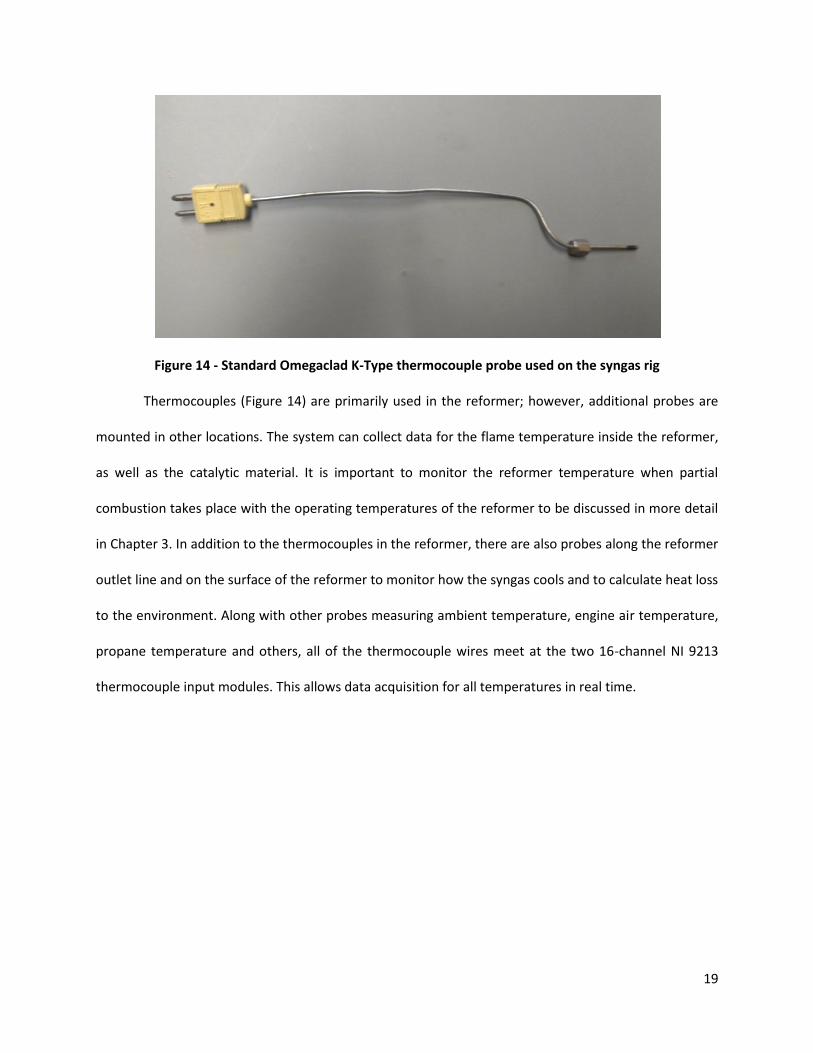
Figure 14 - Standard Omegaclad K-Type thermocouple probe used on the syngas rig
Thermocouples (Figure 14) are primarily used in the reformer; however, additional probes are
mounted in other locations. The system can collect data for the flame temperature inside the reformer,
as well as the catalytic material. It is important to monitor the reformer temperature when partial
combustion takes place with the operating temperatures of the reformer to be discussed in more detail
in Chapter 3. In addition to the thermocouples in the reformer, there are also probes along the reformer
outlet line and on the surface of the reformer to monitor how the syngas cools and to calculate heat loss
to the environment. Along with other probes measuring ambient temperature, engine air temperature,
propane temperature and others, all of the thermocouple wires meet at the two 16-channel NI 9213
thermocouple input modules. This allows data acquisition for all temperatures in real time.

20
Figure 15 - PX 319 pressure transducer used on the syngas rig
Pressure transducers (Figure 15) are also an essential data acquisition tool used throughout the
setup. The majority of all pressure transducers are Omega PX 319 models; these transducers were
chosen due to the relatively low pressures in the reformer lines. All of the transducers used in the
system send an analog current signal of 4-20 mA to the 9203 module in ports three and four. Similar to
many of the other sensors in the rig, pressure measurements can also be monitored in real time with
the LabVIEW software.

21
Figure 16 - Air control system with important features indicated
There are three flow controllers in this system, all essential for accurate operation of the syngas
rig. The first is used to control air flow from the compressed air line. An Omega FMA 1744 air flow meter
is used in line with a custom-built controller operated by a BASIC stamp microprocessor. The controller
allows compressed air to be supplied to the reformer at a flow rate up to 12.1 g/s. The limiting factor on
maximum air supply is the compressor that is unable to produce pressures above 150 psi. Adjustments
to air flow rates can be made by pressing the “increase “ or “decrease” buttons as shown in Figure 16.

22
Figure 17 - Omega gas flow controller for propane (or other combustible gasses)
The second flow controller is an Omega FMA 5444 gas flow controller and meter shown in
Figure 17 used for the bottled gas line. Tests completed by this author used propane for analysis
described in Chapter 3, but other combustible gasses could potentially be used. The flow controller is
placed before the heat exchanger in order to stay within the operating temperatures of the controller.
The original design of the syngas rig had the controller placed after the heat exchanger, but the high
temperature of the propane reduced the accuracy of the meter causing limited repeatability and
lowering the precision of the tests. Both of these flow meters send a 0-10 VDC signal to the NI 9205
analog input module so that flow rates can also be monitored in real time.

23
Figure 18 - Glycerin control with important components indicated
Figure 19 - Glycerin DC motor controller
The final flow control device used is the glycerin flow meter, pump, and control system. A
Leeson C4D7FK70 DC motor and 0.46 gallon per minute 4F17 hydraulic pump are used to supply the
glycerin as shown in Figure 18. Minimum and maximum speed, torque, and acceleration of the pump
are controlled by the Leeson 175291.00 C09 low voltage motor controller shown in Figure 19.

24
Figure 20 - Glycerin control converter from pulse input to analog input
An Omega FPD 1001-R high viscosity flow meter is used to monitor glycerin flow. This device has
a pulse output signal that cannot be monitored by the data acquisition system in place. The solution was
to convert this pulse output to an analog 4-20 mA output as shown in Figure 20. This device was
calibrated by holding the 4 and 20 mA buttons when no flow and maximum flow occur respectively.
All of the components connected to the cRIO chassis are listed in Table 3. This table indicates
what type of signal is being sent, where it is sent, and where the component is found on the syngas rig.
Table 3 - Syngas sensors with location and use described
Pin Signal Location
Port 1 - NI 9205 VI0 0-10 V DC Input Environmental Pressure
VI1 0-10 V DC Input Environmental Temperature
VI2 0-10 V DC Input Environmental Relative Humidity
VI3 0-10 V DC Input Laminar Flow Element Pressure
VI4 0-5 V DC Input Engine Water Temperature
VI5 0-5 V DC Input Engine Oil Pressure
VI6 0-5 V DC Input Throttle Valve Position
VI7 0-5 V DC Input Air/Fuel Valve Position

25
VI8 0-10 V DC Input Reformer Air Flow Meter
VI9 0-10 V DC Input Battery Voltage
Port 2 - NI 9264 VO1 0-10 V DC Output Glycerin DC Motor Controller
VO2 0-10 V DC Output Air Flow Controller
VO3 0-10 V DC Output Propane Flow Controller
VO4 0-10 V DC Output Propane Flow Controller
Port 3 - NI 9203 AI0 4-20 mA Analog Input Laminar Flow Element Pressure
AI1 4-20 mA Analog Input Glycerin Flow Meter
AI2 4-20 mA Analog Input Post Glycerin Pump Pressure
AI3 4-20 mA Analog Input Glycerin Pre Reformer Pressure
AI4 4-20 mA Analog Input Air Pressure Pre Flow Meter
AI5 4-20 mA Analog Input Syngas Post Cyclone Pressure
AI6 4-20 mA Analog Input Engine Intake Pressure
AI7 Open -
Port 4 - NI 9203 AI0 4-20 mA Analog Input GCP 20 Controller
AI1 4-20 mA Analog Input GCP 20 Controller
AI2 Open -
AI3 4-20 mA Analog Input Post Reformer Pressure
AI4 Open -
AI5 Open -
AI6 Open -
AI7 Open -
Port 5 - Open - - -
Port 6 - NI 9213 TC0 Thermocouple Input Reformer Surface Thermocouple 1
TC1 Thermocouple Input Reformer Surface Thermocouple 2
TC2 Thermocouple Input Reformer Surface Thermocouple 3
TC3 Thermocouple Input Reformer Surface Thermocouple 4
TC4 Thermocouple Input Reformer Surface Thermocouple 5
Port 7 - NI 9403 DIO0 Digital Input/Output Main Propane Solenoid
DIO1 Digital Input/Output Engine Propane Solenoid
DIO2 Digital Input/Output Syngas to Engine Solenoid
DIO3 Digital Input/Output Syngas Propane Solenoid
DIO4 Digital Input/Output Heat Wrap Relay
DIO5 Digital Input/Output Reformer Igniter Relay
DIO6 Digital Input/Output Back Pressure Close Relay
DIO7 Digital Input/Output Back Pressure Open Relay
DIO8 Digital Input/Output Engine Starter
DIO9 Digital Input/Output Air Fuel Valve Increase Value
DIO10 Digital Input/Output Air Fuel Valve Decrease Value
DIO11 Digital Input/Output Reformer Air Valve Open
DIO12 Digital Input/Output Reformer Air Valve Close
26
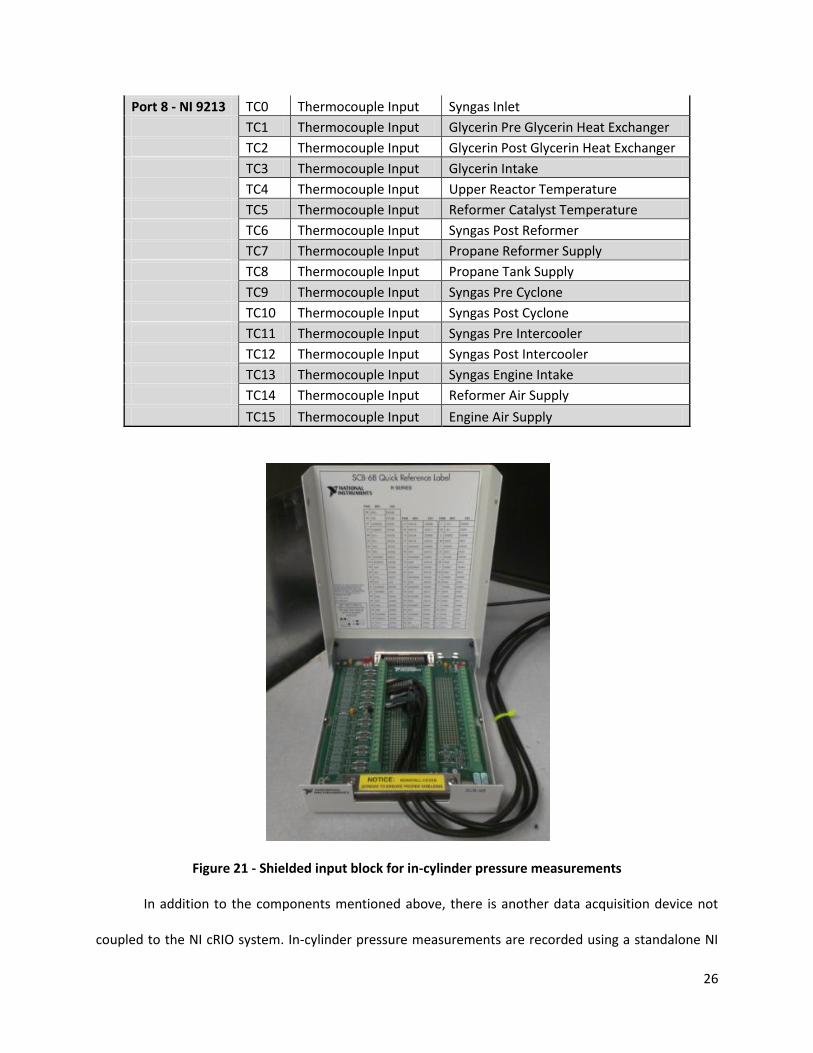
Port 8 - NI 9213 TC0 Thermocouple Input Syngas Inlet
TC1 Thermocouple Input Glycerin Pre Glycerin Heat Exchanger
TC2 Thermocouple Input Glycerin Post Glycerin Heat Exchanger
TC3 Thermocouple Input Glycerin Intake
TC4 Thermocouple Input Upper Reactor Temperature
TC5 Thermocouple Input Reformer Catalyst Temperature
TC6 Thermocouple Input Syngas Post Reformer
TC7 Thermocouple Input Propane Reformer Supply
TC8 Thermocouple Input Propane Tank Supply
TC9 Thermocouple Input Syngas Pre Cyclone
TC10 Thermocouple Input Syngas Post Cyclone
TC11 Thermocouple Input Syngas Pre Intercooler
TC12 Thermocouple Input Syngas Post Intercooler
TC13 Thermocouple Input Syngas Engine Intake
TC14 Thermocouple Input Reformer Air Supply
TC15 Thermocouple Input Engine Air Supply
Figure 21 - Shielded input block for in-cylinder pressure measurements
In addition to the components mentioned above, there is another data acquisition device not
coupled to the NI cRIO system. In-cylinder pressure measurements are recorded using a standalone NI
27
SCB-68 shielded input/output connector block shown in Figure 21. Three signals are sent to the NI SCB-
68 shielded input/output connector block; pressure, TDC trigger, and an encoder square wave. A Kistler
6052C piezoelectric transducer is used to measure the pressure in the engine along with a Kistler 2614B
optical encoder to indicate engine crank angle position.
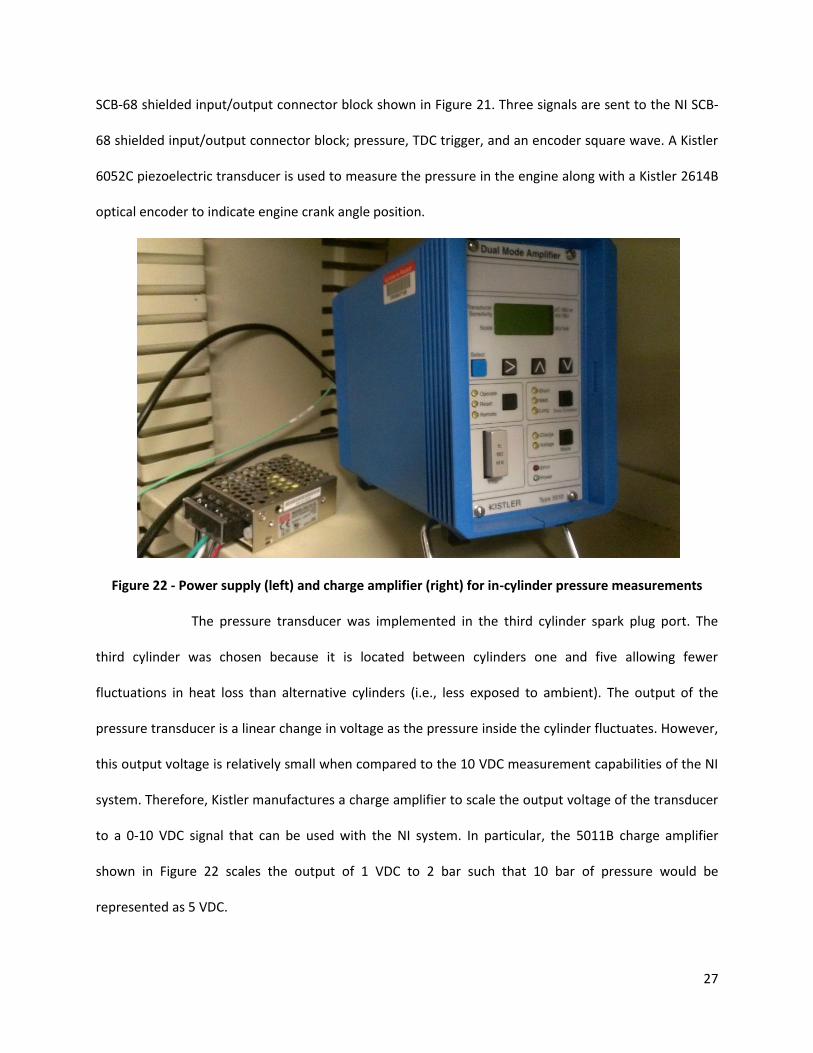
Figure 22 - Power supply (left) and charge amplifier (right) for in-cylinder pressure measurements
The pressure transducer was implemented in the third cylinder spark plug port. The
third cylinder was chosen because it is located between cylinders one and five allowing fewer
fluctuations in heat loss than alternative cylinders (i.e., less exposed to ambient). The output of the
pressure transducer is a linear change in voltage as the pressure inside the cylinder fluctuates. However,
this output voltage is relatively small when compared to the 10 VDC measurement capabilities of the NI
system. Therefore, Kistler manufactures a charge amplifier to scale the output voltage of the transducer
to a 0-10 VDC signal that can be used with the NI system. In particular, the 5011B charge amplifier
shown in Figure 22 scales the output of 1 VDC to 2 bar such that 10 bar of pressure would be
represented as 5 VDC.

28
Figure 23 - Encoder adapter and linkage for in-cylinder pressure measurements with important
components indicated
In order for the in-cylinder pressure traces to represent useful information, it is important that
the pressures be recorded with a corresponding reference to the crankshaft position in the engine. This
is accomplished with the Kistler 2614B optical encoder. A reference location is set by manually moving
the crankshaft until cylinder three is in its top dead center position (TDC) and adjusting the linkage
shown in Figure 23 to the encoders’ appropriate TDC signal position. Every time the encoder reaches the
TDC position, a pulse signal is sent to the NI SCB-68 shielded input/output connector block. Additionally,
a square wave representing incremental change in the encoder position is sent. Finally, the digital
signals can be analyzed by the NI hardware for crank angle and pressure signal recording.
Attachment of the encoder to the engine required the production of an adapter from the
crankshaft to the encoder as shown in Figure 23. The adapter was machined out of a 6-inch piece of 5-
inch diameter aluminum. Shoulder-bolt, counter-bore through holes were drilled with a matching bolt
pattern to that of the flywheel, as well as M5X0.8 tap connections for the encoder flange.

29
2.2 Control and Operation of the Syngas Rig
Figure 24 – Control panel in testing area (1) and computer control in control room (2).
There are two ways in which the syngas rig system can be operated; manually in the testing
area, or electronically via LabVIEW software in the control room. Although more control and data
acquisition is capable when using just the computer software, it is generally more useful to operate with
both manual controls and the software working together. Figure 24 shows the control panel in the
testing area and computer control in the control room.
This section will give a description on how to operate the four different options of the rig. First
of which is engine combustion using propane as a fuel source. The next topic described is partial
combustion of propane in the reformer followed by reformed propane combustion in the engine.
Finally, this segment will provide a description of the procedure of glycerin reforming and its subsequent
combustion.

30
2.2.1 Operating Procedure for Propane Combustion in the Engine
Figure 25 - Syngas control panel for engine combustion using pure propane
Propane combustion in the engine has two benefits; heating the engine before reformed fuels
can be used and finding a baseline for fuel (i.e., energy) requirements in an engine map. This engine map
will be discussed further in Chapter 3. In order for combustion to take place, several steps must be
taken. After turning on and ensuring that all of the data acquisition systems are running, the master
propane solenoid must be opened. This can be done by either flipping the “Master Propane” switch on
the control panel in Figure 25 or clicking the “Master Propane” button in the LabVIEW program shown in
Figure 24. Once master propane is activated, propane can be sent to the engine by flipping the “Engine
Propane” switch on the control panel or clicking the “Engine Propane” button in LabVIEW.
Next, a setpoint must be provided for the propane flow level. This can only be accomplished by
inputting a value into the LabVIEW software. The desired setpoint must be greater than the required
fuel for combustion at idle, usually around 0.75 lb/min. The carburetor on the setup only allows the
required amount of fuel into the engine, and if the set point is lower than this value, combustion will be
31
difficult to achieve. As long as the controller is set to a higher flow rate than that required by the engine,
no excess propane will be supplied since the carburetor is self-correcting.
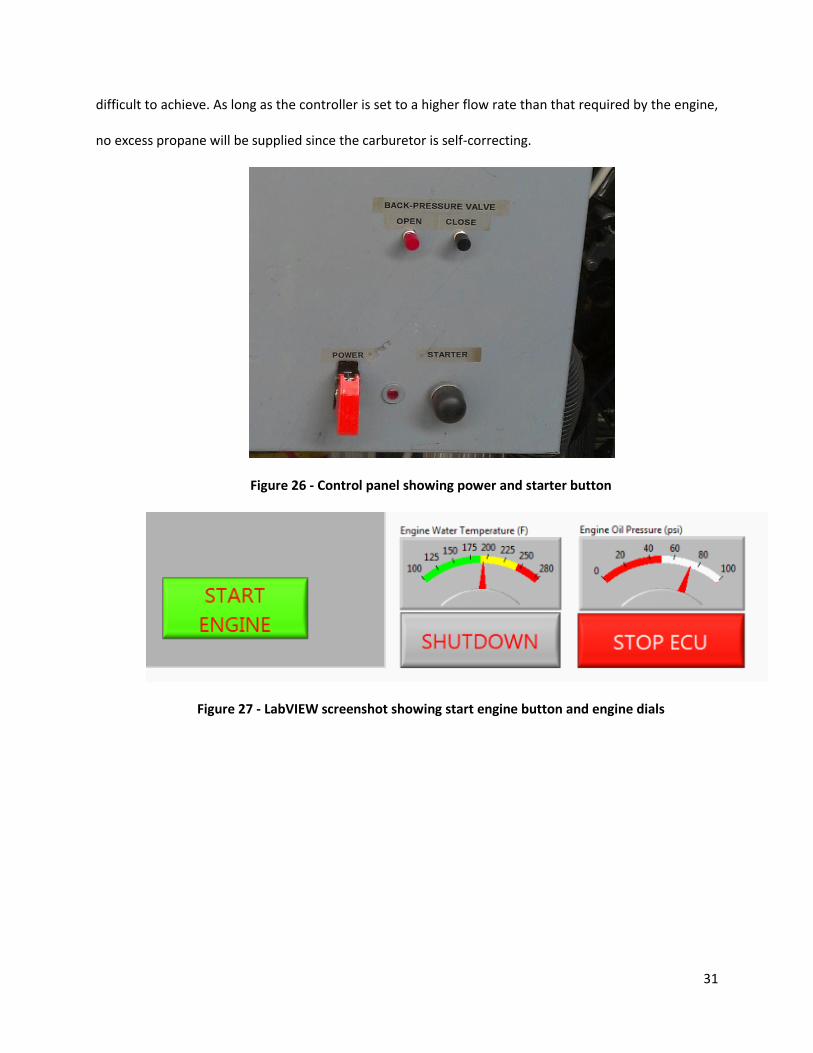
Figure 26 - Control panel showing power and starter button
Figure 27 - LabVIEW screenshot showing start engine button and engine dials

32
Figure 28 - Propane control window showing engine combustion at no load and 1800 RPM
At this point, it is possible to start the engine by either pressing the “Starter” button on the
control panel or clicking “Start Engine” in LabVIEW both shown in Figures 26 and 27 respectively. Once
the engine is running, data can be saved or monitored in real time with the computer program. Figure
28 shows the propane control section of the LabVIEW program when the engine is operating at no load
and 1800 RPM.
When the engine is running, it is possible to add an energy load to the generator. This is
accomplished using two electric heaters (previously mentioned) that are physically plugged into the
generator. When the heaters are turned on, the engine will become loaded and the fuel flow rates to
the engine will automatically increase (i.e., carburetor will add more fuel). It is essential that the
setpoint for the flow rate of propane is still greater than the required fuel flow rate at maximum load
(approximately 0.5 lb/min).

33
2.2.2 Operating Procedure for Partial Combustion in the Reformer
Figure 29 - Air control window during reforming operations
Reforming operations are an important feature of the syngas rig. Similar to propane combustion
in the engine, partial combustion in the reformer requires the master propane to engage in the same
way as mentioned prior. However, now before sending propane to the reformer, one must ensure that
air is supplied first. This is accomplished by pressing the “Air Supply” button in the program and then
turning on the controller. The air supply can be set to any desired value with the reformer air control
window shown in Figure 29.
In addition, before propane is supplied, it is important to turn on the spark plug in the reformer
by flipping the “Igniter” switch on the control panel (Figure 25) or clicking the “Igniter” button in the
program. Adding propane before turning on the igniter can result in unwanted combustion in the
reformer and cause a potential safety issue.
In order for reforming to take place, the flow rates of air and propane must be set so that
combustion takes place in a rich environment; more fuel than air as compared to stoichiometry.
Stoichiometry can be calculated using the fundamental molar balance of the combustion equation for
propane:
(1)

34
Equation 1 provides a way to calculate the number of moles required for complete combustion to take
place with one mole of propane. Completing the molar balance of this equation shows that for every
mol of propane provided, 23.8 moles of air are required. Using the molar weight of propane and air
(44.10 g/mol and 28.97 g/mol respectively) the mass air to fuel ratio (A/F) of 15.6 can be found for
stoichiometry (i.e., perfect combustion). This means that in order for partial combustion to take place,
the A/F ratio must be less than 15.6.
Figure 30 - LabVIEW window during proper reforming operations
Finally, the desired flow rate of propane can be supplied by either flipping the “Reformer
Propane” switch or clicking the same button in LabVIEW. When partial combustion is taking place, the
upper reactor temperature, as well as catalyst temperature will begin to increase. These temperatures
should be monitored at all times to ensure safe operational settings (discussed in Chapter 3). A
screenshot of the LabVIEW program during proper partial combustion of propane is shown in Figure 30.

35
2.2.3 Operating Procedure for Syngas Combustion in the Engine
Syngas combustion in the engine is the primary goal of this effort and a detailed understanding
of how it is accomplished is essential. The previous section describes how to achieve partial combustion
of propane in the reformer to produce syngas. This step must be completed first before engine
operation on syngas is possible.
Figure 31 - Backpressure valve with open position indicated
Figure 32 - Control panel during reformed propane combustion
36
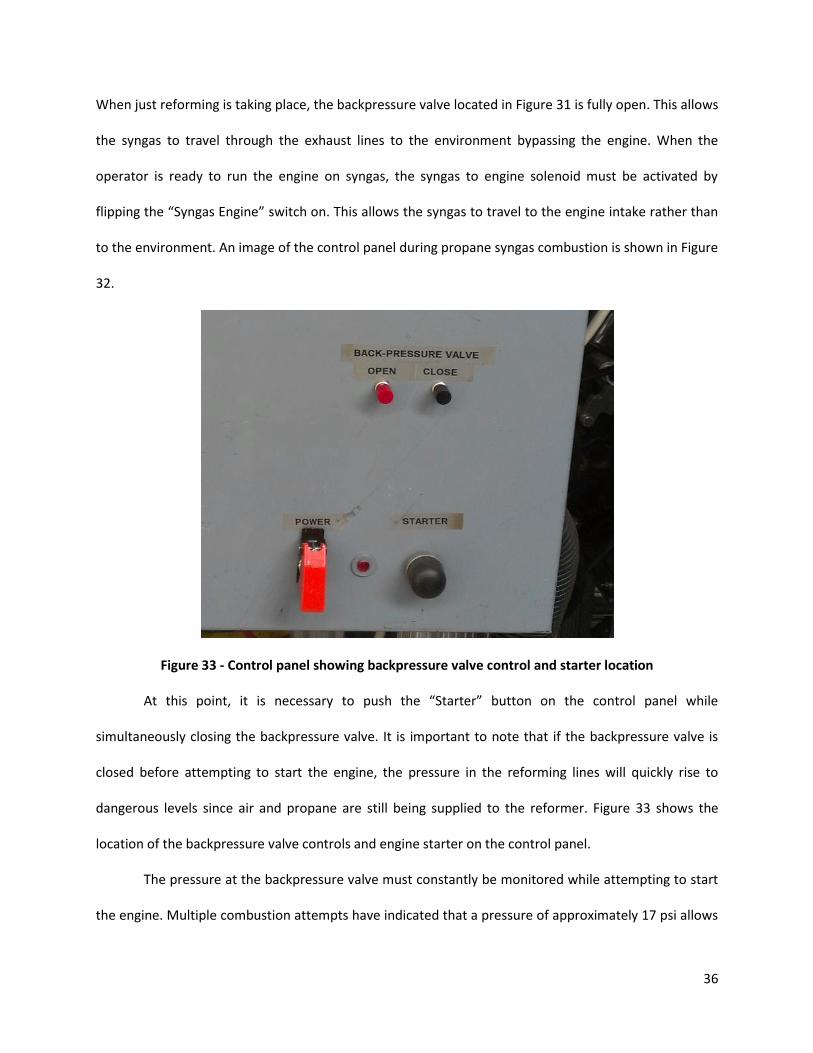
When just reforming is taking place, the backpressure valve located in Figure 31 is fully open. This allows
the syngas to travel through the exhaust lines to the environment bypassing the engine. When the
operator is ready to run the engine on syngas, the syngas to engine solenoid must be activated by
flipping the “Syngas Engine” switch on. This allows the syngas to travel to the engine intake rather than
to the environment. An image of the control panel during propane syngas combustion is shown in Figure
32.
Figure 33 - Control panel showing backpressure valve control and starter location
At this point, it is necessary to push the “Starter” button on the control panel while
simultaneously closing the backpressure valve. It is important to note that if the backpressure valve is
closed before attempting to start the engine, the pressure in the reforming lines will quickly rise to
dangerous levels since air and propane are still being supplied to the reformer. Figure 33 shows the
location of the backpressure valve controls and engine starter on the control panel.
The pressure at the backpressure valve must constantly be monitored while attempting to start
the engine. Multiple combustion attempts have indicated that a pressure of approximately 17 psi allows
37
engine combustion to take place. Once the engine is operating at the desired speed, the pressure at this
valve will adjust back to atmospheric as the syngas is now traveling to (and effectively through) the
engine rather than through the exhaust lines to the environment.
Similar to pure propane combustion in the engine, loading can be applied using reformed
propane as a fuel source. The same procedure is taken to load the engine by applying heaters to the
generator. Currently, engine combustion on reformed propane is possible for no load (aka idle), one
heater, and two heaters. Of note, the exact quantities of propane and air supplied to the reformer to
produce the appropriate levels of syngas for combustion in the engine are found using a numerical
model as discussed in Chapter 3.
2.2.4 Operating Procedure for Glycerin Reforming and its Subsequent Combustion
The final goal of the syngas rig is glycerin reforming and its subsequent engine combustion.
However, before partial combustion of glycerin is possible, the reformer must first be preheated in
order to initiate the partial oxidation and steam reforming reactions of the water-glycerin mixture.
Propane is used to preheat the reformer through the procedure mentioned previously. An air and
propane flow rate of 7.5 g/s and 1.5 g/s, respectively, should be supplied to the reformer to reach the
desired initiation temperature. At these flow rates, the mixture of air and propane is sufficiently rich
(A/F ratio of 5) allowing the reformer to be heated slowly. An air to fuel ratio closer to stoichiometry
would quickly increase the upper reactor temperature without allowing the catalyst temperature to
stabilize. Once the acceptable reformation temperature has been achieved (800 K at the upper reactor
and 600 K in the catalyst bed), glycerin can then be supplied to the reformer.
38
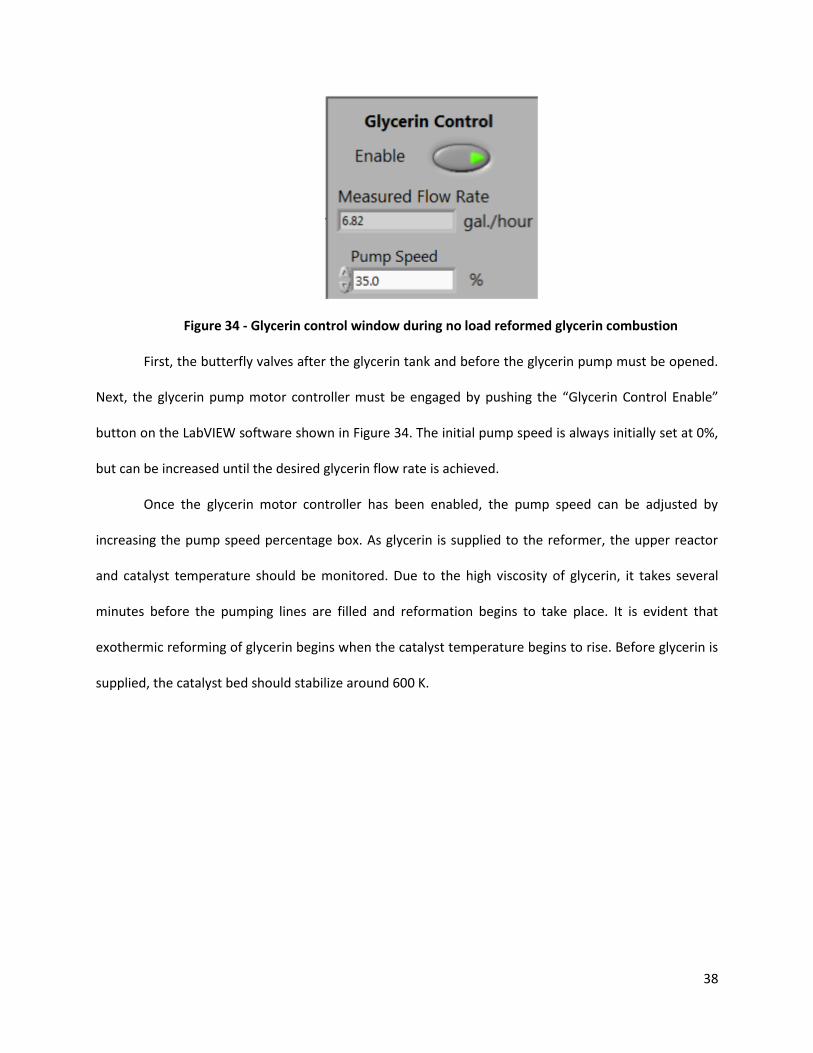
Figure 34 - Glycerin control window during no load reformed glycerin combustion
First, the butterfly valves after the glycerin tank and before the glycerin pump must be opened.
Next, the glycerin pump motor controller must be engaged by pushing the “Glycerin Control Enable”
button on the LabVIEW software shown in Figure 34. The initial pump speed is always initially set at 0%,
but can be increased until the desired glycerin flow rate is achieved.
Once the glycerin motor controller has been enabled, the pump speed can be adjusted by
increasing the pump speed percentage box. As glycerin is supplied to the reformer, the upper reactor
and catalyst temperature should be monitored. Due to the high viscosity of glycerin, it takes several
minutes before the pumping lines are filled and reformation begins to take place. It is evident that
exothermic reforming of glycerin begins when the catalyst temperature begins to rise. Before glycerin is
supplied, the catalyst bed should stabilize around 600 K.

39
Figure 35 - Temperature of upper reactor and catalytic material during transition to exothermic
glycerin reformation.
Once the glycerin is introduced, the catalyst temperature will rise and the upper reactor
temperature will simultaneously begin to fall. This is because unlike propane, glycerin cannot be ignited
through the spark plug and requires a catalytic process to convert the liquid into a reformed gas. Hence,
propane preheats the catalyst bed that causes glycerin to vaporize. Then, upon interacting with the
catalytic material, the gaseous glycerin releases energy while converting into a hydrogen rich syngas.
Figure 35 indicates the change in upper reactor and catalyst temperature as glycerin is first supplied to
the reformer. The X-axis in this figure indicates the amount of time that has passed and a value of zero
represents current values.

40
Figure 36 - Post reformer exhaust drain (1), post heat exchanger exhaust drain (2), and post back
pressure valve exhaust drain (3).
While glycerin is being supplied it is important to periodically check the three drains at the low
points in the reformer lines. The first drain is located between the propane heat exchanger and the
reformer, the second is located after the heat exchanger in the cyclone separator, and the third is
located after the backpressure valve in the exhaust line. As the syngas travels through the heat
exchanger and exhaust lines, the temperature of the gas quickly drops. This drop in temperature leads
to fluid condensation in the exhaust lines. These drains should be emptied regularly throughout glycerin
reformation and are shown in Figure 36.
The specific values for final reformer temperatures, flow rates of glycerin, and flow rates of air
will be discussed in Chapter 4 in order to achieve syngas combustion using glycerin. Once the desired
values are reached, the procedure for syngas combustion in the engine is similar to that of reformed
propane. The backpressure valve should be closed as the engine starter button is pushed.
It is important to note that propane is still being supplied to the reformer when reformed
glycerin engine combustion begins. Since some of the constituents in the reformed glycerin syngas (such
as carbon dioxide and water) reduce the likelihood for combustion to begin, adding propane helps
initially stabilize engine combustion. Once the engine speed has evened out, the propane flow rate can
slowly be reduced until no propane is supplied. At this point, it is possible to close the “Reformer
41
Propane” and “Master Propane” solenoid valves. It is also possible to turn off the igniter as exothermic
reformation of glycerin has already begun. The temperature of the catalyst will remain constant as long
as glycerin is supplied.
Similar to reformed propane combustion in the engine, it is also possible to load the generator
to produce electricity from the reformed glycerin. Before adding a load to the generator through use of
either or both of the two electric heaters, the flow rate of air and glycerin should be increased to the
appropriate flow rates. Once the flow rates and temperatures have stabilized, it is possible to load the
engine.
2.2.5 Data Collection Procedure
One of the most important aspects of the syngas rig is data collection for further analysis. All of
the sensors can be monitored in real time, but it is also beneficial to save this data to complete
calculations and compare with previous tests. Two types of data collection are available with the
LabVIEW program; system processes data, and in-cylinder pressure traces.
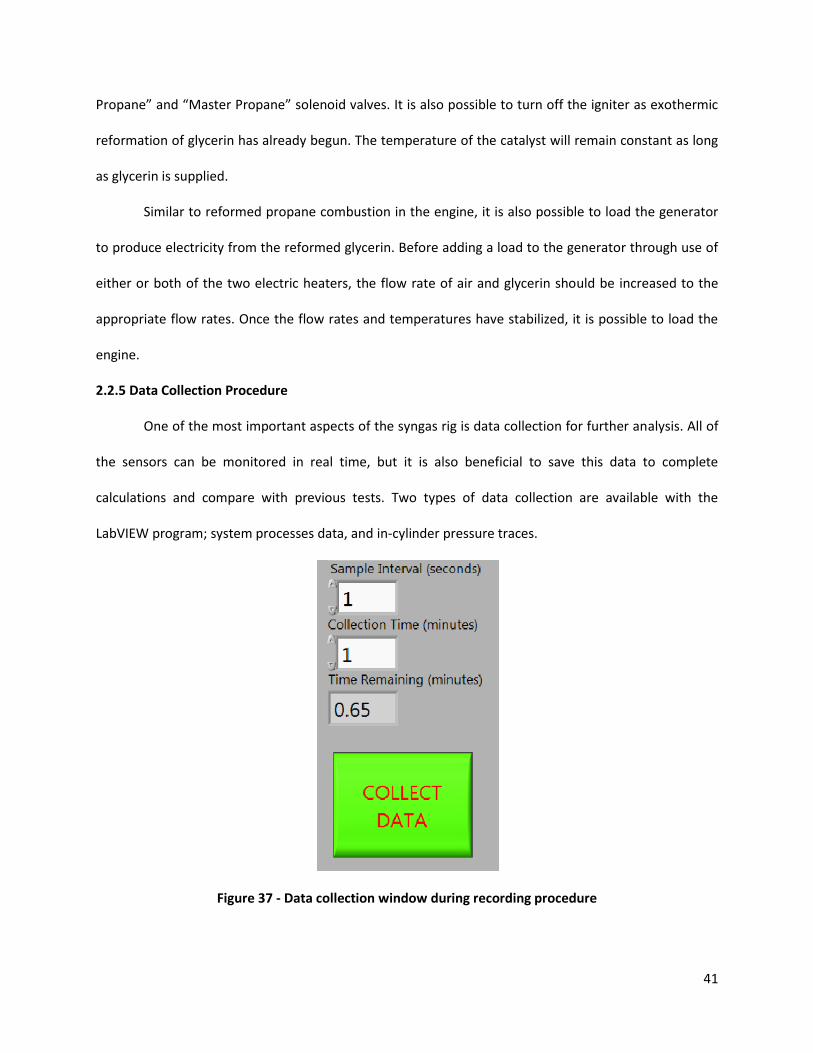
Figure 37 - Data collection window during recording procedure

42
Recording system process data can be accomplished in the program on the front panel screen as
shown in Figure 37. This figure illustrates that the operator can adjust the sample interval and sample
length. Sample interval refers to how often a data point is taken and sample length refers to the length
of the entire recorded test. The values for these parameters shown in Figure 37 indicate that data will
be recorded for one minute with a single data point taken every second. Once the “Collect Data” button
is pressed, the time remaining in the data collection can be monitored. Upon completion, a text file is
created and the user is prompted to save the file for further analysis.
Figure 38 - In-cylinder pressure trace at no load 1800 RPM pure propane engine combustion with the
red line indicating the pressure during combustion (yellow line is a motoring trace)
In addition to the data recording available for the system processes, it is also possible to capture
data for in-cylinder pressure traces in a similar manner. Figure 38 shows the LabVIEW window of the in-
cylinder pressure traces and pressing the “Record High-Speed” button on this screen saves the data.

43
Data is recorded for 20 thermodynamic engine cycles from -180 degrees BTDC to 540 degrees ATDC and
is averaged before being saved. The two curves shown on the graph in Figure 38 indicate a motoring
curve in yellow and the current test pressure curve in red. The motoring curve refers to the pressure in
the cylinder when combustion is not taking place. The peak in the motoring curve corresponds to when
the pressure is highest, near TDC. The red curve corresponds to the actual pressure in-cylinder during
combustion. The peak pressure is later than TDC for this curve as expected for optimum performance
[23].
2.2.6 Shutdown Procedure
After testing has been completed, implementing a proper shutdown procedure is just as
essential as an appropriate startup process. The first step when shutting down the rig consists of
unloading and turning off the engine. First the back pressure valve should be opened completely and the
heaters can be removed and the power switch shown in Figure 33 can be turned off. Once the engine
has stopped, it is often useful to turn the same switch back on in order to continue running the engine
coolant fan while the other systems are still operating.
After the engine has been turned off, purging the reformer exhaust lines is necessary. Before
turning off the glycerin supply, it is useful to turn on the igniter and begin supplying propane to the
reformer again. Once propane is supplied, it is possible to shut off the glycerin pump and close the
butterfly valves on the glycerin supply line. As mentioned previously, when reformed glycerin travels
through the exhaust lines, there is a tendency for the mixture to condense. Continuing to supply
propane and air to the reformer allows the reformed glycerin still in the lines to stay warm and travel to
the exhaust. Similar to when running on glycerin, it is important to continue to drain the condensed fluid
until no more reformed glycerin passes through the exhaust. It is evident that all of the glycerin is gone
and the lines are purged when the smoke in the exhaust lines (seen outside the enclosure) changes from
white to clear.

44
The next step in the shutdown procedure is the cooling of the reformer. In order to close down
the reformer, first the igniter must be turned off. If fuel is shut off first, the air-fuel ratio becomes leaner
and more towards stoichiometry (ideal combustion) resulting in a temperature rise in the reformer.
Turning off the igniter causes the temperature to begin to fall as propane combustion ceases. After
which, the flow of propane can be stopped. It is important to remember to close the propane valve
when purging has been completed. During this time, it is still necessary to continue supplying air to the
reformer because it is relatively hot and needs time to cool. The upper reactor temperature will quickly
fall, but the large mass of the catalyst will retain heat for significantly longer. Complete cooling of the
reformer may take between 30 minutes to an hour. Once the reformer catalyst has reached a safe
temperature (usually 200-300 F), it is possible to turn off the air supply.
The final step in shutting down the syngas rig is turning off the data acquisition components.
The shutdown switch can be turned off and the LabVIEW program can be closed by pressing the
shutdown button in Figure 27. Finally, it is possible to turn off the charge amplifier and power supply to
the in-cylinder pressure components, as well as the cRio power supply.

45
Chapter 3: Investigation of Propane Reforming and Syngas Combustion
Components of this chapter published as: “Combustion of Reformed Propane as Segue to Glycerin Reforming,” D.
Pickett and C. Depcik, ASME 2013 International Mechanical Engineering Congress & Exposition Conference, 13-21
November 2013, San Diego, CA (IMECE2013-62355).
3.1 Abstract
Biodiesel is a potential fuel that reduces dependency on petroleum products. Although its
upstream fabrication results in it being a renewable resource, the downstream components are the
focus of this chapter. Glycerin is a byproduct from biodiesel production and currently has few uses as a
means to recover some of the energy required to produce biodiesel. One such option is to convert
glycerin into a hydrogen rich mixture over a catalyst for subsequent use in an internal combustion
engine. A unique reformer and engine/generator setup at the University of Kansas allows the
exploration of propane reforming and its subsequent combustion as the first step into glycerin
reforming. In particular, the analysis of propane reforming will lead to the specific experimental
conditions (e.g., flow rates) needed prior to glycerin reforming. This chapter will document the
experimental side of propane reforming along with models used in its analysis and extrapolation to
glycerin.
3.2 Introduction
It is estimated that oil production will peak by 2030 necessitating widespread usage of
alternative fuels [5]. In the past several years, biodiesel production has increased as a means to reduce
the United States dependence on petroleum sources. Biodiesel is a viable alternative to petroleum
because it can readily be used in any diesel engine with little modification while maintaining the same
level of performance [9, 24]. The most common way to produce biodiesel is through transesterification.
This process refers to the catalyzed chemical reaction of renewable lipid feedstock, such as vegetable oil
or animal fat, and an alcohol, most commonly methanol, to yield fatty acid alkyl esters (biodiesel) and
46
glycerin [16]. There has been some debate on using vegetable oil as a potential feedstock because the
use of fertile lands needed to produce biofuels reduces the available land area for food crops [25].
However, assessments of biodiesel production show that it is a potential economic solution to the
United States dependence on petroleum [26]. It is important to note that this assessment must include
the study of downstream components or byproducts of biodiesel production.
One byproduct created during the production of biodiesel is glycerin, C3H5(OH)3, which currently
yields about 0.8 pounds of glycerin per gallon of fuel [27]. Glycerin is a colorless, odorless, nontoxic,
highly viscous liquid that is widely used in the food and pharmaceutical industry, as well as in the
production of soaps. Glycerin is considered one of the leading sources of hydrogen production because
of its naturally renewable derivation, as well being carbon dioxide (CO2) neutral [28]. However, glycerin
cannot be used directly as a fuel because it is subject to caking or settling and solidifying in the fuel lines.
Researchers have attempted to use glycerin as a fuel additive, but they are unable to get the fuel
mixture to atomize and burn properly at high glycerin concentrations in an engine due to its high
viscosity (also causing an increased ignition delay) [17]. Fuel additive studies completed using glycerin at
low concentrations have shown that increasing glycerin content causes hydrocarbon (HC), carbon
monoxide (CO), and nitrogen oxide (NOx) concentrations to increase while brake thermal efficiency
decreases [15, 17-19].
As a result, for combustion purposes glycerin should first be converted into a hydrogen rich
gaseous mixture (syngas) through catalytic methods, such as partial oxidation. This hydrogen rich fuel
can be then burned in an engine/generator system in order to produce energy. Hydrogen is expected to
play a major role in energy supply in the future because of its clean burning nature [20, 21]. A secondary
reason why reforming is beneficial is to reduce emissions. Although glycerin is non-toxic, acrolein fumes
that are created from directly burning the glycerin are extremely toxic [17]. A catalytic aftertreatment

47
system could help reduce these fumes, but the syngas produced from glycerin reforming has the
potential to burn significantly cleaner.
At the University of Kansas (KU), a unique experimental setup includes a full-scale reformer and
Chevy 350 in3 V8 engine used to reform glycerin and create power from its subsequent syngas.
Moreover, work is underway at understanding the chemical process of glycerin reformation across
nickel catalysts using a small reactor scale. This is geared towards optimizing the catalytic materials and
maximizing hydrogen production. However, since nickel sinters at 1073K [29] utilizing this material in
the full-scale reformer and testing via trial and error is not a smart tactic. As a result, propane is used to
find the different flow rates for running both the reformer and engine. This will minimize the effort
when it comes to using glycerin while also providing a safe avenue for the catalytic material. It is
important to mention that it does not make sense to reform propane prior to combustion in an engine
because of the loss of available energy. However, this methodology at dialing in the right conditions for
the reformer will allow easier setup of glycerin. This is similar to numerical studies that used methane
for the reforming fuel (e.g., [30]); however, in this effort, both simulation and experimentation provides
a more reliable transition to glycerin.
As a result, this chapter describes a simplified fuel reforming combustion model. Moreover, an
explanation of the experimental setup including the reformer and engine is provided. Furthermore,
experimental results are presented with respect to propane reforming and subsequent syngas
combustion. Finally, a parametric study is indicated that will lead into the combustion of reformed
glycerin in the following chapter.
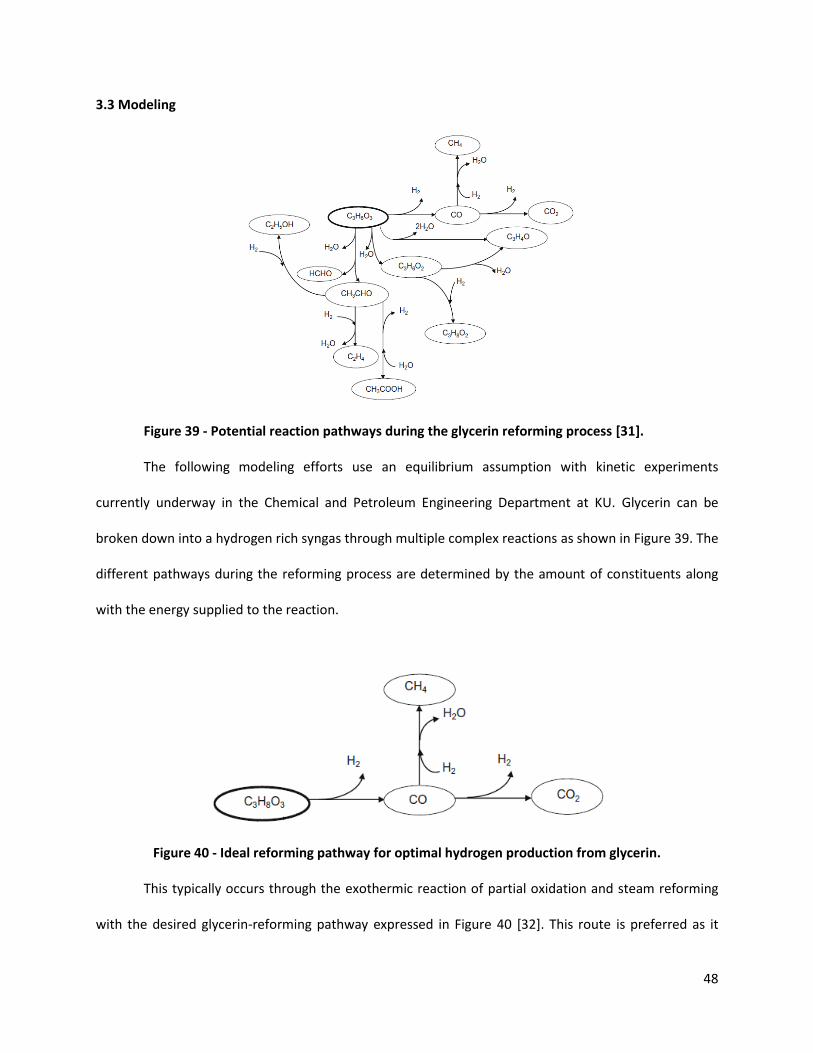
48
3.3 Modeling
Figure 39 - Potential reaction pathways during the glycerin reforming process [31].
The following modeling efforts use an equilibrium assumption with kinetic experiments
currently underway in the Chemical and Petroleum Engineering Department at KU. Glycerin can be
broken down into a hydrogen rich syngas through multiple complex reactions as shown in Figure 39. The
different pathways during the reforming process are determined by the amount of constituents along
with the energy supplied to the reaction.
Figure 40 - Ideal reforming pathway for optimal hydrogen production from glycerin.
This typically occurs through the exothermic reaction of partial oxidation and steam reforming
with the desired glycerin-reforming pathway expressed in Figure 40 [32]. This route is preferred as it
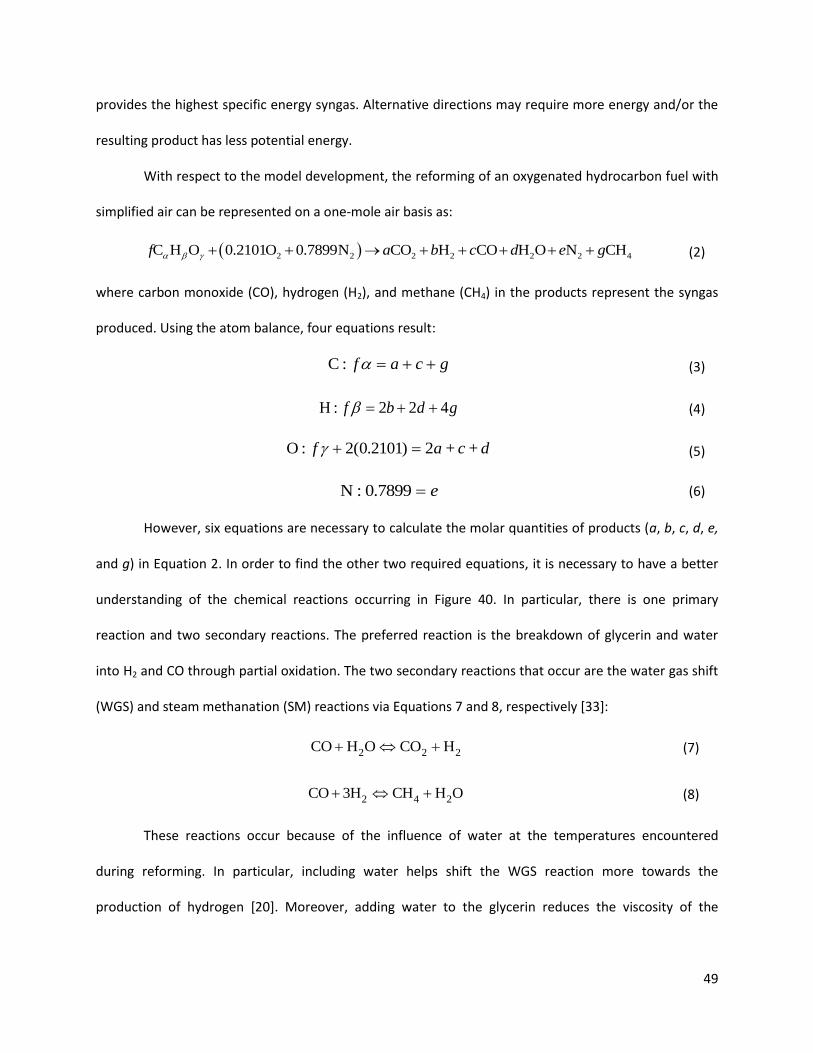
49
provides the highest specific energy syngas. Alternative directions may require more energy and/or the
resulting product has less potential energy.
With respect to the model development, the reforming of an oxygenated hydrocarbon fuel with
simplified air can be represented on a one-mole air basis as:
2 2 2 2 2 2 4C H O 0.2101O 0.7899N CO H CO H O N CHf a b c d e g (2)
where carbon monoxide (CO), hydrogen (H2), and methane (CH4) in the products represent the syngas
produced. Using the atom balance, four equations result:
C : f a c g (3)
H : 2 2 4f b d g (4)
O : 2(0.2101) 2f a +c +d (5)
N : 0.7899 e (6)
However, six equations are necessary to calculate the molar quantities of products (a, b, c, d, e,
and g) in Equation 2. In order to find the other two required equations, it is necessary to have a better
understanding of the chemical reactions occurring in Figure 40. In particular, there is one primary
reaction and two secondary reactions. The preferred reaction is the breakdown of glycerin and water
into H2 and CO through partial oxidation. The two secondary reactions that occur are the water gas shift
(WGS) and steam methanation (SM) reactions via Equations 7 and 8, respectively [33]:
2 2 2CO H O CO H (7)
2 4 2CO 3H CH H O (8)
These reactions occur because of the influence of water at the temperatures encountered
during reforming. In particular, including water helps shift the WGS reaction more towards the
production of hydrogen [20]. Moreover, adding water to the glycerin reduces the viscosity of the
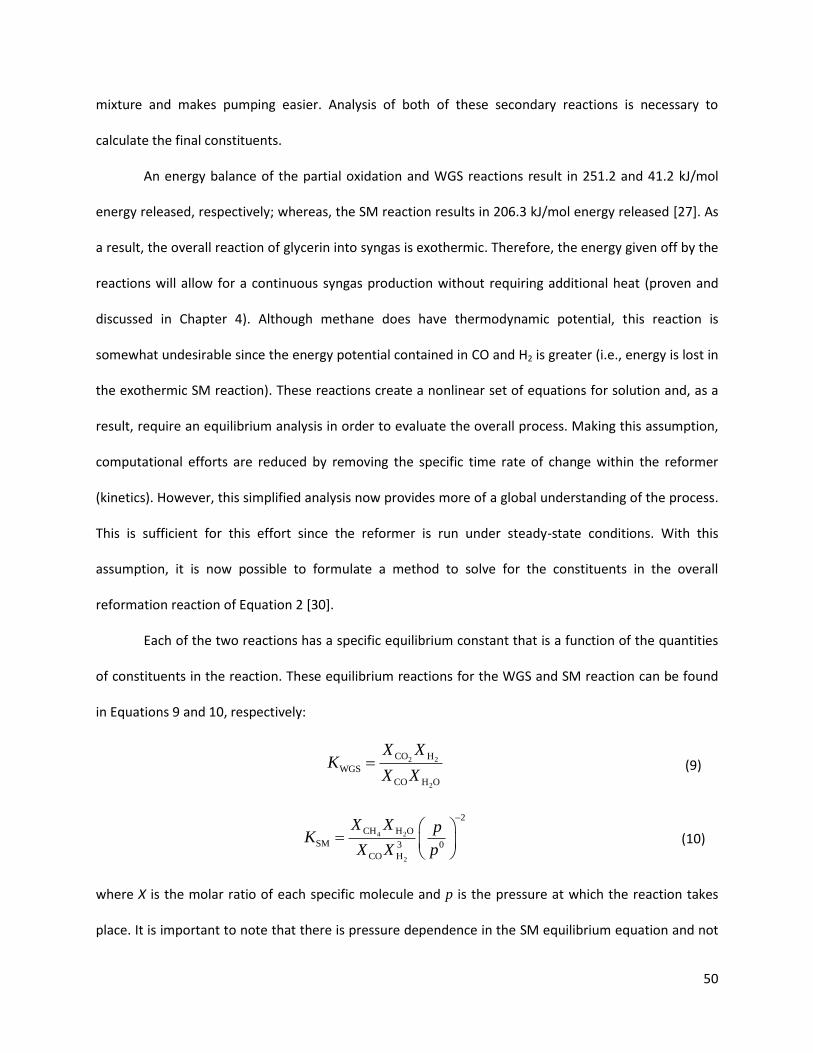
50
mixture and makes pumping easier. Analysis of both of these secondary reactions is necessary to
calculate the final constituents.
An energy balance of the partial oxidation and WGS reactions result in 251.2 and 41.2 kJ/mol
energy released, respectively; whereas, the SM reaction results in 206.3 kJ/mol energy released [27]. As
a result, the overall reaction of glycerin into syngas is exothermic. Therefore, the energy given off by the
reactions will allow for a continuous syngas production without requiring additional heat (proven and
discussed in Chapter 4). Although methane does have thermodynamic potential, this reaction is
somewhat undesirable since the energy potential contained in CO and H2 is greater (i.e., energy is lost in
the exothermic SM reaction). These reactions create a nonlinear set of equations for solution and, as a
result, require an equilibrium analysis in order to evaluate the overall process. Making this assumption,
computational efforts are reduced by removing the specific time rate of change within the reformer
(kinetics). However, this simplified analysis now provides more of a global understanding of the process.
This is sufficient for this effort since the reformer is run under steady-state conditions. With this
assumption, it is now possible to formulate a method to solve for the constituents in the overall
reformation reaction of Equation 2 [30].
Each of the two reactions has a specific equilibrium constant that is a function of the quantities
of constituents in the reaction. These equilibrium reactions for the WGS and SM reaction can be found
in Equations 9 and 10, respectively:
2 2
2
CO H
WGS
CO H O
X XK
X X (9)
4 2
2
2
CH H O
SM 3 0
CO H
X X pK
X X p
(10)
where X is the molar ratio of each specific molecule and p is the pressure at which the reaction takes
place. It is important to note that there is pressure dependence in the SM equilibrium equation and not

51
in the WGS version. This dependence is a result of the fundamental formulation of the equilibrium
analysis. In particular, the number of moles of products and reactants are the same for the WGS
reaction canceling any pressure dependence. However, for the SM reaction there are four moles of
reactants and only two moles of products that causes squared pressure dependence.
Adding Equations 9 and 10 to Equations 3 through 6 provide for the six necessary equations to
solve for the unknown quantities of product constituents. These equations require the calculation of the
equilibrium constants (KWGS and KSM) using a Gibbs free energy (ΔG) analysis. The equation used to
solve for the equilibrium constants is found in Equation 11 where ΔS is the molar entropy, Ru is the
universal gas constant, ΔH is the molar enthalpy and T is the reaction temperature [30]:
exp exp
o o oo
u u u
G S H
R T R R TK
(11)
with the values of entropy and enthalpy tabulated for all of the constituents in both the WGS shift and
SM reaction.
Initially, the author attempted to solve these six equations simultaneously using the fsolve
routine in Matlab. However, convergence was unsuccessful due to the highly non-linear nature of the
equations, specifically the third order dependency in the denominator of Equation 10 for hydrogen. As a
result, the NASA Chemical Equilibrium with Applications (CEA) program was utilized to handle the
equilibrium calculation [34]. This program was linked to MATLAB in order to provide for a quick
methodology of finding the flow rates of syngas components as a function of temperature. In specific,
MATLAB uses the experimental flow rates of fuel and air to the reformer and writes a CEA input file.
Then, MATLAB calls the CEA executable file and reads the output equilibrium values.
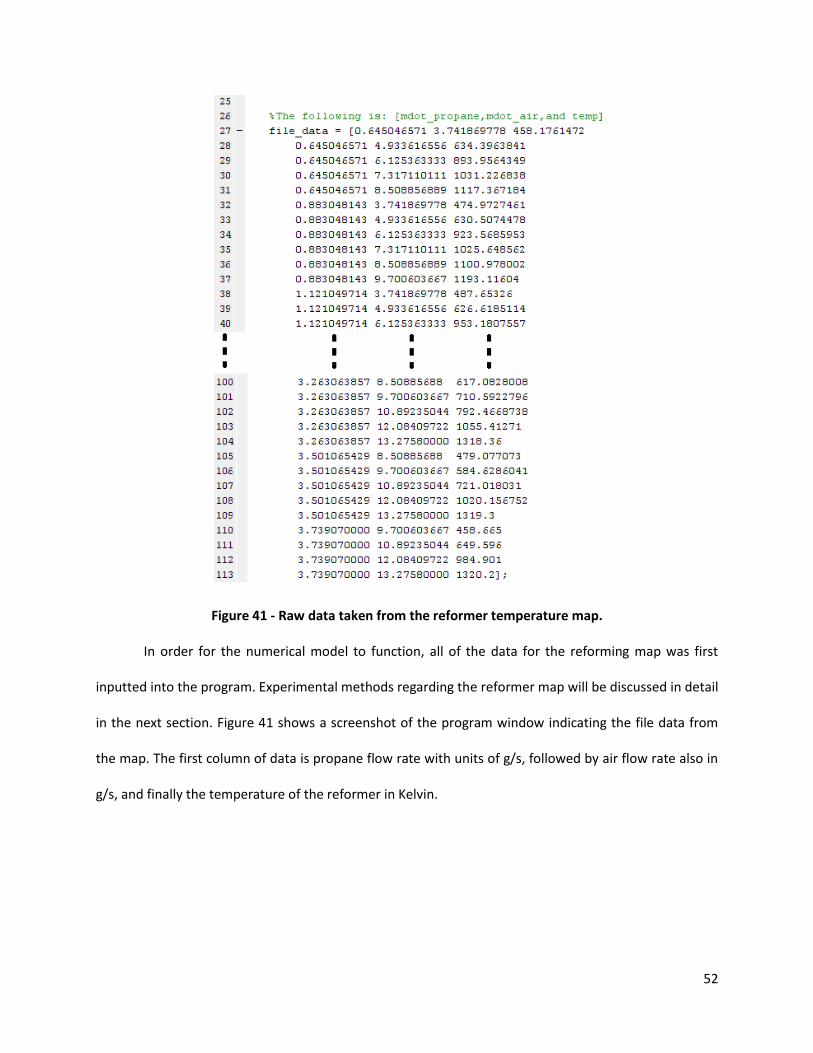
52
Figure 41 - Raw data taken from the reformer temperature map.
In order for the numerical model to function, all of the data for the reforming map was first
inputted into the program. Experimental methods regarding the reformer map will be discussed in detail
in the next section. Figure 41 shows a screenshot of the program window indicating the file data from
the map. The first column of data is propane flow rate with units of g/s, followed by air flow rate also in
g/s, and finally the temperature of the reformer in Kelvin.
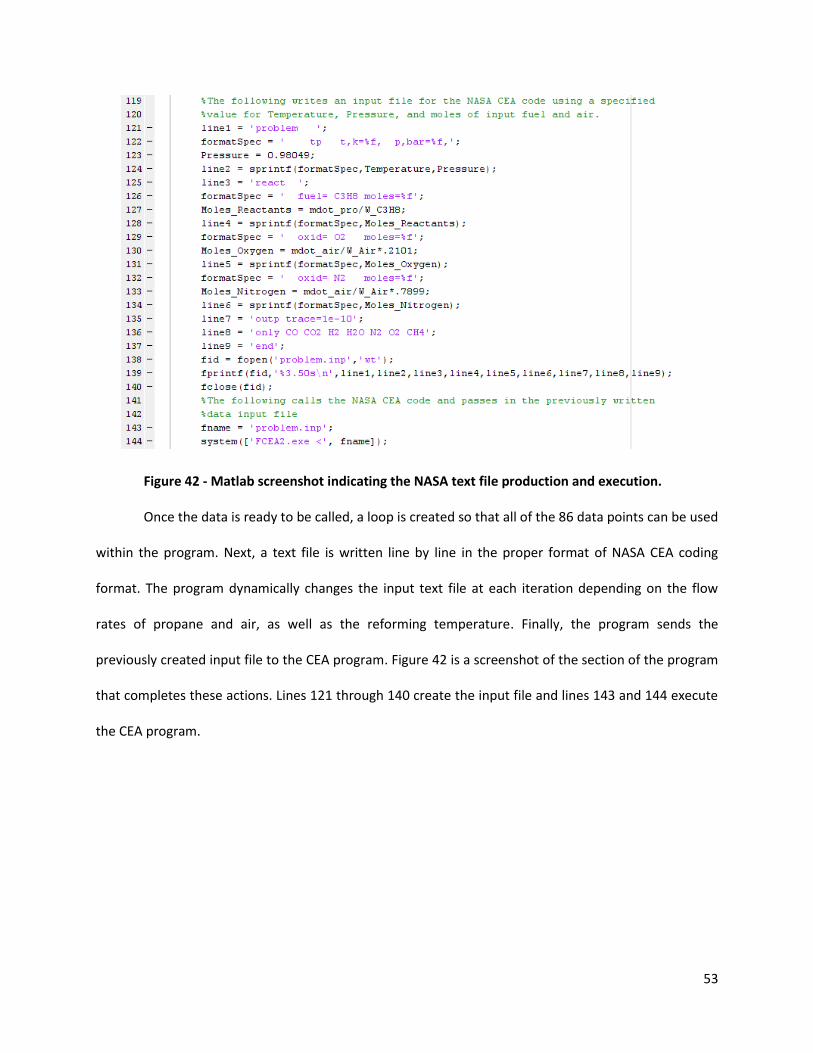
53
Figure 42 - Matlab screenshot indicating the NASA text file production and execution.
Once the data is ready to be called, a loop is created so that all of the 86 data points can be used
within the program. Next, a text file is written line by line in the proper format of NASA CEA coding
format. The program dynamically changes the input text file at each iteration depending on the flow
rates of propane and air, as well as the reforming temperature. Finally, the program sends the
previously created input file to the CEA program. Figure 42 is a screenshot of the section of the program
that completes these actions. Lines 121 through 140 create the input file and lines 143 and 144 execute
the CEA program.
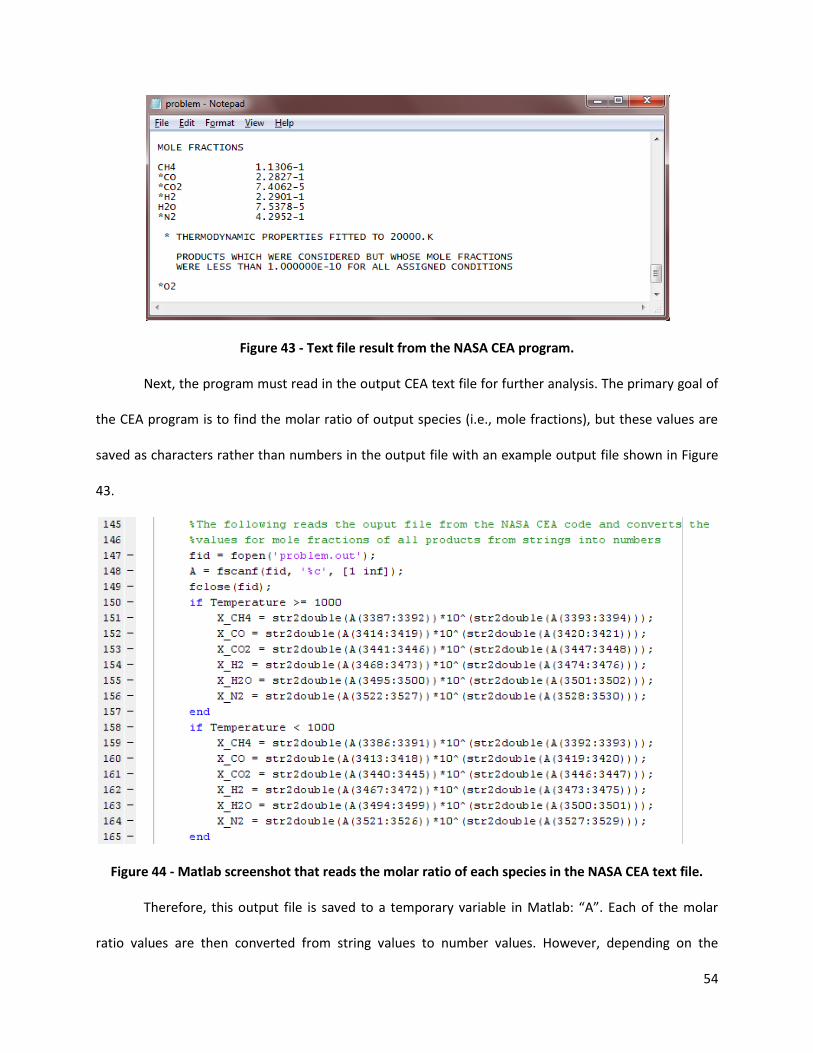
54
Figure 43 - Text file result from the NASA CEA program.
Next, the program must read in the output CEA text file for further analysis. The primary goal of
the CEA program is to find the molar ratio of output species (i.e., mole fractions), but these values are
saved as characters rather than numbers in the output file with an example output file shown in Figure
43.
Figure 44 - Matlab screenshot that reads the molar ratio of each species in the NASA CEA text file.
Therefore, this output file is saved to a temporary variable in Matlab: “A”. Each of the molar
ratio values are then converted from string values to number values. However, depending on the

55
reforming temperature, the location of the molar ratios are different for each iteration. Lines 147 to 149
in Figure 44 show how the output file is read and saved to the temporary variable and then closed. Lines
150 to 165 show the conversion of each molar ratio from a string to number value. The output file of the
NASA CEA program originally writes the values of molar ratios in scientific notation and depending on
the character location of each of these strings, a different portion of the temporary variable must be
called and converted to a number. For example, “A(3387:3392)” in Figure 44 refers to the value of
“1.1306” in Figure 43. Similarly the value of “A(3393:3394)” refers to the exponent value of “-1” in
Figures 44 and 43, respectively.
After reading the output, conservation of mass can be applied to calculate the mass flow rate of
the resulting syngas.
3 8air C H synm m m (12)
The molecular weight of the syngas can be found by summing the multiplication of each species’
molecular weight by their corresponding molar ratio (i.e., mole fraction). Dividing the syngas mass flow
rate by the molecular weight of the mixture calculates the molar flow rate produced by the reforming
process. Now, the molar flow rate of each product can be found by using each species mole fraction.
The molar flow rate of each species is essential in the calculation of the heat release of the reaction
from the first law of thermodynamics:
3 8 3 8C H C Hair air syn synn h n h n h Q (13)
where n is the molar flow rate, h is the molar enthalpy and Q is the heat transfer from the reactor.
The heat transfer to the ambient involves convection and is modeled as:
c s ref ambQ h A T T (14)
In this equation, the temperature leaving the reformer (Tref), ambient temperature (Tamb), and surface
area (As) are measured. As a result, the convective heat transfer coefficient can be calculated using the
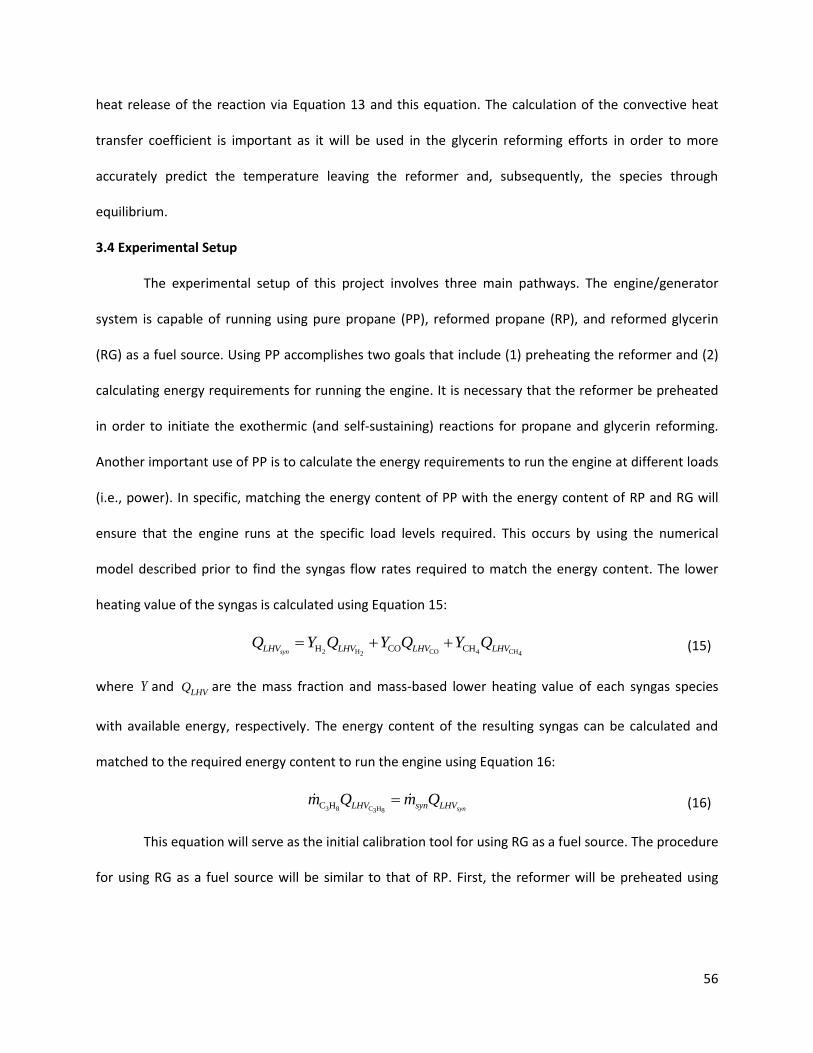
56
heat release of the reaction via Equation 13 and this equation. The calculation of the convective heat
transfer coefficient is important as it will be used in the glycerin reforming efforts in order to more
accurately predict the temperature leaving the reformer and, subsequently, the species through
equilibrium.
3.4 Experimental Setup
The experimental setup of this project involves three main pathways. The engine/generator
system is capable of running using pure propane (PP), reformed propane (RP), and reformed glycerin
(RG) as a fuel source. Using PP accomplishes two goals that include (1) preheating the reformer and (2)
calculating energy requirements for running the engine. It is necessary that the reformer be preheated
in order to initiate the exothermic (and self-sustaining) reactions for propane and glycerin reforming.
Another important use of PP is to calculate the energy requirements to run the engine at different loads
(i.e., power). In specific, matching the energy content of PP with the energy content of RP and RG will
ensure that the engine runs at the specific load levels required. This occurs by using the numerical
model described prior to find the syngas flow rates required to match the energy content. The lower
heating value of the syngas is calculated using Equation 15:
2 H CO 4 CH2 4H CO CHsynLHV LHV LHV LHVQ Y Q Y Q Y Q (15)
where Y and LHVQ are the mass fraction and mass-based lower heating value of each syngas species
with available energy, respectively. The energy content of the resulting syngas can be calculated and
matched to the required energy content to run the engine using Equation 16:
3 8 C H3 8C H synLHV syn LHVm Q m Q (16)
This equation will serve as the initial calibration tool for using RG as a fuel source. The procedure
for using RG as a fuel source will be similar to that of RP. First, the reformer will be preheated using

57
propane until the desired temperature is reached. At this time, a mixture of glycerin and water will be
added to the reformer to produce syngas that is sent to the engine.
Figure 45 - Complete flow structure of the reformer, engine, and generator setup.
Figure 45 shows the complete flow structure of the reformer, engine, and generator setup. The
orange lines in the lower part of the figure indicate how propane is supplied to the reformer or to the
engine for baseline tests. Propane is sent at approximately 15 psi and is controlled by an Omega FMA
5444 gas flow controller. Dashed red lines indicate the flow of syngas, cooled in a heat exchanger before
sending to the engine. This SEC PL-500 heat exchanger helps prevent engine knock and increase the
density of the mixture. Glycerin (dark blue lines) is pumped to the reformer by a Leeson C4D7FK70 DC
motor and its subsequent syngas is also cooled in the same heat exchanger before sending to the
engine. Glycerin flow is measured using an Omega FPD 1001-R high viscosity flow meter. Compressed air
(gray lines) is constantly supplied while reforming takes place and is monitored by an Omega FMA 1744
air flow meter. Control of the air-fuel ratio in the reformer is accomplished with a custom-built air flow
controller made using a NEMA SC060604RC stepper motor and Parallax BS-2 microprocessor.
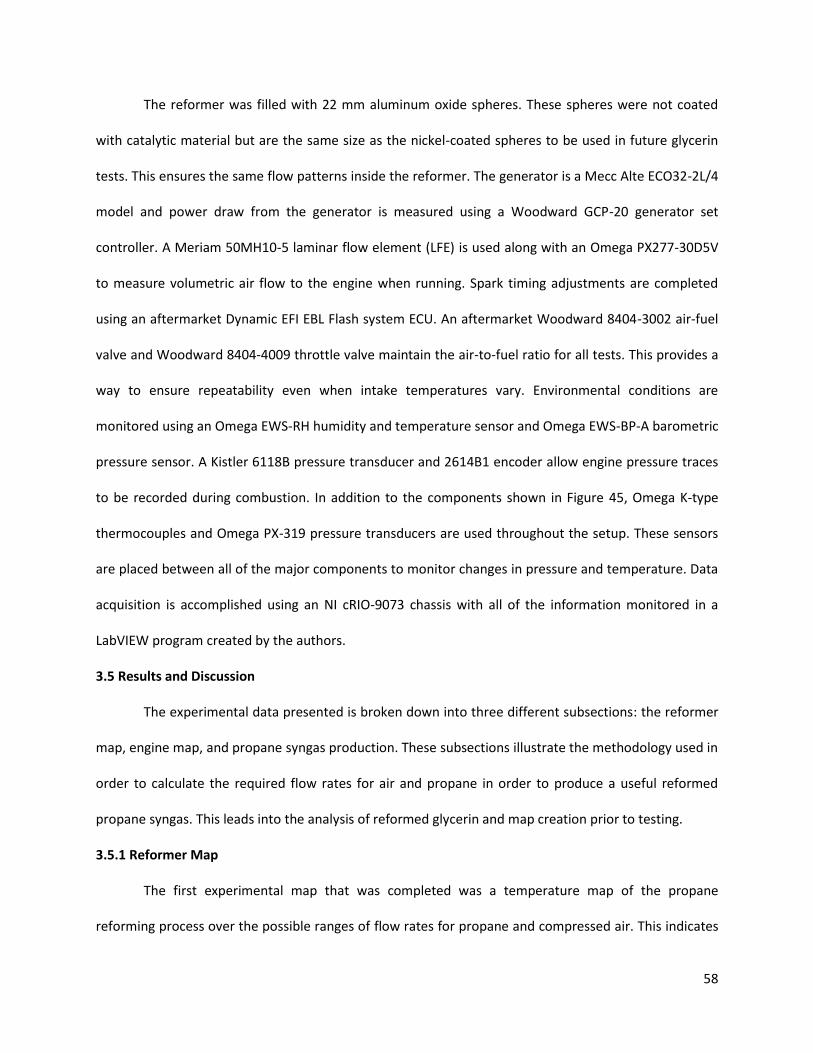
58
The reformer was filled with 22 mm aluminum oxide spheres. These spheres were not coated
with catalytic material but are the same size as the nickel-coated spheres to be used in future glycerin
tests. This ensures the same flow patterns inside the reformer. The generator is a Mecc Alte ECO32-2L/4
model and power draw from the generator is measured using a Woodward GCP-20 generator set
controller. A Meriam 50MH10-5 laminar flow element (LFE) is used along with an Omega PX277-30D5V
to measure volumetric air flow to the engine when running. Spark timing adjustments are completed
using an aftermarket Dynamic EFI EBL Flash system ECU. An aftermarket Woodward 8404-3002 air-fuel
valve and Woodward 8404-4009 throttle valve maintain the air-to-fuel ratio for all tests. This provides a
way to ensure repeatability even when intake temperatures vary. Environmental conditions are
monitored using an Omega EWS-RH humidity and temperature sensor and Omega EWS-BP-A barometric
pressure sensor. A Kistler 6118B pressure transducer and 2614B1 encoder allow engine pressure traces
to be recorded during combustion. In addition to the components shown in Figure 45, Omega K-type
thermocouples and Omega PX-319 pressure transducers are used throughout the setup. These sensors
are placed between all of the major components to monitor changes in pressure and temperature. Data
acquisition is accomplished using an NI cRIO-9073 chassis with all of the information monitored in a
LabVIEW program created by the authors.
3.5 Results and Discussion
The experimental data presented is broken down into three different subsections: the reformer
map, engine map, and propane syngas production. These subsections illustrate the methodology used in
order to calculate the required flow rates for air and propane in order to produce a useful reformed
propane syngas. This leads into the analysis of reformed glycerin and map creation prior to testing.
3.5.1 Reformer Map
The first experimental map that was completed was a temperature map of the propane
reforming process over the possible ranges of flow rates for propane and compressed air. This indicates
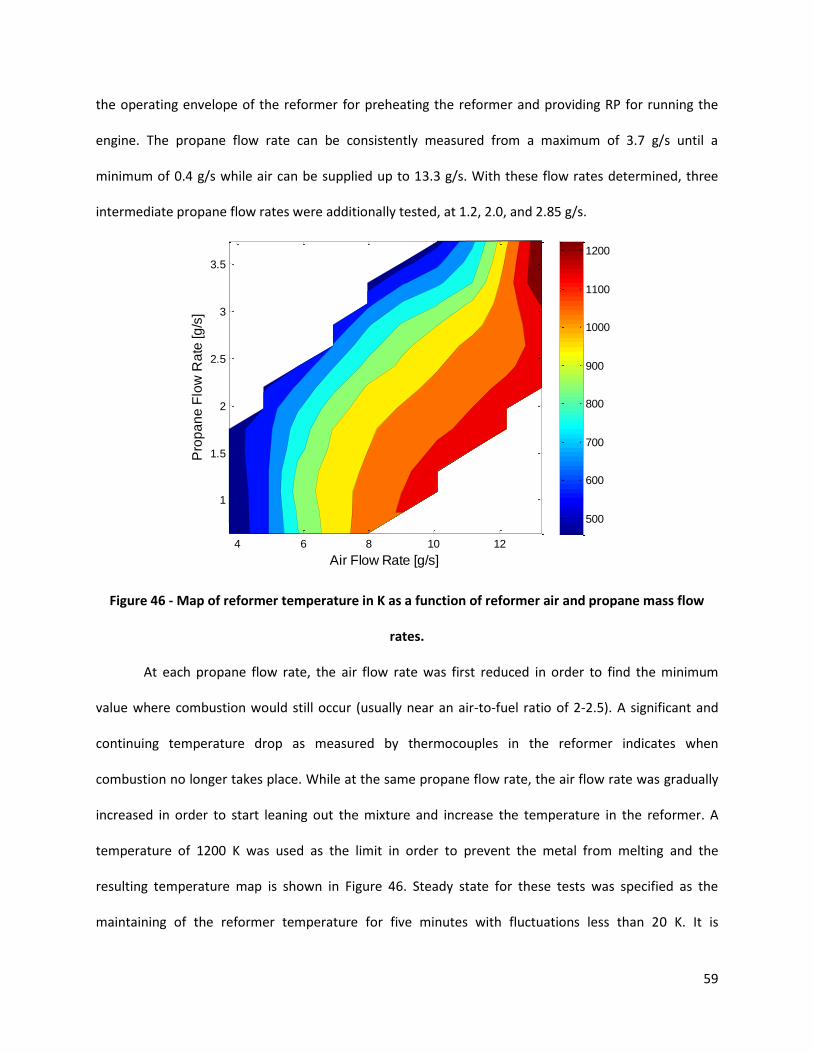
59
the operating envelope of the reformer for preheating the reformer and providing RP for running the
engine. The propane flow rate can be consistently measured from a maximum of 3.7 g/s until a
minimum of 0.4 g/s while air can be supplied up to 13.3 g/s. With these flow rates determined, three
intermediate propane flow rates were additionally tested, at 1.2, 2.0, and 2.85 g/s.
Figure 46 - Map of reformer temperature in K as a function of reformer air and propane mass flow
rates.
At each propane flow rate, the air flow rate was first reduced in order to find the minimum
value where combustion would still occur (usually near an air-to-fuel ratio of 2-2.5). A significant and
continuing temperature drop as measured by thermocouples in the reformer indicates when
combustion no longer takes place. While at the same propane flow rate, the air flow rate was gradually
increased in order to start leaning out the mixture and increase the temperature in the reformer. A
temperature of 1200 K was used as the limit in order to prevent the metal from melting and the
resulting temperature map is shown in Figure 46. Steady state for these tests was specified as the
maintaining of the reformer temperature for five minutes with fluctuations less than 20 K. It is
Air Flow Rate [g/s]
Pro
pa
ne
Flo
w R
ate
[g
/s]
Reformer Temperature [K]
4 6 8 10 12
1
1.5
2
2.5
3
3.5
500
600
700
800
900
1000
1100
1200

60
important to note that this system is housed in a shed exposed to the ambient; hence, rigorous control
of external temperatures was not possible.
The results illustrate that the contours in Figure 46 fall primarily on isotherms according to
constant air-to-fuel ratios as to be expected. The temperatures rise as combustion becomes less rich
(more like stoichiometric) moving from upper left to lower right.
From this information, heat release calculations were completed in order to calculate the heat
transfer from the reformer via Equation 13. The convective heat transfer coefficient could then be
calculated via Equation 14 using the known surface area of the reformer and ambient temperature. The
average convective heat transfer coefficient was found to be 26.55 Wm-2K-1 with a standard deviation of
3.85 Wm-2K-1. This coefficient will be used during glycerin reforming tests in order to more accurately
predict the resulting syngas constituents.
3.5.2 Engine Map
Prior to running the engine on RP, it was important to find the flow rates required for running
on PP using the Omega flow meter. Three different generator loads were possible using two Dayton
3VU34A heavy-duty electric heaters drawing power from the generator. The power drawn from the
generator using one and two heaters is 3.6 and 6.5 kW, respectively. The flow rate of propane for no
load at 1200 revolutions per minute (RPM) was 1.46 g/s. The energy content of the fuel at this load can
be calculated by multiplying the flow rate by the Lower Heating Value of propane (46.35 MJ/kg)
resulting in an energy content of 67.7 kW. As mentioned prior, this energy content must be (at least)
matched by the reformed fuel via Equation 16 in order to achieve the same engine performance. Similar
to the baseline test at 1200 RPM, additional data points were taken for 1800 RPM, required by the
generator to produce power, and over three different loads corresponding to zero, one, or two heaters.
Table 4 provides the engine requirements for all tested engine speeds and generator loads.
61
Table 4 - PP flow requirements in order to run the engine and generator at different speeds and loads.
Engine Setup
Propane Flow
Rate [g/s]
Air
Flow Rate [g/s]
Energy
Content [kW]
1200 RPM / No Load 1.46 (+/- .022) 22.3 (+/- .061) 67.7
1800 RPM / No Load 2.55 (+/- .039) 38.3 (+/- .149) 118.2
1800 RPM / 3.6 kW 3.19 (+/- .014) 47.9 (+/- .141) 147.9
1800 RPM / 6.5 kW 3.65 (+/- .016) 54.8 (+/- .153) 169.2
The air-to-fuel ratios for all of the different load and speed settings fall between 15.0 and 15.2.
These values are less than the stoichiometric air-to-fuel ratio of propane (15.6) meaning the engine is
constantly operating in a slightly rich environment. As Heywood elucidates, maximum power production
is in a slightly rich air-to-fuel environment [23]. This, again, validates similar to Figure 46 that the
experimental setup is running properly and the data collected follows the proper trends.
3.5.3 Engine Running on Reformed Propane Syngas
The second step prior to reforming glycerin is to run the engine using RP. Prior to doing so, the
numerical model is used to calculate the species produced when propane is reformed. The reforming
temperature map of Figure 46 was used to provide the inputs for the numerical model; air flow rate,
propane flow rate, and the reforming temperature.

62
Figure 47 - Effective syngas LHV map in MJ/kg of RP using the conditions found experimentally in
Figure 46.
The program then calculates the species produced using equilibrium (using the tp option in CEA) and
subsequently the LHV of the resulting RP syngas from Equation 15 minus the non-fuel species (CO2, H2O,
N2) that will act like Exhaust Gas Recirculation (EGR) in the setup. Note that the stock engine EGR system
was disabled prior to testing. The RP LHV map correlating to the reformer temperature map is shown in
Figure 47.
Air Flow Rate [g/s]
Pro
pa
ne
Flo
w R
ate
[g
/s]
Reformer Lower Heating Value [MJ/kg]
4 6 8 10 12
1
1.5
2
2.5
3
3.5
20
25
30
35
40
45

63
Figure 48 - RP syngas energy content in kW as a function of air and propane flow rates.
Using this information and multiplying it by the syngas mass flow rate of Equation 12, the
theoretical energy content can be calculated. Figure 48 shows the plot of theoretical RP syngas energy
content as a function of air and propane flow rates. In this figure, the conditions under which the engine
can be operated by RP are indicated as a function of loading at 1800 RPM.
Using this information, the engine was successfully operated using reformed propane. When the
engine operates at 1200 RPM and no load, the required flow rate of PP is 1.46 g/s. However, the
required flow rate of RP was found to be 1.87 g/s. Additional tests were completed at 1800 RPM to
show that the syngas can produce sufficient energy to produce electricity with the generator. In
particular, at no load successful combustion of reformed propane did not take place until 3.04 (+/- .012)
g/s of propane was supplied to the reformer along with 12.07 (+/- .052) g/s of air. This flow rate of
propane and air produces syngas with an energy content of 126.5 kW, 7.0% more than required with PP.
With one heater, the flow rates of propane and air were 3.43 (+/- .011) g/s and 12.94 (+/- .027) g/s,
respectively. Finally, with two heaters, the propane and air flow rates were increased to 4.02 (+/- .013)
Air Flow Rate [g/s]
Pro
pa
ne
Flo
w R
ate
[g
/s]
Syngas Energy Content [kW]
4 6 8 10 12
1
1.5
2
2.5
3
3.5
20
40
60
80
100
120
140
Energy Content Contours
Capable of Operating at No Load
Capable of Operating at One Load
Capable of Operating at Two Loads
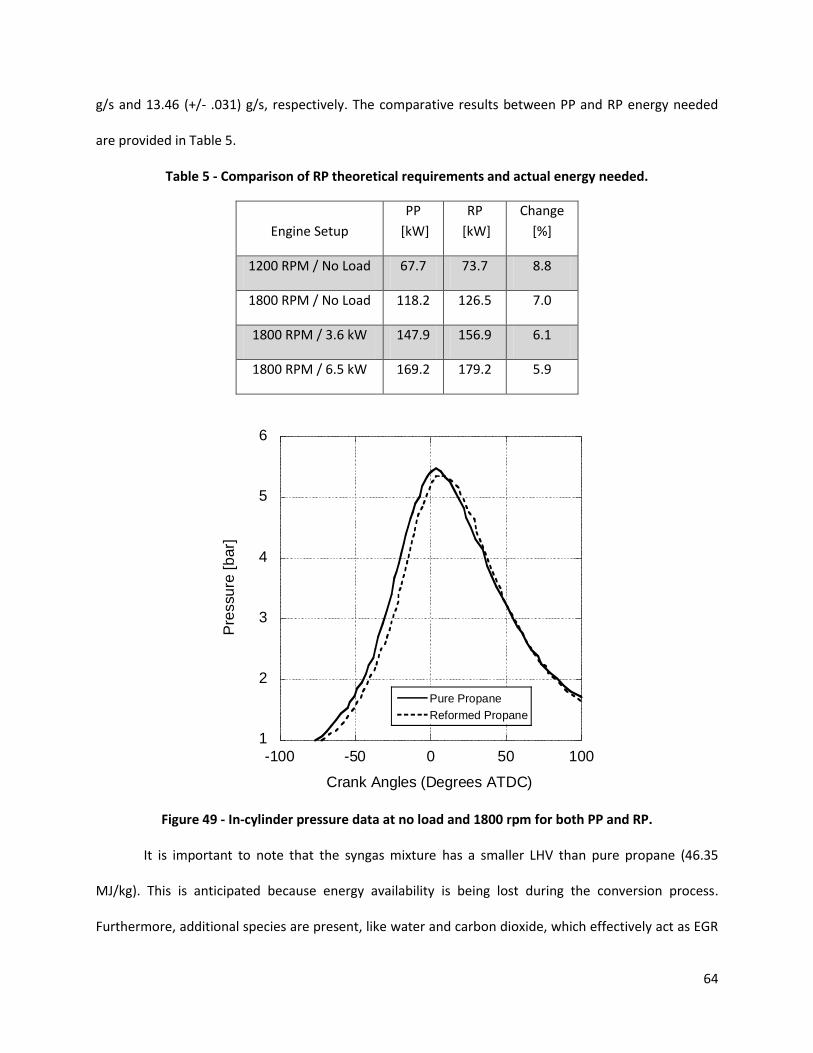
64
g/s and 13.46 (+/- .031) g/s, respectively. The comparative results between PP and RP energy needed
are provided in Table 5.
Table 5 - Comparison of RP theoretical requirements and actual energy needed.
Engine Setup
PP
[kW]
RP
[kW]
Change
[%]
1200 RPM / No Load 67.7 73.7 8.8
1800 RPM / No Load 118.2 126.5 7.0
1800 RPM / 3.6 kW 147.9 156.9 6.1
1800 RPM / 6.5 kW 169.2 179.2 5.9
1
2
3
4
5
6
-100 -50 0 50 100
Pure Propane
Reformed Propane
Pre
ssu
re [
bar]
Crank Angles (Degrees ATDC)
Figure 49 - In-cylinder pressure data at no load and 1800 rpm for both PP and RP.
It is important to note that the syngas mixture has a smaller LHV than pure propane (46.35
MJ/kg). This is anticipated because energy availability is being lost during the conversion process.
Furthermore, additional species are present, like water and carbon dioxide, which effectively act as EGR

65
reducing the power output and combustion speed slightly. This is indicated via Figure 49 via a lower
maximum pressure in the cylinder when running on RP. Overall, the graphs are similar (and should be)
because the same total amount of energy is added in order to achieve the power needed by the engine.
Differences in the curves can be related to the higher temperature of RP in comparison to PP and
dissimilar intake pressures stemming from the flow pathways according to Figure 45. As a result, a
higher mass flow rate of syngas is required to balance Equation 16 and achieve the same engine
performance as PP. This is indicated via the required propane flow rates when running on PP and RP
(Table 5) and the change in percentage energy needed. As a result, operating on RP is less efficient;
however, this methodology proves the validity of using syngas to run the engine and illustrates how to
calibrate the model for glycerin use in the future.
3.6 Conclusion
As oil production begins to peak in the upcoming years, alternative fuels will become a necessity
to keep up with energy demands. Glycerin is a viable alternative fuel because it contains a significant
hydrogen component. Direct combustion of glycerin in an engine, however, is not possible due to its
high viscosity and poor atomization. Therefore, glycerin must first be reformed into a hydrogen rich
syngas. A unique experimental setup at KU reforms glycerin into syngas for its subsequent combustion
in an internal combustion engine.
Before glycerin testing is possible, propane was used to find the operating temperatures of the
reformer and calculate the flow rates and energy requirements needed to run the engine. Literature
research was completed to better understand the reactions taking place and to help generate a
numerical model based on chemical equilibrium. This model was used to estimate the species produced
by reforming propane and calculate the energy content of the resulting syngas. It was then possible to
achieve combustion of the reformed propane in the engine at three different generator loads. This
combustion of reformed propane along with a calculation of heat transfer from the reformer provided

66
the methodology to calibrate the model for upcoming glycerin tests. In particular, this model predicts
the flow rates needed for the glycerin/water mixture and air that can operate the engine.
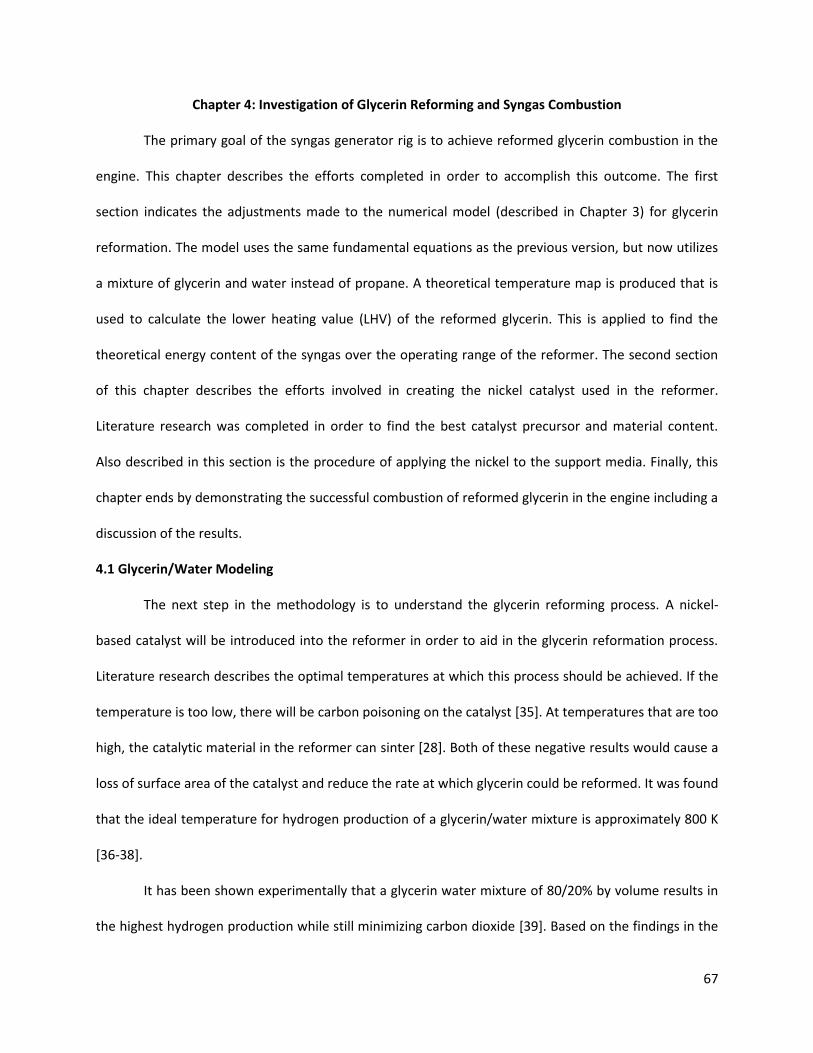
67
Chapter 4: Investigation of Glycerin Reforming and Syngas Combustion
The primary goal of the syngas generator rig is to achieve reformed glycerin combustion in the
engine. This chapter describes the efforts completed in order to accomplish this outcome. The first
section indicates the adjustments made to the numerical model (described in Chapter 3) for glycerin
reformation. The model uses the same fundamental equations as the previous version, but now utilizes
a mixture of glycerin and water instead of propane. A theoretical temperature map is produced that is
used to calculate the lower heating value (LHV) of the reformed glycerin. This is applied to find the
theoretical energy content of the syngas over the operating range of the reformer. The second section
of this chapter describes the efforts involved in creating the nickel catalyst used in the reformer.
Literature research was completed in order to find the best catalyst precursor and material content.
Also described in this section is the procedure of applying the nickel to the support media. Finally, this
chapter ends by demonstrating the successful combustion of reformed glycerin in the engine including a
discussion of the results.
4.1 Glycerin/Water Modeling
The next step in the methodology is to understand the glycerin reforming process. A nickel-
based catalyst will be introduced into the reformer in order to aid in the glycerin reformation process.
Literature research describes the optimal temperatures at which this process should be achieved. If the
temperature is too low, there will be carbon poisoning on the catalyst [35]. At temperatures that are too
high, the catalytic material in the reformer can sinter [28]. Both of these negative results would cause a
loss of surface area of the catalyst and reduce the rate at which glycerin could be reformed. It was found
that the ideal temperature for hydrogen production of a glycerin/water mixture is approximately 800 K
[36-38].
It has been shown experimentally that a glycerin water mixture of 80/20% by volume results in
the highest hydrogen production while still minimizing carbon dioxide [39]. Based on the findings in the
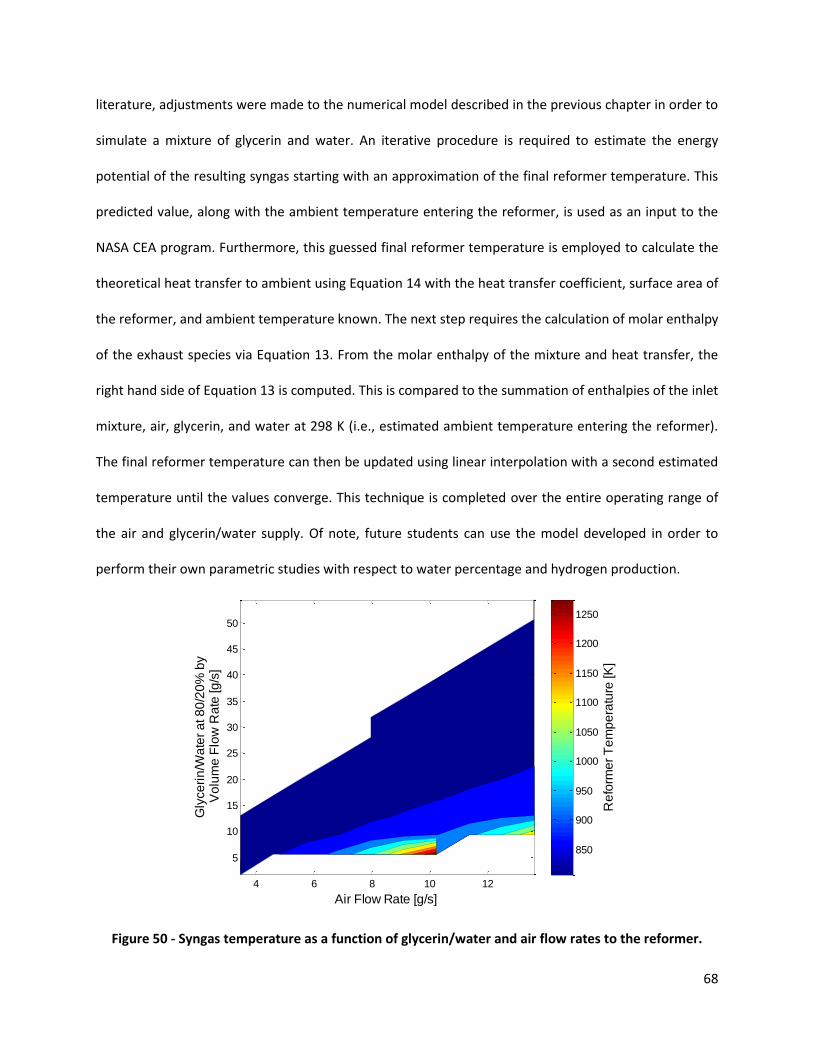
68
literature, adjustments were made to the numerical model described in the previous chapter in order to
simulate a mixture of glycerin and water. An iterative procedure is required to estimate the energy
potential of the resulting syngas starting with an approximation of the final reformer temperature. This
predicted value, along with the ambient temperature entering the reformer, is used as an input to the
NASA CEA program. Furthermore, this guessed final reformer temperature is employed to calculate the
theoretical heat transfer to ambient using Equation 14 with the heat transfer coefficient, surface area of
the reformer, and ambient temperature known. The next step requires the calculation of molar enthalpy
of the exhaust species via Equation 13. From the molar enthalpy of the mixture and heat transfer, the
right hand side of Equation 13 is computed. This is compared to the summation of enthalpies of the inlet
mixture, air, glycerin, and water at 298 K (i.e., estimated ambient temperature entering the reformer).
The final reformer temperature can then be updated using linear interpolation with a second estimated
temperature until the values converge. This technique is completed over the entire operating range of
the air and glycerin/water supply. Of note, future students can use the model developed in order to
perform their own parametric studies with respect to water percentage and hydrogen production.
Figure 50 - Syngas temperature as a function of glycerin/water and air flow rates to the reformer.
Air Flow Rate [g/s]
Gly
ce
rin
/Wa
ter
at 8
0/2
0%
by
Vo
lum
e F
low
Ra
te [g
/s]
Reformer Temperature [K]
4 6 8 10 12
5
10
15
20
25
30
35
40
45
50
Re
form
er
Te
mp
era
ture
[K
]
850
900
950
1000
1050
1100
1150
1200
1250

69
Figure 51 - Effective lower heating value of syngas exiting the reformer as a function of glycerin/water
and air flow rates
Figure 52 - Prediction of generator power output based on glycerin/water and air flow rates to the
reformer
Air Flow Rate [g/s]
Gly
ce
rin
/Wa
ter
at 8
0/2
0%
by
Vo
lum
e F
low
Ra
te [g
/s]
Reformer Effective Lower Heating Value [MJ/kg]
4 6 8 10 12
5
10
15
20
25
30
35
40
45
50
Re
form
er
Effe
ctive
Lo
we
r H
ea
tin
g V
alu
e [M
J/k
g]
20
25
30
35

70
The converged temperature values from the numerical model are shown in Figure 50. This figure
indicates a nearly constant temperature over the operating range of the reformer with glycerin until the
air to fuel ratio reaches the stoichiometric limit. This data is then used to calculate the LHV of the
reformed glycerin (aka syngas) using the same procedure as indicated in Chapter 3. The LHV map
produced by the model is shown in Figure 51. In addition, the theoretical energy content of the syngas is
shown in Figure 52 with the potential power created by the generator indicated.
It is important to note from Figure 52 that the power generated is primarily a function of the
glycerin/water flow rate. Compared to propane partial combustion where air flow controls the species
produced, glycerin reformation is a catalytic reaction. This is beneficial in that the air flow rate can be
adjusted simply to reduce the temperature of the reformer in order to prevent sintering from occurring.
Moreover, regulating the air flow rate will help lower the temperature of intake syngas stream to the
engine lessening the likelihood of engine knock [23]. As long as the temperature of the reformer stays
above the vaporization point of glycerin (563.15 K), exothermic reformation should continue because of
the significant energy released due to partial oxidation and steam reforming.
4.2 Reformer Catalytic Material Preparation
This section details the production of the catalytic material used in the reformer in order to
improve the conversion of a glycerin and water mixture. First, a catalytic material was chosen based on a
literature review. Common catalysts used in glycerin/water reformation for hydrogen production
include nickel, cobalt, cobalt-nickel, platinum, and rhodium [40-43]. Coke deposition (aka carbon
poisoning) is one of the leading causes for catalytic deactivation over time and was a leading factor in
catalyst selection. Cobalt and cobalt-nickel catalysts exhibit greater carbon poisoning than nickel
catalysts. Temperature programmed removal of carbon deposits were required for cobalt catalysts,
which is not feasible for glycerin reformation when continuous and uninterrupted power generation
from the syngas is the ultimate goal. Platinum has been successfully used to produce a hydrogen rich

71
syngas from glycerin at temperatures below 450C with similar conversion efficiency to that of nickel
catalysts at higher temperatures. The cost of platinum, however, greatly outweighs the need for lower
reformation temperatures since the current setup can easily reach high temperatures. Analysis of
rhodium catalysts indicates a slightly higher conversion rate of glycerin to hydrogen with decreased coke
formation. Similar to platinum, the price of rhodium also greatly outweighs the benefits when compared
to nickel catalysts.
A literature review was also completed to find the best support media for the catalyst.
Aluminum oxide, ceria, ceria promoted alumina, and magnesium oxide are common support media used
in glycerin reforming [43, 44]. Studies comparing nickel catalysts applied to magnesium oxide, ceria, and
aluminum oxide found significantly higher hydrogen conversion with aluminum oxide [43]. This is
because nickel is able to disperse more readily across aluminum oxide than the other catalysts resulting
in a greater hydrogen generation rate. Moreover, investigating support media found that many of the
options presented are not available at the size needed for the reformer; i.e., most are for bench-scale
packed beds. Because of this research, aluminum oxide spheres at 99% purity were chosen as the
support media due to their relatively good absorption factor. The author was able to find aluminum
oxide spheres at approximately the same size as the initial uncoated spheres used in propane reforming
tests (3/4 inch). As a result, the flow patterns in the reformer remained relatively the same and the
model created is still applicable. Finally, the cost of the spheres was reasonable since this is a widely
used media (est. cost = $210.00).
The incipient wetness technique was used in order to impregnate the nickel catalyst into the
support media spheres. This is accomplished by dissolving a nickel salt precursor in water and immersing
the spheres in the solution. The coated spheres are then dried in a box furnace and then calcined. The
choice of precursor affects how the final catalyst will behave. Literature research was completed to find
the best salt precursor for this technique [45, 46]. Nickel nitrate hexahydrate, nickel chloride, and nickel

72
acetylacetonate were considered as possible precursors to be used to produce the catalyst. It was found
that nickel nitrate hexahydrate at a weight percent between seven and eight percent produces the best
catalyst [45]. This precursor provides the highest dispersion across the support media while reducing the
likelihood of carbon poisoning and deactivation over time.
Figure 53 - Catalytic support media before catalyst was introduced
Figure 54 - Catalytic support media immersed in nickel salt bath

73
Production of the final supported catalyst involved multiple steps, first of which was creating a
container to hold the support media. Figure 53 shows the aluminum oxide support media in a stainless
steel container. Next, the catalytic support media was immersed into a water bath with the nickel salt
precursor dissolved. The goal of the impregnation was to achieve between 7% and 8% nickel by weight
and the catalytic support media was weighed before immersion into the bath (11.3 kg). Figure 54 shows
the support media immersed in the water and nickel salt precursor solution.
After immersion in the bath, the catalyst was dried in a high temperature box furnace at 125C
for 24 hours. A Carbolite ELF 11/6/301 box furnace was purchased for the drying and calcination
process. This furnace was chosen because of the operating temperatures that can be achieved, as well
as the large internal furnace volume. After the drying procedure was completed, the catalyst was
weighed again to check the weight percent of nickel applied to the support media. The procedure of
immersion and drying was repeated until the appropriate weight percent was achieved. Upon
measuring the weight after the third iteration, it was found that the catalyst and support weighed 12.2
kg. This indicates that 0.9 kg of nickel was impregnated into the alumina for a final weight percent of
7.4%.

74
Figure 55 - Catalytic material after six hours at 800C
The final step in the production of the catalyst is the calcination process that includes
superheating the catalyst in the box furnace at 800C for six hours. Figure 55 shows the catalyst after
the calcination process. Although a weigh percent of nickel added to the support media was measured
to be 7.4%, it is possible that this value could be lower due to the calcination process. After drying in the
furnace the nitrates from the salt precursor are still on the support media. After calcining, these nitrates
are removed which could potentially lower the measured weight percent of nickel. Future development
of the catalyst should include additional weight measurements after calcinations.
4.3 Glycerin/Water Reformation
In order to convert the glycerin and water mixture into a useful fuel for the engine, it must first
be converted in a self-sustaining manner in the reformer. Tests were completed to ensure that this
mixture reformation does occur exothermally. If not exothermic, additional heat must constantly be
supplied to the reformer (e.g., adding propane and leaving the igniter on) resulting in a loss of available

75
energy. Furthermore, testing the reformation process before employing the engine/generator also
provides an avenue to validate the numerical model as discussed in Section 4.1. Initial reformation tests
with the new catalytic material indicated that the reaction occurred in a highly exothermic manner. The
temperature of the reformer quickly rose above the desired operational threshold of the reformer and
needed to be shut down. Half of the catalytic beads were then removed to better control the reaction
and keep the temperature in a safe range.
These tests were carried out using 99% pure food grade glycerin with specifications shown in
Table 6. Lower quality glycerin contains impurities left over from the biodiesel production process that
could hinder or help the conversion to a hydrogen rich fuel. Hence, this effort wanted to remove this
potential influence and provide results based purely on glycerin reformation. Once successful operation
occurred at a safe temperature threshold, an analysis of the effluent from the reformer was completed
in order to compare to numerical predictions.
Table 6 - Purified glycerin technical specifications.
Test Parameter Result Limits Units
Glycerin Content 99.9 99.5, min % Mass
Specific Gravity 1.262 1.249, min N/A
Chlorides <10 10, max ppm
Sulfates <20 20, max ppm
Heavy Metals <1 5, max ppm
Chlorinated Compounds <30 30, max ppm
Fatty Acid/Esters 0.3 1, max ppm
Water <0.5 0.5, max % Mass
An SRI 8610 gas chromatograph (GC) was used to calculate the species produced from this
reformation process. A gas chromatograph is capable of separating and analyzing components in a
mixture of a gas sample. During testing, a carrier gas of nitrogen or argon forces the sample through the
GC column. The sample being analyzed interacts with the walls of the GC column causing each
compound to extract from the mixture at a different time, known as elucidation time. The elucidation
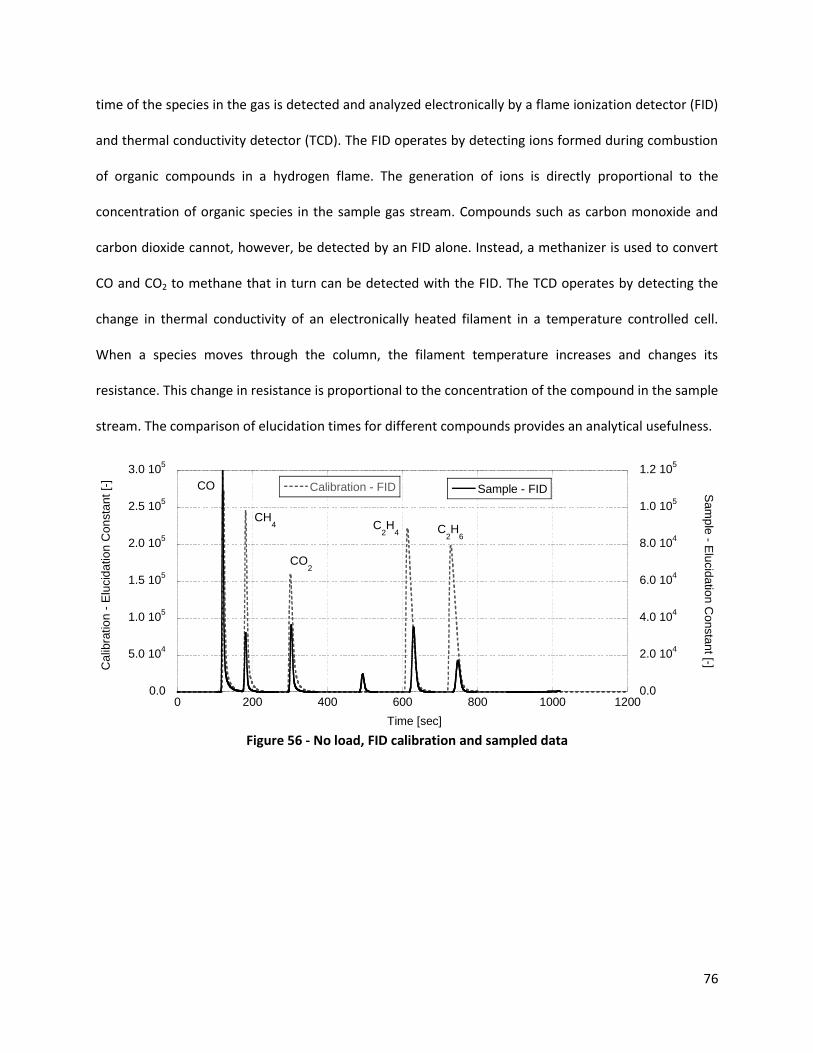
76
time of the species in the gas is detected and analyzed electronically by a flame ionization detector (FID)
and thermal conductivity detector (TCD). The FID operates by detecting ions formed during combustion
of organic compounds in a hydrogen flame. The generation of ions is directly proportional to the
concentration of organic species in the sample gas stream. Compounds such as carbon monoxide and
carbon dioxide cannot, however, be detected by an FID alone. Instead, a methanizer is used to convert
CO and CO2 to methane that in turn can be detected with the FID. The TCD operates by detecting the
change in thermal conductivity of an electronically heated filament in a temperature controlled cell.
When a species moves through the column, the filament temperature increases and changes its
resistance. This change in resistance is proportional to the concentration of the compound in the sample
stream. The comparison of elucidation times for different compounds provides an analytical usefulness.
0.0
5.0 104
1.0 105
1.5 105
2.0 105
2.5 105
3.0 105
0.0
2.0 104
4.0 104
6.0 104
8.0 104
1.0 105
1.2 105
0 200 400 600 800 1000 1200
Calibration - FID Sample - FID
Ca
libra
tio
n -
Elu
cid
ation
Con
sta
nt
[-]
Sam
ple
- Elu
cid
atio
n C
onsta
nt [-]
Time [sec]
CO
CH4
CO2
C2H
4 C2H
6
Figure 56 - No load, FID calibration and sampled data

77
0.0
3.0 104
6.0 104
9.0 104
1.2 105
1.5 105
0.0
1.2 104
2.4 104
3.6 104
4.8 104
6.0 104
0 200 400 600 800 1000 1200
Calibration - TCD Sample - TCD
Calib
ration -
Elu
cid
ation C
onsta
nt
[-]
Sam
ple
- Elu
cid
atio
n C
onsta
nt [-]
Time [sec]
CO
CH4
CO2
C2H
4C
2H
6
H2
Figure 57 - No load, TCD calibration and sampled data
0.0
5.0 104
1.0 105
1.5 105
2.0 105
2.5 105
3.0 105
3.5 105
0.0
2.0 104
4.0 104
6.0 104
8.0 104
1.0 105
1.2 105
1.4 105
0 200 400 600 800 1000 1200
Calibration - FID Sample - FID
Ca
libra
tio
n -
Elu
cid
ation
Con
sta
nt
[-]
Sam
ple
- Elu
cid
atio
n C
onsta
nt [-]
Time [sec]
CO
CH4
CO2
C2H
4 C2H
6
Figure 58 - One load, FID calibration and sampled data
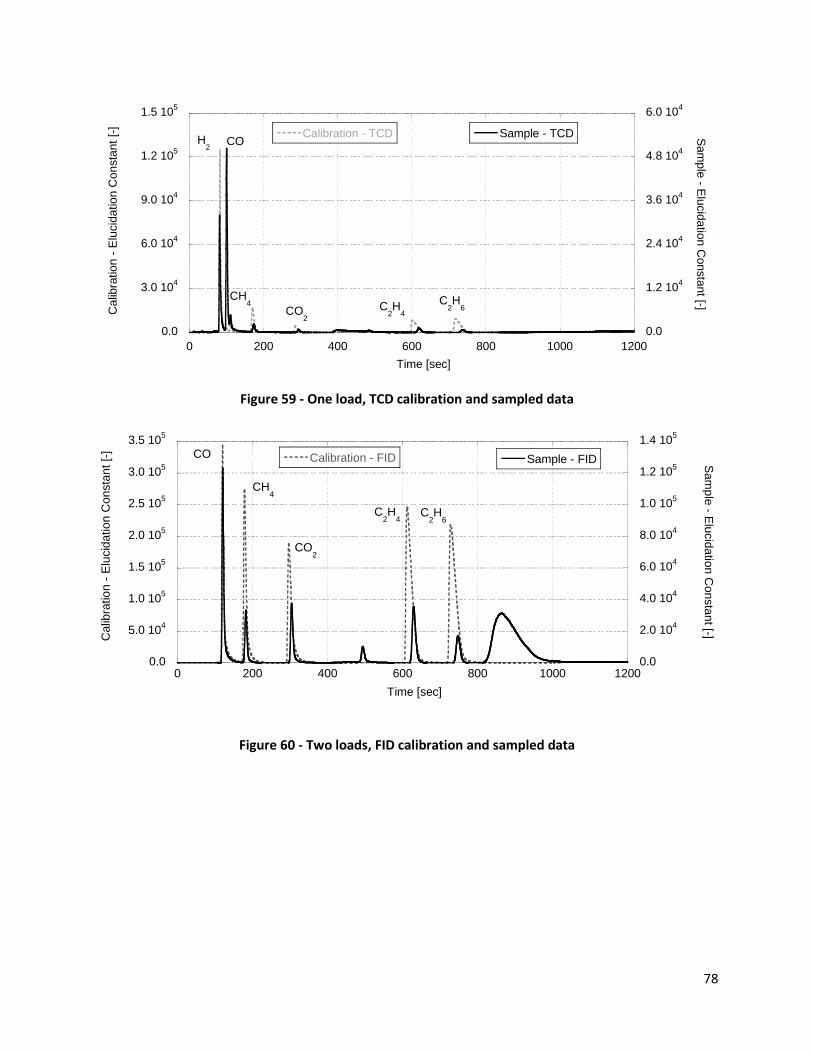
78
0.0
3.0 104
6.0 104
9.0 104
1.2 105
1.5 105
0.0
1.2 104
2.4 104
3.6 104
4.8 104
6.0 104
0 200 400 600 800 1000 1200
Calibration - TCD Sample - TCD
Calib
ration -
Elu
cid
ation C
onsta
nt
[-]
Sam
ple
- Elu
cid
atio
n C
onsta
nt [-]
Time [sec]
CO
CH4
CO2
C2H
4
C2H
6
H2
Figure 59 - One load, TCD calibration and sampled data
0.0
5.0 104
1.0 105
1.5 105
2.0 105
2.5 105
3.0 105
3.5 105
0.0
2.0 104
4.0 104
6.0 104
8.0 104
1.0 105
1.2 105
1.4 105
0 200 400 600 800 1000 1200
Calibration - FID Sample - FID
Ca
libra
tio
n -
Elu
cid
ation
Con
sta
nt
[-]
Sam
ple
- Elu
cid
atio
n C
onsta
nt [-]
Time [sec]
CO
CH4
CO2
C2H
4C
2H
6
Figure 60 - Two loads, FID calibration and sampled data

79
0.0
3.0 104
6.0 104
9.0 104
1.2 105
1.5 105
0.0
1.2 104
2.4 104
3.6 104
4.8 104
6.0 104
0 200 400 600 800 1000 1200
Calibration - TCD Sample - TCD
Calib
ration -
Elu
cid
ation C
onsta
nt
[-]
Sam
ple
- Elu
cid
atio
n C
onsta
nt [-]
Time [sec]
CO
CH4
CO2
C2H
4
C2H
6
H2
Figure 61 - Two loads, TCD calibration and sampled data
In order for useful calculations to be completed, a calibration gas must first be used to find the
baseline elucidation times for gas species being analyzed. Reformed glycerin sample tests were
completed using a calibration tank with equal parts hydrogen, carbon monoxide, methane, carbon
dioxide, ethane, and ethylene. A septum was placed on the calibration tank valve allowing for samples
to be taken using a 250 micro liter syringe. Since the calibration tank contains equal parts by volume, it
is known that 41.66 micro liters of each species is injected. Elucidation times were recorded for each of
the six species in the calibration tank for both the FID and TCD channels. Figures 56-61 show the plots of
elucidation times for three different calibration tests on each channel and three different sample tests
on each channel.
The calibration plots for FID and TCD have different peaks which correspond to each of the
different gases in the calibration tank. FID plots do not show hydrogen since it is burned while
converting all other species to methane for detection. The peaks in the FID plot correspond to carbon
monoxide, methane, carbon dioxide, ethylene, and ethane from left to right. The peaks in the TCD plot
correspond to hydrogen, carbon monoxide, methane, carbon dioxide, ethylene, and ethane from left to
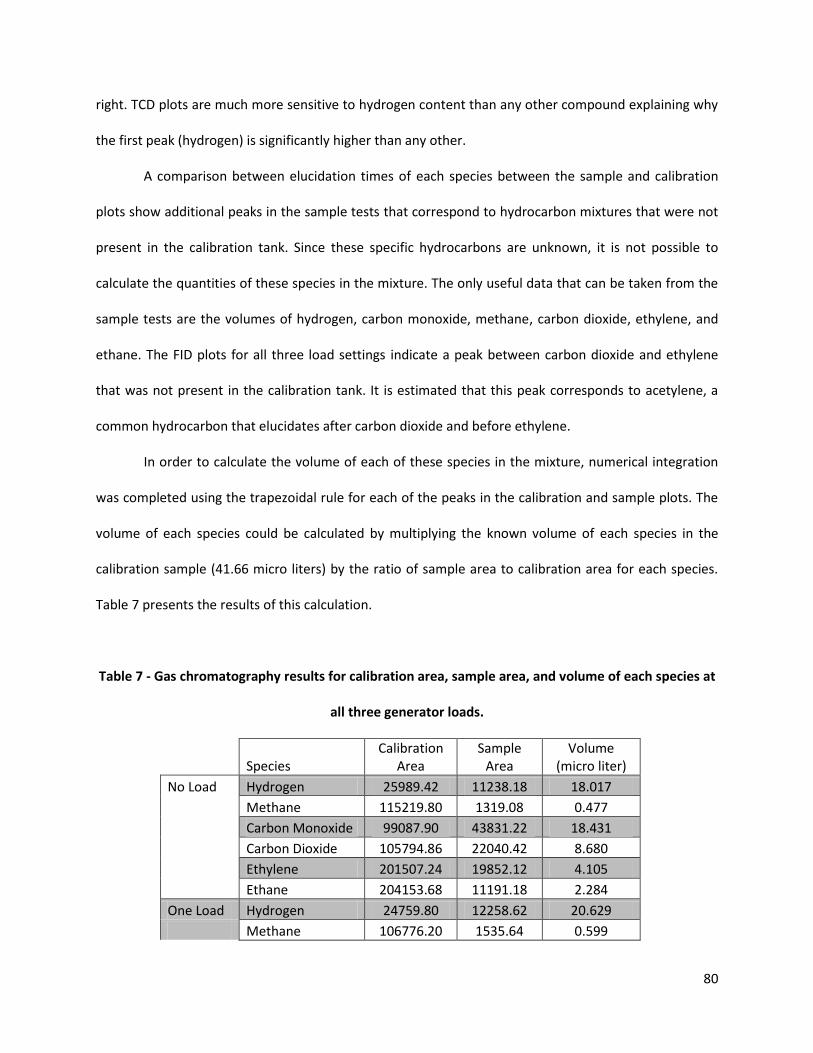
80
right. TCD plots are much more sensitive to hydrogen content than any other compound explaining why
the first peak (hydrogen) is significantly higher than any other.
A comparison between elucidation times of each species between the sample and calibration
plots show additional peaks in the sample tests that correspond to hydrocarbon mixtures that were not
present in the calibration tank. Since these specific hydrocarbons are unknown, it is not possible to
calculate the quantities of these species in the mixture. The only useful data that can be taken from the
sample tests are the volumes of hydrogen, carbon monoxide, methane, carbon dioxide, ethylene, and
ethane. The FID plots for all three load settings indicate a peak between carbon dioxide and ethylene
that was not present in the calibration tank. It is estimated that this peak corresponds to acetylene, a
common hydrocarbon that elucidates after carbon dioxide and before ethylene.
In order to calculate the volume of each of these species in the mixture, numerical integration
was completed using the trapezoidal rule for each of the peaks in the calibration and sample plots. The
volume of each species could be calculated by multiplying the known volume of each species in the
calibration sample (41.66 micro liters) by the ratio of sample area to calibration area for each species.
Table 7 presents the results of this calculation.
Table 7 - Gas chromatography results for calibration area, sample area, and volume of each species at
all three generator loads.
Species
Calibration Area
Sample Area
Volume (micro liter)
No Load Hydrogen 25989.42 11238.18 18.017
Methane 115219.80 1319.08 0.477
Carbon Monoxide 99087.90 43831.22 18.431
Carbon Dioxide 105794.86 22040.42 8.680
Ethylene 201507.24 19852.12 4.105
Ethane 204153.68 11191.18 2.284
One Load Hydrogen 24759.80 12258.62 20.629
Methane 106776.20 1535.64 0.599

81
Carbon Monoxide 107887.44 38672.00 14.935
Carbon Dioxide 132798.60 19073.40 5.984
Ethylene 217941.56 19816.62 3.789
Ethane 220320.00 11117.38 2.103
Two Loads Hydrogen 26525.22 16900.74 26.548
Methane 118265.90 12268.08 4.322
Carbon Monoxide 110893.32 36219.52 13.608
Carbon Dioxide 117712.50 15223.90 5.388
Ethylene 225313.04 19615.80 3.628
Ethane 228571.68 10754.32 1.960
Initial analysis of the results from the GC tests indicates that the volume fraction of the species
was lower than expected. For example, the hydrogen result at two loads is only 26.548 micro liters that
corresponds to a volume fraction of 0.106 (26.548 micro liter species/250 micro liter injection). These
low volume fractions are a result of air in the sample that is not detected by the GC. As a result, the
volume of each species must be adjusted to compensate for the air content in the mixture by
considering the total area under the curve for both FID and TCD plots. The entire area under the curve
for the calibration tests of the FID and TCD plots correspond to 250 micro liters of sample injected. The
entire area under the curve for sample tests for FID and TCD plots only account for the species that can
be analyzed by the GC (not air). By multiplying the volume of each species by the correlating ratio of
entire area of calibration and sample plots, the volume can be adjusted to compensate for air content.
For example, the entire area of the TCD calibration plot is 101313 and the area of the corresponding TCD
sample plot is 33185.78 for two loads. Hence, multiplying the volume of hydrogen at two loads by this
area ratio (101313/33185.78) results in 81.048 micro liters of hydrogen in the sample. This analysis was
completed at all loads for each species and the results are shown in Table 8.
Table 8 - Gas chromatography results for species volume, adjusted species volume, and volume
fraction at all three generator loads after adjusting for air in the sample.
Species
Volume (micro liter)
Adjusted Volume (micro liter) Volume Fraction
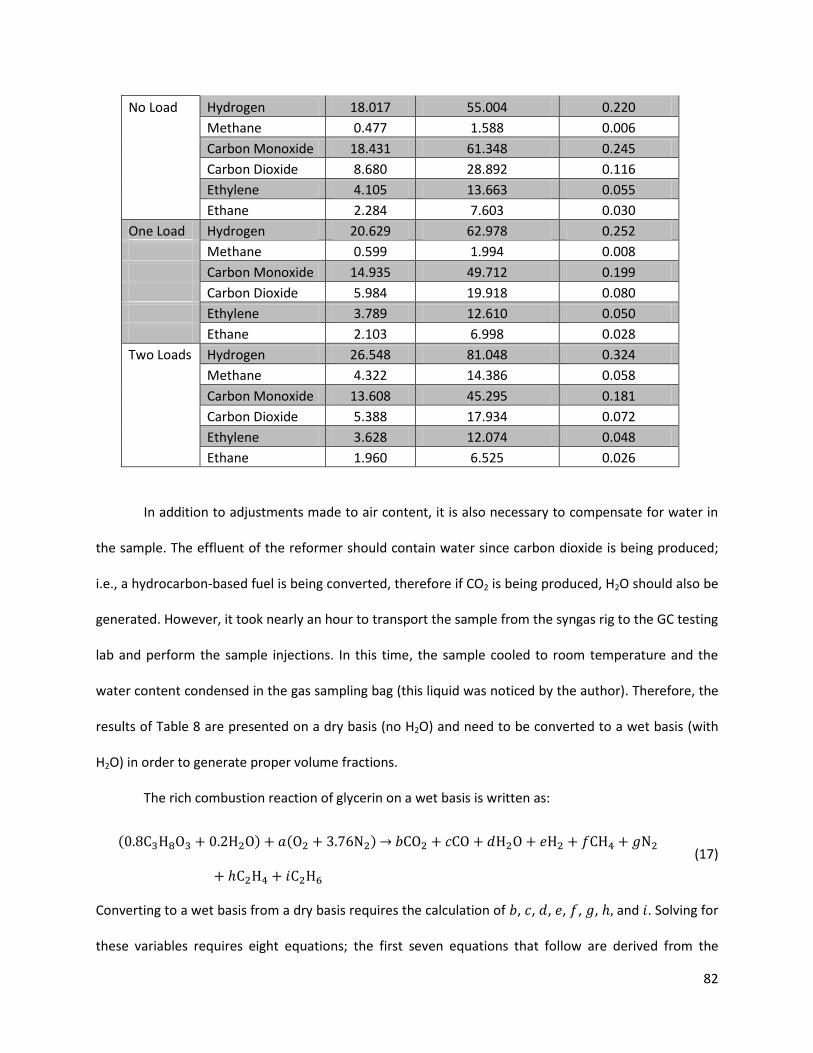
82
No Load Hydrogen 18.017 55.004 0.220
Methane 0.477 1.588 0.006
Carbon Monoxide 18.431 61.348 0.245
Carbon Dioxide 8.680 28.892 0.116
Ethylene 4.105 13.663 0.055
Ethane 2.284 7.603 0.030
One Load Hydrogen 20.629 62.978 0.252
Methane 0.599 1.994 0.008
Carbon Monoxide 14.935 49.712 0.199
Carbon Dioxide 5.984 19.918 0.080
Ethylene 3.789 12.610 0.050
Ethane 2.103 6.998 0.028
Two Loads Hydrogen 26.548 81.048 0.324
Methane 4.322 14.386 0.058
Carbon Monoxide 13.608 45.295 0.181
Carbon Dioxide 5.388 17.934 0.072
Ethylene 3.628 12.074 0.048
Ethane 1.960 6.525 0.026
In addition to adjustments made to air content, it is also necessary to compensate for water in
the sample. The effluent of the reformer should contain water since carbon dioxide is being produced;
i.e., a hydrocarbon-based fuel is being converted, therefore if CO2 is being produced, H2O should also be
generated. However, it took nearly an hour to transport the sample from the syngas rig to the GC testing
lab and perform the sample injections. In this time, the sample cooled to room temperature and the
water content condensed in the gas sampling bag (this liquid was noticed by the author). Therefore, the
results of Table 8 are presented on a dry basis (no H2O) and need to be converted to a wet basis (with
H2O) in order to generate proper volume fractions.
The rich combustion reaction of glycerin on a wet basis is written as:
(17)
Converting to a wet basis from a dry basis requires the calculation of , , , , , , and . Solving for
these variables requires eight equations; the first seven equations that follow are derived from the

83
initial carbon balance of Equation 17 and the volume fractions as indicated in Table 7 with the two load
results provided as an example:
(18)
(19)
(20)
(21)
(22)
(23)
(24)
The eighth equation requires a correlation between wet basis combustion products and dry
basis. Literature review indicated that this can be accomplished by assuming the H2O:CO2 ratio is equal
to the H2:CO ratio [21]:
(25)
The solution to these eight equations was found using the Interactive Thermodynamics 3.1 simultaneous
equation solver and the wet basis volume fractions are shown in Table 9.
Table 9 – Gas chromatography results for volume fraction on dry and wet basis at all three generator
loads and model volume fraction comparisons.
Species
GC Volume Fraction (Dry)
GC Volume Fraction (Wet)
Model Volume Fraction
No Load Hydrogen 0.220 0.199 0.293
Methane 0.006 0.005 0.036
Carbon Monoxide 0.245 0.222 0.165
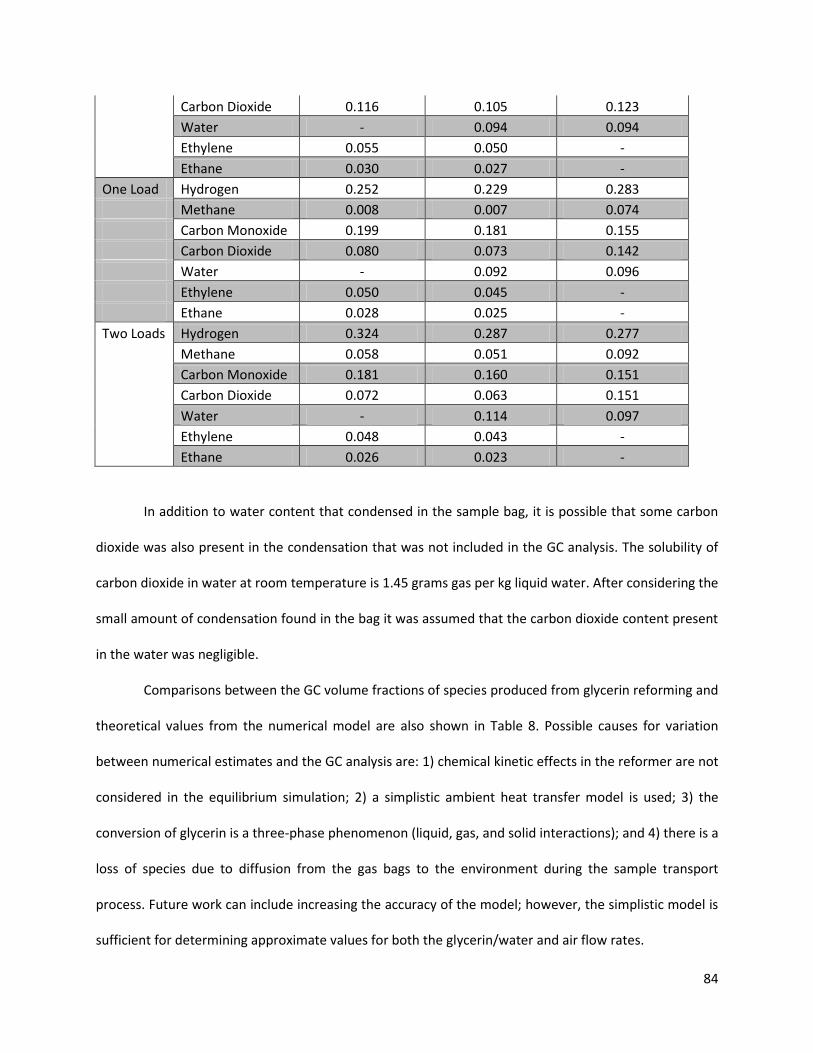
84
Carbon Dioxide 0.116 0.105 0.123
Water - 0.094 0.094
Ethylene 0.055 0.050 -
Ethane 0.030 0.027 -
One Load Hydrogen 0.252 0.229 0.283
Methane 0.008 0.007 0.074
Carbon Monoxide 0.199 0.181 0.155
Carbon Dioxide 0.080 0.073 0.142
Water - 0.092 0.096
Ethylene 0.050 0.045 -
Ethane 0.028 0.025 -
Two Loads Hydrogen 0.324 0.287 0.277
Methane 0.058 0.051 0.092
Carbon Monoxide 0.181 0.160 0.151
Carbon Dioxide 0.072 0.063 0.151
Water - 0.114 0.097
Ethylene 0.048 0.043 -
Ethane 0.026 0.023 -
In addition to water content that condensed in the sample bag, it is possible that some carbon
dioxide was also present in the condensation that was not included in the GC analysis. The solubility of
carbon dioxide in water at room temperature is 1.45 grams gas per kg liquid water. After considering the
small amount of condensation found in the bag it was assumed that the carbon dioxide content present
in the water was negligible.
Comparisons between the GC volume fractions of species produced from glycerin reforming and
theoretical values from the numerical model are also shown in Table 8. Possible causes for variation
between numerical estimates and the GC analysis are: 1) chemical kinetic effects in the reformer are not
considered in the equilibrium simulation; 2) a simplistic ambient heat transfer model is used; 3) the
conversion of glycerin is a three-phase phenomenon (liquid, gas, and solid interactions); and 4) there is a
loss of species due to diffusion from the gas bags to the environment during the sample transport
process. Future work can include increasing the accuracy of the model; however, the simplistic model is
sufficient for determining approximate values for both the glycerin/water and air flow rates.
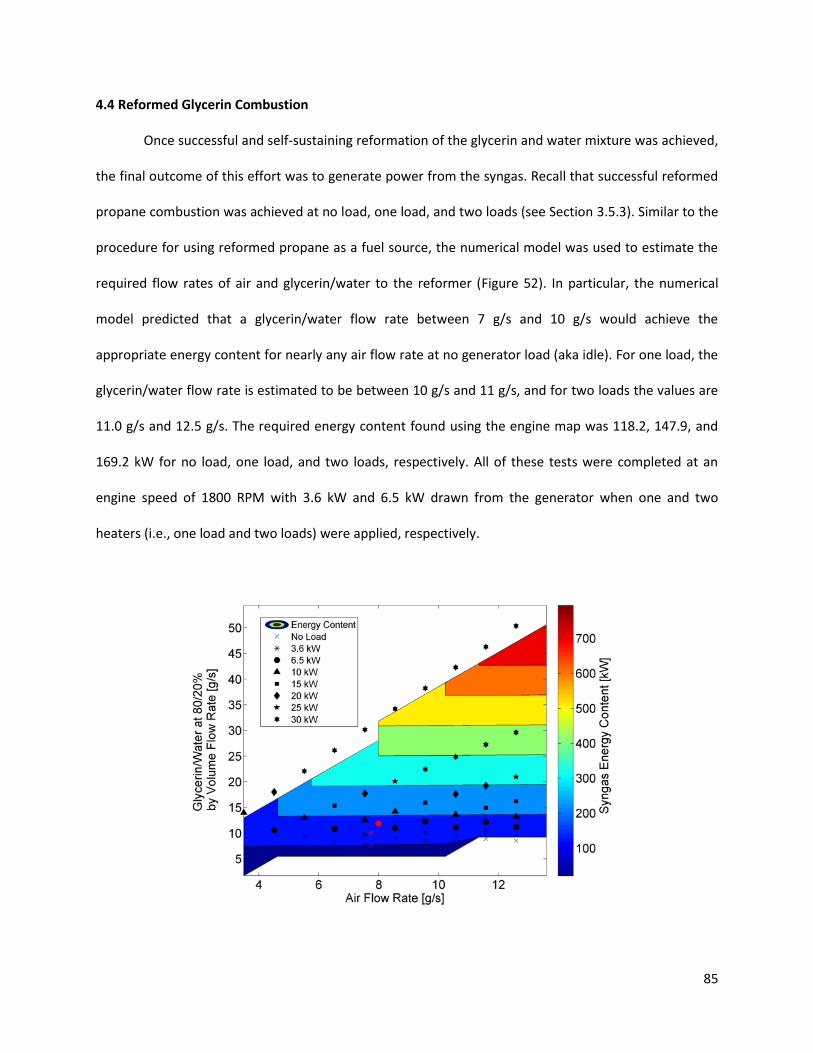
85
4.4 Reformed Glycerin Combustion
Once successful and self-sustaining reformation of the glycerin and water mixture was achieved,
the final outcome of this effort was to generate power from the syngas. Recall that successful reformed
propane combustion was achieved at no load, one load, and two loads (see Section 3.5.3). Similar to the
procedure for using reformed propane as a fuel source, the numerical model was used to estimate the
required flow rates of air and glycerin/water to the reformer (Figure 52). In particular, the numerical
model predicted that a glycerin/water flow rate between 7 g/s and 10 g/s would achieve the
appropriate energy content for nearly any air flow rate at no generator load (aka idle). For one load, the
glycerin/water flow rate is estimated to be between 10 g/s and 11 g/s, and for two loads the values are
11.0 g/s and 12.5 g/s. The required energy content found using the engine map was 118.2, 147.9, and
169.2 kW for no load, one load, and two loads, respectively. All of these tests were completed at an
engine speed of 1800 RPM with 3.6 kW and 6.5 kW drawn from the generator when one and two
heaters (i.e., one load and two loads) were applied, respectively.
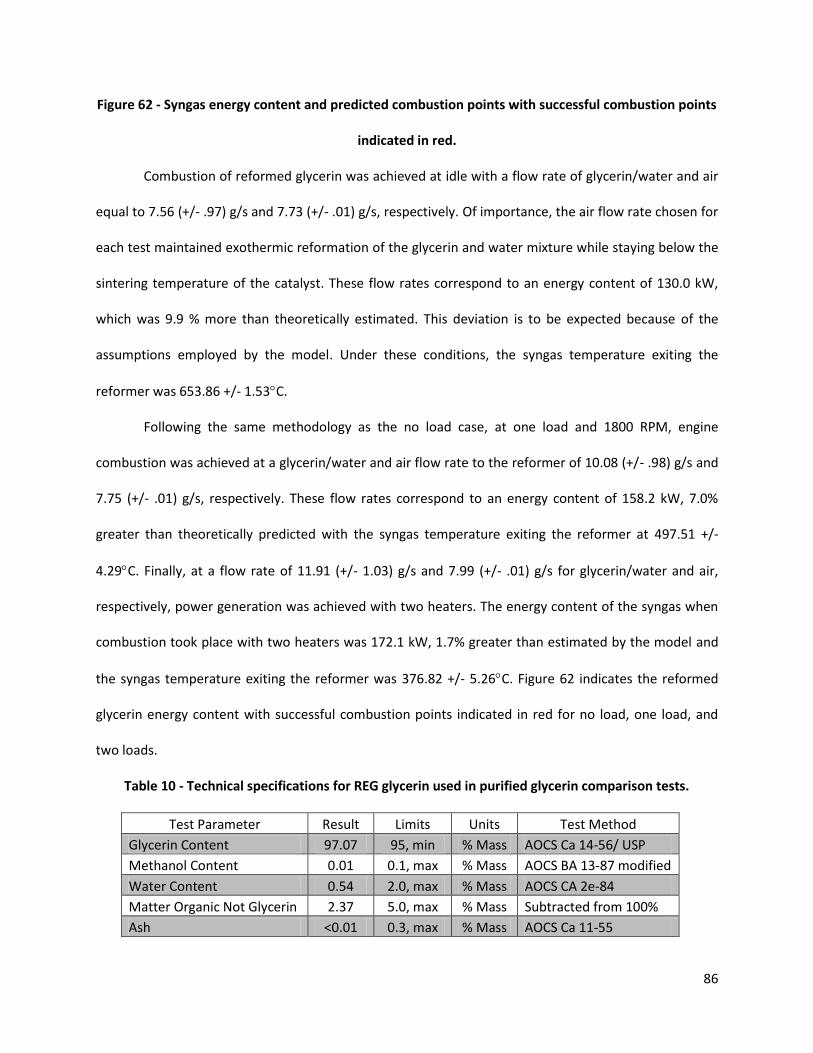
86
Figure 62 - Syngas energy content and predicted combustion points with successful combustion points
indicated in red.
Combustion of reformed glycerin was achieved at idle with a flow rate of glycerin/water and air
equal to 7.56 (+/- .97) g/s and 7.73 (+/- .01) g/s, respectively. Of importance, the air flow rate chosen for
each test maintained exothermic reformation of the glycerin and water mixture while staying below the
sintering temperature of the catalyst. These flow rates correspond to an energy content of 130.0 kW,
which was 9.9 % more than theoretically estimated. This deviation is to be expected because of the
assumptions employed by the model. Under these conditions, the syngas temperature exiting the
reformer was 653.86 +/- 1.53C.
Following the same methodology as the no load case, at one load and 1800 RPM, engine
combustion was achieved at a glycerin/water and air flow rate to the reformer of 10.08 (+/- .98) g/s and
7.75 (+/- .01) g/s, respectively. These flow rates correspond to an energy content of 158.2 kW, 7.0%
greater than theoretically predicted with the syngas temperature exiting the reformer at 497.51 +/-
4.29C. Finally, at a flow rate of 11.91 (+/- 1.03) g/s and 7.99 (+/- .01) g/s for glycerin/water and air,
respectively, power generation was achieved with two heaters. The energy content of the syngas when
combustion took place with two heaters was 172.1 kW, 1.7% greater than estimated by the model and
the syngas temperature exiting the reformer was 376.82 +/- 5.26C. Figure 62 indicates the reformed
glycerin energy content with successful combustion points indicated in red for no load, one load, and
two loads.
Table 10 - Technical specifications for REG glycerin used in purified glycerin comparison tests.
Test Parameter Result Limits Units Test Method
Glycerin Content 97.07 95, min % Mass AOCS Ca 14-56/ USP
Methanol Content 0.01 0.1, max % Mass AOCS BA 13-87 modified
Water Content 0.54 2.0, max % Mass AOCS CA 2e-84
Matter Organic Not Glycerin 2.37 5.0, max % Mass Subtracted from 100%
Ash <0.01 0.3, max % Mass AOCS Ca 11-55
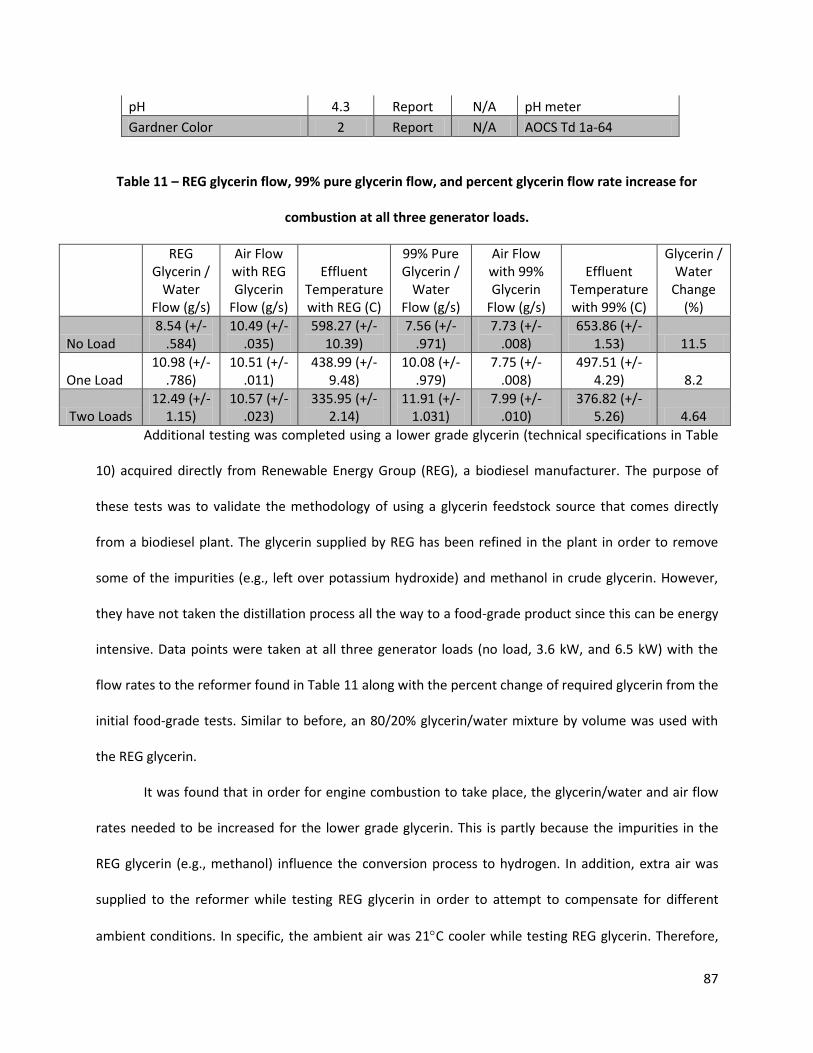
87
pH 4.3 Report N/A pH meter
Gardner Color 2 Report N/A AOCS Td 1a-64
Table 11 – REG glycerin flow, 99% pure glycerin flow, and percent glycerin flow rate increase for
combustion at all three generator loads.
REG Glycerin /
Water Flow (g/s)
Air Flow with REG Glycerin
Flow (g/s)
Effluent Temperature with REG (C)
99% Pure Glycerin /
Water Flow (g/s)
Air Flow with 99% Glycerin
Flow (g/s)
Effluent Temperature with 99% (C)
Glycerin / Water
Change (%)
No Load 8.54 (+/-
.584) 10.49 (+/-
.035) 598.27 (+/-
10.39) 7.56 (+/-
.971) 7.73 (+/-
.008) 653.86 (+/-
1.53) 11.5
One Load 10.98 (+/-
.786) 10.51 (+/-
.011) 438.99 (+/-
9.48) 10.08 (+/-
.979) 7.75 (+/-
.008) 497.51 (+/-
4.29) 8.2
Two Loads 12.49 (+/-
1.15) 10.57 (+/-
.023) 335.95 (+/-
2.14) 11.91 (+/-
1.031) 7.99 (+/-
.010) 376.82 (+/-
5.26) 4.64
Additional testing was completed using a lower grade glycerin (technical specifications in Table
10) acquired directly from Renewable Energy Group (REG), a biodiesel manufacturer. The purpose of
these tests was to validate the methodology of using a glycerin feedstock source that comes directly
from a biodiesel plant. The glycerin supplied by REG has been refined in the plant in order to remove
some of the impurities (e.g., left over potassium hydroxide) and methanol in crude glycerin. However,
they have not taken the distillation process all the way to a food-grade product since this can be energy
intensive. Data points were taken at all three generator loads (no load, 3.6 kW, and 6.5 kW) with the
flow rates to the reformer found in Table 11 along with the percent change of required glycerin from the
initial food-grade tests. Similar to before, an 80/20% glycerin/water mixture by volume was used with
the REG glycerin.
It was found that in order for engine combustion to take place, the glycerin/water and air flow
rates needed to be increased for the lower grade glycerin. This is partly because the impurities in the
REG glycerin (e.g., methanol) influence the conversion process to hydrogen. In addition, extra air was
supplied to the reformer while testing REG glycerin in order to attempt to compensate for different
ambient conditions. In specific, the ambient air was 21C cooler while testing REG glycerin. Therefore,

88
the author attempted to increase the reformer temperature in order to try and maintain consistency
between the tests. However, there was still a significant difference as the temperature exiting the
reformer for the 99% pure glycerin tests and REG glycerin tests were 653.86 +/- 1.53C and 598.27 +/-
10.39C, respectively at no load. Therefore, future work should target testing food grade and the lower
grade glycerin on the same day.
4.5 In-cylinder Pressure and Emissions Analysis
In order to further analyze the food-grade reformed glycerin/water power generation tests, in-
cylinder pressure traces were taken along with exhaust emission species and compared to that of pure
propane combustion. The in-cylinder pressure traces serve as a methodology to compare combustion
timing and flame propagation speed between syngas and propane. Whereas, measurement of emissions
species provides insight into complete combustion and fuel consumption.
0
1
2
3
4
5
6
-100 0 100 200 300 400 500
SyngasPropane
Pre
ssure
[bar]
Crank Angle [deg before TDC]
(a)

89
0
1
2
3
4
5
6
7
8
-100 0 100 200 300 400 500
SyngasPropane
Pre
ssu
re [
bar]
Crank Angle [deg before TDC]
(b)
0
2
4
6
8
10
-100 0 100 200 300 400 500
SyngasPropane
Pre
ssu
re [
bar]
Crank Angle [deg before TDC]
(c)
Figure 63 - In cylinder pressure comparison at (a) no load, (b) one load, and (c) two loads.
Figure 63 indicates that the pressure traces between pure propane and reformed glycerin
combustion look relatively similar with R2 values of 0.998, 0.993 and 0.988 at no load, one load, and two
loads, respectively. In regards to the peak pressure and combustion speed, syngas follows propane
closely even though a portion of the syngas (e.g., CO2 and H2O) acts as Exhaust Gas Recirculation (EGR).
This EGR slows the combustion process by acting as a diluent in the mixture [23] (recall from Chapter 3
that the external EGR system on the engine was disengaged). However, the high hydrogen
concentration in the syngas promotes a greater mixture laminar flame speed and faster flame
propagation [21]. There is some noticeable difference at the highest power loading case. This is believed

90
to be due to syngas having a lower overall Lower Heating Value than propane (e.g., 29.20 vs. 46.35
MJ/kg at this load), requiring more fuel in order to make up the energy difference. Hence, the
combination of added EGR and the need to burn more fuel results in a longer combustion process. Of
note, spark timing was not changed between the two different fuels in order to provide a direct
comparison without the influence of combustion timing.
A Semtech DS gaseous portable emission analyzer was used to monitor multiple different
emissions produced during combustion. The Semtech system is capable of measuring five different
emissions: carbon monoxide (CO), carbon dioxide (CO2), total hydrocarbons (HC), nitrogen monoxide
(NO), and nitrogen dioxide (NO2). The combination of NO and NO2 emissions are used to calculate the
overall nitrogen oxides produced (NOx). Since the NO2 emissions found are significantly lower than the
NO emissions (ratio of 0.005:1, respectively), the NOx results presented later are largely only a function
of NO emissions. This is to be expected for spark ignition engines [23]. A heated emissions line was
placed in the engine exhaust and the analysis of emissions was completed for pure propane and
reformed glycerin/water combustion under all loads tested.
At the beginning of each test, after starting the Semtech system a species calibration was
completed using six bottled gas tanks. After calibration, experimental data was recorded at each load
setting for five minutes with a data point taken every second. After testing was finished, the calibration
process was repeated using the same bottled gas tanks in order to ensure that all recorded values of
emissions were still within the initial calibration range. Every emission species passed the final
calibration test except for carbon monoxide which required a calibration to ambient air. During the final
calibration process, the reformer was purging excess reformed glycerin/water to the environment
through the exhaust while cooling down. It is assumed that the relatively high levels of carbon monoxide
content from the reformed glycerin/water caused the final calibration test to fail.

91
After completing all of the tests, data files were created for post-processing and further analysis.
The Semtech system stores all of the results in a text file with each species concentration recorded.
Semtech post-processing software is capable of calculating the fuel specific emissions for each species
depending on the fuel used for combustion. The software requires the molecular formula, as well as its
specific gravity of the combustion fuel for automatic fuel specific emission calculations. The molecular
formula and specific gravity of propane (C3H8 and 1.522, respectively) are readily available. However,
these values are unknown for the syngas necessitating the requirement of manual calculations by the
author. Accompanying manual calculations for propane combustion emissions provide a methodology to
verify the accuracy of the author’s results.
In order to express the fuel specific emissions in grams of pollutant (gSample) per grams of fuel
(gfuel), the mole fraction of the pollutant to the fuel burned is computed. This is simply the ratio of the
measured concentration of pollutant to the sum of the CO, HC, and CO2 concentrations in the exhaust,
which reflect the number of moles of fuel that is consumed per mole of exhaust. Then, the mass fraction
of each pollutant to fuel burned is computed by multiplying the mole fraction by the ratio of the
molecular weights of the pollutant to that of the fuel. This results in the following equation that was
used to calculate the fuel specific emission values for propane and reformed glycerin/water engine
exhaust:
2CO THC CO
Sample Sample
fs
fuel fuel
g MWSampleSample
g MW
(26)
In this equation, refers to the concentration of the specific species being analyzed, ,
, and refer to the concentration of carbon monoxide, hydrocarbons, and carbon dioxide
respectively, and refers to the molecular weight of the sample species and the fuel being used.
Equation 26 was first used to verify the accuracy of the Semtech post processing software for
carbon dioxide during pure propane combustion. The values for propane’s chemical formula and specific

92
gravity were entered into the software and the fuel specific value of carbon dioxide was found to be
1000.2 g CO2/kg fuel. This was compared to the manually calculated value of 996.6 g CO2/kg fuel
indicating a 0.3% variation. In order to apply Equation 26 to reformed glycerin combustion emissions,
the molecular weight of the fuel must be known. The flow rates of air and glycerin/water to the
reformer were recorded during the Semtech testing and used with the numerical model described in
Section 4.1. The model estimated that the molecular weight of the syngas at no load, one load, and two
loads were 20.99, 21.08, and 21.13 g/mol, respectively. Results of the fuel specific emissions are shown
in Table 12.
Table 12 - Emissions on a g/gfuel basis with standard deviation indicated in parenthesis.
Propane Glycerin/Water
CO2 CO HC NOx CO2 CO HC NOx
No Load
1000.177 (.246)
0.411 (.043)
0.833 (.227)
0.934 (.017)
863.017 (28.388)
81.976 (18.009)
9.265 (.320)
0.008 (.004)
One Load
1000.083 (.048)
0.434 (.032)
0.848 (.011)
2.021 (.029)
628.650 (13.276)
231.265 (8.445)
8.854 (.033)
0.098 (.016)
Two Loads
998.916 (.158)
0.573 (.040)
1.683 (.115)
3.687 (.053)
592.950 (12.697)
253.948 (8.078)
8.935 (.027)
0.143 (.013)
Comparing the results of the Semtech emissions analysis first requires calculating the A/F ratio
of propane and glycerin/water for the recorded tests. The stoichiometric A/F ratio of propane was
calculated as 15.6 in Section 2.2.2. A similar calculation can be completed to find the stoichiometric A/F
ratio for the glycerin/water mixture. The experimental flow rates of glycerin/water and air used to
produce the syngas for combustion were used with the numerical model to calculate the species
produced from reformation at all loads. These species can be used in a stoichiometric balance to find
the amount of air that would result in complete syngas combustion. Equation 27 is used for complete
combustion of the reformed glycerin/water:
(27)

93
Completing the molar balance of this equation shows that for every mol of glycerin/water provided,
13.328 moles of air are required. Using the molar weight of glycerin/water and air (77.2 g/mol and 28.97
g/mol, respectively) the mass air to fuel ratio (A/F) of 5.001 can be found for stoichiometry (i.e., perfect
combustion). Next, the recorded values of fuel and air flow rates for both the propane and
glycerin/water tests are used to find the experimental A/F ratio. The equivalence ratio () can then be
calculated by dividing the stoichiometric A/F ratio by the experimental A/F ratio. An equivalence ratio
greater than one corresponds to rich combustion (deficient oxygen) and an equivalence ratio less than
one corresponds to lean combustion (excess oxygen). Table 13 shows the A/F ratio and equivalence
ratio for propane and glycerin/water at all generator loads.
Table 13 - Air to fuel ratio and equivalence ratio for propane and glycerin/water at all generator loads.
Propane Glycerin/Water
(A/F)s A/F (A/F)s A/F
No Load 15.60 15.19 1.027 5.001 3.222 1.552
One Load 15.60 15.18 1.028 5.001 3.096 1.615
Two Loads 15.60 15.21 1.026 5.001 3.047 1.641
Analysis of the results shows that propane combustion is achieved near stoichiometry as
intended. The initial efforts by the previous student working on this project dialed in the flow rates and
adjusted the Woodward Air-to-Fuel and Throttle Valves in order to achieve stoichiometry for propane
[47]. As a result, the combustion of the syngas resulting from the reformation of glycerin/water is
significantly rich. This is because the large disparity between the air-to-fuel ratios between the two fuels
should require adjustment of the these valves; i.e., 15.6 versus 5.001. Therefore, carbon monoxide and
hydrocarbon emissions are significantly higher for glycerin/water combustion, as indicated in Table 12,
because there is not sufficient oxygen to complete combustion. Additionally, the carbon dioxide
emissions are lower for glycerin/water combustion since the carbon was not fully converted to CO2.
94
Finally, NOx emissions are lower for glycerin/water combustion due to the lack of air needed for the NOx
dissociation reactions and the additional components in the syngas acting as EGR. EGR is a diluent that
reduces the combustion temperature, subsequently decreasing the production of NOx through the
thermal NO mechanism. These results all follow well-established trends with equivalence ratio [21].
In order to more efficiently burn the syngas in the engine, adjustments should be made in order
to achieve stoichiometric combustion. The current setup does not link the throttle valve to the LabVIEW
program controlling combustion. Purchasing a new throttle valve that is capable of dynamic changes to
A/F ratios and coupling to LabVIEW during testing would help solve the issue of rich syngas combustion.
Moreover, a lambda sensor should be placed in the exhaust line in order to monitor oxygen content.
This can be linked to the throttle valve in LabVIEW in order to provide closed-loop feedback control.
4.6 Application with Biodiesel Production
As biodiesel production continues to increase worldwide, the levels of waste glycerin will grow.
Some large-scale biodiesel production facilities have the capabilities to sell the glycerin after extensive
purification, but this option can be energy intense and costly. A decreasing cost of crude glycerin has
created concerns with its viability as a commodity for the biodiesel industry. Additionally, many smaller
biodiesel facilities are required to pay to have the waste glycerin removed, further diminishing the
economic benefits of biodiesel. One option to utilize the waste glycerin is to couple the synthesis gas
generator rig directly with the production of biodiesel.

95
Figure 64 - Power requirements for the entire biodiesel production process at the University of Kansas
In order to determine the size of a biodiesel production facility that can be powered by the
glycerin reformation setup, one must analyze a biodiesel production process in order to determine the
energy requirements. At the University of Kansas, students run a biodiesel production facility (KU
Biodiesel Initiative) that converts the waste cooking oil on campus into biodiesel and crude glycerin as
illustrated in Figure 64. Current efforts are underway at installing a distillation column in order to purify
the glycerin to technical grade quality, similar to the glycerin supplied by REG used in this effort. Each
stage of the biodiesel production process is indicated in Table 14 with the energy required and time at
each stage. The continuous energy requirements of each stage were calculated by dividing the energy
used by the time at each stage.
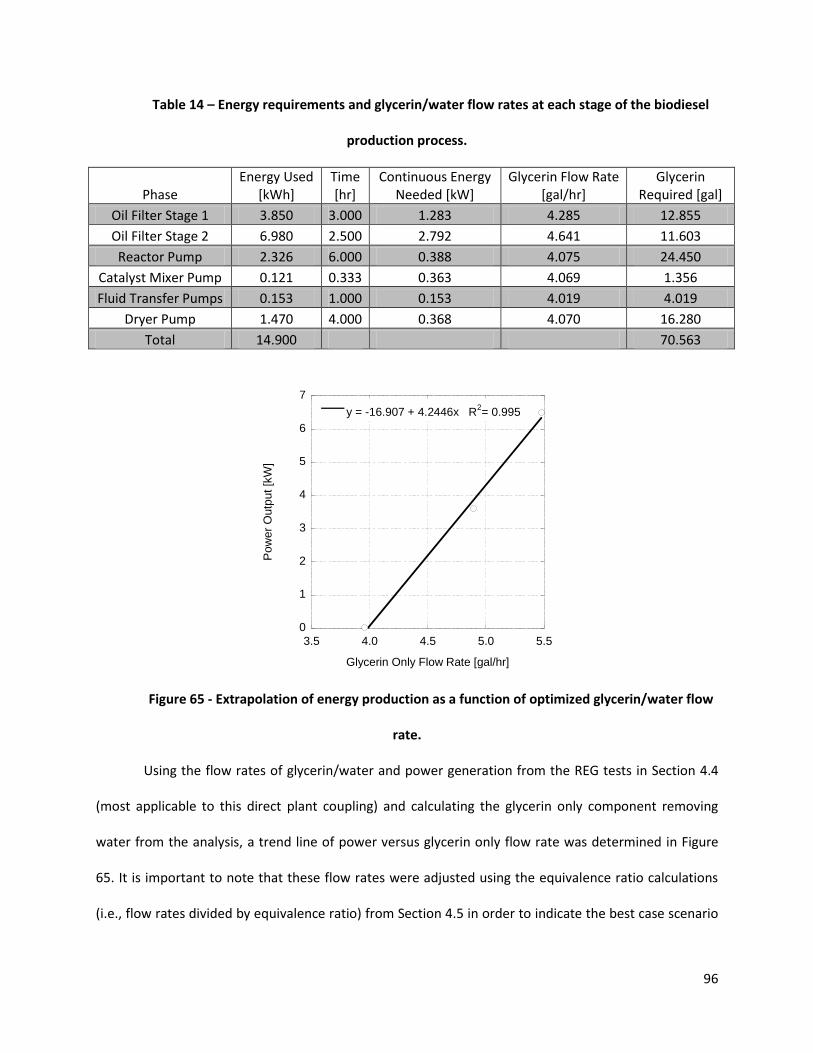
96
Table 14 – Energy requirements and glycerin/water flow rates at each stage of the biodiesel
production process.
Phase Energy Used
[kWh] Time [hr]
Continuous Energy Needed [kW]
Glycerin Flow Rate [gal/hr]
Glycerin Required [gal]
Oil Filter Stage 1 3.850 3.000 1.283 4.285 12.855
Oil Filter Stage 2 6.980 2.500 2.792 4.641 11.603
Reactor Pump 2.326 6.000 0.388 4.075 24.450
Catalyst Mixer Pump 0.121 0.333 0.363 4.069 1.356
Fluid Transfer Pumps 0.153 1.000 0.153 4.019 4.019
Dryer Pump 1.470 4.000 0.368 4.070 16.280
Total 14.900 70.563
0
1
2
3
4
5
6
7
3.5 4.0 4.5 5.0 5.5
y = -16.907 + 4.2446x R2= 0.995
Pow
er
Outp
ut
[kW
]
Glycerin Only Flow Rate [gal/hr]
Figure 65 - Extrapolation of energy production as a function of optimized glycerin/water flow
rate.
Using the flow rates of glycerin/water and power generation from the REG tests in Section 4.4
(most applicable to this direct plant coupling) and calculating the glycerin only component removing
water from the analysis, a trend line of power versus glycerin only flow rate was determined in Figure
65. It is important to note that these flow rates were adjusted using the equivalence ratio calculations
(i.e., flow rates divided by equivalence ratio) from Section 4.5 in order to indicate the best case scenario

97
of minimum glycerin usage for complete combustion. The trend line equation was then used to calculate
the required glycerin flow rate to provide continuous energy to complete each phase of the biodiesel
production process.
As the results indicate in Table 14 in comparison to Figure 64, approximately seven times the
available glycerin is needed in order to produce the required power for the biodiesel production
process. While optimization of the entire system and energy recovery of the waste heat from the engine
will be studied in order to help heat the oil reactor, it is expected that more glycerin is needed than can
be supplied in a continuous manner at a plant. However, the unique setup employed does allow for the
replacement of propane to the reformer with (currently) inexpensive natural gas. Therefore, future
efforts are targeted at optimizing the hydrogen emanating from the reformer using natural gas, glycerin,
and even a hybrid natural gas/glycerin reformer. Of note, nickel is a preferred catalyst for natural gas
reforming [48]. This will allow the biodiesel production facility to utilize two low cost feedstocks as a
function of availability.
4.7 Conclusion
As petroleum prices continue to rise, alternative energy solutions are becoming much more
widely used. Biodiesel is one alternative energy source that has dramatically risen in the last several
years. In order for biodiesel to become an alternative to petroleum, an analysis of its economic uses is
essential. Utilizing the waste byproduct of biodiesel production greatly improves its economic viability.
The unique setup at the University of Kansas converts the waste glycerin from biodiesel production into
a hydrogen rich synthesis gas for combustion in an engine generator system. This system helps recover
some of the energy needed to produce biodiesel. This thesis describes the details behind the operation
and testing of the synthesis gas generator system.
The second chapter gave a complete description of the synthesis gas generator rig and all of the
important components. Additionally, an operating manual was provided that details the procedure for
98
pure propane combustion in the engine, propane reformation and its subsequent combustion and
glycerin/water reformation and its subsequent combustion. The operating procedure of the rig also
contained information for data acquisition for post processing and analysis.
The third chapter provided a literature review of glycerin reformation. This chapter also detailed
the production of the numerical model used for propane reforming. Engine tests were completed to find
the baseline fuel requirements to operate the engine at different load settings. Successful combustion of
reformed propane provided a proof of concept test and led to calibration methods for glycerin/water
reformation by calculating the heat transfer coefficient for the reformer.
The fourth chapter discussed the literature review regarding the catalytic material preparation
for the reformer and the production of the catalyst. The numerical model was then adjusted for
glycerin/water mixtures through an iterative procedure using the heat transfer calculations from the
previous chapter. Results from the numerical model were compared to gas chromatography tests
completed at all of the possible load settings of the reformer. Combustion of reformed glycerin/water
was then completed for power generation at all three loads. Analysis of the emissions produced from
pure propane and reformed glycerin/water combustion was completed using a Semtech DS portable
emissions analyzer. Results of the emissions tests indicated that reformed glycerin/water combustion
occurs in a rich environment and will need to be adjusted for future tests. Finally, an extrapolation of
the combustion results provided a useful application of the work with biodiesel production.

99
References
[1] International Energy Outlook 2010. DOE/EIA; Energy Information and Administration: Washington, D.C. [2] C. Carraretto, A. Macor, A. Mirandola, A. Stoppato, S. Tonon Biodiesel as alternative fuel: experimental analysis and energetic evaluations Energy, 29 (2004), pp. 2195–2211 [3] Yusuf, N.N.A.N., S.K. Kamarudin, and Z. Yaakub, Overview on the current trends in biodiesel production. Energy Conversion and Management, 2011. 52(7): p. 2741-2751. [4] Regulation of Fuels and Fuel Additives: Changes to Renewable Fuel Standard Program; Final Rule, E.P. Agency, Editor March 26, 2010, Federal Register. p. 14669-15320. [5] Greene, D. L., J. L. Hopson, et al. (2006). "Have we run out of oil yet? Oil peaking analysis from an optimist's perspective." Energy Policy 34(5): 515-531. [6] FAO – Food and Agriculture Organization of the United Nations, 2007. Bioenergy Growth Must be Carefully Managed. [7] Janaun, J. and N. Ellis, Perspectives on biodiesel as a sustainable fuel. Renewable & Sustainable Energy Reviews, 2010. 14(4): p. 1312-1320. [8] Araujo, V. K. W. S., S. Hamacher, et al. (2010). "Economic assessment of biodiesel production from waste frying oils." Bioresource Technology 101(12): 4415-4422 [9] C. Carraretto, A. Macor, A. Mirandola, A. Stoppato, S. Tonon. (2004) “Biodiesel as alternative fuel: experimental analysis and energetic evaluations.” Energy, 29: 2195–2211. [10] Stelmachowski, M., Utilization of Glycerol, a By-Product of the Transestrification Process of Vegetable Oils: A Review. Ecological Chemistry and Engineering, 2011. 18(1): p. 9-30. [11] Gui, M.M., K.T. Lee, and S. Bhatia, Feasibility of edible oil vs. non-edible oil vs. waste edible oil as biodiesel feedstock. Energy, 2008. 33(11): p. 1646-1653. [12] Ahmad, S., D. Papadias, Hydrogen from Glycerol: A feasibility Study, U.S.D.o. Energy, Editor 2010: http://www.hydrogen.energy.gov/pdfs/review10/pd003_ahmed_2010_o_web.pdf. [13] Chiu, C.-W., et al., Removal of Residual Catalyst from Simulated Biodiesel's Crude Glycerol for Glycerol Hydrogenolysis to Propylene Glycol. Industrial & Engineering Chemistry Research, 2005. 45(2): p. 791-795. [14] Werpy, T., Petersen, G., Aden, A., Bozell, J, Holladay, J, White, J., Manheim, Amy, Elliot, D., Lasure, L. Jones, S., Gerber, M., Ibsen, K., Lumberg, L., and Kelley, S., Top Value Added Chemicals from Biomass: Volume 1 - Results of Screening for Potential Candidates from Sugars and Synthesis Gas, U.S.D.o.E.E.E.a.R. Energy, Editor 2004.
100
[15] Pandey, R. K., A. Rehman, et al. (2012). "Impact of alternative fuel properties on fuel spray behavior and atomization." Renewable and Sustainable Energy Reviews 16(3): 1762-1778. [16] Zhang, Y., et al., (2003) “Biodiesel production from waste cooking oil: 1. Process design and technological assessment.” Bioresource Technology, 89(1): 1-16. [17] Kinoshita, E., et al., (2004) “Combustion Characteristics for Diesel Engines with Emulsified Biodiesel Without Adding Emulsifier.” [18] Crnkovic, P. M., C. Koch, et al. (2012). "Determination of the activation energies of beef tallow and crude glycerin combustion using thermogravimetry." Biomass and Bioenergy 44(0): 8-16 [19] Bohon, M. D., B. A. Metzger, et al. (2011). "Glycerol combustion and emissions." Proceedings of the Combustion Institute 33(2): 2717-2724. [20] Özgür, D.Ö. and B.Z. Uysal, (2011) “Hydrogen production by aqueous phase catalytic reforming of glycerine.” Biomass & Bioenergy. 35(2): 822-826. [21] Cecrle, E., et al., (2012) “Analysis of the effects of reformate (hydrogen/carbon monoxide) as an assistive fuel on the performance and emissions of used canola-oil biodiesel.” International Journal of Hydrogen Energy. 37(4): 3510-3527. [22] Lin, Y.-C. (2013). "Catalytic valorization of glycerol to hydrogen and syngas." International Journal of Hydrogen Energy 38(6): 2678-2700. [23] Heywood, J.B., (1988) “Internal combustion engine fundamentals.” [24] Cecrle, E., C. Depcik, et al. (2012). "Investigation of the Effects of Biodiesel Feedstock on the Performance and Emissions of a Single-Cylinder Diesel Engine." Energy & Fuels 26(4): 2331-2341. [25] FAO – Food and Agriculture Organization of the United Nations, 2007. “Bioenergy Growth Must be Carefully Managed.” [26] Araujo, V. K. W. S., S. Hamacher, et al. (2010). "Economic assessment of biodiesel production from waste frying oils." Bioresource Technology 101(12): 4415-4422. [27] Nichele, V., et al., (2012) “Glycerol steam reforming for hydrogen production: Design of Ni supported catalysts.” Applied Catalysis B: Environmental. 111-112: 225-232. [28] Wang, X., et al., (2010) “Hydrogen production by glycerol steam reforming with/without calcium oxide sorbent: A comparative study of thermodynamic and experimental work.” Fuel Processing Technology. 91(12): 1812-1818. [29] Sehested, J., J. A. P. Gelten, et al. (2004). "Sintering of nickel steam-reforming catalysts: effects of temperature and steam and hydrogen pressures." Journal of Catalysis 223(2): 432-443. [30] Bottino, A., et al., (2006) “Steam reforming of methane in equilibrium membrane reactors for integration in power cycles.” Catalysis Today. 118(1/2): 214-222.

101
[31] Adhikari, S., S.D. Fernando, and A. Haryanto, (2009) ‘Hydrogen production from glycerol: An update.” Energy Conversion and Management. 50(10): 2600-2604. [32] Yang, G., et al., (2011) “Thermodynamic analysis of hydrogen generation via oxidative steam reforming of glycerol.” Renewable Energy: An International Journal. 36(8): 2120-2127. [33] Authayanun, S., et al., (2010) “Thermodynamic study of hydrogen production from crude glycerol autothermal reforming for fuel cell applications.” International Journal of Hydrogen Energy. 35(13): 6617-6623. [34] Glenn Research Center, NASA Chemical Equilibrium with Applications, http://www.grc.nasa.gov/WWW/CEAWeb/ [35] Chen, T., W. G. Wang, et al. (2011). "Evaluation of carbon deposition behavior on the nickel/yttrium-stabilized zirconia anode-supported fuel cell fueled with simulated syngas." Journal of Power Sources 196(5): 2461-2468. [36] Dou, B., et al., (2010) “Steam reforming of crude glycerol with in situ CO2 sorption.” Bioresource Technology. 101(7): 2436-2442. [37] Gutiérrez Ortiz, F. J., P. Ollero, et al. (2011). "Thermodynamic study of the supercritical water reforming of glycerol." International Journal of Hydrogen Energy 36(15): 8994-9013. [38] Cheng, C. K., S. Y. Foo, et al. (2011). "Steam reforming of glycerol over Ni/Al2O3 catalyst." Catalysis Today 178(1): 25-33. [39] Liu, Y., R. Farrauto, et al. (2013). "Autothermal reforming of glycerol in a dual layer monolith catalyst." Chemical Engineering Science 89(0): 31-39. [40] Cheng, C. K., S. Y. Foo, et al. (2010). "H2-rich synthesis gas production over Co/Al2O3 catalyst via glycerol steam reforming." Catalysis Communications 12(4): 292-298. [41] Cheng, C. K., S. Y. Foo, et al. (2011). "Carbon deposition on bimetallic Co–Ni/Al2O3 catalyst during steam reforming of glycerol." Catalysis Today 164(1): 268-274. [42] Pompeo, F., G. Santori, et al. (2010). "Hydrogen and/or syngas from steam reforming of glycerol. Study of platinum catalysts." International Journal of Hydrogen Energy 35(17): 8912-8920. [43] Chiodo, V., S. Freni, et al. (2010). "Catalytic features of Rh and Ni supported catalysts in the steam reforming of glycerol to produce hydrogen." Applied Catalysis A: General 381(1–2): 1-7. [44] Iriondo, A., V. L. Barrio, et al. (2010). "Glycerol steam reforming over Ni catalysts supported on ceria and ceria-promoted alumina." International Journal of Hydrogen Energy 35(20): 11622-11633. [45] Wang, S. and G. Q. Lu (1998). "Reforming of methane with carbon dioxide over Ni/Al2O3 catalysts: Effect of nickel precursor." Applied Catalysis A: General 169(2): 271-280.

102
[46] Kim, P., H. Kim, et al. (2006). "Effect of nickel precursor on the catalytic performance of Ni/Al2O3 catalysts in the hydrodechlorination of 1,1,2-trichloroethane." Journal of Molecular Catalysis A: Chemical 256(1–2): 178-183. [47] Cecrle, E.D., Controls and Measurements of KU Engine Test Cells for Biodiesel, SynGas, and Assisted Biodiesel Combustion, in Mechanical Engineering. 2011, University of Kansas: Lawrence, Kansas. [48] Bartholomew, C. and R. Farrauto, Fundamentals of Industrial Catalytic Processes2006, Hoboken, NJ: John Wiley and Sons.