pc controlled function generator using direct digital synthesis (dds)
TRANSCRIPT

Jurnal Teknologi, 45(D) Dis. 2006: 19 – 39© Universiti Teknologi Malaysia
PC CONTROLLED FUNCTION GENERATOR USING DIRECTDIGITAL SYNTHESIS (DDS) TECHNOLOGY FOR
ELECTRICAL CAPACITANCE TOMOGRAPHY
RUZAIRI ABDUL RAHIM1, TEO CHIN HENG2, S. SULAIMAN3
& M. S. ABDUL MANAF4
Abstract. A function generator is widely used for experimental work and testing to generatevarious types of waveform (sine, square, triangle, etc) with a particular frequency bandwidth.One of its applications is in generating waveform for the ECT (Electrical CapacitanceTomography) system. ECT is used to retrieve the details of material in a flow system. Aneconomical PC Controlled Function Generator was designed for the use of waveformgenerating in ECT. For the ECT system, high accuracy and frequency waveforms are needed.Three basic waveforms are required; the sine wave, square wave, and triangular wave. Theobjective is to build a function generator which is capable of generating high accuracywaveforms with acceptable distortion and stability. An interfacing system between a PC andthe function generator was also selected and developed with the purpose of producing accurateamplitude and frequency of the waveforms. This interfacing allows remote control to thefunction generator for a wider usage.
Key words: Function generator, direct digital synthesis (DDS)
Abstrak. Penjana frekuensi telah digunakan secara meluas dalam pelbagai jenis ujikaji. Iadigunakan untuk menjana pelbagai bentuk gelombang (gelombang sin, gelombang segiempatdll) pada frekuensi dan lebar jalur tertentu. Satu daripada aplikasinya ialah dalam ProsesTomografi jenis Kapasitif (ECT) di mana ia digunakan untuk menyalurkan maklumatmengenai keadaan aliran. Kertas kerja ini menjelaskan bagaimana mereka bentuk sebuahPenjana Fungsi yang Dikawal oleh Komputer Peribadi yang ekonomi untuk kegunaan ujikajimakmal. Rekaan ini berbeza dengan penjana fungsi manual kerana ia hendaklah dikawalsecara digital. Dalam kes ini, teknologi DDS (Direct Digital Synthesis) digunakan kerana cipDDS adalah digital secara semulajadinya. Analisis telah dibuat untuk memeriksa ketepatankeluaran fungsi dari segi frekuensi dan amplitudnya.
Kata kunci: Penjana frekuensi, sintesis secara terus (DDS)
1.0 INTRODUCTION
Currently, most function generators in the laboratory made use of manualcontrol. Although software controlled function generators are available in the
1,2,3 & 4 Control & Instrumentation Engineering Department, Faculty of Electrical Engineering,Universiti Teknologi Malaysia, 81310 Skudai, Johor. Email: [email protected]
JTD/2005/21 7/19/07, 4:11 PM19
RUZAIRI, TEO CHIN HENG, S. SULAIMAN & M. S. ABDUL MANAF20
market, they are not widely used. This is because of their high cost. An exampleof a construction of a manual-controlled function generator is shown to providea better understanding of function generators. A comparison is also madebetween the MAX038 waveform generator IC [1] and the AD9834 Direct DigitalSynthesis (DDS) [2] waveform generator IC in order to show the advantages ofthe DDS as compared to other waveform generation techniques.
2.0 MANUAL FUNCTION GENERATOR
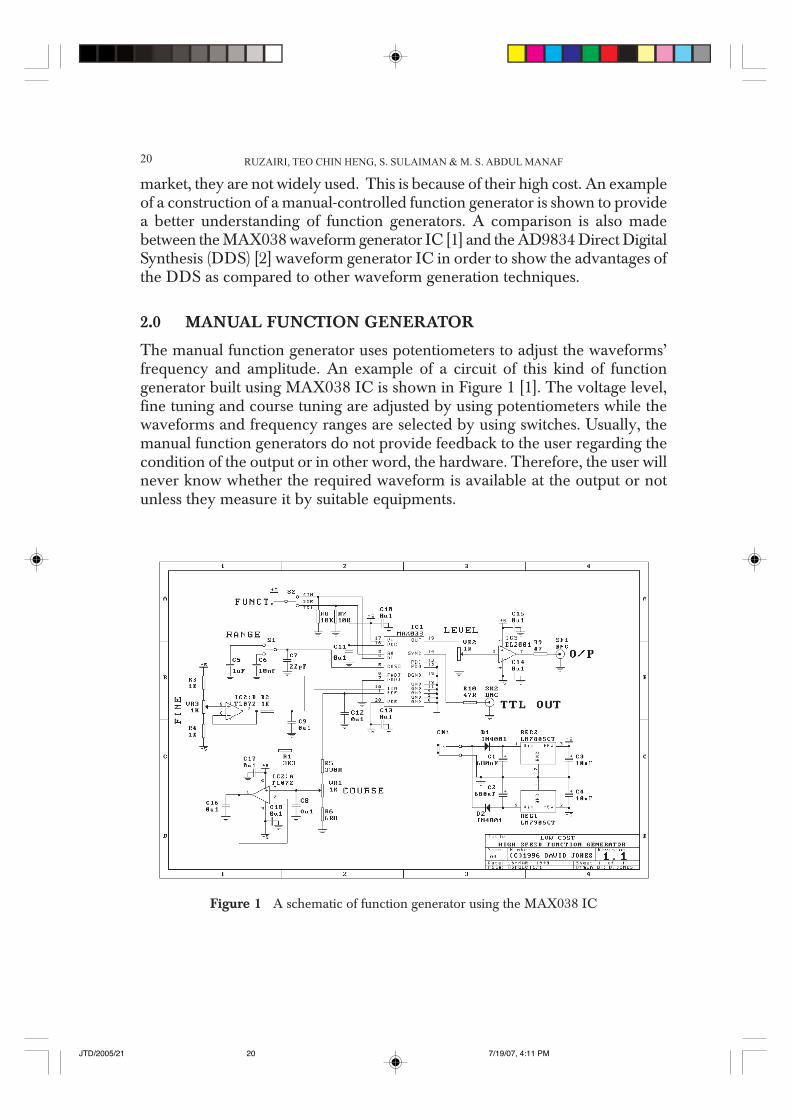
The manual function generator uses potentiometers to adjust the waveforms’frequency and amplitude. An example of a circuit of this kind of functiongenerator built using MAX038 IC is shown in Figure 1 [1]. The voltage level,fine tuning and course tuning are adjusted by using potentiometers while thewaveforms and frequency ranges are selected by using switches. Usually, themanual function generators do not provide feedback to the user regarding thecondition of the output or in other word, the hardware. Therefore, the user willnever know whether the required waveform is available at the output or notunless they measure it by suitable equipments.
Figure 1 A schematic of function generator using the MAX038 IC
JTD/2005/21 7/19/07, 4:11 PM20
PC CONTROLLED FUNCTION GENERATOR USING DIRECT DIGITAL 21
Although the manual function generator is simple and easy to use, there areseveral weaknesses which limits its application its usage [3]. It is often difficultfor the users to adjust the frequency and amplitude of the waveforms to theexact value required because of the tuning difficulty using potentiometers. Thefunction generator does not allow distant control of the waveform. Thereforeusers have to manually adjust the function generator every time they intend tochange the waveform. A typical function generator does not allow interfacingand combination with other devices. However by using a PC as a main station,various devices can be connected together to form a complete testing andexperimentation setup.
The above weaknesses of a manual function generator can be overcomeusing a PC-Controlled Function Generator.
3.0 AD9834 DDS FUNCTION GENERATOR
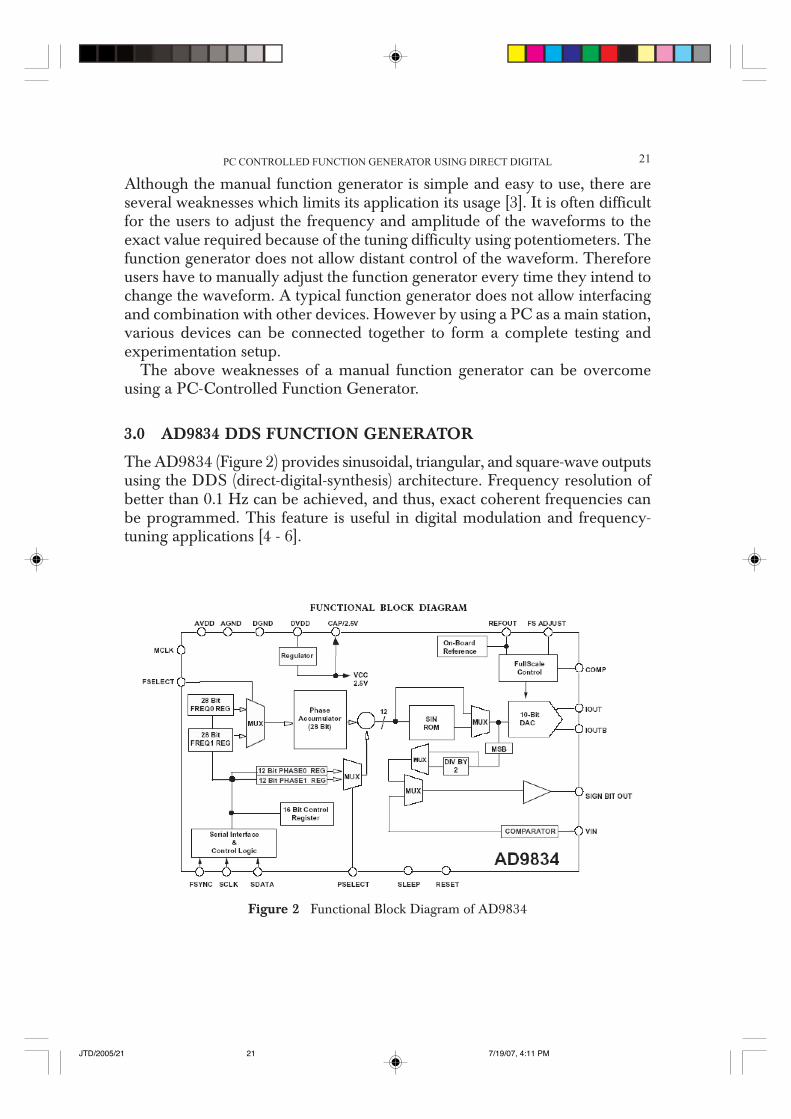
The AD9834 (Figure 2) provides sinusoidal, triangular, and square-wave outputsusing the DDS (direct-digital-synthesis) architecture. Frequency resolution ofbetter than 0.1 Hz can be achieved, and thus, exact coherent frequencies canbe programmed. This feature is useful in digital modulation and frequency-tuning applications [4 - 6].
Figure 2 Functional Block Diagram of AD9834
JTD/2005/21 7/19/07, 4:11 PM21
RUZAIRI, TEO CHIN HENG, S. SULAIMAN & M. S. ABDUL MANAF22
The chip operates as an NCO (numerically controlled oscillator) using anon-chip, 28-bit phase accumulator, sine-coefficient ROM, and a 10-bit D/Aconverter. Typically consider sine waves in terms of their magnitude form, A(t)= sin(!t). The amplitude is nonlinear and is, therefore, difficult to be generated.The angular information, on the other hand, is perfectly linear. That is, thephase angle rotates through a fixed angle for each unit in time. Knowing thatthe phase of a sine wave is linear, and, given a reference interval (clock period),the phase rotation for that period is:
"Phase = ! dt; (1)
! = "Phase
dt= 2#f , and
f =
"Phase× f MCLK
228 ,
where dt =
1f MCLK
, and is the master clock.
Using this formula, output frequencies can be generated, knowing the phaseand master-clock frequency. Theoretically, a maximum output frequency of
f MCLK/2 is possible. The DDS can be programmed by writing to the frequency
registers. The analogue output from the part is then:
fOUT = ×
MCLK228 (frequency register word) (2)
The outputs of the DDS have 28-bit resolution, hence effective frequency stepson the order of 0.1 Hz are possible to a maximum of approximately 20 MHz.Two phase registers are available that allow 12-bit phase resolution. Theseregisters phase-shift the signal by:
Phase shift =
24096#
× (phase register word) (3)
The AD9834 contains 2 frequency registers and 2 phase registers. Eachfrequency register has a size of 28 bits while each phase register has 12 bits. Inthis project, only the frequency register 0 and phase register 0 are used. Theanalog output from the AD9834 is:
JTD/2005/21 7/19/07, 4:11 PM22

PC CONTROLLED FUNCTION GENERATOR USING DIRECT DIGITAL 23
f Phase f MCLK=
×"228 (4)
where "Phase is the value contained in the selected frequency register.
Therefore, the content of the selected frequency register will be
ff MCLK
× 228
.
The signal will be phase shifted by:
2
4096#
× PHASEREG (5)
where PHASEREG is the value contained in the selected phase register.When writing to a frequency register, bits D15 and D14 give the address of
the frequency register. Since only frequency register 0 is used, D15 and D14 areset to 0 and 1, simultaneously. When writing to the frequency register, twoconsecutive writes to the same address are performed, as the frequency registeris 28 bits wide. The first write contains the 14 LSBs while the second writecontains the 14 MSBs. For this mode of operation, the control bit B28 (D13) isset to 1. After changing the content of frequency register, the output will changeaccordingly after 7/8 MCLK cycles.
Summary of Features in AD9834 [2] are as follows:
(i) The AD9834 provides a high resolution frequency for three different typesof waveform: sine wave, square wave and triangular wave. The frequencyselection for the chip is done by altering the content of the frequencyregister in the AD9834. The chip is digital in nature, allowing easiercommunication with the PC.
(ii) Since the AD9834 synthesizer has a crystal locked output frequency, thereis no temperature and time drift for the frequency. This provides a verystable output frequency.
(iii) Theoretically, the AD9834 is able to generate a maximum output frequency
of f MCLK
2. The maximum master clock that can be used by the AD9834 is
50 MHz. Therefore, the chip is able to generate a highest frequency of 25MHz. However, a 50 MHz master clock will result in a more difficultcircuit construction since it is considered as a very high frequency range.
(iv) AD9834 from Analog Devices is only available in the Thin Shrink SmallOutline Package (TSSOP) package. This is an extremely small surfacemount package. A PCB has to be built when constructing the circuit forthe chip.
JTD/2005/21 7/19/07, 4:11 PM23

RUZAIRI, TEO CHIN HENG, S. SULAIMAN & M. S. ABDUL MANAF24
4.0 SYSTEM DESIGN
There are three basic subsystems in the PC Controlled Function Generator asshown in Figure 3.
(a) SoftwareVisual Basic 6.0 is used to create a Graphical User Interface (GUI) to allow theuser to select the type, amplitude and frequency of the waveform that theywant to generate. After that, the GUI is able to send the required data to thefunction generator through an interfacing system. Visual Basic 6.0 is chosen asthe programming platform because of its simple application. Visual Basic 6.0 israther slower as compared to other programming platforms such as VisualC++. However this does not cause much effect to the system because the datatransmission does not require a fast speed [7].
(b) InterfacingA serial link is used to send the data from PC to the Function Generator. Thereare only three types of data to be sent to the Function Generator which are thetype of waveform to be generated, its amplitude, and its frequency.
(c) HardwareThe data received from the PC is input to a microcontroller through a seriallink. This microcontroller will convert the data to suit the requirement of the
Function Generator in order to generate the waveform. The modified datais then sent to the Function Generator IC through output pins.Function Generator IC is already available in the market; therefore it is used asthe main part to generate the required waveforms. This IC generates the type
Figure 3 Block diagram
JTD/2005/21 7/19/07, 4:11 PM24
PC CONTROLLED FUNCTION GENERATOR USING DIRECT DIGITAL 25
and frequency of the waveform as required. However, the amplitude of theoutput waveform is constant in small value depends on the manufacturerspecitications.
The output waveform from the IC is then amplified to required amplitudebased on the data from the PC. To obtain a good quality waveform, that is lowdistortion and stable, the waveform is then filtered using low pass filter toeliminate high frequency noises.
The input data includes the required type, frequency and amplitude of awaveform. It is keyed in to the computer through a GUI built by using VisualBasic 6.0. After that the data is sent to a microcontroller through a serial link.The microcontroller then communicates with the AD9834 and TLE2082 inorder to provide an accurate waveform at the output. The block diagram isshown in Figure 3.
4.1 Software Design
Microsoft Visual Basic 6.0 was chosen to build the GUI for the project. Thedata sent to the hardware does not require a high speed. It is a one-way datasent. Visual Basic 6.0 is more than enough to fulfill the requirement. The platformhas a built-in Microsoft Communication Port control allowing easy settings ofserial communication port on a PC [8]. Figures 4 to 8 show the flowchart forthe GUI programming.
4.1.1 Main Program Loop
When the GUI is first open, the settings for the waveform will be initialized(Figure 4). After that, each time the Reset button is pressed, the initialization ofthe GUI runs again.
After the initialization, the GUI will wait for the Generate command fromthe user. If the user wishes to change any setting to the type of waveform,amplitude or frequency, it may be done at anytime. After the user has decidedon the required type of waveform, amplitude and frequency, he/she may pressthe Generate command button to tell the function generator to generate theoutput waveform which meets the settings on the GUI.
The user may only select three types of waveform on the GUI: sine wave,square wave and triangular wave. There are also only three selections ofamplitude available, which are 1V, 4V and 9V. For the frequency setting, theuser may key in any frequency in the range from 1 Hz to 1 MHz in a 0.01 Hzresolution.
For every change the user make for the type of waveform and amplitude, theGUI will draw a preview of the waveform that is to be generated on the user’s
JTD/2005/21 7/19/07, 4:11 PM25

RUZAIRI, TEO CHIN HENG, S. SULAIMAN & M. S. ABDUL MANAF26
command. The preview is drawn on a graph template on the GUI, showingthe type of waveform and its amplitude. Due to the many variety of frequencythat can be selected, the preview waveform does not have the information onit.
If the user wishes to terminate the GUI, the Exit button may be pressed andthe program will end (Figure 5).
Figure 4 Flowchart of main program for the GUI including the reset function
JTD/2005/21 7/19/07, 4:11 PM26

PC CONTROLLED FUNCTION GENERATOR USING DIRECT DIGITAL 27
Figure 5 Flowchart for the Exit function
4.1.2 Program Initialization
Once the GUI is started, initialization will take place. The GUI will internallyset the type of waveform as a sine wave, with frequency of 1000 Hz andamplitude of 4V (Figure 6). A preview to the initialized waveform is drawn toinform the user about the presets of the GUI. After the settings, all the data willbe sent to the hardware to generate the initialized waveform (Figure 7).
4.1.3 Sending Data through Communication Port (Serial Link)
Before sending all the information to the microcontroller, the GUI will firstlyconvert the data into a form to allow manipulation of data by the microcontroller
Figure 6 Flowchart for initialization of the GUI
JTD/2005/21 7/19/07, 4:12 PM27
RUZAIRI, TEO CHIN HENG, S. SULAIMAN & M. S. ABDUL MANAF28
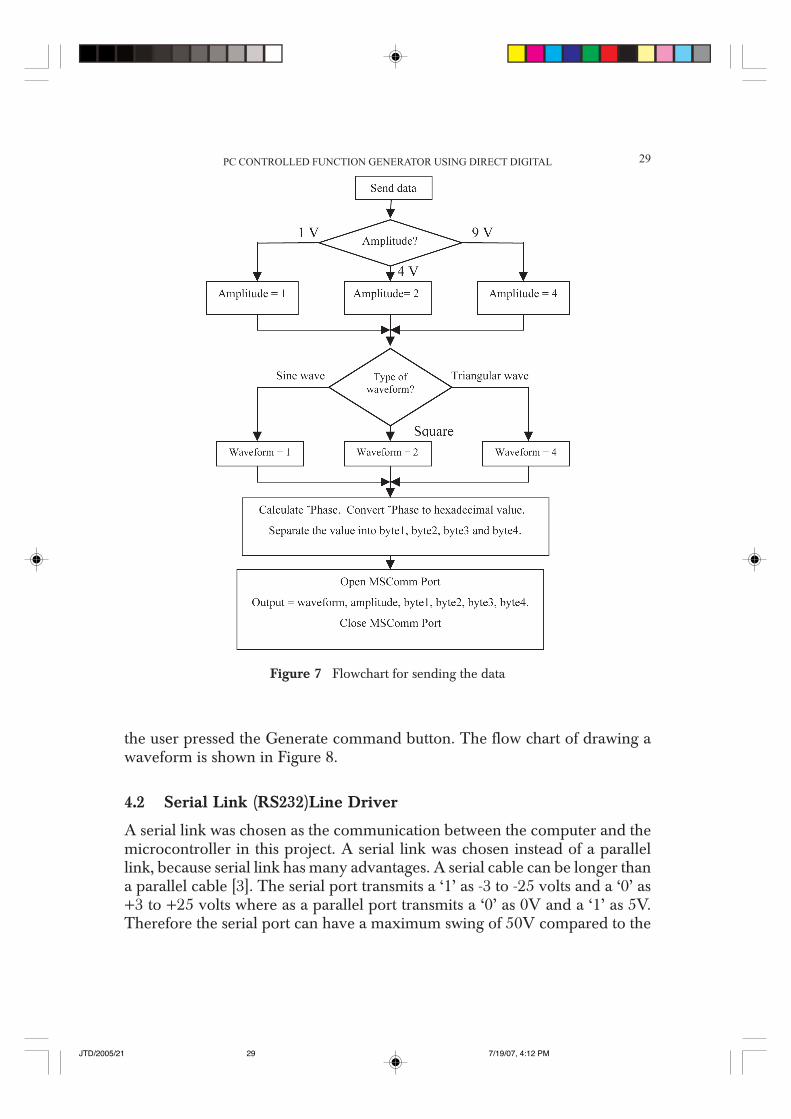
later. The variables to be sent to the microcontroller are the amplitude whichcontains the amplitude information, waveform which contains the type ofwaveform and the 4 byte which contains the information of the frequency.
First, the GUI will detect the amplitude selected by the user. There are threeamplitude options for selection. If the amplitude is 1V, the amplitude variablewill be set to 1. The amplitude will be set to 2 and 4 according to thecorresponding amplitude setting, which are 4V and 9V. These values, whenconverted into ASCII code are 31, 32 and 34. Therefore, the microcontrollerwill only have to detect bit 0, bit 1 and bit 2 of the variable in order to get theinformation of the selected amplitude.
The same algorithm is used to represent the waveform information. Thewaveform variable will be set to 1, 2 and 4 to represent the sine wave, squarewave and triangular wave respectively.
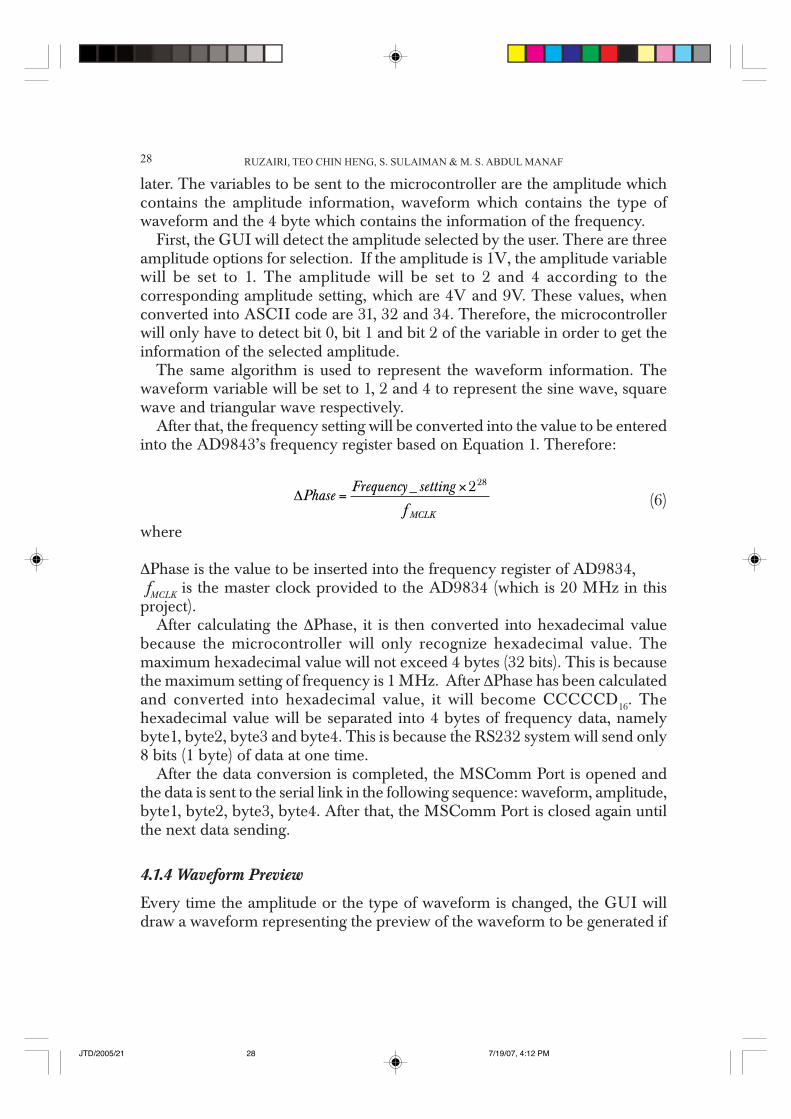
After that, the frequency setting will be converted into the value to be enteredinto the AD9843’s frequency register based on Equation 1. Therefore:
"Phase Frequency setting
f MCLK
=×_ 228
(6)
where
"Phase is the value to be inserted into the frequency register of AD9834, fMCLK is the master clock provided to the AD9834 (which is 20 MHz in thisproject).
After calculating the "Phase, it is then converted into hexadecimal valuebecause the microcontroller will only recognize hexadecimal value. Themaximum hexadecimal value will not exceed 4 bytes (32 bits). This is becausethe maximum setting of frequency is 1 MHz. After "Phase has been calculatedand converted into hexadecimal value, it will become CCCCCD16. Thehexadecimal value will be separated into 4 bytes of frequency data, namelybyte1, byte2, byte3 and byte4. This is because the RS232 system will send only8 bits (1 byte) of data at one time.
After the data conversion is completed, the MSComm Port is opened andthe data is sent to the serial link in the following sequence: waveform, amplitude,byte1, byte2, byte3, byte4. After that, the MSComm Port is closed again untilthe next data sending.
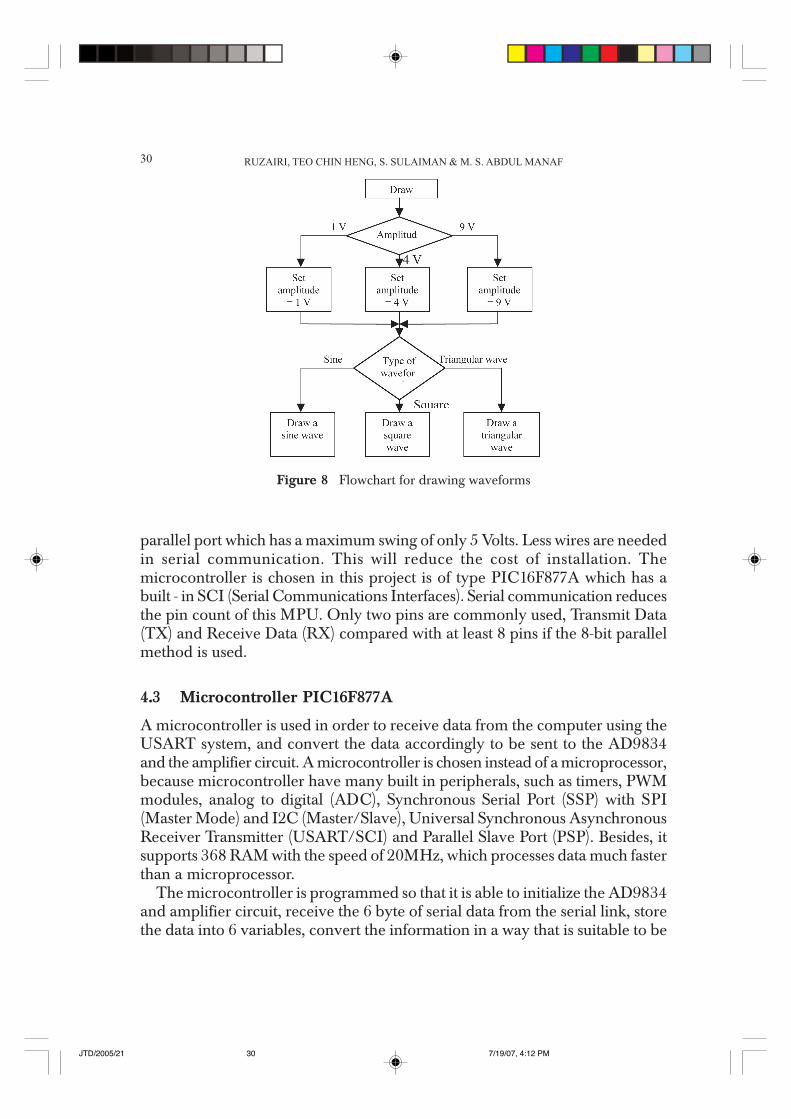
4.1.4 Waveform Preview
Every time the amplitude or the type of waveform is changed, the GUI willdraw a waveform representing the preview of the waveform to be generated if
JTD/2005/21 7/19/07, 4:12 PM28
PC CONTROLLED FUNCTION GENERATOR USING DIRECT DIGITAL 29
the user pressed the Generate command button. The flow chart of drawing awaveform is shown in Figure 8.
4.2 Serial Link (RS232)Line Driver
A serial link was chosen as the communication between the computer and themicrocontroller in this project. A serial link was chosen instead of a parallellink, because serial link has many advantages. A serial cable can be longer thana parallel cable [3]. The serial port transmits a ‘1’ as -3 to -25 volts and a ‘0’ as+3 to +25 volts where as a parallel port transmits a ‘0’ as 0V and a ‘1’ as 5V.Therefore the serial port can have a maximum swing of 50V compared to the
Figure 7 Flowchart for sending the data
JTD/2005/21 7/19/07, 4:12 PM29
RUZAIRI, TEO CHIN HENG, S. SULAIMAN & M. S. ABDUL MANAF30
parallel port which has a maximum swing of only 5 Volts. Less wires are neededin serial communication. This will reduce the cost of installation. Themicrocontroller is chosen in this project is of type PIC16F877A which has abuilt - in SCI (Serial Communications Interfaces). Serial communication reducesthe pin count of this MPU. Only two pins are commonly used, Transmit Data(TX) and Receive Data (RX) compared with at least 8 pins if the 8-bit parallelmethod is used.
4.3 Microcontroller PIC16F877A
A microcontroller is used in order to receive data from the computer using theUSART system, and convert the data accordingly to be sent to the AD9834and the amplifier circuit. A microcontroller is chosen instead of a microprocessor,because microcontroller have many built in peripherals, such as timers, PWMmodules, analog to digital (ADC), Synchronous Serial Port (SSP) with SPI(Master Mode) and I2C (Master/Slave), Universal Synchronous AsynchronousReceiver Transmitter (USART/SCI) and Parallel Slave Port (PSP). Besides, itsupports 368 RAM with the speed of 20MHz, which processes data much fasterthan a microprocessor.
The microcontroller is programmed so that it is able to initialize the AD9834and amplifier circuit, receive the 6 byte of serial data from the serial link, storethe data into 6 variables, convert the information in a way that is suitable to be
Figure 8 Flowchart for drawing waveforms
JTD/2005/21 7/19/07, 4:12 PM30
PC CONTROLLED FUNCTION GENERATOR USING DIRECT DIGITAL 31
sent to the hardware, send the information of type of waveform and frequencyto the AD9834, and send the information about the amplitude to the amplifiercircuit.
4.4 Hardware
4.4.1 Amplification
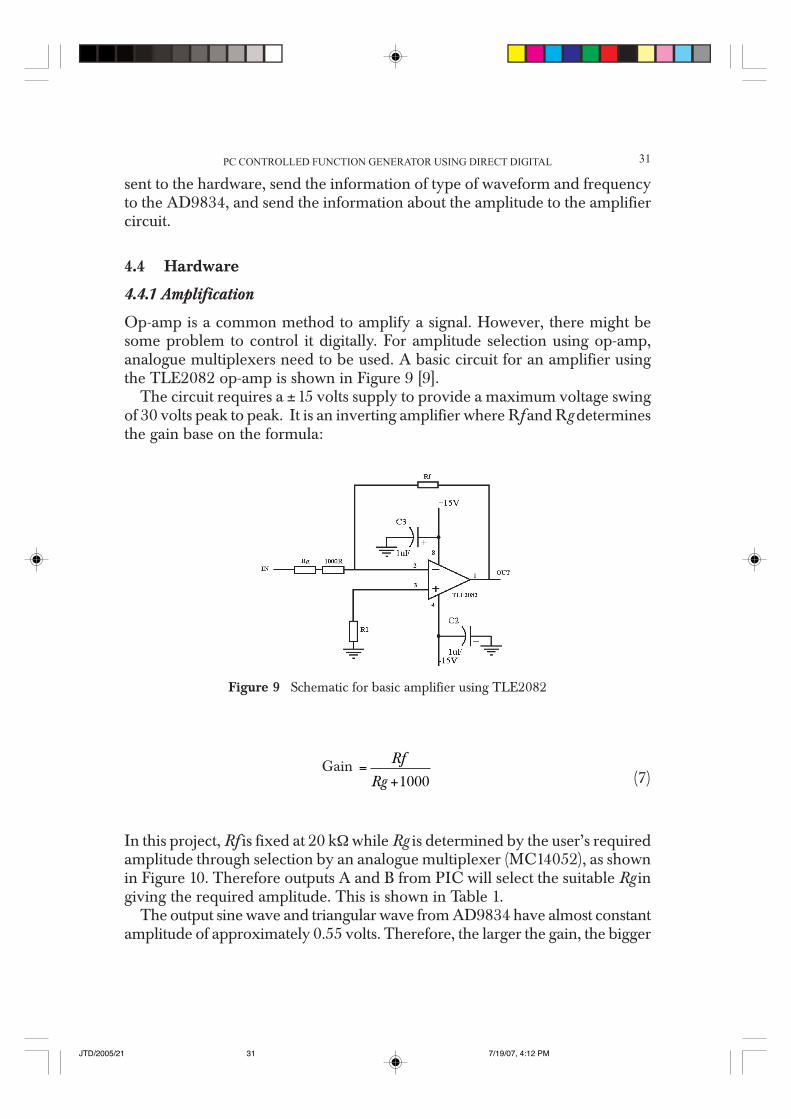
Op-amp is a common method to amplify a signal. However, there might besome problem to control it digitally. For amplitude selection using op-amp,analogue multiplexers need to be used. A basic circuit for an amplifier usingthe TLE2082 op-amp is shown in Figure 9 [9].
The circuit requires a ±15 volts supply to provide a maximum voltage swingof 30 volts peak to peak. It is an inverting amplifier where Rf and Rg determinesthe gain base on the formula:
Gain =
+
RfRg 1000 (7)
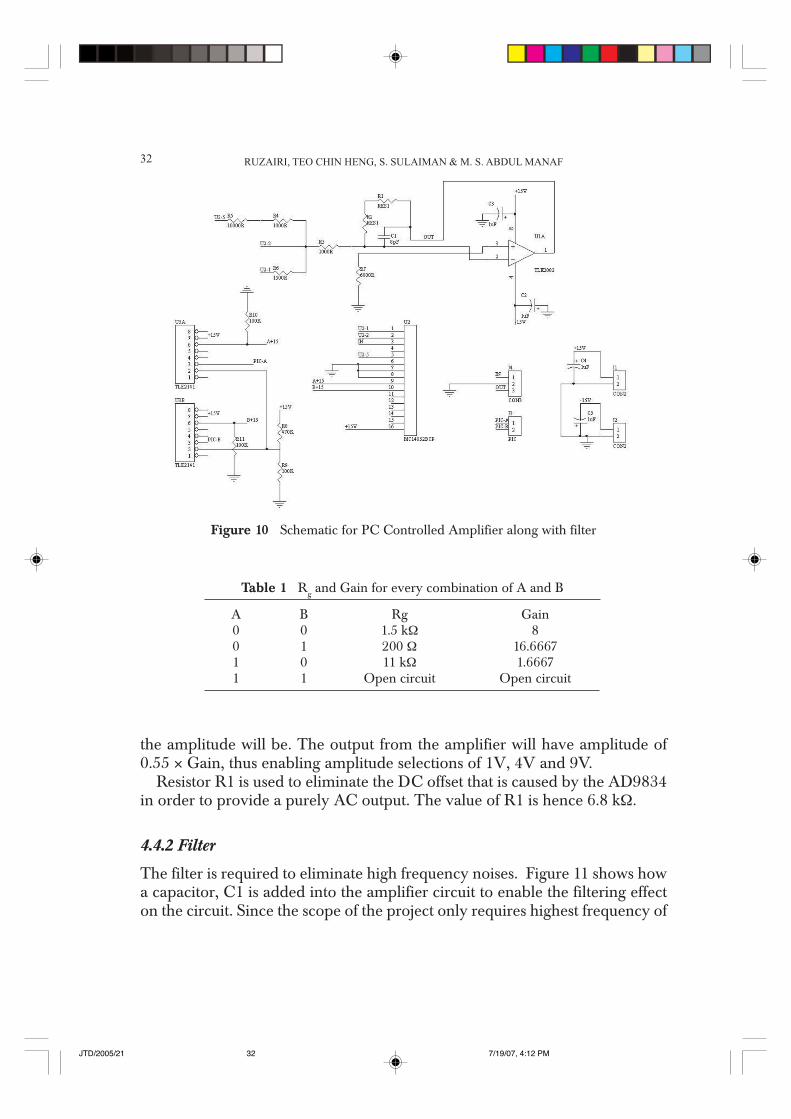
In this project, Rf is fixed at 20 k$ while Rg is determined by the user’s requiredamplitude through selection by an analogue multiplexer (MC14052), as shownin Figure 10. Therefore outputs A and B from PIC will select the suitable Rg ingiving the required amplitude. This is shown in Table 1.
The output sine wave and triangular wave from AD9834 have almost constantamplitude of approximately 0.55 volts. Therefore, the larger the gain, the bigger
Figure 9 Schematic for basic amplifier using TLE2082
JTD/2005/21 7/19/07, 4:12 PM31
RUZAIRI, TEO CHIN HENG, S. SULAIMAN & M. S. ABDUL MANAF32
Table 1 Rg and Gain for every combination of A and B
A B Rg Gain0 0 1.5 k$ 80 1 200 $ 16.66671 0 11 k$ 1.66671 1 Open circuit Open circuit
the amplitude will be. The output from the amplifier will have amplitude of0.55 × Gain, thus enabling amplitude selections of 1V, 4V and 9V.
Resistor R1 is used to eliminate the DC offset that is caused by the AD9834in order to provide a purely AC output. The value of R1 is hence 6.8 k$.
4.4.2 Filter
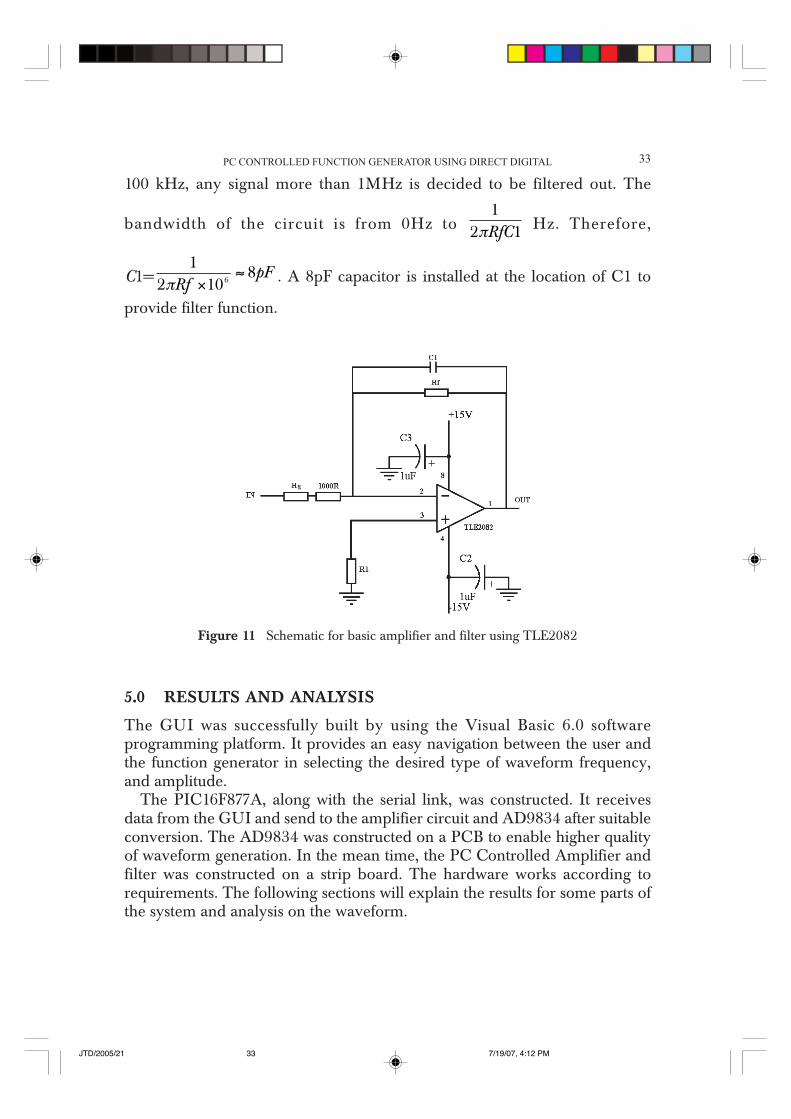
The filter is required to eliminate high frequency noises. Figure 11 shows howa capacitor, C1 is added into the amplifier circuit to enable the filtering effecton the circuit. Since the scope of the project only requires highest frequency of
Figure 10 Schematic for PC Controlled Amplifier along with filter
JTD/2005/21 7/19/07, 4:12 PM32
PC CONTROLLED FUNCTION GENERATOR USING DIRECT DIGITAL 33
100 kHz, any signal more than 1MHz is decided to be filtered out. The
bandwidth of the circuit is from 0Hz to
12 1#RfC Hz. Therefore,
C1=
12 10
86#Rf
pF×
% . A 8pF capacitor is installed at the location of C1 to
provide filter function.
5.0 RESULTS AND ANALYSIS
The GUI was successfully built by using the Visual Basic 6.0 softwareprogramming platform. It provides an easy navigation between the user andthe function generator in selecting the desired type of waveform frequency,and amplitude.
The PIC16F877A, along with the serial link, was constructed. It receivesdata from the GUI and send to the amplifier circuit and AD9834 after suitableconversion. The AD9834 was constructed on a PCB to enable higher qualityof waveform generation. In the mean time, the PC Controlled Amplifier andfilter was constructed on a strip board. The hardware works according torequirements. The following sections will explain the results for some parts ofthe system and analysis on the waveform.
Figure 11 Schematic for basic amplifier and filter using TLE2082
JTD/2005/21 7/19/07, 4:12 PM33

RUZAIRI, TEO CHIN HENG, S. SULAIMAN & M. S. ABDUL MANAF34
5.1 The GUI
Figure 12 shows the screen capture of the GUI. The navigation is basicallydivided into four sections: type of waveform, frequency selection, amplitudeselection and command buttons. The output of the waveform can be previewedfrom the graph above the amplitude selection section.
The types of waveform available for the user to select are sine wave, squarewave and triangular wave. The amplitude available are only 1V, 4V and 9V.These are limited by the capability of the function generator.
As for frequency selection section, the option buttons 10Hz, 100Hz, 1000Hz,10KHz, 100KHz and 1MHz set the upper limit of the output frequency. Theseoptions are very useful when the user does not want the output frequency toexceed a typical range during experiment or other situation. These optionsalso allow easier design in hardware when more amplitude selection andcompensation for different frequency range is required. To determine thefrequency that is to be generated, the user can directly type in the requiredfrequency into the text box using a keyboard. In other cases, the user can alsochoose to use a mouse to navigate with the frequency selection section throughthe sliding bar and the step up/ step down buttons. These many ways offrequency selections makes the GUI more user friendly and easy to use.
Figure 12 The Graphical User Interface
JTD/2005/21 7/19/07, 4:12 PM34

PC CONTROLLED FUNCTION GENERATOR USING DIRECT DIGITAL 35
5.2 Waveform Analysis for AD9834 Output
Analysis had to be done for the waveform generated by AD9834 beforeamplification. This is to gather information for the amplifier design. Examplesof sine wave, square wave and triangular wave of 1 kHz are shown in Figure13.
The required analysis was to determine the amplitude for each waveformgenerated from the AD9834 IC. A set of amplitude data was measured andrecorded over the frequency range and a graph was plotted to show the resultclearly. All measurements were made using the Tektronix TDS 3012 TwoChannel Color Digital Phosphor Oscilloscope.
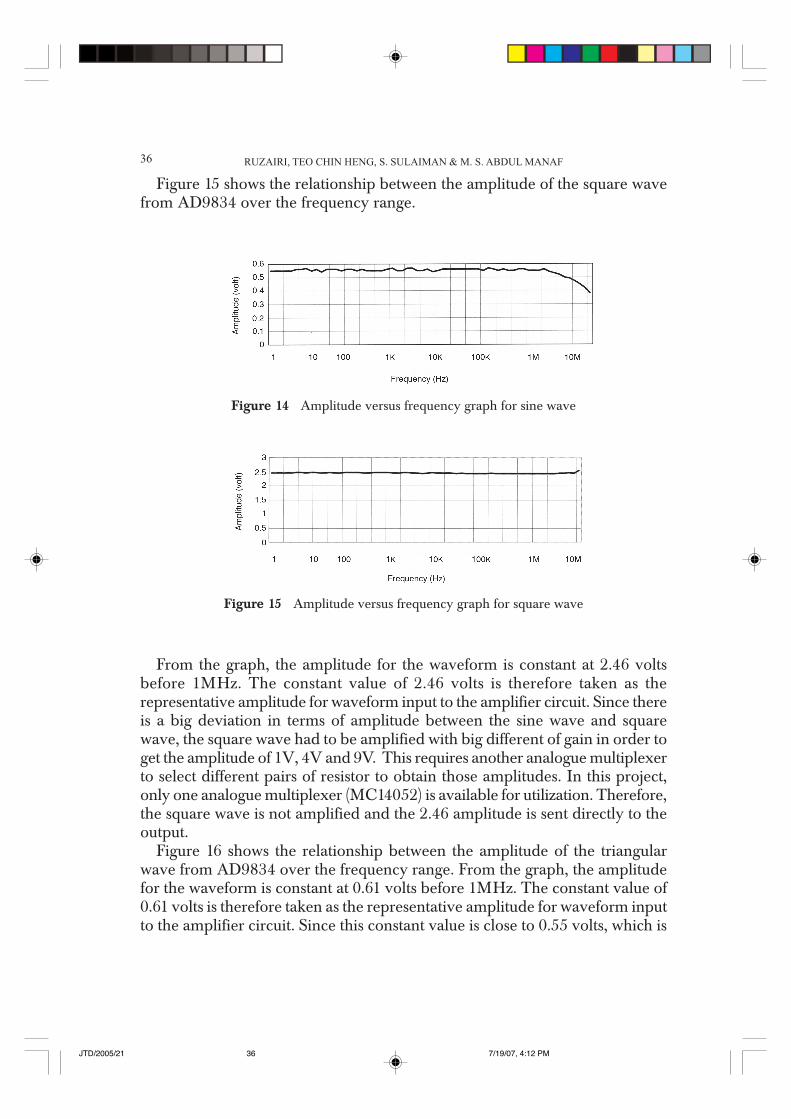
Figure 14 shows the relationship between the amplitude of the sine wavefrom AD9834 over the frequency range.
From the graph, the amplitude for the waveform is constant at 0.55 voltsbefore 1MHz. Only the amplitude lower than 1MHz is concerned because theproject does not require a high frequency of waveform. The constant value of0.55 volts is therefore taken as the representative amplitude for waveform inputto the amplifier circuit.
Figure 13 Examples of waveforms generated by AD9834
JTD/2005/21 7/19/07, 4:12 PM35
RUZAIRI, TEO CHIN HENG, S. SULAIMAN & M. S. ABDUL MANAF36
Figure 15 shows the relationship between the amplitude of the square wavefrom AD9834 over the frequency range.
Figure 14 Amplitude versus frequency graph for sine wave
From the graph, the amplitude for the waveform is constant at 2.46 voltsbefore 1MHz. The constant value of 2.46 volts is therefore taken as therepresentative amplitude for waveform input to the amplifier circuit. Since thereis a big deviation in terms of amplitude between the sine wave and squarewave, the square wave had to be amplified with big different of gain in order toget the amplitude of 1V, 4V and 9V. This requires another analogue multiplexerto select different pairs of resistor to obtain those amplitudes. In this project,only one analogue multiplexer (MC14052) is available for utilization. Therefore,the square wave is not amplified and the 2.46 amplitude is sent directly to theoutput.
Figure 16 shows the relationship between the amplitude of the triangularwave from AD9834 over the frequency range. From the graph, the amplitudefor the waveform is constant at 0.61 volts before 1MHz. The constant value of0.61 volts is therefore taken as the representative amplitude for waveform inputto the amplifier circuit. Since this constant value is close to 0.55 volts, which is
Figure 15 Amplitude versus frequency graph for square wave
JTD/2005/21 7/19/07, 4:12 PM36

PC CONTROLLED FUNCTION GENERATOR USING DIRECT DIGITAL 37
the constant amplitude for the sine wave, the gains are designed to be sharedby both sine wave and triangular wave. In this way, only one analoguemultiplexer is used.
5.3 Analysis on the Accuracy of Output Frequency
One of the most important aspects in the scope of the project is the accuracy ofthe frequency. The output waveform should have a frequency as close as possibleto the user desired frequency. Therefore, output frequency over the frequencysetting was analyzed. Six measurements were made to the frequency for someselected frequency setting for each type of waveform. An error percentage wascomputed based on the largest deviation of output frequency to the frequencysetting. This was done by using the formula:
Error =
Max( frequencysetting measuredfrequency )
frequency setting
&×100% (8)
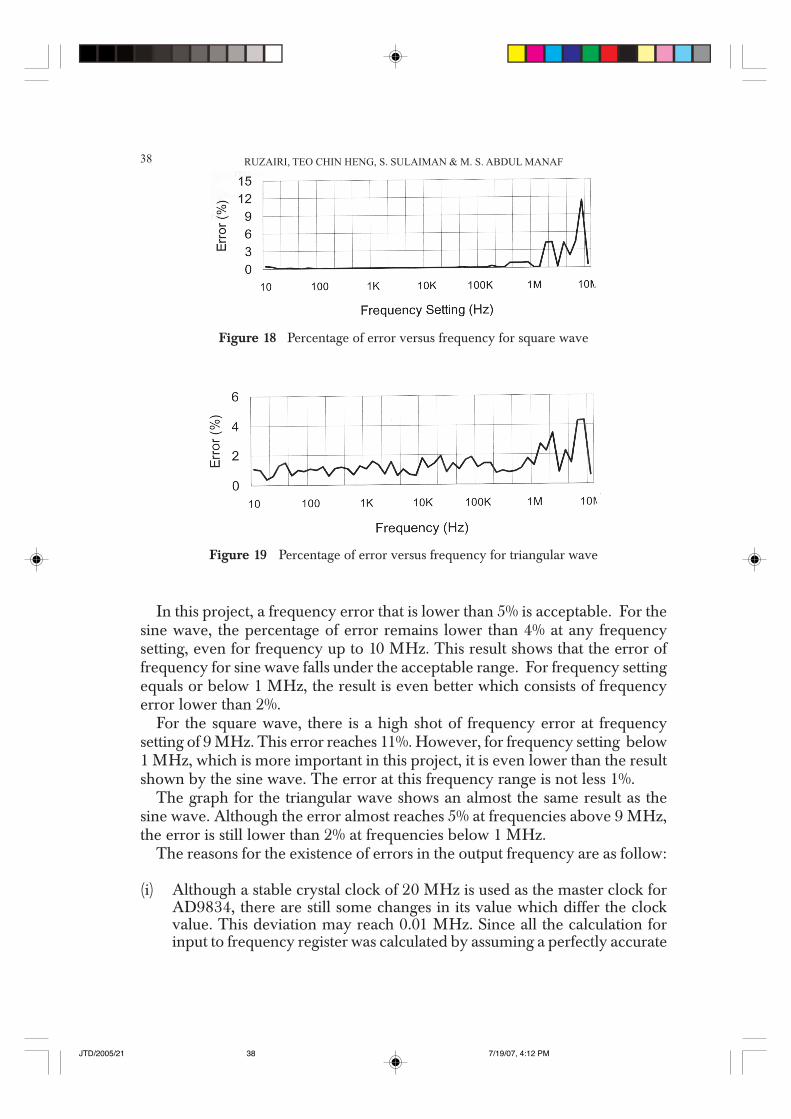
where i = 1, 2, 3, 4, 5, and 6.The results are then plotted into graphs as shown in Figures 17,18 and 19.
Figure 17 Percentage of error versus frequency for sine wave
Figure 16 Amplitude versus frequency graph for triangular wave
JTD/2005/21 7/19/07, 4:12 PM37
RUZAIRI, TEO CHIN HENG, S. SULAIMAN & M. S. ABDUL MANAF38
In this project, a frequency error that is lower than 5% is acceptable. For thesine wave, the percentage of error remains lower than 4% at any frequencysetting, even for frequency up to 10 MHz. This result shows that the error offrequency for sine wave falls under the acceptable range. For frequency settingequals or below 1 MHz, the result is even better which consists of frequencyerror lower than 2%.
For the square wave, there is a high shot of frequency error at frequencysetting of 9 MHz. This error reaches 11%. However, for frequency setting below1 MHz, which is more important in this project, it is even lower than the resultshown by the sine wave. The error at this frequency range is not less 1%.
The graph for the triangular wave shows an almost the same result as thesine wave. Although the error almost reaches 5% at frequencies above 9 MHz,the error is still lower than 2% at frequencies below 1 MHz.
The reasons for the existence of errors in the output frequency are as follow:
(i) Although a stable crystal clock of 20 MHz is used as the master clock forAD9834, there are still some changes in its value which differ the clockvalue. This deviation may reach 0.01 MHz. Since all the calculation forinput to frequency register was calculated by assuming a perfectly accurate
Figure 18 Percentage of error versus frequency for square wave
Figure 19 Percentage of error versus frequency for triangular wave
JTD/2005/21 7/19/07, 4:12 PM38
PC CONTROLLED FUNCTION GENERATOR USING DIRECT DIGITAL 39
master clock, the output frequency will change in small value along withthe change in master clock, if available.
(ii) The calculation of value to be sent to the frequency register is based onequation 1. The result might not be an integer. However, it is then convertedto an integer because the frequency register in AD9834 can only acceptinteger. The small deviation while rounding up the value will cause a slightlyinaccurate output frequency. During the designing stage of the system,this error was already expected to be acceptable.
(iii) Since the readings of output frequency were taken directly by observingthe automatic frequency calculator in the Tektronix TDX 3012 digitaloscilloscope, its accuracy depends on the performance of the scope. Dueto the environmental disturbance and other relevant factors, the waveformentering the oscilloscope is not fully stable. This causes the frequencyreadings to change according to the unstable waveform. However, thisfactor contributes to a very small frequency error and therefore may beneglected.
6.0 CONCLUSIONS
A function generator which is capable to generate sine wave, square wave andtriangular wave with accurate frequency and amplitude had been built. Thefrequency selection can be made in the range from 1 Hz to 1 MHz in smallestresolution of 0.01 Hz. In this frequency range, the amplitude for the outputwaveform is guaranteed to be accurate only for the range from 10 Hz to 100KHz, as stated in the scopes of the project.
The available amplitude for sine wave and triangular wave are 1 volt, 4 voltsand 9 volts. These amplitudes are suitable to meet many experimentalrequirements. However, the square wave is only provided with one selectionof amplitude, which is 2.5 volts.
REFERENCES[1] IC MAX038 pdfserv.maxim-ic.com/en/ds/MAX038.pdf Accessed December 2004[2] AD9834 - Low Power www.analog.com/en/prod/0,,788_843_AD9834,00.html Acessed January 2005[3] Dayton R.L, 1988. Guide to Integrating Digital Services: T1, DDS, and Voice Integrated Network
Architecture. New York: McGraw-Hill.[4] Direct Digital Synthesis, www.altera.com/products/ip/altera/t-alt-dds.html [5] Direct Digital Frequency
Synthesis www.hit.bme.hu/~papay/sci/DDS/start.htm. Accessed January 2005[6] Schewel, J 1999. Direct digital synthesis: some options for FPGA implementation (Paper #: 3844-
02) SPIE Proceedings Vol. 3844 ISBN: 0-8194-3437-X, 180 pages Published 1999 Meeting Date:09/19 - 09/22/99, Boston, MA, USA.
[7] Zak, D. 1999. Programming with Microsoft Visual Basic 6.0, Course Technology, 1999. Preston USA[8] Schneider. D I. 1999. An Introduction to Programming using Visual Basic 6.0. Upper Saddle River, N.J:
Prentice-Hall.[9] Traister R J. 1989. Operational Amplifier Circuit Manual. San Diego, CA: Academic Press.
JTD/2005/21 7/19/07, 4:12 PM39