denmark - op.europa.eu
TRANSCRIPT
February – 2021
European Semester 2020-2021 country fiche on disability equality
Denmark
EUROPEAN COMMISSION Directorate-General for Employment, Social Affairs and Inclusion Directorate C — Social Affairs Unit C3 — Disability & Inclusion European Commission B-1049 Brussels
Directorate-General for Employment, Social Affairs and Inclusion
European Semester 2020-2021 country fiche on disability equality
With comparative data annex provided by EDE
Denmark
Steen Bengtsson
European Disability Expertise (EDE) provides independent scientific support to the Commission’s policy Unit responsible for disability issues. It aims to mainstream disability equality in EU policy processes, including implementation of the United Nations Convention on the Rights of Persons with Disabilities. This country report has been prepared as input for the European Semester in 20211 and has been developed under Contract VC/2020/0273 with the European Commission.
1 For an introduction to the Semester process, see https://www.consilium.europa.eu/en/policies/european-semester/how-european-semester-works/.
LEGAL NOTICE Manuscript completed in February 2021 The European Commission is not liable for any consequence stemming from the reuse of this publication. This document has been prepared for the European Commission however it reflects the views only of the authors, and the European Commission is not liable for any consequence stemming from the reuse of this publication. More information on the European Union is available on the Internet (http://www.europa.eu). Luxembourg: Publications Office of the European Union, 2021 © European Union, 2021
The reuse policy of European Commission documents is implemented based on Commission Decision 2011/833/EU of 12 December 2011 on the reuse of Commission documents (OJ L 330, 14.12.2011, p. 39). Except otherwise noted, the reuse of this document is authorised under a Creative Commons Attribution 4.0 International (CC-BY 4.0) licence (https://creativecommons.org/licenses/by/4.0/). This means that reuse is allowed provided appropriate credit is given and any changes are indicated. PDF ISBN 978-92-76-32178-1 DOI 10.2767/005311 KE-02-21-336-EN-N

3
European Semester 2020-2021 country fiche on disability - Denmark
Table of contents 1 Executive summary and recommendations ....................................................... 4
1.1 Key points and main challenges for the European Semester in 2021 ....... 4 1.2 Recommendations for Denmark ................................................................ 5
2 Opportunities to mainstream disability equality in the Semester documents ..... 6 2.1 Country Report for Denmark (Staff Working Document) ........................... 6 2.2 Country Specific Recommendation for Denmark (CSR) ............................ 7
3 Disability and the labour market - analysis of the situation and the effectiveness of policies ........................................................................................................... 9 3.1 Summary of the labour market situation of persons with disabilities ......... 9 3.2 Analysis of labour market policies relevant to the Semester ................... 11
4 Disability, social policies and healthcare – analysis of the situation and the effectiveness of policies ................................................................................... 13 4.1 Summary of the social situation of persons with disabilities .................... 13 4.2 Analysis of social policies relevant to the Semester ................................ 14
5 Disability, education and skills – analysis of the situation and the effectiveness of policies ......................................................................................................... 18 5.1 Summary of the educational situation of persons with disabilities ........... 18 5.2 Analysis of education policies relevant to the Semester .......................... 19
6 Investment priorities in relation to disability ...................................................... 20 6.1 Updates on use of existing EU funds (to 2020) ....................................... 20 6.2 Priorities for future investment (after 2020) ............................................. 20
7 Annex: disability data relevant to the Semester ............................................... 21 7.1 EU data relevant to disability and the labour market (2018) .................... 22
7.1.1 Unemployment............................................................................ 23 7.1.2 Economic activity ........................................................................ 24 7.1.3 Alternative sources of labour market data in Denmark ............... 25
7.2 EU data relevant to disability, social policies and healthcare (2018) ....... 27 7.2.1 Alternative sources of poverty or health care data in Denmark .. 28
7.3 EU data relevant to disability and education............................................ 29 7.3.1 Alternative sources of education data in Denmark ...................... 29
4
European Semester 2020-2021 country fiche on disability - Denmark
1 Executive summary and recommendations 1.1 Key points and main challenges for the European Semester in 2021 Compared with the EU as a whole, the situation for people with disabilities looks relatively good in Denmark. In Denmark, there are more disabled people in employment, especially people with severe disabilities. In Denmark, both people with and without disabilities have a lower risk of poverty, especially older people with disabilities. Fewer people have unmet needs for medical examination, and there are far fewer early school leavers in the group with disability. However, for the period 2012-2016, the Institute of Human Rights' Handicapbarometer has shown that the situation in most points has not improved, but on the contrary become a little worse. The Handicapbarometer will be updated in 2020, and it will be important to assess if there are signs of improvement. Two decades of efforts to get more people with disabilities into jobs have not borne fruit for a long time. Now EU-SILC 2018 shows that the employment of disabled people is above the EU average but with a disability employment gap of 20 percentage points. This gap has been narrowing. As in many other countries, the number of people at risk of poverty in Denmark has increased. This growth in poverty affects the group with disabilities at least as much as other groups and appears to affect the working age group with disabilities more than others. For several decades, Danish economic policy has been based on a principle of making the supply of labour as large as possible, in order to increase production and afford more welfare. For people with disabilities, this has meant that a great effort has been made to create jobs for this group; while on the other hand, it has been made more difficult to get social benefits. Thus, the threshold for obtaining a disability pension has been raised with reforms in 2003 and 2013, which have each time reduced the number of grants to close to half. A new law on senior pension has now made it easier for people in their 60s to get a pension if they have many years of work behind them and reduced ability to work due to health. However, there is still debate about whether the disability pension reform in 2013 made it too difficult to obtain a pension, and whether there is economic rationality in the resource courses that were introduced with that reform. The Coronavirus pandemic has been of great importance to people with disabilities as well as to everyone else in the country. It has thus prevented some from getting the training they otherwise received. However, it is too early to draw an overall picture of the significance it will have.

5
European Semester 2020-2021 country fiche on disability - Denmark
1.2 Recommendations for Denmark These recommendations are based on the evidence and analysis presented in the following chapters of our report. • Recommendation: Analyse the economic rationality of the efforts of
rehabilitation for ordinary work or for flex jobs in the municipalities' job centres, especially the part of the effort that is called ‘resource course’. This should inform considerations as to whether access to disability pension should again be made easier, so that disability pension will be the solution in cases where continued rehabilitation cannot be expected to pay off.
Rationale: concerning the so-called ‘resource courses’ which were introduced with the reform of disability pension in 2013, it is a question whether the effort to rehabilitate to work actually pays off, or whether there had been lower costs by giving more people a disability pension. Everyone should have a chance to contribute to society but many have the experience that the municipalities continue resource courses long after it must be clear that they are not leading to any result.
• Recommendation: the knowledge gathered in the recent study of students with
disabilities, and their use of various schemes to give students with disabilities the same opportunities to complete studies as others, should be implemented by the educational institutions. So, it should be possible for students with disabilities to prolong their studies. They are often in a situation, where it demands more time, both for study activities and for practical activities.
Rationale: the problem has been addressed with reforms, but focus has been lost when the measures should be implemented and function. Follow-up is needed, and it may also be necessary to give educational institutions greater opportunities to work with the problems, e.g. by hiring a consultant to take care of the implementation.
• Recommendation: funding should be found for initiatives and projects in the
area of disability that can replace what was previously funded through Satspuljen.
Rationale: Especially in this century, Satspuljen2 has functioned as a significant source of funding for new initiatives and projects in the field of disability. However, it was closed down in 2019 without any plans for how the various initiatives would be financed in the future. If no replacement is found, it will be felt in many areas concerning disability.
2 Satspuljen is the name of a large fund which for some decades has functioned as a significant
support in the social field in Denmark. The name comes from the fact that it was created by taking funds from the automatic price indexation of public pensions and other social benefits.
6
European Semester 2020-2021 country fiche on disability - Denmark
2 Opportunities to mainstream disability equality in the Semester documents 2.1 Country Report for Denmark (Staff Working Document)
In 2020, the Country Report for Denmark included the following direct references to disability issues: • ‘p. 9 Lower than average employment rates can be observed for youth,
migrants and people with disabilities. • p. 29 Despite a good labour market situation, certain marginalised groups face
barriers to accessing the labour market...This includes youth, migrants, homeless and people with disabilities, mental issues or who attend drug rehabilitation programmes.
• p. 31 Denmark is progressing towards some of the ten social mobility goals from May 2016...These initiatives aim to lower the number of vulnerable persons, increase the activity rate and incentivise more people to start an education or training despite a disability.
• p. 31 The labour market situation of people with disabilities is less favourable on some indicators.’
As can be seen from the above quotes from the Country Report, there are still inequalities in the Danish society that are related to disability. There is a persistent and constant inequality with regard to the employment of people with disabilities, and although it is stated (Country Report p. 31) that ‘Denmark is progressing towards some of the ten social mobility goals’, this does not apply to the goals that relate to disability. As the analyses below show, currently no clear development is seen in the direction of disability mainstreaming in Denmark. Although there is political awareness in the area and legislation is improving in some respects, challenges in the development of society pull in the opposite direction. Handicapbarometer3 indicates on most points from 2012-2016 a slightly negative development in the situation of people with disabilities compared to other people, but the differences are not significant. All indications say that this development has continued, but this will become apparent at the next Handicapbarometer wave, which is expected in 2021. Disability policy throughout this century has been characterized by a growth in public efforts in relation to the group. At the same time, the situation for people with disabilities in relation to other groups has not changed much. It thus seems as if the political effort has had limited results. But it is also a possible interpretation that the barriers have grown during this period, where we have seen a rapid development in society. With the Disability Barometer's next survey, it will be possible to determine whether the slightly negative trend in the development of disability mainstreaming in relation to the UNCRPD that we saw in the middle of the decade, continues so that a more
3 https://handicapbarometer.dk/.
7
European Semester 2020-2021 country fiche on disability - Denmark
unambiguous picture emerges of a development in the opposite direction. of what UNCRPD was to bring about. However, there are trends in EU-SILC 2018 which may indicate that the employment of people with disabilities in Denmark is starting to grow in recent years, also in relation to the employment of other people. If this result proves to be true, it will be significant, because the many efforts of the last two decades to improve the employment of people with disabilities in Denmark have so far not had such results. Such a development is also seen in the national surveys for recent years, but the development over a number of years is not quite so clear. EU-SILC 2018 shows (Table 1 in Annex) that slightly more people reported activity limitations/disability compared to EU-SILC 2016. However, this increase in numbers is only seen for the group, which is limited to some extent, while there is the reverse trend for the group which is strongly limited. Denmark differs from the EU average in that the proportion of people reporting activity limitations is significantly smaller in the group 65+, while the proportion of people with disabilities is significantly higher in the group 16-64, compared to the EU27. 2.2 Country Specific Recommendation for Denmark (CSR)
In 2020, the Country Specific Recommendation for Denmark included the following direct references to disability issues: • ‘15. These measures effectively reduced the economic shock of the
pandemic, but did not prevent a significant loss of output, a large number of bankruptcies and insolvencies and marked increases in unemployment and persons at risk of poverty, including among those in vulnerable situations (e.g. persons with disabilities).’
Although the Coronavirus pandemic, as stated, has affected people with disabilities, it is difficult to say whether they have affected this group more than it has affected people without disabilities. The pandemic has affected certain industries particularly much, such as travel, tourism, and restaurant. These are not industries where many people with disabilities work, and there is no reason to believe that dismissal has particularly affected people with disabilities. The country specific recommendations in the above quote say that the Coronavirus pandemic also affected people with disabilities. Yet the three recommendations in the paper do not contain anything about it. They are partly about the need to get the economy going again without accumulating too much debt, to get the investments going and to counter money laundering. The Coronavirus effort has been to the detriment of some groups of people with disabilities who, for reasons of capacity, have had their training reduced, as will be discussed in more detail in section 4.1. It has been discussed whether the Coronavirus crisis has led to more people with disabilities feeling lonely. A study4 conducted by the National Institute of Public Health
4 https://coronaminds.ku.dk/resultater/ensomhed-under-coronakrisen/.
8
European Semester 2020-2021 country fiche on disability - Denmark
shows that the group of people with mental health problems feel significantly more lonely than other people. However, the feeling of loneliness does not increase in the period of shutdown due to Coronavirus. A study of Danish Disability Organisations, which is mentioned in section 4, shows, however, that loneliness among a group of people with disabilities has grown in the Coronavirus shutdown period. In general, it would be important to include a disability perspective on CSR1 in relation to the resilience and sufficiency of the health system. It would also be relevant to acknowledge the need for access and accessibility in transport and broadband access in relation to CSR2.
9
European Semester 2020-2021 country fiche on disability - Denmark
3 Disability and the labour market - analysis of the situation and the effectiveness of policies
In 2014, the UN CRPD Committee made the following recommendations to Denmark: Article 27 UN CRPD addresses Work and Employment.
‘59. The Committee recommends that the State party take all necessary measures to significantly increase, as soon as possible, the percentage of persons with disabilities working in the open labour market, including amendments to the general labour legislation so that it imposes clear obligations on employers to afford reasonable accommodation to employees with disabilities.’
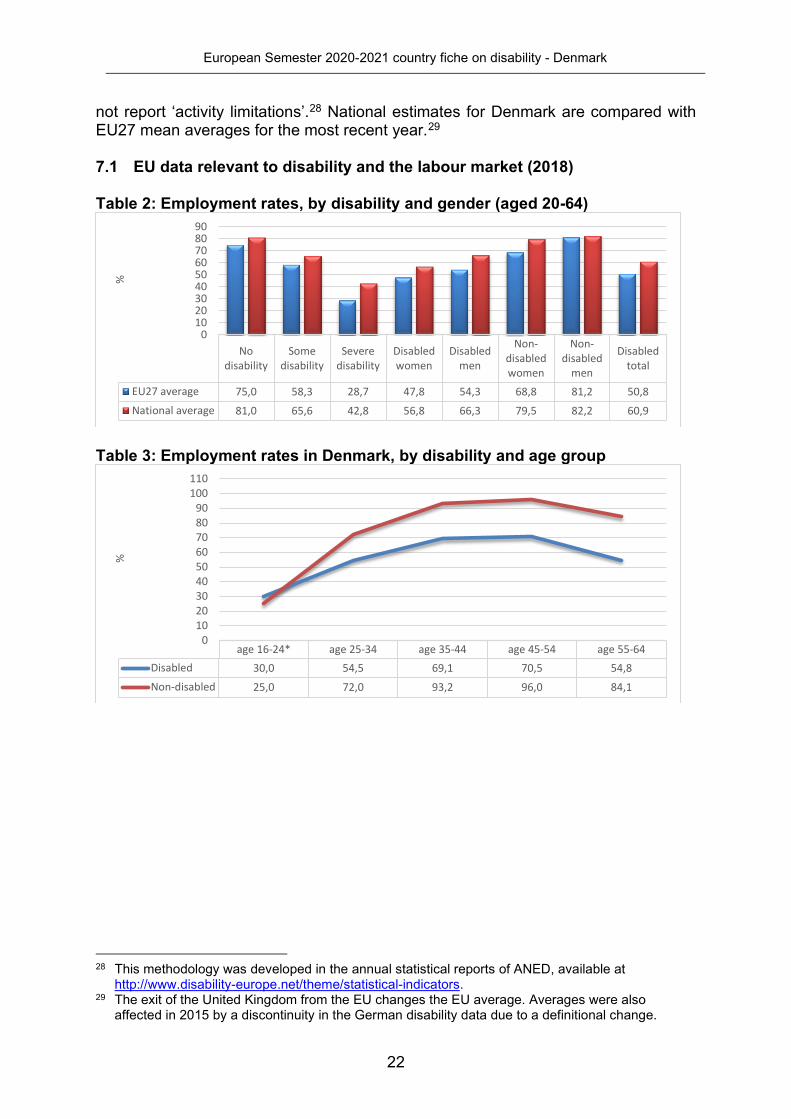
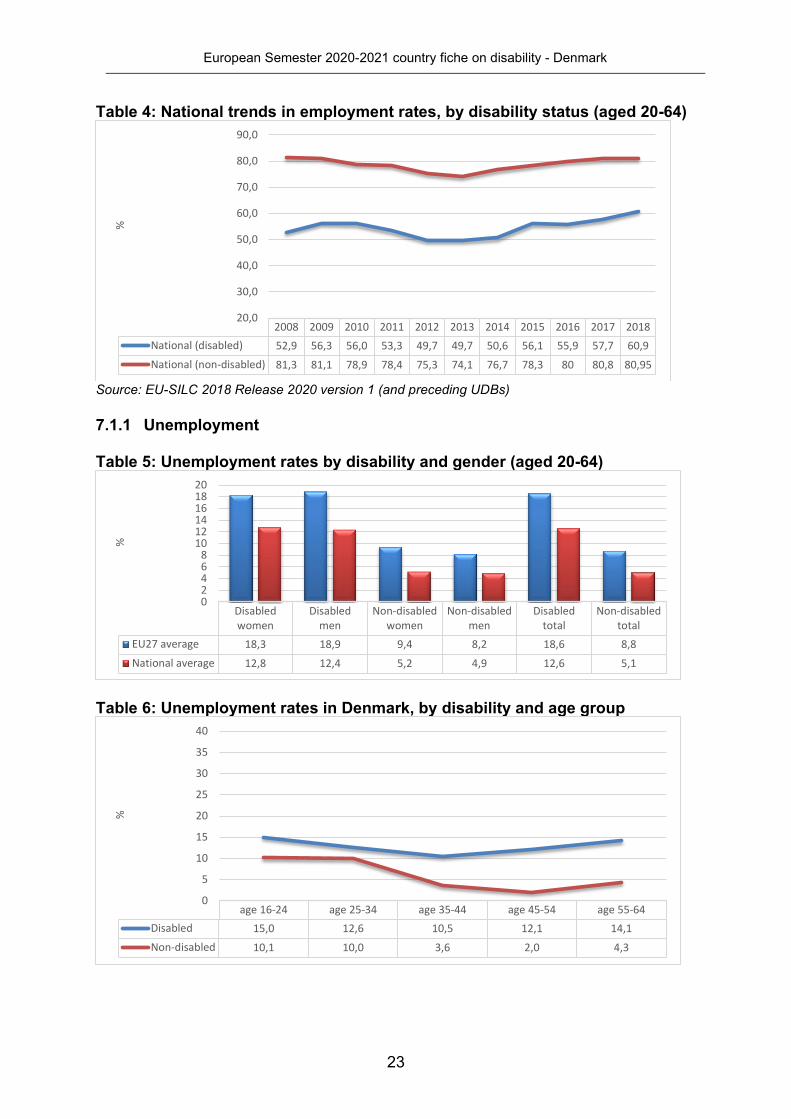
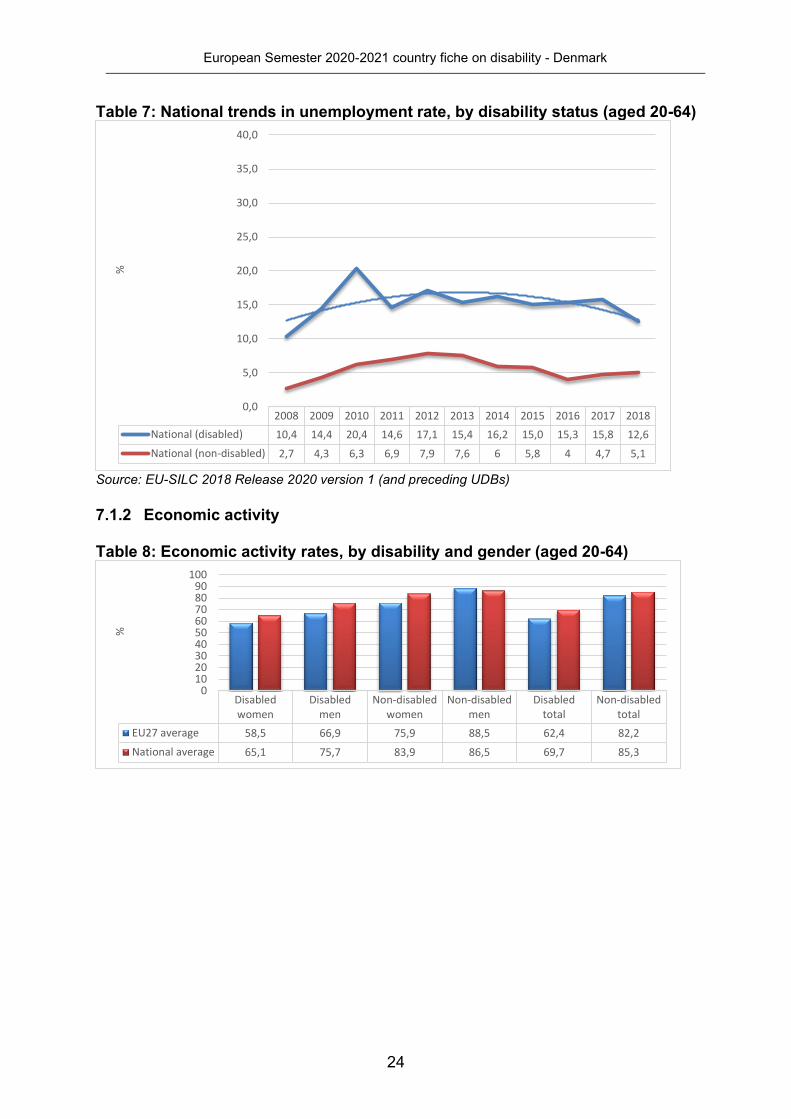
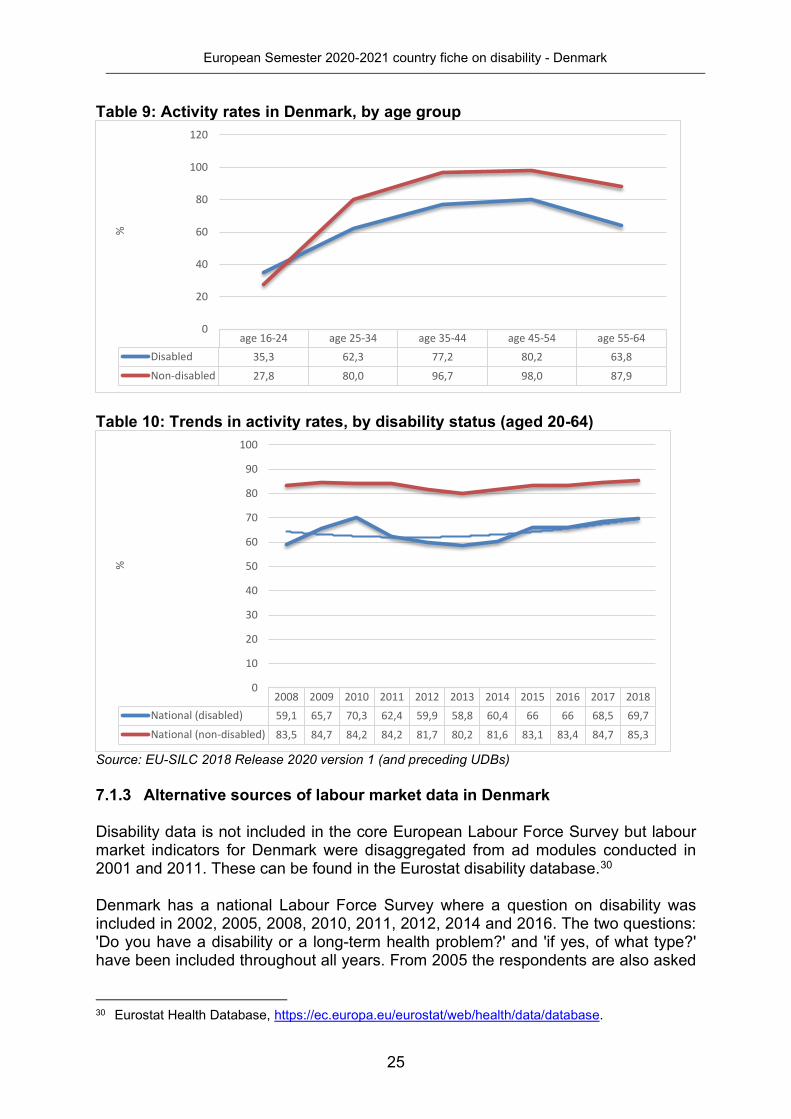
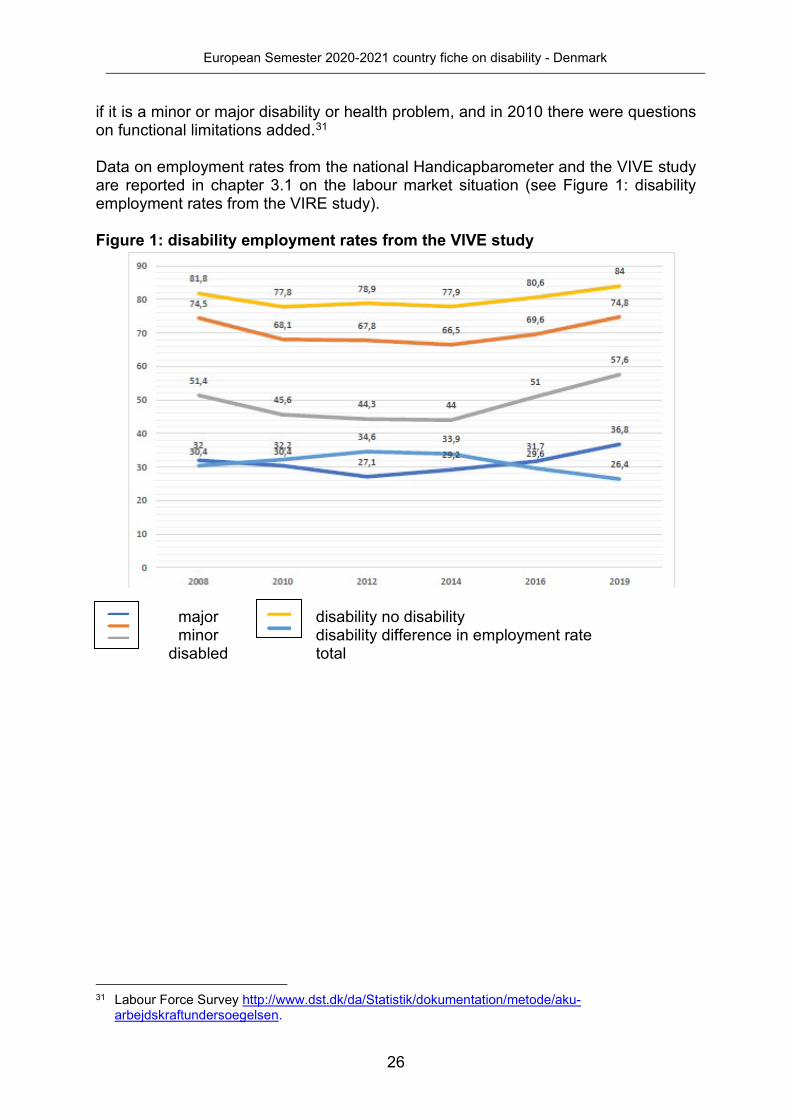
National disability strategies or action plans may also be relevant to these issues in Denmark (Action Plan for Disability Policy, handicappolitiske handlingsplan). 3.1 Summary of the labour market situation of persons with disabilities Data from EU-SILC indicate an employment rate for persons with disabilities in Denmark of 60.9 % in 2018, (approximately 10.1 points above the EU27 average) - compared to 81.0 % for other persons, resulting in an estimated disability employment gap of approximately 20 percentage points (EU27 average gap 24.2, see Tables 2-4). The same data indicate unemployment rates of 12.6 % (disabled) and 5.1 % (non-disabled), respectively in 2018 (see Table 7) and the economic activity rate for persons with disabilities in Denmark was 69.7 %, compared to 85.3 % for other persons (see Tables 8-10). These indications are broken down by gender and age in the respective tables in annex. EU-SILC indicates that employment, especially of people with disabilities, is higher in Denmark than in the EU as a whole. Table 2 in Annex shows employment rates. Employment for men is similar in Denmark as in the EU27, while employment for women is slightly higher in Denmark than in the EU27. Employment is strongly linked to disability. Both for disabled men and for disabled women, employment is higher in Denmark than the EU27 average. For people with severe disabilities, employment has grown dramatically since EU-SILC 2016, which is also shown in the VIVE data (see Figure 1). Employment rates have roughly the same variation with age for people with and without disability, as Table 3 in the Annex shows. For the youngest, the employment rate is the same for the disabled and others, for the group around 30 years it is 15 percentage points less for the disabled, for the group around 40 years the difference is 20 percentage points, and then it rises to 30 for the group around 60 years. Over the years, employment rates for the group with disability have moved with the business cycle in much the same way for the group with and without disability, so that employment for the group with disability has been constantly lower than for the group without disability, as shows table 4 in Annex. For the last few years, however, we see
10
European Semester 2020-2021 country fiche on disability - Denmark
a new trend. Here, employment for the group without disability is constant, while it increases for the group with disability. This is a completely new trend. This result must be taken with caution, but as mentioned earlier, a similar trend may be seen in national studies. Theis mentioned trend is confirmed by the latest release from VIVE on disability and employment.5 This report shows that the financial crisis of 2008 led to a decline in employment for both people with and without disabilities in the years 2008-2012, but that employment thereafter strengthened in both groups in the years 2014-2019. The difference between the two groups became larger as employment fell but has again become smaller after it has increased. The decline in employment in the years 2008-2012 affected people with disabilities more than others, while the increase in employment in the years 2014-2019 was more beneficial for people with disabilities than for others. Or in other words, when employment is high, it implies a higher degree of equality for the group with disabilities. High employment thus benefits people with disabilities. All in all, employment in 2019 is slightly higher than it was in 2008. This applies both to people without disabilities and to the groups with minor and major disabilities. For the group with minor disabilities, however, the growth is slightly smaller, while for the group with greater disabilities it is greater than for the group without disabilities. The VIVE study thus shows that the disability gap for the severely disabled has decreased, while the disability gap for the less disabled has increased since 2008. Seen over a longer period, the development is not as clear as if one only considers the last five years. Since 2002, VIVE (until 2016 SFI) has conducted research on disability and employment, so the conditions are described in detail. The latest publication6 also has an appendix where the situation is mapped in detail for the individual types of disabled people. In addition, a textbook on disability and employment has just been published,7 where the topic is treated both in relation to theory and empirical data. It will probably mean a marked improvement in the knowledge base for the employees in the municipalities' job centres and other places who in practice have to work with the problems in the future. So far, there has been a lack of teaching material for job consultants who dealt with the issue of disability and employment. Unemployment rates are significantly lower for non-disabled than for disabled and for both groups significantly lower in Denmark than the EU27 average, as table 5 in the Annex shows. In contrast, there is almost no difference by gender. Unemployment rates in Denmark for the non-disabled have a clear variation with age (table 6). It is
5 Larsen, M., Jakobsen, V. & Mikkelsen, CH. (2020:41): Handicap og beskæftigelse – Viden til at
understøtte at flere personer med handicap kommer i arbejde. (Disability and employment - Knowledge to support more people with disabilities getting into work). VIVE.
6 Larsen, M., Jakobsen, V. & Mikkelsen, CH. (2020:41): Handicap og beskæftigelse – Viden til at understøtte at flere personer med handicap kommer i arbejde. (Disability and employment - Knowledge to support more people with disabilities getting into work). VIVE.
7 Bredgaard, T., Amby, F., Holt, H. & Thuesen, F. (eds.) 2020: Handicap og beskæftigelse. Fra barrierer til broer. (Disability and employment. From barrieres to bridges). København: Djøf Forlag.

11
European Semester 2020-2021 country fiche on disability - Denmark
much greater for the younger groups than it is for the group over 35. The corresponding variation for the group of disabled is considerably smaller. Here, the unemployment rate remains at a level that is slightly higher than for the younger group without disability. Table 7 in the Annex shows the development since 2008 in unemployment rate. The development has been with an increase to 2013, and then with a decrease, in parallel for the groups with and without disability. In 2016, however, we see a break in the curve for non-disabled, so that the unemployment rate for this group now grows a little and the distance between the two curves becomes smaller. Table 8 in the Annex shows economic activity rates by disability and gender. The picture is roughly the same as we saw in Table 2 with employment rates. Table 9 in the Annex shows activity rates in Denmark by age groups. The picture is roughly the same as we saw in table 3 with employment rates. Table 10 in the Annex shows trends in activity rates by disability status since 2008. Like table 4 with employment, it shows a development that has run in parallel until a few years ago, after which the distance between the groups with and without disability becomes smaller. All in all, the results from EU-SILC 2018 provide a picture that corresponds well with the previous waves of EU-SILC. However, there are indications that the very constant distance between the employment of the groups with and without disabilities, as we have previously reported, has been narrowing as the employment of the group with disabilities (particularly those with more severe disability) is increasing in relation to the employment of the group without disabilities. 3.2 Analysis of labour market policies relevant to the Semester For reference, see also the 2020 National Reform Programme (NRP) for Denmark. Over the past twenty years, changing governments have pursued a policy aimed at getting more people with disabilities into jobs. The number of people in flex jobs has increased from a few thousand to 75,000, various other schemes have been introduced, and a large number of projects have been completed over the years. However, they have not led to more people with disabilities in jobs, compared to people without disabilities (although the employment gap appears now to narrow quite recently). The Commission Country Report for Denmark 2020 mentions on p 29, that ‘A government proposal (October 2018) aims to increase employment among people with significant disabilities, targeting 13,000 persons to find ordinary work or 'flexjobs' by 2025. A total of DKK 128.4 million was earmarked to 11 initiatives for the period 2019-2022, but it remains too early to assess these schemes’. This proposal does not differ significantly from the many other projects that have been launched over the years, and there is no reason to believe that it will accomplish more than them. It is funded by Satspuljen, which has also funded most of the previous projects to get more people with disabilities into employment.
12
European Semester 2020-2021 country fiche on disability - Denmark
However, Satspuljen was abolished in 2019, so if the measures that have been implemented are to be continued, other financing must be obtained. Satspuljen has not only funded projects for the employment of people with disabilities, but also institutions (e.g. the Knowledge Centre for Disability Sports) which have played a major role in this area. A study carried out for the Central Disability Council shows that the greater opportunities for homework, which are a result of the Coronavirus closure, do not benefit people with disabilities.8 The senior officials that answer in the survey say that they are more likely to hire someone working from home after gaining experience with it this year, but only few of them say they are more likely to hire a person with a disability who works from home. The 2020 NRP for Denmark mentions (p. 21) a few initiatives to bring people with disabilities into employment. Five projects receive DKK 14.2 million for work to create employment for people with mental illness.9 One of these projects is the ‘Specialists’, who have already for a number of years provided work for young people with autism who have special abilities to control IT programs. In addition, NRP (p. 21) mentions a competency card for people with disabilities, which is being developed by the National Association of Local Authorities, the Employers' Association, the Trade Unions and the Danish Disability Organisations.10 This competency card should make it easier for municipalities and companies to assess what work the individual is able to perform. These are projects of the type that have been implemented many times in the last two decades. Studies of employment of people with disabilities have shown that, overall, they have not led to the improvement in employment opportunities that they aimed for. However, this does not mean that they have no effect. It is very possible that it is because of them that it has not become more difficult for people with disabilities to get employment. The data from VIVE suggest that there was a big recent increase in employment among people with severe disability.
8 https://dch.dk/nyheder/nyhed/ny-undersoegelse-viser-er-bedre-muligheder-hjemmearbejde-efter-
corona-bare-ikke. 9 https://bm.dk/nyheder-presse/pressemeddelelser/2019/11/millionpulje-skal-hjaelpe-mennesker-
med-psykiske-handicap-i-job/. 10 https://www.dknyt.dk/artikel/kl-skal-udvikle-kompetencekort-til-handicappede-for-satspuljekroner.
13
European Semester 2020-2021 country fiche on disability - Denmark
4 Disability, social policies and healthcare – analysis of the situation and the effectiveness of policies
In 2014, the UN CRPD Committee made the following recommendations to Denmark: Article 28 UN CRPD addresses Adequate standard of living and social protection.
‘59. The Committee recommends that the State party take all necessary measures to significantly increase, as soon as possible, the percentage of persons with disabilities working in the open labour market, including amendments to the general labour legislation so that it imposes clear obligations on employers to afford reasonable accommodation to employees with disabilities.’
Article 19 UN CRPD addresses Living independently in the community.
‘43. The Committee recommends that the State party end the use of State-guaranteed loans to build institution-like residences for persons with disabilities; that it amend the legislation on social services so that persons with disabilities may freely choose where and with whom they live, while enjoying the necessary assistance to live independently; and that it take measures to close existing institution-like residences and to prevent the forced relocation of persons with disabilities, in order to avoid isolation from the community.’
Article 25 UN CRPD addresses Health.
[no recommendation was made to Denmark on this Article] National disability strategies or action plans may also be relevant to these issues in Denmark (Action Plan for Disability Policy). 4.1 Summary of the social situation of persons with disabilities Data from EU-SILC indicate the poverty risk rate for working age persons with disabilities in Denmark was 18.4 % in 2018, compared to 13 % for other persons of similar age - an estimated disability poverty gap of approximately 5 percentage points (see Table 14). For people aged over 65, the disability poverty gap was 1.6 points (10.0 % for older persons with disabilities and 8.4 % for other persons of similar age). The tables in annex also indicate the respective rates of AROPE and break these down by gender as well as age. According to the Handicapbarometer, in 2016, eight per cent of the adults without disabilities had experienced financial deprivation within the last three years, while the proportion of adults with disabilities who had experienced financial deprivation within the last three years was three times as high. EU-SILC paints a picture of employment that is significantly lower for people with disabilities than for other people. At the same time, Denmark emphasizes high employment as a way of creating the economy that is necessary for welfare.
14
European Semester 2020-2021 country fiche on disability - Denmark
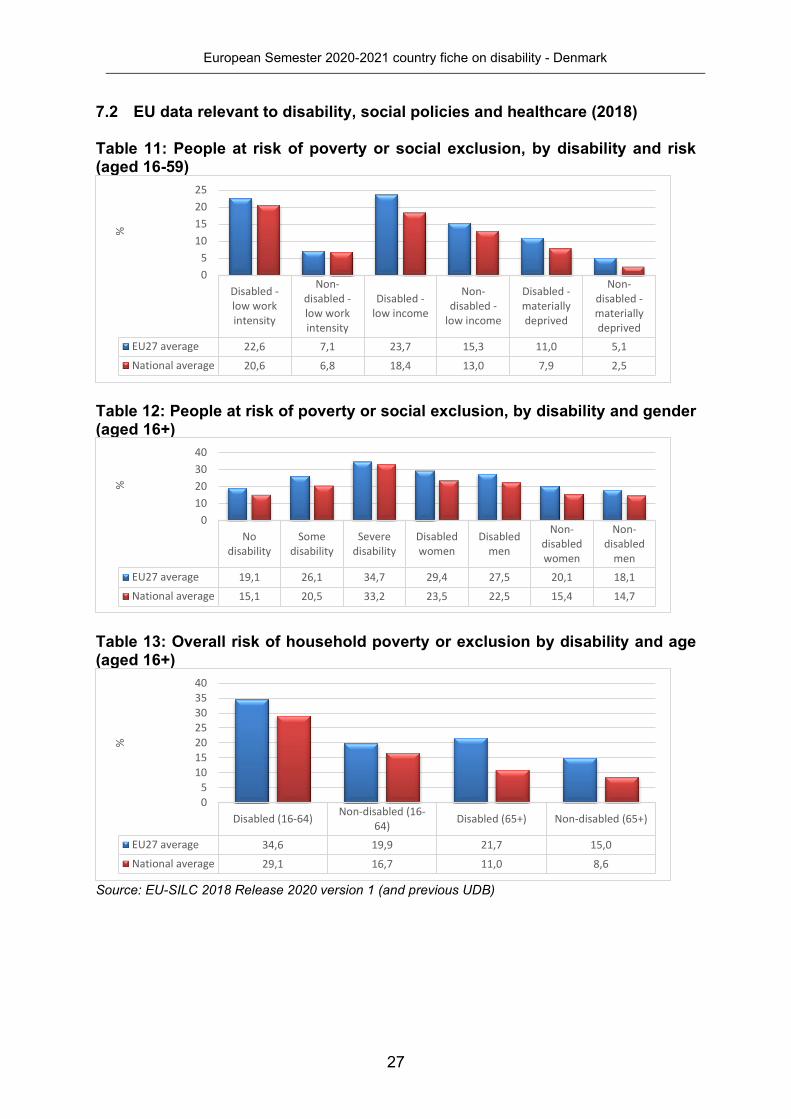
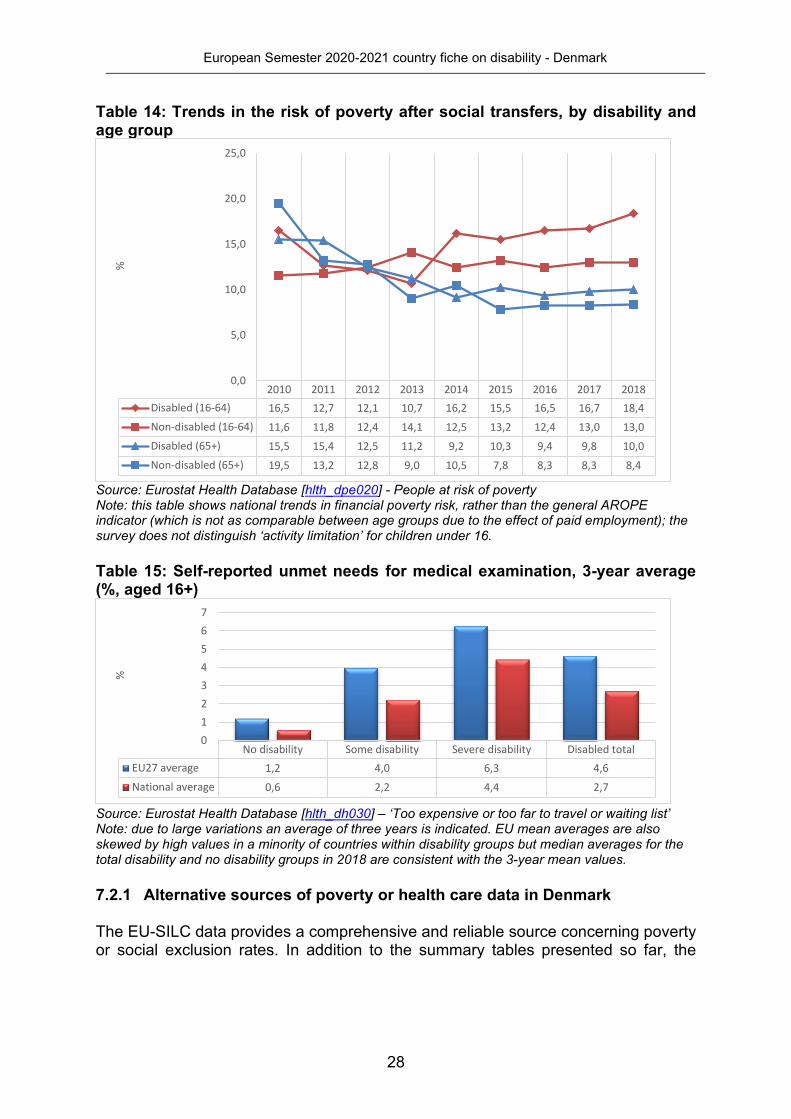
Table 11 in the Annex shows the proportions with low work intensity, with low income and materially deprived. They are all consistently larger for people with disabilities than for other people, both in Denmark and for EU27. The percentages are slightly smaller for Denmark than the EU27 average. The percentages with low work intensity are all smaller than the corresponding percentages were in EU-SILC 2016. The percentages with low income, on the other hand, have increased from EU-SILC 2016, both for Denmark and for the EU27 average. Table 12 in Annex shows people at risk of poverty or social exclusion by disability and gender. The table shows that the risk of poverty is strongly related to the degree of disability. There is also a weak correlation with gender, both for the group with disability and for the group without disability. In all groups, the risk of poverty is slightly lower in Denmark than the EU27 average. The household risk of poverty is strongly linked to disability, it appears from table 13. The household risk of poverty is greater for the group 16-64 years than for the group 65+ years. In all groups, household risk of poverty is lower in Denmark than in EU27 average, especially the difference is large for the group 65+. Table 14 shows trends in risk of poverty after social transfers, by disability and age group. These figures are a better expression of the specific living conditions in the groups than the figures previously shown. Since 2015, the picture has not changed, The risk of poverty has been considerably higher for the group 16-64 years than for the group 65+. And within each of these two groups, the risk of poverty has been higher for disabled than for non-disabled. Self-reported unmet needs for medical examinations from the Eurostat Health database are shown in table 15. The group with unmet needs for medical examinations is significantly larger for people with disabilities, and especially with severe disabilities. The figures for Denmark are significantly lower than the EU27 average, but for the group with severe disability the Danish figure is still above 4 %. The Coronavirus crisis has had major consequences for people with disabilities, is the title of a study11 carried out by Danish disability organisations. It shows that a large group of people with disabilities have had their training or rehabilitation postponed due to Coronavirus, and that in many cases it has affected their ability to function. Some express that the information about the Coronavirus has not been available to them. And a third agree or partially agree that Coronavirus has made them lonelier during the period. 4.2 Analysis of social policies relevant to the Semester For reference, see also the 2020 National Reform Programme (NRP) for Denmark. For decades, economic policy has been based on the principle of creating a large supply of labour in order to achieve a large production that could finance a welfare state. Among other things, this has meant that the threshold for being awarded a
11 https://handicap.dk/nyheder/ny-undersoegelse-coronakrisen-har-haft-store-konsekvenser-
mennesker-med-handicap.
15
European Semester 2020-2021 country fiche on disability - Denmark
disability pension has been raised by reforms in 2003 and 2013. Especially the last reform has made it so difficult to obtain a disability pension that it has provoked criticism from many sides. A law on senior pension from 201912 has made it easier for people who have been in work for at least 25 years and have a maximum of 6 years to old age pension age to receive a pension than it was in the previous law on senior disability pension. Another law currently under consideration, called ‘Arnes tur’,13 will give everyone who has been in work for more than 40 years the right to an old age pension, regardless of health. However, there is still debate as to whether the rules for disability pensions have become too strict. The National Reform Program mentions on page 37 that efforts must be made to make the transition from using schemes for children to using schemes for adults easier for young people with disabilities. This problem has been pointed out for decades and many times sought to be solved by local authorities.14 However, it has proved difficult to do something about, so it is very positive that it now seems that a national effort must be made. Services for people with disabilities are largely provided by the municipality. However, a study conducted by the Central Disability Council, where they have asked a number of questions to the municipal disability councils, shows that the municipal disability policies that are written on paper often are not implemented.15 Only a third of the disability councils surveyed believe that their policy actually helps to improve conditions for the municipality's citizens with disabilities. Only one in four chairmen of municipal disability councils assess that their municipality's disability policy is translated into concrete initiatives, and only every fourth municipality has an action plan attached to their disability policy. Every two years, the government issues a Disability Policy Statement outlining the things that have been done to implement the UNCRPD. Disability Policy Statement 2020 has not yet arrived, so the latest is Disability Policy Statement 2018.16 It deals with awareness-raising and discrimination, independent living, accessibility, education, employment, health, the encounter with the public system, knowledge and data, and international cooperation. However, there has been a change of government since the latest Disability Policy Statement was issued. Disability Policy Report 2018 includes on page 66 a map of Denmark of reversal rates in the social area, which has been published annually since 2017. A high proportion of reversals is a sign that the case processing is not satisfactory. The reversal rate in
12 https://www.retsinformation.dk/eli/lta/2019/1618. 13 Arnes turn, named after a Danish worker who will benefit from this scheme, and who has appeared
in the Social Democrats' election propaganda about it. 14 The organisation of parents of children with learning disabilities, LEV, has prepared a booklet for
parents with guidance on how to tackle the problems, based on experiences that the municipality is often too late to see them; https://www.lev.dk/media/4605/7699_1303_18-aar_juli13_enk_low.pdf.
15 https://dch.dk/nyheder/pressemeddelelse/handicappolitikker-slaar-ikke-til-er-trist-bare-laegges-skuffen.
16 https://www.regeringen.dk/publikationer-og-aftaletekster/handicappolitisk-redegoerelse-2018/.
16
European Semester 2020-2021 country fiche on disability - Denmark
201917 in the adult disability area was 46 %, in the child disability area it was 51 %. It is shown for the individual municipality, and for many municipalities it is over 50 %. The Denmark map of reversal percentages will hopefully prove to be a tool for reducing these percentages. Disability Policy Report 201618 mentions on page 32 quite briefly that the previous municipal supervision of institutions for people with disabilities has been replaced by five inspectorate authorities (Socialtilsyn), supported by guidance and quality control from the National Board of Health and Welfare. These are responsible for approving and conducting operation-oriented supervision of social services. It may seem like a small change that the supervision of institutions is being moved from one authority to another. However, the annual reports of the five social services have shown that this reform has led to a significant development in the quality of the service offered. Thus, there has been more focus on the use of force, both in the way that in several cases it is reported as required by law (and therefore it may look as if there has been a growth in the use of force), and in the way that methods are taken in use in order to reduce the use of force in the institutions. For example, the Annual Report 2019 from Socialtilsyn Hovedstaden19 states: ‘As the social inspections have existed for several years, we have also become better at spotting quality deficiencies and inappropriate patterns in the daily operation of the offers’. The Danish Social Insurance Agency has therefore set up a knowledge team to collect and disseminate knowledge across the organisation with a view to strengthening the supervisory professionalism. The Danish social protection is largely based on social administrations estimating how great the need is and is provided to a large extent in the form of service. For both of these things, the rights of the citizen are unclear, and the situation of the citizen is in the hands of front-line staff. For these types of services, it is difficult to determine whether staff are asserting inappropriate power and discretion or treating the citizen badly. It is therefore crucial that control mechanisms are developed that can secure the citizen's rights. The municipalities are developing service standards that look very convincing, but if the municipalities themselves have to control whether they are complied with, there will be a risk that they will only have a small significance. Regarding the use of State-guaranteed loans to build institution-like residences for persons with disabilities, no change has taken place. LEV, the organisation of parents of people with developmental disabilities, has for years opposed this practice, but the authorities have done nothing to change the situation. Finally, it is clear that initiating as much activity as the effort against the Coronavirus has been, cannot happen without it having to affect other ongoing activities in society, such as the treatment of other diseases. A consequence of the extensive Coronavirus efforts has therefore been that a number of other activities in the health area have
17 https://sim.dk/danmarkskort/2020/jun/omgoerelsesprocenter-paa-socialomraadet-i-2019/. 18 https://sim.dk/media/28858/handicappolitisk-redegoerelse_endelig.pdf. 19
https://socialtilsyn.frederiksberg.dk/sites/default/files/node/field_files/ %C3 %85rsrapport %20- %20kort %20udgave %20.pdf.
17
European Semester 2020-2021 country fiche on disability - Denmark
been given lower priority. This re-prioritization has also affected people with disabilities, as shown by the study mentioned above.20
20 https://handicap.dk/nyheder/ny-undersoegelse-coronakrisen-har-haft-store-konsekvenser-
mennesker-med-handicap.

18
European Semester 2020-2021 country fiche on disability - Denmark
5 Disability, education and skills – analysis of the situation and the effectiveness of policies
In 2014, the UN CRPD Committee made the following recommendations to Denmark: Article 24 UN CRPD addresses Education.
‘53. The Committee recommends that the State party amend its legislation to ensure the inclusion of all children with disabilities in the mainstream education system, with adequate support and accommodation, in particular through the provision of adequate training to teachers and other employees in the school system in all parts of the Kingdom of Denmark, in order to ensure quality education for pupils with disabilities. The State party should take measures to address discrepancies in accomplishment rates between pupils with and without disabilities at all levels of education. 55. The Committee recommends that the State party amend its legislation to ensure that all children with disabilities can submit a complaint to an independent authority if they do not receive adequate educational support.’
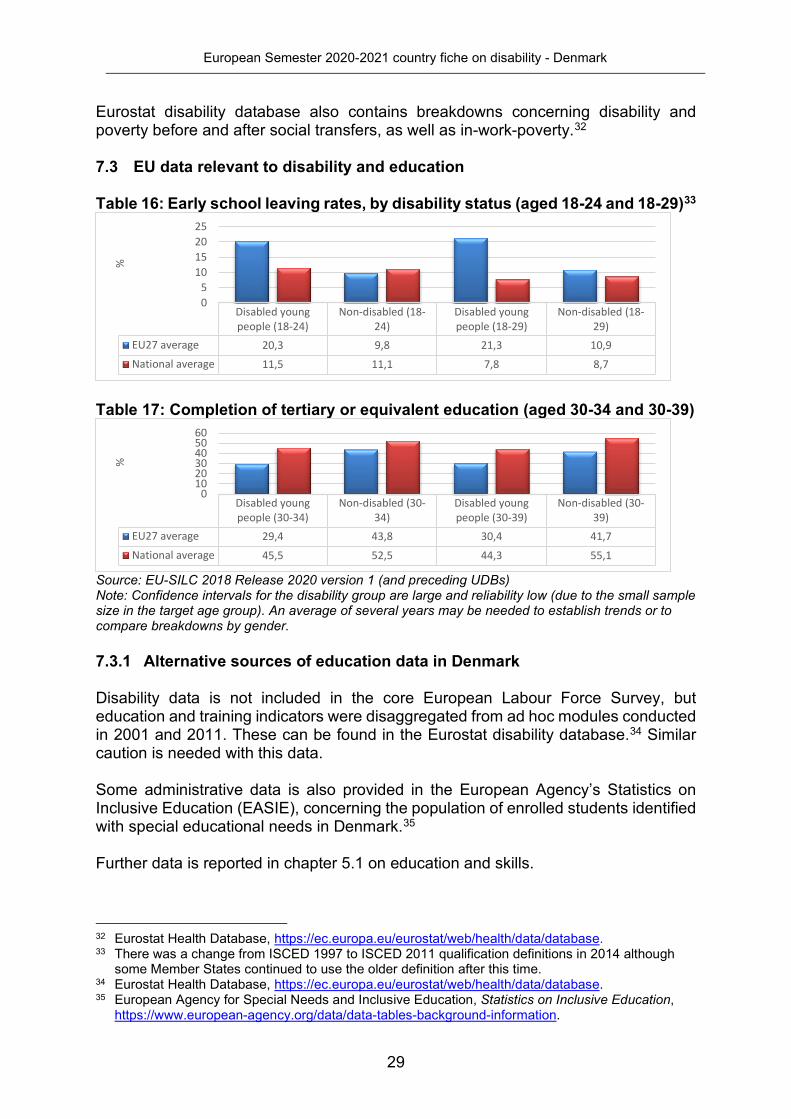
National disability strategies or action plans may also be relevant to these issues in Denmark (The Action Plan for Disability Policy). 5.1 Summary of the educational situation of persons with disabilities EU-SILC shows that people with disabilities receive schooling and higher education to a much greater extent in Denmark than is the case in the other EU countries. Table 16 in Annex shows early school leaving rates by disability status. For EU27, early school leaving rates are significantly higher for disabled young people than for non-disabled. Table 17 in Annex shows completion of tertiary education after disability. There are fewer who receive a tertiary education in the group with disability than in the group without disability. All figures are larger for Denmark than the EU27 average. In general, there has been a positive development in the field of education over the past ten years, as shown by analyses from Statistics Denmark.21 The proportion of the population between 18 and 64 years without education has been steadily declining from 30 to 25 %. Several young people have received upper secondary education, and a larger proportion of them have been in upper secondary school, while a smaller proportion has been vocational. More have gone on and have received a higher education, while fewer have received a vocational education. The growth in education has been far greater for young people with parents with the lowest incomes than it has for parents with higher incomes. In the group that does not have an education, there is a much larger proportion without work than there is in the group with education. There are no new statistics that shed light on how the group of people with disabilities follows this positive development. But the latest figures, which are from the Handicapbarometer 2016, show that the group with disabilities followed the reduction in the number of early school leavers but did not follow the positive development in the
21 https://www.dst.dk/da/Statistik/emner/uddannelse-og-viden/befolkningens-uddannelsesstatus.
19
European Semester 2020-2021 country fiche on disability - Denmark
number who received a tertiary education. Here, on the contrary, the development was negative for the group with disabilities. 5.2 Analysis of education policies relevant to the Semester For reference, see also the 2020 National Reform Programme (NRP) for Denmark. The NRP mentions on page 30 that ‘in 2018, the education drop-out rate among 18-24-year-olds was 10.2 per cent, while 49.1 per cent of 30-34-year-olds had completed a higher education program or equivalent’. The increase in education drop-out rate since the previous year is explained by the fact that the employment of young people has increased significantly. By 2018, it had become so easy for young people to get a job that a large group chose this rather than going into an education. In this connection, it should be noted that if young people do not get a job in Denmark, the public system as a condition for them to receive a benefit will require them to start an education. This group, which previously entered education without it being completely voluntary, will thus not enter education in a situation where there is work for everyone. This means that a larger proportion of young people choose to take a job rather than start an education. However, it is not certain that young people have chosen the education route to a greater extent before. The higher number in education in the past was not necessarily an indication that the young people themselves wanted to get an education, a part of it had to do with the fact that they applied for support. The NRP does not address the question of how large the drop-out rate is for people with disabilities or how many people with disabilities have completed higher education. The Handicapbarometer showed that the group with disabilities had significantly more early school leavers in 2016. It also showed that in terms of higher education, the development of the group of people with disabilities went in the wrong direction. However, a study from 201922 sheds light on how students with disabilities experience the various accessibility reforms that have been implemented and what they mean to them. It turns out that students with disabilities still experience barriers. They often choose other studies than they would like, the drop-out rate is higher, and they are delayed in their studies. They generally experience physical accessibility as good. The special educational support that many of them are receiving is of great importance for them to be able to complete their studies, and the same applies to the special financial support (disability SU). Most students with disabilities believe they will be able to complete an internship in line with other students, but they lack more guidance in this regard. Disability Policy Report 201823 addresses, among other things (p. 34) ‘strengthening inclusive learning environments in primary and lower secondary school’. This is an issue that has been relevant since the reform with increased inclusion in primary school from 2012, and which will probably be for a long time to come.
22 http://taenkperspektiv.dk/noedvendigt-for-nogle-godt-for-alle/. 23 https://www.regeringen.dk/publikationer-og-aftaletekster/handicappolitisk-redegoerelse-2018/.
20
European Semester 2020-2021 country fiche on disability - Denmark
6 Investment priorities in relation to disability 6.1 Updates on use of existing EU funds (to 2020) The European Social Fund mentions on its website24 16 projects in Denmark, most of which have been completed while some are still in progress. One of these is relevant to the group of people with disabilities. It is the project ‘Rummelig I Midt’ (Spacious in Midt), which has formed a network of more than 100 companies in region Midtjylland with the aim of helping people on the edge of the labour market in jobs. The project runs from 2015 to 2021 with a budget of EUR 7.4 million, of which the EU contributes with the 3.7, where they will help a total of 800 participants in jobs. 6.2 Priorities for future investment (after 2020) The 2020 Commission Country Report for Denmark Annex D states that the Fund for Fair Transformation (Fonden for Retfærdig Omstilling) must concentrate its efforts in Denmark on restructuring cement production in North Jutland and partly replace it with other and less CO2-producing activity. Cement production is the activity in Denmark that presents the greatest challenges in relation to the development towards CO2 neutrality in 2050. The 2020 Commission analysis also refers, in general, to the need for upskilling and reskilling of workers, where some specific reference to the needs of persons with disabilities is also needed. The new framework for EU investment priorities will focus on the first two of its priorities, a Smarter Europe, a Greener, carbon free Europe, a more Connected Europe, a more Social Europe, a Europe closer to the citizens. Of the five priorities, a more Social Europe is most relevant to the group of people with disabilities. The first two priorities mean, for example, more use of video conferencing instead of travel, which will relatively benefit the group with disabilities. It will be important to stimulate the development of disability aids, including digital aids. The technical development has provided many opportunities, and the Danish business structure with many smaller companies is particularly suitable for taking up such productions. However, there is not enough research within the smaller companies, so a public effort is needed.
24 https://ec.europa.eu/esf/main.jsp?catId=46&langId=en&list=1&theme=0&country=376&keywords.
21
European Semester 2020-2021 country fiche on disability - Denmark
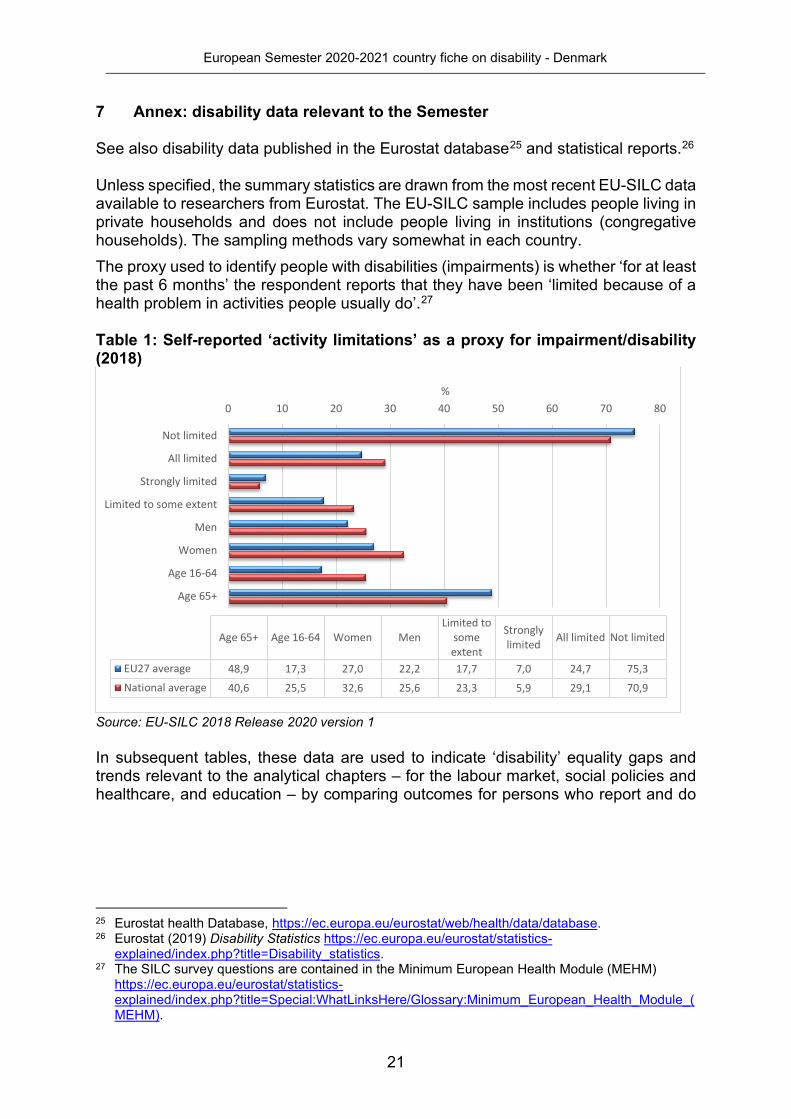
7 Annex: disability data relevant to the Semester See also disability data published in the Eurostat database25 and statistical reports.26 Unless specified, the summary statistics are drawn from the most recent EU-SILC data available to researchers from Eurostat. The EU-SILC sample includes people living in private households and does not include people living in institutions (congregative households). The sampling methods vary somewhat in each country. The proxy used to identify people with disabilities (impairments) is whether ‘for at least the past 6 months’ the respondent reports that they have been ‘limited because of a health problem in activities people usually do’.27 Table 1: Self-reported ‘activity limitations’ as a proxy for impairment/disability (2018)
Source: EU-SILC 2018 Release 2020 version 1 In subsequent tables, these data are used to indicate ‘disability’ equality gaps and trends relevant to the analytical chapters – for the labour market, social policies and healthcare, and education – by comparing outcomes for persons who report and do
25 Eurostat health Database, https://ec.europa.eu/eurostat/web/health/data/database. 26 Eurostat (2019) Disability Statistics https://ec.europa.eu/eurostat/statistics-
explained/index.php?title=Disability_statistics. 27 The SILC survey questions are contained in the Minimum European Health Module (MEHM)
https://ec.europa.eu/eurostat/statistics-explained/index.php?title=Special:WhatLinksHere/Glossary:Minimum_European_Health_Module_(MEHM).
0 10 20 30 40 50 60 70 80
Not limited
All limited
Strongly limited
Limited to some extent
Men
Women
Age 16-64
Age 65+
%
Not limitedAll limitedStronglylimited
Limited tosomeextent
MenWomenAge 16-64Age 65+
EU27 average 75,324,77,017,722,227,017,348,9National average 70,929,15,923,325,632,625,540,6
22
European Semester 2020-2021 country fiche on disability - Denmark
not report ‘activity limitations’.28 National estimates for Denmark are compared with EU27 mean averages for the most recent year.29 7.1 EU data relevant to disability and the labour market (2018) Table 2: Employment rates, by disability and gender (aged 20-64)
Table 3: Employment rates in Denmark, by disability and age group
28 This methodology was developed in the annual statistical reports of ANED, available at
http://www.disability-europe.net/theme/statistical-indicators. 29 The exit of the United Kingdom from the EU changes the EU average. Averages were also
affected in 2015 by a discontinuity in the German disability data due to a definitional change.
Nodisability
Somedisability
Severedisability
Disabledwomen
Disabledmen
Non-disabledwomen
Non-disabled
men
Disabledtotal
EU27 average 75,0 58,3 28,7 47,8 54,3 68,8 81,2 50,8National average 81,0 65,6 42,8 56,8 66,3 79,5 82,2 60,9
0102030405060708090
%
age 16-24* age 25-34 age 35-44 age 45-54 age 55-64Disabled 30,0 54,5 69,1 70,5 54,8Non-disabled 25,0 72,0 93,2 96,0 84,1
0102030405060708090
100110
%
23
European Semester 2020-2021 country fiche on disability - Denmark
Table 4: National trends in employment rates, by disability status (aged 20-64)
Source: EU-SILC 2018 Release 2020 version 1 (and preceding UDBs) 7.1.1 Unemployment Table 5: Unemployment rates by disability and gender (aged 20-64)
Table 6: Unemployment rates in Denmark, by disability and age group
2008 2009 2010 2011 2012 2013 2014 2015 2016 2017 2018National (disabled) 52,9 56,3 56,0 53,3 49,7 49,7 50,6 56,1 55,9 57,7 60,9National (non-disabled) 81,3 81,1 78,9 78,4 75,3 74,1 76,7 78,3 80 80,8 80,95
20,0
30,0
40,0
50,0
60,0
70,0
80,0
90,0%
Disabledwomen
Disabledmen
Non-disabledwomen
Non-disabledmen
Disabledtotal
Non-disabledtotal
EU27 average 18,3 18,9 9,4 8,2 18,6 8,8National average 12,8 12,4 5,2 4,9 12,6 5,1
02468
101214161820
%
age 16-24 age 25-34 age 35-44 age 45-54 age 55-64Disabled 15,0 12,6 10,5 12,1 14,1Non-disabled 10,1 10,0 3,6 2,0 4,3
0
5
10
15
20
25
30
35
40
%
24
European Semester 2020-2021 country fiche on disability - Denmark
Table 7: National trends in unemployment rate, by disability status (aged 20-64)
Source: EU-SILC 2018 Release 2020 version 1 (and preceding UDBs) 7.1.2 Economic activity Table 8: Economic activity rates, by disability and gender (aged 20-64)
2008 2009 2010 2011 2012 2013 2014 2015 2016 2017 2018National (disabled) 10,4 14,4 20,4 14,6 17,1 15,4 16,2 15,0 15,3 15,8 12,6National (non-disabled) 2,7 4,3 6,3 6,9 7,9 7,6 6 5,8 4 4,7 5,1
0,0
5,0
10,0
15,0
20,0
25,0
30,0
35,0
40,0%
Disabledwomen
Disabledmen
Non-disabledwomen
Non-disabledmen
Disabledtotal
Non-disabledtotal
EU27 average 58,5 66,9 75,9 88,5 62,4 82,2National average 65,1 75,7 83,9 86,5 69,7 85,3
0102030405060708090
100
%
25
European Semester 2020-2021 country fiche on disability - Denmark
Table 9: Activity rates in Denmark, by age group
Table 10: Trends in activity rates, by disability status (aged 20-64)
Source: EU-SILC 2018 Release 2020 version 1 (and preceding UDBs) 7.1.3 Alternative sources of labour market data in Denmark Disability data is not included in the core European Labour Force Survey but labour market indicators for Denmark were disaggregated from ad modules conducted in 2001 and 2011. These can be found in the Eurostat disability database.30 Denmark has a national Labour Force Survey where a question on disability was included in 2002, 2005, 2008, 2010, 2011, 2012, 2014 and 2016. The two questions: 'Do you have a disability or a long-term health problem?' and 'if yes, of what type?' have been included throughout all years. From 2005 the respondents are also asked
30 Eurostat Health Database, https://ec.europa.eu/eurostat/web/health/data/database.
age 16-24 age 25-34 age 35-44 age 45-54 age 55-64Disabled 35,3 62,3 77,2 80,2 63,8Non-disabled 27,8 80,0 96,7 98,0 87,9
0
20
40
60
80
100
120%
2008 2009 2010 2011 2012 2013 2014 2015 2016 2017 2018National (disabled) 59,1 65,7 70,3 62,4 59,9 58,8 60,4 66 66 68,5 69,7National (non-disabled) 83,5 84,7 84,2 84,2 81,7 80,2 81,6 83,1 83,4 84,7 85,3
0
10
20
30
40
50
60
70
80
90
100
%
26
European Semester 2020-2021 country fiche on disability - Denmark
if it is a minor or major disability or health problem, and in 2010 there were questions on functional limitations added.31 Data on employment rates from the national Handicapbarometer and the VIVE study are reported in chapter 3.1 on the labour market situation (see Figure 1: disability employment rates from the VIRE study). Figure 1: disability employment rates from the VIVE study
major disability no disability minor disability difference in employment rate
disabled total
31 Labour Force Survey http://www.dst.dk/da/Statistik/dokumentation/metode/aku-
arbejdskraftundersoegelsen.
27
European Semester 2020-2021 country fiche on disability - Denmark
7.2 EU data relevant to disability, social policies and healthcare (2018) Table 11: People at risk of poverty or social exclusion, by disability and risk (aged 16-59)
Table 12: People at risk of poverty or social exclusion, by disability and gender (aged 16+)
Table 13: Overall risk of household poverty or exclusion by disability and age (aged 16+)
Source: EU-SILC 2018 Release 2020 version 1 (and previous UDB)
Disabled -low workintensity
Non-disabled -low workintensity
Disabled -low income
Non-disabled -
low income
Disabled -materiallydeprived
Non-disabled -materiallydeprived
EU27 average 22,6 7,1 23,7 15,3 11,0 5,1National average 20,6 6,8 18,4 13,0 7,9 2,5
05
10152025
%
Nodisability
Somedisability
Severedisability
Disabledwomen
Disabledmen
Non-disabledwomen
Non-disabled
menEU27 average 19,1 26,1 34,7 29,4 27,5 20,1 18,1National average 15,1 20,5 33,2 23,5 22,5 15,4 14,7
010203040
%
Disabled (16-64) Non-disabled (16-64) Disabled (65+) Non-disabled (65+)
EU27 average 34,6 19,9 21,7 15,0National average 29,1 16,7 11,0 8,6
05
10152025303540
%
28
European Semester 2020-2021 country fiche on disability - Denmark
Table 14: Trends in the risk of poverty after social transfers, by disability and age group
Source: Eurostat Health Database [hlth_dpe020] - People at risk of poverty Note: this table shows national trends in financial poverty risk, rather than the general AROPE indicator (which is not as comparable between age groups due to the effect of paid employment); the survey does not distinguish ‘activity limitation’ for children under 16. Table 15: Self-reported unmet needs for medical examination, 3-year average (%, aged 16+)
Source: Eurostat Health Database [hlth_dh030] – ‘Too expensive or too far to travel or waiting list’ Note: due to large variations an average of three years is indicated. EU mean averages are also skewed by high values in a minority of countries within disability groups but median averages for the total disability and no disability groups in 2018 are consistent with the 3-year mean values. 7.2.1 Alternative sources of poverty or health care data in Denmark The EU-SILC data provides a comprehensive and reliable source concerning poverty or social exclusion rates. In addition to the summary tables presented so far, the
2010 2011 2012 2013 2014 2015 2016 2017 2018Disabled (16-64) 16,5 12,7 12,1 10,7 16,2 15,5 16,5 16,7 18,4Non-disabled (16-64) 11,6 11,8 12,4 14,1 12,5 13,2 12,4 13,0 13,0Disabled (65+) 15,5 15,4 12,5 11,2 9,2 10,3 9,4 9,8 10,0Non-disabled (65+) 19,5 13,2 12,8 9,0 10,5 7,8 8,3 8,3 8,4
0,0
5,0
10,0
15,0
20,0
25,0
%
No disability Some disability Severe disability Disabled totalEU27 average 1,2 4,0 6,3 4,6National average 0,6 2,2 4,4 2,7
01234567
%
29
European Semester 2020-2021 country fiche on disability - Denmark
Eurostat disability database also contains breakdowns concerning disability and poverty before and after social transfers, as well as in-work-poverty.32 7.3 EU data relevant to disability and education Table 16: Early school leaving rates, by disability status (aged 18-24 and 18-29)33
Table 17: Completion of tertiary or equivalent education (aged 30-34 and 30-39)
Source: EU-SILC 2018 Release 2020 version 1 (and preceding UDBs) Note: Confidence intervals for the disability group are large and reliability low (due to the small sample size in the target age group). An average of several years may be needed to establish trends or to compare breakdowns by gender. 7.3.1 Alternative sources of education data in Denmark Disability data is not included in the core European Labour Force Survey, but education and training indicators were disaggregated from ad hoc modules conducted in 2001 and 2011. These can be found in the Eurostat disability database.34 Similar caution is needed with this data. Some administrative data is also provided in the European Agency’s Statistics on Inclusive Education (EASIE), concerning the population of enrolled students identified with special educational needs in Denmark.35 Further data is reported in chapter 5.1 on education and skills.
32 Eurostat Health Database, https://ec.europa.eu/eurostat/web/health/data/database. 33 There was a change from ISCED 1997 to ISCED 2011 qualification definitions in 2014 although
some Member States continued to use the older definition after this time. 34 Eurostat Health Database, https://ec.europa.eu/eurostat/web/health/data/database. 35 European Agency for Special Needs and Inclusive Education, Statistics on Inclusive Education,
https://www.european-agency.org/data/data-tables-background-information.
Disabled youngpeople (18-24)
Non-disabled (18-24)
Disabled youngpeople (18-29)
Non-disabled (18-29)
EU27 average 20,3 9,8 21,3 10,9National average 11,5 11,1 7,8 8,7
05
10152025
%
Disabled youngpeople (30-34)
Non-disabled (30-34)
Disabled youngpeople (30-39)
Non-disabled (30-39)
EU27 average 29,4 43,8 30,4 41,7National average 45,5 52,5 44,3 55,1
0102030405060
%
GETTING IN TOUCH WITH THE EU
In person All over the European Union there are hundreds of Europe Direct information centres. You can find the address of the centre nearest you at: https://europa.eu/european-union/contact_en. On the phone or by email Europe Direct is a service that answers your questions about the European Union. You can contact this service: – by freephone: 00 800 6 7 8 9 10 11 (certain operators may charge for these calls), – at the following standard number: +32 22999696, or – by email via: https://europa.eu/european-union/contact_en.
FINDING INFORMATION ABOUT THE EU Online Information about the European Union in all the official languages of the EU is available on the Europa website at: https://europa.eu/european- union/index_en. EU publications You can download or order free and priced EU publications from: https://publications.europa.eu/en/publications. Multiple copies of free publications may be obtained by contacting Europe Direct or your local information centre (see https://europa. eu/european-union/contact_en). EU law and related documents For access to legal information from the EU, including all EU law since 1951 in all the official language versions, go to EUR-Lex at: http://eur- lex.europa.eu. Open data from the EU The EU Open Data Portal (http://data.europa.eu/euodp/en) provides access to datasets from the EU. Data can be downloaded and reused for free, for both commercial and non-commercial purposes.