demographics & trends i mkt 750 dr. west. agenda looking back… how can target leverage its...
TRANSCRIPT
Demographics & Trends I
MKT 750Dr. West
Agenda
Looking back…How can Target leverage its brand?Fixing behavioral segmentation
Snapshot of Demographic Trends Fads versus Trends
Examples of each How to tell them apart? How can we identify trends?

Food for thought
Who are ‘s current and potential customers? (age, income, lifestyle)Why do they prefer to its competitors?How well is positioned relative to its competitors?How can leverage its brand?
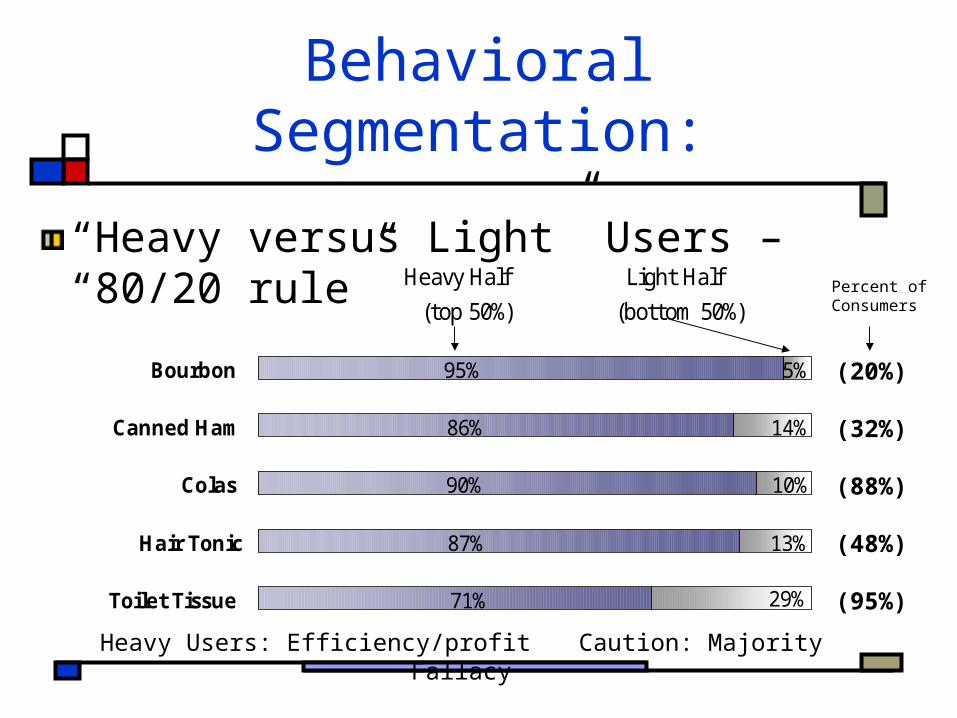
Behavioral Segmentation:
“Heavy versus Light” Users – “80/20 rule” Heavy Half Light Half
(top 50%) (bottom 50%)
5%95%
86%
90%
87%
71%
14%
10%
13%
29%Toilet Tissue
Hair Tonic
Colas
Canned Ham
Bourbon
Heavy Users: Efficiency/profit Caution: Majority Fallacy
(20%)
(32%)
(88%)
(48%)
(95%)
Percent of Consumers
Forecasting Requires:
Understanding the past
Monitoring demographic shifts
Anticipating trends
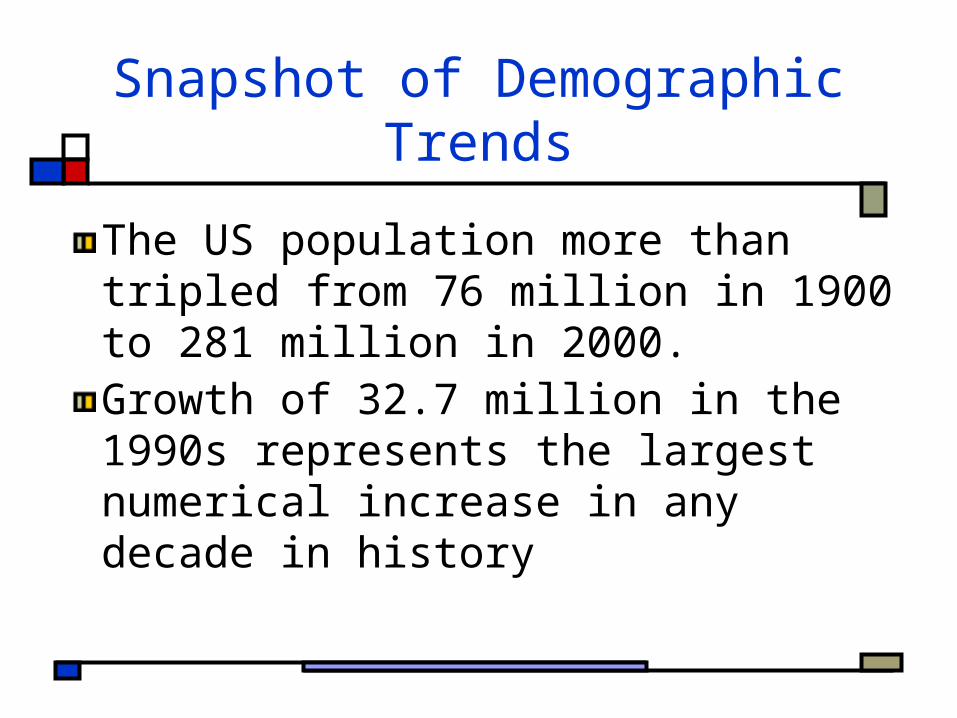
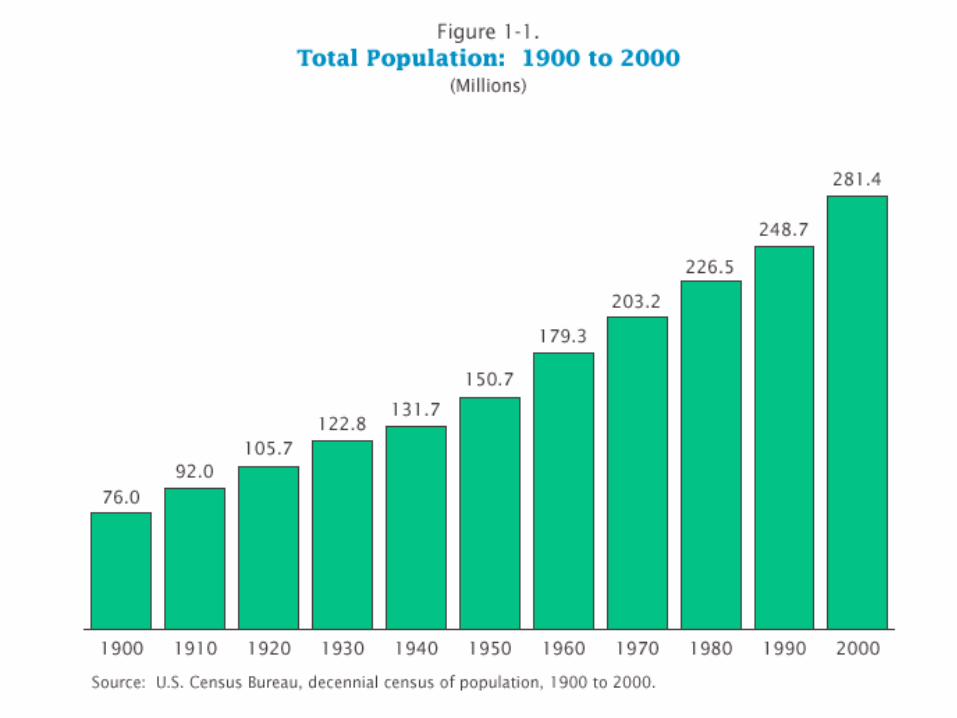
Snapshot of Demographic Trends
The US population more than tripled from 76 million in 1900 to 281 million in 2000.Growth of 32.7 million in the 1990s represents the largest numerical increase in any decade in history
Snapshot of Demographic Trends
Snapshot of Demographic Trends
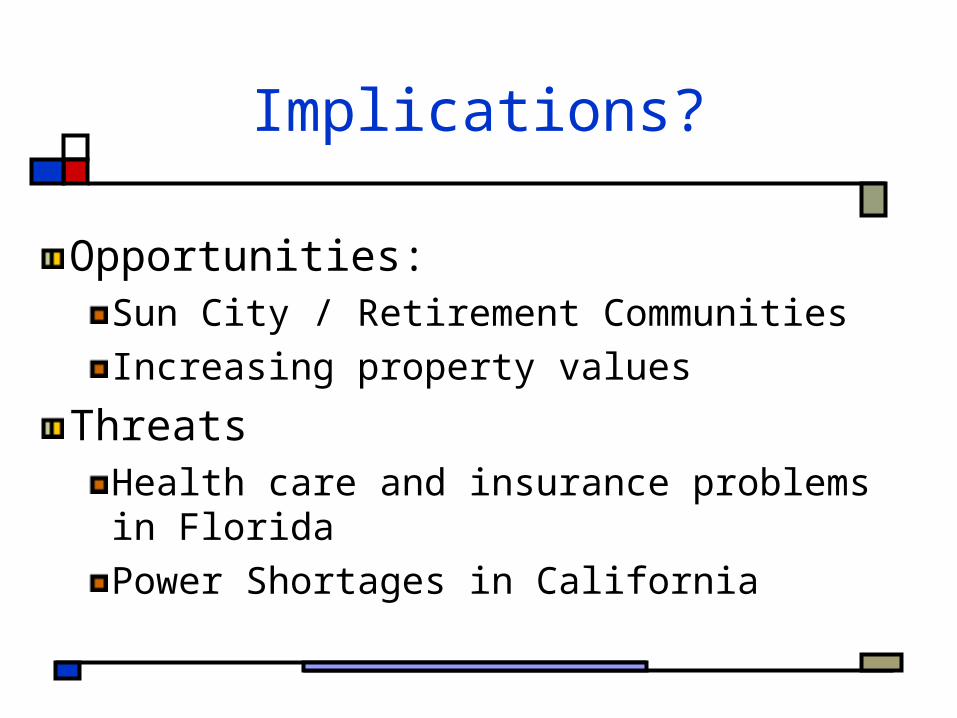
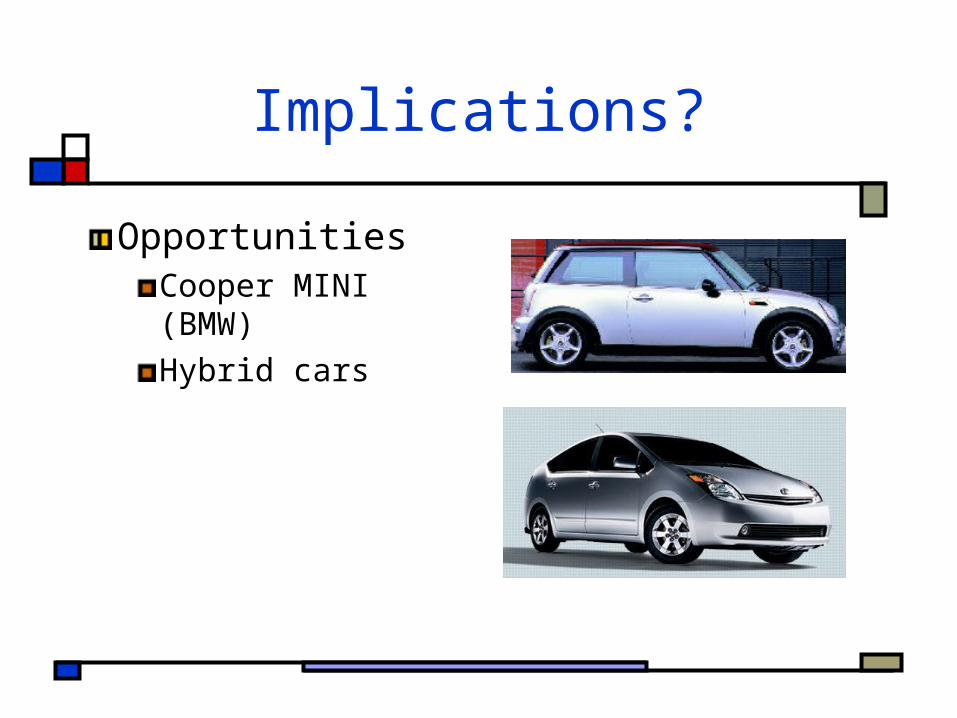
Implications?
Opportunities:Sun City / Retirement Communities Increasing property values
ThreatsHealth care and insurance problems in FloridaPower Shortages in California

Snapshot of Demographic Trends
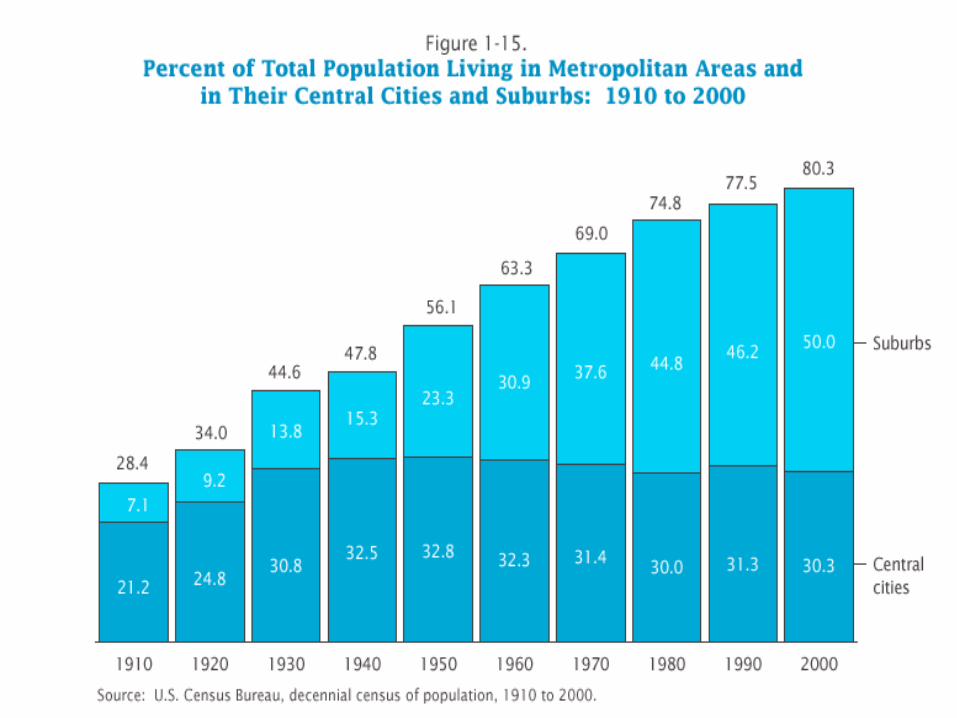
The US population grew increasingly metropolitan, from 28 percent in 1910 to 80 percent in 2000. The suburbs, rather than central cities accounted for most of the growth
By 2000 half of the population lived in suburban areas.

Snapshot of Demographic Trends
Implications?
OpportunitiesCooper MINI (BMW)Hybrid cars
Snapshot of Demographic Trends
Snapshot of Demographic Trends
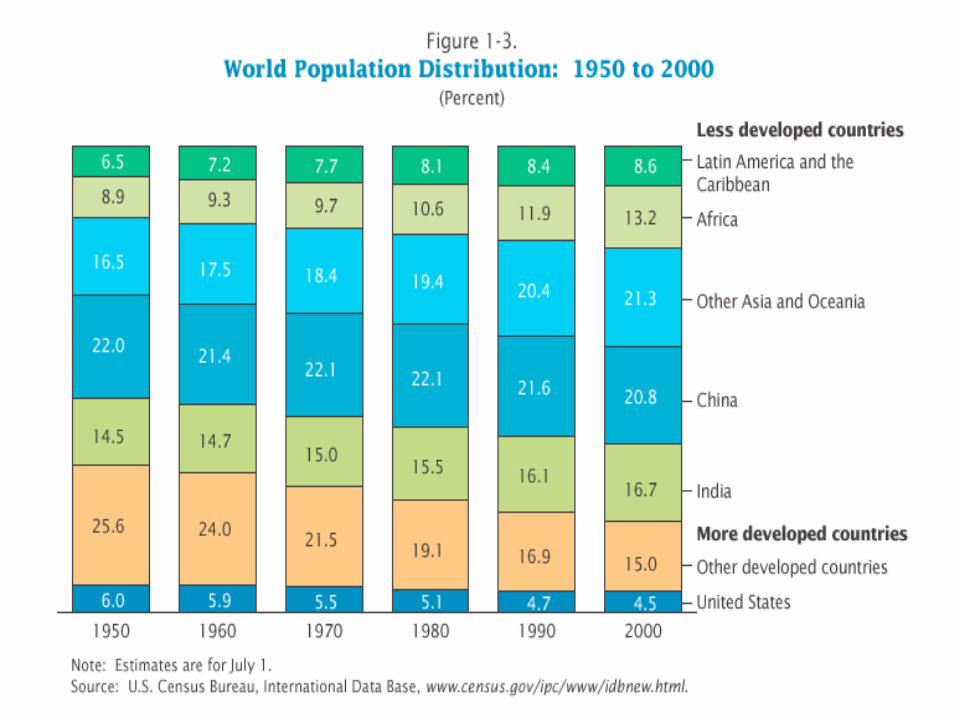
Less developed countries represent 80.5 percent of the global population, this is up from 68 percent in 1950.
Snapshot of Demographic Trends
Implications?
Opportunities:New markets
ThreatsLacking infrastructure
Snapshot of Demographic Trends
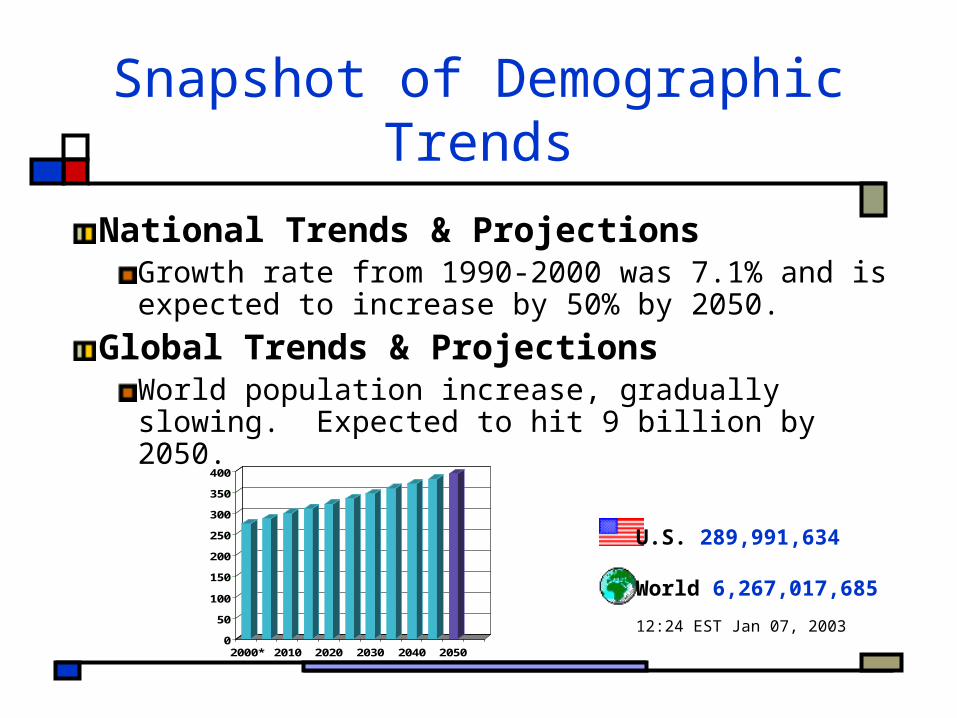
National Trends & ProjectionsGrowth rate from 1990-2000 was 7.1% and is expected to increase by 50% by 2050.
Global Trends & ProjectionsWorld population increase, gradually slowing. Expected to hit 9 billion by 2050.
0
50
100
150
200
250
300
350
400
2000* 2010 2020 2030 2040 2050
U.S. 289,991,634
World 6,267,017,685
12:24 EST Jan 07, 2003
Snapshot of Demographic Trends
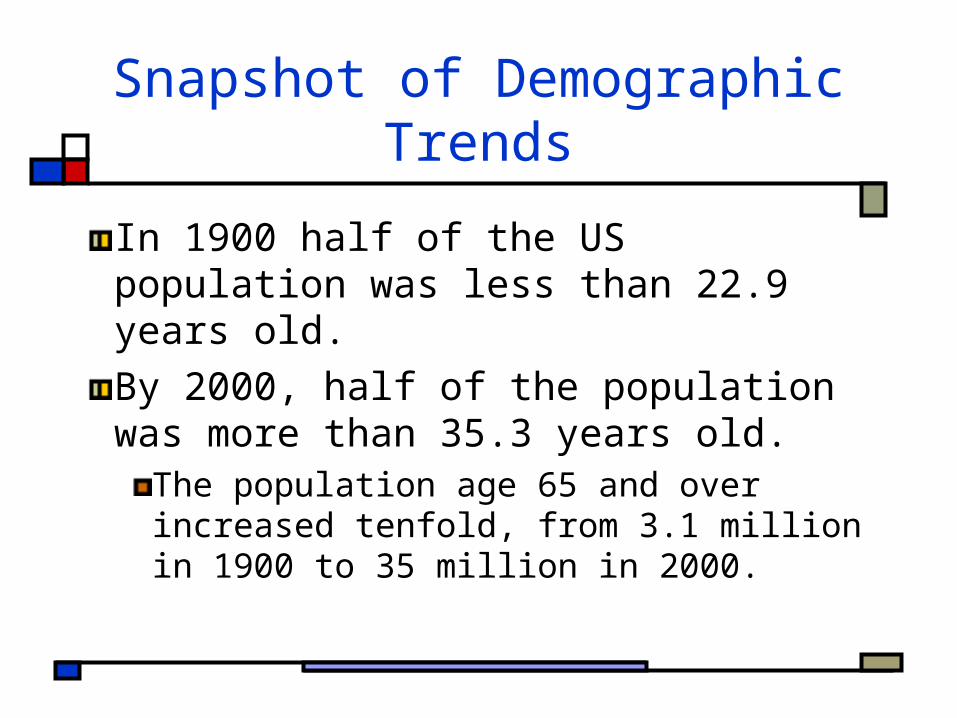
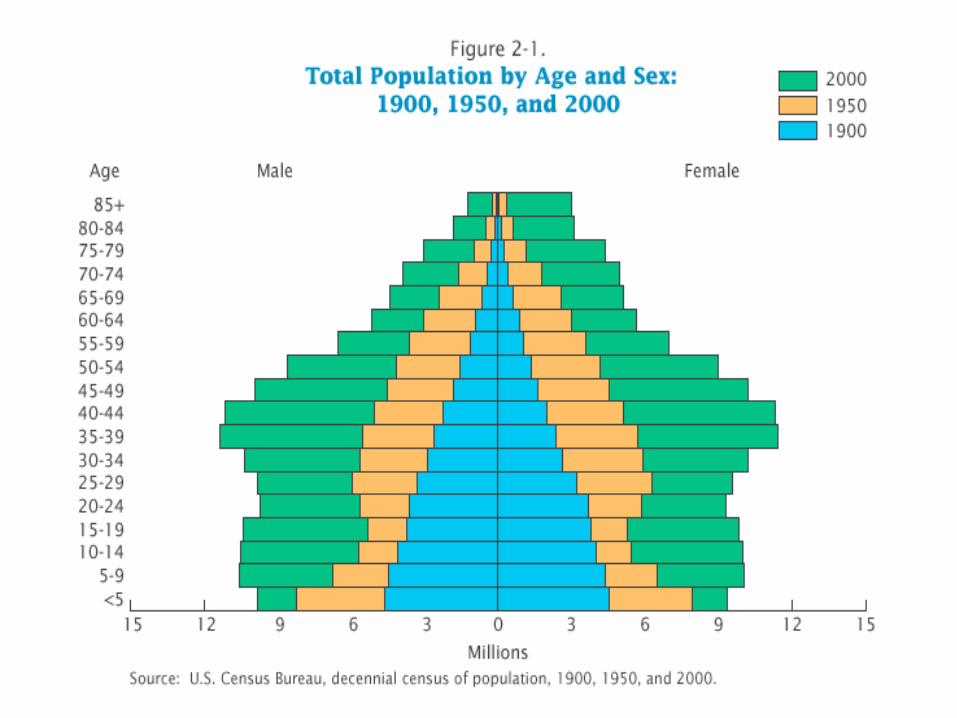
In 1900 half of the US population was less than 22.9 years old. By 2000, half of the population was more than 35.3 years old.
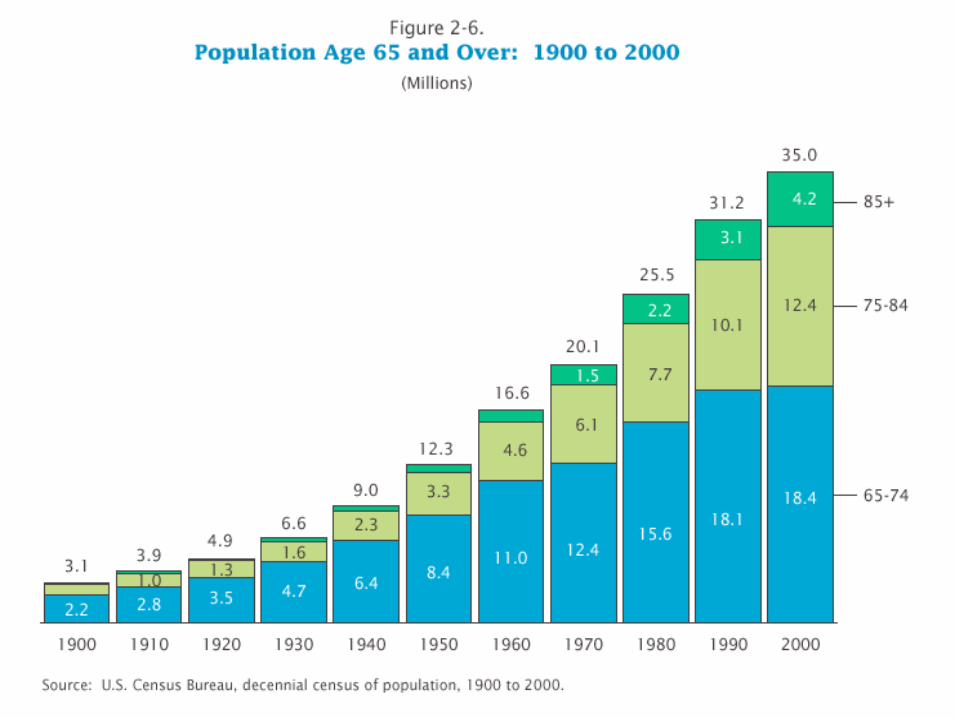
The population age 65 and over increased tenfold, from 3.1 million in 1900 to 35 million in 2000.
Snapshot of Demographic Trends
Snapshot of Demographic Trends
Snapshot of Demographic Trends
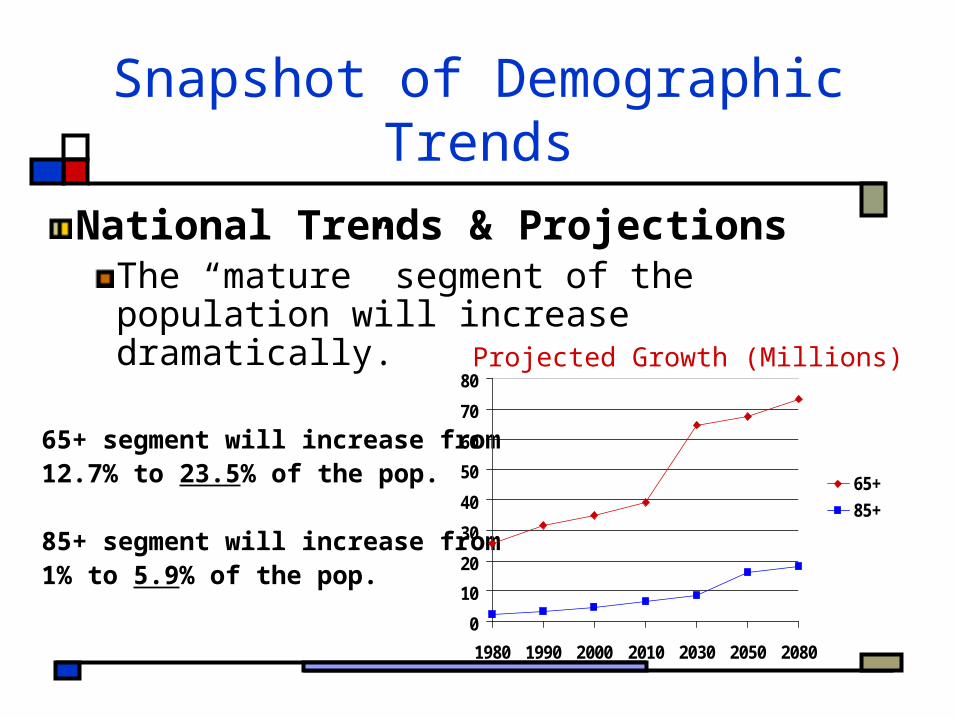
National Trends & ProjectionsThe “mature” segment of the population will increase dramatically.
65+ segment will increase from 12.7% to 23.5% of the pop.
85+ segment will increase from1% to 5.9% of the pop.
0
10
20
30
40
50
60
70
80
1980 1990 2000 2010 2030 2050 2080
65+
85+
Projected Growth (Millions)
Implications?
OpportunitiesPharmaceutical products (i.e. Viagra & Botok) Travel
ThreatsHealth care & insurance
Snapshot of Demographic Trends
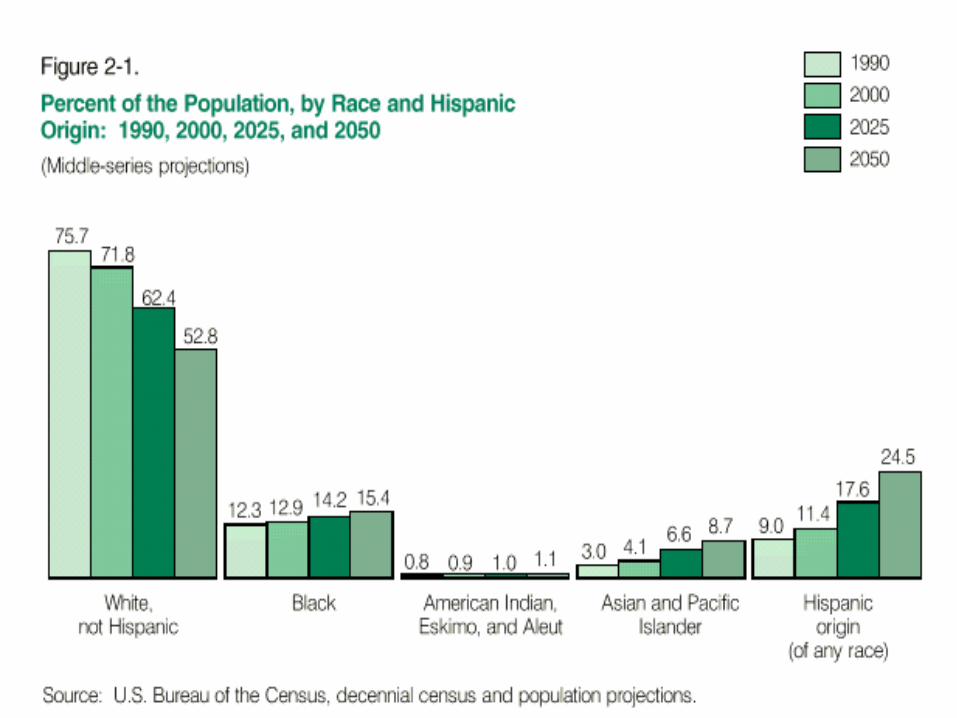
In 1900, 1 out of 8 Americans was not classified as white/not-Hispanic.At the of the century, the ratio was 1 out of 4.
From 1980 to 2000, the Hispanic population more than doubledBy 2000, the percentage of minority populations ranged from 16 percent for people over age 65 and 39 percent for those under age 25.
Snapshot of Demographic Trends
National Trends & Projections
Snapshot of Demographic Trends
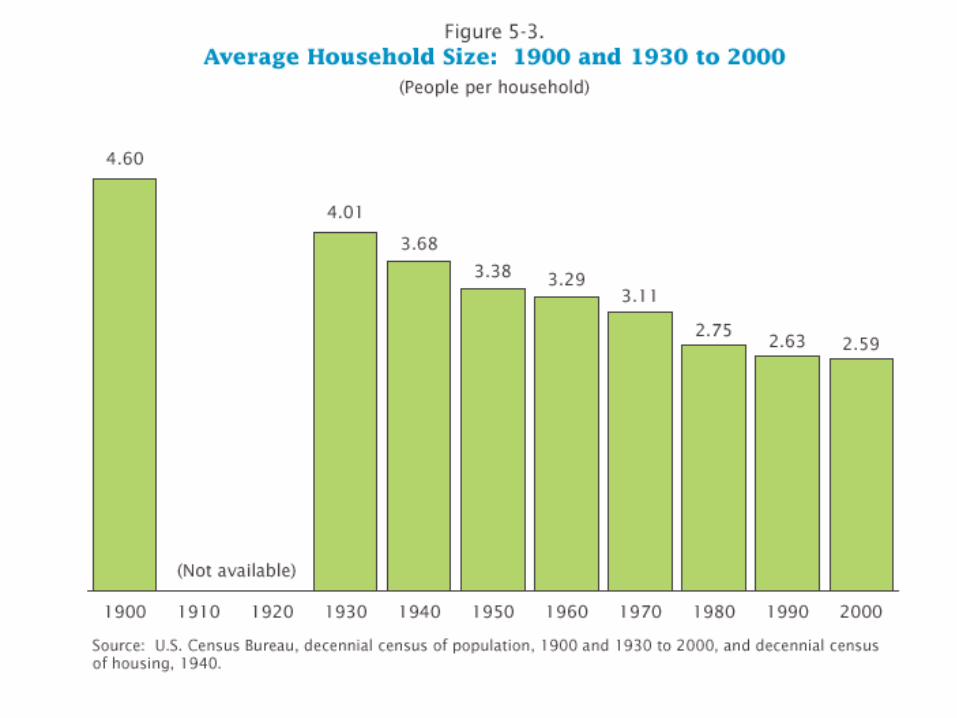
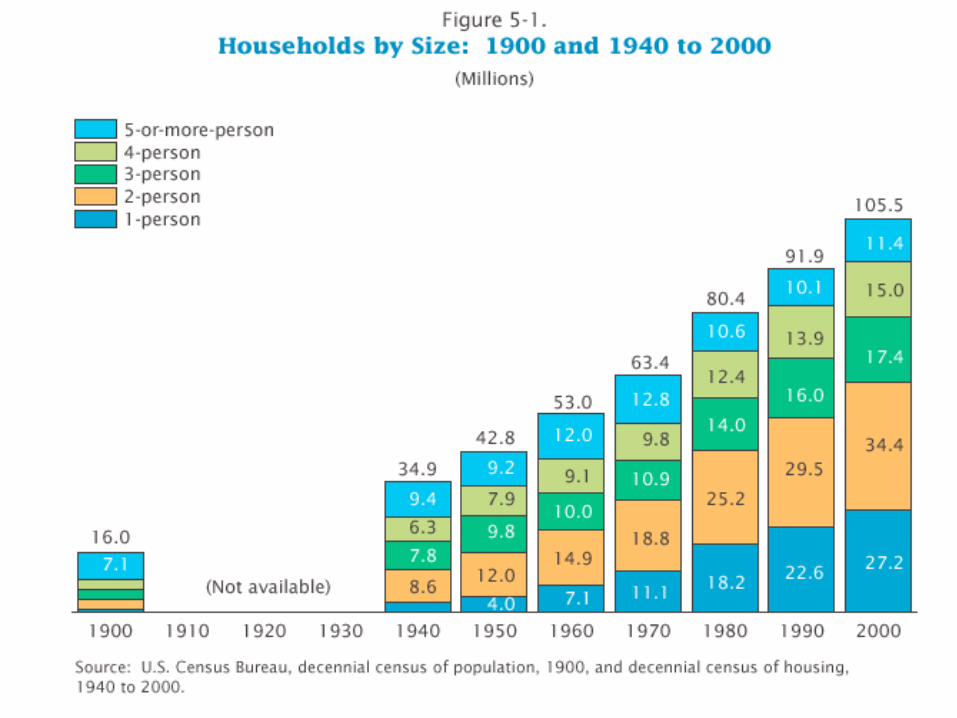
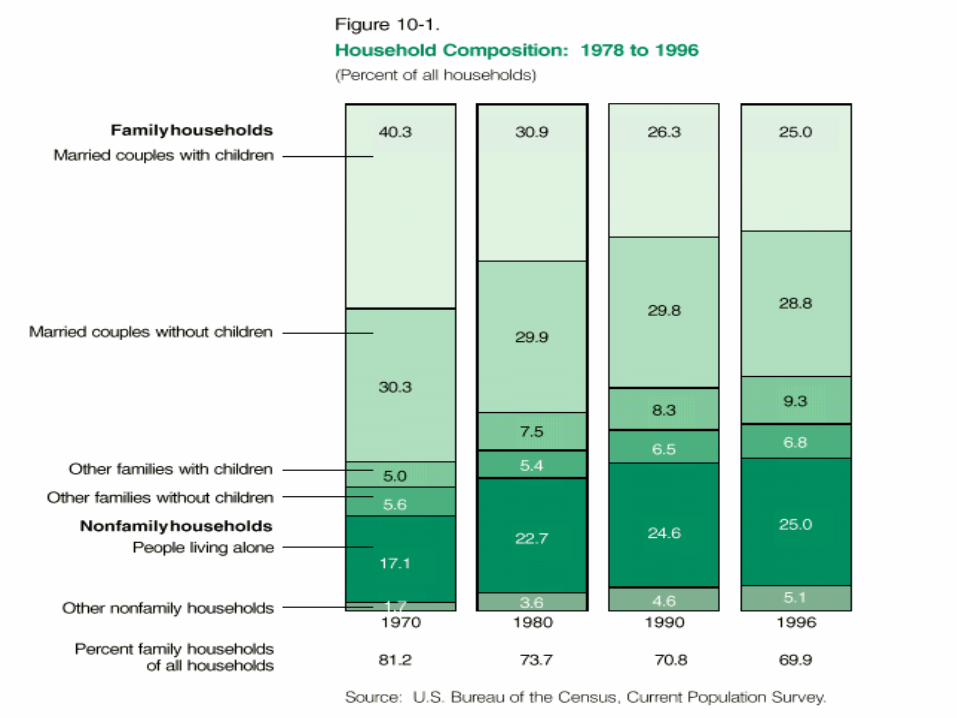
In 1900, the most common household contained seven or more people.Average household size declined from 4.60 in 1900 to 2.59 in 2000, or by 44 percent.
Snapshot of Demographic Trends
Snapshot of Demographic Trends

Snapshot of Demographic Trends
Households and Families The share of “family” households fell from 81percent in 1970 to 71percent in 1990 and has remained at that level. The number of single parents increased from 3.8 million in 1970 to 11.7 million in 1996.
Snapshot of Demographic Trends

Snapshot of Demographic Trends
Marital Status and Living Arrangements
Additional Trends
Two income families Higher education levels More “mobile”
What are the implications?

Fads versus Trends
Critical Questions for Identifying Lifestyle Trends:
Does it fit with lifestyle changes? What benefits does it provide? Can it be personalized? Who has adopted it?
Forecasting the Future
Requires: Understanding the past Monitoring demographic shifts Anticipating trends
Faith Popcorn's Website Yankelovich Monitor

Assignment
Read Chapter 11Memo 1 due on WednesdayTeam Research Proposal Due by Friday