demographic indicators - cbhidghs.nic.in 1.pdf · demographic indicators of a country reveals its...
TRANSCRIPT

D E M O G R A P H I C I N D I C A T O R S
C H A P T E R O N E
An overview of population statistics and vital statistics of
the country.

1. Demographic Indicators Page No.
Highlights 41.1 PopulationStatistics 6-20
1.1.1 TrendinCensusPopulationinIndia,1901-2011 6
1.1.2 State/UTwiseDistributionofPopulation,SexRatio,DensityandDecadalGrowthrateof 10Population,2011
1.1.3 State/UTwisedistributionofProjectedPopulationofIndia,2017-2026 12
1.1.4(a) PercentageDistributionofEstimatedPopulationbyage-group,sexandresidence,2015 16
1.1.4(b) PercentageDistributionofEstimatedPopulationbyage-group,sexandresidence,2016 17
1.1.5(a) Percentagedistributionofpopulationintheagegroupof60yearsandabovebysexand 18residence,Indiaandbiggerstates,2015
1.1.5(b) Percentagedistributionofpopulationintheagegroupof60yearsandabovebysexand 19residence,Indiaandbiggerstates,2016
1.1.6 State/UTwisedistributionofDistricts,Sub-Districts,TownsandVillagesinIndia,2011 20
1.2 VitalStatistics 21-39
1.2.1 EstimatedBirthRate,DeathRateandNaturalGrowthRateinIndia,1991-2016 21
1.2.2 State/UTwisedistributionofBirthRatesinIndia,2014,2015and2016 23
1.2.3 ProjectedCrudeBirthRatesinIndiaandMajorStates,2001-2025 24
1.2.4 ProjectedCrudeDeathRatesinIndiaandMajorStates,2001-2025 24
1.2.5(a) State/UTwisedistributionofDeathRatesbySexandResidenceinIndia,2015 25
1.2.5(b) State/UTwisedistributionofDeathRatesbySexandResidenceinIndia,2016 26
1.2.6(a) ProjectedLevelsofExpectationofLifeatBirthinIndiaandMajorStates,2001–2025 27
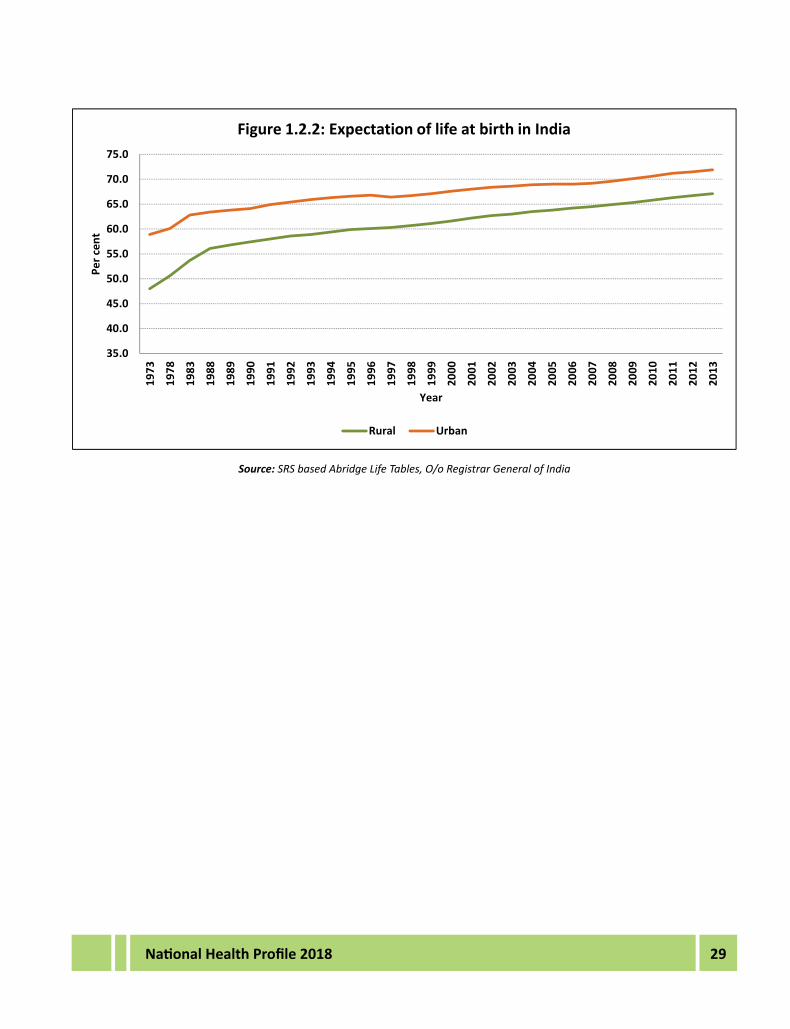
1.2.6(b) Expectationoflifeatbirthbysexandresidence,India,1970-75to2011-15 28
1.2.7 InfantMortalityRatesinIndia,1994-2016 30
1.2.8(a) State/UTwiseInfantMortalityRatesbySexandResidenceinIndia,2015 32
1.2.8(b) State/UTwiseInfantMortalityRatesbySexandResidenceinIndia,2016 33
1.2.9 MaternalMortalityRatio(MMR)inIndiaandMajorStates,2007-09,2010-12&2011-13 35
1.2.10 MortalityIndicatorsinIndia,2001-2016 36
1.2.11(a) AgeSpecificDeathRatebySexandResidenceinIndia,2015 38
1.2.11(b) AgeSpecificDeathRatebySexandResidenceinIndia,2016 38
1.2.12 TotalFertilityRate(TFR)byResidenceinIndiaandMajorStates,2015and2016 39

4 National Health Profile 2018
Demographic Indicators
Highlights
Demographic indicators of a country reveals its population size, decadal growth rate of population,territorialdistribution,gendercomposition,changes thereinandthecomponentsofchangessuchasnativity,mortalityandsocialmorbidity.Demographic indicatorscanbedividedintwoparts–PopulationStatisticsandVitalStatistics.PopulationStatisticsdealswithsizeandgrowthofpopulation,sexratio,densityofpopulationetc.whileVitalStatisticsdealswithbirthrate,deathrate,andnaturalgrowthrate,lifeexpectancyatbirth,mortalityandfertilityrates.State/UTwiseperformanceoftheseindicatorshelpsustoidentifyareasthatneedpolicyandprogrammeinterventions,settingnearandfar-termgoals,anddecidingpriorities,besidesunderstandingtheminanintegratedstructure.Datainthissectionhasbeentakenmainlyfromthe“CensusofIndia”.
India’spopulation,aspercensus2011stoodat12108.5lakhs(6232.7lakhsmalesand5875.8lakhsfemales).Outoftheentirecensustilldate,theAverageAnnualExponentialGrowthRatehasbeennegativeonlyforthedecade1911-21.Duringthis interval,populationdeclinedmarginallyduetogreatinfluenzaepidemicandtwosuccessivebadharvestsinWestBengal.[TableNo.1.1.1]
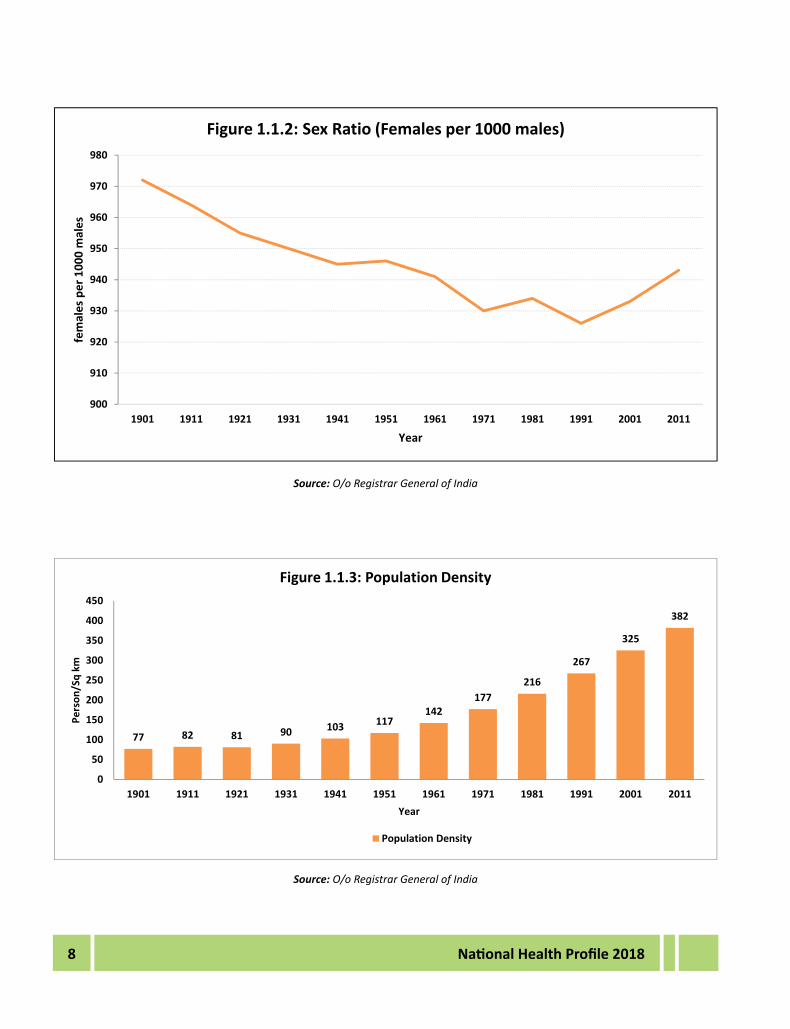
Thesexratioof Indiaduring1901was972femalesper1000males.Sincethen, ithascontinuedtodeclinedecadeoverdecadeto926femalesagainst1000malein1991(exceptin1981).Thesexratiohasfurtherimprovedfrom1991itwas933and943femaleagainst1000femalein2001and2011 respectively in the country as per the information available at TableNo. 1.1.1 and graphicpresentationgivenatFigureNo.1.1.2.AccordingtoFigureNo.1.1.1,thesexratiosof18States/UTswereabovenationalaveragewhile17States/UTshaveregisteredbelownationalaverage.
The highest sex ratio of 1084 females per 1000maleswas reported by State of Kerala followedby Puducherry (1037/1000), Tamil Nadu (996/1000), Andhra Pradesh (993/1000), Chhattisgarh(991/1000)andMeghalaya (989/1000). The lowest sex ratioof618 femalesper1000maleswasreportedbytheUTofDaman&DiufollowedbyChandigarh(818/1000),NCTofDelhi(868/1000),Andaman&NicobarIslands(876/1000),Haryana(879/1000),Jammu&Kashmir(889/1000),Sikkim(890/1000)andPunjab(895/1000).[ReferTableNo.1.1.2]
ThegraphicrepresentationofthepopulationdensityofthecountryisgivenatFigureNo.1.1.3.Thehighestpopulationdensityof11320populationspersquarekilometrewasreportedbyNCTofDelhiwhereasArunachalPradeshhasreportedthelowestpopulationdensityof17.[ReferTableNo.1.1.2]
Age group-wisedistributionof populationof the countryprojected for 2015and2016are givenat TableNo. 1.1.4(a) and TableNo. 1.1.4(b) respectively.Accordingly to TableNo. 1.1.4 (b), 27%ofthetotalestimatedpopulationof2016werebelowtheageof14yearsandmajority(64.7%)ofthepopulationwereintheagegroupof15-59yearsi.e.economicallyactivepopulationand8.5%populationwereintheagegroupof60to85+years.
TheestimatedBirthRate,DeathRateandNaturalGrowthRateinIndiaduring1991to2016aregiveninTableNo.1.2.1.Therehasbeenconsistentdecrease in theBirthRate,DeathRateandNaturalGrowthRateinIndiasince1991to2016.Ason2016IndiahasregisteredBirthRateof20.4per1000populationsandDeathRateof6.4per1000populationswhiletheNaturalGrowthRatewas14.0per1000populationinIndia.TheBirthRateinRuralwashigherthanintheUrban.Similarly,theDeathRateandNaturalGrowthRatewerealsohigherinruralascomparedtotheUrban.
Thepopulation,however,continuestogrow,asthedeclineinthebirthrateisnotasrapidasthedecline in the death rate.

5National Health Profile 2018
TheLifeExpectancyofLifeatBirthhasincreasedfrom49.7yearsin1970-75to68.3yearsin2011-15.Forthesameperiod,theLifeExpectancyforFemalesis70.0yearsand66.9yearsforMales.[TableNo.1.2.6(b)]
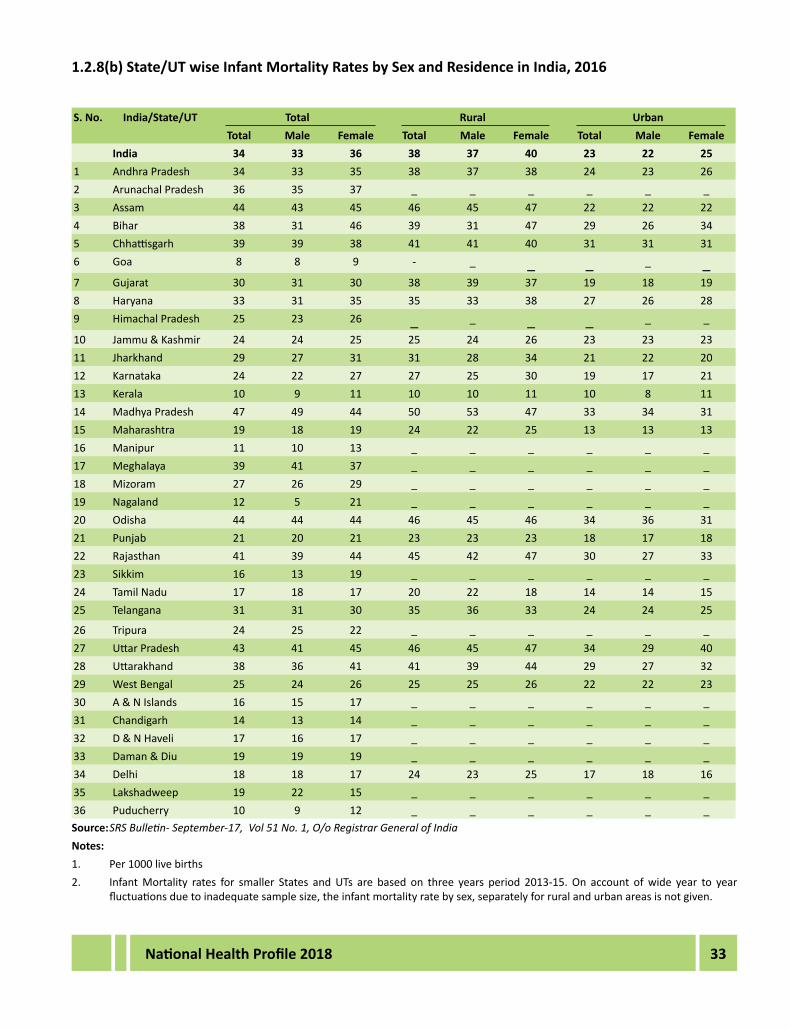
InfantMortality Rate has declined considerably (34 i.e. Per 1000 Live Births in 2016), howeverdifferentialsofrural(38)&urban(23)arestillhigh.[TableNo.1.2.7]
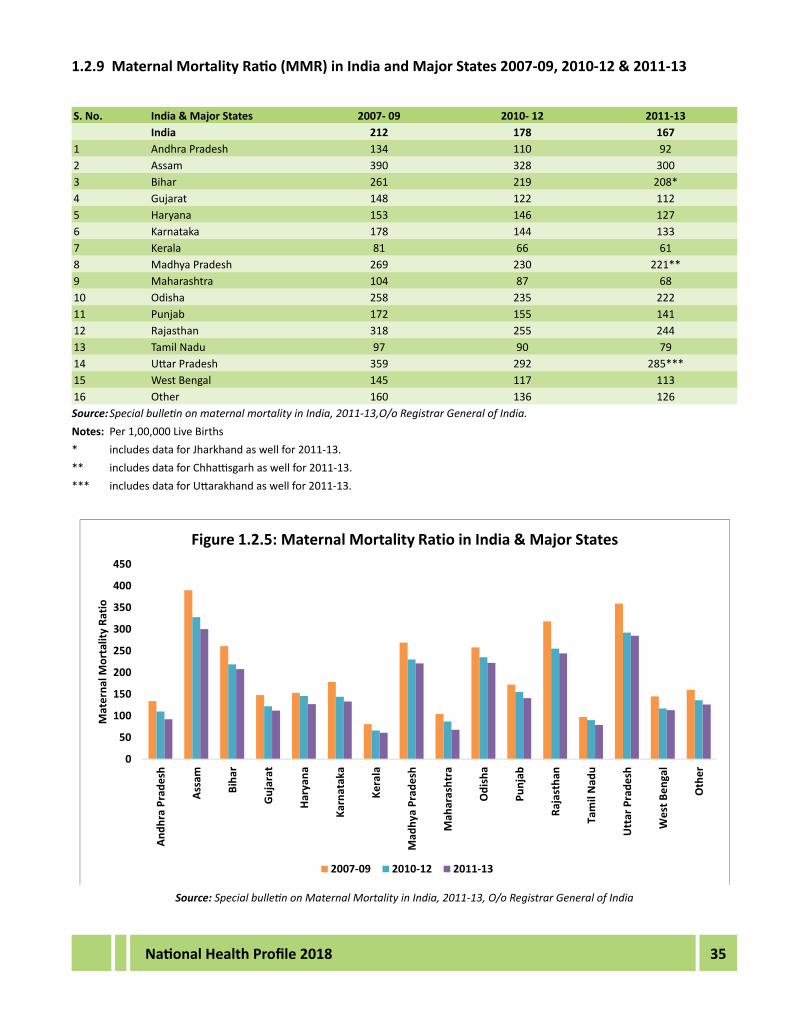
Asper the latestdataavailable,MaternalMortalityRatio ishighest inAssam& lowest inKerala.[TableNo-1.2.9]
TheAge-specificdeath rate isdecliningover theyears; the rural-urbandifferentialsarestillhigh.[TableNo.1.2.11(b)]
TheTotalFertilityRate(TFR)forthecountrywas2.3whereasinruralareasithasbeen2.5andithasbeen1.8inurbanareasduring2016asperthelatestavailableinformation.[TableNo.1.2.12]

6 National Health Profile 2018
1.1PopulationStatistics
1.1.1TrendinCensusPopulationinIndia1901-2011S.No.
Year TotalPopulation(InLakh) SexRatio PopulationDensityh
Decadal Growth Rate(%)g
Average Annual
ExponentalGrowth Rate
%ofUrbanPopulation
to Total Population
Male Female Total
1 1901 1207.9b 1173.6 2384.0a 972f 77 N.A N.A 10.85
2 1911 1283.9 1237.1 2520.9 964 82 5.75 0.56 10.29
3 1921 1285.5 1227.7 2513.2 955 81 -0.31 -0.03 11.18
4 1931 1429.3 1357.9 2789.8a 950f 90 11.00 1.04 11.99
5 1941 1636.9 1546.9 3186.6a 945f 103 14.22 1.33 13.86
6 1951g 1855.3 1755.6 3610.9 946 117 13.31 1.25 17.29
7 1961g 2262.9 2129.4 4392.3 941 142 21.64 1.96 17.97
8 1971 2840.5 2641.1 5481.6 930 177 24.80 2.20 19.91
9 1981c 3533.7 3299.5 6833.3 934 216 24.66 2.22 23.33
10 1991d 4393.6 4070.6 8464.2 926 267 23.87 2.14 25.70
11 2001e 5322.2 4965.1 10287.4 933 325 21.54 1.97 27.81
12 2011i 6232.7 5875.8 12108.5 943 382 17.70 1.64 31.14
Source: O/o Registrar General of India
Notes:
a. ThedistributionofpopulationbysexofPuducherryfor1901(2,46,354),1931(2,58,628)&1941(2,85,011)isnotavailable.Thefiguresoftheseyearsaretherefore,exclusiveofthesepopulationfiguressofarasdistributionbysexisconcerned.
b. SexwiseDistributionofChandanNagar(26831)ofWestBengalandGonda(18810)ofUttarPradesharenotavailable.
c. IncludesinterpolatedpopulationofAssamwherethe1981censuscouldnotbeconductedowingtodisturbedconditionsprevailingin that state during that period.
d. IncludesInterpolatedpopulationofJammu&Kashmirbasedonfinalpopulationof2001cencus,wherethe1991censuscouldnotbeheld.
e. Indiafiguresfor2001includesestimatedpopulationofthethreesub-divisionsViz.MaoMaram,PaomataandPurulofSenapatidistrict of Manipur.
f. ExcludesPuducherry
g. Inworkingout‘decadalgrowth’and‘percentagedecadalgrowth’forIndia1941-51and1951-61thepopulationofTuensangdistrictfor1951(7,025)andthepopulationofTuensang(83,501)andMon(5,774)districtsfor1961censusofNagalandstatehavenotbeentakenintoaccountastheareaswerecensusedforthefirsttimein1951Censusandthesamearenotcomparable.
h. Forcalculatingdensity, theareafigure for Indiaexclude78,114sq.Km.under illegaloccupationofPakistanand5180sq.Km.illegallyhandedoverbyPakistantoChinaand37555sq.Km.underillegaloccupationofChinainLadakhdistrictand1573sq.Km.ofthreesub-divisionofSenapatidistrictofManipur.
i. Thedatapertainingtothreesub-divisionsViz.MaoMaram,PaomataandPurulofSenapatidistrictofManipurwerefinalizedafterreleaseofPCAofCensus2011andaccordinglythefiguresforIndiahasbeenrevised.

7National Health Profile 2018
Source: O/o Registrar General of India
8 National Health Profile 2018
Source: O/o Registrar General of India
Source: O/o Registrar General of India

9National Health Profile 2018
Source: O/o Registrar General of India

10 National Health Profile 2018
1.1.2State/UT wise Distribution of Population, Sex Ratio, Density and Decadal Growth rate ofPopulation:2011
State/UT Code
India/State/UT Totalpopulation Sexratio PopulationDensity
Decadal growth ratePersons Males Females
INDIA 1210854977 623270258 587584719 943 382 17.7
1 Andhra Pradesh 84580777 42442146 42138631 993 308 11.0
2 Arunachal Pradesh 1383727 713912 669815 938 17 26.0
3 Assam 31205576 15939443 15266133 958 398 17.1
4 Bihar 104099452 54278157 49821295 918 1106 25.4
5 Chhattisgarh 25545198 12832895 12712303 991 189 22.6
6 Goa 1458545 739140 719405 973 394 8.2
7 Gujarat 60439692 31491260 28948432 919 308 19.3
8 Haryana 25351462 13494734 11856728 879 573 19.9
9 HimachalPradesh 6864602 3481873 3382729 972 123 12.9
10 Jammu&Kashmir 12541302 6640662 5900640 889 124 23.6
11 Jharkhand 32988134 16930315 16057819 949 414 22.4
12 Karnataka 61095297 30966657 30128640 973 319 15.6
13 Kerala 33406061 16027412 17378649 1,084 860 4.9
14 Madhya Pradesh 72626809 37612306 35014503 931 236 20.3
15 Maharashtra 112374333 58243056 54131277 929 365 16.0
16 Manipur 2855794 1438586 1417208 985 128 24.5
17 Meghalaya 2966889 1491832 1475057 989 132 27.9
18 Mizoram 1097206 555339 541867 976 52 23.5
19 Nagaland 1978502 1024649 953853 931 119 -0.6
20 Odisha 41974218 21212136 20762082 979 270 14.0
21 Punjab 27743338 14639465 13103873 895 551 13.9
22 Rajasthan 68548437 35550997 32997440 928 200 21.3
23 Sikkim 610577 323070 287507 890 86 12.9
24 TamilNadu 72147030 36137975 36009055 996 555 15.6
25 Tripura 3673917 1874376 1799541 960 350 14.8
26 UttarPradesh 199812341 104480510 95331831 912 829 20.2
27 Uttarakhand 10086292 5137773 4948519 963 189 18.8
28 WestBengal 91276115 46809027 44467088 950 1028 13.8
29 Andaman&NicobarIslands 380581 202871 177710 876 46 6.9
30 Chandigarh 1055450 580663 474787 818 9258 17.2
31 Dadra&NagarHaveli 343709 193760 149949 774 700 55.9
32 Daman&Diu 243247 150301 92946 618 2191 53.8
33 NCT of Delhi 16787941 8987326 7800615 868 11320 21.2
34 Lakshadweep 64473 33123 31350 947 2149 6.3
35 Puducherry 1247953 612511 635442 1,037 2547 28.1
Source: O/o Registrar General of India

11National Health Profile 2018
Notes:
1. Thedatapertainingtothreesub-divisionsViz.MaoMaram,PaomataandPurulofSenapatidistrictofManipurwerefinalizedafterreleaseofPCAofCensus2011andaccordinglythefiguresforIndiaandStateofManipurhavebeenrevised.
2. ForworkingoutdensityofIndiaandtheStateofJammu&Kashmir,theentireareaandpopulationofthoseportionsofJammu&KashmirwhichareunderillegaloccupationofPakistanandChinahavenotbeentakenintoaccount.
3. ForCensus2011, thepopulationof “Others”hasbeen clubbedwith the “Males” forworkingoutpopulation,0-6population,literatesandrelatesratesandratios.
4. Inworkingout‘decadalvariation’andpercentagedecalvariation’for1941-1951&1951-1961ofIndiaandNagalandState,thepopulationofTuensangDistrictfor1951(7.025)&thepopulationofTuensang(83,501)&Mon(50,774)districtsfor1961Censushavenotbeentakenintoaccountastheareawascensusedforthefirsttimein1951andthesamearenotcomparable.
5. The1981CensuscouldnotbeheldowingtodisturbedconditionsprevailinginAssam.Hencethepopulationfiguresfor1981ofAssamhavebeenworkedoutby‘Interpolation’.
6. The1991CensuswasnotheldinJammu&Kashmir.Hencethepopulationfiguresfor1991ofJammu&Kashmirhavebeenworkedoutby‘Interpolation’.
7. ThedistributionofpopulationofPondicherry(Puducherry)bysexfor1901(246,354),and1931(258,628)and1941(285,011)isnotavailable.ThefiguresofIndiafortheseyearsare,therefore,exclusiveofthesepopulationfiguressofarasdistributionbysexis concerned.
8. ArunachalPradeshwascensusedforthefirsttimein1961.
9. In1951,Tuensangwascensusedforthefirsttimein129.5sq.kmsofareasonly.In1961censusedareasofTuensangDistrictofNagalandwasincreasedto5356.1sq.kms.
10. Duetonon-availabilityofcensusdatathefiguresforthedecades, from1901to1951havebeenestimatedforthedistrictsofKohima,Phek,Wokha,ZunhebotoandMokokchungofNagaland.EstimationhowevercouldnotbedoneforTuensangandMonastheywerenotfullycensusedpriorto1961.
11. As the sexbreak-up for thedistricts Sheopur,Morena,Bhind,Gwalior,Datia, Shivpuri,Guna,Ratlam,Ujjain, Shajapur,Dewas,Jhabua,Dhar, Indore,WestNimar (Khargone),Barwani,Raigarh,Bhopal,SehoreandRaisen isnotavailable for theyear1901.Figuresformalesandfemaleshavebeenestimatedfortheyear1901forMadhyaPradesh.
12. OnevillageRamtapur(codeNo.217and101in1951and1961respectively)ofJukkalcircleofDegulurtalukawhichwastransferredunderthestateReorganisationAct,1956fromMaharashtratoAndhraPradesh,tillcontinuesinNandeddistrictofMaharashtra.Thepopulationofthisvillagehas,however,beenadjustedinNizamabaddistrictfortheyear1901-1951.
13. ThenamesofUttranchalandPondicherryhavechangedtoUttarakhandandPuducherryrespectivelyafterCensus2001.”
12 National Health Profile 2018
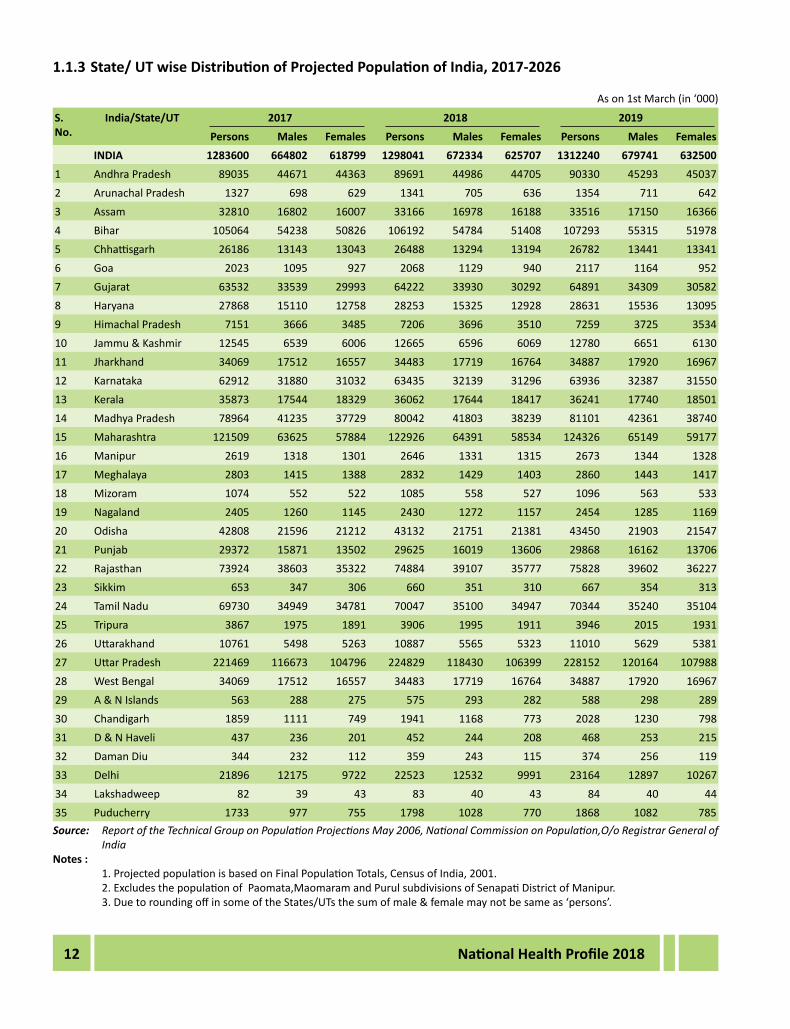
1.1.3State/UTwiseDistributionofProjectedPopulationofIndia,2017-2026
Ason1stMarch(in‘000)
S.No.
India/State/UT 2017 2018 2019Persons Males Females Persons Males Females Persons Males Females
INDIA 1283600 664802 618799 1298041 672334 625707 1312240 679741 6325001 Andhra Pradesh 89035 44671 44363 89691 44986 44705 90330 45293 450372 Arunachal Pradesh 1327 698 629 1341 705 636 1354 711 6423 Assam 32810 16802 16007 33166 16978 16188 33516 17150 163664 Bihar 105064 54238 50826 106192 54784 51408 107293 55315 519785 Chhattisgarh 26186 13143 13043 26488 13294 13194 26782 13441 133416 Goa 2023 1095 927 2068 1129 940 2117 1164 9527 Gujarat 63532 33539 29993 64222 33930 30292 64891 34309 305828 Haryana 27868 15110 12758 28253 15325 12928 28631 15536 130959 HimachalPradesh 7151 3666 3485 7206 3696 3510 7259 3725 353410 Jammu&Kashmir 12545 6539 6006 12665 6596 6069 12780 6651 613011 Jharkhand 34069 17512 16557 34483 17719 16764 34887 17920 1696712 Karnataka 62912 31880 31032 63435 32139 31296 63936 32387 3155013 Kerala 35873 17544 18329 36062 17644 18417 36241 17740 1850114 Madhya Pradesh 78964 41235 37729 80042 41803 38239 81101 42361 3874015 Maharashtra 121509 63625 57884 122926 64391 58534 124326 65149 5917716 Manipur 2619 1318 1301 2646 1331 1315 2673 1344 132817 Meghalaya 2803 1415 1388 2832 1429 1403 2860 1443 141718 Mizoram 1074 552 522 1085 558 527 1096 563 53319 Nagaland 2405 1260 1145 2430 1272 1157 2454 1285 116920 Odisha 42808 21596 21212 43132 21751 21381 43450 21903 2154721 Punjab 29372 15871 13502 29625 16019 13606 29868 16162 1370622 Rajasthan 73924 38603 35322 74884 39107 35777 75828 39602 3622723 Sikkim 653 347 306 660 351 310 667 354 31324 TamilNadu 69730 34949 34781 70047 35100 34947 70344 35240 3510425 Tripura 3867 1975 1891 3906 1995 1911 3946 2015 193126 Uttarakhand 10761 5498 5263 10887 5565 5323 11010 5629 538127 UttarPradesh 221469 116673 104796 224829 118430 106399 228152 120164 10798828 WestBengal 34069 17512 16557 34483 17719 16764 34887 17920 1696729 A&NIslands 563 288 275 575 293 282 588 298 28930 Chandigarh 1859 1111 749 1941 1168 773 2028 1230 79831 D&NHaveli 437 236 201 452 244 208 468 253 21532 DamanDiu 344 232 112 359 243 115 374 256 11933 Delhi 21896 12175 9722 22523 12532 9991 23164 12897 1026734 Lakshadweep 82 39 43 83 40 43 84 40 4435 Puducherry 1733 977 755 1798 1028 770 1868 1082 785Source: Report of the Technical Group on Population Projections May 2006, National Commission on Population,O/o Registrar General of
IndiaNotes : 1.ProjectedpopulationisbasedonFinalPopulationTotals,CensusofIndia,2001. 2.ExcludesthepopulationofPaomata,MaomaramandPurulsubdivisionsofSenapatiDistrictofManipur. 3.DuetoroundingoffinsomeoftheStates/UTsthesumofmale&femalemaynotbesameas‘persons’.

13National Health Profile 2018
1.1.3(Contd.)State/UTwiseDistributionofProjectedPopulationofIndia,2017-2026
Ason1stMarch(in‘000)
S.No. India/State/UT 2020 2021 2022Persons Males Females Persons Males Females Persons Males Females
INDIA 1326155 686998 639157 1339741 694080 645660 1352695 700811 6518841 Andhra Pradesh 90949 45591 45359 91549 45880 45669 92111 46147 459642 Arunachal Pradesh 1367 718 649 1379 724 655 1392 731 6613 Assam 33856 17317 16539 34183 17478 16705 34495 17630 168654 Bihar 108372 55833 52539 109431 56341 53091 110410 56806 536055 Chhattisgarh 27066 13584 13483 27337 13719 13618 27605 13853 137526 Goa 2170 1204 966 2232 1249 983 2262 1275 9877 Gujarat 65532 34674 30858 66139 35020 31119 66774 35381 313938 Haryana 29002 15743 13259 29362 15944 13418 29720 16143 135769 HimachalPradesh 7311 3753 3557 7361 3781 3580 7408 3807 360110 Jammu&Kashmir 12888 6701 6187 12987 6747 6240 13086 6793 629311 Jharkhand 35278 18114 17165 35652 18297 17355 36018 18477 1754112 Karnataka 64410 32619 31791 64848 32832 32016 65295 33051 3224513 Kerala 36410 17831 18579 36569 17917 18652 36722 18001 1872114 Madhya Pradesh 82134 42905 39229 83135 43432 39703 84111 43943 4016815 Maharashtra 125711 65899 59813 127082 66639 60442 128398 67352 6104616 Manipur 2698 1357 1342 2723 1368 1354 2747 1380 136717 Meghalaya 2887 1456 1431 2914 1469 1445 2940 1482 145818 Mizoram 1106 568 538 1116 573 543 1126 578 54819 Nagaland 2477 1297 1181 2500 1308 1192 2522 1319 120320 Odisha 43762 22052 21710 44068 22198 21870 44349 22330 2201921 Punjab 30101 16300 13801 30323 16432 13891 30542 16562 1398022 Rajasthan 76759 40089 36670 77676 40568 37107 78521 41009 3751223 Sikkim 673 357 316 679 360 319 686 363 32224 TamilNadu 70617 35367 35250 70865 35482 35383 71101 35592 3551025 Tripura 3983 2033 1950 4019 2051 1968 4056 2096 198726 Uttarakhand 11029 5691 5437 11241 5750 5491 11351 5807 554327 UttarPradesh 231425 121868 109557 234631 123532 111099 237676 125108 11256828 WestBengal 35278 18114 17165 35652 18297 17355 36018 18477 1754129 A&NIslands 601 305 297 617 312 305 627 318 31030 Chandigarh 2122 1297 825 2226 1372 854 2301 1428 87331 D&NHaveli 486 262 223 506 273 233 517 278 23932 DamanDiu 391 269 122 409 284 125 420 293 12733 Delhi 23818 13270 10549 24485 13650 10835 25162 14036 1112634 Lakshadweep 85 40 45 86 41 45 86 41 4535 Puducherry 1944 1142 802 2028 1208 820 2085 1257 828
Source: Report of the Technical Group on Population Projections May 2006, National Commission on Population,O/o Registrar General of India
Notes : 1.ProjectedpopulationisbasedonFinalPopulationTotals,CensusofIndia,2001. 2.ExcludesthepopulationofPaomata,MaomaramandPurulsubdivisionsofSenapatiDistrictofManipur.

14 National Health Profile 2018
1.1.3(Contd.)State/UTwiseDistributionofProjectedPopulationofIndia,2017-2026
Ason1stMarch(in‘000)
S.No. India/State/UT 2023 2024Persons Males Females Persons Males Females
INDIA 1365302 707355 657947 1377442 713643 6637991 Andhra Pradesh 92649 46401 46248 93160 46641 465182 Arunachal Pradesh 1404 737 667 1415 743 6733 Assam 34796 17777 17020 35084 17916 171694 Bihar 111352 57250 54102 112245 57669 545765 Chhattisgarh 27865 13983 13882 28117 14108 140096 Goa 2023 1298 989 2302 1316 9867 Gujarat 67396 35735 31661 68013 36086 319278 Haryana 3007 16339 13732 30416 16531 138859 HimachalPradesh 7453 3832 3621 7497 3856 364110 Jammu&Kashmir 13180 6836 6344 13269 6876 639211 Jharkhand 36375 18652 17723 36718 18819 1789912 Karnataka 65725 33260 32465 66139 33461 3267813 Kerala 36867 18080 18786 37004 18156 1884714 Madhya Pradesh 85064 44442 40622 85989 44925 4106415 Maharashtra 129689 68051 61639 130948 68732 6221616 Manipur 2771 1392 1379 2794 1403 139117 Meghalaya 2965 1494 1471 2990 1506 148418 Mizoram 1136 583 553 1146 588 55819 Nagaland 2544 1330 1214 2566 1341 122520 Odisha 44620 22456 22164 44876 22574 2230221 Punjab 30753 16687 14066 30956 16808 1414922 Rajasthan 79339 41434 37905 80116 41838 3827923 Sikkim 692 366 325 698 369 32824 TamilNadu 71319 35692 35627 71517 35783 3573425 Tripura 4091 2086 2004 4125 2103 202226 Uttarakhand 11457 5863 5594 11558 5916 564227 UttarPradesh 240651 126643 114008 243517 128117 11540028 WestBengal 36375 18652 17723 99388 50786 4860229 A&NIslands 637 323 314 645 329 31630 Chandigarh 2374 1483 890 2438 1534 90431 D&NHaveli 527 283 245 535 285 24932 DamanDiu 431 301 129 439 308 13133 Delhi 25852 14430 11422 26553 14830 1172334 Lakshadweep 85 40 45 84 39 4435 Puducherry 2140 1306 834 2186 1350 836
Source: Report of the Technical Group on Population Projections May 2006, National Commission on Population,O/o Registrar General of India
Notes : 1.ProjectedpopulationisbasedonFinalPopulationTotals,CensusofIndia,2001. 2.ExcludesthepopulationofPaomata,MaomaramandPurulsubdivisionsofSenapatiDistrictofManipur.

15National Health Profile 2018
1.1.3(Contd.)State/UTwiseDistributionofProjectedPopulationofIndia,2017-2026
Ason1stMarch(in‘000)S.No. India/State/UT 2025 2026
Persons Males Females Persons Males FemalesINDIA 1388994 719606 669388 1399838 725176 674663
1 Andhra Pradesh 93636 46862 46774 94073 47061 470122 Arunachal Pradesh 1427 748 678 1438 754 6843 Assam 35354 18045 17309 35602 18162 174404 Bihar 113081 58058 55023 113847 58409 554375 Chhattisgarh 28359 14229 14130 28591 14344 142476 Goa 2300 1324 976 2275 1317 9587 Gujarat 68631 36437 32194 69258 36793 324658 Haryana 30755 16719 14036 31087 16903 141849 HimachalPradesh 7537 3879 3659 7575 3900 367510 Jammu&Kashmir 13353 6915 6439 13434 6951 648311 Jharkhand 37046 18979 18067 37356 19129 1822712 Karnataka 66541 33656 32885 66933 33846 3308713 Kerala 37132 18229 18904 37254 18297 1895614 Madhya Pradesh 86879 45388 41491 87729 45827 4190215 Maharashtra 132165 69391 62774 13333 70023 6331016 Manipur 2817 1414 1403 2839 1424 141417 Meghalaya 3014 1518 1497 3038 1529 150918 Mizoram 1155 593 562 1164 597 56719 Nagaland 2586 1351 1235 2606 1361 124520 Odisha 45112 22681 22431 45324 22775 2254921 Punjab 31154 16925 14229 31345 17038 1430722 Rajasthan 80841 42212 38629 81501 42551 3895023 Sikkim 704 372 331 709 375 33424 TamilNadu 71696 35864 35832 71857 35937 3592025 Tripura 4159 2119 2039 4191 2135 205626 Uttarakhand 11655 5967 5688 11746 6014 573227 UttarPradesh 246234 129507 116726 248763 130793 11797028 WestBengal 99988 51061 48927 100534 51307 4922629 A&NIslands 651 334 317 653 338 31530 Chandigarh 2488 1576 913 2518 1604 91431 D&NHaveli 537 285 253 534 280 25432 DamanDiu 443 311 131 441 310 13133 Delhi 27263 15235 12028 27982 15645 1233734 Lakshadweep 81 38 43 78 36 4235 Puducherry 2219 1386 833 2232 1410 822
Source: Report of the Technical Group on Population Projections May 2006, National Commission on Population,O/o Registrar General of India
Notes : 1.ProjectedpopulationisbasedonFinalPopulationTotals,CensusofIndia,2001. 2.ExcludesthepopulationofPaomata,MaomaramandPurulsubdivisionsofSenapatiDistrictofManipur.

16 National Health Profile 2018
1.1.4(a)Percentagedistributionofestimatedpopulationbyage-group,sexandresidence,2015
Age Group Total Rural UrbanTotal Males Females Total Males Females Total Males Females
0-4 8.6 8.8 8.4 9.2 9.4 9.0 7.3 7.5 7.15-9 9.0 9.2 8.8 9.5 9.6 9.3 8.0 8.2 7.910-14 9.7 9.9 9.5 10.2 10.4 10.0 8.6 8.8 8.415-19 10.2 10.5 9.9 10.7 11.0 10.4 9.1 9.3 8.920-24 10.4 10.1 10.7 10.6 10.3 10.8 10.1 9.7 10.525-29 9.6 9.5 9.8 9.3 9.2 9.3 10.3 9.9 10.730-34 7.9 8.0 7.9 7.5 7.5 7.4 8.9 8.9 8.935-39 7.0 6.9 7.1 6.7 6.5 6.8 7.7 7.7 7.840-44 6.1 6.1 6.0 5.8 5.8 5.7 6.8 6.9 6.745-49 5.3 5.3 5.3 5.1 5.1 5.1 5.8 5.8 5.850-54 4.3 4.3 4.2 4.0 4.1 3.8 5.0 5.0 5.155-59 3.6 3.4 3.8 3.4 3.1 3.7 4.0 4.0 3.960-64 3.1 3.0 3.1 3.0 2.9 3.0 3.2 3.3 3.265-69 2.2 2.1 2.2 2.2 2.1 2.2 2.2 2.1 2.270-74 1.5 1.4 1.5 1.5 1.4 1.6 1.4 1.4 1.575-79 0.9 0.8 0.9 0.9 0.8 1.0 0.8 0.8 0.980-84 0.5 0.4 0.5 0.4 0.4 0.5 0.5 0.4 0.585+ 0.3 0.2 0.3 0.3 0.2 0.3 0.3 0.2 0.3Total 100.0 100.0 100.0 100.0 100.0 100.0 100.0 100.0 100.0Source: SRS Statistical Report 2015, O/o Registrar General of IndiaNotes : Totalmaynotaddupto100duetorounding.

17National Health Profile 2018
1.1.4(b)Percentagedistributionofestimatedpopulationbyage-group,sexandresidence,2016
Age Group Total Rural UrbanTotal Males Females Total Males Females Total Males Females
0-4 8.5 8.7 8.2 9.1 9.3 8.8 7.2 7.4 7.05-9 8.9 9.1 8.8 9.4 9.6 9.2 7.9 8.1 7.810-14 9.6 9.8 9.4 10.1 10.3 9.9 8.5 8.7 8.315-19 10.1 10.4 9.9 10.6 10.9 10.3 9.1 9.3 8.920-24 10.4 10.2 10.7 10.6 10.4 10.8 10.1 9.8 10.425-29 9.7 9.5 9.8 9.4 9.3 9.4 10.2 9.9 10.630-34 8.1 8.1 8.0 7.6 7.7 7.6 9.0 9.0 9.035-39 7.1 7.0 7.2 6.7 6.6 6.8 7.8 7.8 7.840-44 6.1 6.1 6.1 5.8 5.8 5.8 6.9 6.9 6.845-49 5.3 5.3 5.4 5.1 5.1 5.1 5.8 5.8 5.850-54 4.3 4.4 4.3 4.0 4.1 3.9 5.0 5.0 5.155-59 3.6 3.5 3.7 3.4 3.2 3.6 4.0 4.0 4.060-64 3.1 3.0 3.1 3.0 2.9 3.1 3.2 3.3 3.265-69 2.2 2.1 2.2 2.2 2.1 2.2 2.2 2.2 2.270-74 1.5 1.4 1.5 1.5 1.4 1.6 1.4 1.4 1.575-79 0.9 0.8 0.9 0.9 0.8 1.0 0.8 0.8 0.980-84 0.5 0.4 0.5 0.4 0.4 0.5 0.5 0.4 0.585+ 0.3 0.2 0.3 0.3 0.3 0.3 0.3 0.2 0.3Total 100.0 100.0 100.0 100.0 100.0 100.0 100.0 100.0 100.0Source: SRS Statistical Report 2016, O/o Registrar General of IndiaNotes : Totalmaynotaddupto100duetorounding.
Source: SRS Statistical Report 2016, O/o Registrar General of India

18 National Health Profile 2018
1.1.5(a) PercentagedistributionofPopulationintheagegroupof60yearsandabovebysexandresidence,IndiaandbiggerStates,2015
S.No. India/States Total Rural UrbanTotal Male Female Total Male Female Total Male Female
India 8.3 8.0 8.6 8.3 7.9 8.6 8.4 8.3 8.51 Andhra Pradesh 9.8 10.1 9.4 10.5 10.8 10.0 8.1 8.3 7.82 Assam 6.8 7.0 6.5 6.4 6.6 6.3 8.6 9.4 7.83 Bihar 6.8 6.9 6.7 6.6 6.6 6.5 8.3 8.7 7.94 Chhattisgarh 7.1 6.6 7.7 7.3 6.8 7.9 6.5 5.9 7.15 Delhi 6.9 6.5 7.3 6.6 6.0 7.5 6.9 6.6 7.36 Gujarat 8.6 7.8 9.4 8.9 8.1 9.8 8.2 7.5 8.97 Haryana 7.6 7.1 8.2 7.7 7.1 8.4 7.4 7.0 7.78 HimachalPradesh 11.2 10.9 11.5 11.4 11.1 11.7 8.9 8.9 8.99 Jammu&Kashmir 9.7 9.5 9.9 9.2 9.1 9.4 11.0 10.8 11.410 Jharkhand 6.7 6.6 6.8 6.5 6.4 6.7 7.2 7.2 7.311 Karnataka 8.3 7.8 8.8 8.7 8.2 9.3 7.6 7.3 8.012 Kerala 13.1 12.4 13.8 13.3 12.6 14.0 12.9 12.1 13.713 Madhya Pradesh 7.2 7.0 7.4 7.2 6.9 7.5 7.2 7.1 7.314 Maharashtra 9.3 8.9 9.7 10.2 9.6 10.9 8.0 8.0 8.015 Odisha 9.8 9.9 9.6 10.0 10.1 9.8 8.8 8.8 8.716 Punjab 10.3 9.7 11.0 11.1 10.4 12.0 9.2 8.7 9.717 Rajasthan 7.4 6.7 8.2 7.4 6.6 8.2 7.6 7.0 8.118 TamilNadu 10.5 10.3 10.7 10.8 10.4 11.2 10.2 10.2 10.219 Telangana 8.5 8.5 8.4 9.9 9.9 9.9 6.2 6.4 5.920 UttarPradesh 7.0 6.7 7.4 7.1 6.8 7.5 6.9 6.6 7.121 Uttarakhand 9.1 8.4 9.8 9.6 8.8 10.5 7.6 7.4 7.922 WestBengal 9.0 9.1 8.9 7.8 7.5 8.2 11.6 12.6 10.5Source: SRS Statistical Report 2015 , O/o Registrar General of India

19National Health Profile 2018
1.1.5(b) PercentagedistributionofPopulationintheagegroupof60yearsandabovebysexandresidence,IndiaandbiggerStates,2016
S.No. India/States Total Rural UrbanTotal Male Female Total Male Female Total Male Female
India 8.3 8.0 8.6 8.3 7.9 8.6 8.4 8.3 8.61 Andhra Pradesh 9.8 10.1 9.4 10.5 10.8 10.1 8.0 8.3 7.72 Assam 6.8 7.1 6.6 6.5 6.7 6.4 8.7 9.4 7.93 Bihar 6.6 6.7 6.5 6.4 6.4 6.3 8.2 8.5 7.84 Chhattisgarh 7.2 6.7 7.7 7.4 6.9 7.9 6.5 6.0 7.05 Delhi 6.9 6.6 7.3 6.8 6.2 7.6 6.9 6.6 7.36 Gujarat 8.6 7.9 9.4 8.9 8.1 9.8 8.3 7.6 9.07 Haryana 7.7 7.2 8.3 7.8 7.2 8.5 7.4 7.0 7.88 HimachalPradesh 11.1 10.9 11.4 11.3 11.1 11.6 8.9 8.9 8.99 Jammu&Kashmir 9.3 9.3 9.4 9.0 9.0 9.1 10.1 10.0 10.110 Jharkhand 6.8 6.6 7.1 6.6 6.4 6.9 7.4 7.3 7.611 Karnataka 8.3 7.8 8.9 8.8 8.2 9.5 7.6 7.4 7.912 Kerala 13.2 12.5 13.9 13.4 12.7 14.1 13.0 12.2 13.813 Madhya Pradesh 7.2 6.9 7.5 7.1 6.8 7.5 7.3 7.1 7.614 Maharashtra 9.3 8.9 9.7 10.3 9.6 11.0 8.1 8.0 8.115 Odisha 9.9 10.1 9.8 10.2 10.3 10.0 8.7 8.8 8.616 Punjab 10.4 9.9 11.0 11.2 10.6 12.0 9.2 8.8 9.617 Rajasthan 7.5 6.7 8.3 7.5 6.6 8.4 7.6 7.0 8.118 TamilNadu 10.5 10.3 10.7 10.8 10.4 11.2 10.2 10.2 10.319 Telangana 8.4 8.5 8.3 9.9 9.9 9.8 6.2 6.5 5.920 UttarPradesh 7.0 6.7 7.4 7.0 6.7 7.5 6.9 6.7 7.121 Uttarakhand 9.0 8.3 9.8 9.8 8.7 10.4 7.6 7.4 7.922 WestBengal 9.0 9.0 8.9 7.9 7.6 8.2 11.4 12.3 10.5Source: SRS Statistical Report 2016, O/o Registrar General of India
Source: SRS Statistical Report 2016, O/o Registrar General of India

20 National Health Profile 2018
1.1.6State/UTwisedistributionofDistricts,Sub-Districts,TownsandVillagesinIndia,2011
S.No. India/State/UT Numberofdistricts Numberofsub-districts Numberoftowns(includingCensusTowns)
Numberofvillages(includinguninhabited
villages)
India 640 5988 7933 640932
1 Andhra Pradesh 23 1128 353 27800
2 Arunachal Pradesh 16 188 27 5589
3 Assam 27 184 214 26395
4 Bihar 38 534 199 44874
5 Chhattisgarh 18 149 182 20126
6 Goa 2 11 70 334
7 Gujarat 26 225 348 18225
8 Haryana 21 74 154 6841
9 HimachalPradesh 12 117 59 20690
10 Jammu&Kashmir 22 82 122 6553
11 Jharkhand 24 259 228 32394
12 Karnataka 30 180 347 29340
13 Kerala 14 63 520 1018
14 Madhya Pradesh 50 342 476 54903
15 Maharashtra 35 357 534 43665
16 Manipur 9 38 51 2582
17 Meghalaya 7 39 22 6839
18 Mizoram 8 29 23 830
19 Nagaland 11 114 26 1428
20 Odisha 30 477 223 51311
21 Puducherry 4 8 10 90
22 Punjab 20 77 217 12581
23 Rajasthan 33 244 297 44672
24 Sikkim 4 9 9 451
25 TamilNadu 32 216 1097 15979
26 Tripura 4 44 42 875
27 UttarPradesh 71 312 915 106774
28 Uttarakhand 13 78 115 16793
29 WestBengal 19 360 909 40203
30 A&NIslands 3 9 5 555
31 Chandigarh 1 1 6 5
32 D&NHaveli 1 1 6 65
33 Daman&Diu 2 2 8 19
34 Delhi 9 27 113 112
35 Lakshadweep 1 10 6 21Source: Census of India, 2011

21National Health Profile 2018
1.2VitalStatistics1.2.1EstimatedBirthRate,DeathRateandNaturalGrowthRateinIndia,1991-2016S.No. Year BirthRate* DeathRate* NaturalGrowthRate*
Rural Urban Total Rural Urban Total Rural Urban Total
1 1991 30.9 24.3 29.5 10.6 7.1 9.8 20.3 17.2 19.7
2 1992 30.9 23.1 29.2 10.9 7.0 10.1 20.0 16.1 19.1
3 1993 30.4 23.7 28.7 10.6 5.8 9.3 19.8 17.9 19.4
4 1994 30.5 23.1 28.7 10.1 6.7 9.3 20.4 16.4 19.4
5 1995 30.0 22.7 28.3 9.8 6.6 9.0 20.2 16.1 19.3
6 1996 29.3 21.6 27.5 9.7 6.5 9.0 19.6 15.1 18.5
7 1997 28.9 21.5 27.2 9.6 6.5 8.9 19.3 15.0 18.3
8 1998 28.0 21.0 26.5 9.7 6.6 9.0 18.3 14.5 17.5
9 1999 27.6 20.8 26.1 9.4 6.3 8.7 18.2 14.5 17.4
10 2000 27.6 20.7 25.8 9.3 6.3 8.5 18.3 14.4 17.3
11 2001 27.1 20.3 25.4 9.1 6.3 8.4 18.1 14.0 17.0
12 2002 26.6 20.0 25.0 8.7 6.1 8.1 17.9 13.9 16.9
13 2003 26.4 19.8 24.8 8.7 6.0 8.0 17.8 13.8 16.8
14 2004 25.9 19.0 24.1 8.2 5.8 7.5 17.8 13.3 16.6
15 2005 25.6 19.1 23.8 8.1 6.0 7.6 17.5 13.1 16.3
16 2006 25.2 18.8 23.5 8.1 6.0 7.5 17.2 12.8 16.0
17 2007 24.7 18.6 23.1 8.0 6.0 7.4 16.8 12.7 15.7
18 2008 24.4 18.5 22.8 8.0 5.9 7.4 16.5 12.6 15.4
19 2009 24.1 18.3 22.5 7.8 5.8 7.3 16.3 12.5 15.2
20 2010 23.7 18.0 22.1 7.7 5.8 7.2 15.9 12.2 14.9
21 2011 23.3 17.6 21.8 7.6 5.7 7.1 15.7 11.9 14.7
22 2012 23.1 17.4 21.6 7.6 5.6 7.0 15.5 11.8 14.5
23 2013 22.9 17.3 21.4 7.5 5.6 7.0 15.4 11.7 14.4
24 2014 22.7 17.4 21.0 7.3 5.5 6.7 15.4 11.9 14.3
25 2015 22.4 17.3 20.8 7.1 5.4 6.5 15.4 11.9 14.3
26 2016 22.1 17.0 20.4 6.9 5.4 6.4 15.2 11.7 14.0Source: 1. SRS Bulletin - September, 13 Vol 48 No. 22. SRS Bulletin - September, 14 Vol 49 No. 13. SRS Bulletin - July,16,Vol 50 No. 14. SRS Bulletin - December, 16 Vol 50 No. 25. SRS Bulletin - September, 17 Vol 51 No. 1Notes: *Rateper1000MidYearPopulation.

22 National Health Profile 2018
Source: SRS Bulletin, O/o Registrar General of India

23National Health Profile 2018
1.2.2State/UTwisedistributionofBirthRatesinIndia2014,2015and2016
S.No. India/State/UT BirthRate-2014 BirthRate-2015 BirthRate-2016Total Rural Urban Total Rural Urban Total Rural Urban
India 21.0 22.7 17.4 20.8 22.4 17.3 20.4 22.1 17.01 Andhra Pradesh 17.0 17.3 16.3 16.8 17.1 16.1 16.4 16.7 15.82 Arunachal Pradesh 19.2 20.4 13.2 18.8 19.5 15.3 18.9 19.5 16.13 Assam 22.4 23.6 15.5 22.0 23.2 15.3 21.7 22.8 15.04 Bihar 25.9 26.9 19.9 26.3 27.1 20.6 26.8 27.7 21.15 Chhattisgarh 23.4 25.0 18.4 23.2 24.8 18.3 22.8 24.3 18.16 Goa 12.9 12.5 13.3 12.7 12.3 13.1 12.9 12.1 13.57 Gujarat 20.6 22.6 18.2 20.4 22.4 18.0 20.1 22.0 17.78 Haryana 21.2 22.6 18.7 20.9 22.3 18.4 20.7 22.0 18.39 HimachalPradesh 16.4 16.9 10.8 16.3 16.8 10.6 16.0 16.5 10.510 Jammu&Kashmir 16.8 18.7 12.5 16.2 18.0 10.7 15.7 17.4 11.911 Jharkhand 23.8 25.2 19.3 23.5 25.0 19.2 22.9 24.5 18.412 Karnataka 18.1 19.0 16.6 17.9 18.8 16.5 17.6 18.5 16.213 Kerala 14.8 14.9 14.8 14.8 14.8 14.8 14.3 14.3 14.414 Madhya Pradesh 25.7 27.9 19.9 25.5 27.6 19.7 25.1 27.1 19.515 Maharashtra 16.5 16.8 16.0 16.3 16.6 15.9 15.9 16.3 15.516 Manipur 14.6 14.4 15.0 14.4 14.4 14.5 12.9 13.2 12.417 Meghalaya 24.1 26.2 14.7 23.7 25.7 15.0 23.7 25.9 14.018 Mizoram 16.4 19.5 13.1 16.2 19.3 13.0 15.5 18.2 12.619 Nagaland 15.3 15.3 15.3 14.8 15.0 14.6 14.0 14.4 13.320 Odisha 19.4 20.5 14.2 19.2 20.3 14.1 18.6 19.6 13.721 Punjab 15.5 16.2 14.5 15.2 15.9 14.2 14.9 15.6 14.122 Rajasthan 25.0 26.0 22.1 24.8 25.7 22.0 24.3 25.2 21.623 Sikkim 17.1 16.0 19.0 17.0 15.9 18.7 16.6 15.5 18.524 TamilNadu 15.4 15.5 15.4 15.2 15.3 15.2 15.0 15.1 15.025 Telangana 18.0 18.4 17.4 17.8 18.2 17.2 17.5 17.8 17.0
26 Tripura 14.9 15.9 12.3 14.7 15.7 12.3 13.7 14.6 11.327 UttarPradesh 27.0 28.3 23.3 26.7 27.9 23.0 26.2 27.3 22.828 Uttarakhand 18.2 18.5 17.3 17.8 18.0 17.1 16.6 16.8 16.029 WestBengal 15.6 17.6 11.1 15.5 17.3 11.6 15.4 16.9 11.830 A&NIsland 14.7 14.9 14.5 12.0 12.8 10.8 11.7 12.5 10.631 Chandigarh 14.3 19.9 14.2 13.7 23.0 13.5 13.9 19.2 13.832 D&NHaveli 25.6 21.4 29.4 25.5 21.2 28.9 24.5 20.4 27.733 Daman&Diu 17.3 17.4 17.3 17.1 17.1 17.1 24.0 16.7 25.834 Delhi 16.8 18.1 16.7 16.4 17.9 16.4 15.5 17.0 15.535 Lakshadweep 14.0 17.6 13.0 14.7 18.2 13.9 18.9 24.0 17.636 Puducherry 14.6 15.2 14.3 13.8 13.8 13.9 13.9 13.6 14.0Source: 1. SRS Bulletin - September, 14 Vol 49 No. 12. SRS Bulletin - July, 16 Vol 50 No. 13. SRS Bulletin - December, 16 Vol 50 No. 24. SRS Bulletin-September, 17, Vol. 51, No.1.Notes: 1.BirthRateper1000MidYearPopulation.
24 National Health Profile 2018
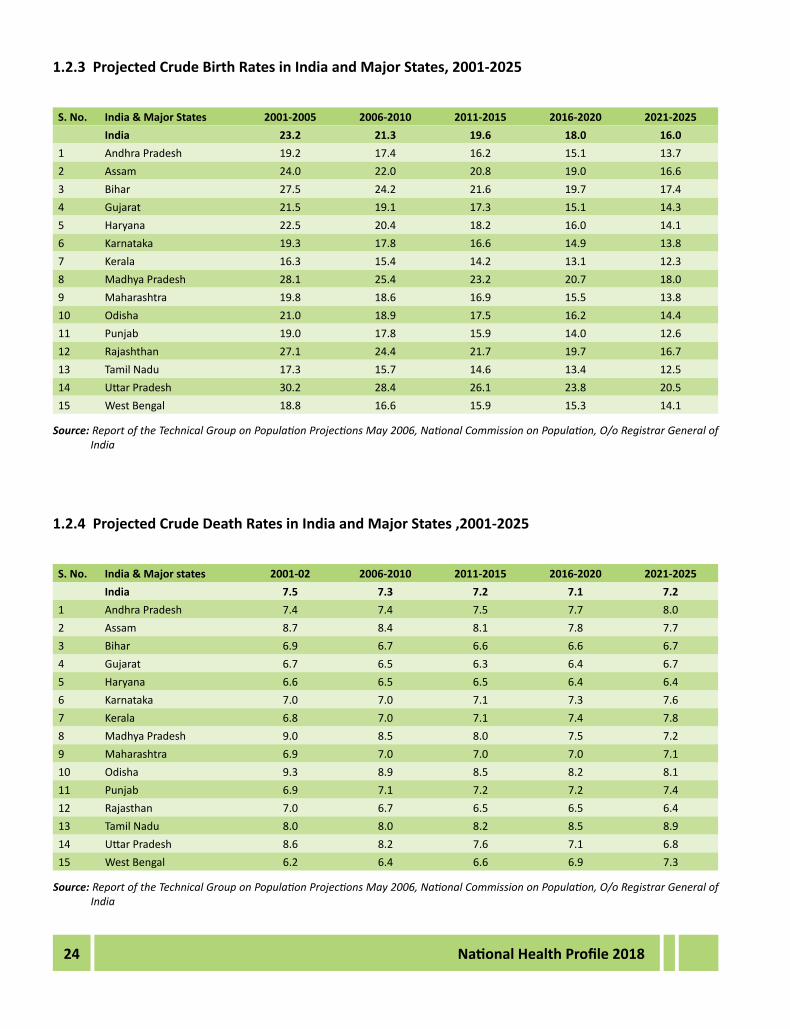
1.2.3ProjectedCrudeBirthRatesinIndiaandMajorStates,2001-2025
S.No. India&MajorStates 2001-2005 2006-2010 2011-2015 2016-2020 2021-2025India 23.2 21.3 19.6 18.0 16.0
1 Andhra Pradesh 19.2 17.4 16.2 15.1 13.72 Assam 24.0 22.0 20.8 19.0 16.63 Bihar 27.5 24.2 21.6 19.7 17.44 Gujarat 21.5 19.1 17.3 15.1 14.35 Haryana 22.5 20.4 18.2 16.0 14.16 Karnataka 19.3 17.8 16.6 14.9 13.87 Kerala 16.3 15.4 14.2 13.1 12.38 Madhya Pradesh 28.1 25.4 23.2 20.7 18.09 Maharashtra 19.8 18.6 16.9 15.5 13.810 Odisha 21.0 18.9 17.5 16.2 14.411 Punjab 19.0 17.8 15.9 14.0 12.612 Rajashthan 27.1 24.4 21.7 19.7 16.713 TamilNadu 17.3 15.7 14.6 13.4 12.514 UttarPradesh 30.2 28.4 26.1 23.8 20.515 WestBengal 18.8 16.6 15.9 15.3 14.1
Source: Report of the Technical Group on Population Projections May 2006, National Commission on Population, O/o Registrar General of India
1.2.4ProjectedCrudeDeathRatesinIndiaandMajorStates,2001-2025
S.No. India&Majorstates 2001-02 2006-2010 2011-2015 2016-2020 2021-2025India 7.5 7.3 7.2 7.1 7.2
1 Andhra Pradesh 7.4 7.4 7.5 7.7 8.02 Assam 8.7 8.4 8.1 7.8 7.73 Bihar 6.9 6.7 6.6 6.6 6.74 Gujarat 6.7 6.5 6.3 6.4 6.75 Haryana 6.6 6.5 6.5 6.4 6.46 Karnataka 7.0 7.0 7.1 7.3 7.67 Kerala 6.8 7.0 7.1 7.4 7.88 Madhya Pradesh 9.0 8.5 8.0 7.5 7.29 Maharashtra 6.9 7.0 7.0 7.0 7.110 Odisha 9.3 8.9 8.5 8.2 8.111 Punjab 6.9 7.1 7.2 7.2 7.412 Rajasthan 7.0 6.7 6.5 6.5 6.413 TamilNadu 8.0 8.0 8.2 8.5 8.914 UttarPradesh 8.6 8.2 7.6 7.1 6.815 WestBengal 6.2 6.4 6.6 6.9 7.3
Source: Report of the Technical Group on Population Projections May 2006, National Commission on Population, O/o Registrar General of India

25National Health Profile 2018
1.2.5(a)State/UTwisedistributionofDeathRatebysexandresidence,2015
S.No. India/State/UT Total Rural Urban
Total Males Females Total Males Females Total Males Females
India 6.5 6.9 6.1 7.1 7.4 6.7 5.4 5.8 5.0
1 Andhra Pradesh 7.1 7.8 6.4 7.9 8.8 7.1 5.0 5.3 4.7
2 Arunachal Pradesh 6.0 5.8 6.3 6.5 6.2 6.8 3.7 3.8 3.5
3 Assam 7.1 7.7 6.4 7.4 8.1 6.7 5.1 5.6 4.5
4 Bihar 6.2 5.8 6.6 6.3 5.9 6.8 5.1 5.2 5.1
5 Chhattisgarh 7.5 7.9 7.0 8.1 8.5 7.7 5.6 6.3 4.8
6 Goa 6.4 7.5 5.3 7.6 8.5 6.5 5.5 6.6 4.3
7 Gujarat 6.1 6.6 5.6 6.5 7.3 5.6 5.6 5.7 5.6
8 Haryana 6.1 6.6 5.4 6.3 6.8 5.6 5.7 6.3 5.1
9 HimachalPradesh 6.6 8.1 5.1 6.8 8.4 5.2 4.2 4.5 3.8
10 Jammu&Kashmir 4.9 5.7 4.0 5.1 5.9 4.2 4.4 5.2 3.5
11 Jharkhand 5.8 5.7 5.9 6.1 5.9 6.3 4.9 5.1 4.7
12 Karnataka 6.6 7.0 6.3 7.7 8.2 7.2 5.0 5.2 4.8
13 Kerala 6.6 7.6 5.7 6.7 7.9 5.7 6.4 7.3 5.7
14 Madhya Pradesh 7.5 8.1 6.9 8.1 8.8 7.5 5.9 6.3 5.5
15 Maharashtra 5.8 6.0 5.5 6.6 6.5 6.6 4.7 5.4 3.9
16 Manipur 4.0 4.5 3.5 3.9 4.5 3.2 4.2 4.4 4.1
17 Meghalaya 7.4 8.1 6.7 7.8 8.4 7.2 5.5 6.5 4.5
18 Mizoram 4.2 4.8 3.7 5.2 5.9 4.4 3.3 3.5 3.1
19 Nagaland 3.0 3.1 2.9 3.2 3.6 2.8 2.7 2.3 3.1
20 Odisha 7.6 8.5 6.7 7.9 8.8 6.9 6.3 6.6 6.0
21 Punjab 6.2 6.5 5.7 6.9 7.2 6.5 5.1 5.6 4.6
22 Rajasthan 6.3 6.9 5.7 6.7 7.4 5.9 5.2 5.4 5.0
23 Sikkim 5.0 5.9 4.4 5.9 6.8 5.0 3.5 4.6 3.5
24 TamilNadu 6.7 7.6 5.8 7.6 8.4 6.6 6.0 6.8 5.1
25 Telangana 6.5 7.1 6.0 7.5 8.2 6.8 4.9 5.2 4.6
26 Tripura 5.2 5.7 4.6 4.9 5.3 4.3 6.0 6.7 5.3
27 UttarPradesh 7.2 7.3 7.1 7.7 7.8 7.5 5.7 5.8 5.7
28 Uttarakhand 6.4 7.2 5.6 6.8 7.7 5.8 5.6 6.2 4.9
29 WestBengal 5.9 6.3 5.5 5.8 6.1 5.5 6.2 6.6 5.7
30 A&NIslands 5.0 5.7 4.3 4.8 5.5 4.1 5.3 5.8 4.7
31 Chandigarh 4.4 4.9 3.8 3.1 4.9 1.0 4.4 4.9 3.8
32 D&NHaveli 3.9 4.0 3.9 4.5 5.0 4.0 3.5 3.2 3.8
33 Daman&Diu 4.7 4.7 4.7 5.4 5.5 5.3 4.5 4.5 4.6
34 Delhi 3.6 3.8 3.3 4.3 4.4 4.2 3.5 3.8 3.3
35 Lakshadweep 6.2 6.4 6.0 9.5 9.2 9.8 5.5 5.8 5.2
36 Puducherry 6.8 7.5 6.2 8.5 9.9 7.3 6.2 6.6 5.8Source: SRS Bulletin - December, 16 Vol 50 No. 2Notes : DeathRateper1000MidYearPopulation

26 National Health Profile 2018
1.2.5(b)State/UTwisedistributionofDeathRatebysexandresidence,2016
S.No. India/State/UT Total Rural Urban
Total Males Females Total Males Females Total Males Females
India 6.4 6.8 5.9 6.9 7.3 6.4 5.4 5.8 4.9
1 Andhra Pradesh 6.8 7.5 6.1 7.7 8.4 6.8 4.9 5.2 4.5
2 Arunachal Pradesh 6.2 6.0 6.4 6.5 6.3 6.8 4.5 4.8 4.1
3 Assam 6.7 7.4 6.0 7.1 7.8 6.3 4.9 5.5 4.3
4 Bihar 6.0 6.0 6.0 6.1 6.1 6.1 5.5 5.4 5.5
5 Chhattisgarh 7.4 7.8 7.0 7.8 8.3 7.3 6.2 6.4 5.9
6 Goa 6.7 7.7 5.7 7.6 8.4 6.8 6.1 7.2 4.9
7 Gujarat 6.1 6.6 5.5 6.5 7.4 5.6 5.5 5.6 5.4
8 Haryana 5.9 6.5 5.2 6.3 7.0 5.5 5.1 5.5 4.5
9 HimachalPradesh 6.8 8.0 5.6 7.0 8.3 5.8 4.3 5.0 3.6
10 Jammu&Kashmir 5.0 5.8 4.1 5.2 6.1 4.3 4.4 5.1 3.6
11 Jharkhand 5.5 5.1 6.0 5.8 5.2 6.4 4.7 5.0 4.5
12 Karnataka 6.7 7.2 6.2 7.9 8.5 7.3 4.9 5.2 4.6
13 Kerala 7.6 8.5 6.7 7.3 8.2 6.4 7.8 8.9 6.9
14 Madhya Pradesh 7.1 7.8 6.4 7.6 8.4 6.8 5.7 6.1 5.4
15 Maharashtra 5.9 6.2 5.5 6.9 6.9 6.8 4.6 5.3 3.9
16 Manipur 4.5 5.1 3.9 4.4 5.2 3.5 4.8 5.0 4.5
17 Meghalaya 6.6 7.7 5.5 7.0 8.2 5.7 5.0 5.6 4.5
18 Mizoram 4.2 4.7 3.7 4.4 4.4 4.3 4.1 5.1 3.1
19 Nagaland 4.5 4.9 4.1 5.6 6.6 4.4 2.8 2.2 3.5
20 Odisha 7.8 8.5 7.1 8.1 8.9 7.3 6.1 6.4 5.8
21 Punjab 6.0 6.4 5.4 6.6 7.0 6.1 5.1 5.7 4.4
22 Rajasthan 6.1 6.7 5.4 6.4 7.2 5.5 5.2 5.2 5.2
23 Sikkim 4.7 5.6 3.7 5.5 6.7 4.1 3.4 3.8 3.1
24 TamilNadu 6.4 7.2 5.5 7.1 8.0 6.3 5.7 6.5 4.8
25 Telangana 6.1 6.7 5.4 7.1 7.8 6.2 4.6 4.9 4.2
26 Tripura 5.5 5.9 5.0 5.2 6.0 4.4 6.1 5.7 6.5
27 UttarPradesh 6.9 7.0 6.7 7.3 7.5 7.1 5.5 5.6 5.4
28 Uttarakhand 6.7 7.9 5.5 7.0 8.4 5.6 5.9 6.8 5.0
29 WestBengal 5.8 6.1 5.5 5.7 6.0 5.3 6.1 6.5 5.8
30 A&NIslands 5.2 6.1 4.3 5.7 7.1 4.2 4.6 4.8 4.3
31 Chandigarh 4.5 5.0 4.0 1.6 1.7 1.4 4.6 5.1 4.0
32 D&NHaveli 4.0 4.0 3.9 5.0 4.9 5.1 3.2 3.4 2.8
33 Daman&Diu 4.6 5.0 4.1 6.1 6.7 5.4 4.2 4.6 3.7
34 Delhi 4.0 4.5 3.5 4.5 4.6 4.4 4.0 4.5 3.5
35 Lakshadweep 6.0 7.1 4.9 7.9 8.1 7.7 5.5 6.8 4.2
36 Puducherry 7.2 9.7 4.8 7.8 10.8 4.9 6.9 9.3 4.7Source: SRS Bulletin - September-17, Vol. 51, No.1Notes :DeathRateper1000MidYearPopulation

27National Health Profile 2018
1.2.6(a)ProjectedLevelsofExpectationofLifeatBirthinIndiaandMajorStates,2001-2025
S.No. India&MajorStates
2001-05 2006-10 2011-15 2016-20 2021-25
Male Female Male Female Male Female Male Female Male Female
India 63.8 66.1 65.8 68.1 67.3 69.6 68.8 71.1 69.8 72.3
1 Andhra Pradesh 63.4 67.9 65.4 69.4 66.9 70.9 68.4 72.1 69.4 73.3
2 Assam 59.6 60.8 61.6 62.8 63.6 64.8 65.6 66.8 67.1 68.8
3 Bihar 65.6 64.7 67.1 66.7 68.6 68.7 69.6 70.2 70.6 71.4
4 Gujarat 64.9 69.0 67.2 71.0 69.2 72.5 70.7 73.7 71.9 74.9
5 Haryana 66.4 68.3 67.9 69.8 68.9 71.3 69.9 72.5 70.9 73.7
6 Karnataka 64.5 69.6 66.5 71.1 68.0 72.3 69.0 73.5 70.0 74.5
7 Kerala 70.8 76.0 72.0 76.8 73.2 77.6 74.2 78.1 75.2 78.6
8 Madhya Pradesh 60.5 61.3 62.5 63.3 64.5 65.3 66.5 67.3 68.0 69.3
9 Maharashtra 66.4 69.8 67.9 71.3 68.9 72.5 69.9 73.7 70.9 74.7
10 Odisha 60.3 62.3 62.3 64.8 64.3 67.3 66.3 69.6 67.8 71.6
11 Punjab 67.7 70.4 68.7 71.6 69.7 72.8 70.7 73.8 71.5 74.8
12 Rajasthan 64.1 67.2 66.1 69.2 67.6 70.7 68.6 71.9 69.6 73.1
13 TamilNadu 66.1 69.1 67.6 70.6 68.6 71.8 69.6 73.0 70.6 74.0
14 UttarPradesh 62.0 61.9 64.0 64.4 66.0 66.9 67.5 69.2 68.7 71.2
15 WestBengal 66.7 69.4 68.2 70.9 69.2 72.1 70.2 73.3 71.0 74.3
Source: Report of the Technical Group on Population Projections May 2006, National Commission on Population, O/o Registrar General of India

28 National Health Profile 2018
1.2.6(b):Expectationoflifeatbirthbysexandresidence,India*,1970-75to2011-15
Period Mid Year Total Rural Urban
Total Male Female Total Male Female Total Male Female
1970-75 1973 49.7 50.5 49.0 48.0 48.9 47.1 58.9 58.8 59.2
1976-80 1978 52.3 52.5 52.1 50.6 51.0 50.3 60.1 59.6 60.8
1981-85 1983 55.4 55.4 55.7 53.7 54.0 53.6 62.8 61.6 64.1
1986-90 1988 57.7 57.7 58.1 56.1 56.1 56.2 63.4 62.0 64.9
1987-91 1989 58.3 58.1 58.6 56.8 56.7 56.9 63.8 62.3 65.3
1988-92 1990 58.7 58.6 59.0 57.4 57.2 57.4 64.1 62.8 65.5
1989-93 1991 59.4 59.0 59.7 58.0 57.9 58.1 64.9 63.5 66.3
1990-94 1992 60.0 59.4 60.4 58.6 58.2 58.7 65.4 64.1 66.7
1991-95 1993 60.3 59.7 60.9 58.9 58.5 59.3 65.9 64.5 67.3
1992-96 1994 60.7 60.1 61.4 59.4 58.9 59.8 66.3 64.9 67.7
1993-97 1995 61.1 60.4 61.8 59.9 59.3 60.2 66.6 65.1 68.0
1994-98 1996 61.4 60.6 62.2 60.1 59.5 60.5 66.8 65.3 68.2
1995-99# 1997 61.5 60.8 62.3 60.3 59.7 60.9 66.4 65.1 67.9
1996-00# 1998 61.9 61.2 62.7 60.7 60.1 61.3 66.7 65.4 68.3
1997-01# 1999 62.3 61.4 63.3 61.1 60.3 61.9 67.1 65.7 68.7
1998-02 2000 62.9 61.9 64.0 61.6 60.7 62.5 67.6 66.1 69.2
1999-03 2001 63.4 62.3 64.6 62.2 61.1 63.2 68.0 66.5 69.7
2000-04 2002 63.9 62.8 65.2 62.7 61.6 63.8 68.4 66.9 70.0
2001-05 2003 64.3 63.1 65.6 63.0 61.9 64.2 68.6 67.2 70.3
2002-06 2004 64.7 63.5 66.1 63.5 62.3 64.7 68.9 67.4 70.6
2003-07 2005 65.0 63.7 66.5 63.8 62.6 65.2 69.0 67.5 70.7
2004-08 2006 65.4 64.0 66.9 64.2 62.9 65.7 69.0 67.5 70.8
2005-09 2007 65.7 64.3 67.2 64.5 63.2 66.0 69.2 67.6 71.0
2006-10 2008 66.1 64.6 67.7 64.9 63.5 66.5 69.6 68.0 71.4
2007-11 2009 66.5 64.9 68.2 65.3 63.8 67.0 70.1 68.4 71.9
2008-12 2010 67.0 65.4 68.8 65.8 64.2 67.6 70.6 69.0 72.4
2009-13 2011 67.5 65.8 69.3 66.3 64.6 68.1 71.2 69.6 73.0
2010-14 2012 67.9 66.4 69.6 66.7 65.1 68.4 71.5 70.0 73.5
2011-15 2013 68.3 66.9 70.0 67.1 65.6 68.7 71.9 70.5 73.5
Source: SRS based Abridge Life Tables, O/o Registrar General of IndiaNotes : *IndiaincludesallStates/UTs #DataforJammu&Kashmirisnotincluded
29National Health Profile 2018
Source: SRS based Abridge Life Tables, O/o Registrar General of India

30 National Health Profile 2018
1.2.7InfantMortalityRatesinIndia,1994-2016
S.No. Period InfantMortalityRate
Rural Urban Total
1 1994 80 52 74
2 1995 80 48 74
3 1996 77 46 72
4 1997 77 45 71
5 1998 77 45 72
6 1999 75 44 70
7 2000 74 44 68
8 2001 72 42 66
9 2002 69 40 63
10 2003 66 38 60
11 2004 64 40 58
12 2005 64 40 58
13 2006 62 39 57
14 2007 61 37 55
15 2008 58 36 53
16 2009 55 34 50
17 2010 51 31 47
18 2011 48 29 44
19 2012 46 28 42
20 2013 44 27 40
21 2014 43 26 39
22 2015 41 25 37
22 2016 38 23 34Source: SRS Bulletin, O/o Registrar General of India.Notes: 1 Per1000livebirths2 1994to1997&2010:ExcludesJammu&Kashmir3 1994to2010:ExcludesMizoram4 1995to2010:ExcludesNagaland(Rural)

31National Health Profile 2018
Source: SRS Bulletin, O/o Registrar General of India

32 National Health Profile 2018
1.2.8(a)State/UTwiseInfantMortalityRatesbySexandResidenceinIndia,2015
S.No. India/State/UT Total Rural UrbanTotal Male Female Total Male Female Total Male Female
India 37 35 39 41 40 43 25 23 281 Andhra Pradesh 37 36 38 41 41 42 26 25 282 Arunachal Pradesh 30 31 30 _ _ _ _ _ _3 Assam 47 47 47 50 50 50 25 24 264 Bihar 42 36 50 42 36 49 44 37 525 Chhattisgarh 41 40 41 43 42 43 32 31 336 Goa 9 8 11 - _ _
7 Gujarat 33 33 34 41 41 42 21 20 228 Haryana 36 36 37 39 38 41 30 30 309 HimachalPradesh 28 28 27 _ _ _
10 Jammu&Kashmir 26 25 27 27 25 28 24 25 2311 Jharkhand 32 30 35 35 32 38 22 23 2012 Karnataka 28 26 30 30 28 32 23 22 2513 Kerala 12 10 13 13 11 15 10 10 1114 Madhya Pradesh 50 51 48 54 56 52 34 34 3515 Maharashtra 21 19 22 26 24 28 14 12 1516 Manipur 9 8 10 _ _ _ _ _ _17 Meghalaya 42 42 43 _ _ _ _ _ _18 Mizoram 32 33 32 _ _ _ _ _ _19 Nagaland 12 10 15 _ _ _ _ _ _20 Odisha 46 45 47 48 47 49 35 37 3421 Punjab 23 22 24 24 23 25 20 18 2222 Rajasthan 43 40 47 48 44 52 27 26 2823 Sikkim 18 15 21 _ _ _ _ _ _24 TamilNadu 19 19 19 22 23 22 16 15 1725 Telangana 34 33 34 37 38 37 27 26 28
26 Tripura 20 19 21 _ _ _ _ _ _27 UttarPradesh 46 44 48 48 48 49 36 30 4228 Uttarakhand 34 31 38 31 27 35 44 44 4529 WestBengal 26 25 28 27 25 28 24 23 2530 A&NIslands 20 17 23 _ _ _ _ _ _31 Chandigarh 21 20 23 _ _ _ _ _ _32 D&NHaveli 21 21 21 _ _ _ _ _ _33 Daman&Diu 18 18 19 _ _ _ _ _ _34 Delhi 18 18 19 27 27 28 18 17 1935 Lakshadweep 20 20 19 _ _ _ _ _ _36 Puducherry 11 8 14 _ _ _ _ _ _Source: SRS Bulletin- December, 16, Vol 50 No. 2, O/o Registrar General of IndiaNotes:1. Per1000livebirths2. InfantMortality rates for smaller States andUTs are based on three years period 2013-15.On account ofwide year to year
fluctuationsduetoinadequatesamplesize,theinfantmortalityratebysex,separatelyforruralandurbanareasisnotgiven.
33National Health Profile 2018
1.2.8(b)State/UTwiseInfantMortalityRatesbySexandResidenceinIndia,2016
S.No. India/State/UT Total Rural UrbanTotal Male Female Total Male Female Total Male Female
India 34 33 36 38 37 40 23 22 251 Andhra Pradesh 34 33 35 38 37 38 24 23 262 Arunachal Pradesh 36 35 37 _ _ _ _ _ _3 Assam 44 43 45 46 45 47 22 22 224 Bihar 38 31 46 39 31 47 29 26 345 Chhattisgarh 39 39 38 41 41 40 31 31 316 Goa 8 8 9 - _ _ _ _ _7 Gujarat 30 31 30 38 39 37 19 18 198 Haryana 33 31 35 35 33 38 27 26 289 HimachalPradesh 25 23 26 _ _ _ _ _ _
10 Jammu&Kashmir 24 24 25 25 24 26 23 23 2311 Jharkhand 29 27 31 31 28 34 21 22 2012 Karnataka 24 22 27 27 25 30 19 17 2113 Kerala 10 9 11 10 10 11 10 8 1114 Madhya Pradesh 47 49 44 50 53 47 33 34 3115 Maharashtra 19 18 19 24 22 25 13 13 1316 Manipur 11 10 13 _ _ _ _ _ _17 Meghalaya 39 41 37 _ _ _ _ _ _18 Mizoram 27 26 29 _ _ _ _ _ _19 Nagaland 12 5 21 _ _ _ _ _ _20 Odisha 44 44 44 46 45 46 34 36 3121 Punjab 21 20 21 23 23 23 18 17 1822 Rajasthan 41 39 44 45 42 47 30 27 3323 Sikkim 16 13 19 _ _ _ _ _ _24 TamilNadu 17 18 17 20 22 18 14 14 1525 Telangana 31 31 30 35 36 33 24 24 25
26 Tripura 24 25 22 _ _ _ _ _ _27 UttarPradesh 43 41 45 46 45 47 34 29 4028 Uttarakhand 38 36 41 41 39 44 29 27 3229 WestBengal 25 24 26 25 25 26 22 22 2330 A&NIslands 16 15 17 _ _ _ _ _ _31 Chandigarh 14 13 14 _ _ _ _ _ _32 D&NHaveli 17 16 17 _ _ _ _ _ _33 Daman&Diu 19 19 19 _ _ _ _ _ _34 Delhi 18 18 17 24 23 25 17 18 1635 Lakshadweep 19 22 15 _ _ _ _ _ _36 Puducherry 10 9 12 _ _ _ _ _ _Source: SRS Bulletin- September-17, Vol 51 No. 1, O/o Registrar General of IndiaNotes:1. Per1000livebirths2. InfantMortality rates for smaller States andUTs are based on three years period 2013-15.On account ofwide year to year
fluctuationsduetoinadequatesamplesize,theinfantmortalityratebysex,separatelyforruralandurbanareasisnotgiven.

34 National Health Profile 2018
Sour
ce: S
RS B
ulle
tin, O
/o R
egist
rar G
ener
al o
f Ind
ia
35National Health Profile 2018
Source: Special bulletin on Maternal Mortality in India, 2011-13, O/o Registrar General of India
1.2.9MaternalMortalityRatio(MMR)inIndiaandMajorStates2007-09,2010-12&2011-13
S.No. India&MajorStates 2007-09 2010-12 2011-13India 212 178 167
1 Andhra Pradesh 134 110 922 Assam 390 328 3003 Bihar 261 219 208*4 Gujarat 148 122 1125 Haryana 153 146 1276 Karnataka 178 144 1337 Kerala 81 66 618 Madhya Pradesh 269 230 221**9 Maharashtra 104 87 6810 Odisha 258 235 22211 Punjab 172 155 14112 Rajasthan 318 255 24413 TamilNadu 97 90 7914 UttarPradesh 359 292 285***15 WestBengal 145 117 11316 Other 160 136 126Source: Special bulletin on maternal mortality in India, 2011-13,O/o Registrar General of India.Notes: Per1,00,000LiveBirths* includesdataforJharkhandaswellfor2011-13.** includesdataforChhattisgarhaswellfor2011-13.*** includesdataforUttarakhandaswellfor2011-13.
36 National Health Profile 2018
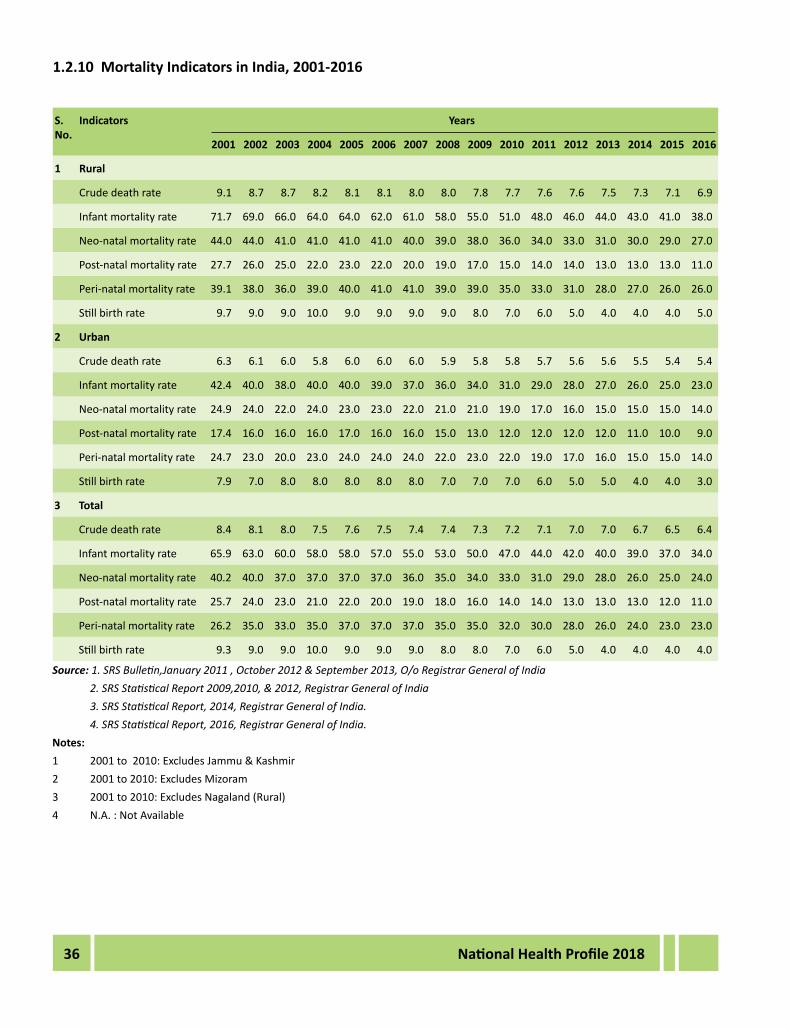
1.2.10MortalityIndicatorsinIndia,2001-2016
S.No.
Indicators Years
2001 2002 2003 2004 2005 2006 2007 2008 2009 2010 2011 2012 2013 2014 2015 2016
1 Rural
Crude death rate 9.1 8.7 8.7 8.2 8.1 8.1 8.0 8.0 7.8 7.7 7.6 7.6 7.5 7.3 7.1 6.9
Infantmortalityrate 71.7 69.0 66.0 64.0 64.0 62.0 61.0 58.0 55.0 51.0 48.0 46.0 44.0 43.0 41.0 38.0
Neo-natalmortalityrate 44.0 44.0 41.0 41.0 41.0 41.0 40.0 39.0 38.0 36.0 34.0 33.0 31.0 30.0 29.0 27.0
Post-natalmortalityrate 27.7 26.0 25.0 22.0 23.0 22.0 20.0 19.0 17.0 15.0 14.0 14.0 13.0 13.0 13.0 11.0
Peri-natalmortalityrate 39.1 38.0 36.0 39.0 40.0 41.0 41.0 39.0 39.0 35.0 33.0 31.0 28.0 27.0 26.0 26.0
Stillbirthrate 9.7 9.0 9.0 10.0 9.0 9.0 9.0 9.0 8.0 7.0 6.0 5.0 4.0 4.0 4.0 5.0
2 Urban
Crude death rate 6.3 6.1 6.0 5.8 6.0 6.0 6.0 5.9 5.8 5.8 5.7 5.6 5.6 5.5 5.4 5.4
Infantmortalityrate 42.4 40.0 38.0 40.0 40.0 39.0 37.0 36.0 34.0 31.0 29.0 28.0 27.0 26.0 25.0 23.0
Neo-natalmortalityrate 24.9 24.0 22.0 24.0 23.0 23.0 22.0 21.0 21.0 19.0 17.0 16.0 15.0 15.0 15.0 14.0
Post-natalmortalityrate 17.4 16.0 16.0 16.0 17.0 16.0 16.0 15.0 13.0 12.0 12.0 12.0 12.0 11.0 10.0 9.0
Peri-natalmortalityrate 24.7 23.0 20.0 23.0 24.0 24.0 24.0 22.0 23.0 22.0 19.0 17.0 16.0 15.0 15.0 14.0
Stillbirthrate 7.9 7.0 8.0 8.0 8.0 8.0 8.0 7.0 7.0 7.0 6.0 5.0 5.0 4.0 4.0 3.0
3 Total
Crude death rate 8.4 8.1 8.0 7.5 7.6 7.5 7.4 7.4 7.3 7.2 7.1 7.0 7.0 6.7 6.5 6.4
Infantmortalityrate 65.9 63.0 60.0 58.0 58.0 57.0 55.0 53.0 50.0 47.0 44.0 42.0 40.0 39.0 37.0 34.0
Neo-natalmortalityrate 40.2 40.0 37.0 37.0 37.0 37.0 36.0 35.0 34.0 33.0 31.0 29.0 28.0 26.0 25.0 24.0
Post-natalmortalityrate 25.7 24.0 23.0 21.0 22.0 20.0 19.0 18.0 16.0 14.0 14.0 13.0 13.0 13.0 12.0 11.0
Peri-natalmortalityrate 26.2 35.0 33.0 35.0 37.0 37.0 37.0 35.0 35.0 32.0 30.0 28.0 26.0 24.0 23.0 23.0
Stillbirthrate 9.3 9.0 9.0 10.0 9.0 9.0 9.0 8.0 8.0 7.0 6.0 5.0 4.0 4.0 4.0 4.0
Source: 1. SRS Bulletin,January 2011 , October 2012 & September 2013, O/o Registrar General of India 2. SRS Statistical Report 2009,2010, & 2012, Registrar General of India 3. SRS Statistical Report, 2014, Registrar General of India. 4. SRS Statistical Report, 2016, Registrar General of India.Notes:1 2001to2010:ExcludesJammu&Kashmir2 2001to2010:ExcludesMizoram3 2001to2010:ExcludesNagaland(Rural)4 N.A.:NotAvailable

37National Health Profile 2018
Source: Special bulletin on Maternal Mortality in India, 2011-13, O/o Registrar General of India

38 National Health Profile 2018
1.2.11(a)AgeSpecificDeathRatebySexandResidenceinIndia,2015
S.No. Age Groups Total Rural UrbanTotal Male Female Total Male Female Total Male Female
1 0-4 10.2 9.8 10.6 11.5 11.2 11.9 6.6 6.1 7.02 5-9 0.7 0.7 0.6 0.6 0.7 0.6 0.8 0.9 0.83 10-14 0.7 0.7 0.7 0.7 0.7 0.7 0.7 0.7 0.74 15-19 0.9 0.9 0.9 0.9 0.9 0.9 0.9 0.8 1.05 20-24 1.2 1.3 1.1 1.2 1.3 1.1 1.2 1.3 1.16 25-29 1.4 1.6 1.2 1.5 1.8 1.3 1.1 1.4 0.97 30-34 1.8 2.2 1.4 2.0 2.3 1.6 1.5 2.0 1.08 35-39 2.6 3.2 1.9 2.9 3.5 2.3 2.0 2.7 1.29 40-44 3.2 3.7 2.7 3.7 4.2 3.2 2.4 2.8 1.910 45-49 5.0 6.3 3.7 5.7 6.8 4.4 3.8 5.3 2.211 50-54 9.4 9.9 8.9 11.1 11.2 11.1 6.6 7.6 5.412 55-59 13.6 16.0 11.3 15.7 18.8 12.9 9.7 11.2 8.113 60-64 20.3 22.0 18.4 23.7 25.5 21.8 13.6 15.3 11.614 65-69 28.6 31.0 26.1 31.1 34.0 28.1 23.4 24.9 21.715 70-74 41.1 44.7 37.6 43.4 47.8 39.1 36.1 37.9 34.216 75-79 65.2 69.8 60.8 65.3 71.1 60.0 64.8 66.9 62.817 80-84 116.2 123.5 109.4 119.7 128.0 111.8 109.1 114.1 104.618 85+ 209.5 238.1 186.9 203.6 224.4 185.5 222.9 275.7 189.8
All Ages 6.5 6.9 6.1 7.1 7.4 6.7 5.4 5.8 5.0Source: SRS Statistical Report, 2015, O/o Registrar General of India.
1.2.11(b)AgeSpecificDeathRatebySexandResidenceinIndia,2016
S.No. Age Groups Total Rural UrbanTotal Male Female Total Male Female Total Male Female
1 0-4 9.4 9.0 9.9 10.7 10.2 11.1 6.0 5.7 6.42 5-9 0.7 0.6 0.8 0.8 0.7 0.9 0.4 0.3 0.53 10-14 0.5 0.5 0.5 0.6 0.6 0.6 0.3 0.3 0.34 15-19 0.8 0.7 0.8 0.8 0.8 0.9 0.6 0.6 0.75 20-24 1.2 1.3 1.1 1.3 1.4 1.1 1.0 1.1 0.96 25-29 1.3 1.5 1.2 1.5 1.7 1.4 1.0 1.1 0.87 30-34 1.9 2.3 1.4 2.1 2.6 1.6 1.5 1.8 1.18 35-39 2.5 3.2 1.8 2.8 3.7 2.0 1.9 2.3 1.69 40-44 3.7 4.4 2.9 4.1 4.9 3.3 2.9 3.6 2.110 45-49 5.2 6.5 3.8 5.6 7.1 3.9 4.5 5.4 3.411 50-54 8.6 9.2 8.0 9.7 9.9 9.4 6.9 7.9 5.912 55-59 13.3 16.2 10.5 14.5 18.0 11.2 11.2 13.2 9.213 60-64 18.8 21.4 16.1 20.4 23.3 17.5 15.6 17.9 13.214 65-69 28.2 31.8 24.5 29.3 33.2 25.4 25.9 28.9 22.615 70-74 45.4 48.7 42.1 47.9 52.2 43.8 39.8 41.4 38.216 75-79 64.7 72.3 57.6 66.5 74.4 59.3 60.6 67.7 53.717 80-84 115.3 120.0 110.9 124.2 130.4 118.4 97.1 98.7 95.718 85+ 197.8 219.4 181.1 202.7 216.3 190.9 186.3 228.5 161.6
All Ages 6.4 6.8 5.9 6.9 7.3 6.4 5.4 5.8 4.9Source: SRS Statistical Report, 2016, Registrar General of India.

39National Health Profile 2018
1.2.12TotalFertilityRate(TFR)byResidenceinIndiaandMajorStates,2015and2016
S.No. IndiaandBiggerStates
2015 2016
Total Rural Urban Total Rural UrbanIndia 2.3 2.5 1.8 2.3 2.5 1.8
1 Andhra Pradesh 1.7 1.8 1.6 1.7 1.7 1.52 Assam 2.3 2.4 1.6 2.3 2.4 1.63 Bihar 3.2 3.3 2.5 3.3 3.4 2.54 Chhattisgarh 2.5 2.7 1.9 2.5 2.7 1.95 Delhi 1.7 1.8 1.7 1.6 1.8 1.66 Gujarat 2.2 2.5 1.9 2.2 2.5 1.97 Haryana 2.2 2.4 2.0 2.3 2.4 2.08 HimachalPradesh 1.7 1.7 1.2 1.7 1.7 1.29 Jammu&Kashmir 1.6 1.9 1.0 1.7 1.9 1.210 Jharkhand 2.7 2.9 2.1 2.6 2.9 2.011 Karnataka 1.8 1.9 1.7 1.8 1.9 1.612 Kerala 1.8 1.8 1.8 1.8 1.8 1.813 Madhya Pradesh 2.8 3.0 2.1 2.8 3.1 2.114 Maharashtra 1.8 2.0 1.6 1.8 1.9 1.615 Odisha 2.0 2.1 1.4 2.0 2.1 1.416 Punjab 1.7 1.7 1.5 1.7 1.7 1.617 Rajasthan 2.7 2.8 2.3 2.7 2.8 2.318 TamilNadu 1.6 1.7 1.6 1.6 1.7 1.619 Telangana 1.8 1.9 1.6 1.7 1.8 1.620 UttarPradesh 3.1 3.4 2.4 3.1 3.4 2.421 Uttarkhand 2.0 2.0 1.8 1.9 1.9 1.722 WestBengal 1.6 1.7 1.2 1.6 1.7 1.3
Source: SRS Statistical Report, 2015 & 2016, Registrar General of IndiaNotes :Roundedofftoonedecimalpoint.

www.cbhid
ghs.nic.in