imf country report no. 16/387 bolivia · 4 bolivia: selected economic and financial indicators i....
TRANSCRIPT

© 2016 International Monetary Fund
IMF Country Report No. 16/387
BOLIVIA 2016 ARTICLE IV CONSULTATION—PRESS RELEASE; STAFF REPORT; AND STATEMENT BY THE EXECUTIVE DIRECTOR FOR BOLIVIA
Under Article IV of the IMF’s Articles of Agreement, the IMF holds bilateral discussions with
members, usually every year. In the context of the 2016 Article IV consultation with Bolivia, the
following documents have been released and are included in this package:
A Press Release summarizing the views of the Executive Board as expressed during its
December 9, 2016 consideration of the staff report that concluded the Article IV
consultation with Bolivia.
The Staff Report prepared by a staff team of the IMF for the Executive Board’s consideration
on December 9, 2016 following discussions that ended on October 27, 2016, with the
officials of Bolivia on economic developments and policies. Based on information available at
the time of these discussions, the staff report was completed on November 23, 2016.
An Informational Annex prepared by the IMF staff.
A Staff Statement updating information on recent developments.
A Statement by the Executive Director for Bolivia.
The IMF’s transparency policy allows for the deletion of market-sensitive information and premature
disclosure of the authorities’ policy intentions in published staff reports and other documents.
Copies of this report are available to the public from
International Monetary Fund Publication Services
PO Box 92780 Washington, D.C. 20090
Telephone: (202) 623-7430 Fax: (202) 623-7201
E-mail: [email protected] Web: http://www.imf.org
Price: $18.00 per printed copy
International Monetary Fund
Washington, D.C.
December 2016

Press Release No. 16/577
FOR IMMEDIATE RELEASE
December 22, 2016
IMF Executive Board Concludes 2016 Article IV Consultation with Bolivia
On December 9, 2016, the Executive Board of the International Monetary Fund (IMF) concluded
the Article IV consultation1 with Bolivia.
Boosted by the commodity boom, Bolivia has experienced substantial economic and social
progress. Growth has been strong, averaging around 5 percent since 2006, and poverty has fallen
by a third. During this time, the authorities built up sizable buffers and de-dollarized the financial
system to a major extent. However, with Bolivia remaining one of the most commodity-
dependent countries in the region, sharply lower commodity prices pose challenges to the
implementation of the authorities’ development objectives laid out in their Patriotic Agenda
2025. To advance their plans, the authorities are using their policy buffers, with the sizable fiscal
and external surpluses that prevailed over the past decade now turning to large twin deficits.
Real GDP growth is projected at 3.7 percent in 2016, which is still relatively strong by regional
standards. A continued supportive fiscal policy and rapid credit growth linked to the Financial
Services Law are buttressing activity and offsetting a major drought and temporary supply
shocks in gas production. However, the fiscal and external current account deficits will remain
wide. In the medium term, growth is expected to converge towards 3.5 percent, consistent with
the new commodity price normal, amid persistent twin deficits. Risks to this outlook are tilted to
the downside, with the potential for additional weakness in key emerging markets, further dollar
strength, and a larger-than-expected impact of the drought. Longer-term uncertainties relate to
1 Under Article IV of the IMF's Articles of Agreement, the IMF holds bilateral discussions with members, usually every year. A staff team visits the country, collects economic and financial information, and discusses with officials the country's economic developments and policies. On return to headquarters, the staff prepares a report, which forms the basis for discussion by the Executive Board.
International Monetary Fund
700 19th Street, NW
Washington, D. C. 20431 USA
2
future oil prices, the extent of natural gas discoveries and export contract renewals, and the
possibility of an excessive credit growth volatility.
Executive Board Assessment2
Executive Directors commended the Bolivian authorities for the sound macroeconomic
management and poverty reduction during the past commodity boom. While slowing, real GDP
growth is projected to remain robust in 2016, on the back of a sizable public investment program
and strong credit growth. Looking ahead, Directors concurred that the outlook appears
increasingly challenging, with risks tilted to the downside, owing to continued low commodity
prices and growing fiscal and external imbalances. Given the still sizable buffers, they
encouraged the authorities to plan a carefully measured approach to adjusting to the less
favorable external environment.
Directors underscored the risks arising from Bolivia’s large and widening fiscal deficits. They
encouraged the authorities to improve the non-hydrocarbons primary balance through
streamlining expenditures while increasing their efficiency. Directors recommended an early
transition to a credible medium-term fiscal framework to continue to assure debt sustainability,
while also accounting for the state of the business cycle and building cushions to absorb
volatility in hydrocarbon prices. They advised the authorities to ensure the financial health of
state-owned enterprises, exercise greater oversight of their activities, and strengthen the
evaluation and transparency of their investments.
Directors stressed the merits of enhancing the independence of the central bank, and advised
phasing out the central bank’s exposures to the state-owned enterprises to avoid potential
conflicts with the commitment to price stability. Most Directors encouraged consideration of
gradually permitting greater exchange rate flexibility, which along with structural reforms,
would improve competitiveness, facilitate the adjustment to lower commodity prices, and protect
against possible future external shocks.
2 At the conclusion of the discussion, the Managing Director, as Chairman of the Board, summarizes the views of Executive Directors, and this summary is transmitted to the country's authorities. An explanation of any qualifiers used in summings up can be found here: http://www.imf.org/external/np/sec/misc/qualifiers.htm.
3
Directors welcomed the overall soundness of the financial sector, and encouraged the authorities
to address the growing vulnerabilities. They considered that the quotas and interest caps set
under the Financial Services Law appear to be inducing banks to expand credit rapidly, which
could lead to greater risks and undermine financial inclusion. Directors suggested that the
authorities modify key provisions of the regulations to reduce distortions and avoid an
unnecessary buildup of risk. They saw scope for the authorities to utilize more market-oriented
mechanisms to achieve greater financial inclusion.
Directors agreed that accelerating structural reforms and improving the business climate are
central to improving medium-term growth prospects. They encouraged the authorities to improve
incentives for hydrocarbons exploration, bring wages back in line with productivity, and address
the severe water shortage.
Directors praised the authorities for the significant declines in inequality and poverty achieved
over the last decade, which should be preserved. They considered that better targeting and
improved efficiency of social spending could help mitigate the negative impact of lower
commodity prices on inequality and poverty.
4
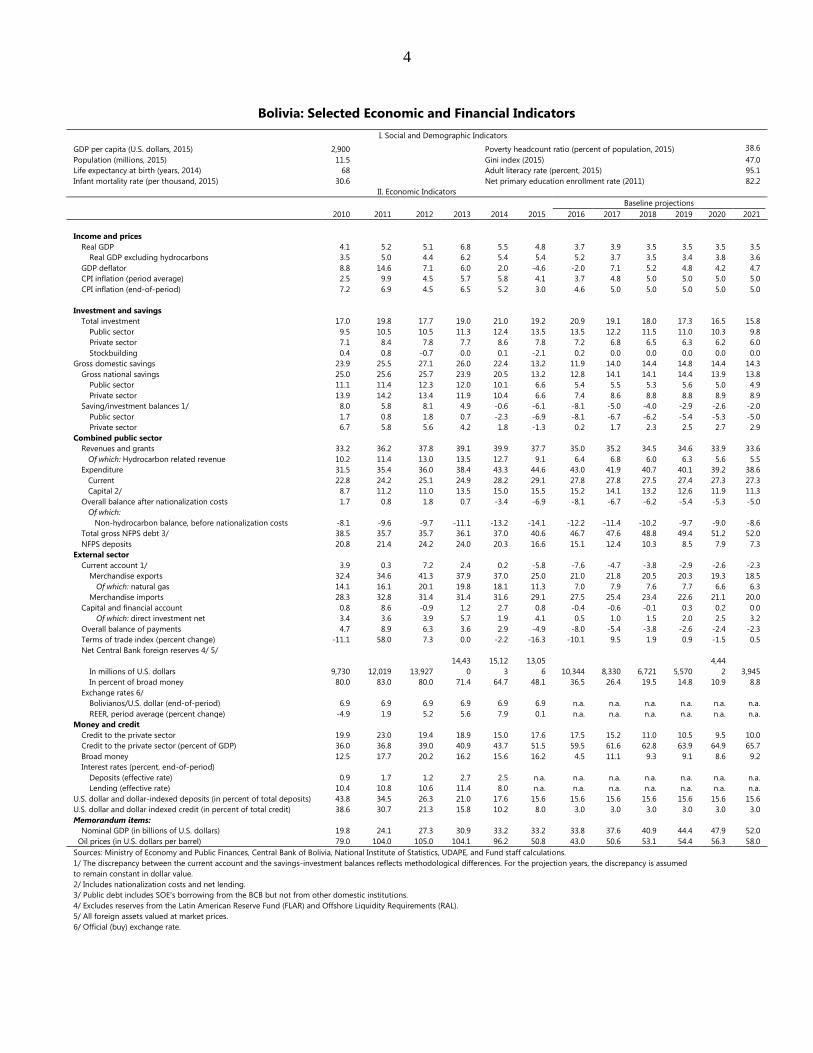
Bolivia: Selected Economic and Financial Indicators
I. Social and Demographic Indicators
GDP per capita (U.S. dollars, 2015) 2,900 Poverty headcount ratio (percent of population, 2015) 38.6
Population (millions, 2015) 11.5 Gini index (2015) 47.0
Life expectancy at birth (years, 2014) 68 Adult literacy rate (percent, 2015) 95.1
Infant mortality rate (per thousand, 2015) 30.6 Net primary education enrollment rate (2011) 82.2
II. Economic Indicators
Baseline projections
2010 2011 2012 2013 2014 2015 2016 2017 2018 2019 2020 2021
Income and prices
Real GDP 4.1 5.2 5.1 6.8 5.5 4.8 3.7 3.9 3.5 3.5 3.5 3.5
Real GDP excluding hydrocarbons 3.5 5.0 4.4 6.2 5.4 5.4 5.2 3.7 3.5 3.4 3.8 3.6
GDP deflator 8.8 14.6 7.1 6.0 2.0 -4.6 -2.0 7.1 5.2 4.8 4.2 4.7
CPI inflation (period average) 2.5 9.9 4.5 5.7 5.8 4.1 3.7 4.8 5.0 5.0 5.0 5.0
CPI inflation (end-of-period) 7.2 6.9 4.5 6.5 5.2 3.0 4.6 5.0 5.0 5.0 5.0 5.0
Investment and savings
Total investment 17.0 19.8 17.7 19.0 21.0 19.2 20.9 19.1 18.0 17.3 16.5 15.8
Public sector 9.5 10.5 10.5 11.3 12.4 13.5 13.5 12.2 11.5 11.0 10.3 9.8
Private sector 7.1 8.4 7.8 7.7 8.6 7.8 7.2 6.8 6.5 6.3 6.2 6.0
Stockbuilding 0.4 0.8 -0.7 0.0 0.1 -2.1 0.2 0.0 0.0 0.0 0.0 0.0
Gross domestic savings 23.9 25.5 27.1 26.0 22.4 13.2 11.9 14.0 14.4 14.8 14.4 14.3
Gross national savings 25.0 25.6 25.7 23.9 20.5 13.2 12.8 14.1 14.1 14.4 13.9 13.8
Public sector 11.1 11.4 12.3 12.0 10.1 6.6 5.4 5.5 5.3 5.6 5.0 4.9
Private sector 13.9 14.2 13.4 11.9 10.4 6.6 7.4 8.6 8.8 8.8 8.9 8.9
Saving/investment balances 1/ 8.0 5.8 8.1 4.9 -0.6 -6.1 -8.1 -5.0 -4.0 -2.9 -2.6 -2.0
Public sector 1.7 0.8 1.8 0.7 -2.3 -6.9 -8.1 -6.7 -6.2 -5.4 -5.3 -5.0
Private sector 6.7 5.8 5.6 4.2 1.8 -1.3 0.2 1.7 2.3 2.5 2.7 2.9
Combined public sector
Revenues and grants 33.2 36.2 37.8 39.1 39.9 37.7 35.0 35.2 34.5 34.6 33.9 33.6
Of which: Hydrocarbon related revenue 10.2 11.4 13.0 13.5 12.7 9.1 6.4 6.8 6.0 6.3 5.6 5.5
Expenditure 31.5 35.4 36.0 38.4 43.3 44.6 43.0 41.9 40.7 40.1 39.2 38.6
Current 22.8 24.2 25.1 24.9 28.2 29.1 27.8 27.8 27.5 27.4 27.3 27.3
Capital 2/ 8.7 11.2 11.0 13.5 15.0 15.5 15.2 14.1 13.2 12.6 11.9 11.3
Overall balance after nationalization costs 1.7 0.8 1.8 0.7 -3.4 -6.9 -8.1 -6.7 -6.2 -5.4 -5.3 -5.0
Of which:
Non-hydrocarbon balance, before nationalization costs -8.1 -9.6 -9.7 -11.1 -13.2 -14.1 -12.2 -11.4 -10.2 -9.7 -9.0 -8.6
Total gross NFPS debt 3/ 38.5 35.7 35.7 36.1 37.0 40.6 46.7 47.6 48.8 49.4 51.2 52.0
NFPS deposits 20.8 21.4 24.2 24.0 20.3 16.6 15.1 12.4 10.3 8.5 7.9 7.3
External sector
Current account 1/ 3.9 0.3 7.2 2.4 0.2 -5.8 -7.6 -4.7 -3.8 -2.9 -2.6 -2.3
Merchandise exports 32.4 34.6 41.3 37.9 37.0 25.0 21.0 21.8 20.5 20.3 19.3 18.5
Of which: natural gas 14.1 16.1 20.1 19.8 18.1 11.3 7.0 7.9 7.6 7.7 6.6 6.3
Merchandise imports 28.3 32.8 31.4 31.4 31.6 29.1 27.5 25.4 23.4 22.6 21.1 20.0
Capital and financial account 0.8 8.6 -0.9 1.2 2.7 0.8 -0.4 -0.6 -0.1 0.3 0.2 0.0
Of which: direct investment net 3.4 3.6 3.9 5.7 1.9 4.1 0.5 1.0 1.5 2.0 2.5 3.2
Overall balance of payments 4.7 8.9 6.3 3.6 2.9 -4.9 -8.0 -5.4 -3.8 -2.6 -2.4 -2.3
Terms of trade index (percent change) -11.1 58.0 7.3 0.0 -2.2 -16.3 -10.1 9.5 1.9 0.9 -1.5 0.5
Net Central Bank foreign reserves 4/ 5/
In millions of U.S. dollars 9,730 12,019 13,927
14,43
0
15,12
3
13,05
6 10,344 8,330 6,721 5,570
4,44
2 3,945
In percent of broad money 80.0 83.0 80.0 71.4 64.7 48.1 36.5 26.4 19.5 14.8 10.9 8.8
Exchange rates 6/
Bolivianos/U.S. dollar (end-of-period) 6.9 6.9 6.9 6.9 6.9 6.9 n.a. n.a. n.a. n.a. n.a. n.a.
REER, period average (percent change) -4.9 1.9 5.2 5.6 7.9 0.1 n.a. n.a. n.a. n.a. n.a. n.a.
Money and credit
Credit to the private sector 19.9 23.0 19.4 18.9 15.0 17.6 17.5 15.2 11.0 10.5 9.5 10.0
Credit to the private sector (percent of GDP) 36.0 36.8 39.0 40.9 43.7 51.5 59.5 61.6 62.8 63.9 64.9 65.7
Broad money 12.5 17.7 20.2 16.2 15.6 16.2 4.5 11.1 9.3 9.1 8.6 9.2
Interest rates (percent, end-of-period)
Deposits (effective rate) 0.9 1.7 1.2 2.7 2.5 n.a. n.a. n.a. n.a. n.a. n.a. n.a.
Lending (effective rate) 10.4 10.8 10.6 11.4 8.0 n.a. n.a. n.a. n.a. n.a. n.a. n.a.
U.S. dollar and dollar-indexed deposits (in percent of total deposits) 43.8 34.5 26.3 21.0 17.6 15.6 15.6 15.6 15.6 15.6 15.6 15.6
U.S. dollar and dollar indexed credit (in percent of total credit) 38.6 30.7 21.3 15.8 10.2 8.0 3.0 3.0 3.0 3.0 3.0 3.0
Memorandum items:
Nominal GDP (in billions of U.S. dollars) 19.8 24.1 27.3 30.9 33.2 33.2 33.8 37.6 40.9 44.4 47.9 52.0
Oil prices (in U.S. dollars per barrel) 79.0 104.0 105.0 104.1 96.2 50.8 43.0 50.6 53.1 54.4 56.3 58.0
Sources: Ministry of Economy and Public Finances, Central Bank of Bolivia, National Institute of Statistics, UDAPE, and Fund staff calculations.
1/ The discrepancy between the current account and the savings-investment balances reflects methodological differences. For the projection years, the discrepancy is assumed
to remain constant in dollar value.
2/ Includes nationalization costs and net lending.
3/ Public debt includes SOE's borrowing from the BCB but not from other domestic institutions.
4/ Excludes reserves from the Latin American Reserve Fund (FLAR) and Offshore Liquidity Requirements (RAL).
5/ All foreign assets valued at market prices.
6/ Official (buy) exchange rate.

BOLIVIA STAFF REPORT FOR THE 2016 ARTICLE IV CONSULTATION
KEY ISSUES
Context. Bolivia’s macroeconomic management of the commodity boom facilitated a
decade of strong macroeconomic performance and poverty reduction, and the
accumulation of sizable policy buffers. As Bolivia remains one of the most
commodity-dependent countries in the region, however, sharply lower commodity
prices pose serious challenges to making further progress towards the objectives laid
out in the authorities’ Patriotic Agenda 2025, including eradication of extreme
poverty, better access to health and education, and state-led industrialization. As the
authorities implement their 5-year development plan (Plan de Desarrollo Económico y
Social 2016–20), sizable fiscal and external current account surpluses during the last
decade have turned into large deficits. These deficits are projected to persist over the
medium term under current policies, eroding policy buffers and raising questions
about the sustainability of the plan.
Outlook and risks. Real output growth is projected at 3.7 percent in 2016, on the back
of large twin deficits and rapid credit growth, and is expected to converge towards
3.5 percent over the medium term, consistent with the new commodity price normal.
Near-term risks remain tilted to the downside, with the potential for additional
weakness in key emerging markets such as China, further dollar strength, and a larger-
than-expected impact of the drought on agricultural output. Longer-term uncertainties
relate to future oil prices, the extent of natural gas reserve discoveries and the renewal
of the Brazil export contract, and the possibility of excessive credit growth volatility.
Policy Recommendations. Existing domestic and external pressures mean that policy
adjustment is indispensable. However, given still sizable fiscal and external buffers, the
authorities can pursue a measured yet credible approach to adjustment, based on a
suitable sequencing of policies. Priorities include steadily reducing the non-
hydrocarbons primary deficit and ensuring the financial health of SOEs, allowing greater
exchange rate flexibility, improving incentives for hydrocarbons exploration, and
bringing wages back in line with productivity.
November 23, 2016

BOLIVIA
2 INTERNATIONAL MONETARY FUND
Approved By Krishna Srinivasan
(WHD) and Bob Traa
(SPR)
Discussions took place in La Paz and Santa Cruz during October 13–
26, 2016. The team comprised R. Balakrishnan (Head), C. Caceres,
E. Jafarov, G. Keim, F. Toscani (all WHD), and S. Lizarazo (SPR). F.
Bornhorst (outgoing Resident Representative), A. Santos (incoming
Resident Representative) and S. Cardenas (local office) assisted the
mission, and E. Tawfik provided research assistance at headquarters.
V. de la Barra (OED) participated in the discussions. The team met
with the Minister of Finance, the President of the Central Bank, other
Ministers and senior officials; as well as private sector participants;
think-tanks; academics; donors; and leaders of Congress and Senate.
CONTENTS
CONTEXT AND RECENT DEVELOPMENTS ______________________________________________________ 4
OUTLOOK AND RISKS ___________________________________________________________________________ 8
POLICY DISCUSSIONS _________________________________________________________________________ 11
A. Preserving Buffers and Strengthening the Fiscal Framework __________________________________ 11
B. Allowing Greater Exchange Rate Flexibility and Improving the Monetary Policy Framework __ 14
C. Cementing Financial Sector Stability and Promoting Financial Inclusion ______________________ 16
D. Enhancing Potential Growth and Inclusiveness _______________________________________________ 18
E. Authorities' Views _____________________________________________________________________________ 19
STAFF APPRAISAL _____________________________________________________________________________ 20
BOXES
1. Impact of Oil and Gas Production in LAC and Bolivia ___________________________________________ 5
2. The Impact of the Commodity Boom/Bust: A DSGE Model for Bolivia _________________________ 10
3. Efficiency of Social Spending in Bolivia ________________________________________________________ 13
FIGURES
1. Real Sector Developments ____________________________________________________________________ 28
2. Monetary Developments ______________________________________________________________________ 29
3. Fiscal Developments ___________________________________________________________________________ 30
4. External Sector Developments _________________________________________________________________ 31
5. Financial Sector Developments ________________________________________________________________ 32
TABLES
1. Selected Economic and Social Indicators ______________________________________________________ 22
2. Financial System Survey _______________________________________________________________________ 23
3. Operations of the Consolidated Public Sector _________________________________________________ 24
BOLIVIA
INTERNATIONAL MONETARY FUND 3
4. Summary Balance of Payments ________________________________________________________________ 25
5. Past Fund Policy Recommendations and Implementations ____________________________________ 26
6. Risk Assessment Matrix ________________________________________________________________________ 27
ANNEXES
I. Financial Stability Assessment ________________________________________________________________ 33
II. Hydrocarbons Sector, Public Enterprises, and the Central Bank Balance Sheet ________________ 35
III. Debt Sustainability Analysis—Baseline Scenario ______________________________________________ 43
IV. External Stability Assessment _________________________________________________________________ 52
V. Stress Tests of the Bolivian Banking System __________________________________________________ 58
BOLIVIA
4 INTERNATIONAL MONETARY FUND
CONTEXT AND RECENT DEVELOPMENTS
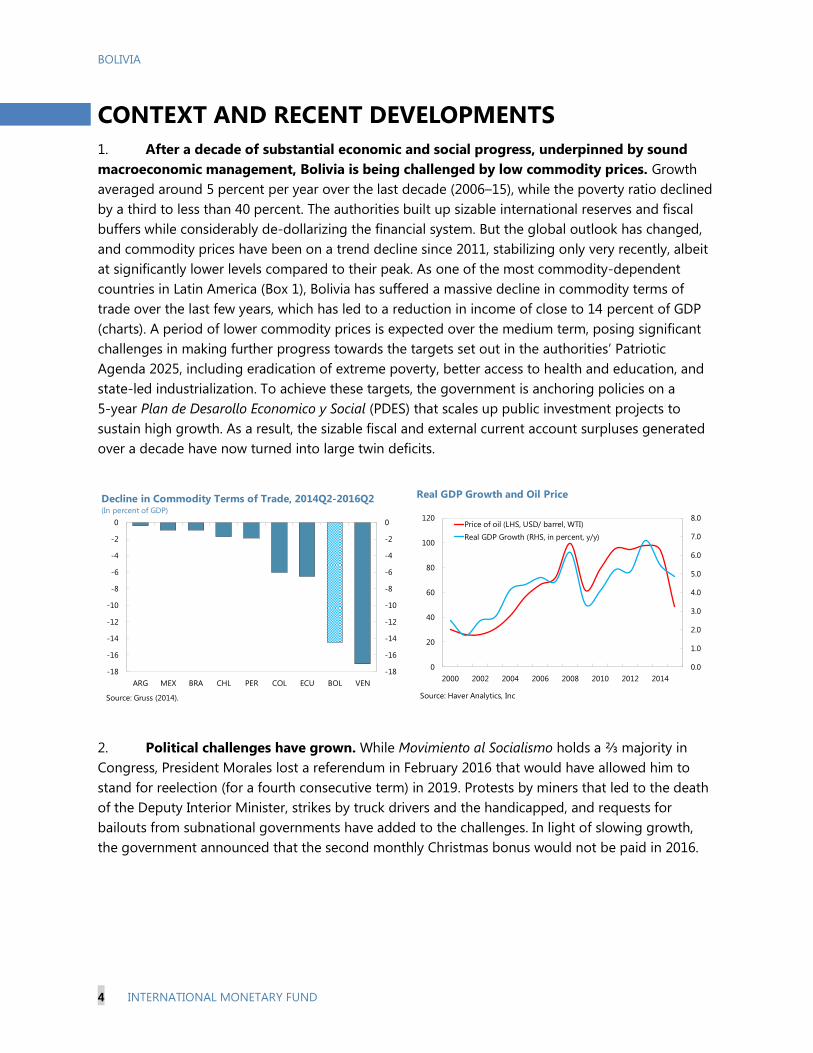
1. After a decade of substantial economic and social progress, underpinned by sound
macroeconomic management, Bolivia is being challenged by low commodity prices. Growth
averaged around 5 percent per year over the last decade (2006–15), while the poverty ratio declined
by a third to less than 40 percent. The authorities built up sizable international reserves and fiscal
buffers while considerably de-dollarizing the financial system. But the global outlook has changed,
and commodity prices have been on a trend decline since 2011, stabilizing only very recently, albeit
at significantly lower levels compared to their peak. As one of the most commodity-dependent
countries in Latin America (Box 1), Bolivia has suffered a massive decline in commodity terms of
trade over the last few years, which has led to a reduction in income of close to 14 percent of GDP
(charts). A period of lower commodity prices is expected over the medium term, posing significant
challenges in making further progress towards the targets set out in the authorities’ Patriotic
Agenda 2025, including eradication of extreme poverty, better access to health and education, and
state-led industrialization. To achieve these targets, the government is anchoring policies on a
5-year Plan de Desarollo Economico y Social (PDES) that scales up public investment projects to
sustain high growth. As a result, the sizable fiscal and external current account surpluses generated
over a decade have now turned into large twin deficits.
2. Political challenges have grown. While Movimiento al Socialismo holds a ⅔ majority in
Congress, President Morales lost a referendum in February 2016 that would have allowed him to
stand for reelection (for a fourth consecutive term) in 2019. Protests by miners that led to the death
of the Deputy Interior Minister, strikes by truck drivers and the handicapped, and requests for
bailouts from subnational governments have added to the challenges. In light of slowing growth,
the government announced that the second monthly Christmas bonus would not be paid in 2016.
0.0
1.0
2.0
3.0
4.0
5.0
6.0
7.0
8.0
0
20
40
60
80
100
120
2000 2002 2004 2006 2008 2010 2012 2014
Price of oil (LHS, USD/ barrel, WTI)
Real GDP Growth (RHS, in percent, y/y)
Source: Haver Analytics, Inc
Real GDP Growth and Oil Price
-18
-16
-14
-12
-10
-8
-6
-4
-2
0
-18
-16
-14
-12
-10
-8
-6
-4
-2
0
ARG MEX BRA CHL PER COL ECU BOL VEN
Decline in Commodity Terms of Trade, 2014Q2-2016Q2(In percent of GDP)
Source: Gruss (2014).

BOLIVIA
INTERNATIONAL MONETARY FUND 5
Box 1. Impact of Oil and Gas Production in LAC and Bolivia
There exists a strong positive long-run relationship between real GDP per capita and the real value of
hydrocarbons production in Latin American and Caribbean (LAC) oil and gas producers. Panel co-
integration analysis for the period 1980–2014 suggests that a 100 percent increase in the value of oil and
gas production increases the level of GDP by 14 percent
on average. The relationship is particularly pronounced
in Trinidad and Tobago and Venezuela while for Bolivia
it is close to the LAC average. Between 2000 and 2014,
the real value of oil and gas production per capita in
Bolivia increased by about 370 percent, while real GDP
per capita increased by 43 percent. The developments
in Bolivia over the recent boom period are thus very
close to what one would have expected based on this
general relationship.
At the provincial level in Bolivia, real GDP per capita in the main gas producing region (Tarija),
increased nearly 150 percent during the boom in the 2000s. The huge gas fields discovered in Bolivia in
the late 1990s are located in the southern province of Tarija, which now produces about 70 percent of all
Bolivian gas. The massive growth in the extractive sector and the related fiscal windfall (with Tarija receiving
more revenues than all other 8 provinces combined in 2014) does not seem to have produced important
spillovers to other sectors. The only sector besides the oil and gas one which grew substantially more in
Tarija than in the rest of Bolivia was construction.
The gas boom and associated fiscal windfall reduced poverty in producing municipalities. Data from
the 2001 and 2012 population censuses indicates that the large gas discoveries were associated with
significant reductions in poverty of around 10 percentage points (as measured by population without access
to basic necessities) in directly affected municipalities. Gas
producing municipalities also experienced a very large
increase in public sector employment (more than 1
standard deviation) as well as important increases in
construction and manufacturing employment. In
municipalities with mining—which is more labor intensive
but generated a smaller fiscal windfall—a larger
reallocation of labor away from agriculture, a positive
migration effect, but a smaller reduction in poverty was
observed.
7.4
7.6
7.8
8.0
8.2
8.4
3.0
4.0
5.0
6.0
7.0
1978 1982 1986 1990 1994 1998 2002 2006 2010 2014
GDP per Capita and Hydrocarbons
Production per Capita in Bolivia
Real Value of Oil and Gas Production per capita (logarithm) - RHS
Real GDP per capita (logarithm) - LHS
0
2,000
4,000
6,000
8,000
10,000
Re
al G
DP
pe
r ca
pit
a (C
on
stan
t 1
99
0 B
oliv
ian
os)
Departmental Real GDP Per Capita
2001 2014

BOLIVIA
6 INTERNATIONAL MONETARY FUND
3. The economic expansion continues, but fiscal and external imbalances are growing:
Economic growth in Bolivia remains among the highest in Latin America, but has slowed (chart).
While real GDP growth over the last 12 months to June 2016 was 4.4 percent, this masks a
significant slowdown recently, with 2016Q2 growth of 3¼ percent (y-o-y). This outcome partly
reflects temporary supply shocks in the
hydrocarbons and agriculture sectors, with the
latter due to a drought linked to the La Niña
climate phenomenon. Consumption growth has
been strong given solid real wage increases, but
unemployment has increased slightly to
4.4 percent (Table 1 and Figure 1). Inflation has
remained moderate (3.5 percent y-o-y in October
2016), despite rapid monetary growth (Table 2
and Figure 2), due in part to falling import prices
and stable administered prices.
While public debt remains moderate, fiscal
imbalances are growing. The fiscal deficit reached
6.9 percent of GDP in 2015 due to sharply lower
hydrocarbon revenues and large increases in
spending. This was mainly financed by Central Bank
of Bolivia (BCB) net credit (either the use of the
government deposits or direct credit to SOEs).
There has been a broad decline in tax collections
through June 2016, reflecting also falling imports
and corporate profits, but the shortfall has been
partly offset by restraint in current expenditures.
Gross public debt remains moderate at 43 percent of GDP in August 2016, while net debt is
lower at 28 percent of GDP (Table 3 and Figure 3). At the subnational level, the financial
positions of several administrations that rely
heavily on hydrocarbons-related revenues have
significantly worsened.
Reserves remain substantial, but the current
account deficit has widened. After being in surplus
for over a decade (2003–14), the current account
registered large deficits of 5.8 percent of GDP in
2015 and about 7 percent of GDP in 2016Q1.1 This
reflects a marked drop in export prices (and some
weakness in hydrocarbon export volumes), which
1 Balance of Payments data in this report are compiled according to the fifth edition of the Balance of Payments
Manual (BPM). The authorities are transitioning to the sixth edition of the BPM. In the first half of 2016, the current
account balance compiled under the updated methodology was -6.5 percent of GDP.
-20.0
-15.0
-10.0
-5.0
0.0
5.0
10.0
0
5
10
15
20
25
30
35
40
45
50
2006 2007 2008 2009 2010 2011 2012 2013 2014 2015
Fiscal balance (RHS)
Non-hydrocarbons balance (RHS)
Revenue (LHS)
Spending (LHS)
Sources: Authorities' data and staff calculations.
Fiscal Balances
(In percent of GDP)
-10
-5
0
5
10
15
-10
-5
0
5
10
15
2009Q1 2011Q1 2013Q1 2015Q1
75th and 25th percentile range LA /1 Bolivia
2016Q2
Real GDP Growth
(In percent, y/y)
Source: Haver Analytics, Inc.
1/ Includes ARG, BRA, CHL PER, PRY and URY.
-16
-12
-8
-4
0
4
8
12
16
20
24
-60
-40
-20
0
20
40
60
80
2000 2003 2006 2009 2012 2015
Gas exports Mining exports
Other exports Imports
Other balances Current account (RHS)
Source: Central Bank of Bolivia.
Current Account (In percent of GDP)
BOLIVIA
INTERNATIONAL MONETARY FUND 7
have been only partly offset by import compression. Given the widening current account deficit,
reserves have dropped sharply, by US$2.1 billion in 2015 (about 6 percent of GDP) and an
additional US$2.3 billion through mid-October 2016 (Table 4 and Figure 4). Nevertheless, at
32 percent of GDP, reserves remain more than adequate by any metric.
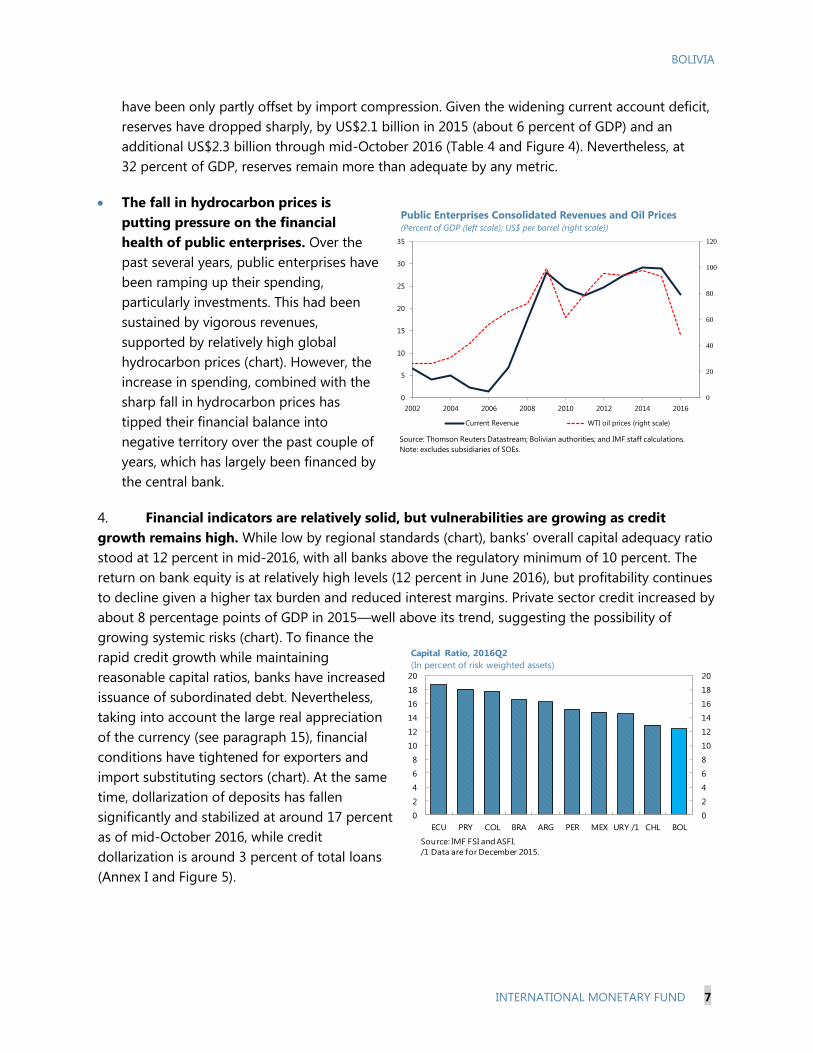
The fall in hydrocarbon prices is
putting pressure on the financial
health of public enterprises. Over the
past several years, public enterprises have
been ramping up their spending,
particularly investments. This had been
sustained by vigorous revenues,
supported by relatively high global
hydrocarbon prices (chart). However, the
increase in spending, combined with the
sharp fall in hydrocarbon prices has
tipped their financial balance into
negative territory over the past couple of
years, which has largely been financed by
the central bank.
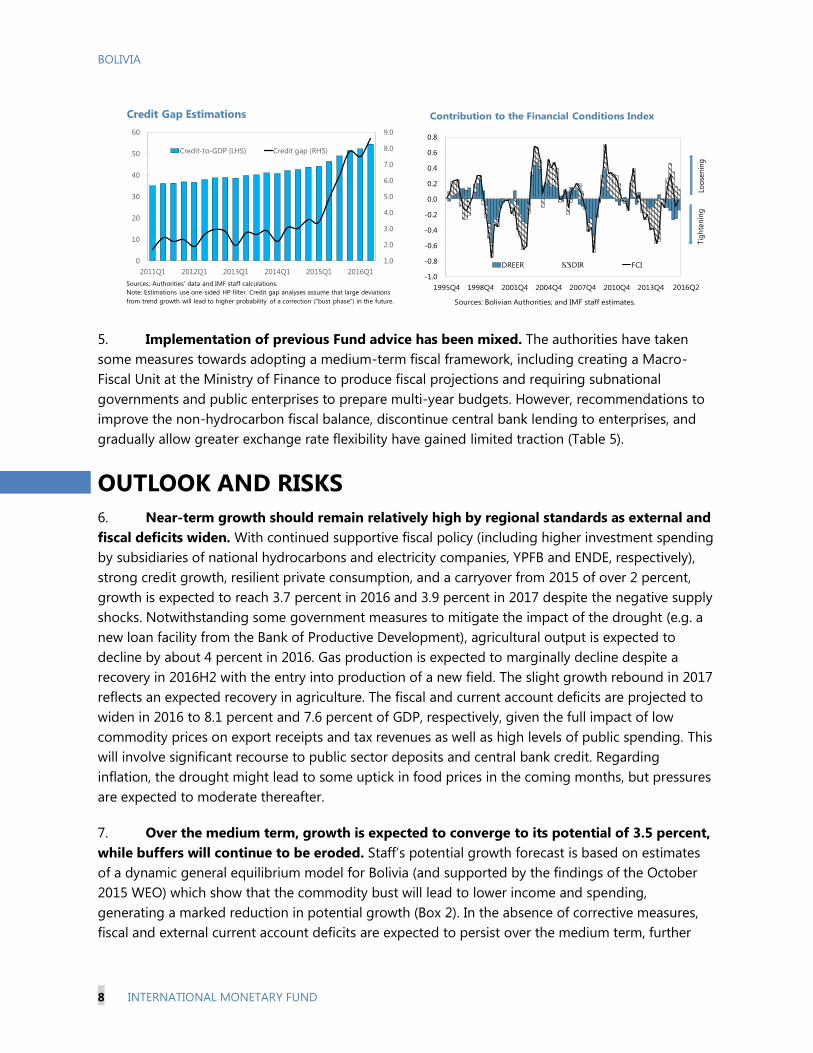
4. Financial indicators are relatively solid, but vulnerabilities are growing as credit
growth remains high. While low by regional standards (chart), banks’ overall capital adequacy ratio
stood at 12 percent in mid-2016, with all banks above the regulatory minimum of 10 percent. The
return on bank equity is at relatively high levels (12 percent in June 2016), but profitability continues
to decline given a higher tax burden and reduced interest margins. Private sector credit increased by
about 8 percentage points of GDP in 2015—well above its trend, suggesting the possibility of
growing systemic risks (chart). To finance the
rapid credit growth while maintaining
reasonable capital ratios, banks have increased
issuance of subordinated debt. Nevertheless,
taking into account the large real appreciation
of the currency (see paragraph 15), financial
conditions have tightened for exporters and
import substituting sectors (chart). At the same
time, dollarization of deposits has fallen
significantly and stabilized at around 17 percent
as of mid-October 2016, while credit
dollarization is around 3 percent of total loans
(Annex I and Figure 5).
0
2
4
6
8
10
12
14
16
18
20
0
2
4
6
8
10
12
14
16
18
20
ECU PRY COL BRA ARG PER MEX URY /1 CHL BOL
Capital Ratio, 2016Q2
(In percent of risk weighted assets)
Source: IMF FSI and ASFI.
/1 Data are for December 2015.
0
20
40
60
80
100
120
0
5
10
15
20
25
30
35
2002 2004 2006 2008 2010 2012 2014 2016
Current Revenue WTI oil prices (right scale)
Source: Thomson Reuters Datastream; Bolivian authorities; and IMF staff calculations.
Note: excludes subsidiaries of SOEs.
Public Enterprises Consolidated Revenues and Oil Prices(Percent of GDP (left scale); US$ per barrel (right scale))
BOLIVIA
8 INTERNATIONAL MONETARY FUND
5. Implementation of previous Fund advice has been mixed. The authorities have taken
some measures towards adopting a medium-term fiscal framework, including creating a Macro-
Fiscal Unit at the Ministry of Finance to produce fiscal projections and requiring subnational
governments and public enterprises to prepare multi-year budgets. However, recommendations to
improve the non-hydrocarbon fiscal balance, discontinue central bank lending to enterprises, and
gradually allow greater exchange rate flexibility have gained limited traction (Table 5).
OUTLOOK AND RISKS
6. Near-term growth should remain relatively high by regional standards as external and
fiscal deficits widen. With continued supportive fiscal policy (including higher investment spending
by subsidiaries of national hydrocarbons and electricity companies, YPFB and ENDE, respectively),
strong credit growth, resilient private consumption, and a carryover from 2015 of over 2 percent,
growth is expected to reach 3.7 percent in 2016 and 3.9 percent in 2017 despite the negative supply
shocks. Notwithstanding some government measures to mitigate the impact of the drought (e.g. a
new loan facility from the Bank of Productive Development), agricultural output is expected to
decline by about 4 percent in 2016. Gas production is expected to marginally decline despite a
recovery in 2016H2 with the entry into production of a new field. The slight growth rebound in 2017
reflects an expected recovery in agriculture. The fiscal and current account deficits are projected to
widen in 2016 to 8.1 percent and 7.6 percent of GDP, respectively, given the full impact of low
commodity prices on export receipts and tax revenues as well as high levels of public spending. This
will involve significant recourse to public sector deposits and central bank credit. Regarding
inflation, the drought might lead to some uptick in food prices in the coming months, but pressures
are expected to moderate thereafter.
7. Over the medium term, growth is expected to converge to its potential of 3.5 percent,
while buffers will continue to be eroded. Staff’s potential growth forecast is based on estimates
of a dynamic general equilibrium model for Bolivia (and supported by the findings of the October
2015 WEO) which show that the commodity bust will lead to lower income and spending,
generating a marked reduction in potential growth (Box 2). In the absence of corrective measures,
fiscal and external current account deficits are expected to persist over the medium term, further
-1.0
-0.8
-0.6
-0.4
-0.2
0.0
0.2
0.4
0.6
0.8
1995Q4 1998Q4 2001Q4 2004Q4 2007Q4 2010Q4 2013Q4
DREER DIR FCI
Sources: Bolivian Authorities; and IMF staff estimates.
Contribution to the Financial Conditions Index
2016Q2
Loo
sen
ing
Tig
hte
nin
g
1.0
2.0
3.0
4.0
5.0
6.0
7.0
8.0
9.0
0
10
20
30
40
50
60
2011Q1 2012Q1 2013Q1 2014Q1 2015Q1 2016Q1
Credit-to-GDP (LHS) Credit gap (RHS)
Credit Gap Estimations
Sources: Authorities' data and IMF staff calculations.
Note: Estimations use one-sided HP filter. Credit gap analyses assume that large deviations
from trend growth will lead to higher probability of a correction ("bust phase") in the future.

BOLIVIA
INTERNATIONAL MONETARY FUND 9
eroding policy buffers (international reserves are forecast to further decline to close to 7½ percent
of GDP or 4 months of imports by 2021).2
8. Risks to this outlook are tilted to the downside. On the domestic side, growth could be
adversely affected by: (i) a slower rebound in agricultural production in 2017; (ii) a faster decline in
gas production (impacting negotiations over the Brazil supply contract, Annex II); and (iii) excessive
credit growth volatility linked to the lending quotas, interest rate caps, and increased taxation in the
financial sector.3 External downside risks arise from the possibility of: (i) further U.S. dollar strength;
(ii) even lower commodity prices; and (iii) additional weakness in key emerging markets (including
Brazil and China). Absent policy adjustment, a combination of these risks could rapidly deplete
buffers and lead to severe macroeconomic stresses (Table 6).
9. Nevertheless, there continue to be several upside risks. In particular, growth could be
higher because of: (i) better-than-expected quality of infrastructure spending;4 (ii) greater success in
discovering and exploiting new gas reserves, and/or in bringing downstream industrialization and
electricity generation projects on stream; and (iii) a stronger recovery in oil prices. Bolivia also has
some of the largest lithium deposits in the world, which would provide a major windfall if lithium
battery production can be made commercially viable over the medium term.
2 Reserves could be up to 3 percent of GDP higher if the US$1 billion of sovereign bond issuance in international
capital markets goes ahead.
3 Previous staff VAR analysis suggests that a 1 p.p. decrease in real credit growth lowers GDP growth by 0.2 p.p. the
following year.
4 Bolivia ranks 138 out of 160 countries in the World Bank’s 2016 Logistics Performance Index.
BOLIVIA
10 INTERNATIONAL MONETARY FUND
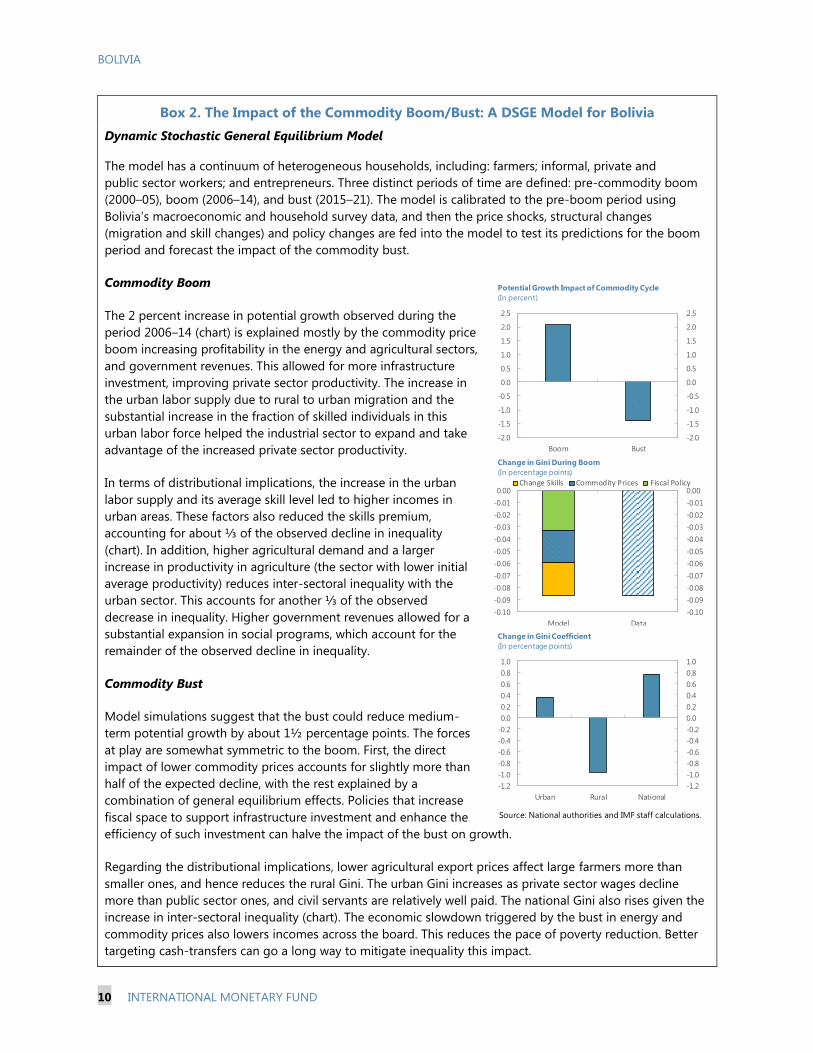
Box 2. The Impact of the Commodity Boom/Bust: A DSGE Model for Bolivia
Dynamic Stochastic General Equilibrium Model
The model has a continuum of heterogeneous households, including: farmers; informal, private and
public sector workers; and entrepreneurs. Three distinct periods of time are defined: pre-commodity boom
(2000–05), boom (2006–14), and bust (2015–21). The model is calibrated to the pre-boom period using
Bolivia’s macroeconomic and household survey data, and then the price shocks, structural changes
(migration and skill changes) and policy changes are fed into the model to test its predictions for the boom
period and forecast the impact of the commodity bust.
Commodity Boom
The 2 percent increase in potential growth observed during the
period 2006–14 (chart) is explained mostly by the commodity price
boom increasing profitability in the energy and agricultural sectors,
and government revenues. This allowed for more infrastructure
investment, improving private sector productivity. The increase in
the urban labor supply due to rural to urban migration and the
substantial increase in the fraction of skilled individuals in this
urban labor force helped the industrial sector to expand and take
advantage of the increased private sector productivity.
In terms of distributional implications, the increase in the urban
labor supply and its average skill level led to higher incomes in
urban areas. These factors also reduced the skills premium,
accounting for about ⅓ of the observed decline in inequality
(chart). In addition, higher agricultural demand and a larger
increase in productivity in agriculture (the sector with lower initial
average productivity) reduces inter-sectoral inequality with the
urban sector. This accounts for another ⅓ of the observed
decrease in inequality. Higher government revenues allowed for a
substantial expansion in social programs, which account for the
remainder of the observed decline in inequality.
Commodity Bust
Model simulations suggest that the bust could reduce medium-
term potential growth by about 1½ percentage points. The forces
at play are somewhat symmetric to the boom. First, the direct
impact of lower commodity prices accounts for slightly more than
half of the expected decline, with the rest explained by a
combination of general equilibrium effects. Policies that increase
fiscal space to support infrastructure investment and enhance the
efficiency of such investment can halve the impact of the bust on growth.
Regarding the distributional implications, lower agricultural export prices affect large farmers more than
smaller ones, and hence reduces the rural Gini. The urban Gini increases as private sector wages decline
more than public sector ones, and civil servants are relatively well paid. The national Gini also rises given the
increase in inter-sectoral inequality (chart). The economic slowdown triggered by the bust in energy and
commodity prices also lowers incomes across the board. This reduces the pace of poverty reduction. Better
targeting cash-transfers can go a long way to mitigate inequality this impact.
Source: National authorities and IMF staff calculations.
-2.0
-1.5
-1.0
-0.5
0.0
0.5
1.0
1.5
2.0
2.5
-2.0
-1.5
-1.0
-0.5
0.0
0.5
1.0
1.5
2.0
2.5
Boom Bust
Potential Growth Impact of Commodity Cycle
(In percent)
-0.10
-0.09
-0.08
-0.07
-0.06
-0.05
-0.04
-0.03
-0.02
-0.01
0.00
-0.10
-0.09
-0.08
-0.07
-0.06
-0.05
-0.04
-0.03
-0.02
-0.01
0.00
Model Data
Change Skills Commodity Prices Fiscal Policy
Change in Gini During Boom
(In percentage points)
-1.2
-1.0
-0.8
-0.6
-0.4
-0.2
0.0
0.2
0.4
0.6
0.8
1.0
-1.2
-1.0
-0.8
-0.6
-0.4
-0.2
0.0
0.2
0.4
0.6
0.8
1.0
Urban Rural National
Change in Gini Coefficient
(In percentage points)

BOLIVIA
INTERNATIONAL MONETARY FUND 11
POLICY DISCUSSIONS
In the context of low commodity prices, the overarching priority is to adapt policies to anchor strong,
balanced and durable growth; continued progress in poverty reduction; and guard against downside
risks. Given still large buffers, the authorities can take a measured approach to adjustment and
sequencing reforms with the following priorities: (i) steadily reducing the non-hydrocarbons primary
deficit and ensuring the financial health of SOEs; (ii) allowing greater exchange rate flexibility; (iii)
improving incentives for hydrocarbons exploration; and (iv) bringing wage growth in line with changes
in productivity.
A. Preserving Buffers and Strengthening the Fiscal Framework
10. While committed to continuing large public investment projects, the authorities are
prepared to be flexible and pragmatic regarding implementing the PDES. This is important
because the projected levels of public investment envisaged in the original 5-year plan could widen
the overall deficit to 15–20 percent of GDP, and increase public debt to about 100 percent of GDP
by 2021. This is markedly above the threshold marking high risk of debt distress for emerging
markets.
11. Staff’s baseline scenario is consistent with a flexible approach to implementing the
PDES. In particular, the baseline has a lower spending level than in the PDES, consistent with the
historical execution rate for investment projects and external financing constraints. Accordingly, the
non-hydrocarbons primary deficit declines gradually from around 13 percent of GDP in 2015 to
7 percent of GDP in 2021. The ratio of gross public debt to GDP is projected to increase from
41 percent of GDP in 2015 to about 52 percent of GDP by 2021. In the absence of further fiscal
adjustment, the ratio would continue to increase and surpass high risk thresholds (Annex III).
12. To maintain buffers, staff recommends a more ambitious consolidation than in the
baseline scenario, but that is steady and safeguards development spending. The exhaustibility
of natural resources makes it imperative to reduce the non-hydrocarbon primary budget deficit
toward a sustainable level (i.e., which stabilizes the debt-to-GDP ratio at around current levels).
Given moderate levels of net public debt, and the need to improve infrastructure and support social
policies to reduce poverty, staff recommends measures that allow a reduction in the non-
(In percent of GDP)
Actual
2015 2016 2017 2018 2019 2020 2021
Overall balance -6.9 -8.1 -6.7 -6.2 -5.4 -5.3 -5.0
Non-hydrocarbon primary balance -13.1 -11.2 -10.3 -9.1 -8.5 -7.6 -7.1
Public debt 40.6 46.7 47.6 48.8 49.4 51.2 52.0
Overall balance -6.9 -8.1 -6.0 -5.3 -3.9 -3.2 -2.4
Non-hydrocarbon primary balance -13.1 -11.2 -9.6 -8.2 -7.1 -5.7 -4.7
Public debt 40.6 46.7 46.8 47.2 46.4 46.3 45.0
Sources: Bolivian authorities; and IMF staff estimates.
Bolivia: Fiscal Balances and Public Debt
Projections
Baseline scenario
Active scenario
BOLIVIA
12 INTERNATIONAL MONETARY FUND
hydrocarbons primary deficit by about 1.3 percent per year on average over the next 5 years (active
scenario). The consolidation could be achieved mainly through streamlining expenditures. Such an
adjustment would help reduce vulnerabilities with limited impact on growth:
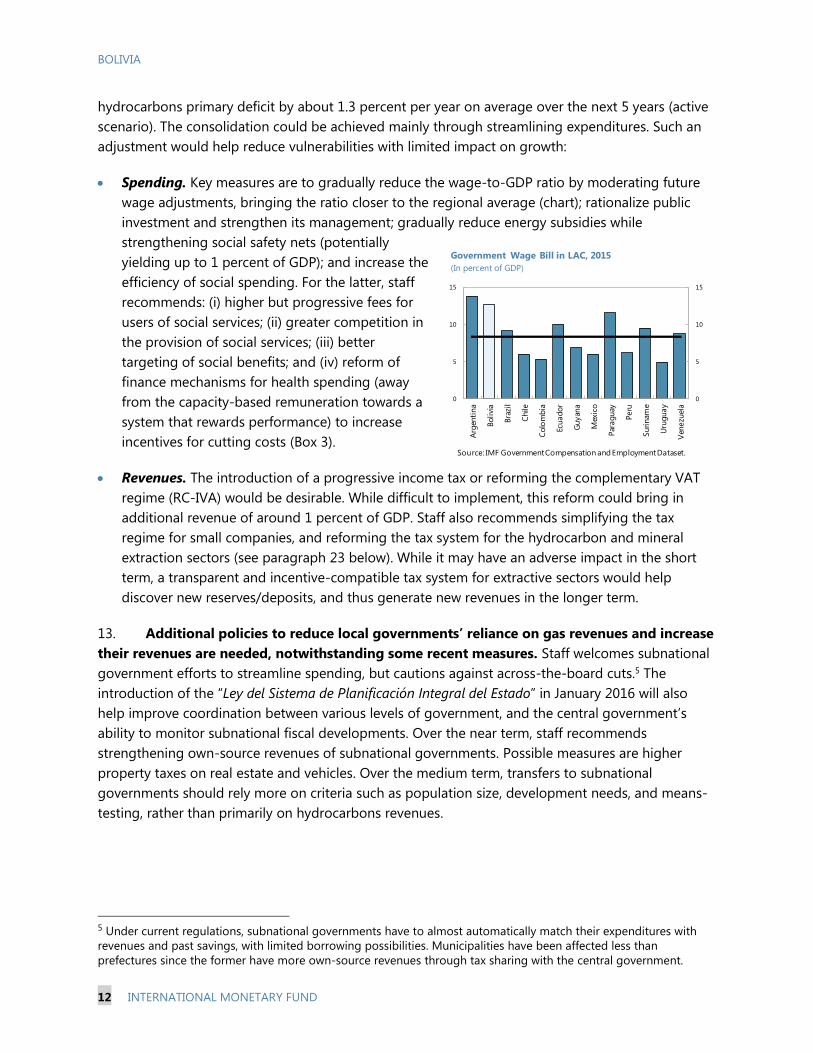
Spending. Key measures are to gradually reduce the wage-to-GDP ratio by moderating future
wage adjustments, bringing the ratio closer to the regional average (chart); rationalize public
investment and strengthen its management; gradually reduce energy subsidies while
strengthening social safety nets (potentially
yielding up to 1 percent of GDP); and increase the
efficiency of social spending. For the latter, staff
recommends: (i) higher but progressive fees for
users of social services; (ii) greater competition in
the provision of social services; (iii) better
targeting of social benefits; and (iv) reform of
finance mechanisms for health spending (away
from the capacity-based remuneration towards a
system that rewards performance) to increase
incentives for cutting costs (Box 3).
Revenues. The introduction of a progressive income tax or reforming the complementary VAT
regime (RC-IVA) would be desirable. While difficult to implement, this reform could bring in
additional revenue of around 1 percent of GDP. Staff also recommends simplifying the tax
regime for small companies, and reforming the tax system for the hydrocarbon and mineral
extraction sectors (see paragraph 23 below). While it may have an adverse impact in the short
term, a transparent and incentive-compatible tax system for extractive sectors would help
discover new reserves/deposits, and thus generate new revenues in the longer term.
13. Additional policies to reduce local governments’ reliance on gas revenues and increase
their revenues are needed, notwithstanding some recent measures. Staff welcomes subnational
government efforts to streamline spending, but cautions against across-the-board cuts.5 The
introduction of the “Ley del Sistema de Planificación Integral del Estado” in January 2016 will also
help improve coordination between various levels of government, and the central government’s
ability to monitor subnational fiscal developments. Over the near term, staff recommends
strengthening own-source revenues of subnational governments. Possible measures are higher
property taxes on real estate and vehicles. Over the medium term, transfers to subnational
governments should rely more on criteria such as population size, development needs, and means-
testing, rather than primarily on hydrocarbons revenues.
5 Under current regulations, subnational governments have to almost automatically match their expenditures with
revenues and past savings, with limited borrowing possibilities. Municipalities have been affected less than
prefectures since the former have more own-source revenues through tax sharing with the central government.
0
5
10
15
0
5
10
15
Arg
enti
na
Bolivi
a
Bra
zil
Chile
Colo
mbia
Ecuador
Guyan
a
Mex
ico
Par
aguay
Peru
Suri
nam
e
Uru
guay
Ven
ezu
ela
Government Wage Bill in LAC, 2015
(In percent of GDP)
Source: IMF Government Compensation and Employment Dataset.

BOLIVIA
INTERNATIONAL MONETARY FUND 13
Box 3. Efficiency of Social Spending in Bolivia
Comparisons with other countries suggest inefficiencies in health spending. These inefficiencies occur
largely in the process of transforming intermediate resources (e.g.
number of physicians, nurses, midwives, and hospital beds) into
health outcomes. This outcome is partly related to weaknesses in
the payment system for general practitioners, who are paid fixed
salaries independent of results they produce, and hospitals that are
largely financed based on capacity considerations. The latter
reduces hospitals’ incentives to cut costs. Also, there are no co-
payments made by recipients of health services, which may lead to
excessive demand for these services.
Bolivia’s spending on education as a share of GDP is well above the levels in its peer countries, but
results are relatively poor. At more than 8 percent of GDP, Bolivia’s spending on education largely exceeds
the average of 5 percent for LAC. While there is no standardized data available in terms of education
outcomes such as PISA scores, Bolivia lags most LA countries in terms of teacher-student ratios and
enrollment rates. Staff analysis suggests that there are
inefficiencies in producing education outputs: Bolivia’s net
enrollment rates are low for the given level of education
spending in purchasing power terms. Bolivia also lags other LAC
countries in terms of final outcomes for education, as indicated
by the number of the medals and awards in the International
Mathematical Olympiads compared with the education spending
on secondary education per student. Furthermore, Bolivia ranks
low in terms of the number of patents per capita granted by the
U.S. Patents and Trademarks Office despite the fact that Bolivia’s
research and development expenditure (about 0.2 percent of
GDP) is close to the average for LAC.
The following factors may have contributed to inefficiencies in education spending. First, the shares of
wages and investment in total primary education spending are large, leaving a smaller share for spending on
non-wage recurrent expenditures such as books for libraries and laboratory equipment. Second,
coordination issues in decision making may be contributing to excess spending since decisions about
establishing schools are made by local governments while teachers are financed by the central government.
Third, public spending on education mostly benefits households with higher income as children from these
families are more likely to continue their education.
Spending on subsidies and social protection is high by regional standards, but only a small
share reach the poor. The government spends 1–2 percent of GDP on fuel subsidies, which mainly benefit
producers and the rich (World Bank, 2015). It spends 2–3 percent of GDP on social programs, but only a
small share of this spending reach the poor since no or limited means’ testing is used to identify
beneficiaries for most social programs (Lustig and others, 2013, Arauco and others, 2013, and World Bank,
2015).
30
35
40
45
50
55
60
65
70
75
80
0 1000 2000 3000
He
alt
h A
dju
ste
d L
ife
Exp
ect
an
cy,
20
15
Total health expenditure per capita, PPP$
South America
Bolivia
LIDCs
OECD
Health Efficiency Frontier, Latest Value Available
Source: IMF Expenditure Assessment Tool (EAT).
1/ Dash line is the average of South America.
Source: IMF Expenditure Assessment Tool (EAT).
60
65
70
75
80
85
90
95
100
105
0 2000 4000 6000 8000
Education spending per student, PPP$, primary
South America
Bolivia
LIDCs
OECD
Education Spending and Outcome, Primary,
Latest Value Available
Ne
t sc
ho
ol
en
rollm
en
t--p
rim
ary
(in
pe
rce
nt)

BOLIVIA
14 INTERNATIONAL MONETARY FUND
14. Structural fiscal reforms in medium-term budgeting and SOE oversight are essential to
containing risks going forward:
Building on previous steps taken, develop and communicate effectively a medium-term framework
to anchor the consolidation described above. Further efforts should include a faster transition to
multi-year budgeting and introducing a fiscal target for the non-hydrocarbons primary balance.
This target should be designed so as to assure debt sustainability while also accounting for the
state of the business cycle and building cushions to absorb volatility in hydrocarbon prices.
Equally important would be to clearly communicate the authorities’ policy intentions to the
population to avoid surprises and unexpected reactions.
Exercise greater oversight of SOEs’ activities and strengthen the evaluation and transparency of
their investments. Investments by YPFB and ENDE are increasing considerably under the PDES,
and a large share of this is carried out by subsidiaries that are currently classified outside the
non-financial public sector (NFPS). Indeed, in 2016, about half of YPFB’s investments are to be
executed by subsidiaries, while the number is close to 80 percent for ENDE. To manage
associated risks, staff recommends monitoring and publishing SOEs’ financial operations and
balance sheets as a first step to including all of them in the fiscal accounts of the NFPS. Staff also
suggests that the efficiency of SOEs and their new investments be assessed on nonsubsidized
gas and electricity input prices (Annex II).
B. Allowing Greater Exchange Rate Flexibility and Improving the Monetary
Policy Framework
15. The boliviano is assessed to be overvalued and diversification remains modest. Despite
a moderate depreciation in recent months, the boliviano—de-facto stabilized against the U.S.
dollar—has appreciated by 49 percent in real effective terms since January 2010 (chart), while
exports are highly concentrated in commodities whose prices remain low (chart). Significant
mandatory minimum and average wage increases—that have largely exceeded productivity
growth—have also eroded competitiveness. This is reflected in Bolivia slipping in international
rankings of competitiveness.6 Against this backdrop, the two EBA-lite approaches (the current
account and real effective exchange rate models) and the external sustainability assessment suggest
a significant overvaluation of the boliviano (Annex IV).
6 In the 2015–16 Global Competitiveness Index, Bolivia slipped to 117th place from 105th place in 2014–15.

BOLIVIA
INTERNATIONAL MONETARY FUND 15
16. Staff sees merit in gradually permitting greater exchange rate flexibility. Such a
transition would help address longstanding competitiveness and diversification challenges, facilitate
the adjustment to lower commodity price prices, and limit the potential impact of future shocks. It
would also help cement the tremendous progress on de-dollarization and build capacity to manage
exchange rate risks by requiring agents to internalize the effects of two-way flexibility. Importantly,
with buffers still ample, the financial sector stable, and macroeconomic performance solid,
preparations for greater flexibility could take place in fairly tranquil conditions—a key factor behind
smooth transitions to greater flexibility in other countries. Policies to implement the transition will
need to be carefully crafted and clearly communicated, with a view towards keeping inflation
expectations anchored, building market infrastructure, and strengthening policy and analytical
capacity as needed.
17. Central bank independence and a strong BCB balance sheet are critical elements of the
reform process. The BCB’s exposures to the SOEs—especially the state owned natural gas and
electricity companies—have grown substantially in recent years (Annex II). To avoid potential
conflicts with the BCB’s commitment to price stability, the BCB’s exposures to the SOEs should be
phased out. Instead, the developmental spending currently financed by BCB credit should be
transferred to a separate agency, funded by other means, and guided by transparent investment
rules, strong governance, and a clearly-stated development mandate.7
7 Enacting a new central bank law has been delayed, and a first draft is now expected in 2017 H1.
60
70
80
90
100
110
120
130
140
150
160
2010 2011 2012 2013 2014 2015 2016
Real Effective Exchange Rates(Indexes, January 2010=100)
Sources: Information Notice System and Fund staff calculations.
1/ The LA-5 countries include Brazil, Chile, Colombia, Mexico, and Peru.
Range of LA-5 REERs1/
Bolivia
Ecuador
0
5
10
15
20
25
30
35
40
45
2003 2004 2005 2006 2007 2008 2009 2010 2011 2012 2013 2014 2015
Exports, by Type of Product(In percent of GDP)
Sources: Banco Central de Bolivia.
Other nontraditional
Soy and derivatives
Minerals
Hydrocarbons
Other items
(incl. re-exports)
BOLIVIA
16 INTERNATIONAL MONETARY FUND
C. Cementing Financial Sector Stability and Promoting Financial Inclusion
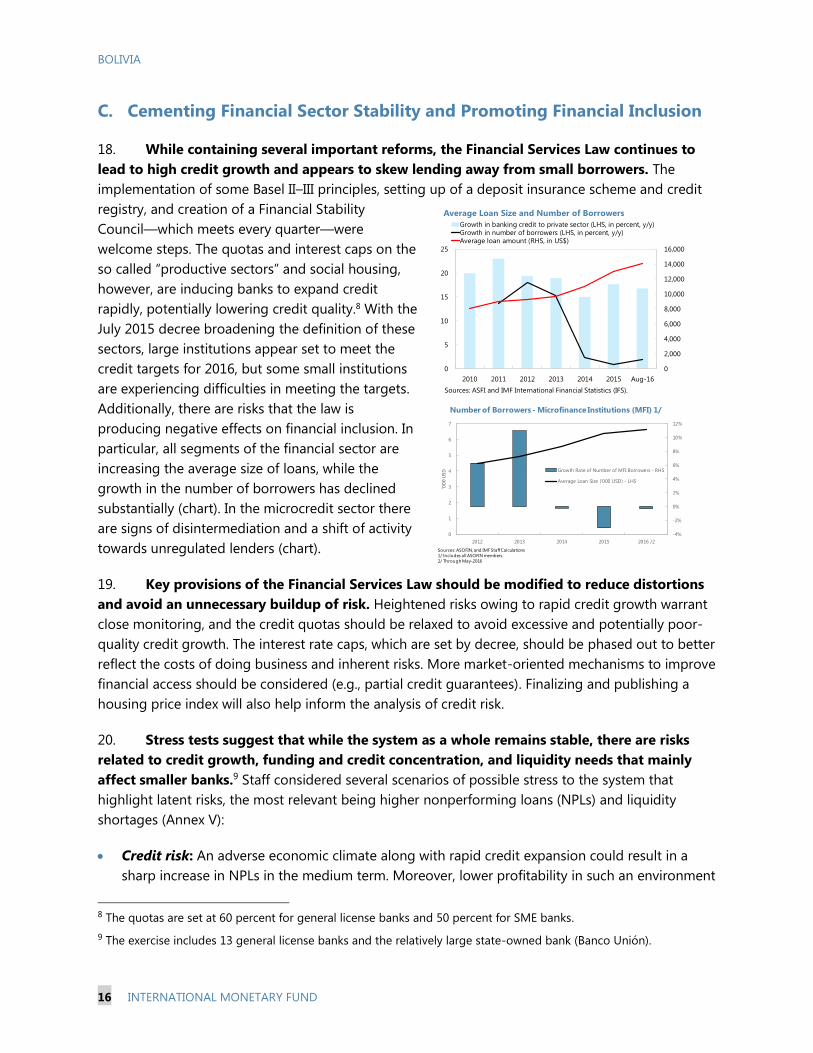
18. While containing several important reforms, the Financial Services Law continues to
lead to high credit growth and appears to skew lending away from small borrowers. The
implementation of some Basel II–III principles, setting up of a deposit insurance scheme and credit
registry, and creation of a Financial Stability
Council—which meets every quarter—were
welcome steps. The quotas and interest caps on the
so called “productive sectors” and social housing,
however, are inducing banks to expand credit
rapidly, potentially lowering credit quality.8 With the
July 2015 decree broadening the definition of these
sectors, large institutions appear set to meet the
credit targets for 2016, but some small institutions
are experiencing difficulties in meeting the targets.
Additionally, there are risks that the law is
producing negative effects on financial inclusion. In
particular, all segments of the financial sector are
increasing the average size of loans, while the
growth in the number of borrowers has declined
substantially (chart). In the microcredit sector there
are signs of disintermediation and a shift of activity
towards unregulated lenders (chart).
19. Key provisions of the Financial Services Law should be modified to reduce distortions
and avoid an unnecessary buildup of risk. Heightened risks owing to rapid credit growth warrant
close monitoring, and the credit quotas should be relaxed to avoid excessive and potentially poor-
quality credit growth. The interest rate caps, which are set by decree, should be phased out to better
reflect the costs of doing business and inherent risks. More market-oriented mechanisms to improve
financial access should be considered (e.g., partial credit guarantees). Finalizing and publishing a
housing price index will also help inform the analysis of credit risk.
20. Stress tests suggest that while the system as a whole remains stable, there are risks
related to credit growth, funding and credit concentration, and liquidity needs that mainly
affect smaller banks.9 Staff considered several scenarios of possible stress to the system that
highlight latent risks, the most relevant being higher nonperforming loans (NPLs) and liquidity
shortages (Annex V):
Credit risk: An adverse economic climate along with rapid credit expansion could result in a
sharp increase in NPLs in the medium term. Moreover, lower profitability in such an environment
8 The quotas are set at 60 percent for general license banks and 50 percent for SME banks.
9 The exercise includes 13 general license banks and the relatively large state-owned bank (Banco Unión).
0
2,000
4,000
6,000
8,000
10,000
12,000
14,000
16,000
0
5
10
15
20
25
2010 2011 2012 2013 2014 2015 Aug-16
Growth in banking credit to private sector (LHS, in percent, y/y)Growth in number of borrowers (LHS, in percent, y/y)Average loan amount (RHS, in US$)
Average Loan Size and Number of Borrowers
Sources: ASFI and IMF International Financial Statistics (IFS).
-4%
-2%
0%
2%
4%
6%
8%
10%
12%
0
1
2
3
4
5
6
7
2012 2013 2014 2015 2016 /2
'00
0 U
SD
Growth Rate of Number of MFI Borrowers - RHS
Average Loan Size ('000 USD) - LHS
Number of Borrowers - Microfinance Institutions (MFI) 1/
Sources: ASOFIN, and IMF Staff Calculations
1/ Includes all ASOFIN members.
2/ Through May-2016

BOLIVIA
INTERNATIONAL MONETARY FUND 17
would reduce the scope for building capital through retained earnings.10 In the event the NPL
ratio doubles, capital would need to be raised to meet regulatory requirements in just over half
of banks (chart). An even more adverse scenario, which involves a quadrupling in NPLs (a “one-
in-twenty year” shock, calibrated using historical patterns; a level that is still well below the peak
observed in 2002) would leave nearly all banks with some capital shortfall. Although nontrivial,
these losses remain broadly manageable (0.2 and 1.2 percent of GDP, respectively).
Concentration risk: The single largest credit exposure exceeds 10 percent of regulatory capital
in 10 banks in the system, and the five largest exposures together exceed half of the regulatory
capital in 8 banks in the system. This represents an important potential risk stemming from the
default of a small number of borrowers, especially for a few small banks.
Liquidity risk: There is currently sufficient liquidity at the system level, with an aggregate
liquidity coverage ratio of around 110 percent (chart).11 However, a stress scenario
corresponding to the largest deposit withdrawal rates observed in recent years suggests that
several small banks would struggle to cover required liquidity needs, but with no systemic
implications.
10 The Financial Services Law requires banks to retain 50 percent of their annual net profits to increase their capital
base.
11 Although Bolivia has not adopted the Basel III regulation (including LCR), liquidity stress tests were based on the
computation of LCR proxies in the spirit of Basel III requirements and assumptions, using data for end-June 2016. The
“Bolivia specific assumptions” allow for the largest deposit withdrawal rates observed in recent years in Bolivia to
materialize throughout the banking system (an extreme assumption).
-
25
50
75
100
125
150
175
B1 B2 B3 B4 B5 B6 B7 B8 B9 B10 B11 B12 B13 B14
LCR-based Liquidty Stress Tests
"Basel III" assumptions "Bolivia-specific" assumptions
01020304050607080
-
2
4
6
8
10
12
14
16
B1 B2 B3 B4 B5 B6 B7 B8 B9 (rhs) B10 (rhs) B11 B12 B13 B14
Bank Capital Adequacy Ratios
Reported data Adjusted for 'underprovising' "Doubling of NPLs" "Severe shock"
BOLIVIA
18 INTERNATIONAL MONETARY FUND
D. Enhancing Potential Growth and Inclusiveness
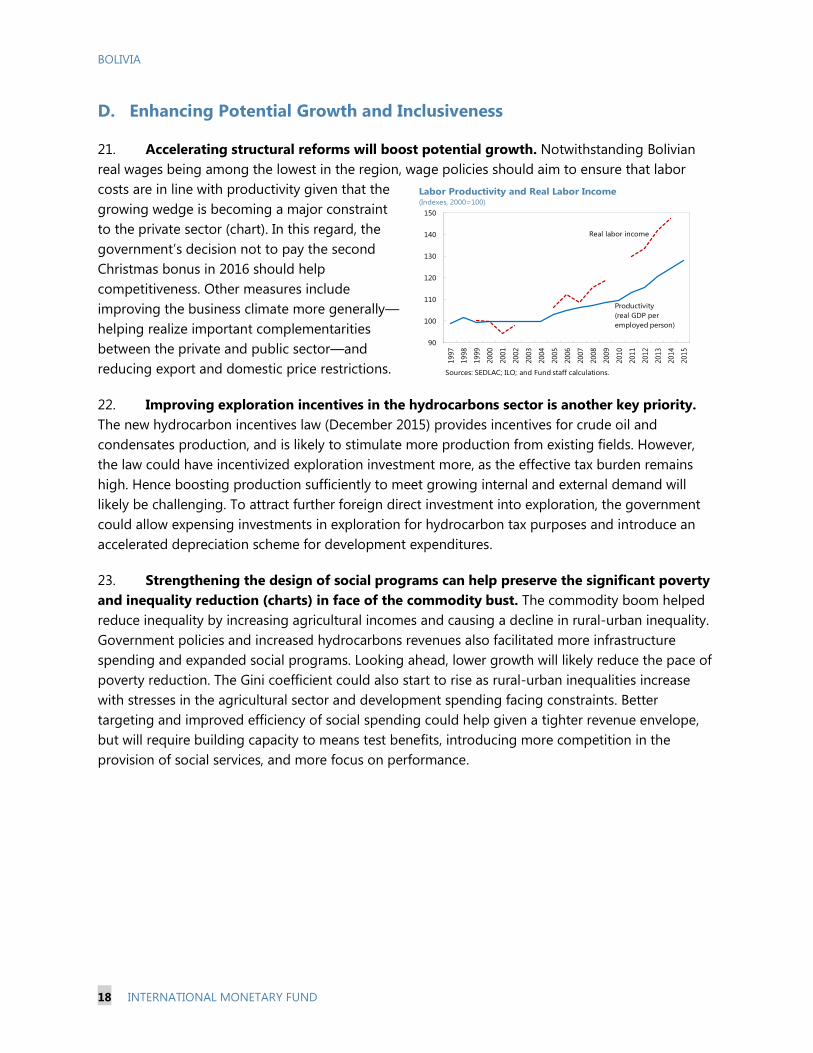
21. Accelerating structural reforms will boost potential growth. Notwithstanding Bolivian
real wages being among the lowest in the region, wage policies should aim to ensure that labor
costs are in line with productivity given that the
growing wedge is becoming a major constraint
to the private sector (chart). In this regard, the
government’s decision not to pay the second
Christmas bonus in 2016 should help
competitiveness. Other measures include
improving the business climate more generally—
helping realize important complementarities
between the private and public sector—and
reducing export and domestic price restrictions.
22. Improving exploration incentives in the hydrocarbons sector is another key priority.
The new hydrocarbon incentives law (December 2015) provides incentives for crude oil and
condensates production, and is likely to stimulate more production from existing fields. However,
the law could have incentivized exploration investment more, as the effective tax burden remains
high. Hence boosting production sufficiently to meet growing internal and external demand will
likely be challenging. To attract further foreign direct investment into exploration, the government
could allow expensing investments in exploration for hydrocarbon tax purposes and introduce an
accelerated depreciation scheme for development expenditures.
23. Strengthening the design of social programs can help preserve the significant poverty
and inequality reduction (charts) in face of the commodity bust. The commodity boom helped
reduce inequality by increasing agricultural incomes and causing a decline in rural-urban inequality.
Government policies and increased hydrocarbons revenues also facilitated more infrastructure
spending and expanded social programs. Looking ahead, lower growth will likely reduce the pace of
poverty reduction. The Gini coefficient could also start to rise as rural-urban inequalities increase
with stresses in the agricultural sector and development spending facing constraints. Better
targeting and improved efficiency of social spending could help given a tighter revenue envelope,
but will require building capacity to means test benefits, introducing more competition in the
provision of social services, and more focus on performance.
90
100
110
120
130
140
150
1997
1998
1999
2000
2001
2002
2003
2004
2005
2006
2007
2008
2009
2010
2011
2012
2013
2014
2015
Labor Productivity and Real Labor Income(Indexes, 2000=100)
Sources: SEDLAC; ILO; and Fund staff calculations.
Productivity
(real GDP per
employed person)
Real labor income

BOLIVIA
INTERNATIONAL MONETARY FUND 19
E. Authorities’ Views
24. The authorities do not share staff’s views on short and medium term growth prospects
for Bolivia. The authorities expect to reap greater benefits from their current and previous 5-year
development plans and viewed staff’s projections as overly pessimistic. They pointed to IMF
forecasts which had underestimated growth during the past decade. The authorities stressed that
strong public investment, one of the main engines of internal demand growth, and higher execution
rates, will boost growth both in the near and long term. Moreover, the authorities argued that these
measures will generate new income streams, and current twin deficits – which largely reflect high
public investment levels – are thus both expected and transitory in nature.
25. The authorities did not favor staff’s key policy recommendations. More generally, they
questioned if the IMF should make policy recommendations for Bolivia. The authorities’ 2017
budget is being planned on the basis of relatively low oil prices ($45 per barrel as in the 2016
budget), taking into account the less favorable external environment. They nevertheless expect
output growth of around 4.8 percent. The authorities argued that significant public spending plans
in the 2017 budget and beyond, notwithstanding their impact on large fiscal deficits, are oriented
towards economic diversification and finding new sources of revenue. At the same time, authorities
stressed that current spending levels remained well controlled. They did not concur with staff’s
recommendation to gradually reduce the non-hydrocarbon deficit over the medium term (a concept
they do not like because it is difficult to explain to the public).
26. The authorities pointed to the existing mechanisms of subnational fiscal adjustments,
which automatically limit persistent fiscal deficits over the medium term. Although
departmental governments are highly dependent on mining and hydrocarbon revenues, they are
required by the existing legal framework (Ley de Autonomías) to finance their operations through
their own resources and savings from previous years, which induces an automatic fiscal adjustment
towards a balanced budget. Under the law, the central government is under no obligation to
0.40
0.45
0.50
0.55
0.60
0.65
0.40
0.45
0.50
0.55
0.60
0.65
2000 2002 2004 2006 2008 2010 2012
BOL
LA MAX /1
LA MIN
Gini Inequality Index
Source: INE SEDLAC (CEDLAS and The World Bank)
/1 Includes ARG, BRA, ECU, SLV, HON, MEX, PRY, PER and URY.
2015
0
10
20
30
40
50
60
70
0
10
20
30
40
50
60
70
1999 2001 2005 2007 2009 2012
Extreme poverty Poverty
Population Under Poverty and Extreme Poverty
(In percent)
Source: National Statistics Institute (INE).
2015

BOLIVIA
20 INTERNATIONAL MONETARY FUND
transfer additional resources to departmental governments. Moreover, the authorities said that the
fiscal position of local governments (municipalities) had not weakened. They argued that the loss in
revenue of local governments from lower hydrocarbon revenues was counterbalanced through tax
sharing and existing transfer mechanisms, which have benefitted from a set of tax and customs
administration measures executed by the central government.
27. The authorities view the coordination of policies between the Ministry of Finance and
the BCB as a key tool to promote economic growth and stability. They see the coordination
between these entities as adequate, and do not see the need to phase out the BCB’s economic
development role. The authorities view the BCB loans to SOEs as a key source of financial resources
directed towards strategic investment projects that are part of their industrialization plans. In
addition, the authorities argued that the returns obtained by the BCB on these operations are higher
than those derived from alternative financial investments.
28. Notwithstanding the depreciation of neighboring currencies, the authorities do not
see an exchange rate misalignment. The authorities argued that exchange rate stability shielded
the domestic economy from inflationary pressures and other adverse effects of exchange rate
volatility observed in other countries in the region. Moreover, pointing to the experience of
neighboring countries, the authorities do not believe that more exchange rate flexibility would lead
to higher economic diversification, and would only have a limited impact in addressing external
imbalances.
29. The authorities disagreed with staff’s analysis suggesting the financial sector law may
have led to increased credit and other risks. They argued that credit growth was not excessive
given that credit was flowing to productive sectors and NPLs were the lowest in the region. The
authorities emphasized that banks remained profitable, and maintained that decreasing numbers of
borrowers and rising loans sizes were a result of reclassification and did not indicate a reversal of
gains in financial access. They explained that a housing price index was built, but more time would
be needed before it could be published.
30. The authorities highlighted their efforts to reduce poverty and inequality. They argued
that their social policies have played a fundamental role in reducing poverty and inequality. They are
also implementing and designing a number of projects to support the agriculture sector and rural
areas, some involving financial support from IFIs. They explained that their efforts to improve
irrigation and support farmers as well as building roads would help boost rural incomes and thus
reduce inequality even further.
STAFF APPRAISAL
31. After a decade of substantial economic and social progress, underpinned by sound
macroeconomic management, Bolivia is being challenged by low commodity prices. Bolivia
recorded strong growth accompanied by a substantial buildup of fiscal and external buffers, and
achieved significant reductions in poverty and inequality. However, Bolivia now faces the challenge
of adjusting to the new low commodity price normal while preserving and building on the economic
BOLIVIA
INTERNATIONAL MONETARY FUND 21
and social gains achieved in the past. Given still sizable policy buffers and developmental needs, the
authorities can take a measured approach to this adjustment, but it needs to start soon.
32. Growth will remain robust, but imbalances are growing. Growth is projected at
3.7 percent in 2016, despite temporary supply shocks given support from a sizeable public
investment plan and rapid credit growth. But given lower commodity prices, potential growth is
estimated at 3.5 percent, which is significantly lower than in the boom years. And relatively low
hydrocarbon prices combined with robust public spending levels is leading to sustained large fiscal
and external deficits, absent any significant adjustment. Rapid wage growth and sizeable exchange
rate appreciation in real effective terms have eroded Bolivia’s competitiveness.
33. Key policy priorities are the consolidation of the non-hydrocarbon primary balance
and allowing for greater exchange rate flexibility. Existing external sector pressures render policy
adjustment indispensable. The gradual consolidation of the non-hydrocarbon primary deficit,
especially through streamlining spending, would help ensure longer term fiscal sustainability. It will
also be important to adopt a credible medium-term fiscal framework which includes activities of
SOEs more systematically. Likewise, gradually transitioning towards a more flexible exchange rate
regime would help facilitate the adjustment to lower commodity prices and provide an important
line of defense against future external shocks.
34. Increasing private investment is key to medium-term prospects, while improving the
efficiency of social spending can help preserve the inequality and poverty reduction. The
existing hydrocarbon sector framework should be strengthened to increase the incentives for much
needed exploration activities. Reigning in wage growth, to prevent increases in labor costs not
aligned with productivity growth, and eliminating distortionary policies in product markets would
improve private sector participation and efficiency. Importantly, the short horizon of current proven
reserves of natural gas adds to the urgency to improve the business climate and governance,
helping promote the development of non-commodity sectors. Better targeting and improved
efficiency of social spending could help mitigate the negative impact of lower commodity prices on
inequality and poverty given a tighter revenue envelope. This will require building capacity to means
test benefits, introducing more competition in the provision of social services, and more focus on
performance.
35. Data provision is broadly adequate for surveillance, although some shortcomings are
present. Progress has been made to strengthen the quality of statistics, including working towards
full subscription of the Special Data Dissemination Standard (SDDS). Timely publication of
macroeconomic data according to a pre-announced schedule, improving data on quasi-fiscal
activities of subsidiaries of SOEs outside of the fiscal accounts, and publishing a real estate price
index would be further important steps to improve transparency.
36. Staff proposes holding the next Article IV Consultation with Bolivia on the standard
12-month cycle.
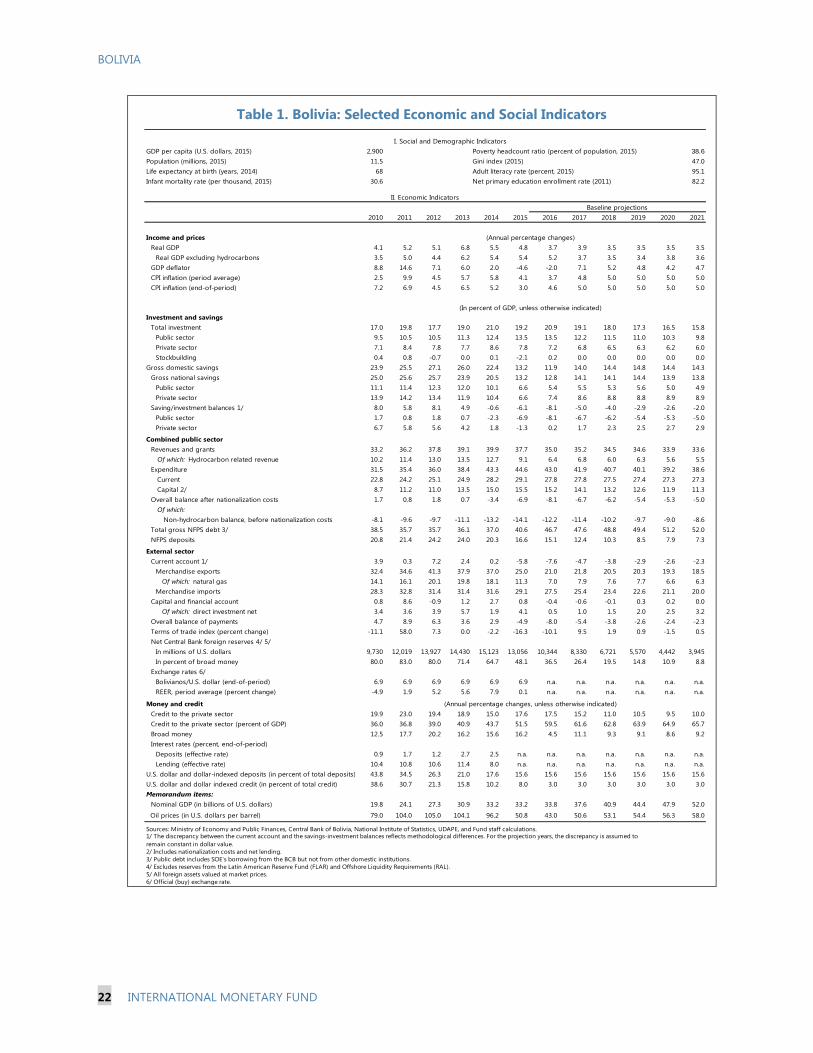
BOLIVIA
22 INTERNATIONAL MONETARY FUND
Table 1. Bolivia: Selected Economic and Social Indicators
GDP per capita (U.S. dollars, 2015) 2,900 Poverty headcount ratio (percent of population, 2015) 38.6
Population (millions, 2015) 11.5 Gini index (2015) 47.0
Life expectancy at birth (years, 2014) 68 Adult literacy rate (percent, 2015) 95.1
Infant mortality rate (per thousand, 2015) 30.6 Net primary education enrollment rate (2011) 82.2
2010 2011 2012 2013 2014 2015 2016 2017 2018 2019 2020 2021
Income and prices
Real GDP 4.1 5.2 5.1 6.8 5.5 4.8 3.7 3.9 3.5 3.5 3.5 3.5
Real GDP excluding hydrocarbons 3.5 5.0 4.4 6.2 5.4 5.4 5.2 3.7 3.5 3.4 3.8 3.6
GDP deflator 8.8 14.6 7.1 6.0 2.0 -4.6 -2.0 7.1 5.2 4.8 4.2 4.7
CPI inflation (period average) 2.5 9.9 4.5 5.7 5.8 4.1 3.7 4.8 5.0 5.0 5.0 5.0
CPI inflation (end-of-period) 7.2 6.9 4.5 6.5 5.2 3.0 4.6 5.0 5.0 5.0 5.0 5.0
Investment and savings
Total investment 17.0 19.8 17.7 19.0 21.0 19.2 20.9 19.1 18.0 17.3 16.5 15.8
Public sector 9.5 10.5 10.5 11.3 12.4 13.5 13.5 12.2 11.5 11.0 10.3 9.8
Private sector 7.1 8.4 7.8 7.7 8.6 7.8 7.2 6.8 6.5 6.3 6.2 6.0
Stockbuilding 0.4 0.8 -0.7 0.0 0.1 -2.1 0.2 0.0 0.0 0.0 0.0 0.0
Gross domestic savings 23.9 25.5 27.1 26.0 22.4 13.2 11.9 14.0 14.4 14.8 14.4 14.3
Gross national savings 25.0 25.6 25.7 23.9 20.5 13.2 12.8 14.1 14.1 14.4 13.9 13.8
Public sector 11.1 11.4 12.3 12.0 10.1 6.6 5.4 5.5 5.3 5.6 5.0 4.9
Private sector 13.9 14.2 13.4 11.9 10.4 6.6 7.4 8.6 8.8 8.8 8.9 8.9
Saving/investment balances 1/ 8.0 5.8 8.1 4.9 -0.6 -6.1 -8.1 -5.0 -4.0 -2.9 -2.6 -2.0
Public sector 1.7 0.8 1.8 0.7 -2.3 -6.9 -8.1 -6.7 -6.2 -5.4 -5.3 -5.0
Private sector 6.7 5.8 5.6 4.2 1.8 -1.3 0.2 1.7 2.3 2.5 2.7 2.9
Combined public sector
Revenues and grants 33.2 36.2 37.8 39.1 39.9 37.7 35.0 35.2 34.5 34.6 33.9 33.6
Of which: Hydrocarbon related revenue 10.2 11.4 13.0 13.5 12.7 9.1 6.4 6.8 6.0 6.3 5.6 5.5
Expenditure 31.5 35.4 36.0 38.4 43.3 44.6 43.0 41.9 40.7 40.1 39.2 38.6
Current 22.8 24.2 25.1 24.9 28.2 29.1 27.8 27.8 27.5 27.4 27.3 27.3
Capital 2/ 8.7 11.2 11.0 13.5 15.0 15.5 15.2 14.1 13.2 12.6 11.9 11.3
Overall balance after nationalization costs 1.7 0.8 1.8 0.7 -3.4 -6.9 -8.1 -6.7 -6.2 -5.4 -5.3 -5.0
Of which:
Non-hydrocarbon balance, before nationalization costs -8.1 -9.6 -9.7 -11.1 -13.2 -14.1 -12.2 -11.4 -10.2 -9.7 -9.0 -8.6
Total gross NFPS debt 3/ 38.5 35.7 35.7 36.1 37.0 40.6 46.7 47.6 48.8 49.4 51.2 52.0
NFPS deposits 20.8 21.4 24.2 24.0 20.3 16.6 15.1 12.4 10.3 8.5 7.9 7.3
External sector
Current account 1/ 3.9 0.3 7.2 2.4 0.2 -5.8 -7.6 -4.7 -3.8 -2.9 -2.6 -2.3
Merchandise exports 32.4 34.6 41.3 37.9 37.0 25.0 21.0 21.8 20.5 20.3 19.3 18.5
Of which: natural gas 14.1 16.1 20.1 19.8 18.1 11.3 7.0 7.9 7.6 7.7 6.6 6.3
Merchandise imports 28.3 32.8 31.4 31.4 31.6 29.1 27.5 25.4 23.4 22.6 21.1 20.0
Capital and financial account 0.8 8.6 -0.9 1.2 2.7 0.8 -0.4 -0.6 -0.1 0.3 0.2 0.0
Of which: direct investment net 3.4 3.6 3.9 5.7 1.9 4.1 0.5 1.0 1.5 2.0 2.5 3.2
Overall balance of payments 4.7 8.9 6.3 3.6 2.9 -4.9 -8.0 -5.4 -3.8 -2.6 -2.4 -2.3
Terms of trade index (percent change) -11.1 58.0 7.3 0.0 -2.2 -16.3 -10.1 9.5 1.9 0.9 -1.5 0.5
Net Central Bank foreign reserves 4/ 5/
In millions of U.S. dollars 9,730 12,019 13,927 14,430 15,123 13,056 10,344 8,330 6,721 5,570 4,442 3,945
In percent of broad money 80.0 83.0 80.0 71.4 64.7 48.1 36.5 26.4 19.5 14.8 10.9 8.8
Exchange rates 6/
Bolivianos/U.S. dollar (end-of-period) 6.9 6.9 6.9 6.9 6.9 6.9 n.a. n.a. n.a. n.a. n.a. n.a.
REER, period average (percent change) -4.9 1.9 5.2 5.6 7.9 0.1 n.a. n.a. n.a. n.a. n.a. n.a.
Money and credit
Credit to the private sector 19.9 23.0 19.4 18.9 15.0 17.6 17.5 15.2 11.0 10.5 9.5 10.0
Credit to the private sector (percent of GDP) 36.0 36.8 39.0 40.9 43.7 51.5 59.5 61.6 62.8 63.9 64.9 65.7
Broad money 12.5 17.7 20.2 16.2 15.6 16.2 4.5 11.1 9.3 9.1 8.6 9.2
Interest rates (percent, end-of-period)
Deposits (effective rate) 0.9 1.7 1.2 2.7 2.5 n.a. n.a. n.a. n.a. n.a. n.a. n.a.
Lending (effective rate) 10.4 10.8 10.6 11.4 8.0 n.a. n.a. n.a. n.a. n.a. n.a. n.a.
U.S. dollar and dollar-indexed deposits (in percent of total deposits) 43.8 34.5 26.3 21.0 17.6 15.6 15.6 15.6 15.6 15.6 15.6 15.6
U.S. dollar and dollar indexed credit (in percent of total credit) 38.6 30.7 21.3 15.8 10.2 8.0 3.0 3.0 3.0 3.0 3.0 3.0
Memorandum items:
Nominal GDP (in billions of U.S. dollars) 19.8 24.1 27.3 30.9 33.2 33.2 33.8 37.6 40.9 44.4 47.9 52.0
Oil prices (in U.S. dollars per barrel) 79.0 104.0 105.0 104.1 96.2 50.8 43.0 50.6 53.1 54.4 56.3 58.0
Sources: Ministry of Economy and Public Finances, Central Bank of Bolivia, National Institute of Statistics, UDAPE, and Fund staff calculations.
2/ Includes nationalization costs and net lending.
(Annual percentage changes, unless otherwise indicated)
I. Social and Demographic Indicators
II. Economic Indicators
4/ Excludes reserves from the Latin American Reserve Fund (FLAR) and Offshore Liquidity Requirements (RAL).
5/ All foreign assets valued at market prices.
6/ Official (buy) exchange rate.
1/ The discrepancy between the current account and the savings-investment balances reflects methodological differences. For the projection years, the discrepancy is assumed to
remain constant in dollar value.
(Annual percentage changes)
(In percent of GDP, unless otherwise indicated)
Baseline projections
3/ Public debt includes SOE's borrowing from the BCB but not from other domestic institutions.

BOLIVIA
INTERNATIONAL MONETARY FUND 23
Table 2. Bolivia: Financial System Survey 1/
2010 2011 2012 2013 2014 2015 2016 2017 2018 2019 2020 2021
Net short-term foreign assets 7,245 12,999 14,563 5,368 8,474 -10,886 -16,854 -10,566 -7,914 -4,582 -4,306 65
(Flows in millions of U.S. dollars) 1,088 2,025 2,123 783 1,235 -1,587 -2,457 -1,540 -1,154 -668 -628 9
Net domestic assets 1,029 1,313 4,339 14,189 13,025 38,756 26,419 33,378 29,288 27,328 27,787 27,023
Net credit to the public sector -7,487 -5,654 -6,132 -4,028 4,398 13,454 12,372 11,372 11,372 11,372 10,686 10,000
Credit to the private sector 8,258 11,423 11,832 13,784 13,038 17,571 20,586 20,934 17,474 18,432 18,521 21,307
Other items (net) 258 -4,456 -1,362 4,433 -4,411 7,731 -6,539 1,072 442 -2,476 -1,421 -4,284
Net medium and long-term foreign liabilities (increase -) -1,123 -620 -1,150 263 -118 1,844 1,194 1,194 1,194 1,194 1,194 1,194
Broad money 9,398 14,933 20,052 19,295 21,618 26,026 8,372 21,618 20,179 21,552 22,286 25,895
Liabilities in domestic currency 12,562 16,354 22,036 20,819 22,022 24,586 7,289 18,161 16,910 17,996 18,568 21,431
Foreign currency deposits -3,164 -1,421 -1,985 -1,525 -404 1,440 1,083 3,456 3,270 3,556 3,719 4,464
Net short-term foreign assets 77,635 90,634 105,197 110,565 119,040 108,154 91,300 80,734 72,820 68,238 63,931 63,996
(Stocks in millions of U.S. dollars) 11,187 13,212 15,335 16,117 17,353 15,766 13,309 11,769 10,615 9,947 9,319 9,329
Net domestic assets 8,458 9,771 14,110 28,299 41,324 80,080 106,499 139,877 169,165 196,493 224,280 251,303
Net credit to the public sector -17,492 -23,145 -29,277 -33,305 -28,906 -15,452 -3,080 8,292 19,664 31,036 41,722 51,722
Credit to the private sector 49,668 61,090 72,922 86,706 99,744 117,315 137,901 158,835 176,308 194,740 213,262 234,569
Other items (net) -23,718 -28,174 -29,536 -25,103 -29,514 -21,783 -28,321 -27,249 -26,807 -29,283 -30,704 -34,988
Net medium and long-term foreign liabilities (increase -) 1,710 1,090 -60 203 85 1,929 3,123 4,317 5,510 6,704 7,898 9,092
Broad money 84,382 99,315 119,367 138,661 160,279 186,305 194,677 216,295 236,474 258,026 280,313 306,207
Liabilities in domestic currency 57,375 73,728 95,765 116,584 138,606 163,192 170,481 188,643 205,552 223,548 242,116 263,547
Foreign currency deposits 27,007 25,587 23,602 22,077 21,673 23,113 24,196 27,652 30,922 34,478 38,197 42,661
Net short-term foreign assets 9.7 15.4 14.7 4.5 6.1 -6.8 -9.0 -5.4 -3.7 -1.9 -1.7 0.0
Net domestic assets 1.4 1.6 4.4 11.9 9.4 24.2 14.2 17.1 13.5 11.6 10.8 9.6
Net credit to the public sector -10.0 -6.7 -6.2 -3.4 3.2 8.4 6.6 5.8 5.3 4.8 4.1 3.6
Credit to the private sector 11.0 13.5 11.9 11.5 9.4 11.0 11.0 10.8 8.1 7.8 7.2 7.6
Other items (net) 0.3 -5.3 -1.4 3.7 -3.2 4.8 -3.5 0.6 0.2 -1.0 -0.6 -1.5
Net medium and long-term foreign liabilities -1.5 -0.7 -1.2 0.2 -0.1 1.2 0.6 0.6 0.6 0.5 0.5 0.4
Broad money 12.5 17.7 20.2 16.2 15.6 16.2 4.5 11.1 9.3 9.1 8.6 9.2
Liabilities in domestic currency 16.8 19.4 22.2 17.4 15.9 15.3 3.9 9.3 7.8 7.6 7.2 7.6
Foreign currency deposits -4.2 -1.7 -2.0 -1.3 -0.3 0.9 0.6 1.8 1.5 1.5 1.4 1.6
Sources: Central Bank of Bolivia, and Fund staff calculations.
1/ The financial system comprises the central bank, commercial banks and nonbanks, and the Banco de Desarrollo Productivo (BDP), which is a state-owned
second-tier bank.
(Flows in millions of Bolivianos, unless otherwise indicated)
(Stocks in millions of Bolivianos, unless otherwise indicated)
(Changes in percent of broad money at the beginning of the period)
Baseline projections

BOLIVIA
24 INTERNATIONAL MONETARY FUND
Table 3. Bolivia: Operations of the Consolidated Public Sector 1/
(In percent of GDP, unless otherwise indicated)
2010 2011 2012 2013 2014 2015 2016 2017 2018 2019 2020 2021
Revenue 33.2 36.2 37.8 39.1 39.9 37.7 35.0 35.2 34.5 34.6 33.9 33.6
Taxes 26.3 28.9 31.8 33.7 33.7 31.3 28.7 28.8 28.8 28.7 28.3 28.0
IDH and royalties 7.7 8.3 10.3 11.5 10.8 7.6 5.1 5.4 5.3 5.4 5.1 5.0
Direct taxes 4.6 5.5 5.7 6.0 6.2 6.1 6.1 6.1 6.1 6.0 6.0 6.0
o/w: Corporate income tax 3.8 4.6 5.0 5.3 5.4 5.4 5.4 5.4 5.4 5.4 5.4 5.4
Indirect taxes 14.0 15.2 15.7 16.2 16.7 17.6 17.5 17.3 17.4 17.2 17.1 16.9
o/w: VAT 7.2 8.1 8.7 9.0 9.0 9.1 9.0 8.9 9.0 8.9 8.8 8.7
o/w: Excise tax on fuel 1.6 1.5 1.3 1.3 1.3 1.3 1.4 1.4 1.4 1.4 1.4 1.4
Grants 1.1 0.8 0.7 0.3 0.3 0.4 0.3 0.3 0.3 0.3 0.3 0.3
Other revenue 5.8 6.5 5.4 5.1 5.9 6.1 5.9 6.1 5.4 5.6 5.3 5.3
Nontax revenue 3.4 3.0 2.6 2.7 3.8 4.5 4.6 4.6 4.6 4.6 4.6 4.6
Public enterprises operating balance 2.5 3.2 2.6 2.0 1.9 1.5 1.3 1.4 0.7 0.8 0.5 0.5
Central bank operating balance -0.1 0.2 0.1 0.3 0.2 0.1 0.0 0.1 0.1 0.2 0.2 0.2
Expenditure 31.5 35.4 36.0 38.4 43.3 44.6 43.0 41.9 40.7 40.1 39.2 38.6
Expense 22.8 24.2 25.1 24.9 28.2 29.1 27.8 27.8 27.5 27.4 27.3 27.3
Compensation of employees 9.5 9.3 9.0 9.1 10.4 12.6 12.2 11.7 11.5 11.3 11.1 10.9
Purchases of goods and services 2.2 3.0 2.1 2.3 2.8 3.8 3.7 3.7 3.7 3.7 3.7 3.7
Interest 1.4 1.2 1.0 1.0 1.0 1.0 1.0 1.1 1.1 1.2 1.4 1.5
Domestic 1.1 1.0 0.8 0.6 0.5 0.5 0.5 0.6 0.7 0.8 1.0 1.2
Foreign 0.3 0.2 0.2 0.3 0.4 0.5 0.5 0.4 0.4 0.4 0.4 0.4
Subsidies 2/ 0.9 2.1 3.1 3.0 2.0 1.3 0.8 1.5 1.4 1.5 1.4 1.5
Social benefits 3/ 7.8 7.9 8.8 8.9 9.5 8.4 8.1 7.9 7.9 7.8 7.8 7.7
Other expense 1.1 0.7 1.1 0.7 2.6 2.0 2.0 1.9 1.9 1.9 1.9 1.9
Other 1.1 0.7 1.1 0.7 1.5 2.0 2.0 1.9 1.9 1.9 1.9 1.9
Nationalization cost 0.0 0.0 0.0 0.0 1.1 0.0 0.0 0.0 0.0 0.0 0.0 0.0
Net acquisition of nonfinancial assets 4/ 8.7 11.2 11.0 13.5 15.0 15.5 15.2 14.1 13.2 12.6 11.9 11.3
o/w: Public Enterprises 0.9 1.9 2.8 3.2 3.7 4.7 4.4 4.3 4.0 3.9 3.8 3.7
Gross operating balance 10.4 12.0 12.7 14.2 11.7 8.6 7.2 7.3 7.0 7.2 6.6 6.3
Net lending/borrowing (overall balance) 1.7 0.8 1.8 0.7 -3.4 -6.9 -8.1 -6.7 -6.2 -5.4 -5.3 -5.0
Net financial transactions 1.7 0.8 1.8 0.7 -3.4 -6.9 -8.1 -6.7 -6.2 -5.4 -5.3 -5.0
Net incurrence of liabilities -1.7 -0.8 -1.8 -0.7 3.4 6.9 8.1 6.7 6.2 5.4 5.3 5.0
External 1.0 1.8 2.3 2.5 1.3 1.9 1.6 1.5 1.5 1.4 1.2 1.1
Disbursements 4.1 4.7 5.5 4.0 2.3 3.1 2.5 2.3 2.3 2.2 2.1 2.1
Amortizations -3.0 -2.8 -3.2 -1.1 -0.9 -1.1 -0.8 -0.8 -0.7 -0.7 -0.9 -0.9
Other external 0.0 -0.1 0.0 -0.5 -0.1 -0.1 -0.1 -0.1 -0.1 -0.1 -0.1 -0.1
Domestic -2.7 -2.6 -4.1 -3.1 2.0 5.0 6.5 5.2 4.7 4.0 4.1 3.9
Banking system -5.3 -3.5 -3.4 -2.1 1.8 5.9 5.3 4.4 4.0 3.7 3.3 2.8
Central Bank -4.9 -2.7 -3.3 -2.4 1.8 5.8 4.7 3.9 3.6 3.3 3.0 2.8
Commercial banks -0.4 -0.9 -0.1 0.2 0.0 0.1 0.6 0.5 0.5 0.5 0.2 0.0
Pension funds 0.0 0.0 -0.7 -0.8 -0.8 0.0 0.0 0.0 0.0 0.0 0.0 0.0
Other domestic 2.6 0.9 -0.7 -1.0 0.2 -0.9 1.1 0.8 0.7 0.2 0.8 1.1
Memorandum items:
Primary balance 3.1 2.1 2.8 1.6 -2.4 -5.9 -7.0 -5.7 -5.1 -4.2 -3.9 -3.4
Overall balance before nationalization 1.7 0.8 1.8 0.7 -2.3 -6.9 -8.1 -6.7 -6.2 -5.4 -5.3 -5.0
o/w Non-hydrocarbon primary balance 5/ -6.7 -8.3 -8.7 -10.1 -12.3 -13.1 -11.2 -10.3 -9.1 -8.5 -7.6 -7.1
Overall balance as a share of non-hydrocarbon GDP 1.8 0.9 1.9 0.7 -2.5 -7.3 -8.5 -7.1 -6.5 -5.7 -5.5 -5.2
Hydrocarbon related revenue 6/ 10.2 11.4 13.0 13.5 12.7 9.1 6.4 6.8 6.0 6.3 5.6 5.5
Hydrocarbon balance 7/ 9.8 10.4 11.4 11.7 11.0 7.2 4.2 4.7 4.0 4.3 3.7 3.6
Nonfinancial public sector gross public debt 8/ 38.5 35.7 35.7 36.1 37.0 40.6 46.7 47.6 48.8 49.4 51.2 52.0
o/w gross foreign public debt 15.4 14.8 15.7 17.0 17.3 19.1 20.3 19.8 19.7 19.6 19.3 18.9
Nonfinancial public sector gross public debt
(in percent of non-hydrocarbon GDP) 41.1 38.6 39.5 40.3 41.0 43.3 49.1 50.0 51.3 52.0 53.6 54.5
Nominal GDP in billions of Bolivianos 137.9 166.2 187.2 211.9 228.0 228.0 231.9 258.0 280.8 304.7 328.4 356.9
Sources: Ministry of Economy and Public Finances and Fund staff calculations.
1/ The operation of mixed-ownership companies, primarily in the telecommunications, electricity and hydrocarbon sectors, are not included.
2/ Includes incentives for hydrocarbon exploration investments in the projection period.
3/ Includes pensions, cash transfers to households, and social investment programs (previously classified as capital expenditure).
5/ Primary balance before nationalization costs minus hydrocarbon related balance.
6/ Hydrocarbon related revenues are defined as direct hydrocarbon tax (IDH), royalties, and the operating balance of state oil/gas company (YPFB).
7/ Hydrocarbon related revenues minus YPFB capital expenditures.
8/ Public debt includes SOE's borrowing from the BCB but not from other domestic institutions.
Baseline projections
4/ The authorities' programs of social investment, including school breakfast, recurrent costs on basic sanitation and social management, are reclassified to current
spending.

BOLIVIA
INTERNATIONAL MONETARY FUND 25
Table 4. Bolivia: Summary Balance of Payments
(In millions of U.S. dollars, unless otherwise indicated)
2010 2011 2012 2013 2014 2015 2016 2017 2018 2019 2020 2021
Current account 766 77 1,970 749 61 -1,923 -2,563 -1,786 -1,571 -1,298 -1,232 -1,211
Trade balance 812 431 2,676 2,014 1,783 -1,384 -2,209 -1,354 -1,233 -998 -868 -765
Exports, f.o.b. 6,402 8,358 11,254 11,698 12,301 8,302 7,100 8,188 8,560 9,034 9,253 9,641
Exports, c.i.f. 7,052 9,215 11,991 12,372 13,028 8,912 7,710 8,797 9,170 9,643 9,862 10,251
Natural gas 2,798 3,885 5,479 6,113 6,012 3,771 2,358 2,956 3,170 3,398 3,165 3,254
Mining 2,396 3,429 3,744 3,077 3,929 2,852 3,164 3,482 3,577 3,686 3,811 3,966
Soy - related 496 628 977 1,211 1,083 795 856 822 818 846 873 902
Other 1,363 1,273 1,791 1,970 2,004 1,494 1,331 1,537 1,604 1,713 2,013 2,128
Imports, c.i.f. -5,590 -7,927 -8,578 -9,684 -10,518 -9,686 -9,309 -9,542 -9,793 -10,032 -10,121 -10,406
Services (net) -263 -369 -342 -627 -1,099 -535 -657 -451 -205 -133 -144 -156
Income (net) -864 -1,161 -1,629 -1,908 -1,707 -1,173 -866 -1,181 -1,365 -1,429 -1,512 -1,627
Transfers (net) 1,081 1,175 1,266 1,270 1,084 1,169 1,169 1,201 1,231 1,262 1,292 1,337
Capital and financial account 157 2,083 -258 372 909 280 -149 -228 -39 147 103 713
Capital transfers -7 6 6 6 5 5 0 0 0 0 0 0
Direct investment (net) 672 859 1,060 1,750 648 503 169 376 628 888 1,197 1,665
Gross investment 915 954 1,505 2,030 2,113 1,060 693 950 1,202 1,435 1,753 1,885
Disinvestment and investment abroad -293 -95 -445 -280 -1,465 -557 -524 -574 -574 -547 -556 -584
Portfolio investment (net) 90 186 -360 -429 -561 -917 65 -148 -125 -163 -359 -336
Public sector 263 537 651 -458 1,101 838 562 596 629 665 604 581
Disbursements 538 777 1,135 1,243 759 1,032 839 881 925 971 1,019 1,070
Amortization -528 -607 -829 -279 -231 -376 -276 -285 -295 -306 -415 -489
Other (net) 253 367 346 -1,423 573 182 0 0 0 0 0 0
Private sector -101 -611 -815 -1,045 -1,303 -1,163 -946 -1,052 -1,171 -1,243 -1,339 -1,197
Errors and omissions -759 1,107 -800 549 1,018 1,015 0 0 0 0 0 0
Overall balance 923 2,160 1,712 1,122 971 -1,643 -2,712 -2,014 -1,610 -1,151 -1,129 -497
Financing -923 -2,160 -1,712 -1,122 -971 1,643 2,712 2,014 1,610 1,151 1,129 497
Memorandum items:
Current account (in percent of GDP) 3.9 0.3 7.2 2.4 0.2 -5.8 -7.6 -4.7 -3.8 -2.9 -2.6 -2.3
Current account (in percent of non-hydrocarbon GDP) 4.1 0.3 8.0 2.7 0.2 -6.2 -8.0 -5.0 -4.0 -3.1 -2.7 -2.4
Non-energy current account (in percent of non-hydrocarbon GDP) -6.0 -10.6 -7.9 -13.7 -14.7 -13.9 -11.7 -9.4 -8.3 -7.4 -6.0 -5.7
Merchandise exports (in percent of GDP) 32.4 34.6 41.3 37.9 37.0 25.0 21.0 21.8 20.5 20.3 19.3 18.5
Merchandise imports (in percent of GDP) -28.3 -32.8 -31.4 -31.4 -31.6 -29.1 -27.5 -25.4 -23.4 -22.6 -21.1 -20.0
Net official reserves (end-of-period) 9,730 12,019 13,927 14,430 15,123 13,480 10,768 8,753 7,143 5,992 4,863 4,366
(in months of imports of goods and services) 17.6 15.7 16.8 15.2 14.1 14.2 11.6 9.3 7.4 6.0 4.8 4.1
Foreign direct investment (in percent of GDP) 3.4 3.6 3.9 5.7 1.9 4.1 0.5 1.0 1.5 2.0 2.5 3.2
GDP (in millions of U.S. dollars) 19,786 24,135 27,282 30,883 33,237 33,238 33,798 37,612 40,932 44,411 47,869 52,028
Capital account (in percent of GDP) 0.8 8.6 -0.9 1.2 2.7 0.8 -0.4 -0.6 -0.1 0.3 0.2 0.0
Errors and omissions (in percent of GDP) -3.8 4.6 -2.9 1.8 3.1 3.1 0.0 0.0 0.0 0.0 0.0 0.0
Export value growth (in percent) 29.1 30.6 34.6 3.9 5.2 -32.5 -14.5 15.3 4.5 5.5 2.4 4.2
Export volume growth (in percent) 28.5 -26.0 25.8 6.6 10.6 -15.1 -0.9 12.7 3.2 4.7 2.1 3.7
Export prices growth (in percent) 0.4 76.4 7.0 -2.5 -4.9 -20.5 -13.7 2.4 1.3 0.8 0.3 0.4
Import value growth (in percent) 23.0 41.8 8.2 12.9 8.6 -7.9 -4.9 2.5 2.7 2.6 1.8 2.8
Import volume growth (in percent) 8.8 27.0 8.5 15.8 11.7 -3.0 -4.0 1.0 2.2 1.9 1.1 2.4
Import prices growth (in percent) 13.0 11.6 -0.3 -2.5 -2.7 -5.1 -1.0 1.5 0.5 0.7 0.7 0.4
Sources: Central Bank of Bolivia, National Institute of Statistics and Fund staff calculations.
Baseline projections
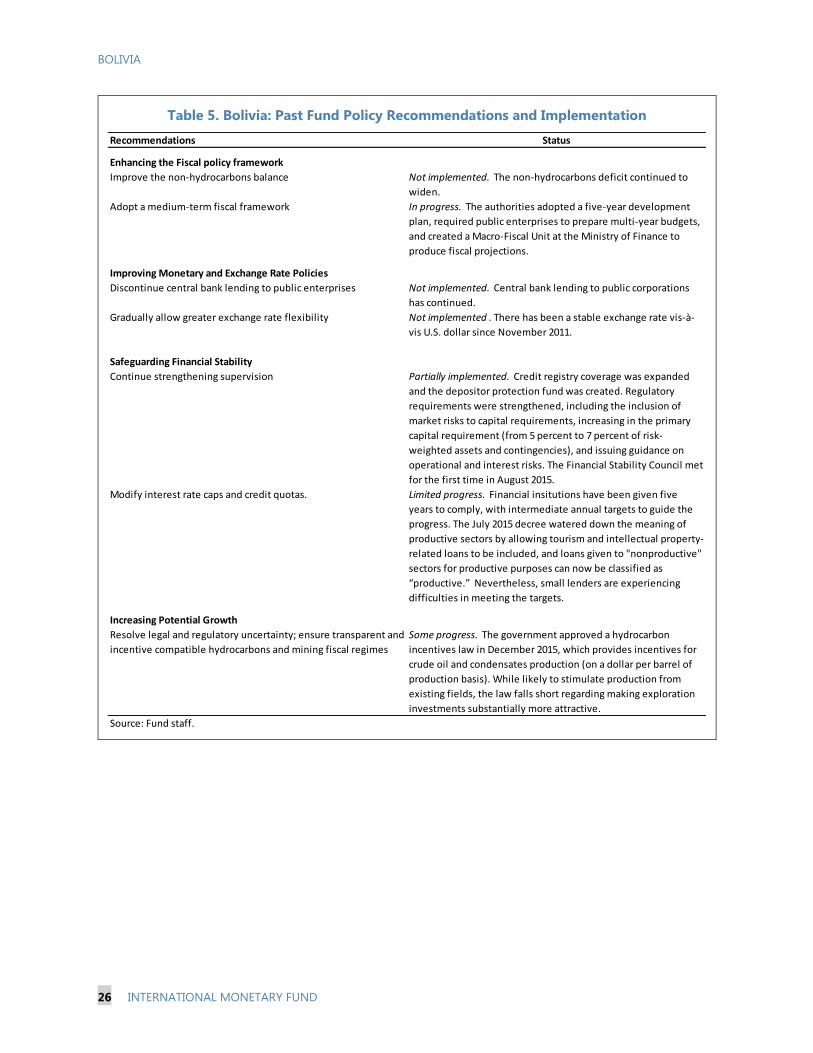
BOLIVIA
26 INTERNATIONAL MONETARY FUND
Table 5. Bolivia: Past Fund Policy Recommendations and Implementation
Recommendations Status
Enhancing the Fiscal policy framework
Improve the non-hydrocarbons balance Not implemented. The non-hydrocarbons deficit continued to
widen.
Adopt a medium-term fiscal framework In progress. The authorities adopted a five-year development
plan, required public enterprises to prepare multi-year budgets,
and created a Macro-Fiscal Unit at the Ministry of Finance to
produce fiscal projections.
Improving Monetary and Exchange Rate Policies
Discontinue central bank lending to public enterprises Not implemented. Central bank lending to public corporations
has continued.
Gradually allow greater exchange rate flexibility Not implemented . There has been a stable exchange rate vis-à-
vis U.S. dollar since November 2011.
Safeguarding Financial Stability
Continue strengthening supervision Partially implemented. Credit registry coverage was expanded
and the depositor protection fund was created. Regulatory
requirements were strengthened, including the inclusion of
market risks to capital requirements, increasing in the primary
capital requirement (from 5 percent to 7 percent of risk-
weighted assets and contingencies), and issuing guidance on
operational and interest risks. The Financial Stability Council met
for the first time in August 2015.
Modify interest rate caps and credit quotas. Limited progress. Financial insitutions have been given five
years to comply, with intermediate annual targets to guide the
progress. The July 2015 decree watered down the meaning of
productive sectors by allowing tourism and intellectual property-
related loans to be included, and loans given to "nonproductive"
sectors for productive purposes can now be classified as
“productive.” Nevertheless, small lenders are experiencing
difficulties in meeting the targets.
Increasing Potential Growth
Resolve legal and regulatory uncertainty; ensure transparent and
incentive compatible hydrocarbons and mining fiscal regimes
Some progress. The government approved a hydrocarbon
incentives law in December 2015, which provides incentives for
crude oil and condensates production (on a dollar per barrel of
production basis). While likely to stimulate production from
existing fields, the law falls short regarding making exploration
investments substantially more attractive.
Source: Fund staff.
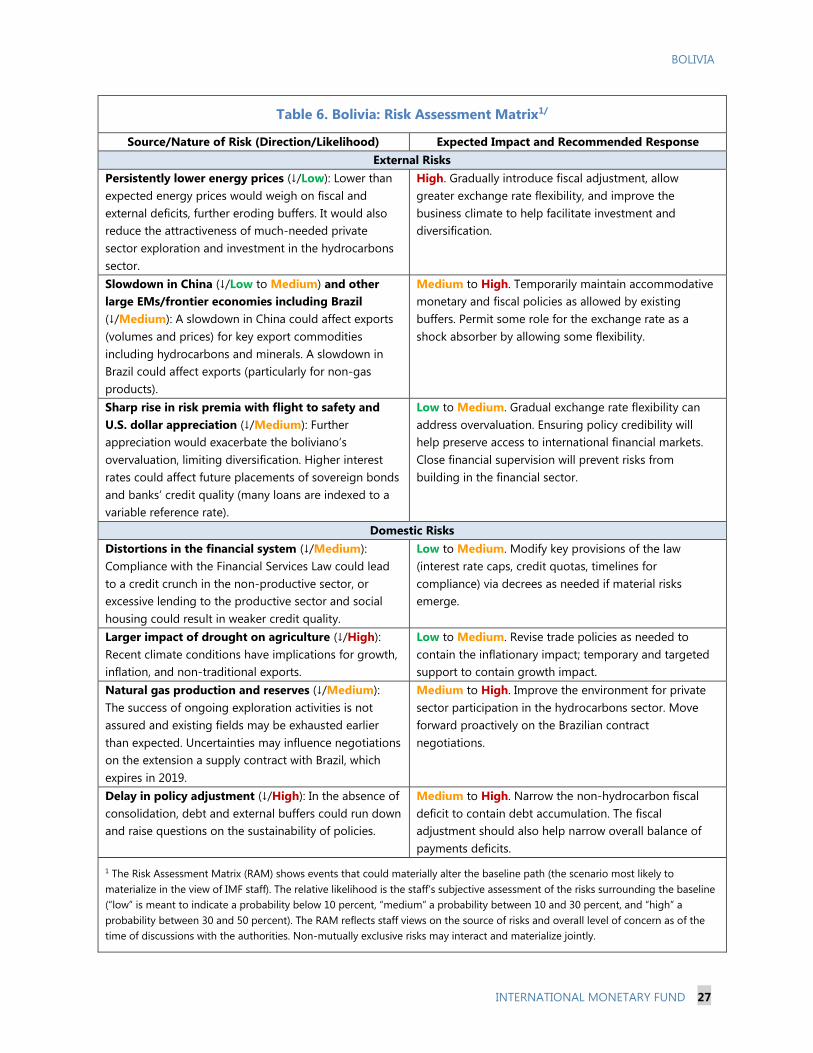
BOLIVIA
INTERNATIONAL MONETARY FUND 27
Table 6. Bolivia: Risk Assessment Matrix1/
Source/Nature of Risk (Direction/Likelihood) Expected Impact and Recommended Response
External Risks
Persistently lower energy prices (↓/Low): Lower than
expected energy prices would weigh on fiscal and
external deficits, further eroding buffers. It would also
reduce the attractiveness of much-needed private
sector exploration and investment in the hydrocarbons
sector.
High. Gradually introduce fiscal adjustment, allow
greater exchange rate flexibility, and improve the
business climate to help facilitate investment and
diversification.
Slowdown in China (↓/Low to Medium) and other
large EMs/frontier economies including Brazil
(↓/Medium): A slowdown in China could affect exports
(volumes and prices) for key export commodities
including hydrocarbons and minerals. A slowdown in
Brazil could affect exports (particularly for non-gas
products).
Medium to High. Temporarily maintain accommodative
monetary and fiscal policies as allowed by existing
buffers. Permit some role for the exchange rate as a
shock absorber by allowing some flexibility.
Sharp rise in risk premia with flight to safety and
U.S. dollar appreciation (↓/Medium): Further
appreciation would exacerbate the boliviano’s
overvaluation, limiting diversification. Higher interest
rates could affect future placements of sovereign bonds
and banks’ credit quality (many loans are indexed to a
variable reference rate).
Low to Medium. Gradual exchange rate flexibility can
address overvaluation. Ensuring policy credibility will
help preserve access to international financial markets.
Close financial supervision will prevent risks from
building in the financial sector.
Domestic Risks
Distortions in the financial system (↓/Medium):
Compliance with the Financial Services Law could lead
to a credit crunch in the non-productive sector, or
excessive lending to the productive sector and social
housing could result in weaker credit quality.
Low to Medium. Modify key provisions of the law
(interest rate caps, credit quotas, timelines for
compliance) via decrees as needed if material risks
emerge.
Larger impact of drought on agriculture (↓/High):
Recent climate conditions have implications for growth,
inflation, and non-traditional exports.
Low to Medium. Revise trade policies as needed to
contain the inflationary impact; temporary and targeted
support to contain growth impact.
Natural gas production and reserves (↓/Medium):
The success of ongoing exploration activities is not
assured and existing fields may be exhausted earlier
than expected. Uncertainties may influence negotiations
on the extension a supply contract with Brazil, which
expires in 2019.
Medium to High. Improve the environment for private
sector participation in the hydrocarbons sector. Move
forward proactively on the Brazilian contract
negotiations.
Delay in policy adjustment (↓/High): In the absence of
consolidation, debt and external buffers could run down
and raise questions on the sustainability of policies.
Medium to High. Narrow the non-hydrocarbon fiscal
deficit to contain debt accumulation. The fiscal
adjustment should also help narrow overall balance of
payments deficits.
1 The Risk Assessment Matrix (RAM) shows events that could materially alter the baseline path (the scenario most likely to
materialize in the view of IMF staff). The relative likelihood is the staff’s subjective assessment of the risks surrounding the baseline
(“low” is meant to indicate a probability below 10 percent, “medium” a probability between 10 and 30 percent, and “high” a
probability between 30 and 50 percent). The RAM reflects staff views on the source of risks and overall level of concern as of the
time of discussions with the authorities. Non-mutually exclusive risks may interact and materialize jointly.

BOLIVIA
28 INTERNATIONAL MONETARY FUND
Figure 1. Bolivia: Real Sector Developments
Inflation has remained at moderate levels despite
some volatility in food prices....
-5
0
5
10
15
20
25
-5
0
5
10
15
20
25
Jan-09 Jan-11 Jan-13 Jan-15
Headline Food
CPI Inflation
(In percent, y/y)
Jul-16
0
1
2
3
4
5
6
7
8
Jul-14 Jan-15 Jul-15 Jan-16 Jul-16
Other
Restaurants & Hotels
Transportation
Housing and Basic Services
Food and Nonalcoholic Beverages
Contribution to CPI Inflation
(In percent, y/y)
Sources: National Institute of Statistics, Central Bank of Bolivia, Haver Analytics, Inc., SEDLAC, World Bank, and
Fund staff estimates.
0
1
2
3
4
5
6
7
8
9
10
0
1
2
3
4
5
6
7
8
9
10
Jan-09 Jan-11 Jan-13 Jan-15
y/y growth
y/y growth of 12 month moving average
Index of Economic Activity
(In percent)
May-16
Economic activity is moderating but remains
robust...
....with strong growth in financial services
offsetting weakness in gas production.
On the demand side, private consumption
continues to be the main driver of growth...
....while investment has turned negative, due to
weakness in the private sector.
...which dominate movements in the headline
number given their large weight.
-15
-10
-5
0
5
10
15
2009Q1 2010Q4 2012Q3 2014Q2 2016Q1
Net exports Investment
Private consumption Gov. consumption
GDP
Contributions to Real GDP Growth
(In percent, y/y)
-15
-10
-5
0
5
10
15
20
25
Jan-10 Jan-12 Jan-14
Natural gas and petroleum
Mining
Financial services
Agriculture, livestock, forestry, hunting and fishing
Index of Economic Activity
(In percent, 12 month moving average)
May-16
-15
-10
-5
0
5
10
15
20
25
30
35
2009Q1 2010Q4 2012Q3 2014Q2 2016Q1
Private
Public
Gross fixed capital formation
Contributions to Real Investment Growth
(In percent, y/y)

BOLIVIA
INTERNATIONAL MONETARY FUND 29
Figure 2. Bolivia: Monetary Developments
`
`
Figure 2. Bolivia: Monetary Developments
Rates on Central Bank paper have remained low
while interbank rates have edged up from low levels.
Declines in NFA have reduced banks' excess reserves
and the need for BCB open market operations.
Real interest rates on deposits continue to be negative.
0.0
2.0
4.0
6.0
8.0
10.0
12.0
14.0
Jan-08 Jan-10 Jan-12 Jan-14 Jan-16
0.0
2.0
4.0
6.0
8.0
10.0
12.0
14.0
90-day Central Bank paper
rate
Interbank rate
Policy Rate and Exchange Rate
(In percent)
0
1,000
2,000
3,000
4,000
5,000
6,000
7,000
0
1,000
2,000
3,000
4,000
5,000
6,000
7,000
Jan-08 Jan-10 Jan-12 Jan-14 Jan-16
Excess reserves
Required reserves
Open market operations
Bank Reserves and Open Market Operations
(In millions of US dollars)
Sources: Central Bank of Bolivia, National Institute of Statistics, and Fund staff estimates.
Central bank credit to state-owned enterprises
continues to expand.
0
5
10
15
20
0
5
10
15
20
Jan-08 Jan-10 Jan-12 Jan-14 Jan-16
Interest Rates and Inflation
(In percent)
Inflation rate (y/y)
Deposit rate
Lending rate
0
5,000
10,000
15,000
20,000
25,000
30,000
0
5,000
10,000
15,000
20,000
25,000
30,000
35,000
Jan-08 Jan-10 Jan-12 Jan-14 Jan-16
Tho
usa
nd
s
Tho
usa
nd
s
Central government
State-owned enterprises
Central Bank Lending to the Public Sector
(In millions of Bolivianos)
Dollarization ratios have stabilized at low levels.
0
500
1,000
1,500
2,000
2,500
3,000
3,500
0
500
1,000
1,500
2,000
2,500
3,000
3,500
Jan-08 Jan-10 Jan-12 Jan-14 Jan-16
Tho
usa
nd
s
Intervention limit
Amount demanded
Amount adjudicated
Central Bank Intervention in FX Market
(In millions of US dollars)
Central bank foreign exchange interventions remain
low.
0
10
20
30
40
50
60
0
10
20
30
40
50
60
Jan-08 Jan-10 Jan-12 Jan-14 Jan-16
Monetary Aggregates Dollarization
(In percent of monetary aggregate)
M2 dollarization
M1 dollarization
M3 dollarization
M4 dollarization
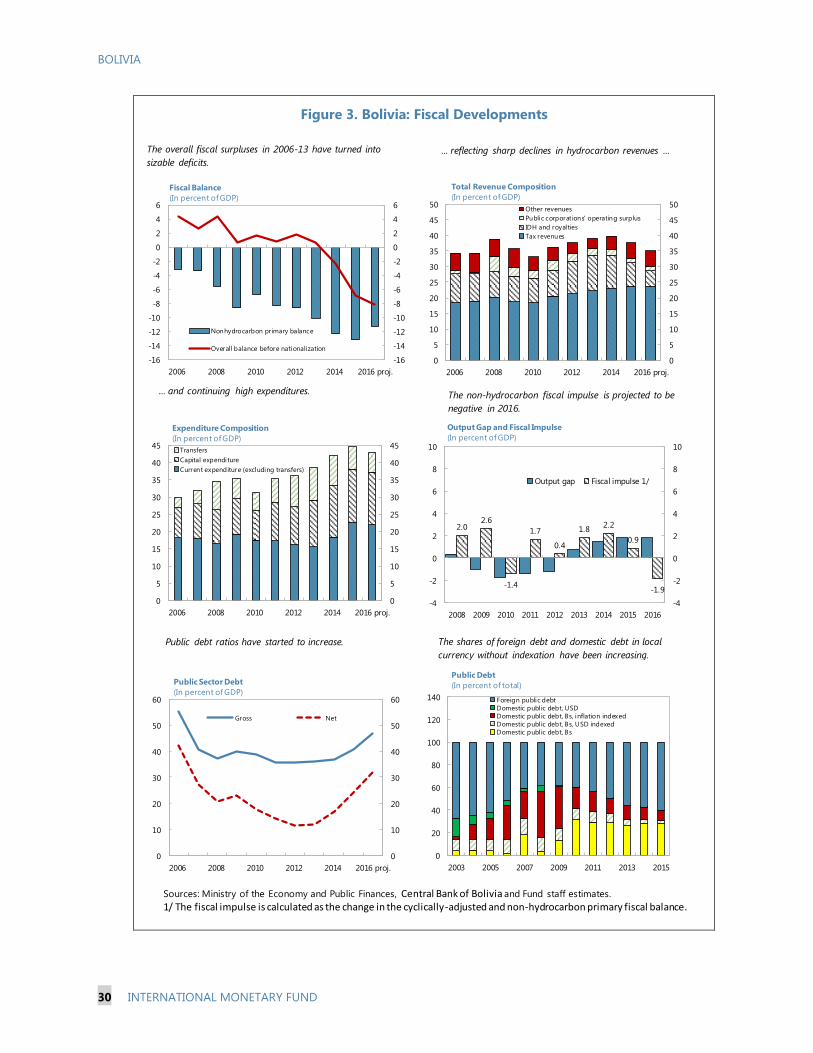
BOLIVIA
30 INTERNATIONAL MONETARY FUND
Figure 3. Bolivia: Fiscal Developments
0
10
20
30
40
50
60
0
10
20
30
40
50
60
2006 2008 2010 2012 2014 2016 proj.
Gross Net
Public Sector Debt
(In percent of GDP)
-16
-14
-12
-10
-8
-6
-4
-2
0
2
4
6
-16
-14
-12
-10
-8
-6
-4
-2
0
2
4
6
2006 2008 2010 2012 2014 2016 proj.
Nonhydrocarbon primary balance
Overall balance before nationalization
Fiscal Balance
(In percent of GDP)
The overall fiscal surpluses in 2006-13 have turned into
sizable deficits.
... and continuing high expenditures.
Public debt ratios have started to increase.
... reflecting sharp declines in hydrocarbon revenues ...
The shares of foreign debt and domestic debt in local
currency without indexation have been increasing.
0
20
40
60
80
100
120
140
2003 2005 2007 2009 2011 2013 2015
Foreign public debt
Domestic public debt, USD
Domestic public debt, Bs, inflation indexed
Domestic public debt, Bs, USD indexed
Domestic public debt, Bs
Public Debt
(In percent of total)
0
5
10
15
20
25
30
35
40
45
50
0
5
10
15
20
25
30
35
40
45
50
2006 2008 2010 2012 2014 2016 proj.
Other revenues
Public corporat ions' operating surplus
IDH and royalties
Tax revenues
Total Revenue Composition
(In percent of GDP)
0
5
10
15
20
25
30
35
40
45
0
5
10
15
20
25
30
35
40
45
2006 2008 2010 2012 2014 2016 proj.
Transfers
Capital expenditure
Current expenditure (excluding transfers)
Expenditure Composition
(In percent of GDP)
Sources: Ministry of the Economy and Public Finances, Central Bank of Bolivia and Fund staff estimates.
1/ The fiscal impulse is calculated as the change in the cyclically-adjusted and non-hydrocarbon primary fiscal balance.
The non-hydrocarbon fiscal impulse is projected to be
negative in 2016.
2.02.6
-1.4
1.7
0.4
1.82.2
0.9
-1.9
-4
-2
0
2
4
6
8
10
-4
-2
0
2
4
6
8
10
2008 2009 2010 2011 2012 2013 2014 2015 2016
Output gap Fiscal impulse 1/
Output Gap and Fiscal Impulse
(In percent of GDP)
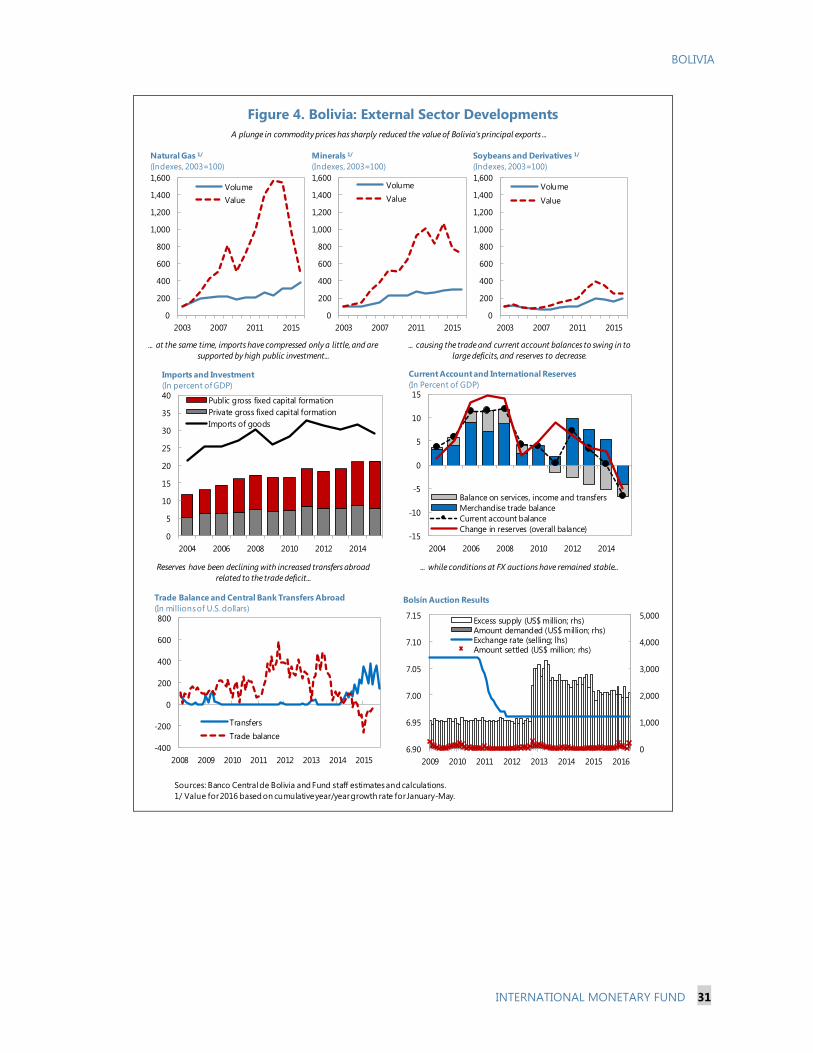
BOLIVIA
INTERNATIONAL MONETARY FUND 31
Figure 4. Bolivia: External Sector Developments
-15
-10
-5
0
5
10
15
2004 2006 2008 2010 2012 2014
Balance on services, income and transfers
Merchandise trade balance
Current account balance
Change in reserves (overall balance)
Current Account and International Reserves
(In Percent of GDP)
Figure 4. Bolivia: External Sector Developments
Sources: Banco Central de Bolivia and Fund staff estimates and calculations.
1/ Value for 2016 based on cumulative year/year growth rate for January-May.
0
5
10
15
20
25
30
35
40
2004 2006 2008 2010 2012 2014
Public gross fixed capital formation
Private gross fixed capital formation
Imports of goods
Imports and Investment
(In percent of GDP)
-400
-200
0
200
400
600
800
2008 2009 2010 2011 2012 2013 2014 2015
Transfers
Trade balance
Trade Balance and Central Bank Transfers Abroad
(In millions of U.S. dollars)
0
1,000
2,000
3,000
4,000
5,000
6.90
6.95
7.00
7.05
7.10
7.15
2009 2010 2011 2012 2013 2014 2015 2016
Excess supply (US$ million; rhs)Amount demanded (US$ million; rhs)Exchange rate (selling; lhs)Amount settled (US$ million; rhs)
Bolsín Auction Results
0
200
400
600
800
1,000
1,200
1,400
1,600
2003 2007 2011 2015
Volume
Value
Natural Gas 1/
(Indexes, 2003=100)
0
200
400
600
800
1,000
1,200
1,400
1,600
2003 2007 2011 2015
Volume
Value
Minerals 1/
(Indexes, 2003=100)
0
200
400
600
800
1,000
1,200
1,400
1,600
2003 2007 2011 2015
Volume
Value
Soybeans and Derivatives 1/
(Indexes, 2003=100)
A plunge in commodity prices has sharply reduced the value of Bolivia's principal exports ...
... at the same time, imports have compressed only a little, and are
supported by high public investment...
... causing the trade and current account balances to swing in to
large deficits, and reserves to decrease.
Reserves have been declining with increased transfers abroad
related to the trade deficit...
... while conditions at FX auctions have remained stable...

BOLIVIA
32 INTERNATIONAL MONETARY FUND
Figure 5. Bolivia: Financial Sector Developments
-1.0
-0.5
0.0
0.5
1.0
1.5
2.0
2.5
3.0
(10.0)
(5.0)
0.0
5.0
10.0
15.0
20.0
25.0
30.0
2000 2002 2004 2006 2008 2010 2012 2014 Jul-16
Rates of Return
(In percent)
ROA (RHS)
ROE (LHS)
0.0
2.0
4.0
6.0
8.0
10.0
12.0
14.0
16.0
18.0
0.0
2.0
4.0
6.0
8.0
10.0
12.0
14.0
16.0
18.0
2000 2002 2004 2006 2008 2010 2012 2014 Jul-16
Capital Adequacy Ratio and Nonperforming Loans
(In percent)
Capital adequacy ratio NPL
0
5
10
15
20
25
30
35
0
5
10
15
20
25
30
35
Jan-09 Jan-11 Jan-13 Jan-15
Bank Lending Rate by Type of Credit
(In percent, effective rate)
Consumer
Commercial
Mortgage
Microcredit
Microcredit cap
SME
Jul-16
Gap
Figure 5. Bolivia: Financial Sector Developments
Capital adequacy ratios are above the regulatory minimum, while NPLs remain low...
The microcredit lending rate is the most affected by the FInancial Services law...
...however, bank profitability has been declining.
...while lending to 'non-productive' activities are
slowing to create space for 'productive' lending.
Sources: ASFI and Fund staff calculations.
/1 Licensed institutions only./2 Contributions refer to 2016M6 over 2015M6 levels.
0
10
20
30
40
50
60
70
80
90
100
Number of
institutions
Sep.2014
Number of
institutions
Jun.2016
Assets
Sep.2014
Assets
Jun.2016
Credit
Sep.2014
Credit
Jun.2016
Composition of Financial Sector /1
(In percent of total)
Housing-specialized institutions Cooperatives
SME banks Commercial banks
Commercial banks continue to dominate the financial sector...
0
5
10
15
20
25
30
0
5
10
15
20
25
30
Jan-10 Jan-12 Jan-14 Jan-16
Deposits and Credit Growth
(In percent, y/y)
Deposits of the financial system
Credit to the private sector
Jul-16
...while overall credit sector growth remains high.
-10
-5
0
5
10
15
20
25
30
Contribution to Credit Growth by Destination Sector
(In percent, end of period)
Services
Construct ion and real estate
Commerce
Productive
Total
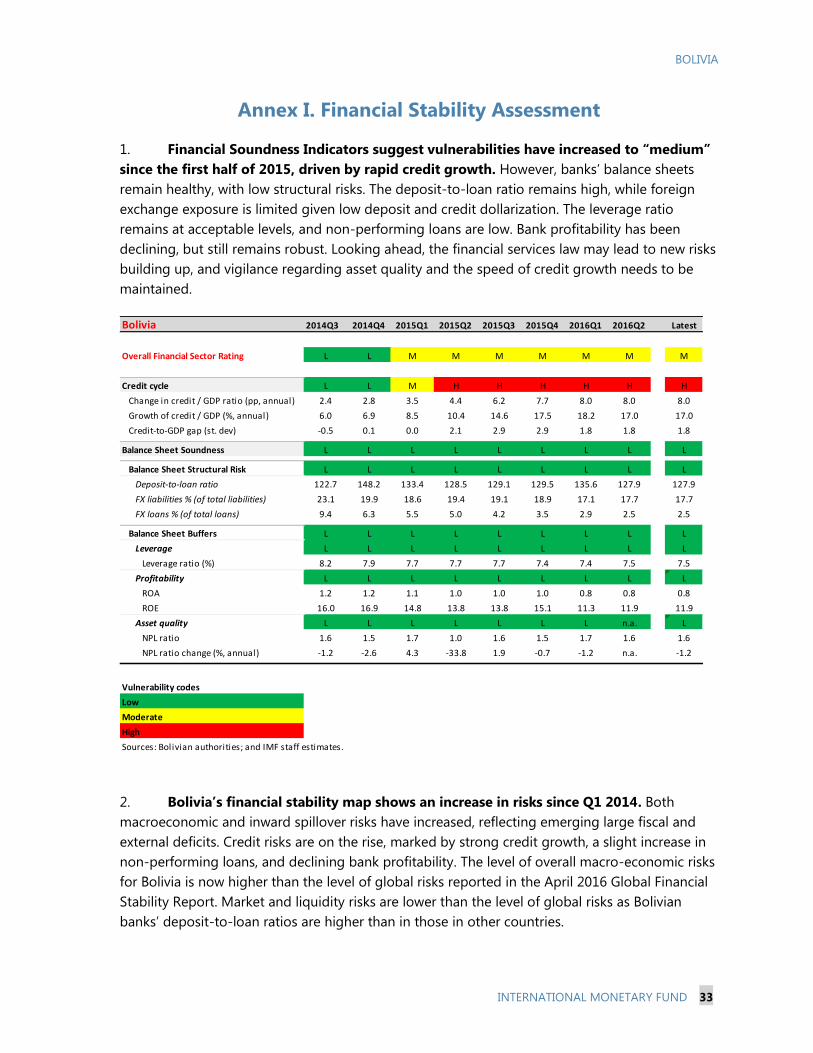
BOLIVIA
INTERNATIONAL MONETARY FUND 33
Annex I. Financial Stability Assessment
1. Financial Soundness Indicators suggest vulnerabilities have increased to “medium”
since the first half of 2015, driven by rapid credit growth. However, banks’ balance sheets
remain healthy, with low structural risks. The deposit-to-loan ratio remains high, while foreign
exchange exposure is limited given low deposit and credit dollarization. The leverage ratio
remains at acceptable levels, and non-performing loans are low. Bank profitability has been
declining, but still remains robust. Looking ahead, the financial services law may lead to new risks
building up, and vigilance regarding asset quality and the speed of credit growth needs to be
maintained.
2. Bolivia’s financial stability map shows an increase in risks since Q1 2014. Both
macroeconomic and inward spillover risks have increased, reflecting emerging large fiscal and
external deficits. Credit risks are on the rise, marked by strong credit growth, a slight increase in
non-performing loans, and declining bank profitability. The level of overall macro-economic risks
for Bolivia is now higher than the level of global risks reported in the April 2016 Global Financial
Stability Report. Market and liquidity risks are lower than the level of global risks as Bolivian
banks’ deposit-to-loan ratios are higher than in those in other countries.
Bolivia 2014Q3 2014Q4 2015Q1 2015Q2 2015Q3 2015Q4 2016Q1 2016Q2 Latest
Overall Financial Sector Rating L L M M M M M M M
Credit cycle L L M H H H H H H
Change in credit / GDP ratio (pp, annual) 2.4 2.8 3.5 4.4 6.2 7.7 8.0 8.0 8.0
Growth of credit / GDP (%, annual) 6.0 6.9 8.5 10.4 14.6 17.5 18.2 17.0 17.0
Credit-to-GDP gap (st. dev) -0.5 0.1 0.0 2.1 2.9 2.9 1.8 1.8 1.8
Balance Sheet Soundness L L L L L L L L L
Balance Sheet Structural Risk L L L L L L L L L
Deposit-to-loan ratio 122.7 148.2 133.4 128.5 129.1 129.5 135.6 127.9 127.9
FX liabilities % (of total liabilities) 23.1 19.9 18.6 19.4 19.1 18.9 17.1 17.7 17.7
FX loans % (of total loans) 9.4 6.3 5.5 5.0 4.2 3.5 2.9 2.5 2.5
Balance Sheet Buffers L L L L L L L L L
Leverage L L L L L L L L L
Leverage ratio (%) 8.2 7.9 7.7 7.7 7.7 7.4 7.4 7.5 7.5
Profitability L L L L L L L L L
ROA 1.2 1.2 1.1 1.0 1.0 1.0 0.8 0.8 0.8
ROE 16.0 16.9 14.8 13.8 13.8 15.1 11.3 11.9 11.9
Asset quality L L L L L L L n.a. L
NPL ratio 1.6 1.5 1.7 1.0 1.6 1.5 1.7 1.6 1.6
NPL ratio change (%, annual) -1.2 -2.6 4.3 -33.8 1.9 -0.7 -1.2 n.a. -1.2
Vulnerability codes
Low
Moderate
High
Sources: Bolivian authorities; and IMF staff estimates.

BOLIVIA
34 INTERNATIONAL MONETARY FUND
Comparable GFSR Global Financial Stability Map Country Financial Stability Map:Bolivia Mapping CFSM Time Periods to GFSM
Financial Stability Maps
2. Emerging market
risks
3. Credit risks
4. Market and liquidity
risks
5. Monetary and
financial conditions
6. Risk appetite
1. Macroeconomic risks
0
2
4
6
8
10
April 2013
April 2016
Note: Away from center signifies higher risks, easier monetary and financial conditions, or higher risk appetite.
2. Inward spillover risks
3. Credit risks
4. Market and liquidity
risks
5. Monetary and
financial conditions
6. Risk appetite
1. Macroeconomic risks
0
2
4
6
8
10
2013Q1
2016Q1
Note: Away from center signifies higher risks, easier monetary and financial conditions, or higher risk appetite.

BOLIVIA
INTERNATIONAL MONETARY FUND 35
Annex II. Hydrocarbons Sector, Public Enterprises, and the Central Bank Balance Sheet
Hydrocarbons sector prospects
Following large natural gas discoveries in the late 1990s, and fueled by high prices, Bolivia
increased gas production volumes eightfold over 1998–2014. The large increase in
production made Bolivia a key regional gas supplier. At the peak in 2013–14, roughly 31 percent
of fiscal revenues, 8 percent of GDP and over 50 percent of export revenues came from
hydrocarbons.
Since 2014, gas production has been falling, as the fields discovered in the 1990s are
nearing the end of their production cycles. Gas production fell by over 1 percent in 2015. It is
expected to fall by another 1–2 percent in 2016 but should recover in 2017 as a new field
(Incahuasi) came on stream in August 2016.
Exploratory activity has been limited over the past 10 years (graph). Incahuasi, which was
discovered in 2004, was the last big field discovered in Bolivia. A high government tax take and
the state oil company’s (YPFB) focus on exploitation over exploration have been impediments to
exploration. Proven reserves are now estimated at about 10 Tcf, equal to a maximum of 10 years
of production at current volumes.
YPFB has recently ramped up exploration spending significantly,1 however, and Bolivia
remains an underexplored country with vast potential. YPFB estimates that the total potential
of fields currently being explored is around 29–35 TCF, with expected discoveries of 5–10 TCF
(applying subjective discovery probabilities). Crucially, the authorities are also trying to attract
FDI into hydrocarbon exploration to
complement YPFB’s efforts. Foreign
financing and know-how appear
crucial to making exploration a
success. The hydrocarbon
investment law passed in late 2015
is a step in the right direction but
more could be done to make costly
and risky exploration activity
attractive for international
companies.2
1 See text figure. Data are for the sector as a whole. Total planned investment for 2016 was US$2,411 million, and
exploration investment accounted for roughly 28 percent of total investment. For 2016, the scheduled total
investment by YPBF headquarters, YPFB subsidiaries and private operators was 905.6, 942.7 and 562.6,
respectively.
2 For example, exploration spending could be allowed to be offset again hydrocarbon taxes.
0
200
400
600
800
1000
1200
0
5
10
15
20
25
30
35
40
1998 2000 2002 2004 2006 2008 2010 2012 2014 2016* 2018* 2020*
Number of exploration wells drilled (LHS)
YPFB Exploration investment (mns of US$, RHS)
Sources: Yacimientos Petroliferos Fiscales Bolivianos, Agencia Nacional de Hydrocarburos, and IMF staff calculations.
* Projections for 2016–20.
Hydrocarbon Exploration Activity in Bolivia

BOLIVIA
36 INTERNATIONAL MONETARY FUND
Most of the potential for discoveries lies with a few large projects in non-traditional zones.
The most promising prospects are Huacareta (being explored by BG-Shell); Azero (by Total); and
San Telmo (by Petrobras). There is also some potential for additional discoveries in traditional
production zones (mainly Boyuy and Boycobo by Repsol). It is important to keep in mind,
however, that the timeline for projects in non-traditional zones is quite long, with discovery
results not to be expected before 2018–19 and production at some point in the mid-2020s if
drilling is successful. Boyuy or Boycobo, on the other hand, could be producing by 2019 if
successful.
Staff projections show that there are risks to Bolivia’s being able to meet internal and
external gas demand over the period 2016–25. Using the current pipeline of exploratory
projects and the likely production curve of existing fields, staff projected a baseline, as well as an
upside and a downside scenario for
Bolivian gas production. While
production is expected to increase
in the years until 2019, from
currently about 60 million cubic
meters per day to close to 70,
Bolivia would struggle to meet
internal demand and minimum
contractual export volumes even
under the baseline scenario after
2021.
Industrialization projects
At the same time, the government is pursuing an ambitious program of downstream
hydrocarbon industrialization and electricity generation to move into higher value-added
sectors. A core element of the government’s five-year development plan is to transform Bolivia
into a South American energy hub, moving exports away from natural gas and into
petrochemicals and electricity. Staff baseline projections currently envisage exports from
industrialization projects to increase total goods exports by 2 percent in 2021 (in a best case
scenario, exports could be higher by another 6 percent in 2021).
Industrialization investments are concentrated in a number of large projects executed by
YPFB and the state-owned electricity company (ENDE). YPFB is investing roughly
US$4.3 billion in gas separation plants and petrochemical plants to turn natural gas into
fertilizers and plastic (Table A1). Half of the amount is already executed with the largest project, a
polyethylene (plastic) plant, still outstanding. ENDE is investing heavily in thermoelectric and
hydroelectric power generation to be able to generate excess capacity to be exported to Bolivia’s
neighbors (Table A2).
While there are significant upside risks associated with a successful implementation of
these projects, there are also a number of downside risks. In particular, a potential shortage
0
10
20
30
40
50
60
70
80
90
100
0
10
20
30
40
50
60
70
80
90
100
2016 2017 2018 2019 2020 2021 2022 2023 2024 2025
Natural Gas Production Scenarios
(In millions of cubic meters per day)
Maximum contractual exports to ARG and BRA Minimum guaranteed exports to ARG and BRA
Domestic Gas Demand Projection Baseline Production Scenario
Upside Production Scenario Downside Production Scenario
Sources: Staff estimates and projection based on data by national authorities, authorities of Tarija, YPFB, Fundacion
Jubileo, Petrobras, Total, Repsol and BG-Shell.

BOLIVIA
INTERNATIONAL MONETARY FUND 37
in gas as an input is a concern, as are the elevated costs, logistical issues and a lack of
guaranteed markets. Overall, the financial viability of the projects is not clear from available
information.
Risks to Financial Health of Public Enterprises and the Central Bank Balance Sheet
Most of the financing for the industrialization projects comes directly from the central
bank (Table A5). Apart from large loans to YPFB and ENDE for the above mentioned projects, the
BCB is also lending to the state mining company, COMIBOL (table). Loans to SOEs are issued in
bolivianos at highly concessional terms, including subsidized interest rates (averaging less than
1 percent), generous grace periods (3 to 7 years) both for principal and interest payments, and
relatively long maturities (18 to 30 years).
Loans to ENDE and COMIBOL are
ultimately guaranteed by the Treasury
with TGN securities.3
The fall in hydrocarbon prices is putting
pressure on the financial health of key
public enterprises. Largely due to the
industrialization projects and exploration
activity, public enterprises have ramped up
their spending (Table A3). However, the
increase in spending combined with the
sharp fall in hydrocarbon prices has
recently tipped these’ enterprises’ balance
into negative territory. By virtue of its size,
YPFP accounts for the bulk of the overall
deficit in the consolidated public
enterprise sector. Almost the entire deficit
of the sector has been financed by the
central bank (chart).
3 Loans to YPFB are guaranteed by the company itself through YPFB account receivables.
YPFB ENDE COMIBOL
In millions of Bolivianos 12,563 4,612 2,149
In percent of BCB's capital 1,000 367 171
Outstanding Amount of BCB Loans to Public Enterprises
-3.0
-2.0
-1.0
0.0
1.0
2.0
3.0
4.0
5.0
ENDE COMIBOL YPFB Total Public Enterprises Financing from BCB (inv.)
Overall Fiscal Balance(Percent of GDP)
Sources: Bolivian authorities; and IMF staff calculations.
Note: excludes subsidiaries of SOEs.
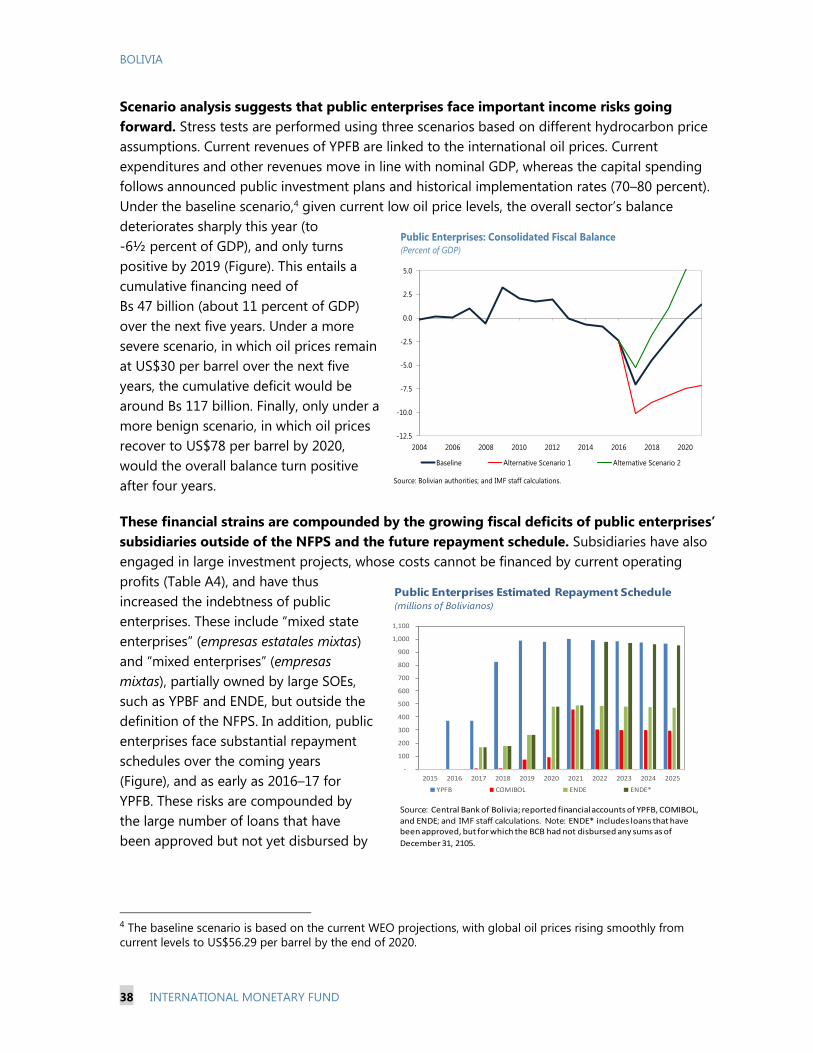
BOLIVIA
38 INTERNATIONAL MONETARY FUND
Scenario analysis suggests that public enterprises face important income risks going
forward. Stress tests are performed using three scenarios based on different hydrocarbon price
assumptions. Current revenues of YPFB are linked to the international oil prices. Current
expenditures and other revenues move in line with nominal GDP, whereas the capital spending
follows announced public investment plans and historical implementation rates (70–80 percent).
Under the baseline scenario,4 given current low oil price levels, the overall sector’s balance
deteriorates sharply this year (to
-6½ percent of GDP), and only turns
positive by 2019 (Figure). This entails a
cumulative financing need of
Bs 47 billion (about 11 percent of GDP)
over the next five years. Under a more
severe scenario, in which oil prices remain
at US$30 per barrel over the next five
years, the cumulative deficit would be
around Bs 117 billion. Finally, only under a
more benign scenario, in which oil prices
recover to US$78 per barrel by 2020,
would the overall balance turn positive
after four years.
These financial strains are compounded by the growing fiscal deficits of public enterprises’
subsidiaries outside of the NFPS and the future repayment schedule. Subsidiaries have also
engaged in large investment projects, whose costs cannot be financed by current operating
profits (Table A4), and have thus
increased the indebtness of public
enterprises. These include “mixed state
enterprises” (empresas estatales mixtas)
and “mixed enterprises” (empresas
mixtas), partially owned by large SOEs,
such as YPBF and ENDE, but outside the
definition of the NFPS. In addition, public
enterprises face substantial repayment
schedules over the coming years
(Figure), and as early as 2016–17 for
YPFB. These risks are compounded by
the large number of loans that have
been approved but not yet disbursed by
4 The baseline scenario is based on the current WEO projections, with global oil prices rising smoothly from
current levels to US$56.29 per barrel by the end of 2020.
-
100
200
300
400
500
600
700
800
900
1,000
1,100
2015 2016 2017 2018 2019 2020 2021 2022 2023 2024 2025
YPFB COMIBOL ENDE ENDE*
Public Enterprises Estimated Repayment Schedule (millions of Bolivianos)
Source: Central Bank of Bolivia; reported financial accounts of YPFB, COMIBOL,
and ENDE; and IMF staff calculations. Note: ENDE* includes loans that have been approved, but for which the BCB had not disbursed any sums as of
December 31, 2105.
-12.5
-10.0
-7.5
-5.0
-2.5
0.0
2.5
5.0
2004 2006 2008 2010 2012 2014 2016 2018 2020
Baseline Alternative Scenario 1 Alternative Scenario 2
Public Enterprises: Consolidated Fiscal Balance(Percent of GDP)
Source: Bolivian authorities; and IMF staff calculations.

BOLIVIA
INTERNATIONAL MONETARY FUND 39
the BCB which, if fully implemented, would add further pressures to their repayment schedule in
outer years, particularly ENDE.
Loans to public enterprises are likely to hinder the BCB’s ability to generate positive net
income. For every dollar lent, the central bank would only receive the subsidized interest rate
from public enterprises. Equally, the central bank will have to: (i) likely pay a higher interest rate
on its own securities (for sterilization purposes),5 or (ii) forgo interest income owing to a
reduction in NIR (in line with public enterprises’ demand for imported capital goods). Interest
rates on central bank securities are currently low, but historically these have been higher than
rates on loans to public enterprises, and the expected normalization in U.S. interest rates will put
upward pressure on BCB’s interest rates. These factors would adversely affect the central bank’s
net interest income over the coming years.6
5 A central bank could choose not to conduct the needed sterilization to minimize interest income losses, but this
would be in direct conflict with its price stability objective.
6 The computation of overall net income does not only depend on the loans to public enterprises. Other assets
(e.g. NIR) also generate profits, while other liabilities generate losses. Over the past couple of years, about half of
the BCB’s revenues came from earnings on foreign assets, while half of its expenses (excluding transfers to the
Treasury) were due to the cost of open market operations (i.e. interest payments on BCB securities).

BOLIVIA
40 INTERNATIONAL MONETARY FUND
Table A1. Bolivia: YPFB Industrialization Projects
Table A2. Bolivia: ENDE Investment Projects
YPFB executed projects Progress Estimated Start of Production Cost and other information
Polyethylene plant Construction scheduled to start in
early 2017
Late 2021
Cost of project US$ 688 million. Financed with BCB credits.
Exports to Peru and Paraguay of LPG. Ethane and liquefied
petroleum gas (LPG) for internal use as an input for
downstream industry.
Cost of project US $445 million. Part BCB financed. The
project will allow delivery of gas to areas of the country not
served well previously.
Cost of project 955 million USD, financed by BCB loans to
YPFB.
Projected cost of project is US$ 2,089 million with US$ 1,847
million to come directly from the BCB.
80% of production for internal use. US$ 160 million financing
from BCB.
LNG Operational as of February 2016 Production started in February 2016
Ammonia and urea plant Close to completion as of October
2016 (had been scheduled for early
2016)
Early 2017 but delays in railway
construction (only 30-40% complete)
could pose significant problems.
Rio Grande liquid separation plant Operational as of August 2013 Production started August 2013
Gran Chaco liquid separation plant Operational as of August 2015 Production started August 2015
Project Progress
Estimated Start of
Production
Projected
capacity Estimated cost Other comments
Proyecto Termoelectrico de Entre Rios Completed Summer 2010 110 MW
Planta Termoelectrica del Sur Completed 2014 160 MW
Planta Termoelectrica Warnes Completed Autumn 2015 200 MW
Proyecto Eolico Qollpana In Construction Summer 2016 24 MW
Proyecto Hidroelectrico Misicuni In Construction 2017 120 MW US$ 137 million Financing from IDB and TGN
Proyecto Planta Solar Uyuni In Construction 2017 60 MW US$ 94 million Financing from BCB.
Proyecto Planta Solar Oruro In Construction Summer 2017 50 MW US$ 54.5 million Financing from FINPRO
Proyecto Hidroelectrico San Jose In Construction Apr-18 124 MW US$ 245 million Financing from IDB and CAF
Ampliacion Planto Termoelectrica Entre Rios Contract signed Late 2019 380 MW US$ 463 million Financing from BCB.
Ampliacion Planta Termoelectrica del Sur Contract signed Late 2019 320 MW US$ 463 million Financing from BCB. Transmission line to
Argentina (Yaguacua-Tartagal-San
Juancito) being built during the same time
Ampliacion Planta Termoelectrica Warnes Financing from BCB obtained Late 2019 280 MW US$ 406 million Financing from BCB.
Proyecto Hidroelectrico Miguilas In Construction 2020 200 MW US$ 448 million Financing from BCB.
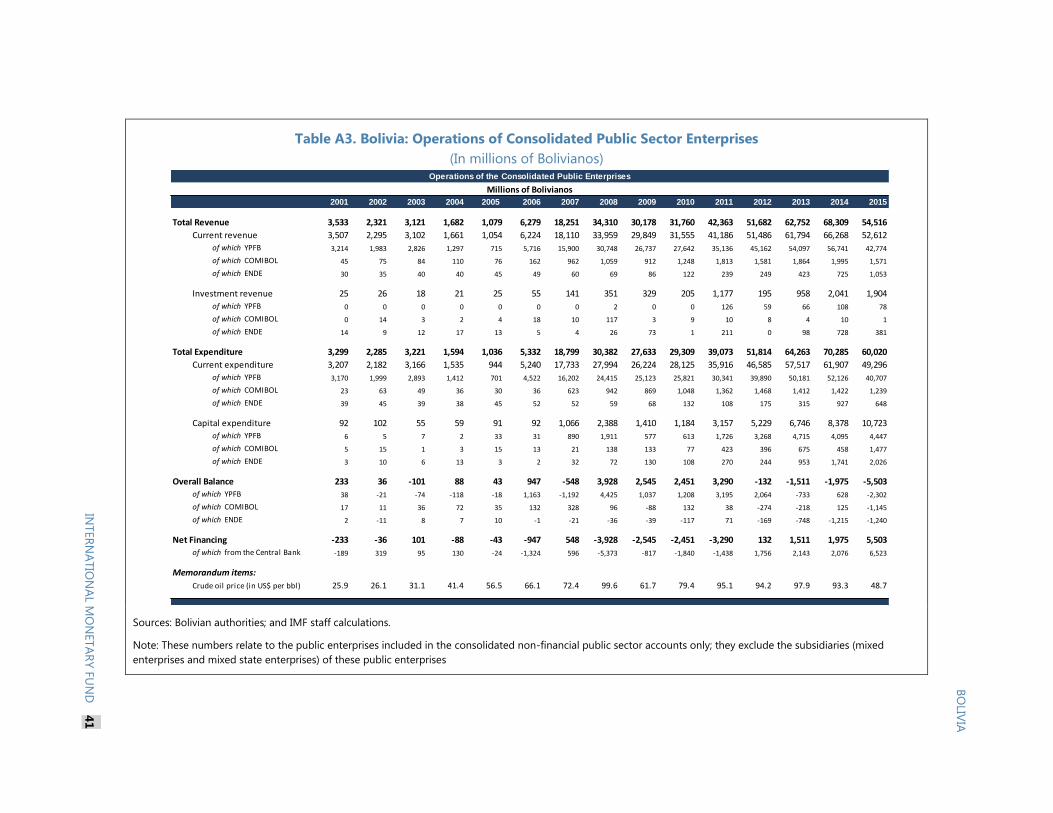
Table A3. Bolivia: Operations of Consolidated Public Sector Enterprises
(In millions of Bolivianos)
Sources: Bolivian authorities; and IMF staff calculations.
Note: These numbers relate to the public enterprises included in the consolidated non-financial public sector accounts only; they exclude the subsidiaries (mixed
enterprises and mixed state enterprises) of these public enterprises
2001 2002 2003 2004 2005 2006 2007 2008 2009 2010 2011 2012 2013 2014 2015
Total Revenue 3,533 2,321 3,121 1,682 1,079 6,279 18,251 34,310 30,178 31,760 42,363 51,682 62,752 68,309 54,516
Current revenue 3,507 2,295 3,102 1,661 1,054 6,224 18,110 33,959 29,849 31,555 41,186 51,486 61,794 66,268 52,612
of which YPFB 3,214 1,983 2,826 1,297 715 5,716 15,900 30,748 26,737 27,642 35,136 45,162 54,097 56,741 42,774
of which COMIBOL 45 75 84 110 76 162 962 1,059 912 1,248 1,813 1,581 1,864 1,995 1,571
of which ENDE 30 35 40 40 45 49 60 69 86 122 239 249 423 725 1,053
Investment revenue 25 26 18 21 25 55 141 351 329 205 1,177 195 958 2,041 1,904
of which YPFB 0 0 0 0 0 0 0 2 0 0 126 59 66 108 78
of which COMIBOL 0 14 3 2 4 18 10 117 3 9 10 8 4 10 1
of which ENDE 14 9 12 17 13 5 4 26 73 1 211 0 98 728 381
Total Expenditure 3,299 2,285 3,221 1,594 1,036 5,332 18,799 30,382 27,633 29,309 39,073 51,814 64,263 70,285 60,020
Current expenditure 3,207 2,182 3,166 1,535 944 5,240 17,733 27,994 26,224 28,125 35,916 46,585 57,517 61,907 49,296
of which YPFB 3,170 1,999 2,893 1,412 701 4,522 16,202 24,415 25,123 25,821 30,341 39,890 50,181 52,126 40,707
of which COMIBOL 23 63 49 36 30 36 623 942 869 1,048 1,362 1,468 1,412 1,422 1,239
of which ENDE 39 45 39 38 45 52 52 59 68 132 108 175 315 927 648
Capital expenditure 92 102 55 59 91 92 1,066 2,388 1,410 1,184 3,157 5,229 6,746 8,378 10,723
of which YPFB 6 5 7 2 33 31 890 1,911 577 613 1,726 3,268 4,715 4,095 4,447
of which COMIBOL 5 15 1 3 15 13 21 138 133 77 423 396 675 458 1,477
of which ENDE 3 10 6 13 3 2 32 72 130 108 270 244 953 1,741 2,026
Overall Balance 233 36 -101 88 43 947 -548 3,928 2,545 2,451 3,290 -132 -1,511 -1,975 -5,503
of which YPFB 38 -21 -74 -118 -18 1,163 -1,192 4,425 1,037 1,208 3,195 2,064 -733 628 -2,302
of which COMIBOL 17 11 36 72 35 132 328 96 -88 132 38 -274 -218 125 -1,145
of which ENDE 2 -11 8 7 10 -1 -21 -36 -39 -117 71 -169 -748 -1,215 -1,240
Net Financing -233 -36 101 -88 -43 -947 548 -3,928 -2,545 -2,451 -3,290 132 1,511 1,975 5,503
of which from the Central Bank -189 319 95 130 -24 -1,324 596 -5,373 -817 -1,840 -1,438 1,756 2,143 2,076 6,523
Memorandum items:
Crude oil price (in US$ per bbl) 25.9 26.1 31.1 41.4 56.5 66.1 72.4 99.6 61.7 79.4 95.1 94.2 97.9 93.3 48.7
Operations of the Consolidated Public Enterprises
Millions of Bolivianos
BO
LIVIA
INTER
NA
TIO
NA
L MO
NETA
RY F
UN
D
41

Table A4. Bolivia: Profit and Loss Accounts of Selected Subsidiaries of Public Enterprises
(In millions of Bolivianos)
Sources: Annual financial reports of public enterprises and subsidiaries; and IMF staff calculations.
Notes: YPFB’s ownership share is 98.6 percent of YPFB Transporte, 99.3 percent of YPFB Chaco, 99.9 percent of YPFB Refinacion, and 51 percent of YPFB Andina. ENDE’s
ownership share is 100 percent of Empresa Electrica Valle Hermoso, 60 percent of ENDE Andina, and 100 percent of ENDE Corani. All these subsidiaries are not included
in the consolidated non-financial public sector accounts.
2012 2013 2014 2015 2012 2013 2014 2015
YPFB Group ENDE Group
(1) Net profits before tax 6,347 6,799 7,055 1,311 Net profits before tax 168 198 807 1,435
(2) Net profits after tax 6,347 6,799 7,055 1,311 Net profits after tax 168 198 807 1,435
(3) Acquisition of fixed assets 3,301 3,682 4,198 4,379 Acquisition of fixed assets 401 685 905 1,595
(4)=(2)-(3) Difference 3,045 3,117 2,857 -3,068 Difference -233 -487 -97 -160
YPFB Transporte ENDE Empresa Electrica Valle Hermoso
(1) Net profits before tax 594 627 658 615 Net profits before tax 14 21 8 30
(2) Net profits after tax 518 557 511 503 Net profits after tax 14 21 8 30
(3) Acquisition of fixed assets 1,072 889 648 471 Acquisition of fixed assets 77 73 45 20
(4)=(2)-(3) Difference -554 -332 -137 33 Difference -62 -52 -38 10
YPFB Chaco ENDE Andina
(1) Net profits before tax 1,085 647 945 481 Net profits before tax 1 5 10 23
(2) Net profits after tax 867 415 762 414 Net profits after tax 1 5 10 22
(3) Acquisition of fixed assets 661 992 643 620 Acquisition of fixed assets 392 930 633 324
(4)=(2)-(3) Difference 205 -577 119 -206 Difference -392 -925 -623 -302
YPFB Refinacion Corani (ENDE)
(1) Net profits before tax 254 674 471 505 Net profits before tax 72 57 63
(2) Net profits after tax 254 674 471 505 Net profits after tax 57 49 51
(3) Acquisition of fixed assets 171 415 1,034 1,500 Acquisition of fixed assets 16 83 43
(4)=(2)-(3) Difference 82 259 -563 -995 Difference 42 -34 9
YPFB Andina
(1) Net profits before tax 1,258 1,456 2,086 1,299
(2) Net profits after tax 790 1,061 1,495 875
(3) Acquisition of fixed assets 1,411 1,110 933 1,122
(4)=(2)-(3) Difference -621 -50 561 -247
BO
LIVIA
42
IN
TER
NA
TIO
NA
L MO
NETA
RY F
UN
D

BOLIVIA
INTERNATIONAL MONETARY FUND 43
Annex III. Debt Sustainability Analysis—Baseline Scenario
Staff’s analysis applying the Public DSA framework for Market-Access Countries suggests that risks
to Bolivia’s public debt are moderate in the medium term (2016–21). At 43 percent of GDP in
August 2016, Bolivia’s public debt is moderate by international standards, but it has grown
significantly in recent years and is projected to reach about 52 percent of GDP in 2021. Medium-
term risks remain manageable if the authorities continue their pragmatic approach to implementing
public investment plans (as under the baseline projections), with the financing need remaining
below the respective benchmark under most standard macroeconomic shocks through 2021 (except
for 2016, when the financing need is 10.2 percent); under the primary balance shock, the gross
financing need is projected to exceed 10 percent of GDP in 2017–18.
Definition and debt profile: Public sector debt in this DSA includes all financial obligations of the
central government and subnational governments as well as liabilities of non-financial state-owned
enterprises to the central bank (BCB). After declining to 35.7 percent of GDP in 2012, public sector
debt increased to 40.6 percent of GDP in 2015. The BCB’s lending to SOEs increased from
1.9 percent of GDP in 2011 to 9.2 percent of GDP in 2015. There was a 3.6 percentage point of GDP
increase in gross public debt in 2015 relative to 2014, due mainly to an increase in external debt and
BCB lending to SOEs. External debt accounted for about 47 percent of total debt at end-2015. Net
public debt (gross debt excluding deposits of the general government and SOEs at the BCB) stood
at 28 percent of GDP at end-August 2016.
Staff macroeconomic and fiscal assumptions: Growth is projected at about 3.7 percent and
3.9 percent in 2016 and 2017, respectively, and at 3.5 percent thereafter. Inflation is projected at
about 5 percent in the medium term. The GDP deflator is projected to decline by about 2 percent in
2016, increase by about 7 percent in 2017, and increase by at 4.2–5.2 percent in 2018–21. The fiscal
position is projected to improve, with the primary deficit declining to 3.4 percent of GDP in 2021
from 7 percent of GDP in 2016, as the limited financing and capacity constraints will restrict the
authorities’ ability to carry out their capital expenditure plan. With an expected tightening of
monetary policy in the US, interest rates are expected to increase. However, given the maturity
structure of the outstanding debt stock, the impact of higher interest rates on new loans on the
effective interest rate is gradual and limited. Under these assumptions, the gross financing needs of
the public sector are projected to fall to about 8 percent of GDP in 2019–21 from about 10 percent
of GDP in 2016. The public debt-to GDP ratio is projected to increase to about 52 percent in 2021.
Stress tests:
Primary balance shock. The primary balance in 2017–18 is hit by a shock equal to 1.9 percent of
GDP (50 percent of the 10-year historical standard deviation of the primary balance-to-GDP ratio).
The debt/GDP ratio increases to 52.6 percent in 2018 and then gradually increases to 55.7 percent in
2021, about 3.7 percentage points higher than baseline debt in 2021.
BOLIVIA
44 INTERNATIONAL MONETARY FUND
Growth shock. Real GDP growth rates are 1 percentage point lower in 2017–18 (100 percent of the
10-year historical standard deviation of real GDP growth rates). The debt-to-GDP ratio increases to
51.3 in 2018 and then gradually increases to 54.4 percent in 2021 (2.4 percentage points higher than
in the baseline).
Interest rate shock. Real interest rates increase by about 330 basis points during 2017–21 (the
difference between the average real interest rate in 2006–15 and the highest historical real interest
rate). The debt-to-GDP ratio gradually increases to 54.3 percent in 2021 (2.3 percentage points
higher than the baseline).
Exchange rate shock. The real effective exchange rate depreciates by 20 percent in 2017. The debt-
to-GDP ratio increases to 50.1 percent in 2017 and then gradually increase to 54.2 (2.2 percentage
points higher than the baseline).
Combined shock. A simultaneous combination of the previous four shocks would result in an
increasing debt-to-GDP ratio, rising to 55.3 percent in 2017, 58.9 percent in 2018, and 63.1 percent
in 2021 (11.1 percentage points higher than the baseline).
Contingent liability shock. A one-time increase in non-interest expenditures equivalent in 2017 to
10 percent of banking sector assets, combined with lower growth and lower inflation in 2017–18
(i.e., growth is reduced by 1 standard deviation), results in the debt-to-GDP ratio peaking at
55.9 percent in 2018, followed by a gradual increase to 58.9 percent in 2021 (6.9 percentage points
higher than the baseline).
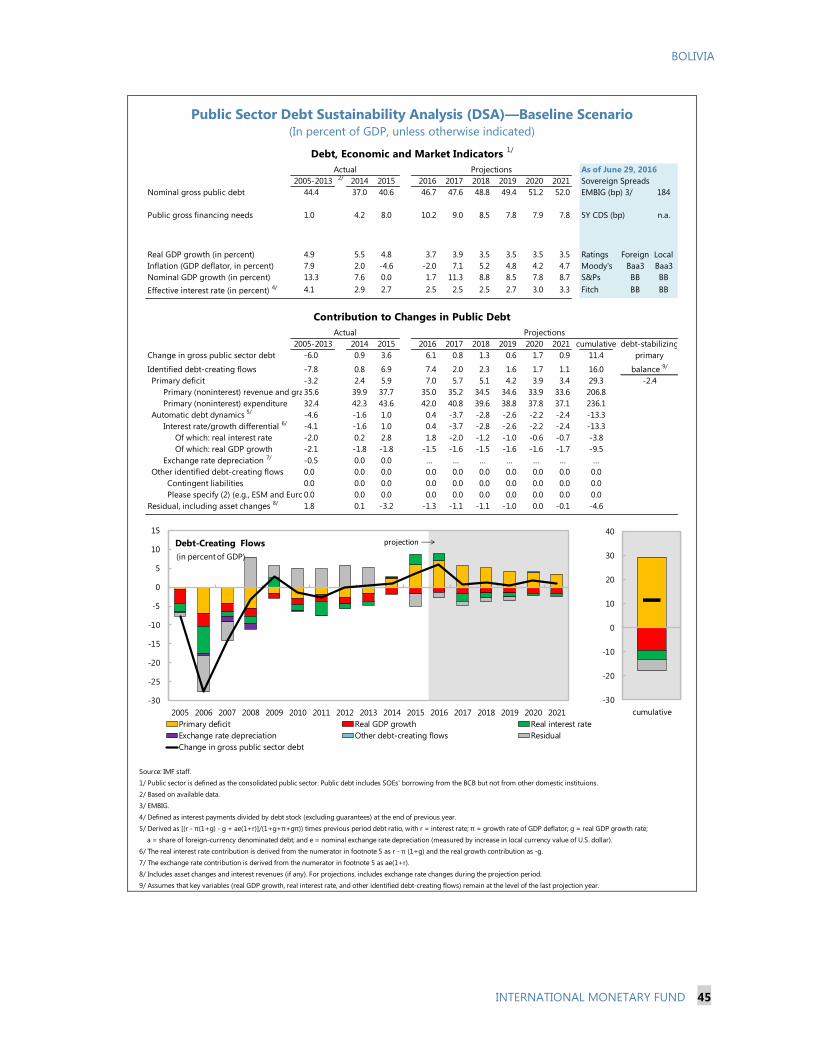
BOLIVIA
INTERNATIONAL MONETARY FUND 45
Public Sector Debt Sustainability Analysis (DSA)—Baseline Scenario (In percent of GDP, unless otherwise indicated)
As of June 29, 20162/
2014 2015 2016 2017 2018 2019 2020 2021 Sovereign Spreads
Nominal gross public debt 44.4 37.0 40.6 46.7 47.6 48.8 49.4 51.2 52.0 EMBIG (bp) 3/ 184
Public gross financing needs 1.0 4.2 8.0 10.2 9.0 8.5 7.8 7.9 7.8 5Y CDS (bp) n.a.
Real GDP growth (in percent) 4.9 5.5 4.8 3.7 3.9 3.5 3.5 3.5 3.5 Ratings Foreign Local
Inflation (GDP deflator, in percent) 7.9 2.0 -4.6 -2.0 7.1 5.2 4.8 4.2 4.7 Moody's Baa3 Baa3
Nominal GDP growth (in percent) 13.3 7.6 0.0 1.7 11.3 8.8 8.5 7.8 8.7 S&Ps BB BB
Effective interest rate (in percent) 4/ 4.1 2.9 2.7 2.5 2.5 2.5 2.7 3.0 3.3 Fitch BB BB
2014 2015 2016 2017 2018 2019 2020 2021 cumulative
Change in gross public sector debt -6.0 0.9 3.6 6.1 0.8 1.3 0.6 1.7 0.9 11.4
Identified debt-creating flows -7.8 0.8 6.9 7.4 2.0 2.3 1.6 1.7 1.1 16.0
Primary deficit -3.2 2.4 5.9 7.0 5.7 5.1 4.2 3.9 3.4 29.3
Primary (noninterest) revenue and grants35.6 39.9 37.7 35.0 35.2 34.5 34.6 33.9 33.6 206.8
Primary (noninterest) expenditure 32.4 42.3 43.6 42.0 40.8 39.6 38.8 37.8 37.1 236.1
Automatic debt dynamics 5/
-4.6 -1.6 1.0 0.4 -3.7 -2.8 -2.6 -2.2 -2.4 -13.3
Interest rate/growth differential 6/
-4.1 -1.6 1.0 0.4 -3.7 -2.8 -2.6 -2.2 -2.4 -13.3
Of which: real interest rate -2.0 0.2 2.8 1.8 -2.0 -1.2 -1.0 -0.6 -0.7 -3.8
Of which: real GDP growth -2.1 -1.8 -1.8 -1.5 -1.6 -1.5 -1.6 -1.6 -1.7 -9.5
Exchange rate depreciation 7/
-0.5 0.0 0.0 … … … … … … …
Other identified debt-creating flows 0.0 0.0 0.0 0.0 0.0 0.0 0.0 0.0 0.0 0.0
Contingent liabilities 0.0 0.0 0.0 0.0 0.0 0.0 0.0 0.0 0.0 0.0
Please specify (2) (e.g., ESM and Euroarea loans)0.0 0.0 0.0 0.0 0.0 0.0 0.0 0.0 0.0 0.0
Residual, including asset changes 8/
1.8 0.1 -3.2 -1.3 -1.1 -1.1 -1.0 0.0 -0.1 -4.6
Source: IMF staff.
1/ Public sector is defined as the consolidated public sector. Public debt includes SOEs' borrowing from the BCB but not from other domestic instituions.
2/ Based on available data.
3/ EMBIG.
4/ Defined as interest payments divided by debt stock (excluding guarantees) at the end of previous year.
5/ Derived as [(r - π(1+g) - g + ae(1+r)]/(1+g+π+gπ)) times previous period debt ratio, with r = interest rate; π = growth rate of GDP deflator; g = real GDP growth rate;
a = share of foreign-currency denominated debt; and e = nominal exchange rate depreciation (measured by increase in local currency value of U.S. dollar).
6/ The real interest rate contribution is derived from the numerator in footnote 5 as r - π (1+g) and the real growth contribution as -g.
7/ The exchange rate contribution is derived from the numerator in footnote 5 as ae(1+r).
8/ Includes asset changes and interest revenues (if any). For projections, includes exchange rate changes during the projection period.
9/ Assumes that key variables (real GDP growth, real interest rate, and other identified debt-creating flows) remain at the level of the last projection year.
-2.4
balance 9/
primary
Debt, Economic and Market Indicators 1/
2005-2013
Actual
Projections
Contribution to Changes in Public Debt
Projections
2005-2013
Actual
debt-stabilizing
-30
-25
-20
-15
-10
-5
0
5
10
15
2005 2006 2007 2008 2009 2010 2011 2012 2013 2014 2015 2016 2017 2018 2019 2020 2021
Debt-Creating Flows
Primary deficit Real GDP growth Real interest rate
Exchange rate depreciation Other debt-creating flows Residual
Change in gross public sector debt
projection
(in percent of GDP)
-30
-20
-10
0
10
20
30
40
cumulative

BOLIVIA
46 INTERNATIONAL MONETARY FUND
Public DSA—Composition of Public Debt and Alternative Scenarios
Baseline Scenario 2016 2017 2018 2019 2020 2021 Historical Scenario 2016 2017 2018 2019 2020 2021
Real GDP growth 3.7 3.9 3.5 3.5 3.5 3.5 Real GDP growth 3.7 5.0 5.0 5.0 5.0 5.0
Inflation -2.0 7.1 5.2 4.8 4.2 4.7 Inflation -2.0 7.1 5.2 4.8 4.2 4.7
Primary Balance -7.0 -5.7 -5.1 -4.2 -3.9 -3.4 Primary Balance -7.0 2.0 2.0 2.0 2.0 2.0
Effective interest rate 2.5 2.5 2.5 2.7 3.0 3.3 Effective interest rate 2.5 2.5 2.2 2.0 1.8 1.8
Constant Primary Balance Scenario
Real GDP growth 3.7 3.9 3.5 3.5 3.5 3.5
Inflation -2.0 7.1 5.2 4.8 4.2 4.7
Primary Balance -7.0 -7.0 -7.0 -7.0 -7.0 -7.0
Effective interest rate 2.5 2.5 2.6 2.9 3.2 3.6
Source: IMF staff.
Underlying Assumptions(in percent)
Bolivia Public DSA - Composition of Public Debt and Alternative Scenarios
Alternative Scenarios
Composition of Public Debt
Baseline Historical Constant Primary Balance
0
10
20
30
40
50
60
70
2014 2015 2016 2017 2018 2019 2020 2021
Gross Nominal Public Debt
(in percent of GDP)
projection
0
2
4
6
8
10
12
14
2014 2015 2016 2017 2018 2019 2020 2021
Public Gross Financing Needs
(in percent of GDP)
projection
-10
0
10
20
30
40
50
60
70
80
90
2005 2007 2009 2011 2013 2015 2017 2019 2021
By Maturity
Medium and long-term
Short-term
projection
(in percent of GDP)
0
10
20
30
40
50
60
70
80
90
2005 2007 2009 2011 2013 2015 2017 2019 2021
By Currency
Local currency-denominated
Foreign currency-denominated
projection
(in percent of GDP)

BOLIVIA
INTERNATIONAL MONETARY FUND 47
Public DSA—Realism of Baseline Assumptions
Source : IMF Staff.
1/ Plotted distribution includes surveillance countries, percentile rank refers to all countries.
2/ Projections made in the spring WEO vintage of the preceding year.
3/ Not applicable for Bolivia, as it meets neither the positive output gap criterion nor the private credit growth criterion.
4/ Data cover annual obervations from 1990 to 2011 for advanced and emerging economies with debt greater than 60 percent of GDP. Percent of sample on vertical axis.
Forecast Track Record, versus surveillance countries
Boom-Bust Analysis 3/Assessing the Realism of Projected Fiscal Adjustment
-10
-8
-6
-4
-2
0
2
4
6
2007 2008 2009 2010 2011 2012 2013 2014 2015
Year 2/
Real GDP Growth
Distribution of forecast errors:
Median
Bolivia forecast error
0.66
94%Has a percentile rank of:
Bolivia median forecast error, 2007-2015:
Distribution of
forecast errors: 1/
(in percent, actual-projection)
-10
-8
-6
-4
-2
0
2
4
6
2007 2008 2009 2010 2011 2012 2013 2014 2015
Year 2/
Primary Balance
0.31
78%Has a percentile rank of:
Bolivia median forecast error, 2007-2015:
Distribution of
forecast errors: 1/
(in percent of GDP, actual-projection)
-15
-10
-5
0
5
10
15
2007 2008 2009 2010 2011 2012 2013 2014 2015
Year 2/
Inflation (Deflator)
Distribution of forecast errors:
Median
Bolivia forecast error
2.01
83%Has a percentile rank of:
Bolivia median forecast error, 2007-2015:
Distribution of
forecast errors: 1/
(in percent, actual-projection)
pess
imis
tic
op
tim
isti
c
-6
-4
-2
0
2
4
6
8
t-5 t-4 t-3 t-2 t-1 t t+1 t+2 t+3 t+4 t+5
Real GDP growth
Bolivia
(in percent)
Not applicable for Bolivia
0
2
4
6
8
10
12
14
Less -4 -3 -2 -1 0 1 2 3 4 5 6 7 8
Distribution 4/
Bolivia
3-Year Adjustment in Cyclically-Adjusted
Primary Balance (CAPB)
(Percent of GDP)
Mo
re
3-year CAPB adjustment
greater than 3 percent of
GDP in approx. top quartilehas a percentile
rank of 38%
0
2
4
6
8
10
12
Less -4 -3 -2 -1 0 1 2 3 4 5 6 7 8
Distribution 4/
Bolivia
3-Year Average Level of Cyclically-Adjusted
Primary Balance (CAPB)
(Percent of GDP)
Mo
re
3-year average CAPB level
greater than 3.5 percent of
GDP in approx. top quartilehas a percentile
rank of 100%
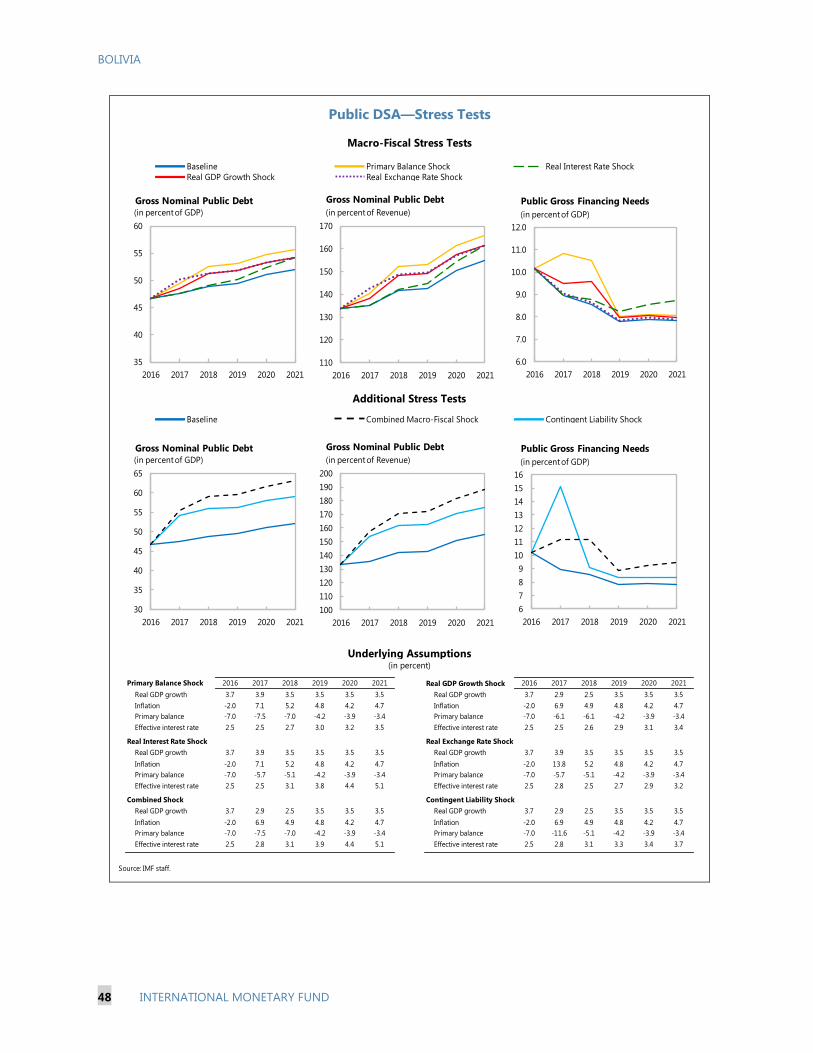
BOLIVIA
48 INTERNATIONAL MONETARY FUND
Public DSA—Stress Tests
Primary Balance Shock 2016 2017 2018 2019 2020 2021 Real GDP Growth Shock 2016 2017 2018 2019 2020 2021
Real GDP growth 3.7 3.9 3.5 3.5 3.5 3.5 Real GDP growth 3.7 2.9 2.5 3.5 3.5 3.5
Inflation -2.0 7.1 5.2 4.8 4.2 4.7 Inflation -2.0 6.9 4.9 4.8 4.2 4.7
Primary balance -7.0 -7.5 -7.0 -4.2 -3.9 -3.4 Primary balance -7.0 -6.1 -6.1 -4.2 -3.9 -3.4
Effective interest rate 2.5 2.5 2.7 3.0 3.2 3.5 Effective interest rate 2.5 2.5 2.6 2.9 3.1 3.4
Real Interest Rate Shock Real Exchange Rate Shock
Real GDP growth 3.7 3.9 3.5 3.5 3.5 3.5 Real GDP growth 3.7 3.9 3.5 3.5 3.5 3.5
Inflation -2.0 7.1 5.2 4.8 4.2 4.7 Inflation -2.0 13.8 5.2 4.8 4.2 4.7
Primary balance -7.0 -5.7 -5.1 -4.2 -3.9 -3.4 Primary balance -7.0 -5.7 -5.1 -4.2 -3.9 -3.4
Effective interest rate 2.5 2.5 3.1 3.8 4.4 5.1 Effective interest rate 2.5 2.8 2.5 2.7 2.9 3.2
Combined Shock Contingent Liability Shock
Real GDP growth 3.7 2.9 2.5 3.5 3.5 3.5 Real GDP growth 3.7 2.9 2.5 3.5 3.5 3.5
Inflation -2.0 6.9 4.9 4.8 4.2 4.7 Inflation -2.0 6.9 4.9 4.8 4.2 4.7
Primary balance -7.0 -7.5 -7.0 -4.2 -3.9 -3.4 Primary balance -7.0 -11.6 -5.1 -4.2 -3.9 -3.4
Effective interest rate 2.5 2.8 3.1 3.9 4.4 5.1 Effective interest rate 2.5 2.8 3.1 3.3 3.4 3.7
Source: IMF staff.
Bolivia Public DSA - Stress Tests
Macro-Fiscal Stress Tests
Baseline Primary Balance Shock
Real GDP Growth Shock
Real Interest Rate Shock
(in percent)
Real Exchange Rate Shock
Combined Macro-Fiscal Shock
Additional Stress Tests
Baseline
Underlying Assumptions
Contingent Liability Shock
35
40
45
50
55
60
2016 2017 2018 2019 2020 2021
Gross Nominal Public Debt(in percent of GDP)
110
120
130
140
150
160
170
2016 2017 2018 2019 2020 2021
Gross Nominal Public Debt
(in percent of Revenue)
6.0
7.0
8.0
9.0
10.0
11.0
12.0
2016 2017 2018 2019 2020 2021
Public Gross Financing Needs
(in percent of GDP)
30
35
40
45
50
55
60
65
2016 2017 2018 2019 2020 2021
Gross Nominal Public Debt(in percent of GDP)
100
110
120
130
140
150
160
170
180
190
200
2016 2017 2018 2019 2020 2021
Gross Nominal Public Debt
(in percent of Revenue)
6
7
8
9
10
11
12
13
14
15
16
2016 2017 2018 2019 2020 2021
Public Gross Financing Needs
(in percent of GDP)

BOLIVIA
INTERNATIONAL MONETARY FUND 49
Public DSA—Risk Assessment
Bolivia
Source: IMF staff.
1/ The cell is highlighted in green if debt burden benchmark of 70% is not exceeded under the specific shock or baseline, yellow if exceeded under specific shock but not
baseline, red if benchmark is exceeded under baseline, white if stress test is not relevant.
Real Interest
Rate Shock
External
Financing
Requirements
Real GDP
Growth Shock
Heat Map
Upper early warning
Evolution of Predictive Densities of Gross Nominal Public Debt
(in percent of GDP)
Debt profile 3/
Lower early warning
(Indicators vis-à-vis risk assessment benchmarks, in 2015)
Debt Profile Vulnerabilities
Gross financing needs 2/
Debt level 1/ Real GDP
Growth Shock
Primary
Balance Shock
3/ The cell is highlighted in green if country value is less than the lower risk-assessment benchmark, red if country value exceeds the upper risk-assessment benchmark,
yellow if country value is between the lower and upper risk-assessment benchmarks. If data are unavailable or indicator is not relevant, cell is white.
Lower and upper risk-assessment benchmarks are:
Change in the
Share of
Short-Term
Debt
Foreign
Currency
Debt
Public Debt
Held by Non-
Residents
Primary
Balance Shock
Real Interest
Rate Shock
Exchange
Rate Shock
Contingent
Liability Shock
Exchange
Rate Shock
Contingent
Liability shock
5/ External financing requirement is defined as the sum of current account deficit, amortization of medium and long-term total external debt, and short-term total external
debt at the end of previous period.
4/ EMBIG, an average over the last 3 months, 31-Mar-16 through 29-Jun-16.
2/ The cell is highlighted in green if gross financing needs benchmark of 15% is not exceeded under the specific shock or baseline, yellow if exceeded under specific shock
but not baseline, red if benchmark is exceeded under baseline, white if stress test is not relevant.
200 and 600 basis points for bond spreads; 5 and 15 percent of GDP for external financing requirement; 0.5 and 1 percent for change in the share of short-term debt; 15
and 45 percent for the public debt held by non-residents; and 20 and 60 percent for the share of foreign-currency denominated debt.
Market
Perception
20
60
50%
1 2
200
600
177
bp
1 2
5
15
9%
1 2
0.5
1
0%
1 2
EMBIGExternal Financing
Requirement
Annual Change in
Short-Term Public
Debt
Public Debt in
Foreign Currency
(in basis points) 4/ (in percent of GDP) 5/ (in percent of total) (in percent of total)
0
10
20
30
40
50
60
70
80
2014 2015 2016 2017 2018 2019 2020 2021
10th-25th 25th-75th 75th-90thPercentiles:Baseline
Symmetric Distribution
0
10
20
30
40
50
60
70
80
2014 2015 2016 2017 2018 2019 2020 2021
Restricted (Asymmetric) Distribution
no restriction on the growth rate shock
no restriction on the interest rate shock
0 is the max positive pb shock (percent GDP)
no restriction on the exchange rate shock
Restrictions on upside shocks:
15
45
no
data
1 2
Public Debt Held
by Non-Residents
(in percent of total)

External Debt Sustainability Framework, 2011–21
(In percent of GDP, unless otherwise indicated)
BO
LIVIA
50
IN
TER
NA
TIO
NA
L MO
NETA
RY F
UN
D
Projections
2011 2012 2013 2014 2015 2016 2017 2018 2019 2020 2021 Debt-stabilizing
non-interest
current account 6/
Baseline: External debt 18.7 18.6 19.7 19.9 21.7 23.0 22.4 22.3 22.2 22.0 21.6 -4.7
Change in external debt -1.7 -0.1 1.0 0.2 1.8 1.3 -0.6 -0.1 -0.1 -0.2 -0.4
Identified external debt-creating flows (4+8+9) -7.6 -13.3 -10.3 -3.5 4.3 5.1 1.2 -0.4 -1.2 -1.8 -2.0
Current account deficit, excluding interest payments -0.8 -7.6 -2.8 -0.7 5.3 6.4 4.7 3.7 2.7 2.2 1.7
Deficit in balance of goods and services -0.3 -8.6 -4.5 -2.1 5.8 6.7 4.8 3.7 2.6 1.9 1.5
Exports 38.3 44.9 41.5 40.7 28.5 26.5 27.0 26.2 25.6 24.8 24.0
Imports 38.0 36.4 37.0 38.7 34.2 33.2 31.8 29.9 28.1 26.7 25.6
Net non-debt creating capital inflows (negative) -3.6 -3.9 -5.7 -1.9 -1.5 -1.1 -3.2 -3.8 -3.7 -3.7 -3.4
Automatic debt dynamics 1/ -3.2 -1.8 -1.8 -0.9 0.5 -0.3 -0.3 -0.2 -0.3 -0.3 -0.3
Contribution from nominal interest rate 0.5 0.3 0.4 0.5 0.5 0.5 0.5 0.5 0.5 0.4 0.4
Contribution from real GDP growth -0.9 -0.8 -1.1 -1.0 -1.0 -0.8 -0.8 -0.7 -0.7 -0.7 -0.7
Contribution from price and exchange rate changes 2/ -2.8 -1.3 -1.1 -0.4 1.0 ... ... ... ... ... ...
Residual, incl. change in gross foreign assets (2-3) 3/ 5.8 13.2 11.3 3.7 -2.5 -3.8 -1.8 0.2 1.1 1.6 1.6
External debt-to-exports ratio (in percent) 48.8 41.5 47.5 48.8 76.3 86.7 83.1 85.1 86.9 88.6 89.8
Gross external financing need (in billions of US dollars) 4/ 1.0 -0.6 0.0 0.7 2.8 3.3 2.9 2.7 2.5 2.4 2.3
in percent of GDP 4.3 -2.2 0.0 2.0 8.5 10-Year 10-Year 9.6 7.7 6.7 5.6 5.0 4.4
Scenario with key variables at their historical averages 5/ 23.0 12.2 3.9 -2.9 -8.9 -14.3 -1.7
Historical Standard
Key Macroeconomic Assumptions Underlying Baseline Average Deviation
Real GDP growth (in percent) 5.2 5.1 6.8 5.5 4.8 5.0 1.0 3.7 3.9 3.5 3.5 3.5 3.5
GDP deflator in US dollars (change in percent) 15.9 7.5 6.0 2.0 -4.6 8.1 7.5 -2.0 7.1 5.2 4.8 4.2 4.7
Nominal external interest rate (in percent) 3.0 2.1 2.4 2.6 2.7 2.7 0.6 2.5 2.4 2.3 2.2 2.1 2.1
Growth of exports (US dollar terms, in percent) 28.8 32.7 4.4 5.8 -30.2 13.7 24.4 -5.2 13.2 5.7 5.7 4.7 4.9
Growth of imports (US dollar terms, in percent) 38.6 8.2 15.0 12.6 -11.5 15.5 16.5 -1.3 6.6 2.2 2.1 2.4 3.7
Current account balance, excluding interest payments 0.8 7.6 2.8 0.7 -5.3 5.3 6.0 -6.4 -4.7 -3.7 -2.7 -2.2 -1.7
Net non-debt creating capital inflows 3.6 3.9 5.7 1.9 1.5 3.1 1.2 1.1 3.2 3.8 3.7 3.7 3.4
1/ Derived as [r - g - r(1+g) + ea(1+r)]/(1+g+r+gr) times previous period debt stock, with r = nominal effective interest rate on external debt; r = change in domestic GDP deflator in US dollar terms, g = real GDP growth rate,
e = nominal appreciation (increase in dollar value of domestic currency), and a = share of domestic-currency denominated debt in total external debt.
3/ For projection, line includes the impact of price and exchange rate changes.
4/ Defined as current account deficit, plus amortization on medium- and long-term debt, plus short-term debt at end of previous period.
5/ The key variables include real GDP growth; nominal interest rate; dollar deflator growth; and both non-interest current account and non-debt inflows in percent of GDP.
6/ Long-run, constant balance that stabilizes the debt ratio assuming that key variables (real GDP growth, nominal interest rate, dollar deflator growth, and non-debt inflows in percent of GDP) remain at their levels
of the last projection year.
Actual
2/ The contribution from price and exchange rate changes is defined as [-r(1+g) + ea(1+r)]/(1+g+r+gr) times previous period debt stock. r increases with an appreciating domestic currency (e > 0) and rising inflation (based on GDP
deflator).
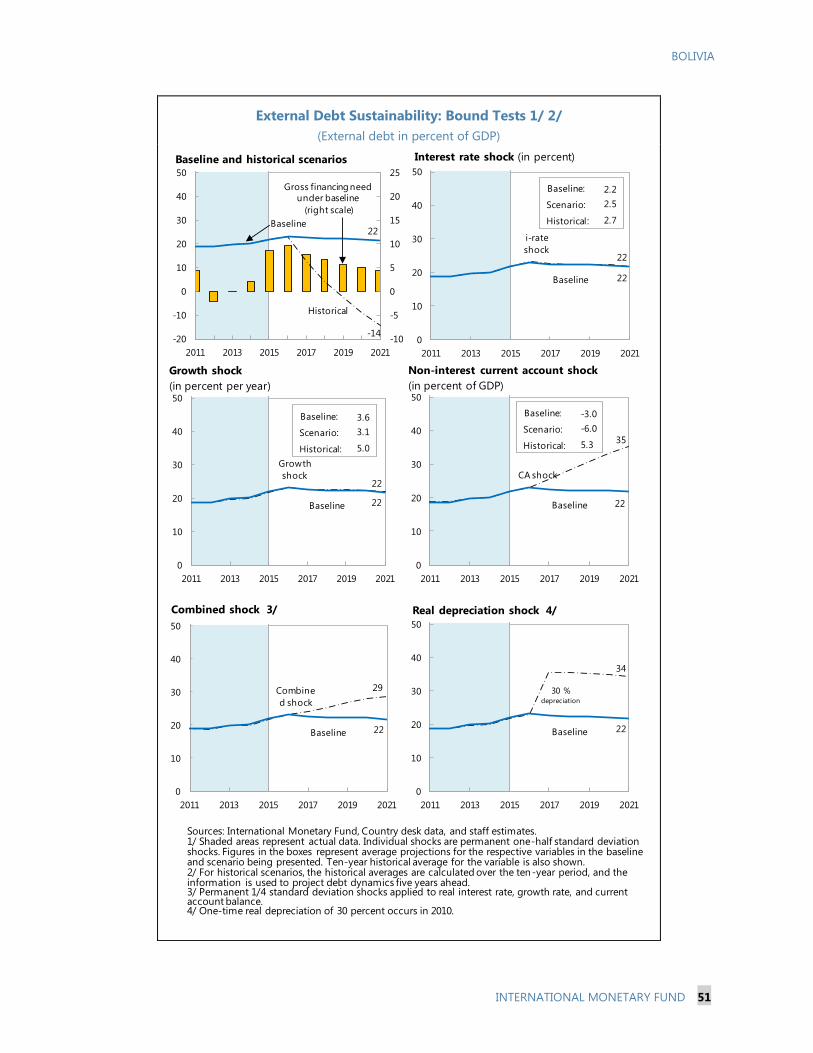
BOLIVIA
INTERNATIONAL MONETARY FUND 51
External Debt Sustainability: Bound Tests 1/ 2/
(External debt in percent of GDP)
i-rate
shock22
Baseline 22
0
10
20
30
40
50
2011 2013 2015 2017 2019 2021
Interest rate shock (in percent)
Sources: International Monetary Fund, Country desk data, and staff estimates.1/ Shaded areas represent actual data. Individual shocks are permanent one-half standard deviation shocks. Figures in the boxes represent average projections for the respective variables in the baseline and scenario being presented. Ten-year historical average for the variable is also shown. 2/ For historical scenarios, the historical averages are calculated over the ten-year period, and the information is used to project debt dynamics five years ahead.3/ Permanent 1/4 standard deviation shocks applied to real interest rate, growth rate, and current account balance.4/ One-time real depreciation of 30 percent occurs in 2010.
Historical
-14
Baseline22
-10
-5
0
5
10
15
20
25
-20
-10
0
10
20
30
40
50
2011 2013 2015 2017 2019 2021
Baseline and historical scenarios
CA shock
35
Baseline 22
0
10
20
30
40
50
2011 2013 2015 2017 2019 2021
Combine
d shock
29
Baseline 22
0
10
20
30
40
50
2011 2013 2015 2017 2019 2021
Combined shock 3/
30 % depreciation
34
Baseline 22
0
10
20
30
40
50
2011 2013 2015 2017 2019 2021
Real depreciation shock 4/
Gross financing need
under baseline
(right scale)
Non-interest current account shock
(in percent of GDP)
Growth
shock 22
Baseline 22
0
10
20
30
40
50
2011 2013 2015 2017 2019 2021
Baseline:
Scenario:
Historical:
2.2
2.5
2.7
Baseline:
Scenario:
Historical:
3.6
3.1
5.0
Baseline:
Scenario:
Historical:
-3.0
-6.0
5.3
Growth shock
(in percent per year)

BOLIVIA
52 INTERNATIONAL MONETARY FUND
Annex IV. External Stability Assessment
Key factors affecting Bolivia’s external sector—lower commodity prices and real effective exchange rate
appreciation—have persisted since last year. As a consequence, the real exchange rate is assessed as
stronger than warranted by medium-term fundamentals and desirable policies in 2016. Additionally,
Bolivia’s performance in other measures of competitiveness slipped from already weak levels. In the
absence of progress on relative price adjustments and the structural environment, gains in
diversification away from natural resources has languished. A wide current account deficit opened up
in 2015, and is set to continue going forward, sustained in part by import demand related to planned
public investment. With limited capital and financial account flows, a drawdown in reserves has
financed a large portion of the recent current account deficits. Still, reserves remain more than
adequate by standard metrics.
A. Challenges Affecting the External Sector
1. International prices for Bolivia’s major
exports have only partially recovered. The plunge
in commodity prices dealt Bolivia one of its largest
terms-of-trade shocks in its history. Peak to trough
declines in prices ranged between 30 to 71 percent
for hydrocarbons, metals, and soybeans and
derivatives. Together, these goods accounted for
more than three-quarters of Bolivia’s exports in 2015.
Since bottoming out, there have been gains ranging
between 11 and 51 percent, but prices remain below
peak levels. Going forward, futures contracts indicate
that prices for these commodities will strengthen only
modestly over the next five years.
2. The real effective exchange rate has been
on an appreciating trend. The real value of the
Boliviano has surged, principally reflecting sharp
depreciations of major trading partners’ exchange
rates (including Brazil and Argentina). As these
countries’ currencies have been stabilizing in recent
months, the Bolivian REER has slightly depreciated. As
of September 2016, it depreciated 1.9 percent from a
year ago, but the REER remains 49 percent
appreciated relative to the January 2010 level.
3. Recent supply shocks in the hydrocarbon and agriculture sectors will be a drag on
exports this year. Shipments of natural gas decreased temporarily mid-year, reflecting challenges
at existing fields. The launch of operations at a new field in August restored output to normal levels,
0
20
40
60
80
100
120
140
160
180
200
2010 2011 2012 2013 2014 2015 2016
SoybeansGoldZincCrude Oil (WTI)Tin
Commodity Prices(indexes, January 2010=100)
Sources: Haver Analytics; Fund staff calculations.
-0.1
0.0
0.1
0.2
0.3
0.4
0.5
2010 2011 2012 2013 2014 2015 2016
Contribution from Inflation Differential
Contribution from Nominal Effective Exchange Rate
Total
Real Effective Exchange Rate(change in log level relative to January 2010)
Sources: Information Notice System and Fund staff calculations.

BOLIVIA
INTERNATIONAL MONETARY FUND 53
but overall natural gas export quantities are expected to be lower this year. In the agriculture sector,
a major drought has been adversely affecting crop output, which is expected to decrease 4 percent
this year.
4. Last year’s large current account deficit will likely widen this year, and remain
substantial over the next few years. This year, the current account deficit will reach 7.6 percent of
GDP. Exports are expected to decline, reflecting the
full-year impact of commodity prices and the
supply shocks in the agriculture and hydrocarbon
sectors. Imports will remain high this year and into
the medium term, driven by the authorities’
investment plans. Over the next few years, staff
forecasts annual current account deficits to
decrease but remain significant, declining to
2⅓ percent of GDP in 2021.
B. Reserves Remain Fully Adequate
5. A drawdown in NIR has largely been financing recent current account deficits.
Although public sector external borrowing and foreign direct investment provided some offset,
capital and financial account flows have not been fully financing the recent current account deficits,
implying a drawdown in reserves. In 2015, reserves decreased US$2.1 billion and so far in 2016, they
have come down another US$2.3 billion. Nevertheless, at US$10¾ billion through mid-October
2016, or around 32 percent of GDP, they remain high. Going forward, however, in the absence of
policy adjustment, external deficits would persist, and reserves would continue trending down.
6. Still-high NIR levels remain more than adequate. Even with staff’s projection of a large
current account deficit for 2016, reserves would decrease to still-elevated 30½ percent of GDP and
cover 11.6 months of imports. At that level,
reserves would be well above 100–150 percent of
the Assessing Reserve Adequacy benchmark
(applicable to countries with inflexible exchange
rates), which stands at 16 percent of GDP.
Reserves in excess of the benchmark are
warranted in a country like Bolivia, because it is a
commodity exporter that is vulnerable to price
shocks. While buffers are ample in the near term,
staff’s baseline has reserves falling below
recommended levels in the medium term. This
possibility underscores the need for adjustment.
-15
-10
-5
0
5
10
15
20
25
30
2003 2005 2007 2009 2011 2013 2015
Other flows and stat. discrepancy
Official portfolio and other investment
FDI
Current account balance
Overall Balance
Bolivia: Overall Balance of Payments (Percent of GDP)
Sources: National Authorities and Fund staff calculations and projections.
0
5
10
15
20
25
30
35
Metric Projection Metric Projection
2016 2021
International Reserves and Adequacy Metrics(In percent of GDP)
Sources: Fund staff calculations.
100-150% of
Reserve Adequacy
Metric
10% of Exports
10% of Broad Money
30% of ST Debt
20% of Other Liab.
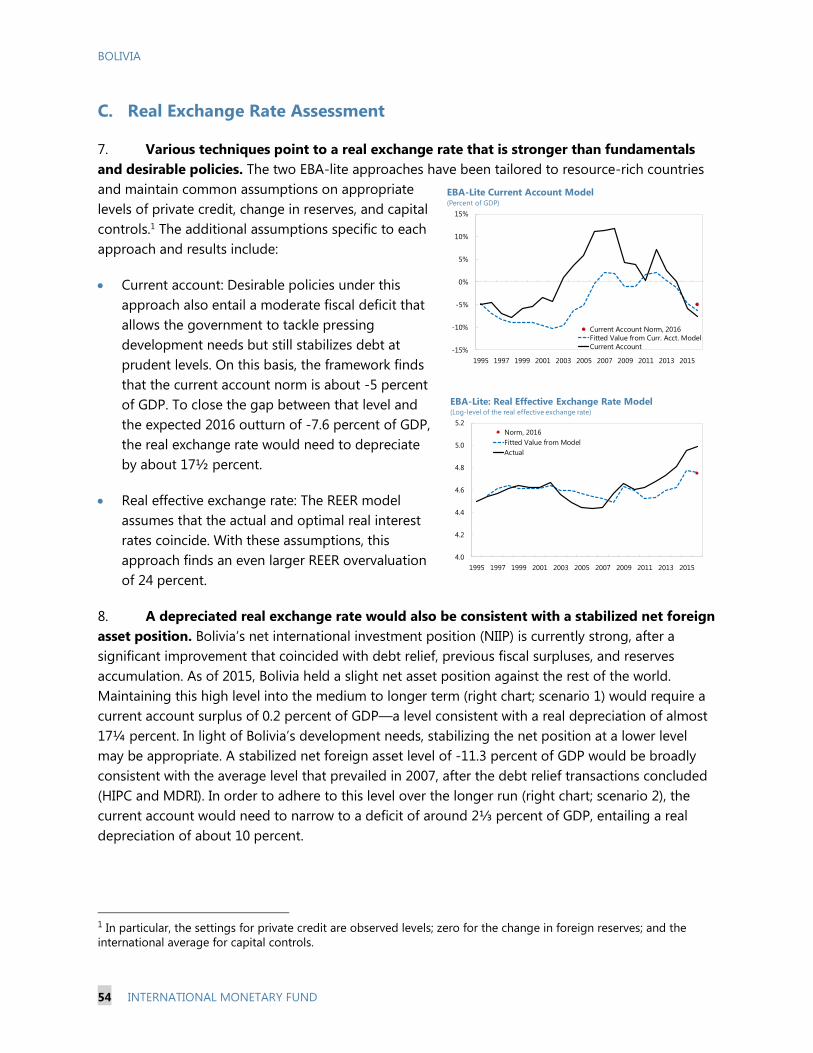
BOLIVIA
54 INTERNATIONAL MONETARY FUND
C. Real Exchange Rate Assessment
7. Various techniques point to a real exchange rate that is stronger than fundamentals
and desirable policies. The two EBA-lite approaches have been tailored to resource-rich countries
and maintain common assumptions on appropriate
levels of private credit, change in reserves, and capital
controls.1 The additional assumptions specific to each
approach and results include:
Current account: Desirable policies under this
approach also entail a moderate fiscal deficit that
allows the government to tackle pressing
development needs but still stabilizes debt at
prudent levels. On this basis, the framework finds
that the current account norm is about -5 percent
of GDP. To close the gap between that level and
the expected 2016 outturn of -7.6 percent of GDP,
the real exchange rate would need to depreciate
by about 17½ percent.
Real effective exchange rate: The REER model
assumes that the actual and optimal real interest
rates coincide. With these assumptions, this
approach finds an even larger REER overvaluation
of 24 percent.
8. A depreciated real exchange rate would also be consistent with a stabilized net foreign
asset position. Bolivia’s net international investment position (NIIP) is currently strong, after a
significant improvement that coincided with debt relief, previous fiscal surpluses, and reserves
accumulation. As of 2015, Bolivia held a slight net asset position against the rest of the world.
Maintaining this high level into the medium to longer term (right chart; scenario 1) would require a
current account surplus of 0.2 percent of GDP—a level consistent with a real depreciation of almost
17¼ percent. In light of Bolivia’s development needs, stabilizing the net position at a lower level
may be appropriate. A stabilized net foreign asset level of -11.3 percent of GDP would be broadly
consistent with the average level that prevailed in 2007, after the debt relief transactions concluded
(HIPC and MDRI). In order to adhere to this level over the longer run (right chart; scenario 2), the
current account would need to narrow to a deficit of around 2⅓ percent of GDP, entailing a real
depreciation of about 10 percent.
1 In particular, the settings for private credit are observed levels; zero for the change in foreign reserves; and the
international average for capital controls.
-15%
-10%
-5%
0%
5%
10%
15%
1995 1997 1999 2001 2003 2005 2007 2009 2011 2013 2015
Current Account Norm, 2016
Fitted Value from Curr. Acct. Model
Current Account
EBA-Lite Current Account Model(Percent of GDP)
4.0
4.2
4.4
4.6
4.8
5.0
5.2
1995 1997 1999 2001 2003 2005 2007 2009 2011 2013 2015
Norm, 2016
Fitted Value from Model
Actual
EBA-Lite: Real Effective Exchange Rate Model(Log-level of the real effective exchange rate)

BOLIVIA
INTERNATIONAL MONETARY FUND 55
D. Weakening Performance in Other Measures of Competitiveness
9. Bolivia’s rankings on international comparisons of competitiveness have slipped.
Bolivia’s placement in the World Economic Forum’s Global Competitiveness Index deteriorated from
105th place in 2014–15 to 117th place in 2015–16. Among the twelve subcategories, Bolivia
performed above the median for Latin American countries in two areas, macroeconomic
environment and institutions. Labor and goods market efficiency as well as business sophistication
and innovation were particularly weak, underscoring the importance of reforms give the private
sector a greater role in the economy. Perceptions of Bolivia’s logistics capability are also weaker than
the median for Latin America and they have been declining over the past several years. Respondents
were particularly critical of the quality and competence of logistics providers as well as customs, with
both having even weaker ratings in the 2016 survey than in 2014. On the other hand, shipments and
timeliness both improved a little.
-200
-150
-100
-50
0
50
100
1995 2000 2005 2010 2015
Portfolio equity assets
Portfolio equity liab.
FDI assets
FDI liabilities
Debt assets
Debt liabilities
Fin. derivatives assets
Fin. derivatives liab.
FX Reserves minus gold
Net foreign assets
Source: Lane and Milesi-Ferretti's External Wealth of Nations Dataset, IMF WEO,
Banco Central de Bolivia, and Fund staff calculations.
IIP Composition, by Instrument(in percent of GDP, based on IIP data from EWN database)
-140
-120
-100
-80
-60
-40
-20
0
20
1995 2000 2005 2010 2015 2020 2025 2030 2035 2040 2045 2050
Net IIP - Actual
Net IIP - Baseline (WEO CA proj.)
Net IIP - Scenario 1
Net IIP - Scenario 2
Benchmark
Source: Lane and Milesi-Ferretti's External Wealth of Nations Dataset, IMF WEO,
Banco Central de Bolivia, and Fund staff estimates and projections.
Net IIP: Actual & Projected(in percent of GDP, based on IIP data from EWN database)
Current
account
norm
Current
account
balance 2/ Gap Elasticity
Current Account -5.0 -7.6 -2.6 -0.15 17.4
REER … … … … 23.7
External Stability
Scenario 1: Stabilize 2015 NFA level 0.2 -2.3 -2.6 -0.15 17.2
Scenario 2: Stabilize at 2007 level (11.3% of GDP) -0.8 -2.3 -1.5 -0.15 10.1
Source: Fund staff estimates.
3/ A positive number indicates overvaluation.
EBA-Lite Methodologies: Summary Results for Exchange Rate Assessment 1/
Percent of GDP
REER 3/
1/ Based on data for 2015 and projections for 2016. Regressions use sample restricted to oil and gas exporting
countries only.
2/ For the current account approach, the current account corresponds to the projection for 2016. For the
external sustainability approaches, the value corresponds to the projection for 2021.

BOLIVIA
56 INTERNATIONAL MONETARY FUND
10. Real wages continue to grow ahead of productivity. Bolivia has closed the gap between
its real minimum wage (measured in U.S. dollars) and those of other Latin American countries. This
convergence largely reflects hikes in the nominal minimum wage in local currency. In Bolivia, this
growth averaged 14.2 percent over the past 10 years, with only Uruguay having slightly faster
nominal growth (14.9 percent). Other Bolivian wage policies have also driven rapid increases in labor
incomes. Overall, real labor incomes have risen about 47 percent over 2000–14. However, labor
productivity (real output per employed person) has grown less rapidly over this period (24 percent),
causing a drag on competitiveness.
11. These trends are likely holding back progress on diversification and expanding exports:
Diversification and complexity: The authorities’ objectives include diversification and production
of higher value-added commodities. Each objective has been linked with higher longer-run
growth empirically. To advance this agenda, they have advanced certain initiatives that have
expanded certain non-traditional exports. However, overall, the share of nontraditional exports
has changed little over the past 12 years. Instead, exports have remained principally
concentrated in natural resource extraction (hydrocarbons and minerals).
0 50 100 150
Institutions
Infrastructure
Macroeconomic env.
Health & primary educ.
Higher educ. & training
Goods market efficiency
Labor market efficiency
Fin. mkt. development
Technological readiness
Market size
Business sophistication
Innovation
Competitiveness Indicators(Ranking among 140 countries)
Source: World Economic Forum, Global Competitiveness Report.
1/ Latin America & Caribbean WEO group, excluding small states and Venezuela.
Range of 12 Latin American Countries1/
Bolivia
Median
Inter-
quartile
Range
Weaker Ranking
0
1
2
3
4
2007 2010 2012 2014 2016
Inter-quartile Range
Range of 12 Latin American Countries 1/
Median
Bolivia
Logistics Performance Index(scores on index from very low (1) to very high (5))
Sources: World Bank.
1/ Latin America & Caribbean WEO group excluding small states and Venezuela.
0
50
100
150
200
250
300
350
400
1995 2000 2005 2010 2015
Real Minimum Wages in Selected Comparitor Economies(In 2001 U.S. dollars)
Sources: ILO; National Authorities; IFS; Haver Analytics; and Fund staff calculations.
1/Brazil, Chile, Ecuador, Paraguay, Peru and Uruguay. Ecuador data begin in 2001.
Bolivia
Range of 6 South
American Economies 1/
90
100
110
120
130
140
150
1997
1998
1999
2000
2001
2002
2003
2004
2005
2006
2007
2008
2009
2010
2011
2012
2013
2014
2015
Labor Productivity and Real Labor Income(Indexes, 2000=100)
Sources: SEDLAC; ILO; and Fund staff calculations.
Productivity
(real GDP per
employed person)
Real labor income

BOLIVIA
INTERNATIONAL MONETARY FUND 57
Market share: Bolivia’s share of world exports has risen, largely reflecting increases in its main
export commodities (hydrocarbons, minerals, and soy). However, its share of world real exports
has remained broadly stable for some time. This indicates that Bolivia has been able to expand
exports broadly in line with the world average.
0
5
10
15
20
25
30
35
40
45
2003 2004 2005 2006 2007 2008 2009 2010 2011 2012 2013 2014 2015
Exports, by Type of Product(In percent of GDP)
Sources: Banco Central de Bolivia.
Other nontraditional
Soy and derivatives
Minerals
Hydrocarbons
Other items
(incl. re-exports)
50
100
150
200
250
300
350
0.00
0.01
0.02
0.03
0.04
0.05
0.06
2003200420052006200720082009201020112012201320142015
Implied Deflator for Bolivian
Exports (2003=100; rhs)
Share of World Exports in
Constant 2003 Prices (%)
Share of World Exports in
Current Prices (%)
Exports: Shares and Prices
Sources: World Economic Outlook; Haver Analytics; and Fund staff estimates.
BOLIVIA
58 INTERNATIONAL MONETARY FUND
Annex V. Stress Tests of the Bolivian Banking System
This annex provides background on the stress tests of the Bolivian banking system. Loan
growth has picked up significantly, resulting in a fourfold increase in total lending since 2009.
Although part of it reflects strong demand from a growing economy, it also points to potentially
higher risks in the future. Thus, stress tests were performed to assess both the solvency and liquidity
stance of banking sector in the face of potential shocks. These tests were conducted on the 13
general license banks (“Bancos Múltiples”) and the relatively large state-owned bank (Banco Union),
on a bank-by-bank basis, using publically available balance sheet data and complementary data
provided by the authorities as of end-June 2016. This annex provides details on the methodologies
and assumptions used to derive the stress test results discussed earlier within this report.
Credit Risk
Reported data present some differences in reported and implied provisions, requiring some
initial adjustments. Reported system-wide capital adequacy ratio (CAR) stands at 12.4 percent of
total risk-weighted assets, with all 14 banks above the regulatory minimum ratio of 10 percent
(Figure B1). However, in some cases, the reported levels of provisions appear to be lower than that
required by existing loan classification. Thus, banks capital ratios were adjusted by the amount of
“underprovisioning” derived from the reported loan classification and provisioning rates, lowering
the system’s CAR to 12 percent, with no bank below the 10 percent threshold.1
Credit risk was modeled as a function of a set of macroeconomic variables. The NPL-ratio is
modeled as a function of real GDP growth, real (lending) interest rates, and the real effective
exchange rate (REER). To ensure that the model only produces predictions for the NPL-ratio
between 0 and 100 percent, the following logit transformation is applied:
𝑌𝑡 = ln (NPLt
1−NPLt) for 𝑡 = 1, … , 𝑇 [1]
This logit transformation is then assumed to be a linear function of the three macroeconomic
factors, and estimation model can be expressed as:
𝑌𝑖,𝑡 = 𝛼 + 𝛽1𝑋1,𝑡 + 𝛽2𝑋2,𝑡 + 𝛽3𝑋3,𝑡 + 𝜇𝑖 + 𝜖𝑖,𝑡 for 𝑡 = 1, … , 𝑇 [2]
where 𝜇𝑖captures the bank specific fixed effects, 𝜖𝑖,𝑡 is a well-behaved error term, and 𝛼 and the 𝛽𝑖‘s
are parameters estimated using standard fixed-effects panel data techniques on quarterly data for
the period 2001Q1 to 2016Q1 (Table 1).2
1 The reported capital may still suffer from additional deficiencies, reflecting in part limitations in quality of
supervision, including issues related to the appropriate classification of loans, treatment of restructured loans,
valuation of collateral and investment assets, dealing with related-party lending and on-lending practices, etc.
2 To minimize any endogeneity issues, the dependent variable takes end-of-period (quarter) values, while the
explanatory variables represent averages over the quarter. Robustness tests were also conducted using lags of the
explanatory variables.
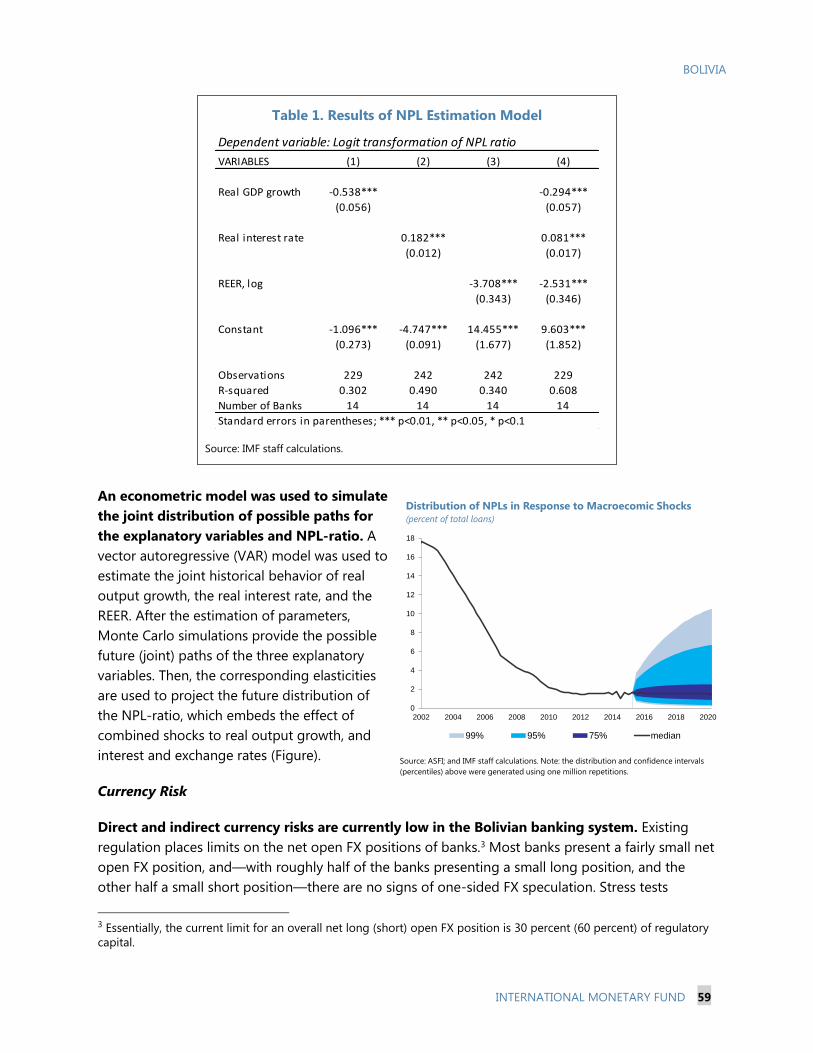
INTERNATIONAL MONETARY FUND 59
Table 1. Results of NPL Estimation Model
Source: IMF staff calculations.
An econometric model was used to simulate
the joint distribution of possible paths for
the explanatory variables and NPL-ratio. A
vector autoregressive (VAR) model was used to
estimate the joint historical behavior of real
output growth, the real interest rate, and the
REER. After the estimation of parameters,
Monte Carlo simulations provide the possible
future (joint) paths of the three explanatory
variables. Then, the corresponding elasticities
are used to project the future distribution of
the NPL-ratio, which embeds the effect of
combined shocks to real output growth, and
interest and exchange rates (Figure).
Currency Risk
Direct and indirect currency risks are currently low in the Bolivian banking system. Existing
regulation places limits on the net open FX positions of banks.3 Most banks present a fairly small net
open FX position, and—with roughly half of the banks presenting a small long position, and the
other half a small short position—there are no signs of one-sided FX speculation. Stress tests
3 Essentially, the current limit for an overall net long (short) open FX position is 30 percent (60 percent) of regulatory
capital.
Dependent variable: Logit transformation of NPL ratio
VARIABLES (1) (2) (3) (4)
Real GDP growth -0.538*** -0.294***
(0.056) (0.057)
Real interest rate 0.182*** 0.081***
(0.012) (0.017)
REER, log -3.708*** -2.531***
(0.343) (0.346)
Constant -1.096*** -4.747*** 14.455*** 9.603***
(0.273) (0.091) (1.677) (1.852)
Observations 229 242 242 229
R-squared 0.302 0.490 0.340 0.608
Number of Banks 14 14 14 14
Standard errors in parentheses; *** p<0.01, ** p<0.05, * p<0.1
0
2
4
6
8
10
12
14
16
18
2002 2004 2006 2008 2010 2012 2014 2016 2018 2020
99% 95% 75% median
Distribution of NPLs in Response to Macroecomic Shocks(percent of total loans)
Source: ASFI; and IMF staff calculations. Note: the distribution and confidence intervals
(percentiles) above were generated using one million repetitions.
BOLIVIA

BOLIVIA
60 INTERNATIONAL MONETARY FUND
suggest that direct credit risks are low, and even under an extreme scenario (25 percent
depreciation), the implied losses would be fairly small (180 million Bolivianos, or less than
0.1 percent of GDP). Moreover, levels of dollarization have fallen rapidly in recent years. Roughly
15–16 percent of assets and liabilities are currently denominated in U.S. dollars. On the asset side,
most FX-denominated assets are made of cash and high-quality liquid assets, while credit
dollarization represents a mere 2 percent of total loans. FX loans are generally provided to
borrowers that receive hard currency income. However, by virtue of the small amounts involved, the
presence of any “unhedged borrowers” is unlikely to pose a systemic risk.
Concentration Risk
Concentration risk was assessed based on the hypothetical default of the largest borrowers. In
most banks, the largest single exposure represents an important share of total regulatory capital
(Table 2). In particular, the largest exposure in two small banks is close to the regulatory minimum
(20 percent of capital). Although for most banks the reported amount of collateral pledged against a
large loan exceeds the amount of the loan, it does not eliminate the underlying risk as the collateral
might suffer from valuation deficiencies or practical limitations (e.g. costly legal process, large
execution times, etc.), or might be somewhat encumbered (e.g. syndicated loans). Stress tests show
that the default of the single largest borrower would lead to system-wide losses of around 543
million Bolivianos,4 with the resulting capitalization of all banks above the 10 percent minimum.
Whereas the hypothetical default of the largest 5 borrowers would lead to losses of about 1.86bn
Bolivianos (0.8 percent of GDP) and would result in the undercapitalization of 6 banks.
Table 2. Largest Credit Exposures in the Banking System
(In percent of total regulatory capital)
Sources: Bolivian authorities; and IMF staff calculations.
Liquidity Risk
The assessment of the banking sector liquidity stance is based on the use of liquidity coverage
metrics. Liquidity Coverage Ratio (LCR)-type proxies were constructed using bank-by-bank balance
sheet data and assumptions in the spirit of Basel III. The LCR measures the banks’ potential net
outflows over the next 30 days, and the counterbalancing capacity of the banks—i.e. the amount of
available liquid assets (“liquidity buffer”)—to be able to cover these potential outflows. Banks should
maintain an LCR above 100 percent. Specific deposit run-off rates and asset haircuts are included to
4 Stress tests assumed a recovery rate of 50 percent on the reported collateral value.
All Banks B1 B2 B3 B4 B5 B6 B7 B8 B9 B10 B11 B12 B13 B14
Largest borrower 11.4 16.6 19.5 18.7 14.7 16.8 16.1 3.3 13.7 14.5 19.0 9.0 0.8 0.1 12.8
Largest 5 borrowers 46.4 64.1 91.9 81.3 41.6 79.9 65.7 10.1 57.3 47.5 76.5 37.4 3.2 0.4 59.3
Largest 10 borrowers 76.4 100.3 139.1 129.2 59.8 141.9 117.0 15.3 90.9 79.1 94.3 63.0 5.0 0.7 101.5

INTERNATIONAL MONETARY FUND 61
emulate stress conditions. The assumptions embedded in the LCR proxy were based on the
calibration suggested by Basel III. Furthermore, we construct an additional LCR-proxy calibrated on
historically observed deposit run-off rates in Bolivia, which are much larger than the standard run-
off rates embedded in the Basel III LCR (Table 3).
Table 3. Assumptions Used in Computation of LCR Proxies
Source: IMF staff calculations.
Basel III Bolivia-specific
Liquid Assets ("Liquidity Buffer")
Cash 0 0
Deposits at Central Bank 0 0
Central Bank securities 0 0
Government securities 15 15
Interbank claims 100 100
Loans (performing) maturing within 1 month 50 50
Other assets maturing within 1 month 50 50
Potential Outflows
Interbank deposits 100 100
Customer Deposits
Stable deposits 5 25
Less stable deposits 10 50
Term deposits, RM > 1 month 0 5
Other deposits 1/ 40 40
Non-deposit liabilities maturing within 1 month 100 100
1/ Include desposits from large non-financial corporates, sovereigns, central banks, and SOEs.
assumed run-off rates:
assumed haircuts:
BOLIVIA
BOLIVIA STAFF REPORT FOR THE 2016 ARTICLE IV CONSULTATION—
INFORMATIONAL ANNEX
Prepared By
The Western Hemisphere Department
(In Consultation with Other Departments)
FUND RELATIONS ____________________________________________________________________ 2
RELATIONS WITH THE WORLD BANK AND BANK-FUND COLLABORATION
UNDER THE JMAP ____________________________________________________________________ 7
RELATIONS WITH THE INTER-AMERICAN DEVELOPMENT BANK ________________ 11
STATISTICAL ISSUES ________________________________________________________________ 12
CONTENTS
November 23, 2016
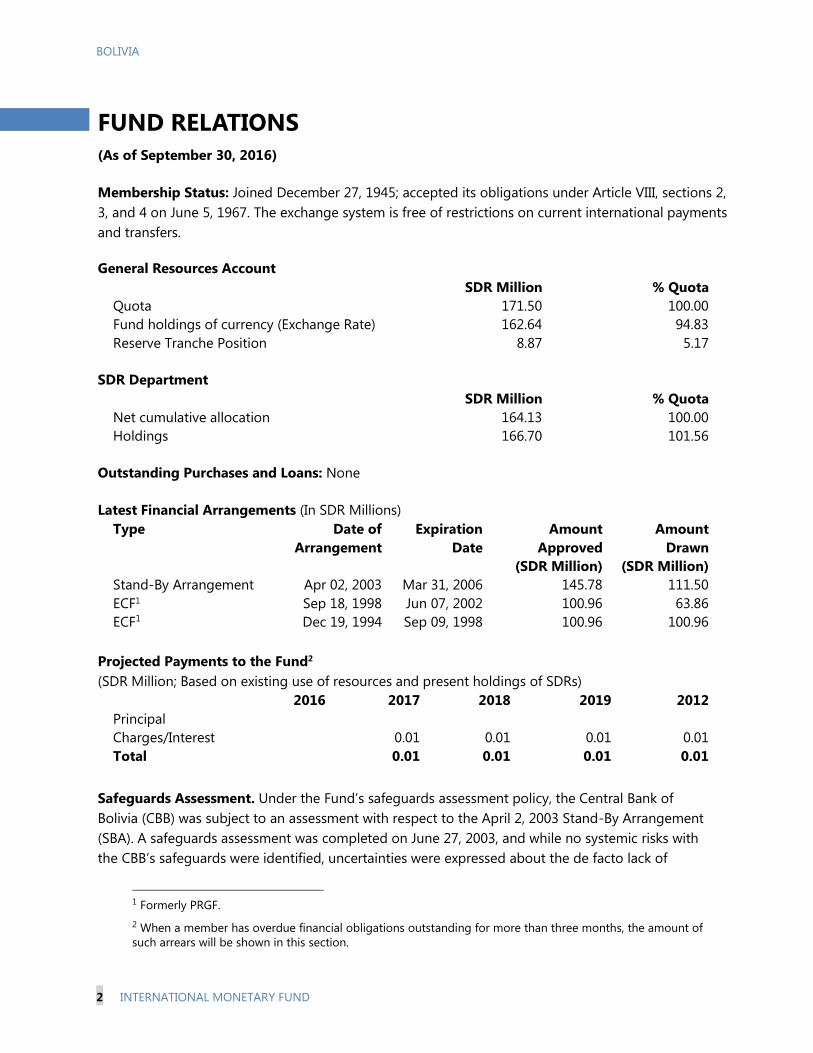
BOLIVIA
2 INTERNATIONAL MONETARY FUND
FUND RELATIONS
(As of September 30, 2016)
Membership Status: Joined December 27, 1945; accepted its obligations under Article VIII, sections 2,
3, and 4 on June 5, 1967. The exchange system is free of restrictions on current international payments
and transfers.
General Resources Account
SDR Million % Quota
Quota 171.50 100.00
Fund holdings of currency (Exchange Rate) 162.64 94.83
Reserve Tranche Position 8.87 5.17
SDR Department
SDR Million % Quota
Net cumulative allocation 164.13 100.00
Holdings 166.70 101.56
Outstanding Purchases and Loans: None
Latest Financial Arrangements (In SDR Millions)
Type Date of
Arrangement
Expiration
Date
Amount
Approved
(SDR Million)
Amount
Drawn
(SDR Million)
Stand-By Arrangement Apr 02, 2003 Mar 31, 2006 145.78 111.50
ECF1 Sep 18, 1998 Jun 07, 2002 100.96 63.86
ECF1 Dec 19, 1994 Sep 09, 1998 100.96 100.96
Projected Payments to the Fund2
(SDR Million; Based on existing use of resources and present holdings of SDRs)
2016 2017 2018 2019 2012
Principal
Charges/Interest 0.01 0.01 0.01 0.01
Total 0.01 0.01 0.01 0.01
Safeguards Assessment. Under the Fund’s safeguards assessment policy, the Central Bank of
Bolivia (CBB) was subject to an assessment with respect to the April 2, 2003 Stand-By Arrangement
(SBA). A safeguards assessment was completed on June 27, 2003, and while no systemic risks with
the CBB’s safeguards were identified, uncertainties were expressed about the de facto lack of
1 Formerly PRGF.
2 When a member has overdue financial obligations outstanding for more than three months, the amount of
such arrears will be shown in this section.

BOLIVIA
INTERNATIONAL MONETARY FUND 3
operational independence and program monetary data. An update assessment was completed on
September 27, 2004 in conjunction with an augmentation of the SBA. This assessment confirmed
that measures had been implemented to address all previously identified vulnerabilities, except for
those requiring a change in the central bank law. Currently, CBB is not subject to the policy.
Exchange Arrangement: The Bolivian currency is the Boliviano and the de jure exchange rate
regime is crawling peg to the U.S. dollar. Within the scope of the official crawling peg exchange rate
regime, in an external environment characterized by market exchange rate volatility and decreasing
external inflation, the sliding rate was set to zero to anchor the public’s expectations. Consequently,
the boliviano stabilized against the U.S. dollar since November 2011. Accordingly, the de facto
exchange rate arrangement has been retroactively reclassified to a stabilized arrangement from a
crawling peg, effective November 2, 2011. The exchange regime is free of restrictions and multiple
currency practices.
Article IV Consultation: The last Article IV consultation was completed by the Executive Board on
November 20, 2015 (Country Report No. 15/334). Bolivia is on a standard 12-month consultation cycle.

BOLIVIA
4 INTERNATIONAL MONETARY FUND
Implementation of HIPC Initiative
Original
Framework
Enhanced
Framework Total
Commitment of HIPC assistance
Decision point date Sep 1997 Feb 2000
Assistance committed by all creditors (US$ million)3 448.00 854.00
Of which: IMF assistance (US$ million) 29.00 55.32
(SDR equivalent in millions) 21.25 41.14
Completion point date Sep 1998 Jun 2001
Disbursement of IMF assistance (SDR million)
Assistance disbursed to the member 21.25 41.14 62.39
Interim assistance ... ... ...
Completion point balance 21.25 41.14 62.39
Additional disbursement of interest income4 ... 3.09 3.09
Total disbursements 21.25 44.23 65.48
Implementation of MDRI Assistance
Total debt relief (SDR Million)5 160.93
Financed by: MDRI Trust 154.82
Remaining HIPC resources 6.11
Debt relief by facility (SDR Million)
Debt Relief by Facility (SDR Million)
Eligible Debt
Delivery Date GRA PRGF Total
January 2006 83.08 N/A 83.08
January 2006 6.70 71.15 77.85
Implementation of Post-Catastrophe Debt Relief (PCDR): Not Applicable
3 Assistance committed under the original framework is expressed in net present value (NPV) terms at the completion point, and
assistance committed under the enhanced framework is expressed in NPV terms at the decision point. Hence these two amounts
cannot be added.
4 Under the enhanced framework, an additional disbursement is made at the completion point corresponding to interest income
earned on the amount committed at the decision point but not disbursed during the interim period.
5 The Multilateral Debt Relief Initiative (MDRI) provides 100 percent debt relief to eligible member countries that are qualified for
the assistance. Grant assistance from the MDRI Trust and HIPC resources provide debt relief to cover the full stock of debt owed to
the Fund as of end-2004 that remains outstanding at the time the member qualifies for such debt relief.
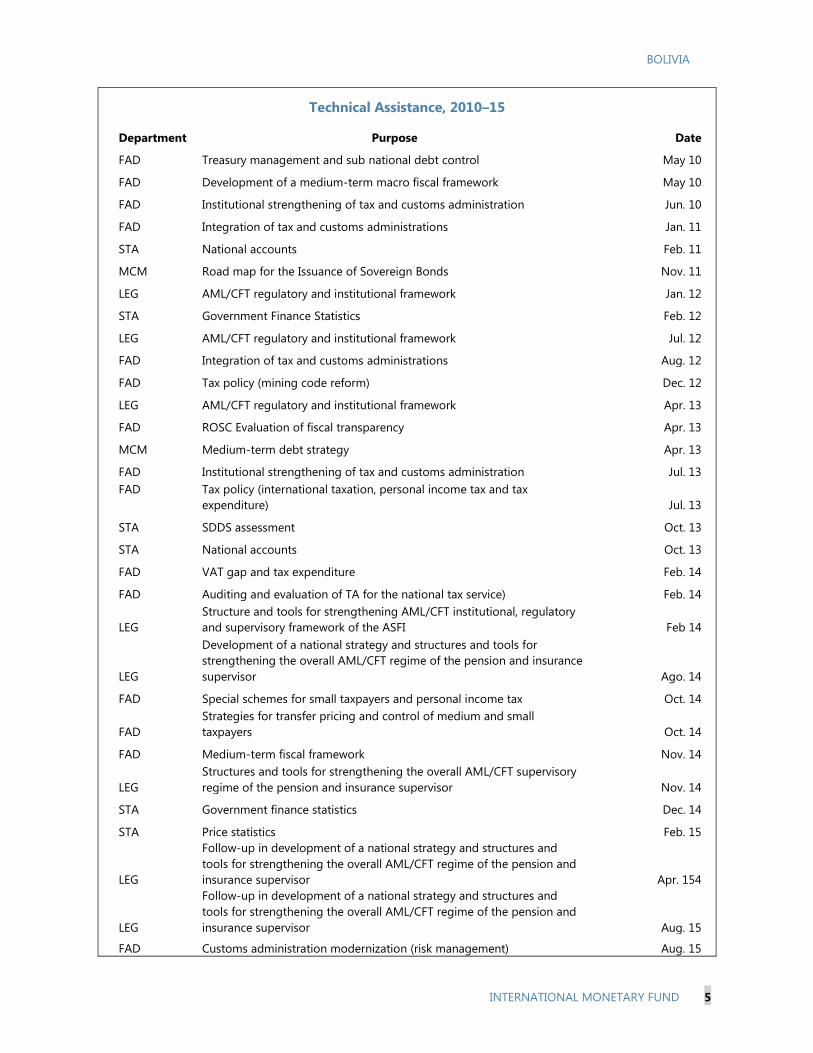
BOLIVIA
INTERNATIONAL MONETARY FUND 5
Technical Assistance, 2010–15
Department Purpose Date
FAD Treasury management and sub national debt control May 10
FAD Development of a medium-term macro fiscal framework May 10
FAD Institutional strengthening of tax and customs administration Jun. 10
FAD Integration of tax and customs administrations Jan. 11
STA National accounts Feb. 11
MCM Road map for the Issuance of Sovereign Bonds Nov. 11
LEG AML/CFT regulatory and institutional framework Jan. 12
STA Government Finance Statistics Feb. 12
LEG AML/CFT regulatory and institutional framework Jul. 12
FAD Integration of tax and customs administrations Aug. 12
FAD Tax policy (mining code reform) Dec. 12
LEG AML/CFT regulatory and institutional framework Apr. 13
FAD ROSC Evaluation of fiscal transparency Apr. 13
MCM Medium-term debt strategy Apr. 13
FAD Institutional strengthening of tax and customs administration Jul. 13
FAD Tax policy (international taxation, personal income tax and tax
expenditure) Jul. 13
STA SDDS assessment Oct. 13
STA National accounts Oct. 13
FAD VAT gap and tax expenditure Feb. 14
FAD Auditing and evaluation of TA for the national tax service) Feb. 14
LEG
Structure and tools for strengthening AML/CFT institutional, regulatory
and supervisory framework of the ASFI Feb 14
LEG
Development of a national strategy and structures and tools for
strengthening the overall AML/CFT regime of the pension and insurance
supervisor Ago. 14
FAD Special schemes for small taxpayers and personal income tax Oct. 14
FAD
Strategies for transfer pricing and control of medium and small
taxpayers Oct. 14
FAD Medium-term fiscal framework Nov. 14
LEG
Structures and tools for strengthening the overall AML/CFT supervisory
regime of the pension and insurance supervisor Nov. 14
STA Government finance statistics Dec. 14
STA Price statistics Feb. 15
LEG
Follow-up in development of a national strategy and structures and
tools for strengthening the overall AML/CFT regime of the pension and
insurance supervisor Apr. 154
LEG
Follow-up in development of a national strategy and structures and
tools for strengthening the overall AML/CFT regime of the pension and
insurance supervisor Aug. 15
FAD Customs administration modernization (risk management) Aug. 15

BOLIVIA
6 INTERNATIONAL MONETARY FUND
Technical Assistance, 2010–15 (concluded)
STA External sector statistics Sep. 15
LEG
Follow-up in development of a national strategy and structures and
tools for strengthening the overall AML/CFT regime of the pension and
insurance supervisor Oct. 15
STA Reporting and dissemination of FSIs Dec. 15
FAD Follow-up to customs administration modernization (risk management) Jan. 16
FAD
Assessment of the current organization and operation of the GRACOS
offices Jan. 16
FAD Follow-up tax administration Jan. 16
STA External sector statistics Apr. 16
STA Price statistics Apr. 16
LEG
Follow-up in development of a national strategy and structures and
tools for strengthening the overall AML/CFT regime of the pension and
insurance supervisor Jul. 16
FAD
Advice on techniques for planning and executing tax auditing of large
taxpayers in the financial sector Aug. 16
FAD Tax administration Oct. 16
LEG
Follow-up in development of a national strategy and structures and
tools for strengthening the overall AML/CFT regime of the pension and
insurance supervisor Oct. 16
STA Follow-up to external sector statistics Oct. 16
BOLIVIA
INTERNATIONAL MONETARY FUND 7
RELATIONS WITH THE WORLD BANK AND BANK-
FUND COLLABORATION UNDER THE JMAP
A. Relations with the World Bank Group
The ongoing Country Partnership Framework (CPF) for the fiscal period 2016–20 constitutes
the umbrella for World Bank Group (WBG) support to Bolivia. The CPF was discussed by the
Board of Executive Directors in December 2015. The program under the CPF aims at maximizing the
impact of WBG interventions on poverty reduction and the promotion of shared prosperity, the
WBG Twin Goals. Three selectivity filters were used to frame the program: (a) broad consistency with
the priority constraints identified in the WBG Systematic Country Diagnostic (SCD); (b) alignment
with the Government’s development plans and demands; and (c) the WBG comparative advantage in
sustaining Bolivia’s progress in moving toward the Twin Goals. Despite the filters, the WBG
engagement in Bolivia will remain flexible with respect to the evolution of the country’s growth
trajectory and new demands that may arise from the authorities.
The WBG program under the CPF is comprised of two pillars and five objectives that will
provide general direction to the WBG’s engagement. The CPF has the following two pillars:
(1) promote broad-based and inclusive growth; and (2) support environmental and fiscal
sustainability, and resilience to climate change and economic shocks. Within each pillar, the
following inter-linked objectives guide the WBG’s engagement: (i) reduce transport costs and
increase connectivity of isolated and vulnerable communities to the national road network;
(ii) increase access to selected quality basic services for the poorest rural and urban communities;
(iii) improve opportunities for income generation, market access and sustainable intensification
(Pillar 1); (iv) strengthen capacity to manage climate change and reduce vulnerability to natural
disasters; and (v) strengthen institutional capacity to improve public resource management and the
business environment (Pillar 2). The formulation of the pillars and objectives reflect the current
portfolio and allow space for nascent government demands.
Bolivia will continue receiving financing from both the International Bank for Reconstruction
and Development (IBRD) and the International Development Association (IDA) during the
CPF period. The Bolivia CPF reflects an indicative lending volume of up to US$2 billion during the
2016–20 period. The Special Drawing Rights (SDR) 146 million (approx. US$208 million) of the IDA17
allocation for FY2015–17 was front-loaded and is already fully committed. The IDA Scale-up Facility
allocated US$30 million to Bolivia that will be committed in late 2016. The CPF envisioned the
transition of Bolivia to an IBRD-only status by the end of the IDA17 cycle at the end of FY2017.
However, under ongoing discussions with regard to IDA financing, it is proposed that Bolivia,
together with other three IDA graduate countries, will receive transitional support from IDA
equivalent to ⅔ of the IDA17 allocation during the IDA18 cycle (FY2018–20).
The CPF takes into account the existing portfolio as much of the impact on the CPF objectives
will be derived from the legacy portfolio. The World Bank active portfolio in Bolivia comprises 10
investment project financing worth US$766 million, of which US$486 million remain undisbursed

BOLIVIA
8 INTERNATIONAL MONETARY FUND
(Table 1). The existing trend of a steady state number of projects (about 11–13) is expected to
continue. The portfolio supports projects in the following areas: transport, rural development and
agriculture, statistical capacity building, energy, urban development, climate change and
employment. The first Development Policy Financing (DPF) in a decade, approved in FY2015
underpinned by a solid policy program in Disaster Risk Management, closed in mid-July. There are
currently no plans to follow up with additional DFP financing.
The WBG’s engagement is defined for fiscal years 2017–19. The pipeline comprises five
investment project financing and two additional financing for US$965 million. The authorities are
prioritizing investments in the water sector, including drinking water, irrigation, basic sanitation and
wastewater treatment plants, in line with the Government’s Economic and Social Development Plan
for 2016–20. Transport, energy, rural and urban development areas continue to be priorities for Bank
engagement. The tentative lending program for part of FY2019 and FY2020 is open and flexible to
respond to emerging demands and reflects the findings of a Performance and Learning Review (PLR)
that is planned for FY2018. The PLR will offer a critical stocktaking exercise and allow the WBG to
adjust course as necessary.
Table 1. World Bank Investment Portfolio in Bolivia (as of October 2016)
Project Commitment
(US$ million)
Disbursed
(US$ million)
Undisbursed*
(US$ million) Closing Date
Access and Renewable Energy 50.0 0.40 44.31 December 2021
Pilot Program for Climate Resilience
(PPCR) Phase 2 – Integrated Basin
Management
45.5 1.06 44.44 June 2020
Agricultural Innovation and Services 39.0 33.6 1.87 February 2017
Community Investment in Rural Areas 100.0 33.62 63.35 November 2019
Rural Alliances Project II 50.0 33.85 12.39 November 2017
Strengthening Statistical Capacity &
Information for Evidence-Based
Planning
73.3 58.93 10.62 December 2017
Improving Employability and Labor
Income of Youth 20.0 1.04 17.22 December 2020
Urban Infrastructure Project 53.94 44.03 10.03 December 2016
National Roads & Airport
Infrastructure 109.5 39.12 58.24 December 2016
Road Sector Capacity Development 225.0 0.41 224.30 June 2022
Total 766.24 246.06 486.78
*Undisbursed balances differ from the difference between committed and disbursed amounts due to variations in the exchange
rates between SDRs and U.S. dollars.
The International Finance Corporation (IFC) will continue supporting opportunities for
private sector development under the CPF. The IFC portfolio comprises nine projects worth
US$31.8 million in commitments. Last year, the IFC approved two long-term financing operations in
Bolivia’s banking sector, the first ones in over a decade. These credit facilities aim to help banks
strengthen their position to finance local Small and Medium Enterprises (SMEs). In addition, the IFC
has lent to a firm in the wood manufacturing sector. In the next five years, IFC will work to

BOLIVIA
INTERNATIONAL MONETARY FUND 9
strengthen its relations with clients in the private sector, focusing on finance, agribusiness, and
services. As for Advisory Services (AS), the IFC is implementing projects in strategic sectors to
maximize employment, simplify business creation and income generation by low-income people,
and protect the environment. In addition, dialogue with partners in new sectors is underway. As for
the Multilateral Investment Guarantee Agency (MIGA), it remains open to supporting foreign direct
investments via its political risk insurance products.
In addition, the World Bank will continue providing Advisory Services and Analytics (ASA).
In the next years ASAs will focus on those areas where the World Bank can provide value added,
respond to Government needs and in alignment with the knowledge gaps identified in the
Systematic Country Diagnostic. Table 2 presents the list of ongoing ASA. The program is kept open
to respond to emerging requirements.
Table 2. Ongoing ASA FY2017
Product
Strengthening Delivery of Sustainable Water Services for the Most Disadvantaged in Bolivia TA
Intermediate Cities Development TA
Private Investment Note TA
Policy Note in the Energy Sector TA
Trust funds (TF) continue to be used to support policy dialogue and to pilot innovative ideas.
The current TF portfolio (Table 3) includes three grants in areas such as community-driven
development in remote areas, institutional capacity in the public investment cycle, and the capacity
to develop and implement a system of statistical indicators to measure well-being in a multi-
dimensional sense.
Table 3. World Bank Trust Fund Portfolio in Bolivia (as of October 2015)
Project Amount
(US$ million)
Living Well Indicators 0.30
Integrated Community-Driven Territorial Development for Remote Communities in the Amazon
(JSDF) 2.21
Strengthening of Planning, Investment, Fiduciary and Procurement Capacities 0.52
TOTAL 3.03
B. IMF Relations with the World Bank Under JMAP
The following priorities were identified for the coordinated work-plan on Bolivia:
Reducing poverty and inequality: Significant challenges remain in poverty reduction and
inequality. The share of the population living in poverty has stagnated at around 38 percent
between 2013 and 2015. Similarly, the reduction in income inequality has stopped since 2011,
with a Gini of 0.47 in both 2011 and 2015.

BOLIVIA
10 INTERNATIONAL MONETARY FUND
Expanding access to basic services: Access to basic services, particularly in rural areas, remains
a challenge. Access to water and sanitation, health, education, and social protection are in the
agenda.
Promoting private investment: Private investment, both domestic and foreign direct
investment, is below regional levels and has decreased after commodity prices plummeted.
Enhancing macroeconomic and fiscal framework: Strengthening Bolivia’s macroeconomic
and fiscal management may help in dealing with the challenges brought by low commodity
prices.
It was agreed that the teams continue with the following division of labor:
Poverty and social protection: The Bank has been providing technical assistance on poverty
measurement, including monetary poverty and multidimensional well-being indicators. This
complements the support provided to generate high quality statistical information through a
STATCAP project. These tools would support both diagnosis and targeting of population that
fails to reach minimum standards of multidimensional welfare. In addition, the Bank continues
supporting improvements in the access to sustainable basic productive infrastructure for the
most disadvantaged rural communities, the employability of vulnerable youth in urban and
peri-urban areas, and will support the dialogue on key health issues.
Basic and social services: The Bank provides support to expand access to energy in unserved
rural areas. It will also support the access to water, both for drinking and irrigation purposes in
rural areas, as well as water and basic sanitation in peri-urban unserved areas. Support in the
transport sector aims to increase connectivity not only for economic purposes but to facilitate
access to services.
Private sector development: The IFC is providing credit lines to financial institutions in an
on-lending program to SMEs. Additionally, the IFC provides short-term credit lines to guarantee
trade operations. The corporation is also aiming to expand its activities to other sectors such as
food, agro-industry, and education. Similarly, the IFC is providing technical assistance to
promote more efficient processes to improve the business climate at both national and
sub-national levels.
Macroeconomic and fiscal management: The Bank continues to be open to a government
requirement to support activities based on previous technical assistance in debt management,
multi-year budgeting and planning, public finance management, and public investment,
including at the sub-national level.
BOLIVIA
INTERNATIONAL MONETARY FUND 11
RELATIONS WITH THE INTER-AMERICAN DEVELOPMENT BANK
As of September 30, 2016, the Inter-American Development Bank (IDB) had approved loans
to Bolivia amounting to US$6.64 billion, with disbursements totaling US$4.91 billion.
Bolivia’s outstanding debt to the IDB was US$2,165 million with undisbursed approved funds of
US$1,325 million. During the year, net cash flows to the country were positive for an eight year in a
row, a trend expected to continue in the baseline scenario to 2017. At the end of 2007, the IDB
unilaterally joined the IMF-WB MDRI initiative, by writing off a total of US$741.1 million in principal
payments and US$307.3 million of future interest payments, generating an estimated annual fiscal
space of more than US$18.0 million on average.
In order to make the IDB’s concessional assistance to its poorest and most vulnerable member
countries (Bolivia, Guyana, Honduras, and Nicaragua) sustainable, the Board of Executive
Directors and Management have resolved the transfer of the resources of the Fund of Special
Operations (FSO) into the Ordinary Capital (OC). Modifications to the eligibility criteria and
financial structure for providing concessional lending to eligible borrowing members have also been
approved. This transfer and modifications will be effective and implemented on January 1, 2017 and
will allow Bolivia to keep having access to concessional borrowing.
The IDB and Bolivia approved at end-2015 a new country strategy for the period 2016–20.
Under the country strategy, the IDB has decided to increase financial flows to Bolivia. While in
2011 the approval of new loans was US$252 million; it reached US$475.1 million in 2015 and will
reach US$680.73 million in 2016 (US$633.4 million of blend financing and US$47.33 million from a
one-time Grant Leverage Mechanism). The country strategy also contemplates a scenario where
after 2016 the approval of new loans could go back to 2015´s levels given a new FSO performance-
based allocation exercise.
The actions provided in the new Bank´s country strategy are consistent with Bolivia´s National
Development Plan 2016–20. The strategy will help in the medium and long term development of
Bolivia supporting three priority areas: (i) increasing productivity and diversifying the economy, (ii)
closing social gaps, and (iii) improving of public management.
As of September 30, 2016, the portfolio of sovereign guaranteed operations in Bolivia
consisted of 34 operations, totaling US$2.17 billion, of which 38.8 percent had been
disbursed. The current executing portfolio supports mostly transport, water and sanitation and
energy infrastructure interventions. The non-sovereign guaranteed executing portfolio consists of 15
loans equaling to US$81.7 million.

BOLIVIA
12 INTERNATIONAL MONETARY FUND
STATISTICAL ISSUES
(As of November 22, 2016)
A. Assessment of Data Adequacy for Surveillance
General. Data provision has some shortcomings, but is broadly adequate for surveillance. Progress
has been made to strengthen the quality of statistics, including working towards full subscription of
the Special Data Dissemination Standard (SDDS). Timely publication of macroeconomic data
according to a pre-announced schedule, improving data on quasi-fiscal activities of subsidiaries of
SOEs outside of the fiscal accounts, and publishing a real estate price index would be further
important steps to improve transparency.
National Accounts. The National Institute of Statistics (INE) is working on updating of the base year
of the national accounts (from 1990 to 2010, with mobile base) which includes the implementation
of the System of National Accounts 1993 (SNA 1993) and some of the most relevant
recommendations of the SNA 2008. The INE plans to release series for years 2010–15 in mid-2017,
and then gradually release historic quarterly and regional national accounts from 1990,
Labor market. The quality of household and employment surveys has declined in the last few years,
due mainly to financial constraints. The quarterly employment survey was discontinued in 2010,
leading to a lack of quarterly information on unemployment, employment and wages. Yearly
information on wages is still compiled by the INE. Currently, the INE is working on new household
and employment surveys to be published next year with information since 2015.
Prices statistics. Industrial producer price indices (PPI) and external trade unit values are compiled
by the INE, but are in need of revision as regards concepts and definitions consistent with SNA 1993,
as well as treatment of seasonal products, missing items, quality changes, and introduction of new
products. Two PPI TA visited Bolivia in 2015 and 2016. The INE is updating the CPI base year to be
released during the first quarter of 2017; and preparing a new producer price index and a wholesale
price index, both planned to be published in 2017.
Government finance statistics. Annual data on the operations of the consolidated central
government do not cover all operations of decentralized agencies and operations channeled
through special funds. The ongoing implementation of a comprehensive financial management
system, with funding from the IADB/WB, will help ensure proper monitoring of public sector
financial operations including subnational fiscal operations, debt and social spending. It will also be
important to improve on the reporting of the operations and debt of public enterprises.
Balance of payments. In November 2016, the BCB began publishing balance of payments and
international investment position data according to the Balance of Payments Manual, sixth edition
(BPM6). The transition to BPM6 accounting principles took place along with a technical assistance
program provided by the Fund and financed by the sub-account of the Government of Belgium.
These revised external sector statistics (ESS) contain a number of methodological enhancements

BOLIVIA
INTERNATIONAL MONETARY FUND 13
including improved coverage in the financial account and IIP, better classifications of institutional
sectors and financial instruments, and a more comprehensive method to account for processing
services performed on certain types of Bolivia’s exports, among others. SDDS requirements for ESS
are almost met, except for the publication of a calendar with data release dates.
B. Data Standards and Quality
Bolivia has participated in the General Data Dissemination System (GDDS) since November 2002.
Data ROSC published on August 13, 2007.

Bolivia: Indicators Required for Surveillance
(As of November 22, 2016)
Date of Latest
Observation
Date
Received
Frequency of
Data1
Frequency of
Reporting1
Frequency of
Publication1
Memo Items
Data Quality–
Methodological
Soundness10
Data Quality–
Accuracy and
Reliability11
Exchange Rates Daily Daily D D D
International Reserve Assets and Reserve Liabilities of the
Monetary Authorities2
Daily Daily D D D
Reserve/Base Money Aug. 2016 Oct. 2016 M M M O, LO, LO, O O, O, O, O, O
Broad Money Aug. 2016 Oct. 2016 M M M
Central Bank Balance Sheet Aug. 2016 Oct. 2016 M M M
Consolidated Balance Sheet of the Banking System July. 2016 Oct. 2016 M M M
Interest Rates3 Sep. 2016 Oct. 2016 W W W
Consumer Price Index Oct. 2016 Nov. 2016 M M M LO, O, LO, O O, LO, LNO, O, LO
Revenue, Expenditure, Balance and Composition of Financing4 –
General Government5
May. 2016 July. 2016 M M M LO, LO, LNO, LO LO, O, O, O, LO
Revenue, Expenditure, Balance and Composition of Financing4–
Central Government6
May. 2016 July. 2016 M M M
Stock of Central Government and Central Government-Guaranteed
Debt7
Aug. 2016 Oct. 2016 M M M
External Current Account Balance Q2 2016 Nov. 2016 Q Q Q O, LO, LO, LO LO, O, LO, O, LO
Exports and Imports of Goods and Services8 Q1 2016 Oct. 2016 Q Q Q
GDP/GNP Q2 2016 Oct. 2016 Q Q Q LO, LO, LO, O LNO, LO, LNO, O,
LO
Gross External Debt Oct. 2016 Nov. 2016 M M M
International Investment Position9 Q2 2016 Nov. 2016 Q Q Q 1 Daily (D), Weekly (W), Monthly (M), Quarterly (Q), Annually (A); Irregular (I); Not Available (NA). 2 Any reserve assets that are pledged or otherwise encumbered should be specified separately. Also, data should comprise short-term liabilities linked to a foreign currency but settled by other
means as well as the notional values of financial derivatives to pay and to receive foreign currency, including those linked to a foreign currency but settled by other means. 3 Both market-based and officially-determined, including discount rates, money market rates, rates on treasury bills, notes and bonds. 4 Foreign, domestic bank, and domestic nonbank financing. 5 The general government consists of the central government (budgetary funds, extra budgetary funds, and social security funds) and state and local governments. 6 Bolivia does not compile central government fiscal data. 7 Guaranteed non-financial public sector debt. Including currency and maturity composition. 8 Monthly frequencies for goods only. 9 Includes external gross financial asset and liability positions vis-à-vis nonresidents. 10 Reflects the assessment provided in the data ROSC (published on August 13, 2007, and based on the findings of the mission that took place during January 24–February 7, 2007) for the
dataset corresponding to the variable in each row. The assessment indicates whether international standards concerning concepts and definitions, scope, classification/sectorization, and basis
for recording are fully observed (O); largely observed (LO); largely not observed (LNO); not observed (NO); and not available (NA). 11 Same as footnote 10, except referring to international standards concerning (respectively) source data, assessment of source data, statistical techniques, assessment and validation of
intermediate data and statistical outputs, and revision studies.
BO
LIVIA
14
IN
TER
NA
TIO
NA
L MO
NETA
RY F
UN
D

Statement by the IMF Staff Representative on Bolivia
December 9, 2016
1. This statement reports on information that has become available since the staff report
was issued. It does not alter the thrust of the staff appraisal.
2. The government declared a state of emergency in response to severe water
shortages in some areas across Bolivia, principally La Paz. The shortages, linked to the
current drought—the worst in 25 years—as well as underlying vulnerabilities from climate
change, have left many Bolivians without reliable access to water. The government has
introduced rationing measures, formed a working group of senior officials to oversee the
response to the crisis, and announced an early end to the school year. Officials are
considering other measures to alleviate the situation going forward including constructing
additional water infrastructure, although these will take some time to yield results. Overall,
these developments suggest that the drought may be having more severe and wider-reaching
effects than envisaged in staff’s baseline projections.
3. The fiscal balance through September is running well below levels a year ago, in
line with staff’s forecast of a wide deficit for 2016. The non-financial public sector has
posted a deficit of 2 percent of GDP so far this year, substantially worse than the small
surplus recorded in the same period a year ago. Weakening revenues, which mainly reflect
the full-year impact of lower petroleum prices on hydrocarbon taxes, as well as higher capital
spending are driving the deficit, notwithstanding restraint in current expenditures.
4. Newly published balance of payments data contain important methodological
improvements, but continue pointing to external imbalances. The latest release showed a
current account deficit of 6½ percent of GDP in the first half of 2016, with small but positive
revisions to 2014–15. On this basis, staff is maintaining its outlook for the current account
and international reserves, which have fallen $2.6 billion or 7.8 percent of GDP through
November 25, 2016. Thus, staff’s assessment that the real exchange rate is stronger than
warranted by fundamentals and desirable policies remains valid. However, for the first time,
the authorities issued the data using the methods of the Balance of Payments Manual, 6th
Edition, significantly impacting key components (see attached table). In the current account,
improved accounting of processing services and free-on-board imports valuation, and other
needed reclassifications substantially impact goods and services trade balances, among other
revisions. With these changes, the merchandise trade balance is about 3⅓ percentage points
of GDP higher, while the services balance is about 2¾ percentage points lower on average
during 2014–15. In the financial account, expanded coverage of sectors and instruments are
major steps, although the authorities are still taking decisions regarding the treatment of debt
issued abroad but held locally.

2
Bolivia: Balance of Payments Summary
2014 2015 Q1 Q2 H1 2014 2015 Q1 Q2 H1
Current account 478 -1,854 -569 -450 -1,019 1.4 -5.6 -7.4 -5.7 -6.5
Goods 2,922 -331 -251 -189 -439 8.8 -1.0 -3.3 -2.4 -2.8
Exports 12,810 8,673 1,588 1,708 3,296 38.5 26.1 20.7 21.6 21.1
Imports 9,888 9,004 1,839 1,897 3,735 29.7 27.1 23.9 24.0 24.0
Services -1,833 -1,568 -416 -400 -816 -5.5 -4.7 -5.4 -5.1 -5.2
Exports 1,190 1,242 265 259 524 3.6 3.7 3.5 3.3 3.4
Imports 3,024 2,810 682 659 1,340 9.1 8.5 8.9 8.3 8.6
Primary income, net -1,696 -1,124 -199 -126 -325 -5.1 -3.4 -2.6 -1.6 -2.1
Secondary income, net 1,086 1,169 297 265 562 3.3 3.5 3.9 3.4 3.6
Capital account 5 5 1 1 2 0.0 0.0 0.0 0.0 0.0
Financial account 483 -2,650 -868 -1,203 -2,071 1.5 -8.0 -11.3 -15.2 -13.3
Foreign direct investment, net -690 -495 -14 -157 -170 -2.1 -1.5 -0.2 -2.0 -1.1
Portfolio investment, net 406 804 224 129 352 1.2 2.4 2.9 1.6 2.3
Other investment, net 1/ -166 -1,338 -184 -214 -397 -0.5 -4.0 -2.4 -2.7 -2.5
Change in reserve assets 932 -1,620 -894 -962 -1,856 2.8 -4.9 -11.6 -12.2 -11.9
Net errors and omissions -1 -801 -300 -755 -1,055 0.0 -2.4 -3.9 -9.6 -6.8
Current account 61 -1,923 -541 n.a. n.a. 0.2 -5.8 -7.0 n.a. n.a.
Goods 1,783 -1,384 -471 n.a. n.a. 5.4 -4.2 -6.1 n.a. n.a.
Exports 12,301 8,302 1,503 n.a. n.a. 37.0 25.0 19.6 n.a. n.a.
Imports 2/ 10,518 9,686 1,974 n.a. n.a. 31.6 29.1 25.7 n.a. n.a.
Services -1,099 -535 -167 n.a. n.a. -3.3 -1.6 -2.2 n.a. n.a.
Exports 1,242 1,154 251 n.a. n.a. 3.7 3.5 3.3 n.a. n.a.
Imports 2/ 2,341 1,689 418 n.a. n.a. 7.0 5.1 5.4 n.a. n.a.
Income, net -1,707 -1,173 -199 n.a. n.a. -5.1 -3.5 -2.6 n.a. n.a.
Transfers, net 1,084 1,169 296 n.a. n.a. 3.3 3.5 3.9 n.a. n.a.
Capital account 5 5 1 n.a. n.a. 0.0 0.0 0.0 n.a. n.a.
Financial account 2/ 3/ -561 -917 328 n.a. n.a. -1.7 -2.8 4.3 n.a. n.a.
Foreign direct investment, net 2/ -648 -503 -122 n.a. n.a. -1.9 -1.5 -1.6 n.a. n.a.
Portfolio investment, net 2/ 561 917 16 n.a. n.a. 1.7 2.8 0.2 n.a. n.a.
Other investment, net 1/ 2/ 202 326 434 n.a. n.a. 0.6 1.0 5.7 n.a. n.a.
Change in reserve assets 2/ 971 -1,643 -876 n.a. n.a. 2.9 -4.9 -11.4 n.a. n.a.
Net errors and omissions 1,018 1,015 -8 n.a. n.a. 3.1 3.1 -0.1 n.a. n.a.
Source: Central Bank of Bolivia, National Institute of Statistics, and Fund staff calculations.
1/ Includes multilateral and bilateral loans to the public sector.
2/ Inverted (multiplied by -1) for ease of comparison with similar items in BPM6 presentation.
3/ Excludes errors and omissions and change in reserve assets.
BPM 5 Methodology
2016 2016
(millions of U.S. dollars) (percent of GDP)
Bolivia: Balance of Payments Summary
BPM 6 Methodology

Statement by Mr. Torres, Executive Director for Bolivia, and
Mr. De la Barra, Advisor to the Executive Director
December 9, 2016
The authorities had frank conversations with the staff. As you will note below, they have
several differences with the staff’s assessment and recommendations contained in the report.
Nevertheless, they appreciate the staff’s hard work and thank them for their report. We turn
now to the authorities’ views.
Bolivia has taken important strides in reforming its economy and its macroeconomic stability
has largely strengthened in recent years, as underscored in the staff report and at previous
Board meetings. While the external environment affected Bolivia through the trade channel
in 2015, clear positive growth has been achieved (4.8 percent), coupled with social policies
that include ample social programs aimed at reducing inequality in income distribution and
poverty. Going forward, Bolivia’s macroeconomic outlook looks stable. In order to further
consolidate macro stability, achieve sustainable higher growth and inclusive development,
the government will expand public investment to facilitate the industrialization of domestic
raw materials.
The Economic and Social Development Plan (PDES) 2016–2020 focuses on the
industrialization to further expand the output base. It therefore envisages fiscal and current
account deficits in the short-term, consistent with the need to diversify income sources. This
stance relies on the fiscal and external buffers accumulated in previous years thanks to sound
macroeconomic policies. Nevertheless, the authorities remain cognizant of the challenges
that still lie ahead.
The staff has its doubts about PDES’ sustainability. However, the authorities are persuaded
that those doubts are unwarranted as the PDES projections and consistency analysis is solid.
The Bolivian government prioritizes macroeconomic stability along with sustained growth.
PDES scenarios count on reasonable assumptions about oil price and other relevant variables
and according to the authorities, scenarios do not lead to a fiscal deficit of 15–20 percent of
GDP, and public debt does not reach half of the level that the staff projects.
Growth Outlook and Risks
The staff underestimates Bolivia’s growth for 2016—as it has been the case in the last 10
years—which calls for a revision of the methodology. The authorities believe that the staff
projections do not fully internalize the results of public investment projects in the short and
medium term. In addition, projections on export prices do not follow recent trends,
particularly regarding minerals and agro industrial products, such as soy beans.
2
The Bolivian authorities do not see a significant deceleration as growth is above historic
average (3.2 percent, 1986–2005) and around the observed growth rate in the last 10 years
(5 percent). Therefore, growth is still strong mainly due to the dynamics of the internal
demand. During the first semester of 2016 almost all sectors had a positive growth, except
hydrocarbons; even agriculture grew 1.4 percent in spite of adverse climate events. Although
the Bolivian authorities do not attach high likelihood to the downside risks pointed by the
staff, they are adopting several measures in order to address them.
In the agricultural sector, measures include an Action Plan to deal with El Niño and La Niña
effects, financial and technical assistance for farmers, and agricultural insurance against
drought and floods, among others. Moreover, according to the International Institute for
Climate and Society Investigation, it is likely that climate conditions will normalize in 2017.
Considering that there is a seasonal greater dynamism in the second half of the year, growth
in 2016 will be around 4.7 percent, which is among the highest in the region.
The average potential growth estimated through econometric models is around the observed
level in recent years. Although real growth in 2014 and 2015 was smaller compared to
growth in 2013 (6.8 percent), growth in 2015 was around the average in the last 10 years,
which signals that the potential output should not have deteriorated substantially. In 2014, the
staff estimated Bolivia’s potential output to be around 5 percent. The last estimation has been
changed to 3.5 percent, which appears inconsistent and downward biased.
The authorities do not share the staff’s pessimistic view regarding the decline in natural gas
production, given that gas fields Incahuasi and Margarita Huacaya II will add gas volume in
late 2016 and 2017. Exploration continues in several places with high hydrocarbons
potential, which may enter into production before 2020. The authorities have fully taken into
account the current level of international oil price into the 2016 and 2017 budget; and yet
GDP growth would be around 4.7 percent in 2017. The authorities also expect a recovery in
oil price in 2017 as a result of the recent agreement reached among OPEP and other leading
producers to cut global oil production, which will improve the profile of oil income in
Bolivia.
Fiscal Policy
Bolivia will incur in fiscal deficits in the near future. Nevertheless, the projected fiscal deficit
must be analyzed considering its composition and its relation with PDES 2016–2020. Public
investment is the main component of public expenditure and it obviously includes
investments in State Owned Enterprises (SOEs)—particularly in hydrocarbons, electricity,
and industry—as well as public works by the Bolivian Road Agency and by sub-national
entities such as municipalities and regional governments. The Central Administration’s
deficit was only 0.9 percent of GDP in 2015. Therefore, the presence of higher fiscal deficits

3
is of temporary nature, given the objective of achieving a higher potential for the economy
going forward.
The staff’s pessimistic medium-term fiscal deficit forecasts do not include revenues from
diversification envisaged in the PDES—especially from industrialization in energy and
mining sectors. Non-financial Public Sector (NFPS) current expenditure increased
moderately in the period 2005–2015 due to the startup of some SOEs, while Central
Government current expenditure remained almost constant as it reached 16.3 percent of GDP
in 2015, similar to 16.2 percent recorded in 2005.
Regarding the consequences of falling oil revenues for sub-national administrations, it is
important to remark that these entities apply automatic adjustments when their revenues
decrease. Moreover, resources coming from hydrocarbon royalties and taxes have to be
dedicated to investment. As for municipalities, they can offset hydrocarbon-related revenues
fall with the current tax sharing schemes financed by domestic tax collection and
accumulated savings in their accounts.
Execution capacity for public investment has continued to improve since 2009, albeit some
setbacks at the subnational level in 2014 due mainly to the electoral process. The National
Government has put in place the new State Integral Planning System in early 2016 aiming to
better coordinate among regional and local plans within the PDES framework, which
strengthens public investment execution capacity, and consequently the potential for
economic growth.
Public investment financing is secured as the State counts on fiscal buffers at the national and
sub-national level. In addition, international financing sources from both bilateral and
multilateral are open. Bilateral financing negotiations are underway (China and some
countries from the European Union), and Bolivia already counts with open financing
channels to multilateral financial organizations such as CAF, BID, AIF, IDA, and the World
Bank. In addition, given Bolivia’s track record, the country has no problem in tapping
international financial markets. These financial sources (whether potential or secured) have
already been considered in the PDES.
Considering SOE’s debt to the Central Bank of Bolivia (CBB) as part of public debt is not
appropriate, since intra-government debt does not affect public debt sustainability; otherwise,
SOE deposits in the CBB should be subtracted for consistency. In sum, concerns about public
debt in Bolivia are overstated as it is moderate and fiscal deficits are financed out of
government deposits at the CBB.
The staff emphasizes the need to reduce the non-hydrocarbon deficit as a means to advance
fiscal consolidation. The Bolivian authorities have been committed to macroeconomic
stability for a long time; indeed, they have applied a sound fiscal policy during the last 10

4
years, building up substantial fiscal buffers. Their commitment remains unchanged.
However, at this juncture there is a need to strengthen the resilience of the economy by
pursuing public investment in a sustained way. In the authorities’ view, this could be
afforded without compromising macroeconomic stability, gains in potential growth or
improvements in fighting poverty thanks to the fiscal buffers built before. Moreover, as
underscored earlier, the fiscal deficit is of temporary nature.
As for revenue policy, the staff suggests to introduce bold tax measures, which are not
suitable for the Bolivian economy as they may affect macroeconomic stability and be
counterproductive for growth. At the subnational level, provisions of the Autonomy Law and
the Constitution allow subnational administrations to apply tax policies according to their
competences, which have already been exercised in several municipalities. Additional excise
tax on hydrocarbons consumptions cannot be applied because the current Hydrocarbon
Direct Tax, Special Hydrocarbon Tax and Value Added Tax covers the whole spectrum of
hydrocarbon production and commercialization. As for tax policy on electricity consumption,
the staff’s proposal could hamper the goal of ensuring that electricity coverage reach every
household in the country. To boost fiscal revenue, the authorities are committed to
continuously improve the efficiency of the tax-collecting agencies dealing with customs and
domestic taxes. They also intend to diminish the share of oil revenues in fiscal revenue
through higher diversification of economic activity both for domestic and exporting sectors.
Exchange Rate and Competitiveness
Raw materials (hydrocarbons and minerals) are an important part of Bolivia’s exports. High
export prices have compounded the concentration of Bolivia’s export basket in raw material.
This is not a new issue to Bolivia and therefore it is not explained by the recent appreciation
of its domestic currency. In the same vein, measuring the Boliviano appreciation requires a
more careful approach regarding the chosen period. If the evaluation period was February
2009–September 2016, the outcome would show an appreciation less than half of what the
staff estimated. Wage increases for productivity analysis should consider not only the pace
but also the level and the departing point.
As noted above, the staff and the authorities have different views regarding the exchange
rate. The staff has advocated in the last ten years for greater exchange rate flexibility even
when devaluation expectations would have been exacerbated, reversing de-dollarization and
leading to loses in international reserves, contrary to the staff and the authorities’ objectives.
While in several occasions the staff has acknowledged those unwanted effects, it has
expressed that they would be short-lived and would eventually turn favorable (in the long-
term). The authorities could not support staff’s recommendations as they were not persuaded
by staff’s long-term projections.

5
The authorities have had frank discussion with Management and the Western Hemisphere
Department on recommendations about the exchange rate policy. In those discussions, the
authorities noted that differences on this issue are market sensitive and should not be included
in Article IV staff reports. The staff was told that devaluation expectations in Bolivia are easily
formed and they are tremendously damaging to de-dollarization and international reserves, as
observed in 2008 and 2009. The Bolivian authorities extensively explained their exchange rate
policy, its consistency with the overall economic policy, as well as the negative effects that an
estimation about a possible exchange rate appreciation would cause on expectations. They find
that staff’s recommendation is not properly justified and that it is regrettable that staff insists in
laying down a value for the Boliviano in the report.
The ample range of the real exchange rate appreciation pointed out by the staff illustrates how
imprecise such estimation could be since the outcome is sensible to the type of method, the
chosen period and data from other countries included in the evaluation. CBB estimations using
the staff’s method shows that the real effective exchange rate is in accordance with its
fundamentals. Real appreciation since January 2010 is 31.3 percent as opposed to 49 percent
calculated by the staff (even inflation data for neighboring countries could be downward
biased). If the chosen period was December 2015–September 2016, there would be a 4 percent
real depreciation. In the authorities’ view, the staff should have explained why it chose such
period when there was a pronounced depreciation in the period immediately before.
As noted before, Bolivia’s limited export basket is not a consequence of the exchange rate
policy, but reflects a structural condition of a country rich in natural resources and highly
efficient in producing raw materials. Moreover, export diversification was greater during the
exchange rate stability period than during depreciation periods.
It is not accurate to measure competitiveness using only nominal or real exchange rate
developments. Since 2008, the Global Economic Forum abandoned it as an indicator of
competitiveness. In the same token, the 2016–2017 Global Competitiveness Report mentions
that many countries did not increase exports even though they depreciated their currencies,
and export elasticity to exchange rate would have decreased.
In recent months, pressures on the exchange rate market in Bolivia were subdued while
inflation is currently low and expectations are anchored, backing the expansionary monetary
policy. The stable exchange rate confers confidence to the economic agents.
Wages in Bolivia are among the lowest in the region, and wage increases aim to reach the
lower wage brackets in order to reduce inequality and strengthen domestic demand,
enhancing the output base and domestic market. Wage increase policy has not affected costs
across the board as attested by price stability. For productivity analysis, wage increases
should consider not only the pace but also the departing low base. Reducing inequality
should not be questioned.

6
Central Bank Independence
Credit from CBB to SOEs—which does not finance current expenditure—does not
compromise price stability, as disbursements are fully considered in the financial program.
As for CBB’s independence advocated by the IMF, there are cases that illustrate that central
bank independence led to unwanted outcomes, such as periods of high inflation and rising
interest rates coinciding with growth deceleration. These pro-cyclical policies affected their
economies. In the authorities’ views, benefits from policy coordination outweigh costs and
better suit Bolivia. The authorities believe that on this issue the staff’s recommendations do
not appropriately ponder countries’ idiosyncrasies.
Central Banks normally incur in losses due to low yields in reserves and high costs for their
monetary liabilities; however, CBB is having positive net income because interest rates for
loans to SOEs are higher than yields on international reserves, and even higher than
monetary policy operations (policy rates are close to zero). Therefore, net assets with NFPS
and the financial system yield positively to CBB. Forecasting an unfavorable scenario
because of credit to SOEs is not justifiable.
External Sector
The industrialization process requires capital and intermediate goods imports which are the
main driver of the current account deficits (they count for 80 percent of imports). Therefore,
this deficit must be put in context of the new PDES. It is important to highlight that although
exports have fallen between January–September 2016, because of lower commodity prices,
export volumes for minerals, agro industrial and industry products have increased by 10, 16,
and 20 percent, respectively.
The staff projections for net international reserves (NIR) seem downward biased given that
they only include capital projects outlays in PDES. In the same vein, the staff keeps exports
at 20.2 percent of GDP flat during 2016–2021 assuming that there would not be changes
stemming from public investment megaprojects. This is not coherent. Moreover, FDI
projections are pessimistic (only 1.8 percent flat during 2016–2021) even though—as of
September 2016—FDI doubles staff’s projection, the staff emphasizes risks coming from
losing NIR and lower domestic buffers, but it does not consider committed financing from
international investors. The deterioration of terms-of-trade projected for 2021 is inconsistent
with an increase in oil price projected by the staff for the same year.
Financial Sector
The Financial Services Law (FSL) aims to infuse greater dynamism in financial
intermediation to support economic activity and ultimately growth. Historically, financial
intermediation in Bolivia was stagnant because financial institutions were unduly risk-

7
adverse depriving vast sectors access to credit; therefore, there was high inefficiency in
financial intermediation from the economic development perspective. Contrary to the staff’s
assertion, credit growth in Bolivia is being driven by microfinance institutions. The
authorities do not see the need for quota flexibility at this time, since banking and other
financial entities do not confront difficulties to comply with them.
Conversely to what the staff is implying for the health of the financial system, Bolivia’s is
among the strongest in the region as credit portfolio as percentage of GDP is moderate and
non-performing loans (NPL) rate is low compared to historic records and for regional and
global standards, while provisions are at 100 percent. It comes to the attention of the
authorities that Article IV Reports for other countries with higher NPL rate do not question
or even comment on the matter.
The staff highlights that higher subordinated debt would be financing fast credit growth;
however, the increase in subordinated debt is marginal, given that growing deposits and
liquidity holdings are the main financing sources for credit. The FSL seeks that credit be
channeled to housing and productive sectors; however, in seeking those goals there has not
been a deterioration of credit quality, because the financial institutions continue to evaluate
repayment capacity in the same manner that they did before the approval of FSL and more
generally, Bolivia still enjoys a strong growth which creates space for credit expansion.
Based on stress tests and experiences of other countries, the staff puts forth a gloomy forecast
for the system, apparently without considering its current strong performance as a departing
point neither the appropriate regulation for banking supervision or the macroeconomic policy
outlook. It is surprising that the staff’s econometric model for NPLs does not include credit
growth as an explanatory variable, while the staff concludes that portfolio quality
deterioration would come mainly from accelerated credit growth.
The staff does not elaborate on how shocks are transmitted to banks’ balance sheets and
CAR, yet it is necessary to analyze how increases in NPLs affect credit portfolio rating,
provisions and profits (the outcome could be quite different depending on the assumptions).
The staff should also explain whether it is including or not cyclical provisions, given that
they are a cushion to shocks’ effects on net worth.
On the remaining stress test, the staff does not find systemic issues but it insists in amplifying
some vulnerabilities that would cause limited impact.
Historically, the financial system has had a low level of financial inclusion but the
supervisory authority is implementing measures to boost it, such as credit fairs and financial
education events aiming to reach 75 percent of financial services users. It is hard to
determine if FSL is producing negative effects in financial inclusion; more evidence is
needed. On disintermediation in microcredit sector, there is not sufficient evidence to make

8
such assertion given that microcredit has grown 9.6 percent so far in 2016 and small and
micro credit user’s participation rate is above 50 percent.
According to the staff, the FSL’s interest rates ceilings would not be reflecting risks and cost
of doing business in the financial sector; however, the free market would not either;
otherwise the 2008 financial crisis would have not occurred. Better access to credit following
pure market rules is not guaranteed; on the contrary, with the FSL in place there has been a
significant increase of borrowers that leads to think that previously access was not better.
Currently, the concentration risk in the Bolivian financial system has decreased, given that a
higher number of institutions are operating while solvency and liquidity risks are completely
manageable, as one can appreciate looking at the indicators coming from the stress test
performed by the staff. Hydrocarbon and mining sectors have been affected by the external
environment of lower commodity prices; though regulated credit quota has driven credit to
non-commodity related sectors, such as manufacturing (43 percent) and construction and
agriculture (23 percent).
Policies for Sustainable Economic Development
Wage policy in Bolivia has allowed to improve income distribution and, therefore, reduce
inequality; however, the authorities have carefully monitored developments in the labor
market and productivity. The United Nations Economic Commission for Latin America
(ECLAC) data shows that average wage in Bolivia is the lowest in South America. Given
wage stability in Bolivia, it would not be accurate to say that wage policy is an obstacle for
private sector and competitiveness. We reiterate that public investment is focused on
improving physical infrastructure (energy, transportation, communications), which supports
greater competitiveness for both public and private sectors.
Development of the hydrocarbons sector is still a key factor for Bolivia’s future and for
attaining a sustainable reduction in poverty levels. The authorities are aware of this and are
doing their utmost to put in place a framework of incentives for exploration and additional
production of oil and natural gas, given the potential of the hydrocarbons reserves, allowing
room for private investment. Within this framework, several foreign corporations operating
in Bolivia have announced investments in exploration ($2.3 billion) and expansion of
production capacity, amounting also $2.3 billion.
Mining is another key sector for the Bolivian economy. In addition to traditional minerals
production which is showing signs of expansion, the Government has made progress towards
industrialization of lithium. Bolivia is considered to hold half of the world’s lithium reserves
from the Salar de Uyuni located in Potosi, in the high plateau region. As for electricity, the
authorities plan to execute large projects to reach a substantial increase in generation
capacity. As a result of the impulse of public investment, the Bolivian authorities expect to

9
induce greater growth rate vis-à-vis 2016, throughout the whole economy. In this vein, the
Bolivian government attaches great importance to the diversification of the economy to
gradually reduce, in the future, the relative dependence on the hydrocarbon and mining
sectors and, consequently, lessen the economy’s vulnerability to external shocks.
The Bolivian authorities highlight the need to attain greater equality, transparency, and
accountability underpinned by cautious macroeconomic policies. Social programs will
continue to be applied and improved to provide better living conditions particularly for the
poor. Slight lower growth in the last 2 years has not put at risk the progress achieved in the
fight against poverty. All social programs have been designed pursuing their sustainability as
the Bolivian authorities consider paramount to finance the improvement of education, health,
and sanitation that will help reduce poverty and inequality.
In concluding, the overall performance of Bolivia’s economy in recent years is deeply rooted
in its macroeconomic and development policies. Social inclusion has reigned in the policy
agenda and will remain a key pillar of the government economic strategy. The current
administration is fully committed on the same path of fiscal discipline and pro-poor and pro-
growth development policies. Brighter economic prospects will lie ahead.