deloitte mobile consumer report uk 2016
TRANSCRIPT
There’s no place like phone Consumer usage patterns in the era of peak smartphoneGlobal Mobile Consumer Survey 2016: UK Cut
Contents
Foreword 01
Better living with smartphones 04
Prints charming: the silent rise of the fingerprint reader 12
The Internet of Things: most entertaining 18
The smartphone approaches a perfect peak 26
Gearing up for gigabit mobile speeds 33
A day in the life of a smartphone... 36
Call me maybe? Not. 41
Apps versus browsers 48
Tablets: From optimal to optional 54
About the research 60
Relevant thought leadership 61
Endnotes 62
Contacts 69
In this publication, references to Deloitte are references to Deloitte LLP, the UK member firm of DTTL
Welcome to the 2016 edition of Deloitte’s mobile consumer survey.
This year’s report will likely mark the end of the smartphone growth era, and the start of its consolidation. A mere nine years after the launch of the first full touchscreen smartphone, adoption is nearing a plateau, at 81 per cent of UK adults, and 91 per cent of 18–44 year olds.
The smartphone user base is approaching an unprecedented peak. No other personal device has had the same commercial and societal impact as the smartphone, and no other current device seems likely to.
While the base may plateau, relentless innovation continues at device and network levels. Devices are likely to incorporate more functionality and get even faster.
Biometric sensors, particularly fingerprint readers (this year’s cover image), are likely to see widespread adoption. Over a quarter of smartphones now have a fingerprint reader, of which three quarters are in use.
The majority of phones are now connected to 4G, and cellular networks are getting ever faster, with headline speeds now at over 300 Mbit/s.1 As speeds rise, ever more latent, high bandwidth applications become viable. It is now as easy to read the news on a phone as it is to live stream a breaking news event from a smartphone.
Businesses and consumers are still determining how best to use these devices. For the former, a common dilemma is over whether to use apps or websites. The typical UK user downloads 20 or fewer apps. Our research suggests that apps are not the right approach for every business.
Consumers, who collectively look at their smartphones 0.4 trillion times per year,2 still need to identify how to use their devices in a balanced way, at a level that suits them, their other halves and colleagues. It is the sleek digital Swiss army knife that can be used at every stage of the day (as shown in the centrefold graphic).
How people will use their devices to communicate will be driven by consumers. The traditional voice call has become steadily less popular over the last four years, and usage of email, social networks and instant messaging has risen in tandem.
Foreword
01
There's no place like phone | Global Mobile Consumer Survey 2016: UK Cut

The smartphone’s success has overshadowed the performance of other devices, including tablets. Two thirds of adults in the UK now have access to a tablet, yet this triumph pales compared to uptake of smartphones. Adoption of a wide range of connected devices, including fitness bands, smart home appliances, smart lighting and smart watches appears lacklustre by comparison at under ten per cent.
The era of smartphone growth is drawing to a close; consolidation will be an exciting time.
It’s 2016 and there’s no place like home, or indeed the home screen of one’s smartphone. And in the coming years, the smartphone is likely to further reinforce its position at the centre of tens of millions of UK citizens’ lives.
We hope that you find this set of insights useful, and we welcome further conversations based on the content or full data sets.
Ed MarsdenUK Head of TelecommunicationsDeloitte LLP
Paul LeeHead of Technology, Media & Telecommunications ResearchDeloitte LLP
02
There's no place like phone | Global Mobile Consumer Survey 2016: UK Cut

03

In a mere nine years the smartphone has had a massive impact on UK society. Collectively, UK citizens look at their smartphones over a billion times a day.3
Four out of five adults now have one. Among 18-44 year olds, adoption is higher still at 91 per cent – equivalent to 21 million people.4 For the majority of smartphone owners, it has become their ever-present companion. It is useful and entertaining. It is functional and ostentatious. It enables creativity and consumption. It fosters productivity – and offers distraction.
Smartphones are personal, but their usage impacts on those around them. As with most emerging technologies, consumers will need to learn how best to run their lives with smartphones, as opposed to having their lives run by their devices.
A day in the age of the smartphoneA tenth of smartphone owners instinctively reach for their phones as soon as they wake up – and not just to turn off their alarm. A third reach for their phones within five minutes of waking, and half (equivalent to 23 million UK adults) within a quarter of an hour (see Figure 1).5
Figure 1. Interval between waking up and checking smartphone (%)Question. Typically how long is the interval between waking up and looking at your phone for the first time?
Weighted base: Respondents who own or have access to a smartphone (3,251)Source: UK edition, Deloitte Global Mobile Consumer Survey, May-Jun 2016
Immediately 10%
Within 5 minutes
Within 15 minutes
Within 30 minutes
Within an hour
Within 2-3 hours
Longer than 3 hours
33%
52%
69%
86%
93%
97%
Better living with smartphones
04
There's no place like phone | Global Mobile Consumer Survey 2016: UK Cut
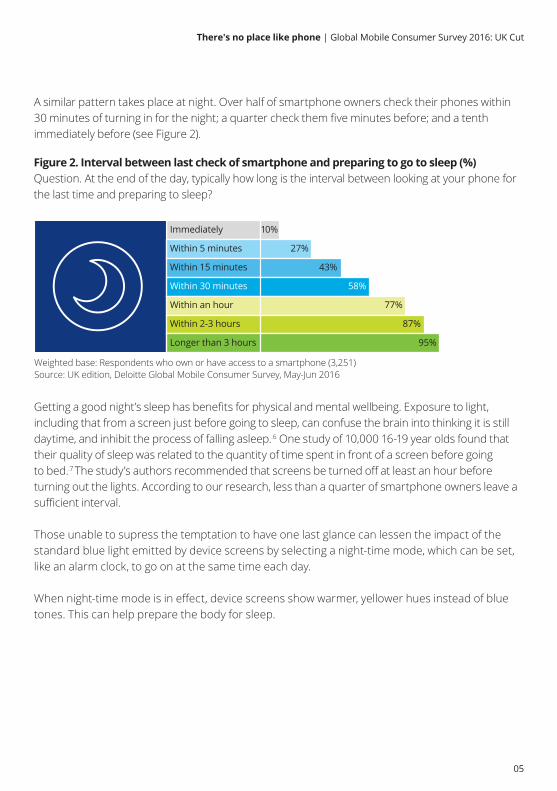
A similar pattern takes place at night. Over half of smartphone owners check their phones within 30 minutes of turning in for the night; a quarter check them five minutes before; and a tenth immediately before (see Figure 2).
Getting a good night’s sleep has benefits for physical and mental wellbeing. Exposure to light, including that from a screen just before going to sleep, can confuse the brain into thinking it is still daytime, and inhibit the process of falling asleep..6 One study of 10,000 16-19 year olds found that their quality of sleep was related to the quantity of time spent in front of a screen before going to bed..7 The study’s authors recommended that screens be turned off at least an hour before turning out the lights. According to our research, less than a quarter of smartphone owners leave a sufficient interval.
Those unable to supress the temptation to have one last glance can lessen the impact of the standard blue light emitted by device screens by selecting a night-time mode, which can be set, like an alarm clock, to go on at the same time each day.
When night-time mode is in effect, device screens show warmer, yellower hues instead of blue tones. This can help prepare the body for sleep.
Figure 2. Interval between last check of smartphone and preparing to go to sleep (%)Question. At the end of the day, typically how long is the interval between looking at your phone for the last time and preparing to sleep?
Weighted base: Respondents who own or have access to a smartphone (3,251)Source: UK edition, Deloitte Global Mobile Consumer Survey, May-Jun 2016
Immediately 10%
Within 5 minutes
Within 15 minutes
Within 30 minutes
Within an hour
Within 2-3 hours
Longer than 3 hours
27%
43%
58%
77%
87%
95%
05
There's no place like phone | Global Mobile Consumer Survey 2016: UK Cut
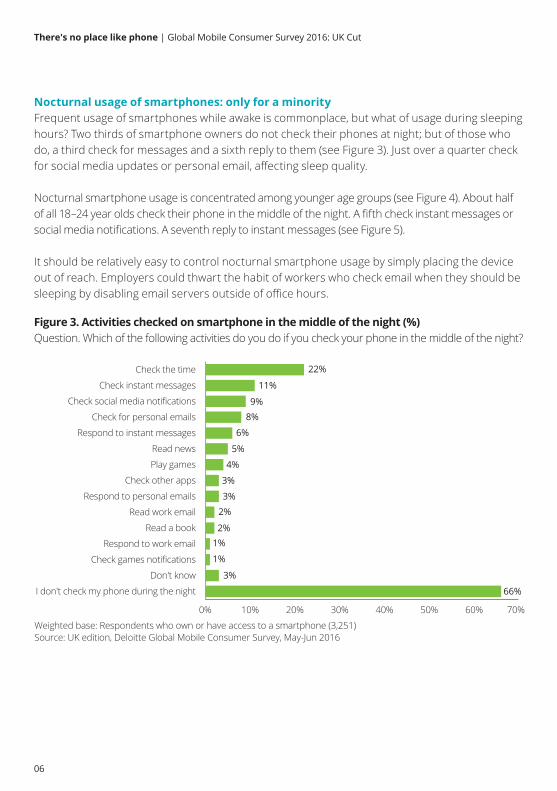
Nocturnal usage of smartphones: only for a minorityFrequent usage of smartphones while awake is commonplace, but what of usage during sleeping hours? Two thirds of smartphone owners do not check their phones at night; but of those who do, a third check for messages and a sixth reply to them (see Figure 3). Just over a quarter check for social media updates or personal email, affecting sleep quality.
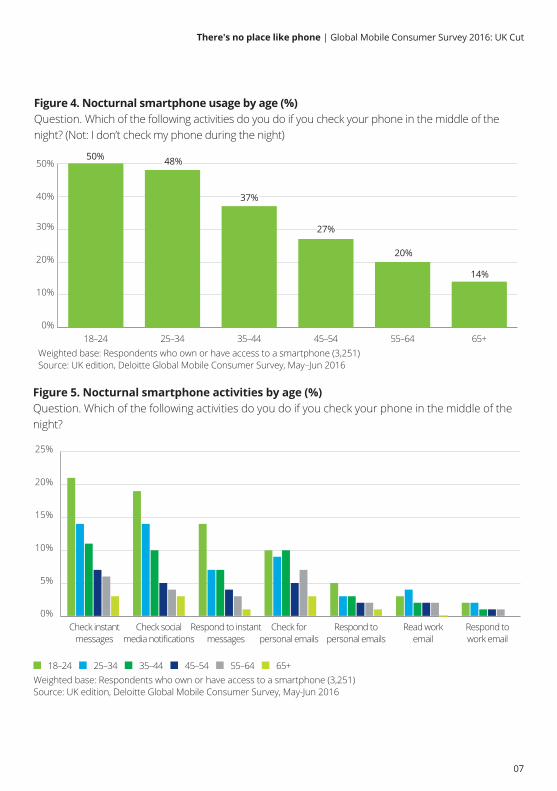
Nocturnal smartphone usage is concentrated among younger age groups (see Figure 4). About half of all 18–24 year olds check their phone in the middle of the night. A fifth check instant messages or social media notifications. A seventh reply to instant messages (see Figure 5).
It should be relatively easy to control nocturnal smartphone usage by simply placing the device out of reach. Employers could thwart the habit of workers who check email when they should be sleeping by disabling email servers outside of office hours.
I don't check my phone during the night
Don't know
Check games notifications
Respond to work email
Read a book
Read work email
Respond to personal emails
Check other apps
Play games
Read news
Respond to instant messages
Check for personal emails
Check social media notifications
Check instant messages
Check the time
0% 10% 20% 30% 40% 50% 60% 70%
Figure 3. Activities checked on smartphone in the middle of the night (%)Question. Which of the following activities do you do if you check your phone in the middle of the night?
11%
9%8%
6%
5%
4%
3%
3%
2%
2%1%
1%
3%
66%
22%
Weighted base: Respondents who own or have access to a smartphone (3,251)Source: UK edition, Deloitte Global Mobile Consumer Survey, May-Jun 2016
06
There's no place like phone | Global Mobile Consumer Survey 2016: UK Cut
0%
10%
20%
30%
40%
50%
65+55–6445–5435–4425–3418–24
Figure 4. Nocturnal smartphone usage by age (%)Question. Which of the following activities do you do if you check your phone in the middle of the night? (Not: I don’t check my phone during the night)
Weighted base: Respondents who own or have access to a smartphone (3,251)Source: UK edition, Deloitte Global Mobile Consumer Survey, May–Jun 2016
37%
27%
20%
14%
50% 48%
37%
27%
20%
14%
50% 48%
Figure 5. Nocturnal smartphone activities by age (%) Question. Which of the following activities do you do if you check your phone in the middle of the night?
Weighted base: Respondents who own or have access to a smartphone (3,251)Source: UK edition, Deloitte Global Mobile Consumer Survey, May-Jun 2016
18–24 25–34 35–44 45–54 55–64 65+
0%
5%
10%
15%
20%
25%
Respond towork email
Read workemail
Respond topersonal emails
Check forpersonal emails
Respond to instantmessages
Check socialmedia notifications
Check instantmessages
07
There's no place like phone | Global Mobile Consumer Survey 2016: UK Cut

When usage verges on the intrusiveSmartphones can enhance social lives, but overuse can be perceived as anti-social, and cause arguments. During the day, 18-24 year olds are among the most enthusiastic of smartphone users. A third use their devices ‘always’ or ‘very often’ when meeting friends, shopping or watching television. Over a tenth use their phones ‘always’ or ‘very often’ when eating at home, or eating out (see Figure 6).
Figure 6. Usage of smartphones while doing other activitiesQuestion. How often, if at all, do you use your mobile phone while doing the following?
Note: The ‘Intensity of usage’ axis and size of the bubbles represent a weighted average for the indexed frequency with those that ‘always’ do that activity rated 1 and those that ‘never’ do the activity rated 0. The ‘Intrusiveness’ axis shows how intrusive the phone is for each activityWeighted base: Respondents who own or have access to a smartphone (3,251)Source: UK edition, Deloitte Global Mobile Consumer Survey, May–Jun 2016
Watching TV/a film
Driving
Eating in a restaurant with family/friends
Using public transport
Spending time with family/friends
Meeting friends on a night out
Talking to family/friends
Eating at home with family/friends
While out shopping
In a business meeting
At work
Walking
Crossing the road
0%
10%
20%
30%
40%
50%
60%
0 1 2 3 4 5
Inte
nsity
of u
sage
IntrusivenessLow High
High
Low
08
There's no place like phone | Global Mobile Consumer Survey 2016: UK Cut
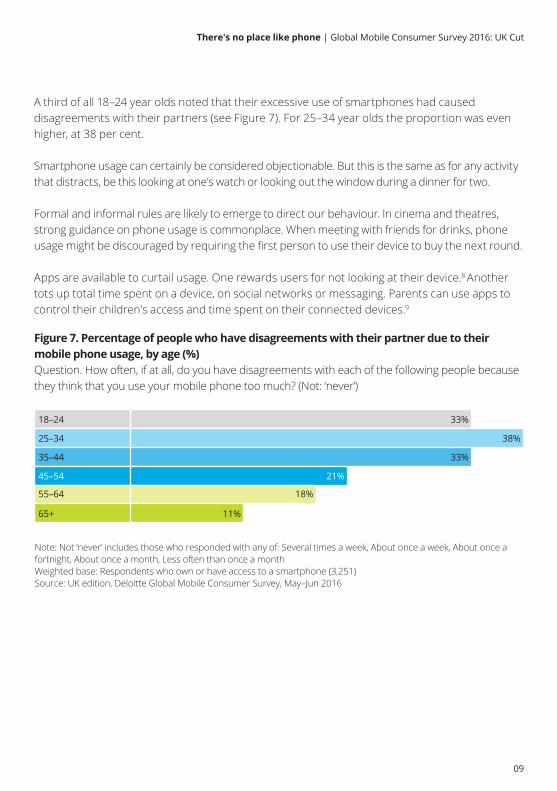
A third of all 18–24 year olds noted that their excessive use of smartphones had caused disagreements with their partners (see Figure 7). For 25–34 year olds the proportion was even higher, at 38 per cent.
Smartphone usage can certainly be considered objectionable. But this is the same as for any activity that distracts, be this looking at one’s watch or looking out the window during a dinner for two.
Formal and informal rules are likely to emerge to direct our behaviour. In cinema and theatres, strong guidance on phone usage is commonplace. When meeting with friends for drinks, phone usage might be discouraged by requiring the first person to use their device to buy the next round.
Apps are available to curtail usage. One rewards users for not looking at their device.8 Another tots up total time spent on a device, on social networks or messaging. Parents can use apps to control their children’s access and time spent on their connected devices.9
Figure 7. Percentage of people who have disagreements with their partner due to their mobile phone usage, by age (%)Question. How often, if at all, do you have disagreements with each of the following people because they think that you use your mobile phone too much? (Not: ‘never’)
Note: Not ‘never’ includes those who responded with any of: Several times a week, About once a week, About once a fortnight, About once a month, Less often than once a monthWeighted base: Respondents who own or have access to a smartphone (3,251)Source: UK edition, Deloitte Global Mobile Consumer Survey, May–Jun 2016
18–24 33%
25–34
35–44
45–54
55–64
65+
38%
33%
21%
18%
11%
09
There's no place like phone | Global Mobile Consumer Survey 2016: UK Cut
Bottom line: living can be better with smartphones The debate over whether smartphones are good for society may never cease, much as discussions continue to simmer over whether television (a disruptor over 70 years ago) is a net positive.
The reality is that most technologies are a double-edged sword. The smartphone is no exception. It can increment productivity, as well as diminish it. It can be used to communicate more and better, as well as misinform. It can help us share moments from our lives with friends, and occasionally over-share.
It can deliver regular doses of social updates, messages, news, photos, special offers, cat GIFs, games and more. For some this would add colour to an otherwise dull day and could enliven an otherwise dreary commute. Others might consider it hellish.
Humans repeat actions that make them happy. For some, happiness is chocolate spread, and they are likely to have this again on another day to relive the enjoyment. Contentment can also be derived from positive reactions to a post on social media or a message from a friend thousands of miles away. For that reason, people who get enjoyment this way will likely increase their propensity to engage with their smartphones.
Smartphones are here for good, for better and worse. UK citizens are unlikely to revert to feature phones. Public displays of smartphone abandonment, whether by public figures or individuals, are unlikely to be permanent.
For the vast majority of people, the smartphone’s pros outweigh the cons. And the pluses are likely to grow over time. It may be in only a few years’ time that people are being reminded of happy moments captured in photos and videos taken in 2016. They will then appreciate the benefit of having taken thousands of photos and videos each year, and of having had a 256 gigabyte (GB) phone memory to keep them on.
10
There's no place like phone | Global Mobile Consumer Survey 2016: UK Cut
11
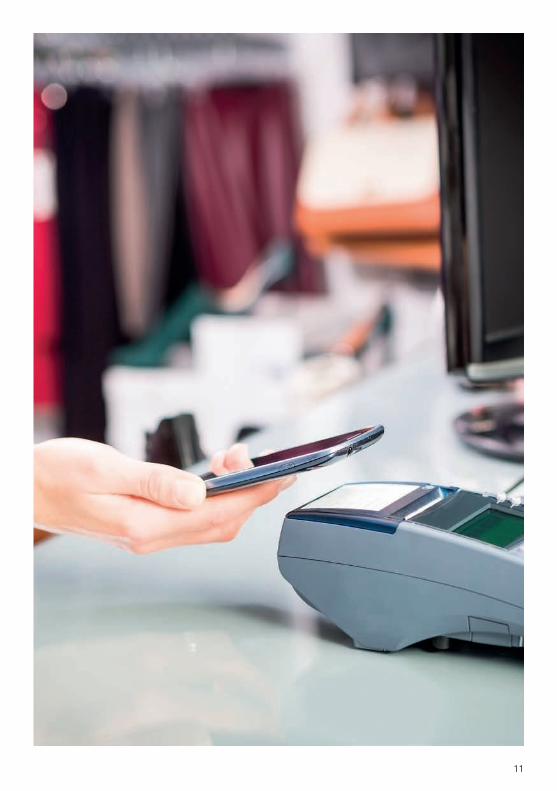
Thousands of years ago, the citizens of Ancient Babylon imprinted their fingerprints into clay tablets to authenticate transactions. Today the problem of authentication remains and a multiplicity of passwords have become an awkward part of everyday life. That’s why the fingerprint is making a comeback.
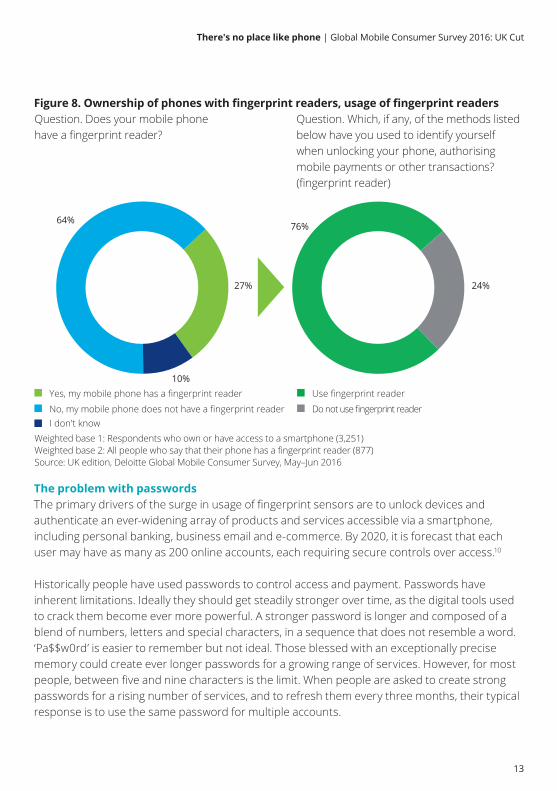
The rise of the fingerprint reader has been rapid. In September 2013, few devices had one. By mid-2016, 27 per cent of smartphone owners were aware their phone had a fingerprint reader and 76 per cent of those who were aware of it used it (see Figure 8). Therefore about a fifth of all smartphone owners in the UK are now using their fingerprints for a range of authentication-based applications, from unlocking their phones to authorising transactions.
Over the next few years we expect usage of fingerprint readers to increase markedly as they are incorporated in mid-range smartphone models, as well as premium ones. As the base of reader-equipped phones increases, a growing number of apps and websites will likely support fingerprint reader access.
Prints charming: the silent rise of the fingerprint reader
12
There's no place like phone | Global Mobile Consumer Survey 2016: UK Cut
The problem with passwords The primary drivers of the surge in usage of fingerprint sensors are to unlock devices and authenticate an ever-widening array of products and services accessible via a smartphone, including personal banking, business email and e-commerce. By 2020, it is forecast that each user may have as many as 200 online accounts, each requiring secure controls over access.10
Historically people have used passwords to control access and payment. Passwords have inherent limitations. Ideally they should get steadily stronger over time, as the digital tools used to crack them become ever more powerful. A stronger password is longer and composed of a blend of numbers, letters and special characters, in a sequence that does not resemble a word. ‘Pa$$w0rd’ is easier to remember but not ideal. Those blessed with an exceptionally precise memory could create ever longer passwords for a growing range of services. However, for most people, between five and nine characters is the limit. When people are asked to create strong passwords for a rising number of services, and to refresh them every three months, their typical response is to use the same password for multiple accounts.
Figure 8. Ownership of phones with fingerprint readers, usage of fingerprint readers Question. Which, if any, of the methods listed below have you used to identify yourself when unlocking your phone, authorising mobile payments or other transactions? (fingerprint reader)
Question. Does your mobile phone have a fingerprint reader?
Weighted base 1: Respondents who own or have access to a smartphone (3,251)Weighted base 2: All people who say that their phone has a fingerprint reader (877)Source: UK edition, Deloitte Global Mobile Consumer Survey, May–Jun 2016
No, my mobile phone does not have a fingerprint reader
27%
10%
64%
Yes, my mobile phone has a fingerprint reader
Do not use fingerprint reader
76%
24%
Use fingerprint reader
I don't know
13
There's no place like phone | Global Mobile Consumer Survey 2016: UK Cut
Entering a strong password on a full sized keyboard is hard but it can be notably more challenging when using a smartphone’s touchscreen. The user may need to switch between the device’s alphabetic and numerical keyboards and toggle between upper and lower case. Entering complex passwords while walking or in a moving vehicle is liable to cause errors – and mistakes can mean the user is locked out from the service.
In stark contrast, access using a fingerprint reader requires a single tap. With more recent models of smartphone, the time taken to read the fingerprint is imperceptible.
The rise of biometrics in the smartphoneThe fingerprint is one of a set of biometric identifiers that can be used as a password substitute. On smartphones it has proven by far the most popular. It is fast, less subject to ambient conditions and inconspicuous. The fingerprint sensor matches the applied print to images stored securely on the device.
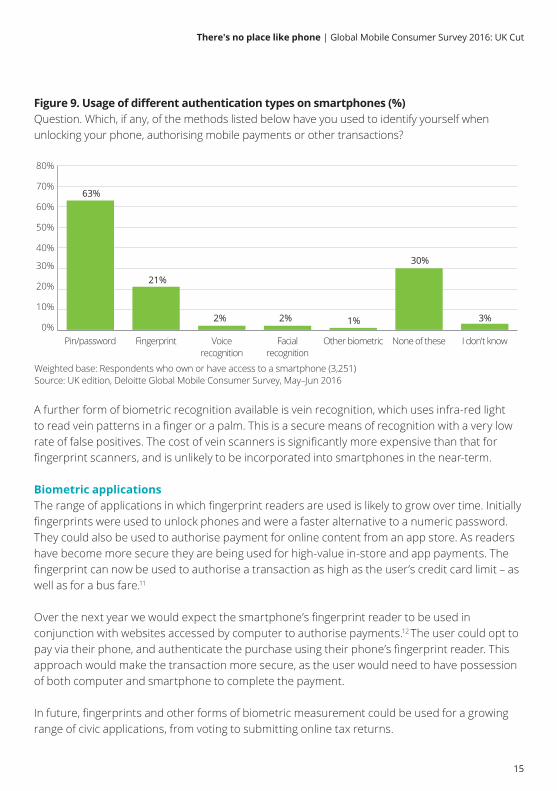
By contrast, voice recognition may not work when used in a noisy area and may be distracting when used in the company of friends or colleagues. Facial recognition requires similar lighting conditions to those in which the reference images were taken; if not, false negatives are likely. According to our research, only two per cent of smartphone owners have used either voice or facial recognition on their smartphones to unlock their phone or authorise a mobile payment or another transaction (see Figure 9).
One other biometric identifier is iris recognition, which was not surveyed in this year’s research as only a few smartphones support this functionality. We would expect take up to be constrained by the precision required when scanning the iris. For example, the device always needs to be held at the same distance from the eye. However, some users may find it quicker to use an iris scanner in the winter than to take their gloves off.
14
There's no place like phone | Global Mobile Consumer Survey 2016: UK Cut
Weighted base: Respondents who own or have access to a smartphone (3,251)Source: UK edition, Deloitte Global Mobile Consumer Survey, May–Jun 2016
0%
10%
20%
30%
40%
50%
60%
70%
80%
I don't knowNone of theseOther biometricFacialrecognition
Voicerecognition
FingerprintPin/password
Figure 9. Usage of different authentication types on smartphones (%)Question. Which, if any, of the methods listed below have you used to identify yourself when unlocking your phone, authorising mobile payments or other transactions?
2% 2%
30%
1% 3%
63%
21%
A further form of biometric recognition available is vein recognition, which uses infra-red light to read vein patterns in a finger or a palm. This is a secure means of recognition with a very low rate of false positives. The cost of vein scanners is significantly more expensive than that for fingerprint scanners, and is unlikely to be incorporated into smartphones in the near-term.
Biometric applications The range of applications in which fingerprint readers are used is likely to grow over time. Initially fingerprints were used to unlock phones and were a faster alternative to a numeric password. They could also be used to authorise payment for online content from an app store. As readers have become more secure they are being used for high-value in-store and app payments. The fingerprint can now be used to authorise a transaction as high as the user’s credit card limit – as well as for a bus fare.11
Over the next year we would expect the smartphone’s fingerprint reader to be used in conjunction with websites accessed by computer to authorise payments.12 The user could opt to pay via their phone, and authenticate the purchase using their phone’s fingerprint reader. This approach would make the transaction more secure, as the user would need to have possession of both computer and smartphone to complete the payment.
In future, fingerprints and other forms of biometric measurement could be used for a growing range of civic applications, from voting to submitting online tax returns.
15
There's no place like phone | Global Mobile Consumer Survey 2016: UK Cut
The fallibility of the fingerprint For all its evident merits, the fingerprint reader is not infallible. It is possible – albeit increasingly difficult – to make copies of a fingerprint. Earlier readers are more susceptible to spoofing.13 But readers are becoming more sophisticated and harder to fool as they capture a more detailed image of the original fingerprint.14 The latest fingerprint readers can readily differentiate between a real finger and a copy of one.
Another potential problem is that in humid or wet conditions, water on the surface of the finger may inhibit the sensor, increasing the likelihood of false negatives; and in winter, users may not want to remove their gloves. But these are minor inconveniences compared to the task of entering a complex password.
Bottom line: the fingerprint is the futureWe expect ownership of fingerprint readers to continue increasing rapidly. Many millions of people are likely to acquire a handset with a fingerprint reader over the coming year (either as a new or second-hand phone) and some people who currently have a fingerprint reader may start using it, as more apps offer this functionality.
Shopping is likely to be one of the key applications to adopt fingerprint readers over the coming year. The fingerprint reader can be used to authenticate transactions instantly and supply shipping address data stored on the phone.
Multiple biometric and other data generated by smartphones are likely to be combined to generate ever more secure transactions. Location information can be used as an input, as can one’s gait. A request to make a significant bank transfer payment in a location in which the phone has never previously been used could trigger a phone call to authenticate the user, and this latter step could be accomplished via voice recognition.
16
There's no place like phone | Global Mobile Consumer Survey 2016: UK Cut

17
The Internet of Things: most entertaining A common vision of an Internet of Things (IoT) world, as often portrayed at industry gatherings and in business journals, is of a superior today. With ubiquitous IoT devices, people will consume less energy, because of smart thermostats and light bulbs. They will be better connected and more informed, thanks to smart watches. They will be in better shape, thanks to fitness devices. They will be safer, courtesy of smart security cameras and tracking wearables. They will never run out of milk, because of connected fridges, and their dinners will always turn out perfectly, as they can watch their roasts roasting remotely as they plan their hourly energy consumption for the coming week, whilst speed walking.
This may seem like a distant, idealised future, available only once such products become available. But all these devices are on sale, and in some cases have been for years. Yet for many, demand appears lacklustre.
IoT has not yet connected with the UK consumerThe connected-self category of IoT, which involves fitness bands and smart watches, has enjoyed a doubling in adoption over the past year, but despite this neither device yet boasts penetration into double figures. Just nine per cent of UK adults own a fitness band,15 and only four per cent have a smart watch (see Figure 10). This is particularly low when compared to the 81 per cent smartphone penetration.
18
There's no place like phone | Global Mobile Consumer Survey 2016: UK Cut

Figure 10. Adoption of IoT devices, by category and product, 2015-2016 (%)Question. Which, if any, of the following devices do you own or have ready access to?
Weighted base (2015/2016): All respondents (4,000/4,003)Source: UK edition, Deloitte Global Mobile Consumer Survey: May–Jun 2015, May–Jun 2016
28%
0%
5%
10%
15%
20%
25%
30%
2015 2016
Smartlightingsystems
Smartthermostat
Smarthome
appliance
Surveillancesecuritysystem
Connectedcar
system
Smartwatch
Fitnessband
TV videostreaming
device
Wirelessspeaker
SmartTV
Gamesconsole
Connected entertainment Connected self Connected home
24%
9%10%8%
11%
4%
9%
2%4%
2% 2% 2% 2% 2%2% 3%3% 3% 3%
29%
26%24%
9%10%8%
11%
4%
9%
2%4%
2% 2% 2% 2% 2%2% 3%3% 3% 3%
29%
26%
In the connected home category, the smart thermostat has had the standout performance over the last year: adoption has surged, albeit from a mere two to a (slightly less mere) three per cent.
Overall, ownership of connected home devices has barely changed since 2015. Smart lights and smart appliances remain at two per cent of adults; connected surveillance systems at three per cent.
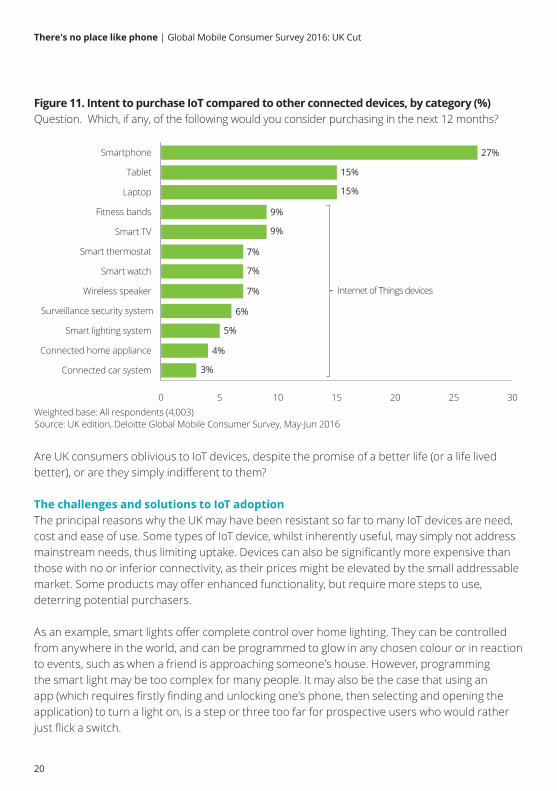
Many of these types of device are not new. Fitness tracking smartwatches went on sale a quarter of a century ago;16 the first connected fridge 15 years ago.17 These products have been relatively niche since launch, and are unlikely to experience a surge in demand over the next year, based on stated purchase intent (see Figure 11).
19
There's no place like phone | Global Mobile Consumer Survey 2016: UK Cut
Connected car system
Connected home appliance
Smart lighting system
Surveillance security system
Wireless speaker
Smart watch
Smart thermostat
Smart TV
Fitness bands
Laptop
Tablet
Smartphone
0 5 10 15 20 25 30
Figure 11. Intent to purchase IoT compared to other connected devices, by category (%)Question. Which, if any, of the following would you consider purchasing in the next 12 months?
15%
15%
9%
9%
7%
7%
7%
6%
5%
4%
3%
27%
Weighted base: All respondents (4,003)Source: UK edition, Deloitte Global Mobile Consumer Survey, May-Jun 2016
Internet of Things devices
Are UK consumers oblivious to IoT devices, despite the promise of a better life (or a life lived better), or are they simply indifferent to them?
The challenges and solutions to IoT adoption The principal reasons why the UK may have been resistant so far to many IoT devices are need, cost and ease of use. Some types of IoT device, whilst inherently useful, may simply not address mainstream needs, thus limiting uptake. Devices can also be significantly more expensive than those with no or inferior connectivity, as their prices might be elevated by the small addressable market. Some products may offer enhanced functionality, but require more steps to use, deterring potential purchasers. As an example, smart lights offer complete control over home lighting. They can be controlled from anywhere in the world, and can be programmed to glow in any chosen colour or in reaction to events, such as when a friend is approaching someone’s house. However, programming the smart light may be too complex for many people. It may also be the case that using an app (which requires firstly finding and unlocking one’s phone, then selecting and opening the application) to turn a light on, is a step or three too far for prospective users who would rather just flick a switch.
20
There's no place like phone | Global Mobile Consumer Survey 2016: UK Cut
Fitness bands, which are owned by nine per cent of respondents, may also have limited appeal: while getting fit may be a mainstream need, measuring one’s lack of fitness may be off-putting, and the sharing of this data even less appealing.18
The current IoT winner is the category no one talks about The connected entertainment category is often overlooked in discussions about IoT. It is rarely referred to at industry conferences, even though the devices we use to entertain ourselves via video or audio increasingly incorporate IP addresses, and are programmed to send and receive data without human intervention. Using this definition they are as much a part of the IoT revolution as smart thermostats.
Connected entertainment has enjoyed mainstream adoption and is growing in popularity. Games consoles, for example, are owned by or accessible to a quarter of UK adults, and have had in-built connectivity for over a decade. Consoles incorporate features such as automated software updates, online contests with opponents of a similar capability and automatic uploading of machine failure reports to the manufacturer.
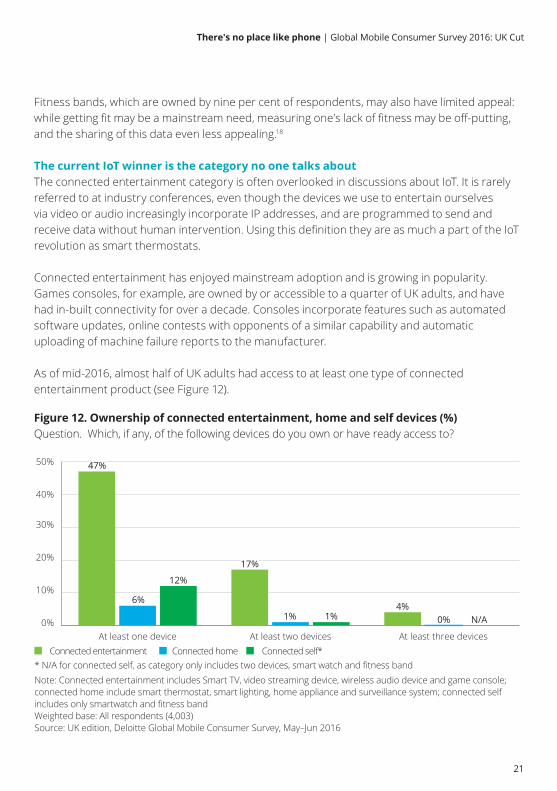
As of mid-2016, almost half of UK adults had access to at least one type of connected entertainment product (see Figure 12).
Figure 12. Ownership of connected entertainment, home and self devices (%) Question. Which, if any, of the following devices do you own or have ready access to?
xx
* N/A for connected self, as category only includes two devices, smart watch and fitness bandConnected entertainment
Note: Connected entertainment includes Smart TV, video streaming device, wireless audio device and game console; connected home include smart thermostat, smart lighting, home appliance and surveillance system; connected self includes only smartwatch and fitness bandWeighted base: All respondents (4,003)Source: UK edition, Deloitte Global Mobile Consumer Survey, May–Jun 2016
0%
10%
20%
30%
40%
50%
At least three devicesAt least two devicesAt least one deviceConnected home Connected self*
12%
6%
17%
1%4%
1% N/A0%
47%
12%
6%
17%
1%4%
1% N/A0%
47%
21
There's no place like phone | Global Mobile Consumer Survey 2016: UK Cut
Over a third of UK adults own or have access to a connected television, either through ownership of smart TVs and/or ancillary streaming devices. If we had also asked about ownership of connected set-top boxes (STBs) and personal video recorders (PVRs), this would probably have raised penetration to over half of respondents.
We expect penetration of connected TVs, either via in-built connectivity, or via a peripheral connected to the TV set, to continue increasing. Demand is likely to grow, as watching television is a mainstream activity in the UK. On an average day about three-quarters of the UK population is likely to watch television.19 In an average week about 95 per cent will do so. This is a greater proportion, we suspect, than those who wish to micro-manage their thermostat.
Connected TV provides access to a wider range of viewing, and at any time. There is little or no incremental cost in purchasing a connected television, STB or PVR.
Connectivity offers greater ease of use: being able to stream a film to a TV set means not having to get off the sofa and put in a DVD. It permits setting up a PVR to record a series via a single click on a smartphone, in response to an automated email suggesting what you might like to watch. If a viewer starts watching a programme midway through, their PVR may automatically download the programme from the start and offer the option to watch from the beginning.
Penetration of connected audio devices should continue increasing for similar reasons. Listening to music and conversation, within radio programmes or standalone, is a mainstream activity. Making a radio or speaker connected unlocks a wider choice of content and automated recommendations of what to listen to. Connected speakers can also be linked, enabling the same music to play throughout the home.
22
There's no place like phone | Global Mobile Consumer Survey 2016: UK Cut
Bottom line: Growing the IoT market; enhancing mainstream behaviours The era of mainstream IoT device ownership is likely to dawn when the benefits align with mainstream consumer behaviour. Some IoT applications may simply make aspects of our lives easier; others may be perceived as frivolous.
It is worth noting, however, that widespread technology adoption has often been driven by entertainment and occasionally exuberant behaviours. Soap operas and reality TV may do a better job of selling new televisions than documentaries. Cat videos may be a bigger driver of mobile networks than online lectures.
Adoption of connected surveillance cameras – which enable images of suspicious activity at home to be forwarded to a smartphone – has remained modest at three per cent over the last year. As break-ins are fortunately relatively rare, connected surveillance cameras that are configured to stream video only in the event of unexpected movement may not be activated for years. This may discourage the acquisition of such devices.
However, tapping into mainstream consumer behaviours, such as pet ownership, might be one way of driving up demand for IoT products.
Fifteen million (almost half) of UK households have a pet. Dogs (8.5 million) and cats (7.4 million) predominate. The pet food market alone is worth close to £3 billion annually and three million pets are insured.20,21 Many pets are treated and cossetted like members of the family, but left at home during the day.
The anxiety caused by separation from pets can be mitigated by using devices with the same functionality as a connected security camera. This enables owners to see, hear and even talk to pets from a distance. Some can have a beam of light controlled by tracing a pattern using the smartphone’s touchscreen which allows owners to play with their pets. Remote feeders can enable treats to be dispensed.22 Owners can also remotely trigger the release of scents associated with them.23
Connectivity by default One of the challenges to the adoption of some IoT devices has been the premium payable for a connected device. Connected appliances, for examples, tend to be significantly more expensive than regular ones. For example, a connected fridge costs thousands of pounds; a non-connected one hundreds.24 The benefit of connectivity, such as potentially never running out of milk, may be too small relative to the price premium.
23
There's no place like phone | Global Mobile Consumer Survey 2016: UK Cut
Yet connecting appliances can provide valuable benefits. Being able to monitor a cake rising from outside of the kitchen is likely to be useful to millions of people in the UK.25
Adding connectivity and a basic camera behind heat-resistant glass adds cost but this should not be substantial and is unlikely to raise the price out of the range of most people’s budgets.
Including connectivity by default appears to have worked for the video console, connected TV market and set top box markets, and may work for other sectors too.
B to B to C IoTReducing or removing the connectivity premium to the consumer may require the supplier to bear the cost in the short term. But this may well pay off in the long run via higher sales volumes, lower costs or both.
Making the connected car mainstream may require manufacturers to integrate connectivity and offer this by default.
This could help differentiate their models and drive increased sales. Owners may enjoy some of the comforts that connectivity enables, such as remote activation of air conditioning or heating prior to getting into the car, but not want to pay for it.
For some manufacturers, meanwhile, the cost of incorporating a cellular mobile connection will be covered by the ability to update a car’s software remotely, without requiring a recall.26
24
There's no place like phone | Global Mobile Consumer Survey 2016: UK Cut
25

The smartphone approaches a perfect peakSmartphone penetration in the UK leapt from 52 per cent to 81 per cent of the population in the four years to May 2016, as shown in Figure 13. But increases in adoption are now slowing to a crawl: smartphone penetration rose by a modest seven per cent in the year to 2016, and we expect penetration to rise modestly (by two to four percentage points) over the coming 12 months.
However, the replacement market is likely to remain healthy and, given the sizeable base of existing owners, smartphone sales in the UK are likely to remain in the tens of millions annually for the foreseeable future.
Figure 13. UK smartphone penetration since 2012 (%)Question. Which, if any, of the following devices do you own or have ready access to?
Note: Growth rate is calculated as year-on-year growthWeighted base (2012/2013/2014/2015/2016): All respondents (2,060/4,020/4,000/4,000/4,003)Source: UK edition, Deloitte Global Mobile Consumer Survey, May–Jun 2012, May 2013, May 2014, May–Jun 2015, May–Jun 2016
Smartphone
2012 2013 2014 2015 2016
Dev
ice
pene
trat
ion
Device penetration grow
th rate
0%
20%
40%
60%
80%
100%
0%
4%
8%
12%
16%
20%
Smartphone penetration growth
13%
9%
7%
19%
70%
81%76%
52%
62%70%
81%76%
52%
62%
26
There's no place like phone | Global Mobile Consumer Survey 2016: UK Cut
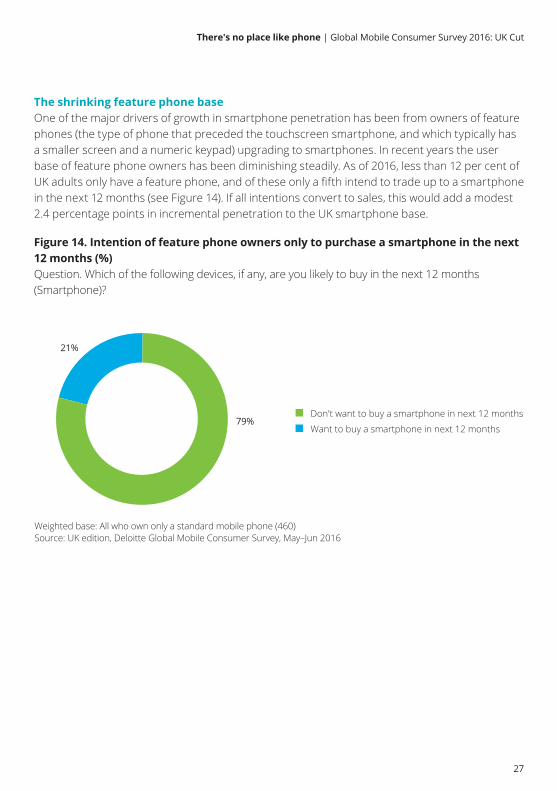
The shrinking feature phone baseOne of the major drivers of growth in smartphone penetration has been from owners of feature phones (the type of phone that preceded the touchscreen smartphone, and which typically has a smaller screen and a numeric keypad) upgrading to smartphones. In recent years the user base of feature phone owners has been diminishing steadily. As of 2016, less than 12 per cent of UK adults only have a feature phone, and of these only a fifth intend to trade up to a smartphone in the next 12 months (see Figure 14). If all intentions convert to sales, this would add a modest 2.4 percentage points in incremental penetration to the UK smartphone base.
Figure 14. Intention of feature phone owners only to purchase a smartphone in the next 12 months (%) Question. Which of the following devices, if any, are you likely to buy in the next 12 months (Smartphone)?
Weighted base: All who own only a standard mobile phone (460) Source: UK edition, Deloitte Global Mobile Consumer Survey, May–Jun 2016
21%
79%Want to buy a smartphone in next 12 months
Don't want to buy a smartphone in next 12 months
27
There's no place like phone | Global Mobile Consumer Survey 2016: UK Cut

Replacement remains healthyWhile smartphone penetration is plateauing, the replacement market remains healthy – albeit a little less vibrant than in prior years. Tens of millions of smartphones are likely to be acquired over the next year, but sales revenues and unit volumes in the UK may decline in 2016 relative to 2015.
Worldwide shipments for the first quarter of 2016 saw the smallest year-on-year growth on record. The saturation of the smartphone market is a worldwide phenomenon, and is probably most pronounced in developed countries, such as the UK.27
The largest smartphone penetration growth is among those aged over 55,28 with a compound annual growth rate of 14 per cent since 2014.29 Individuals in this age group are unlikely to exhibit similar smartphone behaviour to their younger counterparts; they are less likely, for example, to post selfies on social media or to suffer from smartphone-induced FOMO (fear of missing out).
Innovation evolution, not revolutionA key challenge for smartphone vendors is that while the pace of innovation from a supplier's perspective may remain as fervent as ever, the changes may be less perceptible to, or valued by, consumers.
Since the first touchscreen smartphone launched in 2007, there has been significant and readily noticeable innovation for most of the subsequent years. Smartphones have become more powerful, offer faster connectivity, feature larger screens and better cameras, have become tougher and have included a widening array of sensors.
With each year, the industry has moved closer to its optimal combination of size, weight, features and performance. Screens may now be big enough for most individuals: demand for yet larger displays may be constrained by the size of the hand. Increments in screen and camera resolution may now be imperceptible to many consumers’ eyes, except for those projecting their photos onto large screens or printing posters. Weight and thickness are also unlikely to change much: the need for powerful batteries means phones cannot become much thinner, or lighter, without frustrating users who want the phone to work for a day on a single charge. Data speeds may satisfy the majority, now that 54 per cent of phone owners have 4G, and voice quality, once a core differentiator, has become ever less relevant in an era of instant messaging, social networks and email.
In addition, the look and feel of smartphones has in recent years become increasingly optimised and homogenised. As a consequence there are arguably now fewer visual cues to signify ownership of the latest model of smartphone, unlike in previous years. Some smartphone owners may therefore no longer feel the same compulsion to upgrade.
28
There's no place like phone | Global Mobile Consumer Survey 2016: UK Cut
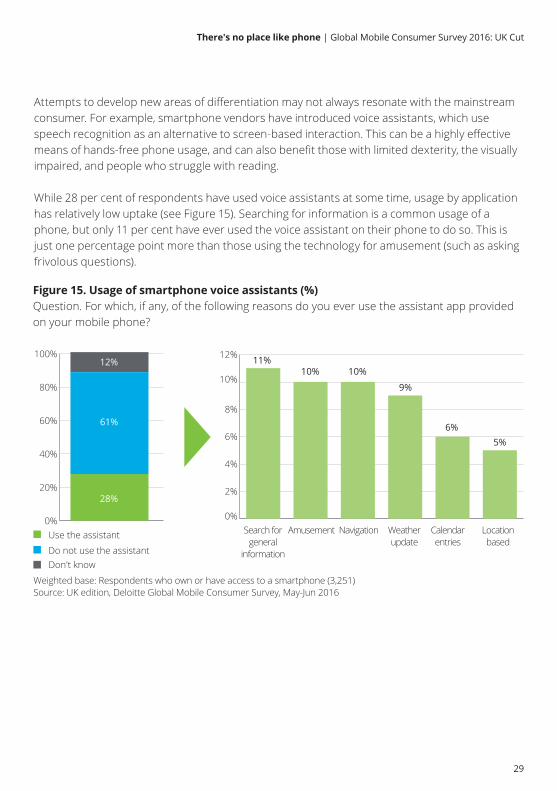
Attempts to develop new areas of differentiation may not always resonate with the mainstream consumer. For example, smartphone vendors have introduced voice assistants, which use speech recognition as an alternative to screen-based interaction. This can be a highly effective means of hands-free phone usage, and can also benefit those with limited dexterity, the visually impaired, and people who struggle with reading.
While 28 per cent of respondents have used voice assistants at some time, usage by application has relatively low uptake (see Figure 15). Searching for information is a common usage of a phone, but only 11 per cent have ever used the voice assistant on their phone to do so. This is just one percentage point more than those using the technology for amusement (such as asking frivolous questions).
Figure 15. Usage of smartphone voice assistants (%)Question. For which, if any, of the following reasons do you ever use the assistant app provided on your mobile phone?
Weighted base: Respondents who own or have access to a smartphone (3,251)Source: UK edition, Deloitte Global Mobile Consumer Survey, May-Jun 2016
Do not use the assistant
Use the assistant0%
20%
40%
60%
80%
100%
61%
28%
12%
0%
2%
4%
6%
8%
10%
12%
6%5%
Search forgeneral
information
Amusement Navigation Calendarentries
Weatherupdate
Locationbased
11%10% 10%
9%
Don't know
29
There's no place like phone | Global Mobile Consumer Survey 2016: UK Cut

Effects on the existing marketThis diminishing perceptible innovation may also be a factor in the rise of the second-hand smartphone market. Some consumers may decide to pass on the very latest handset, and the premium cost associated with it, by purchasing a recent, pre-owned model instead. In 2016, 11 per cent of the smartphone base consisted of second-hand devices.
With this perceived lack of differentiation, users need a good reason to remain loyal to one brand; such as, a superior customer interface, value added services (such as payment or location tracking), reliability or high performance hardware.
Bottom line: plateauing on the peak The approach of peak smartphone ownership needs to be put into perspective. It will plateau at a level which positions it as the most successful consumer electronics device of all time (see Figure 16). Globally, about 1.5 billion smartphones are likely to ship in 2016,30 a volume greater than the aggregate of all PCs, tablets, televisions and games consoles.
VR headset
Smart watches
Fitness bands
eReader
Desktop
Tablet
Laptops
Smartphone
0% 20% 40% 60% 80% 100%
Figure 16. Device penetration (%)Question. Which, if any, of the following devices do you own or have ready access to?
76%
63%
48%
29%
9%
4%
3%
81%
Weighted base: All respondents (4,003)Source: UK edition, Deloitte Global Mobile Consumer Survey, May–Jun 2016
30
There's no place like phone | Global Mobile Consumer Survey 2016: UK Cut

Aside from the market impact, smartphones have had a remarkable cultural impact. They have unlocked a multitude of new mainstream behaviours, from selfies to live blogging, from shopping on the move, to collecting Pokémon and never having to stop to ask a stranger for directions. They have become the all-in-one device in people’s pockets. That will not likely change for many years.
The impact of the smartphone is likely to become ever more pronounced. Greater connectivity speeds will likely unlock a whole range of new applications, in addition to live streaming as a mainstream activity (See ‘Gearing up for gigabit mobile speeds’ chapter for more information). Once components such as fingerprint readers become available in the majority of devices, smartphones may become increasingly accepted as a proof of identity (See ‘Prints charming: the silent rise of the fingerprint reader’ chapter for more information). Smartphone penetration may be approaching a peak, but its impact should continue to grow over the coming years.
31
There's no place like phone | Global Mobile Consumer Survey 2016: UK Cut
32
Gearing up for gigabit mobile speeds In June 2016, the first 500 megabit per second (Mbit/s) mobile broadband services were launched in South Korea, with a gigabit per second (Gbit/s, equivalent to 1,000 Mbit/s) service planned for 2019.31 Delivering a Gbit/s connection over a mobile network is a phenomenal technological achievement yet when it goes live it may be met not only with acclaim but also with questions over the need, and commercial viability, of such high speeds.
Over half of UK adults now have a 4G connection, and this already offers peak headline speeds of over 300 Mbit/s across parts of the UK.32 This headline speed is higher than the maximum speeds available from the majority of active fixed broadband connections.33 A 2 Mbit/s connection is sufficient to deliver a high-definition television image to a 40 inch screen, and even a 20 Mbit/s connection is more than sufficient to download high-definition video to a five-inch smartphone screen. So what would be the purpose of a gigabit connection?
A large UK household might have dozens of bandwidth-devouring devices, such as multiple TV sets each receiving different ultra-high definition live sports streams. While this household might have an aggregate demand close to 1 Gbit/s at peak times, smartphones are owned and used by individuals, and typical usage does not necessitate a need for anything close to 1 Gbit/s. There is no single consumer application that currently requires a Gbit/s connection to a mobile phone (indeed there are not any websites today that can transfer data at 1 Gbit/s).
But to decide that delivering a 1 Gbit/s service to smartphones is unnecessary and commercially unwise might be wrong. Could the availability of much faster mobile broadband speeds – as has been the case historically – yet again expose formerly unseen and unmet needs, whims and desires?
33
There's no place like phone | Global Mobile Consumer Survey 2016: UK Cut

Will the need for speed ever be satiated?It is worth noting that five years ago, at a time when measured mobile broadband speeds averaged 1.5 Mbit/s in the UK,34 the need to 'livestream’ an egg and spoon race at a sports day, to meander around major cities capturing digital artefacts, or to consume an endless stream of video clips did not exist. Arguably technology, and not consumer desire – given the popularity of Pokémon Go in the UK and elsewhere – was the constraint.
One major indicator of the UK’s appetite for faster mobile speeds is the pace of adoption of 4G. Three years ago, just three per cent of our survey respondents had 4G. Two years ago, adoption had risen to eight per cent. This year it surged to 54 per cent from 25 per cent one year ago (see Figure 17).
0%
10%
20%
30%
40%
50%
60%
Figure 17. 4G adoption in the UK since 2013 (%)Question. Is your mobile on a 4G/LTE network?
25%
54%
2013 2014 2015 2016
Note: “I don’t know” was not an answer option in 2015 or 2014 GMCS. Assume “I don’t know” respondents are included in “No” responses for those yearsWeighted base (2013/2014/2015/2016): Respondents who own or have access to a feature phone or smartphone (3,756/3,676/3,682/3,712) Source: UK edition, Deloitte Global Mobile Consumer Survey, May-Jun 2013, May 2014, May-Jun 2015, May-Jun 2016
3%
8%
34
There's no place like phone | Global Mobile Consumer Survey 2016: UK Cut
Supply begets demand: the case study of the “camera phone”Over the history of the mobile phone, speed and functionality have had a symbiotic relationship. Consider, for example, the camera. Today, all smartphones sold in the UK include at least one camera, most have two, and a few have three (two at the rear).
In 2002, sales of mobile phones incorporating a camera totalled 18 million units worldwide,35 most of which were sold in Asia Pacific, which was also the region with the greatest uptake of 3G at that time.36 Connectivity enables photos to be shared, while the fast speed makes the sharing, and the feedback, near-instant.
One consequence of the proliferation of cameras in phones and the complementary availability of ever-faster fixed and mobile networks is a vast increase in the number of photographs taken and shared. This year globally a collective two trillion photos and images will be sent, posted, forwarded or backed up from a smartphone. 37
Beyond trillionsIs the two trillion photo shares number a stepping stone or a peak?
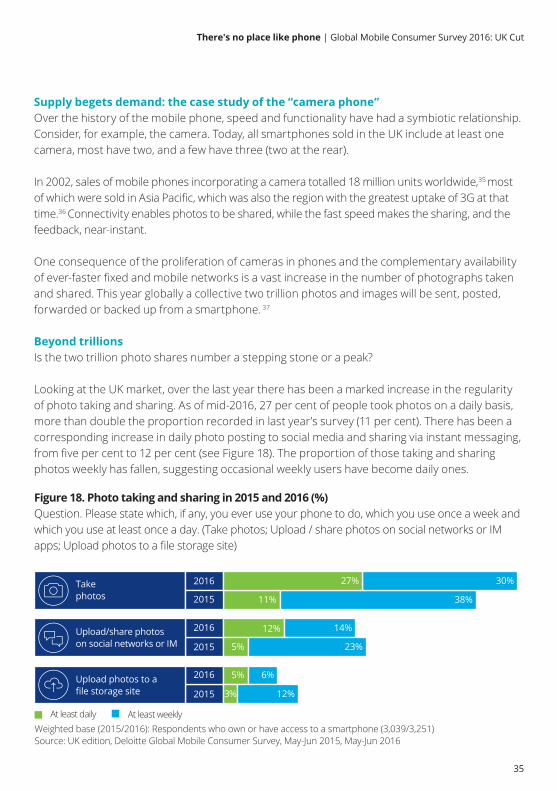
Looking at the UK market, over the last year there has been a marked increase in the regularity of photo taking and sharing. As of mid-2016, 27 per cent of people took photos on a daily basis, more than double the proportion recorded in last year’s survey (11 per cent). There has been a corresponding increase in daily photo posting to social media and sharing via instant messaging, from five per cent to 12 per cent (see Figure 18). The proportion of those taking and sharing photos weekly has fallen, suggesting occasional weekly users have become daily ones.
Figure 18. Photo taking and sharing in 2015 and 2016 (%)Question. Please state which, if any, you ever use your phone to do, which you use once a week and which you use at least once a day. (Take photos; Upload / share photos on social networks or IM apps; Upload photos to a file storage site)
11%2015
2016
2016
2015
2016
2015
38%
12% 14%
5% 23%
5% 6%
3% 12%
Weighted base (2015/2016): Respondents who own or have access to a smartphone (3,039/3,251)Source: UK edition, Deloitte Global Mobile Consumer Survey, May-Jun 2015, May-Jun 2016
At least daily At least weekly
Take photos
Upload photos to a file storage site
Upload/share photos on social networks or IM
27% 30%
35
There's no place like phone | Global Mobile Consumer Survey 2016: UK Cut

2423 122
2120
19
18
1716
15
23
45
6
78
91011121314
Sleep
Morning
Even
ing
Work
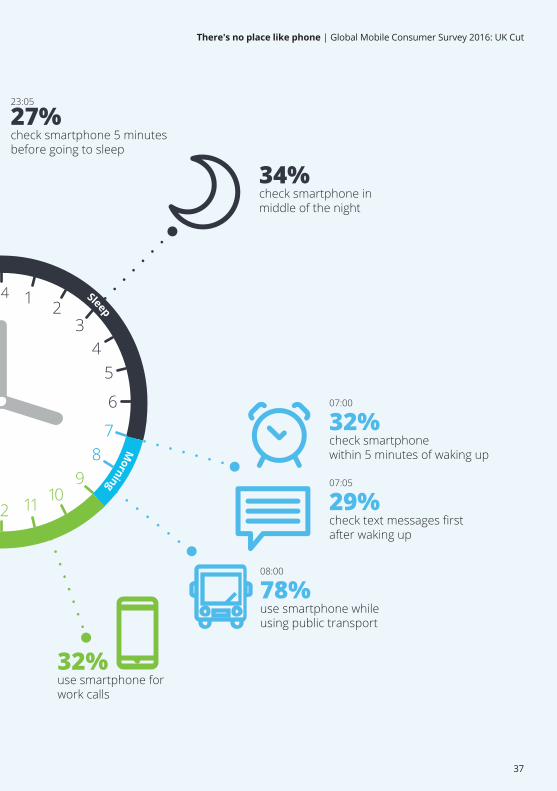
07:00
32%check smartphonewithin 5 minutes of waking up
07:05
29%check text messages first after waking up
08:00
78%use smartphone while using public transport
A day in the life of a smartphone...
34%check smartphone inmiddle of the night
89%use smartphone
while at work
37%use smartphone
for work email
32%use smartphone forwork calls
22:00–22:55
9% use smartphone to pay taxis
23:05
27% check smartphone 5 minutes before going to sleep
Note: Respondents for which a particular activity does not apply have been excluded from this analysis (e.g. respondents who do not work have not been asked if they use their phone at work).Weighted base: Respondents who own or have access to a smartphone (3,251)Source: UK edition, Deloitte Global Mobile Consumer Survey, May–Jun 2016
17:00–18:00
9% use smartphone to pay for public
transport
19:00–20:00
68% use smartphone while
having dinner with family
18:00–19:00
80% use smartphone while
talking to friends
20:00–22:00
81% use smartphone while
watching TV
36
There's no place like phone | Global Mobile Consumer Survey 2016: UK Cut
2423 122
2120
19
18
1716
15
23
45
6
78
91011121314
Sleep
Morning
Even
ing
Work
07:00
32%check smartphonewithin 5 minutes of waking up
07:05
29%check text messages first after waking up
08:00
78%use smartphone while using public transport
A day in the life of a smartphone...
34%check smartphone inmiddle of the night
89%use smartphone
while at work
37%use smartphone
for work email
32%use smartphone forwork calls
22:00–22:55
9% use smartphone to pay taxis
23:05
27% check smartphone 5 minutes before going to sleep
Note: Respondents for which a particular activity does not apply have been excluded from this analysis (e.g. respondents who do not work have not been asked if they use their phone at work).Weighted base: Respondents who own or have access to a smartphone (3,251)Source: UK edition, Deloitte Global Mobile Consumer Survey, May–Jun 2016
17:00–18:00
9% use smartphone to pay for public
transport
19:00–20:00
68% use smartphone while
having dinner with family
18:00–19:00
80% use smartphone while
talking to friends
20:00–22:00
81% use smartphone while
watching TV
37
There's no place like phone | Global Mobile Consumer Survey 2016: UK Cut

Figure 19. Video taking and sharing (%)Question. Please state which, if any, you ever use your phone to do, which you use once a week and which you use at least once a day. (Take videos; Upload / share videos on social networks or IM apps)
6% 10%
8% 8%
Weighted base: Respondents who own or have access to a smartphone (3,251)Source: UK edition, Deloitte Global Mobile Consumer Survey, May–Jun 2016
At least daily At least weekly
Take videos
Smartphone users that share videos on IM or social media
There are several likely reasons for this. One is the significantly higher uptake of 4G, with the majority of mobile phone users in the UK now on a 4G network. There has also been a growth in the number of apps based around or featuring sharing. In the last year, both Facebook Messenger and WhatsApp have surpassed the billion active-users milestone.38
Photography, video recording and content sharing appears also to be driven by the network effect: the larger it becomes the more valuable it is to its users. As the network of people who can receive and send photos or view videos increases, the more posts are made. As the network effect kicks in, the demand for bandwidth may rise too.
As photo taking and sharing becomes ever more prolific, the focus is shifting to video, which is likely to substitute increasingly for still photos.
Sharing video is becoming easier thanks to faster connectivity speeds and the availability of social media platforms that enable (and encourage) sharing of video content. Indeed, users can now offer a profile video, rather than a mere photo.39 According to our research 16 per cent of smartphone owners now shoot videos weekly and share via social media or instant messaging (see Figure 19).
It has now become common for people to film events which they are attending. At a concert in Italy, Adele, stopped singing to ask a fan to stop filming her live show and “enjoy it in real life”. This moment was of course filmed by another fan, using a smartphone.40
38
There's no place like phone | Global Mobile Consumer Survey 2016: UK Cut
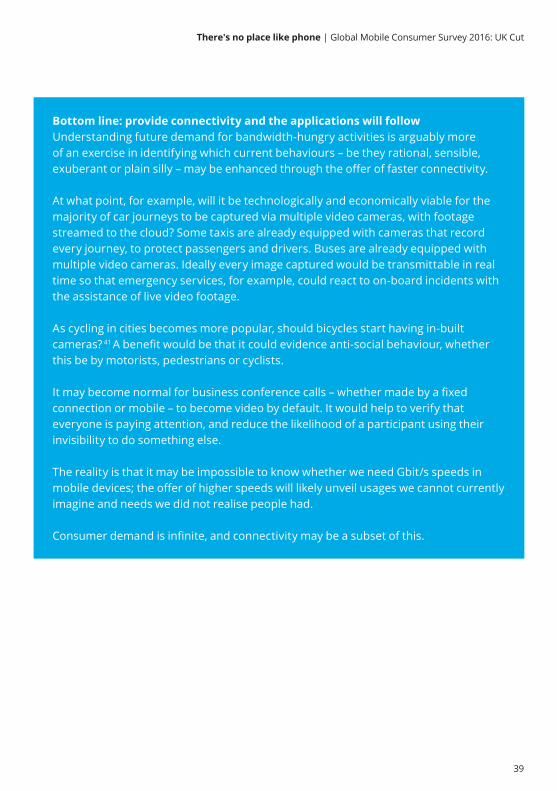
Bottom line: provide connectivity and the applications will followUnderstanding future demand for bandwidth-hungry activities is arguably more of an exercise in identifying which current behaviours – be they rational, sensible, exuberant or plain silly – may be enhanced through the offer of faster connectivity.
At what point, for example, will it be technologically and economically viable for the majority of car journeys to be captured via multiple video cameras, with footage streamed to the cloud? Some taxis are already equipped with cameras that record every journey, to protect passengers and drivers. Buses are already equipped with multiple video cameras. Ideally every image captured would be transmittable in real time so that emergency services, for example, could react to on-board incidents with the assistance of live video footage.
As cycling in cities becomes more popular, should bicycles start having in-built cameras? 41 A benefit would be that it could evidence anti-social behaviour, whether this be by motorists, pedestrians or cyclists.
It may become normal for business conference calls – whether made by a fixed connection or mobile – to become video by default. It would help to verify that everyone is paying attention, and reduce the likelihood of a participant using their invisibility to do something else.
The reality is that it may be impossible to know whether we need Gbit/s speeds in mobile devices; the offer of higher speeds will likely unveil usages we cannot currently imagine and needs we did not realise people had.
Consumer demand is infinite, and connectivity may be a subset of this.
39
There's no place like phone | Global Mobile Consumer Survey 2016: UK Cut

40
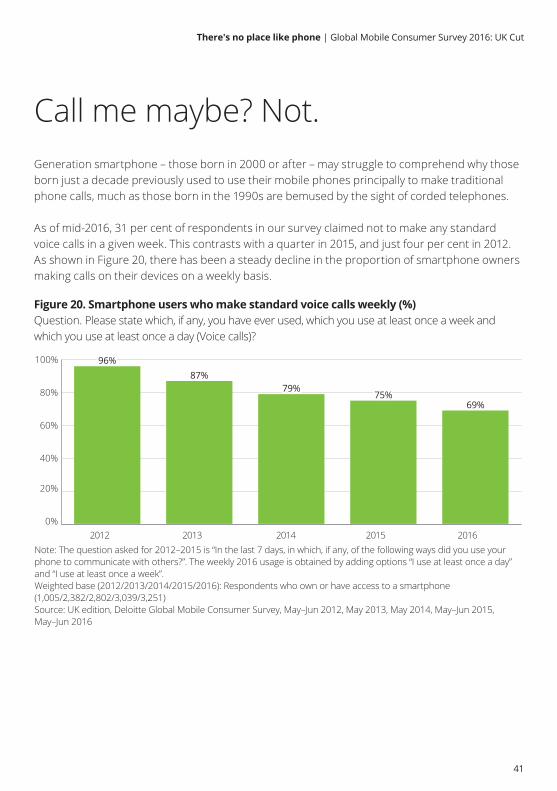
Generation smartphone – those born in 2000 or after – may struggle to comprehend why those born just a decade previously used to use their mobile phones principally to make traditional phone calls, much as those born in the 1990s are bemused by the sight of corded telephones.
As of mid-2016, 31 per cent of respondents in our survey claimed not to make any standard voice calls in a given week. This contrasts with a quarter in 2015, and just four per cent in 2012. As shown in Figure 20, there has been a steady decline in the proportion of smartphone owners making calls on their devices on a weekly basis.
Call me maybe? Not.
Note: The question asked for 2012–2015 is “In the last 7 days, in which, if any, of the following ways did you use your phone to communicate with others?”. The weekly 2016 usage is obtained by adding options “I use at least once a day” and “I use at least once a week”.Weighted base (2012/2013/2014/2015/2016): Respondents who own or have access to a smartphone (1,005/2,382/2,802/3,039/3,251)Source: UK edition, Deloitte Global Mobile Consumer Survey, May–Jun 2012, May 2013, May 2014, May–Jun 2015, May–Jun 2016
0%
20%
40%
60%
80%
100%
Figure 20. Smartphone users who make standard voice calls weekly (%)Question. Please state which, if any, you have ever used, which you use at least once a week and which you use at least once a day (Voice calls)?
2012 2013 2014 2015 2016
79%75%
69%
87%96%
79%75%
69%
87%96%
41
There's no place like phone | Global Mobile Consumer Survey 2016: UK Cut

0%
10%
20%
30%
40%
50%
60%
70%
80%
Voice call using VoIPVideo CallInstant MessagingSocial NetworkEmail
Figure 21. Smartphone users who use data communication services weekly (%)Question. Please state which, if any, you have ever used, which you use at least once a week and which you use at least once a day?
Note: The question asked for 2012–2015 is “In the last 7 days, in which, if any, of the following ways did you use your phone to communicate with others?”. The weekly 2016 usage is obtained by adding options “I use at least once a day” and “I use at least once a week”Weighted base (2012/2013/2014/2015/2016): Respondents who own or have access to a smartphone (1,005/2,382/2,802/3,039/3,251)Source: UK edition, Deloitte Global Mobile Consumer Survey, May 2014, May–Jun 2015, May–Jun 2016
2014 2015 2016
9%12% 14% 14%
48%
5%
16%
56%60%
71%
44%51%
59%
31%
46%
9%12% 14% 14%
48%
5%
16%
56%60%
71%
44%51%
59%
31%
46%
What is clear is that the reach of each tool is rising in parallel: they are not regarded as substitutes. While email may be considered by some as old-fashioned by digital standards, usage increased by 11 percentage points over the last year, which is a greater increase than that for social networks (eight percentage points) or instant messaging (ten percentage points). This means that email has remained the most popular digital communications tool on a smartphone in each of the last three years. Email’s appeal lies in its universality: every smartphone includes an email app. The email format has changed little over the last few years, yet it remains a simple and useful way to send and receive communication quickly.
Messaging multipliesThe majority of ‘data exclusives’ who no longer make calls are not forgoing communication entirely; rather they are choosing to use a range of alternative tools to communicate, favouring predominantly text messaging, instant messages (IM) and social networks.
Indeed, looking at the entire base, there has been a marked increase in the last two years in both the proportion of people using all data communications tools (see Figure 21).
42
There's no place like phone | Global Mobile Consumer Survey 2016: UK Cut
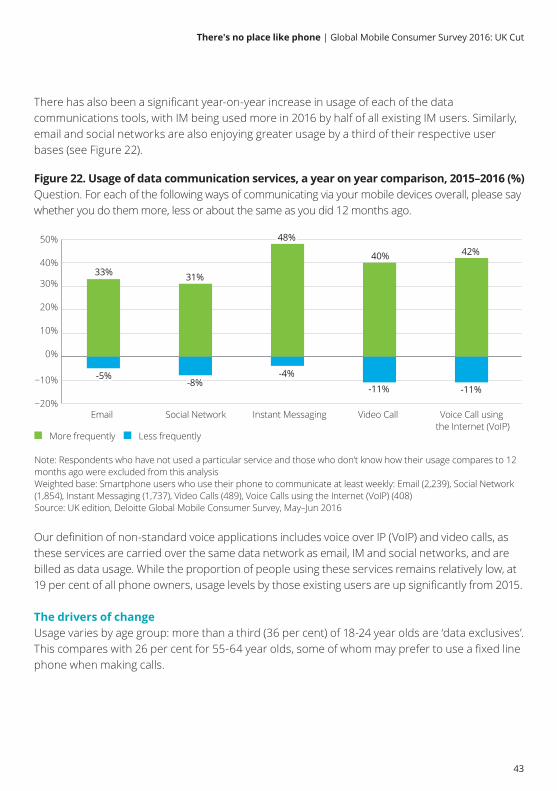
Our definition of non-standard voice applications includes voice over IP (VoIP) and video calls, as these services are carried over the same data network as email, IM and social networks, and are billed as data usage. While the proportion of people using these services remains relatively low, at 19 per cent of all phone owners, usage levels by those existing users are up significantly from 2015.
The drivers of changeUsage varies by age group: more than a third (36 per cent) of 18-24 year olds are ‘data exclusives’. This compares with 26 per cent for 55-64 year olds, some of whom may prefer to use a fixed line phone when making calls.
−20%
−10%
0%
10%
20%
30%
40%
50%
Voice Call using the Internet (VoIP)
Video CallInstant MessagingSocial NetworkEmail
Figure 22. Usage of data communication services, a year on year comparison, 2015–2016 (%)Question. For each of the following ways of communicating via your mobile devices overall, please say whether you do them more, less or about the same as you did 12 months ago.
Note: Respondents who have not used a particular service and those who don’t know how their usage compares to 12 months ago were excluded from this analysisWeighted base: Smartphone users who use their phone to communicate at least weekly: Email (2,239), Social Network (1,854), Instant Messaging (1,737), Video Calls (489), Voice Calls using the Internet (VoIP) (408)Source: UK edition, Deloitte Global Mobile Consumer Survey, May–Jun 2016
More frequently Less frequently
33% 31%
48%
40% 42%
-5%-8%
-4%
-11% -11%
33% 31%
48%
40% 42%
-5%-8%
-4%
-11% -11%
There has also been a significant year-on-year increase in usage of each of the data communications tools, with IM being used more in 2016 by half of all existing IM users. Similarly, email and social networks are also enjoying greater usage by a third of their respective user bases (see Figure 22).
43
There's no place like phone | Global Mobile Consumer Survey 2016: UK Cut
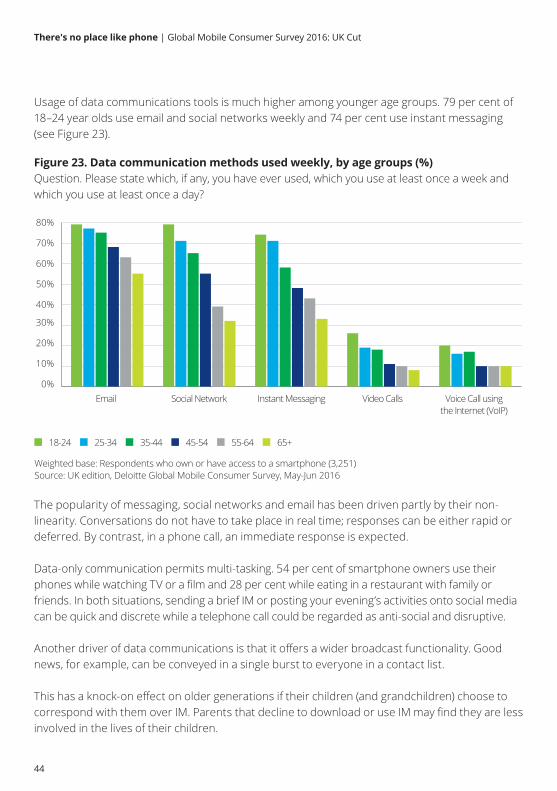
Figure 23. Data communication methods used weekly, by age groups (%) Question. Please state which, if any, you have ever used, which you use at least once a week and which you use at least once a day?
Weighted base: Respondents who own or have access to a smartphone (3,251)Source: UK edition, Deloitte Global Mobile Consumer Survey, May-Jun 2016
18-24 25-34 35-44 45-54 55-64 65+
Email Social Network Instant Messaging Video Calls Voice Call using the Internet (VoIP)
0%
10%
20%
30%
40%
50%
60%
70%
80%
The popularity of messaging, social networks and email has been driven partly by their non-linearity. Conversations do not have to take place in real time; responses can be either rapid or deferred. By contrast, in a phone call, an immediate response is expected.
Data-only communication permits multi-tasking. 54 per cent of smartphone owners use their phones while watching TV or a film and 28 per cent while eating in a restaurant with family or friends. In both situations, sending a brief IM or posting your evening’s activities onto social media can be quick and discrete while a telephone call could be regarded as anti-social and disruptive.
Another driver of data communications is that it offers a wider broadcast functionality. Good news, for example, can be conveyed in a single burst to everyone in a contact list.
This has a knock-on effect on older generations if their children (and grandchildren) choose to correspond with them over IM. Parents that decline to download or use IM may find they are less involved in the lives of their children.
Usage of data communications tools is much higher among younger age groups. 79 per cent of 18–24 year olds use email and social networks weekly and 74 per cent use instant messaging (see Figure 23).
44
There's no place like phone | Global Mobile Consumer Survey 2016: UK Cut
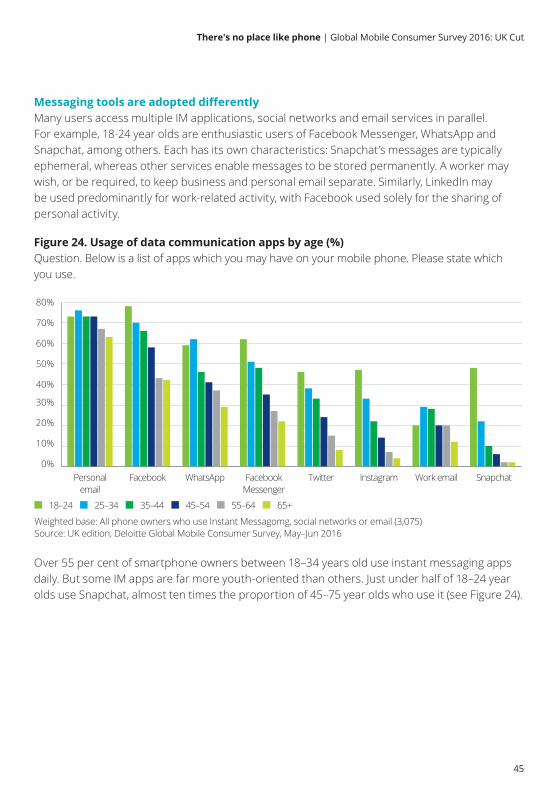
Over 55 per cent of smartphone owners between 18–34 years old use instant messaging apps daily. But some IM apps are far more youth-oriented than others. Just under half of 18–24 year olds use Snapchat, almost ten times the proportion of 45–75 year olds who use it (see Figure 24).
Figure 24. Usage of data communication apps by age (%) Question. Below is a list of apps which you may have on your mobile phone. Please state which you use.
Weighted base: All phone owners who use Instant Messagomg, social networks or email (3,075)Source: UK edition, Deloitte Global Mobile Consumer Survey, May–Jun 2016
18–24 25–34 35–44 45–54 55–64 65+
0%
10%
20%
30%
40%
50%
60%
70%
80%
SnapchatWork emailInstagramTwitterFacebookMessenger
WhatsAppFacebookPersonalemail
Messaging tools are adopted differently Many users access multiple IM applications, social networks and email services in parallel. For example, 18-24 year olds are enthusiastic users of Facebook Messenger, WhatsApp and Snapchat, among others. Each has its own characteristics: Snapchat’s messages are typically ephemeral, whereas other services enable messages to be stored permanently. A worker may wish, or be required, to keep business and personal email separate. Similarly, LinkedIn may be used predominantly for work-related activity, with Facebook used solely for the sharing of personal activity.
45
There's no place like phone | Global Mobile Consumer Survey 2016: UK Cut
Bottom line: the next era of messaging – commercialisation Over the past five years, there has been a steady decline in the use of smartphones for voice calls, and a steady rise in the use of email, social networks and instant messaging platforms. The adoption of data-based communications has been partly driven by the fact that they are typically free, data cost aside.
As many of these platforms now enjoy a significant user base, it is likely that they will become increasingly commercial over the coming years to cover the costs required to provide, upgrade, market and support these services.42
Emails and social networks have long experimented with targeted advertising, and, in some cases, successfully. In contrast, to date, instant messaging platforms have mostly been free from advertising in the UK. As well as showing a range of static and video display advertising, these platforms will likely be increasingly used for selective communications between suppliers and their customers to market and sell products or services directly.43
These platforms could also increasingly be used as a means of carrying payments. In other markets, messaging platforms are used extensively to send forms of money. In China, over half a billion people effected 32 billion money transfers via a messaging platform during this year’s Chinese New Year.44
There is always the risk that advertisements and other such monetising activities may be regarded as disruptive and intrusive. As such, some data communications platforms offer a subscription tier, others request donations,45 and a few others offer in-app purchases for extra features.
Users are likely to balance these potential inconveniences against the benefits of being able to communicate with everyone, using a range of media from words to photos, from emoticons to GIFs, and at the time that best suits them.
46
There's no place like phone | Global Mobile Consumer Survey 2016: UK Cut
47

The app is one of the most disruptive innovations of the last decade and has been pivotal to the commercial success of the smartphone.
Appsolutely fabulous, mostlyMillions of apps are now available to smartphone consumers, with approximately a million just for games.46,47 The vast majority of smartphone user time is spent in apps and some of the most successful digital services, from social networks to ordering taxis, are available via an app.48 The app market has proven, in aggregate, lucrative, albeit with the value spread across hundreds and thousands of publishers. Over the last eight years, app stores have generated tens of billions of dollars in revenues via download sales and in-app payments.49 The most successful apps have been downloaded over a billion times.50
It would therefore appear logical for all companies to want to create an app. If smartphone users want to spend the bulk of their time in apps, then shouldn’t all companies, from retailers to news providers and airlines, want to create apps through which to interact with, and better understand, their customers? Furthermore, for companies reliant on advertising revenues, apps, unlike browsers, are impervious to ad-blockers.51
But apps are not always the best approach and should not be considered a default. While for some categories – most obviously games – the app is almost always the right way to go, there are many instances in which a browser is preferred. In a few cases obliging users to download an app might deter potential customers.
When apps are preferred Smartphone users like apps for some, but not all activities. Apps tend to be most successful for processes or tasks which are completed regularly.
Among UK smartphone owners, over half would typically use an app to check the weather, whereas only a fifth would use a browser. Checking the weather is a simple process and is able to employ smartphone data inputs such as GPS, forgoing the need to type in the name of a town or place. An app can meet this need with a single touch. Similarly, checking a social network feed requires a simple instruction. Navigation via a smartphone works well as the app is able to pull from information contained within the calendar and contacts apps on the phone. These are the top three mobile activities typically undertaken via an app rather than a browser (see Figure 25).
Apps versus browsers
48
There's no place like phone | Global Mobile Consumer Survey 2016: UK Cut

When browsers are better Shopping online via a phone, whether looking at products or purchasing, is a common activity. An app may be suitable when making regular purchases, such as the weekly order from an online grocer.
But when searching for a new outfit the first action might well be a browser-based search as this would return results from a range of retailers, not just a single one. According to our research, an online search for a product is over three times more likely to start in a browser (50 per cent) than in an app (15 per cent). Figure 26 provides more detail.
For more occasional tasks where content is not uniform, such as shopping, using a browser may be more effective – and for this to work on smartphones, companies should create mobile-optimised websites.
Figure 25. Top ten activities accessed using an app or a browser (%)Question. For each of the mobile activities below, would you typically use an app or a browser?
Top Ten App Activities Top Ten Browser Activities
Weighted base: Respondents who own or have access to a smartphone (3,251)Source: UK edition, Deloitte Global Mobile Consumer Survey, May–Jun 2016
Online shopping/retail
Streaming video
Streaming music
Read the news
Online banking
Play games
Navigation
Social networking
Weather
0% 10% 20% 30% 40% 50% 60%
Order a take away
Streaming video
Social networking
Online banking
Read sports news
Weather
Travel booking
Read the news
Online shopping/retail
0% 10% 20% 30% 40% 50%
56%
55%
54%
52%
47%
40%
33%
32%
26%
22%
40%
36%
31%
24%
22%
22%
18%
16%
16%
16%
49
There's no place like phone | Global Mobile Consumer Survey 2016: UK Cut
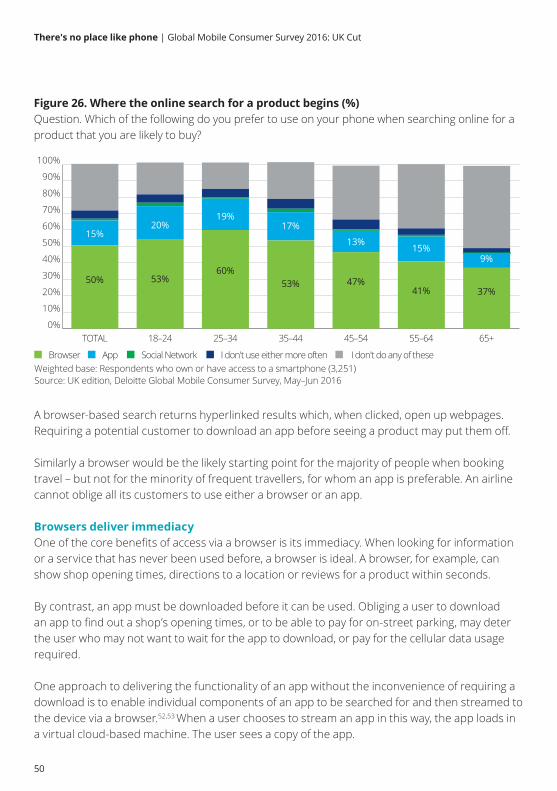
A browser-based search returns hyperlinked results which, when clicked, open up webpages. Requiring a potential customer to download an app before seeing a product may put them off.
Similarly a browser would be the likely starting point for the majority of people when booking travel – but not for the minority of frequent travellers, for whom an app is preferable. An airline cannot oblige all its customers to use either a browser or an app.
Browsers deliver immediacy One of the core benefits of access via a browser is its immediacy. When looking for information or a service that has never been used before, a browser is ideal. A browser, for example, can show shop opening times, directions to a location or reviews for a product within seconds.
By contrast, an app must be downloaded before it can be used. Obliging a user to download an app to find out a shop’s opening times, or to be able to pay for on-street parking, may deter the user who may not want to wait for the app to download, or pay for the cellular data usage required.
One approach to delivering the functionality of an app without the inconvenience of requiring a download is to enable individual components of an app to be searched for and then streamed to the device via a browser.52,53 When a user chooses to stream an app in this way, the app loads in a virtual cloud-based machine. The user sees a copy of the app.
0%
10%
20%
30%
40%
50%
60%
70%
80%
90%
100%
65+55–6445–5435–4425–3418–24TOTAL
Figure 26. Where the online search for a product begins (%)Question. Which of the following do you prefer to use on your phone when searching online for a product that you are likely to buy?
Weighted base: Respondents who own or have access to a smartphone (3,251)Source: UK edition, Deloitte Global Mobile Consumer Survey, May–Jun 2016
20%
53%60%
19%
9%
37%
17%
53%
15%
41%
13%
47%
Browser App Social Network I don't use either more often I don't do any of these
15%
50%
50
There's no place like phone | Global Mobile Consumer Survey 2016: UK Cut
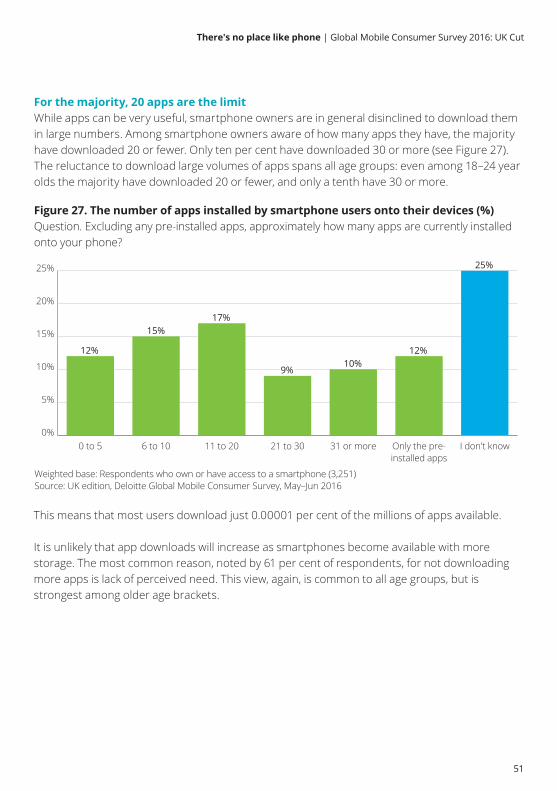
This means that most users download just 0.00001 per cent of the millions of apps available.
It is unlikely that app downloads will increase as smartphones become available with more storage. The most common reason, noted by 61 per cent of respondents, for not downloading more apps is lack of perceived need. This view, again, is common to all age groups, but is strongest among older age brackets.
0%
5%
10%
15%
20%
25%
I don't knowOnly the pre-installed apps
31 or more21 to 3011 to 206 to 100 to 5
Figure 27. The number of apps installed by smartphone users onto their devices (%)Question. Excluding any pre-installed apps, approximately how many apps are currently installed onto your phone?
Weighted base: Respondents who own or have access to a smartphone (3,251)Source: UK edition, Deloitte Global Mobile Consumer Survey, May–Jun 2016
12%
15%17%
25%
10%12%
9%
12%
15%17%
25%
10%12%
9%
For the majority, 20 apps are the limit While apps can be very useful, smartphone owners are in general disinclined to download them in large numbers. Among smartphone owners aware of how many apps they have, the majority have downloaded 20 or fewer. Only ten per cent have downloaded 30 or more (see Figure 27). The reluctance to download large volumes of apps spans all age groups: even among 18–24 year olds the majority have downloaded 20 or fewer, and only a tenth have 30 or more.
51
There's no place like phone | Global Mobile Consumer Survey 2016: UK Cut
Bottom line: Apps and browsers will be complements
Since the arrival of apps, some commentators have questioned the need for browser-based content.54 Those questions are unlikely to go away and apps are likely to remain the optimal approach for delivering some – but not all – functionality and content for mobile phones.
Smartphones are likely to remain multi-functional devices which people will want to use for a blend of regular and occasional tasks. For the former, apps are likely to be the preferred approach. For everything else, the browser is likely to remain best.
52
There's no place like phone | Global Mobile Consumer Survey 2016: UK Cut
53
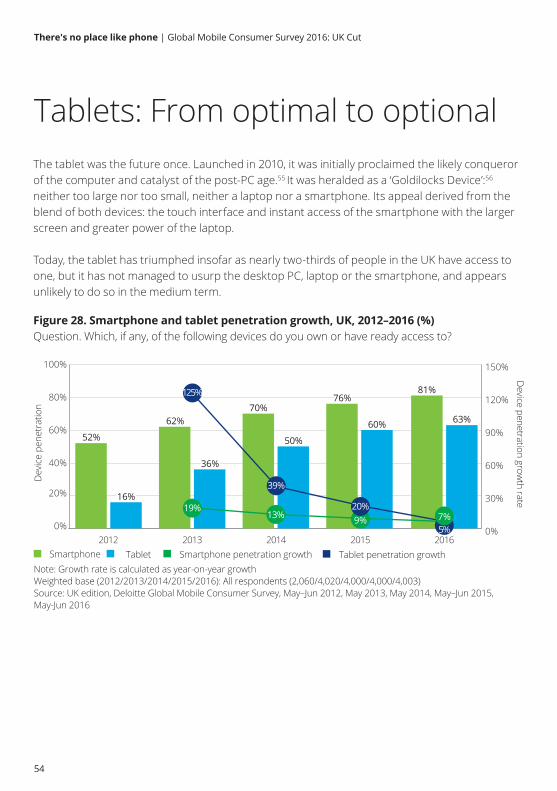
Tablets: From optimal to optionalThe tablet was the future once. Launched in 2010, it was initially proclaimed the likely conqueror of the computer and catalyst of the post-PC age.55 It was heralded as a ‘Goldilocks Device’:56
neither too large nor too small, neither a laptop nor a smartphone. Its appeal derived from the blend of both devices: the touch interface and instant access of the smartphone with the larger screen and greater power of the laptop.
Today, the tablet has triumphed insofar as nearly two-thirds of people in the UK have access to one, but it has not managed to usurp the desktop PC, laptop or the smartphone, and appears unlikely to do so in the medium term.
Figure 28. Smartphone and tablet penetration growth, UK, 2012–2016 (%)Question. Which, if any, of the following devices do you own or have ready access to?
Note: Growth rate is calculated as year-on-year growthWeighted base (2012/2013/2014/2015/2016): All respondents (2,060/4,020/4,000/4,000/4,003)Source: UK edition, Deloitte Global Mobile Consumer Survey, May–Jun 2012, May 2013, May 2014, May–Jun 2015, May-Jun 2016
Smartphone2012 2013 2014 2015 2016
Dev
ice
pene
trat
ionD
evice penetration growth rate
0%
20%
40%
60%
80%
100%
0%
30%
60%
90%
120%
150%
Tablet Smartphone penetration growth Tablet penetration growth
125%
7%5%
9%20%
39%
13%19%
70%76%
50%
60%
81%
63%
36%
16%
52%
62%70%
76%
50%
60%
81%
63%
36%
16%
52%
62%
54
There's no place like phone | Global Mobile Consumer Survey 2016: UK Cut
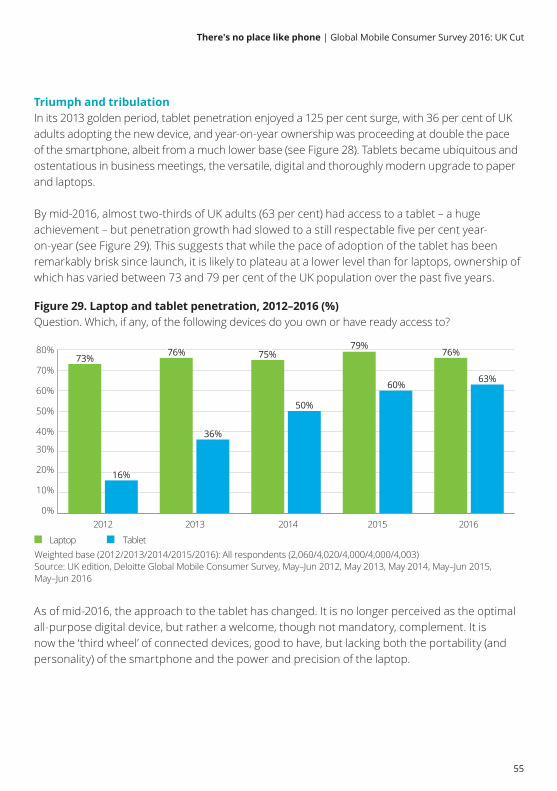
Triumph and tribulationIn its 2013 golden period, tablet penetration enjoyed a 125 per cent surge, with 36 per cent of UK adults adopting the new device, and year-on-year ownership was proceeding at double the pace of the smartphone, albeit from a much lower base (see Figure 28). Tablets became ubiquitous and ostentatious in business meetings, the versatile, digital and thoroughly modern upgrade to paper and laptops.
By mid-2016, almost two-thirds of UK adults (63 per cent) had access to a tablet – a huge achievement – but penetration growth had slowed to a still respectable five per cent year-on-year (see Figure 29). This suggests that while the pace of adoption of the tablet has been remarkably brisk since launch, it is likely to plateau at a lower level than for laptops, ownership of which has varied between 73 and 79 per cent of the UK population over the past five years.
Figure 29. Laptop and tablet penetration, 2012–2016 (%)Question. Which, if any, of the following devices do you own or have ready access to?
62
Weighted base (2012/2013/2014/2015/2016): All respondents (2,060/4,020/4,000/4,000/4,003)Source: UK edition, Deloitte Global Mobile Consumer Survey, May–Jun 2012, May 2013, May 2014, May–Jun 2015, May–Jun 2016
2012 2013 2014 2015 20160%
10%
20%
30%
40%
50%
60%
70%
80%
Laptop Tablet
73%
36%
75%
50%
60%
76%
63%
76%
16%
73%
36%
75%79%
50%
60%
76%
63%
76%
16%
As of mid-2016, the approach to the tablet has changed. It is no longer perceived as the optimal all-purpose digital device, but rather a welcome, though not mandatory, complement. It is now the ‘third wheel’ of connected devices, good to have, but lacking both the portability (and personality) of the smartphone and the power and precision of the laptop.
Figure 28. Smartphone and tablet penetration growth, UK, 2012–2016 (%)Question. Which, if any, of the following devices do you own or have ready access to?
Note: Growth rate is calculated as year-on-year growthWeighted base (2012/2013/2014/2015/2016): All respondents (2,060/4,020/4,000/4,000/4,003)Source: UK edition, Deloitte Global Mobile Consumer Survey, May–Jun 2012, May 2013, May 2014, May–Jun 2015, May-Jun 2016
Smartphone2012 2013 2014 2015 2016
Dev
ice
pene
trat
ion
Device penetration grow
th rate
0%
20%
40%
60%
80%
100%
0%
30%
60%
90%
120%
150%
Tablet Smartphone penetration growth Tablet penetration growth
125%
7%5%
9%20%
39%
13%19%
70%76%
50%
60%
81%
63%
36%
16%
52%
62%70%
76%
50%
60%
81%
63%
36%
16%
52%
62%
55
There's no place like phone | Global Mobile Consumer Survey 2016: UK Cut
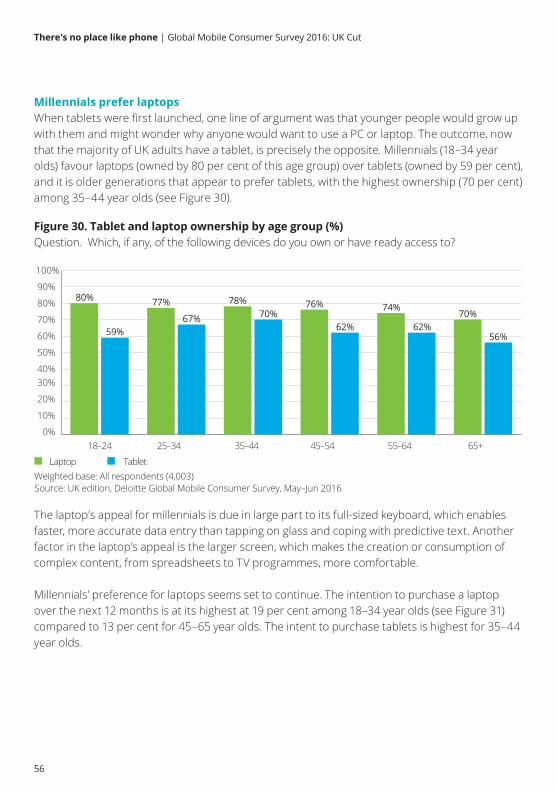
Millennials prefer laptopsWhen tablets were first launched, one line of argument was that younger people would grow up with them and might wonder why anyone would want to use a PC or laptop. The outcome, now that the majority of UK adults have a tablet, is precisely the opposite. Millennials (18–34 year olds) favour laptops (owned by 80 per cent of this age group) over tablets (owned by 59 per cent), and it is older generations that appear to prefer tablets, with the highest ownership (70 per cent) among 35–44 year olds (see Figure 30).
Figure 30. Tablet and laptop ownership by age group (%)Question. Which, if any, of the following devices do you own or have ready access to?
Weighted base: All respondents (4,003)Source: UK edition, Deloitte Global Mobile Consumer Survey, May–Jun 2016
18–24 25–34 35–44 55–6445–54 65+0%
10%
20%
30%40%
50%
60%
70%
80%
90%
100%
Laptop Tablet
80%
59%67%
78%70%
74%76%
62% 62%70%
56%
77%80%
59%67%
78%70%
74%76%
62% 62%70%
56%
77%
The laptop’s appeal for millennials is due in large part to its full-sized keyboard, which enables faster, more accurate data entry than tapping on glass and coping with predictive text. Another factor in the laptop’s appeal is the larger screen, which makes the creation or consumption of complex content, from spreadsheets to TV programmes, more comfortable.
Millennials’ preference for laptops seems set to continue. The intention to purchase a laptop over the next 12 months is at its highest at 19 per cent among 18–34 year olds (see Figure 31) compared to 13 per cent for 45–65 year olds. The intent to purchase tablets is highest for 35–44 year olds.
56
There's no place like phone | Global Mobile Consumer Survey 2016: UK Cut
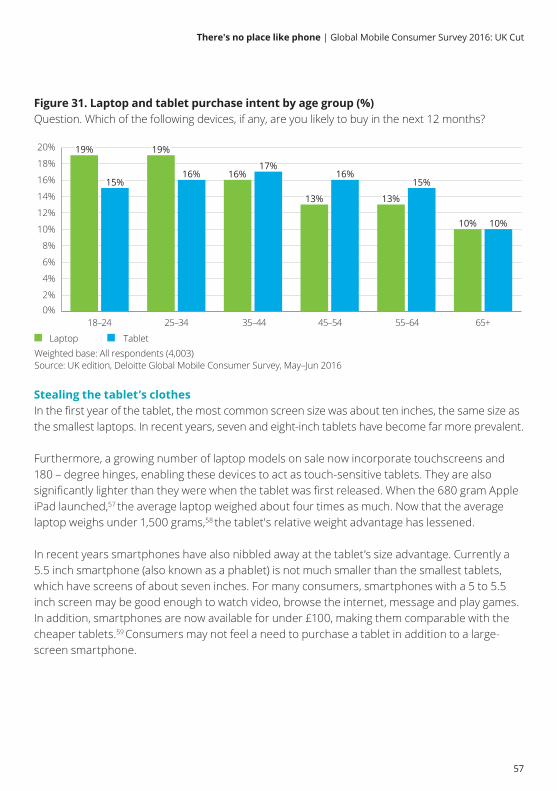
Figure 31. Laptop and tablet purchase intent by age group (%)Question. Which of the following devices, if any, are you likely to buy in the next 12 months?
Weighted base: All respondents (4,003)Source: UK edition, Deloitte Global Mobile Consumer Survey, May–Jun 2016
18–24 25–34 35–44 55–6445–54 65+0%2%
4%
6%
8%
10%
12%
14%
16%
18%
20%
Laptop Tablet
19%
15%
19%
16% 16%17%
13%13%
16%15%
10% 10%
19%
15%
19%
16% 16%17%
13%13%
16%15%
10% 10%
Stealing the tablet’s clothes In the first year of the tablet, the most common screen size was about ten inches, the same size as the smallest laptops. In recent years, seven and eight-inch tablets have become far more prevalent.
Furthermore, a growing number of laptop models on sale now incorporate touchscreens and 180 – degree hinges, enabling these devices to act as touch-sensitive tablets. They are also significantly lighter than they were when the tablet was first released. When the 680 gram Apple iPad launched,57 the average laptop weighed about four times as much. Now that the average laptop weighs under 1,500 grams,58 the tablet's relative weight advantage has lessened.
In recent years smartphones have also nibbled away at the tablet’s size advantage. Currently a 5.5 inch smartphone (also known as a phablet) is not much smaller than the smallest tablets, which have screens of about seven inches. For many consumers, smartphones with a 5 to 5.5 inch screen may be good enough to watch video, browse the internet, message and play games. In addition, smartphones are now available for under £100, making them comparable with the cheaper tablets.59 Consumers may not feel a need to purchase a tablet in addition to a large-screen smartphone.
Figure 30. Tablet and laptop ownership by age group (%)Question. Which, if any, of the following devices do you own or have ready access to?
Weighted base: All respondents (4,003)Source: UK edition, Deloitte Global Mobile Consumer Survey, May–Jun 2016
18–24 25–34 35–44 55–6445–54 65+0%
10%
20%
30%40%
50%
60%
70%
80%
90%
100%
Laptop Tablet
80%
59%67%
78%70%
74%76%
62% 62%70%
56%
77%80%
59%67%
78%70%
74%76%
62% 62%70%
56%
77%
57
There's no place like phone | Global Mobile Consumer Survey 2016: UK Cut

The tablet may be getting harder to swallowSo what is the tablet now optimised for, given that smartphones and laptops have incorporated some of its core features?
We looked at 15 different activities that people regularly perform on smartphones, tablets or laptops, and asked which device they preferred to use for that activity. What emerged was that while tablets were sometimes preferred over either laptops or smartphones for some activities, they were never better than the second choice (see Figure 32).
Tablets came closest to being a first choice in one activity: playing games. Inspection of the demographics shows that they were the first choice device for games on the part of women and all people over the age of 45.
Figure 32. Preferred device for a range of applications
Preferred device Second choice
Browse shopping websites Laptop Tablet
Make online purchases Laptop Tablet
Check bank balances Laptop Smartphone
Check social networks Smartphone Laptop
Video calls Laptop Smartphone
Voice calls using the Internet Smartphone Laptop
Watch short videos Laptop Tablet
Stream films and/or TV series Laptop Tablet
Watch TV programmes via catch-up services
Laptop Tablet
Watch live TV Laptop Tablet
Online search Laptop Tablet
Read the news Laptop Smartphone
Play games Smartphone Tablet
Take photos Smartphone Tablet
Record videos Smartphone Tablet
Weighted base: All respondents (4,003)Source: UK edition, Deloitte Global Mobile Consumer Survey, May–Jun 2016
58
There's no place like phone | Global Mobile Consumer Survey 2016: UK Cut

Bottom line: From need to have, to nice to haveThe tablet is one of the most successful consumer products ever. It is one of the fastest-adopted and is now in the vast majority of UK homes. It is likely to remain more ubiquitous than most other recent digital devices, including smart watches, eReaders and fitness bands. It is a popular device for many applications, even if it is not the most preferred.
However, it is unlikely ever to fundamentally displace the laptop or any other device. We expect penetration to plateau at between 65 and 70 per cent of UK homes – a lower level than for computers or smartphones.
We would also expect that the majority of tablets will be used for entertainment purposes, and occasionally be an excellent productivity tool in a range of professions from architectural design to retail. Most tablets will be used indoors, and few are likely to have cellular mobile connections.
The tablet is likely to be shared, rather than personal, and is likely to have a prolonged upgrade cycle relative to the smartphone. Among our respondents, two-thirds of smartphones were acquired in 2015 or 2016, whereas two-thirds of tablets were bought in 2014 or earlier.
When the tablet launched, there were unrealistically high expectations, particularly with respect to its impact on laptop computers. The reality is that for most users, the tablet seems likely to struggle to replace the laptop, particularly for those requiring a productivity tool. It could be argued that tablets cannot replace laptops without losing some of their fundamental attributes, such as reliance on a touchscreen and much lighter weight.
59
There's no place like phone | Global Mobile Consumer Survey 2016: UK Cut
About the researchThe UK data cut is part of Deloitte’s Global Mobile Consumer Survey, a multi-country study of mobile phone users around the world. The 2016 study comprises of 53,000 respondents across 31 countries and five continents.
Data cited in this report are based on a nationally representative sample of 4,000 UK consumers aged 18-75. The sample follows a country specific quota on age, gender, region, working and socio-economic status. Fieldwork took place during May to June 2016 and was carried out online by Ipsos MORI, an independent research firm, based on a question set provided by Deloitte.
This brief report provides a snapshot of some of the insights that the survey has revealed. Additional analysis such as: 4G adoption and usage, smartphone purchase channel, reasons for joining leaving mobile operators, attitudes towards triple/quad play, usage of tablets, and usage of communication services such as instant messaging, SMS and social networks are available upon request.
Results for other countries are also available upon request.
For further information about this research, please contact:
60
There's no place like phone | Global Mobile Consumer Survey 2016: UK Cut
Relevant Thought LeadershipTMT Predictions 2016Deloitte’s Technology, Media & Telecommunications (TMT) Predictions presents our view on the major trends that will impact UK businesses in 2016. Knowing what will come next has become a key competitive differentiator and can give your business a leading edge.
www.deloitte.co.uk/tmtpredictions
Switch on to the connected homeMore than 2,000 UK consumers were surveyed about their relationship with IoT devices and we found that two thirds agree that connected devices have the potential to make their day-to-day lives easier. This report focuses on the emerging prospect of the connected home and consumers' interaction with the Internet of Things.
www.deloitte.co.uk/consumerreview
Media Metrics 2016We’ve identified the top 100 UK media companies and examined their performance to provide a snapshot of the UK media market today. This report evaluates the five-year financial performance of the largest UK media organisations, highlighting the main trends and issues facing the industry in 2016 and beyond.
www.deloitte.co.uk/mediametrics
Technology, Media & TelecommunicationsPredictions2016
Switch on to the connected homeThe Deloitte Consumer ReviewJuly 2016
Media MetricsThe state of UK media and entertainment 2016www.deloitte.co.uk/mediametrics#mediametrics
61
There's no place like phone | Global Mobile Consumer Survey 2016: UK Cut
1. EE LAUNCHES NEXT PHASE OF 4G FOR THE WORLD'S FASTEST SMARTPHONES, EE, 6 September 2016: http://newsroom.ee.co.uk/ee-launches-next-phase-of-4g-for-the-worlds-fastest-smartphones/
2. Calculated as 1.1 billion times a day multipled by 365 days of the year. The options given to this question were: ‘Never’, ‘Under 10 times’ ‘Between 11 and 25 times’, ‘Between 26 and 50 times’, ‘Between 51 and 100 times’, ‘Between 101 and 200 times’, ‘Over 200 times’ and ‘I don’t know’. To calculate the average number of times people look at their device, a mid-point has been taken for all the options with the exception of ‘Never’ where a value of zero has been used and ‘Over 200 times’ where a value of 250 has been used. Respondents who answered ‘I don’t know’ have been excluded from this calculation. An average has been calculated for each age group and then multiplied with the number of smartphone owners in that age group. A value has been considered for the 14-17 and 75+ age groups.
3. The options given to this question were: ‘Never’, ‘Under 10 times’ ‘Between 11 and 25 times’, ‘Between 26 and 50 times’, ‘Between 51 and 100 times’, ‘Between 101 and 200 times’, ‘Over 200 times’ and ‘I don’t know’. To calculate the average number of times people look at their device, a mid-point has been taken for all the options with the exception of ‘Never’ where a value of zero has been used and ‘Over 200 times’ where a value of 250 has been used. Respondents who answered ‘I don’t know’ have been excluded from this calculation. An average has been calculated for each age group and then multiplied with the number of smartphone owners in that age group. A value has been considered for the 14-17 and 75+ age groups.
4. Calculated as 91 per cent of 23 million. Based on 18-45 year old population sourced from Population Estimates for UK, England and Wales, Scotland and Northern Ireland: mid-2015. See Population Estimates for UK, England and Wales, Scotland and Northern Ireland: mid-2015, Office for National Statistics, 23 June 2016: http://www.ons.gov.uk/peoplepopulationandcommunity/populationandmigration/populationestimates/bulletins/annualmidyearpopulationestimates/mid2015
5. Calculated as 50 per cent of 45 million. Based on 18-75 year old population sourced from Population Estimates for UK, England and Wales, Scotland and Northern Ireland: mid-2015. See Population Estimates for UK, England and Wales, Scotland and Northern Ireland: mid-2015, Office for National Statistics, 23 June 2016: http://www.ons.gov.uk/peoplepopulationandcommunity/populationandmigration/populationestimates/bulletins/annualmidyearpopulationestimates/mid2015
6. Photoreceptors in the eyes that sense light signal to our brain whether it is day or night. This tunes our circadian rhythms to enable us to feel awake in the morning, and sleepy at night. Artificial light from tablets or smartphones could confuse the photoreceptors and, in turn, our circadian rhythms. See Electronics in the Bedroom: Why it’s Necessary to Turn off Before You Tuck in, National Sleep Foundation, as accessed on 1 September 2016: https://sleepfoundation.org/ask-the-expert/electronics-the-bedroom
7. Too much exposure to smartphone screens ruins your sleep, study shows, The Independent, 3 February 2015: http://www.independent.co.uk/life-style/health-and-families/health-news/too-much-exposure-to-smartphone-screens-ruins-your-sleep-study-shows-10019185.html
8. See Pocket Points by Pocket Points, iTunes, as accessed on 8 September 2016: https://itunes.apple.com/us/app/pocket-points/id908136685?mt=8
9. This is a summary of multiple apps on the market to meet this functionality. See Screen Time Parental Control By Screen Time Labs, iTunes, as accessed on 8 September 2016: https://itunes.apple.com/in/app/screen-time-parental-control/id1055315077?mt=8; ( OFFTIME ) light – Track how much you use your phone & Digital Detox and unplug to focus By OFFTIME, iTunes, as accessed on 8 September 2016: https://itunes.apple.com/us/app/offtime-light-track-how-much/id974022309?mt=8; Moment – Track how much you and your family use your phone By Kevin Holesh, iTunes, as accessed on 8 September 2016: https://itunes.apple.com/in/app/moment-track-how-much-you/id771541926?mt=8
Endnotes
62
There's no place like phone | Global Mobile Consumer Survey 2016: UK Cut
10. A world beyond passwords: Improving security, efficiency, and user experience in digital transformation, Deloitte University Press, Deloitte Development LLC, 25 July 2016: http://dupress.com/articles/moving-beyond-passwords-cybersecurity/
11. You can use Apple Pay to pay as you go. See Apple Pay, Transport for London, as accessed on 6 September 2016: https://tfl.gov.uk/fares-and-payments/contactless/other-methods-of-contactless-payment/apple-pay?cid=applepay
12. Apple Pay For Safari Is Like Having The Amazon 1-Click Shopping Cart On Any Website, Medium, 13 June 2016: https://medium.com/@brianroemmele/apple-pay-for-safari-is-like-having-the-amazon-1-click-shopping-cart-on-any-website-db1fb29930a9#.qud94cvrc
13. Your smartphone fingerprint reader could be hacked using paper and ink, Naked Security, 8 March 2016: https://nakedsecurity.sophos.com/2016/03/08/your-smartphone-fingerprint-reader-could-be-hacked-using-paper-and-ink/
14. For more information see Breakthrough 3D fingerprint authentication with Snapdragon Sense ID, Qualcomm Technologies, 2 March 2015: https://www.qualcomm.com/news/snapdragon/2015/03/02/breakthrough-3d-fingerprint-authentication-snapdragon-sense-id
15. Of those that own a fitness band, a significant proportion may stopped using them. See Wearables have a dirty little secret: 50% of users lose interest, TechRepublic, 13 February 2014: http://www.techrepublic.com/article/wearables-have-a-dirty-little-secret-most-people-lose-interest/
16. The Timex Datalink smartwatch was launched in 1994. See Timex Corporation History, as accessed on 6 September 2016: http://www.fundinguniverse.com/company-histories/timex-corporation-history/
17. LG Electronics launched the “Internet Digital DIOS' refrigerator in 2010. See LG UNVEILS INTERNET-READY REFRIGERATOR, telecompaper, 21 June 2000: http://www.telecompaper.com/news/lg-unveils-internetready-refrigerator--221266
18. The hypothetical benefit of fitness bands is that they may encourage people to track their exercise levels and, by sharing them, compete to be fitter. The reality may be somewhat different: these devices may expose a lack of exercise which the disconsolate can readily ignore by abandoning their trackers. Many smartphones, owned by 81 per cent of UK adults, incorporate the components to measure fitness and include apps for viewing of activity data. But how often are these data actually viewed? How often are these apps deleted or hidden among a basket of unloved, but undeletable, apps?
19. In the last week of September 2015, a year before this report launches, average daily viewing was just over 75 per cent. For the week, viewing was 93 per cent. For more information see Weekly viewing summary, BARB, as accessed on 1 September 2016: http://www.barb.co.uk/viewing-data/weekly-viewing-summary/
20. UK pet food market reaches £2.8 billion, Pet Business World, 14 April 2015: http://www.petbusinessworld.co.uk/news/feed/uk-pet-food-market-reaches--2-8-billion
21. UK Insurance & Long Term Savings Key Facts 2015, Association of British Insurers, 18 September 2015: https://www.abi.org.uk/~/media/Files/Documents/Publications/Public/2015/Statistics/Key%20Facts%202015.pdf
22. For an example see Petcube, Petcube, as accessed on 20 August 2016: https://petcube.com/
23. For an example of such a product, see PetChatz, PetChatz, as accessed on 6 September 2016: https://petchatz.com/
24. For prices of connected fridges, see Touchscreen refrigerators and talking everything at CES 2016, CNET, 10 January 2016: http://www.cnet.com/uk/news/touchscreen-refrigerators-and-talking-everything-at-ces-2016/
25. You Can Put This Oven on Autopilot and Control It from Your Smartphone, Edible Manhattan, 25 May 2016: http://www.ediblemanhattan.com/eat/june-oven/; See June Intelligent Oven, June, as accessed on 1 September 2016: https://juneoven.com/
63
There's no place like phone | Global Mobile Consumer Survey 2016: UK Cut
26. According to one study, cost savings from over the air software updates to cars were worth $2.7 billion in 2015 and may be worth $35 billion in 2022. See Over-the-air Software Updates to Create Boon for Automotive Market, IHS Says, IHS, 3 September 2015: http://press.ihs.com/press-release/automotive/over-air-software-updates-create-boon-automotive-market-ihs-says
27. Worldwide Smartphone Growth Goes Flat in the First Quarter as Chinese Vendors Churn the Top 5 Vendor List, According to IDC, IDC, 27 April 2016: http://www.idc.com/getdoc.jsp?containerId=prUS41216716
28. The UK Mobile Consumer Survey is nationally representative of the population aged 18-75.
29. Compound annual growth rate calculated over 2 years from 2014 and 2016 from UK Mobile Consumer Survey data.
30. Worldwide Smartphone Growth Forecast to Slow to 3.1% in 2016 as Focus Shifts to Device Lifecycles, According to IDC, IDC, 1 June 2016: http://www.idc.com/getdoc.jsp?containerId=prUS41425416
31. SK Telecom to launch 500Mbps LTE-A Pro on June 1, 1Gbps by 2019, ZDNet, 24 May 2016: http://www.zdnet.com/article/sk-telecom-to-launch-500mbps-lte-a-pro-on-june-1-1gbps-by-2019/
32. EE LAUNCHES NEXT PHASE OF 4G FOR THE WORLD'S FASTEST SMARTPHONES, EE, 6 September 2016: http://newsroom.ee.co.uk/ee-launches-next-phase-of-4g-for-the-worlds-fastest-smartphones/
33. Peak broadband speeds available over fibre to the cabinet (FTTC) connections are 76 Mbit/s. See Fibre Broadband (FTTC / FTTH) Guide, thinkbroadband, as accessed on 6 September 2016: http://www.thinkbroadband.com/guide/fibre-broadband.html#what-speed
34. For more information see Mobile broadband speeds revealed, Ofcom, 26 May 2011: http://media.ofcom.org.uk/news/2011/mobile-broadband-speeds-revealed/
35. Phone users become picture savvy, BBC, 12 February 2003: http://news.bbc.co.uk/1/hi/business/2752113.stm
36. Asia Pacific Mobile Observatory 2011 Driving Economic and Social Development through Mobile Broadband, GSMA, iWireless Intelligence, A.T. Kearney Analysis, 5 December 2011: http://www.gsma.com/spectrum/wp-content/uploads/2012/07/Asia-Pacific-Mobile-Observatory.pdf
37. For more information, see Photo sharing: trillions and rising, TMT Prediction 2016, Deloitte Touche Tohmatsu Limited, as accessed on 6 September 2016: http://www2.deloitte.com/global/en/pages/technology-media-and-telecommunications/articles/tmt-predictions.html
38. Thank You! Messenger, Facebook, 20 July 2016: http://newsroom.fb.com/news/2016/07/thank-you-messenger/; One billion, WhatsApp, 1 February 2016: https://blog.whatsapp.com/616/One-billion
39. You can now set videos as your Facebook profile picture, Digital Spy, 13 April 2016: http://www.digitalspy.com/tech/news/a790485/you-can-now-set-videos-as-your-facebook-profile-picture/
40. Adele stops gig to blast audience member filming Verona concert, The Independent, 31 May 2016: http://www.independent.co.uk/arts-entertainment/music/news/adele-stops-gig-to-blast-audience-member-filming-verona-concert-a7057611.html
41. Cycle accessories such as lights and helmets are already available with built-in cameras. For example see: FLY12, Cycliq, as accessed on 6 September 2016: https://cycliq.com/; DUAL-CAMERA CYCLING HELMET TECHNOLOGY FOR COMPETITIVE AND SOCIAL CYCLISTS, Cyclevision, as accessed on 6 September 2016: http://www.cyclevision.com.au/technology/
42. WhatsApp and Instagram shift business models, Financial Times, 18 January 2016: http://www.ft.com/cms/s/0/fac63040-bddd-11e5-9fdb-87b8d15baec2.html
43. WhatsApp paves way for messages from businesses, Financial Times, 25 August 2016: http://www.ft.com/cms/s/0/0098d6aa-6a34-11e6-a0b1-d87a9fea034f.html
44. Tencent's charges for WeChat pay users kick in amid fight for mobile payment marketshare, CNBC, 1 March 2016: http://www.cnbc.com/2016/03/01/tencents-charges-for-wechat-pay-users-kick-in-amid-fight-for-mobile-payment-marketshare.html
64
There's no place like phone | Global Mobile Consumer Survey 2016: UK Cut
45. Telegram uses donation model see Telegram statistics and revenue, The Business of Apps, 11 January 2016: http://www.businessofapps.com/telegram-statistics-and-revenue/
46. Number of apps available in leading app stores as of June 2016, Statista, 31 August 2016: http://www.statista.com/statistics/276623/number-of-apps-available-in-leading-app-stores/
47. App Store Metrics, Pocket Gamer.biz, 31 August 2016: http://www.pocketgamer.biz/metrics/app-store/
48. Seven Years Into The Mobile Revolution: Content is King… Again. Flurry Insights. 26 August 2015. See: http://flurrymobile.tumblr.com/post/127638842745/seven-years-into-the-mobile-revolution-content-is
49. Apple moves to maintain the allure of its apps, Financial Times, 13 June 2016: http://www.ft.com/cms/s/0/a30ca956-319b-11e6-ad39-3fee5ffe5b5b.html#axzz4IjmgyYJP
50. See WhatsApp has grown to 1 billion users, The Verge, 1 February 2016: http://www.theverge.com/2016/2/1/10889534/whats-app-1-billion-users-facebook-mark-zuckerberg
51. Google just took a much clearer stance on banning ad blocking apps (but ad blocking browsers are still OK), Business Insider, 2 March 2016: http://uk.businessinsider.com/google-just-took-a-much-clearer-stance-on-banning-ad-blocking-apps-but-ad-blocking-browsers-are-still-ok-2016-3 ; Apple pulls the plug on in-app ad-blockers, MacWorld, 9 October 2015: http://www.macworld.com/article/2991342/security/apple-pulls-the-plug-on-in-app-ad-blockers.html
52. Instant Apps on Android are the most fascinating thing Google announced today, The Verge, 18 May 2016: http://www.theverge.com/2016/5/18/11705918/google-instant-apps-android-hands-on-video
53. See Google Search Now Surfaces App-Only Content, Streams Apps From The Cloud When Not Installed On Your Phone, TechCrunch, 18 November 2015: https://techcrunch.com/2015/11/18/google-search-now-surfaces-app-only-content-streams-apps-from-the-cloud-when-not-installed-on-your-phone/
54. See The Web Is Dying; Apps Are Killing It, The Wall Street Journal, 17 November 2014: http://www.wsj.com/articles/the-web-is-dying-apps-are-killing-it-1416169934
55. Tablet Computer Demand Putting a Dent in PC Sales, The Wall Street Journal, 4 March 2011: http://www.wsj.com/articles/SB10001424052748703300904576178381437662352 Tablets: The Goldilocks device, ChannelBuzz.ca, 7 December 2010: http://www.channelbuzz.ca/2010/12/tablets-the-goldilocks-device-842/
56. Tablets: The Goldilocks device, ChannelBuzz.ca, 7 December 2010: http://www.channelbuzz.ca/2010/12/tablets-the-goldilocks-device-842/
57. Apple iPad Wi-Fi, GSMArena.com, as accessed on 6 September 2016: http://www.gsmarena.com/apple_ipad_wi_fi-3828.php
58. Ultrabooks vs regular laptops/notebooks in 2016: similarities and differences, Ultrabookreview.com, 2 February 2016: http://www.ultrabookreview.com/154-ultrabooks-versus-regular-laptops/
59. See Vodafone Smart ultra 6 on Pay as you go, Vodafone, as accessed on 6 September 2016: http://shop.vodafone.co.uk/shop/pay-as-you-go/vodafone-smart-6-ultra-payg/sku86618-silver
65
There's no place like phone | Global Mobile Consumer Survey 2016: UK Cut

Notes
66
There's no place like phone | Global Mobile Consumer Survey 2016: UK Cut

Notes
67
There's no place like phone | Global Mobile Consumer Survey 2016: UK Cut

Notes
68
There's no place like phone | Global Mobile Consumer Survey 2016: UK Cut

Ed MarsdenUK Head of Telecommunications+44 (0)20 7303 [email protected]
David BlackwellPartner, Telecoms +44 (0)20 7007 [email protected]
Researched and written by
Paul LeeHead of Global Research, TMT+44 (0)20 7303 [email protected]
Emily TalbotInsight Manager+44 (0)20 7303 [email protected]
Marketing & media
Rosie ShepherdMarketing Lead+44 (0)118 322 [email protected]
George ParrettPublic Relations Manager+44 (0)20 7007 [email protected]
Joanna Reidy-Bond HoushamMarketing Senior Assistant+44 (0)20 7303 [email protected]
Contacts
Deloitte refers to one or more of Deloitte Touche Tohmatsu Limited (“DTTL”), a UK private company limited by guarantee, and its network of member firms, each of which is a legally separate and independent entity. Please see www.deloitte.co.uk/about for a detailed description of the legal structure of DTTL and its member firms.
Deloitte LLP is the United Kingdom member firm of DTTL.
This publication has been written in general terms and therefore cannot be relied on to cover specific situations; application of the principles set out will depend upon the particular circumstances involved and we recommend that you obtain professional advice before acting or refraining from acting on any of the contents of this publication. Deloitte LLP would be pleased to advise readers on how to apply the principles set out in this publication to their specific circumstances. Deloitte LLP accepts no duty of care or liability for any loss occasioned to any person acting or refraining from action as a result of any material in this publication.
© 2016 Deloitte LLP. All rights reserved.
Deloitte LLP is a limited liability partnership registered in England and Wales with registered number OC303675 and its registered office at 2 New Street Square, London EC4A 3BZ, United Kingdom. Tel: +44 (0) 20 7936 3000 Fax: +44 (0) 20 7583 1198.
Designed and produced by The Creative Studio at Deloitte, London. J8177