the deloitte consumer review sales and sales promotions – a consumer… · the deloitte consumer...
TRANSCRIPT
The Deloitte Consumer Review Sales and sales promotions – a consumer’s perspective
December 2014
2
About the survey The research was carried out by Amárach as part of an omnibus survey. The total sample for this survey was 1,000 people, and the interviewing fieldwork dates were 11 to 15 September 2014.
Due to rounding, responses to the questions covered in this report may not aggregate to 100.
Contents
The Deloitte Consumer Review 3
About the Deloitte Ireland Consumer Review 3
Key observations 4
Purchasing products/services on sale or promotion 5
Consumers’ view of sales and promotions for different products and services 6
The likelihood of consumers switching key service providers due to a promotional offer 8
Where do consumers get their coupons? 10
Consumers’ brand loyalty 11
Sources of information on promotional offers 12
Who bears the cost of promotional offers? 13
How sales and promotions alter consumers’ spending behaviour 14
The Deloitte Ireland Consumer Tracker 16
Introducing the Deloitte Ireland Consumer Tracker 16
Key observations 17
Consumer confidence 18
Consumer spending 19
Outlook 21

3
About the Deloitte Ireland Consumer Review
Welcome to the second edition of the Deloitte Ireland Consumer Review
As we come through a traditionally renowned sales season with ‘Black Friday’ becoming ever more popular and end of year and new year sales fast approaching, we look at Irish consumer behaviour across a number of different aspects of sales and promotions to consider the value and opportunity to retailers and the supply chain. Irish consumers remain cautious. Our Consumer Review findings, outlined later in this report, show that many consumers’ financial situations have stayed the same over the last number of months and while marginal increases in spend are anticipated, these are mostly likely to be on essential items, with little left for discretionary items. For retailers however, it is interesting to note that, excluding groceries, the most popular option for consumer buying habits is to wait for a sale. Couple this with a lack of brand loyalty and a majority of switchers not returning to original brands, sales and promotions can have the desired effect of brand switching and new customers. While the festive season will bring an obvious jump in sales, retailers’ focus must be on ensuring a strong value proposition to capitalise in the year ahead on this seasonal opportunity. The discerning Irish consumer is here to stay.
CONTACTS
If you would like further information on the survey please contact: Kevin Sheehan Head of Consumer Business T: +353 1 417 2218 E: [email protected]
The Deloitte Consumer ReviewSales and sales promotions – a consumer’s perspective
SALE %
4
523469
Key observations
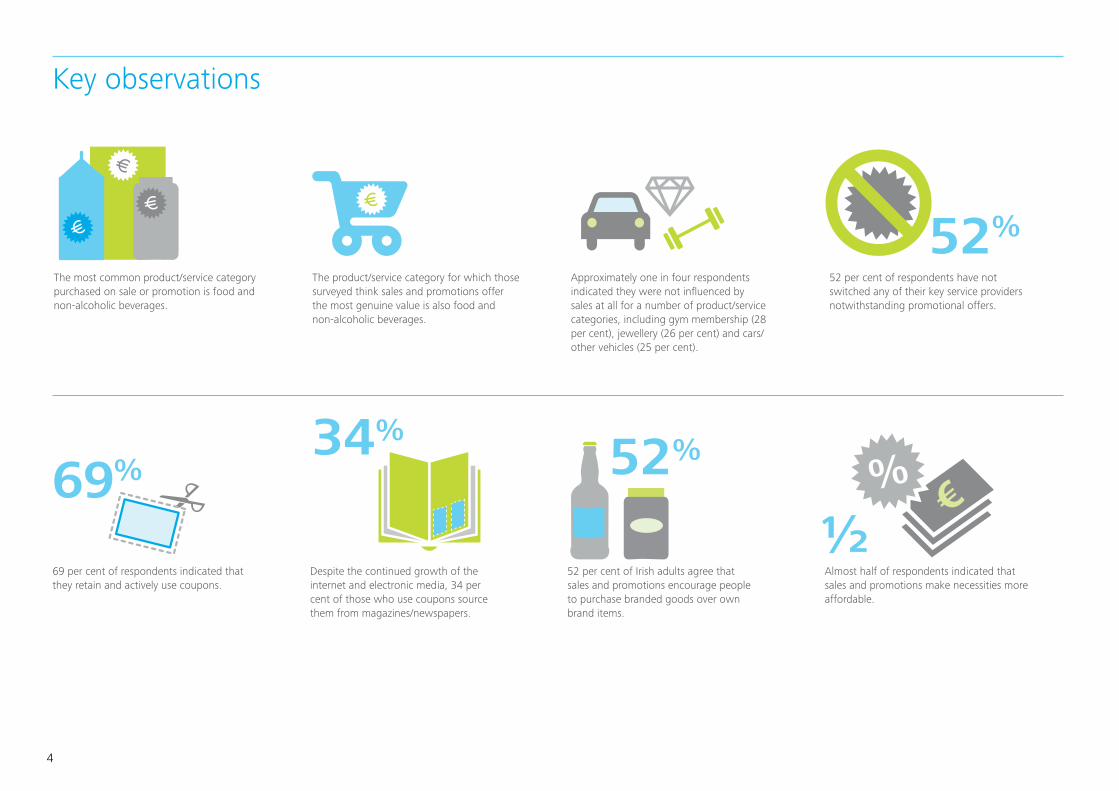
The most common product/service category purchased on sale or promotion is food and non-alcoholic beverages.
69 per cent of respondents indicated that they retain and actively use coupons.
The product/service category for which those surveyed think sales and promotions offer the most genuine value is also food and non-alcoholic beverages.
Despite the continued growth of the internet and electronic media, 34 per cent of those who use coupons source them from magazines/newspapers.
Approximately one in four respondents indicated they were not influenced by sales at all for a number of product/service categories, including gym membership (28 per cent), jewellery (26 per cent) and cars/other vehicles (25 per cent).
52 per cent of Irish adults agree that sales and promotions encourage people to purchase branded goods over own brand items.
52 per cent of respondents have not switched any of their key service providers notwithstanding promotional offers.
Almost half of respondents indicated that sales and promotions make necessities more affordable.
%%
%
%
1/2
52%
5
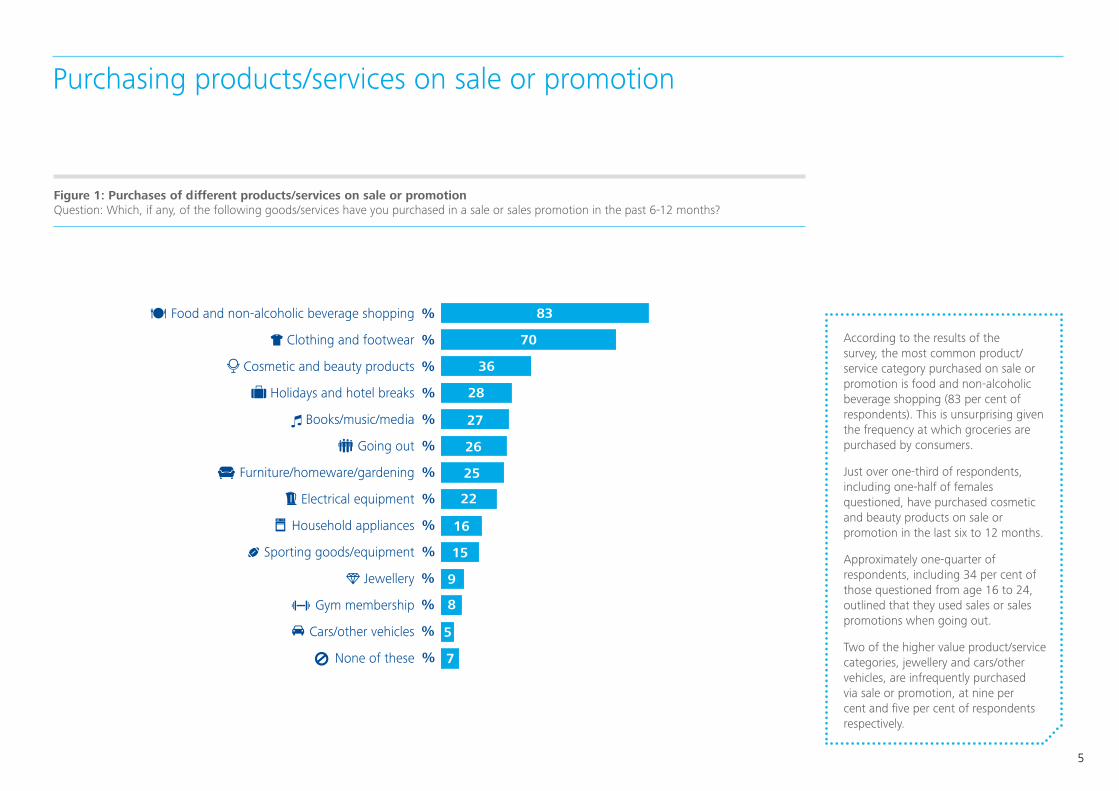
According to the results of the survey, the most common product/service category purchased on sale or promotion is food and non-alcoholic beverage shopping (83 per cent of respondents). This is unsurprising given the frequency at which groceries are purchased by consumers.
Just over one-third of respondents, including one-half of females questioned, have purchased cosmetic and beauty products on sale or promotion in the last six to 12 months.
Approximately one-quarter of respondents, including 34 per cent of those questioned from age 16 to 24, outlined that they used sales or sales promotions when going out.
Two of the higher value product/service categories, jewellery and cars/other vehicles, are infrequently purchased via sale or promotion, at nine per cent and five per cent of respondents respectively.
Figure 1: Purchases of different products/services on sale or promotion Question: Which, if any, of the following goods/services have you purchased in a sale or sales promotion in the past 6-12 months?
Purchases on Sale/Promotion
Food and non-alcoholic beverage shopping
Clothing and footwear
Cosmetic and beauty products
Holidays and hotel breaks
Books/music/media
Going out
Furniture/homeware/gardening
Electrical equipment
Household appliances
Sporting goods/equipment
Jewellery
Gym membership
Cars/other vehicles
None of these
83
70
36
28
27
26
25
22
16
15
9
8
5
7
320 15 916 38
%
%
%
%
%
%
%
%
%
%
%
%
%
%
Purchasing products/services on sale or promotion
6
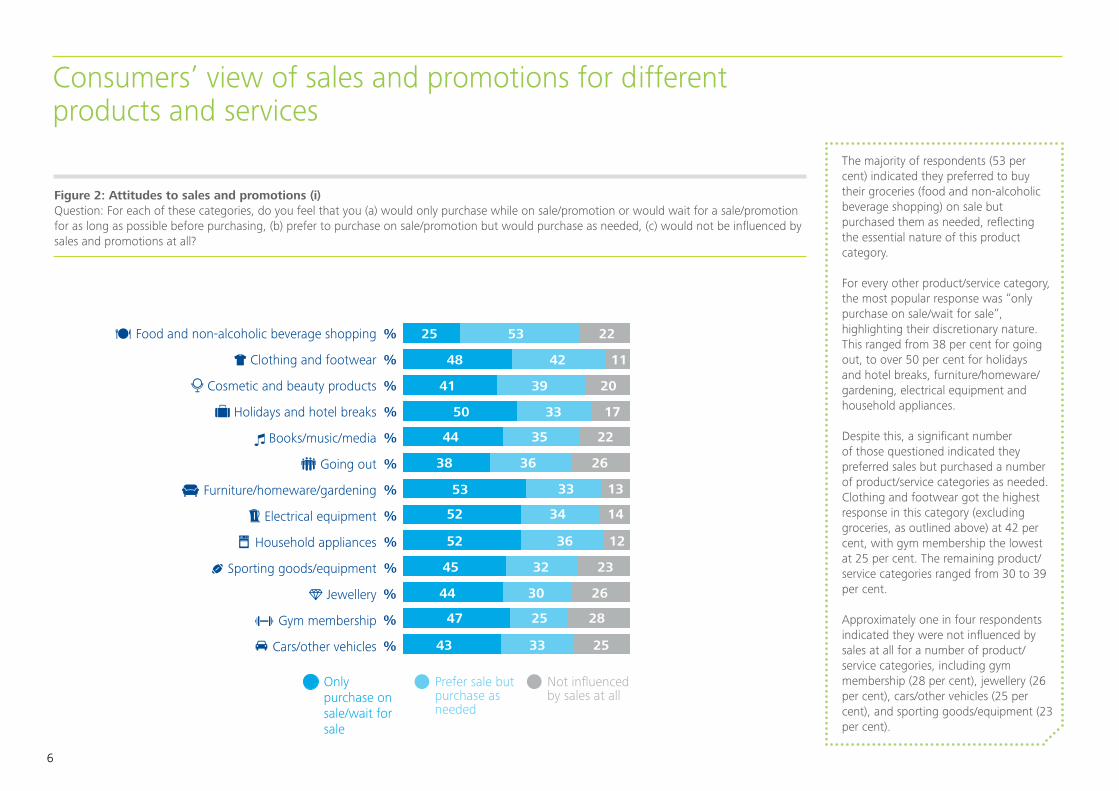
The majority of respondents (53 per cent) indicated they preferred to buy their groceries (food and non-alcoholic beverage shopping) on sale but purchased them as needed, reflecting the essential nature of this product category.
For every other product/service category, the most popular response was “only purchase on sale/wait for sale”, highlighting their discretionary nature. This ranged from 38 per cent for going out, to over 50 per cent for holidays and hotel breaks, furniture/homeware/gardening, electrical equipment and household appliances.
Despite this, a significant number of those questioned indicated they preferred sales but purchased a number of product/service categories as needed. Clothing and footwear got the highest response in this category (excluding groceries, as outlined above) at 42 per cent, with gym membership the lowest at 25 per cent. The remaining product/service categories ranged from 30 to 39 per cent.
Approximately one in four respondents indicated they were not influenced by sales at all for a number of product/service categories, including gym membership (28 per cent), jewellery (26 per cent), cars/other vehicles (25 per cent), and sporting goods/equipment (23 per cent).
Figure 2: Attitudes to sales and promotions (i) Question: For each of these categories, do you feel that you (a) would only purchase while on sale/promotion or would wait for a sale/promotion for as long as possible before purchasing, (b) prefer to purchase on sale/promotion but would purchase as needed, (c) would not be influenced by sales and promotions at all?
Attitudes to Sales/Promotions – I
Food and non-alcoholic beverage shopping
Clothing and footwear
Cosmetic and beauty products
Holidays and hotel breaks
Books/music/media
Going out
Furniture/homeware/gardening
Electrical equipment
Household appliances
Sporting goods/equipment
Jewellery
Gym membership
Cars/other vehicles
25 53 22
48 42 11
41 39 20
50 33 17
44 35 22
38 36 26
53 33 13
52 34 14
52 36 12
45 32 23
44 30 26
47 25 28
43 33 25
7
%
%
%
%
%
%
%
%
%
%
%
%
%
Only purchase on sale/wait for sale
Prefer sale but purchase as needed
Not influenced by sales at all
Consumers’ view of sales and promotions for different products and services
7
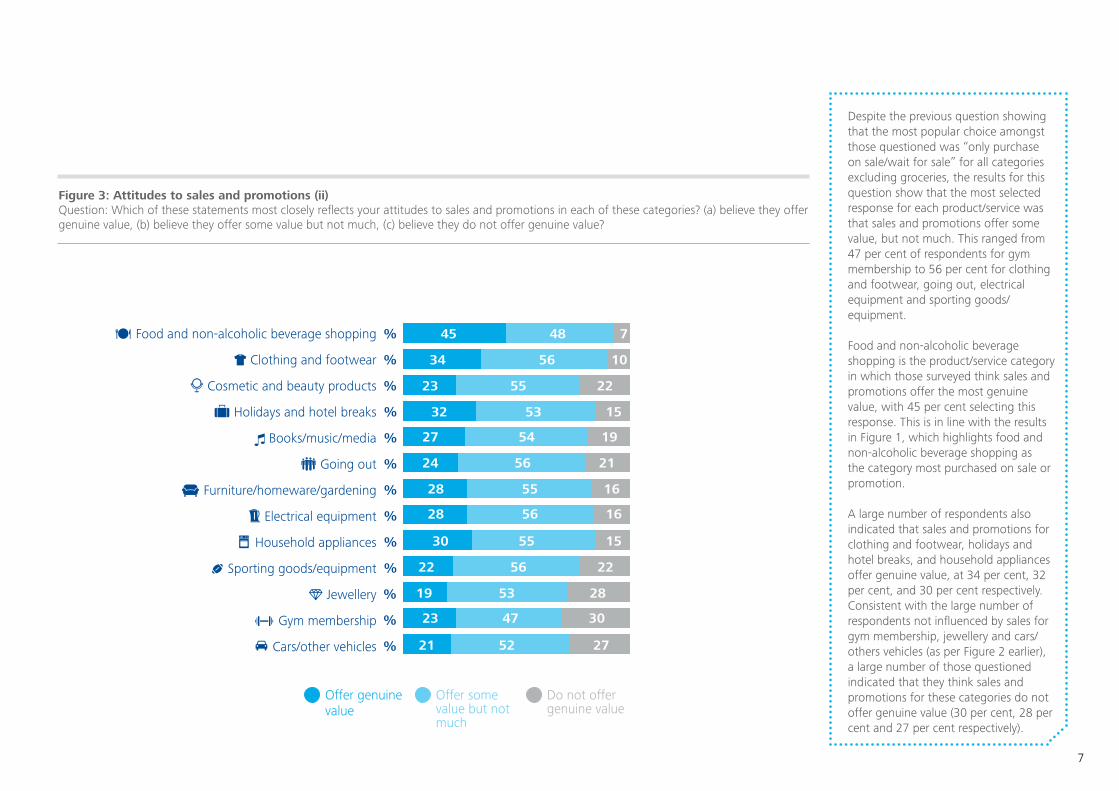
Despite the previous question showing that the most popular choice amongst those questioned was “only purchase on sale/wait for sale” for all categories excluding groceries, the results for this question show that the most selected response for each product/service was that sales and promotions offer some value, but not much. This ranged from 47 per cent of respondents for gym membership to 56 per cent for clothing and footwear, going out, electrical equipment and sporting goods/equipment.
Food and non-alcoholic beverage shopping is the product/service category in which those surveyed think sales and promotions offer the most genuine value, with 45 per cent selecting this response. This is in line with the results in Figure 1, which highlights food and non-alcoholic beverage shopping as the category most purchased on sale or promotion.
A large number of respondents also indicated that sales and promotions for clothing and footwear, holidays and hotel breaks, and household appliances offer genuine value, at 34 per cent, 32 per cent, and 30 per cent respectively.Consistent with the large number of respondents not influenced by sales for gym membership, jewellery and cars/others vehicles (as per Figure 2 earlier), a large number of those questioned indicated that they think sales and promotions for these categories do not offer genuine value (30 per cent, 28 per cent and 27 per cent respectively).
Figure 3: Attitudes to sales and promotions (ii) Question: Which of these statements most closely reflects your attitudes to sales and promotions in each of these categories? (a) believe they offer genuine value, (b) believe they offer some value but not much, (c) believe they do not offer genuine value?
Attitudes to Sales/Promotions – II
Food and non-alcoholic beverage shopping
Clothing and footwear
Cosmetic and beauty products
Holidays and hotel breaks
Books/music/media
Going out
Furniture/homeware/gardening
Electrical equipment
Household appliances
Sporting goods/equipment
Jewellery
Gym membership
Cars/other vehicles
45 48 7
34 56 10
23 55 22
32 53 15
27 54 19
24 56 21
28 55 16
28 56 16
30 55 15
22 56 22
19 53 28
23 47 30
21 52 27
315 9
%
%
%
%
%
%
%
%
%
%
%
%
%
Offer genuine value
Offer some value but not much
Do not offer genuine value
8
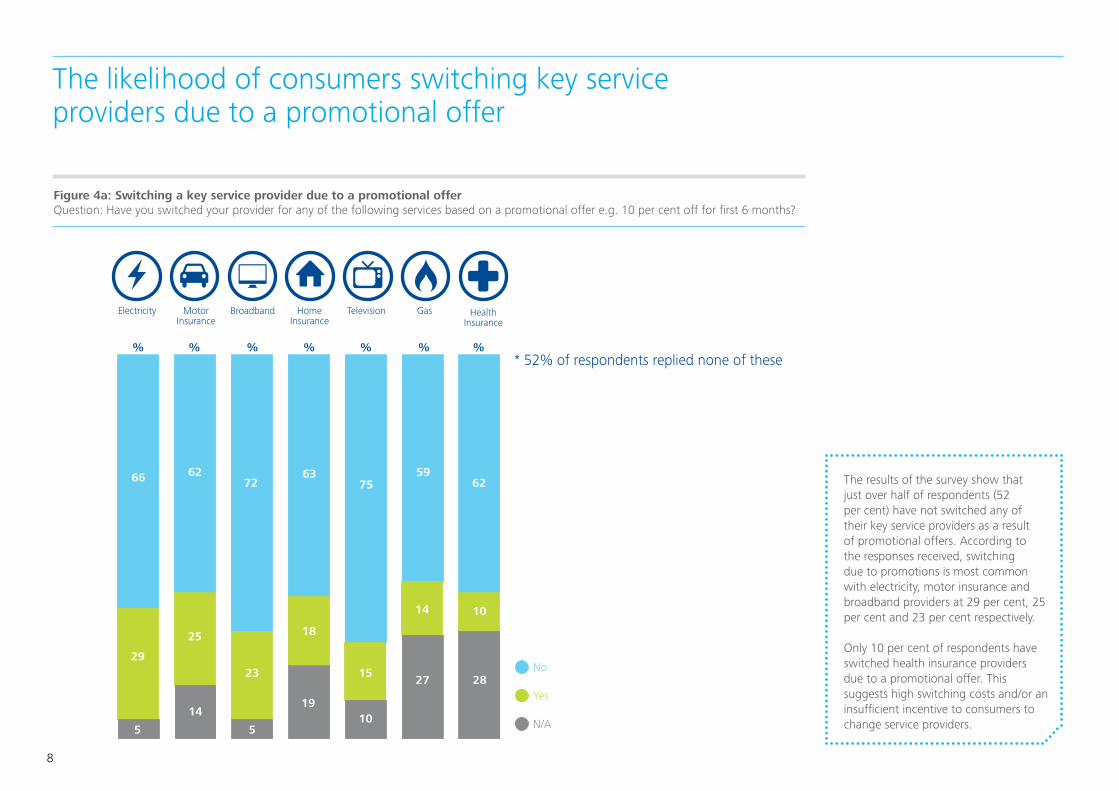
Figure 4a: Switching a key service provider due to a promotional offer Question: Have you switched your provider for any of the following services based on a promotional offer e.g. 10 per cent off for first 6 months?
0
20
40
60
80
100 * 52% of respondents replied none of these
66
29
5
62
25
14
72
23
5
63
18
19
75
15
10
59
14
27
62
10
28
Switched Provider Based on Promotional Offer
% % % % % % %
Yes
No
N/A
Electricity Motor Insurance
Broadband Home Insurance
Television Gas Health Insurance
The results of the survey show that just over half of respondents (52 per cent) have not switched any of their key service providers as a result of promotional offers. According to the responses received, switching due to promotions is most common with electricity, motor insurance and broadband providers at 29 per cent, 25 per cent and 23 per cent respectively. Only 10 per cent of respondents have switched health insurance providers due to a promotional offer. This suggests high switching costs and/or an insufficient incentive to consumers to change service providers.
The likelihood of consumers switching key service providers due to a promotional offer
90
20
40
60
80
100
Electricity Motor Insurance
Broadband Home Insurance
Television Gas Health Insurance
69
31
75
25
72
28
76
24
71
29
69
31
66
34
Subsequently Switched Back
% % % % % % %
Yes
No
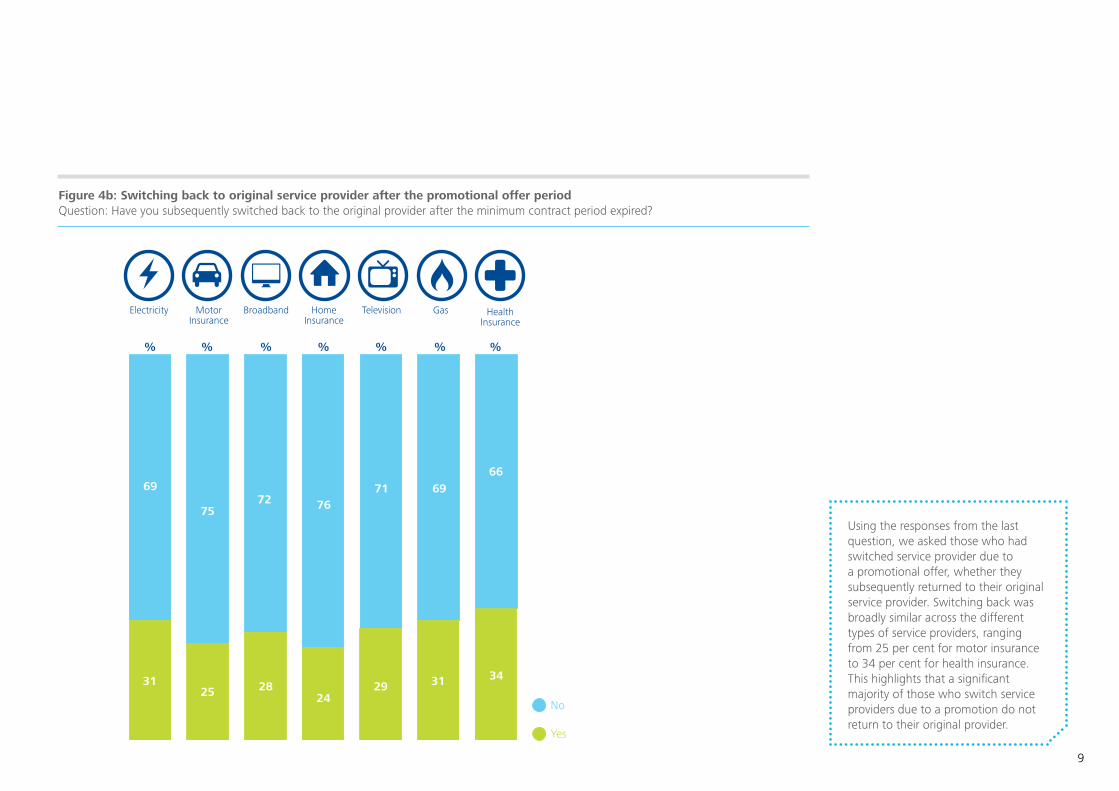
Using the responses from the last question, we asked those who had switched service provider due to a promotional offer, whether they subsequently returned to their original service provider. Switching back was broadly similar across the different types of service providers, ranging from 25 per cent for motor insurance to 34 per cent for health insurance. This highlights that a significant majority of those who switch service providers due to a promotion do not return to their original provider.
Figure 4b: Switching back to original service provider after the promotional offer period Question: Have you subsequently switched back to the original provider after the minimum contract period expired?
10
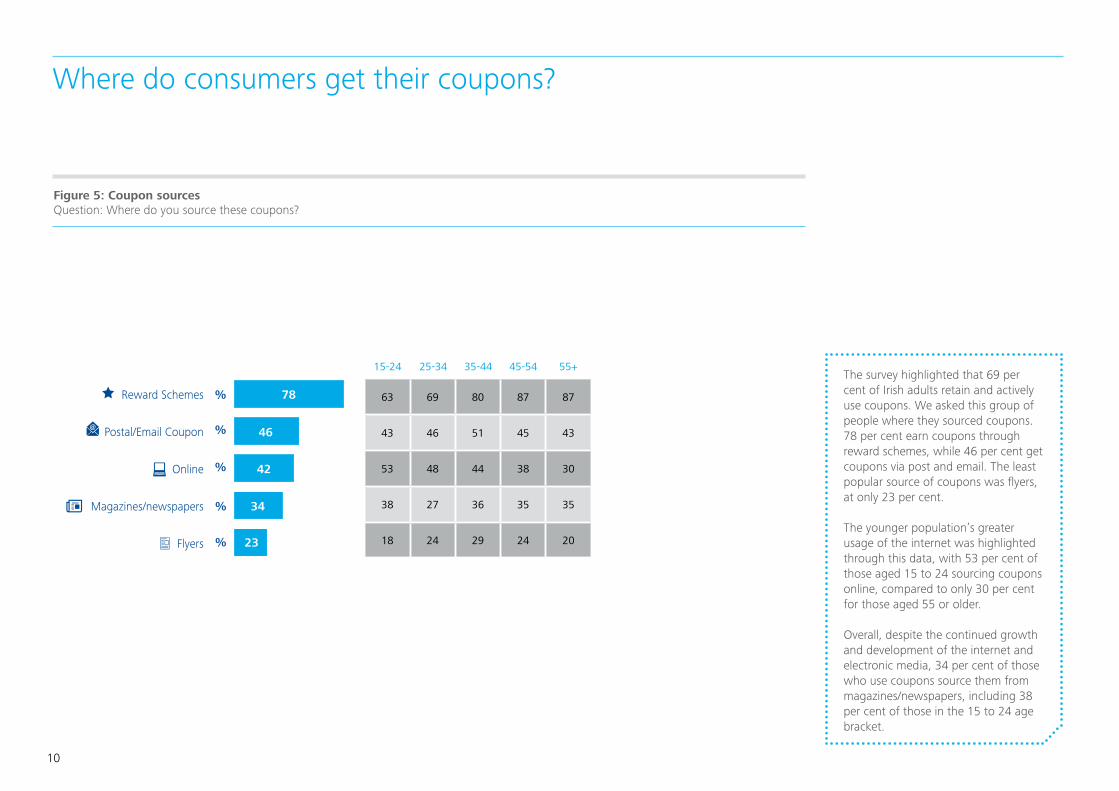
The survey highlighted that 69 per cent of Irish adults retain and actively use coupons. We asked this group of people where they sourced coupons. 78 per cent earn coupons through reward schemes, while 46 per cent get coupons via post and email. The least popular source of coupons was flyers, at only 23 per cent.
The younger population’s greater usage of the internet was highlighted through this data, with 53 per cent of those aged 15 to 24 sourcing coupons online, compared to only 30 per cent for those aged 55 or older.
Overall, despite the continued growth and development of the internet and electronic media, 34 per cent of those who use coupons source them from magazines/newspapers, including 38 per cent of those in the 15 to 24 age bracket.
Where do consumers get their coupons?
Figure 5: Coupon sources Question: Where do you source these coupons?
Reward Schemes
Postal/Email Coupon
Online
Magazines/newspapers
Flyers
Coupon Sources
%
%
%
%
%
78
46
42
34
23
31
30
63 69 80 87 87
43 46 51 45 43
53 48 44 38 30
38 27 36 35 35
18 24 29 24 20
15-24 25-34 35-44 45-54 55+
11
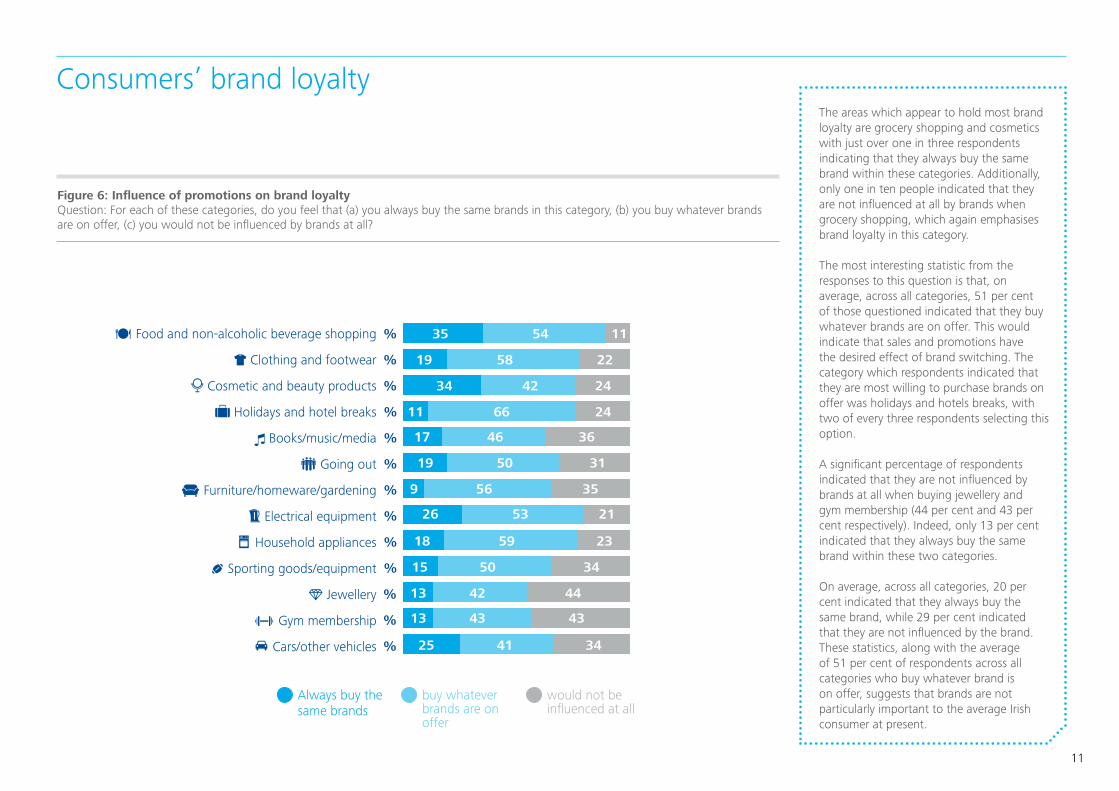
Figure 6: Influence of promotions on brand loyalty Question: For each of these categories, do you feel that (a) you always buy the same brands in this category, (b) you buy whatever brands are on offer, (c) you would not be influenced by brands at all?
The areas which appear to hold most brand loyalty are grocery shopping and cosmetics with just over one in three respondents indicating that they always buy the same brand within these categories. Additionally, only one in ten people indicated that they are not influenced at all by brands when grocery shopping, which again emphasises brand loyalty in this category.
The most interesting statistic from the responses to this question is that, on average, across all categories, 51 per cent of those questioned indicated that they buy whatever brands are on offer. This would indicate that sales and promotions have the desired effect of brand switching. The category which respondents indicated that they are most willing to purchase brands on offer was holidays and hotels breaks, with two of every three respondents selecting this option.
A significant percentage of respondents indicated that they are not influenced by brands at all when buying jewellery and gym membership (44 per cent and 43 per cent respectively). Indeed, only 13 per cent indicated that they always buy the same brand within these two categories.
On average, across all categories, 20 per cent indicated that they always buy the same brand, while 29 per cent indicated that they are not influenced by the brand. These statistics, along with the average of 51 per cent of respondents across all categories who buy whatever brand is on offer, suggests that brands are not particularly important to the average Irish consumer at present.
Consumers’ brand loyalty
Attitudes to Sales/Promotions – II
Food and non-alcoholic beverage shopping
Clothing and footwear
Cosmetic and beauty products
Holidays and hotel breaks
Books/music/media
Going out
Furniture/homeware/gardening
Electrical equipment
Household appliances
Sporting goods/equipment
Jewellery
Gym membership
Cars/other vehicles
35 54 11
19 58 22
34 42 24
11 66 24
17 46 36
19 50 31
9 56 35
26 53 21
18 59 23
15 50 34
13 42 44
13 43 43
25 41 34
315 9
%
%
%
%
%
%
%
%
%
%
%
%
%
Always buy the same brands
buy whatever brands are on offer
would not be influenced at all
12
In store
Email offers
Friends/family/colleagues
Newspaper
TV/Radio
Direct mail
Postal offers
Sources of Information for Sales/Promotions
%
%
%
%
%
%
%
67
46
33
32
31
31
30
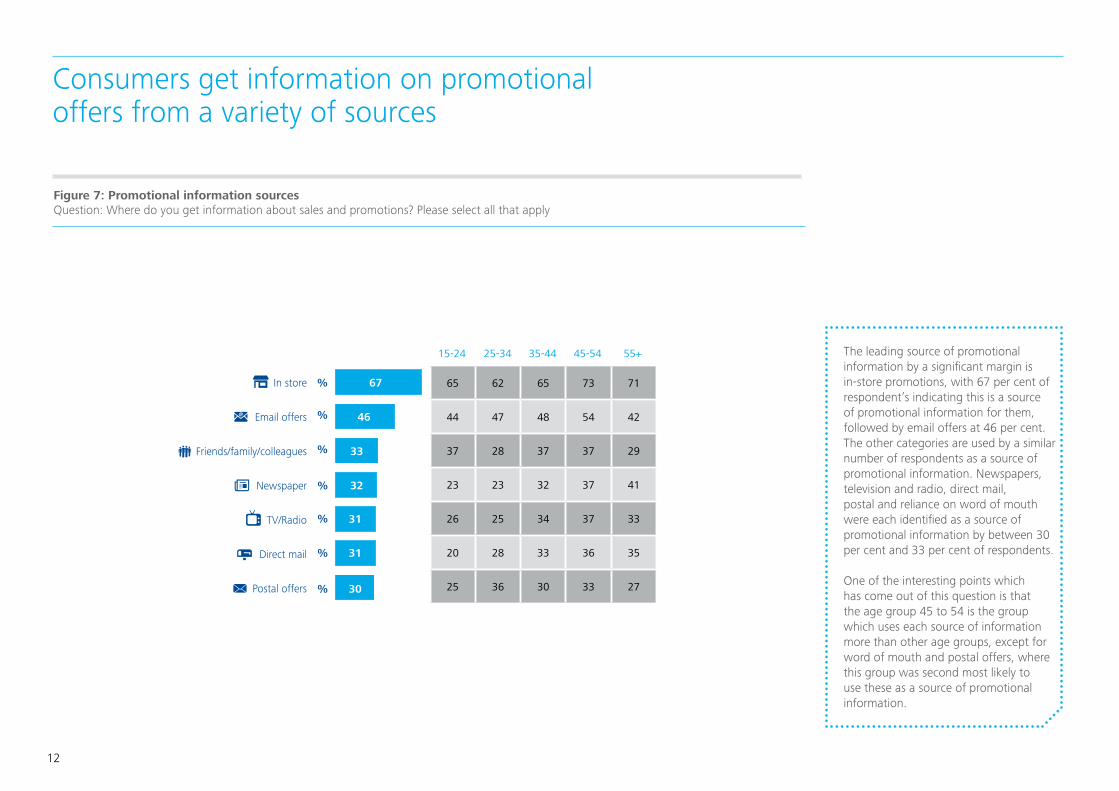
Consumers get information on promotional offers from a variety of sources
The leading source of promotional information by a significant margin is in-store promotions, with 67 per cent of respondent’s indicating this is a source of promotional information for them, followed by email offers at 46 per cent. The other categories are used by a similar number of respondents as a source of promotional information. Newspapers, television and radio, direct mail, postal and reliance on word of mouth were each identified as a source of promotional information by between 30 per cent and 33 per cent of respondents.
One of the interesting points which has come out of this question is that the age group 45 to 54 is the group which uses each source of information more than other age groups, except for word of mouth and postal offers, where this group was second most likely to use these as a source of promotional information.
Figure 7: Promotional information sources Question: Where do you get information about sales and promotions? Please select all that apply
65 62 65 73 71
44 47 48 54 42
37 28 37 37 29
23 23 32 37 41
26 25 34 37 33
20 28 33 36 35
25 36 30 33 27
15-24 25-34 35-44 45-54 55+
13
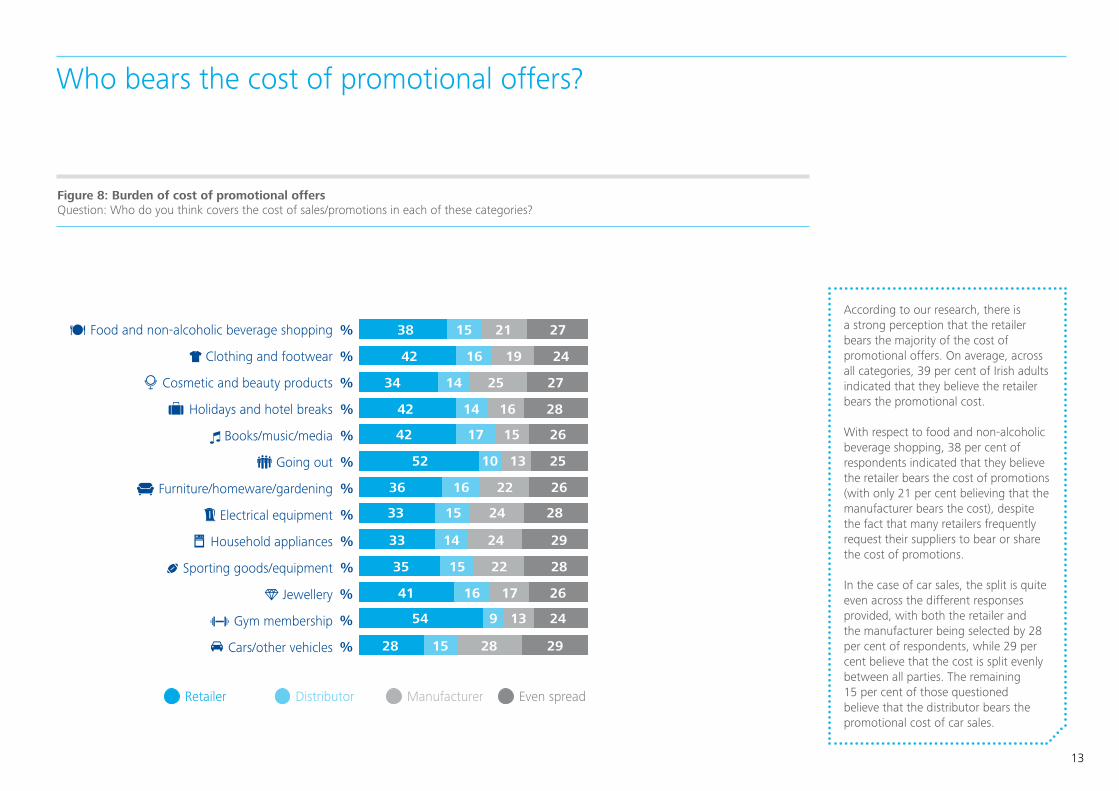
Figure 8: Burden of cost of promotional offers Question: Who do you think covers the cost of sales/promotions in each of these categories?
According to our research, there is a strong perception that the retailer bears the majority of the cost of promotional offers. On average, across all categories, 39 per cent of Irish adults indicated that they believe the retailer bears the promotional cost.
With respect to food and non-alcoholic beverage shopping, 38 per cent of respondents indicated that they believe the retailer bears the cost of promotions (with only 21 per cent believing that the manufacturer bears the cost), despite the fact that many retailers frequently request their suppliers to bear or share the cost of promotions.
In the case of car sales, the split is quite even across the different responses provided, with both the retailer and the manufacturer being selected by 28 per cent of respondents, while 29 per cent believe that the cost is split evenly between all parties. The remaining 15 per cent of those questioned believe that the distributor bears the promotional cost of car sales.
Who bears the cost of promotional offers?
Perceived Sales/Promotion Burden
Food and non-alcoholic beverage shopping
Clothing and footwear
Cosmetic and beauty products
Holidays and hotel breaks
Books/music/media
Going out
Furniture/homeware/gardening
Electrical equipment
Household appliances
Sporting goods/equipment
Jewellery
Gym membership
Cars/other vehicles
38 2115 27
42 1916 24
34 2514 27
42 1614 28
42 17 15 26
52 10 13 25
36 2216 26
33 2415 28
33 2414 29
35 2215 28
41 16 17 26
54 9 13 24
28 15 28 29
315 9
%
%
%
%
%
%
%
%
%
%
%
%
%
Distributor ManufacturerRetailer Even spread
14
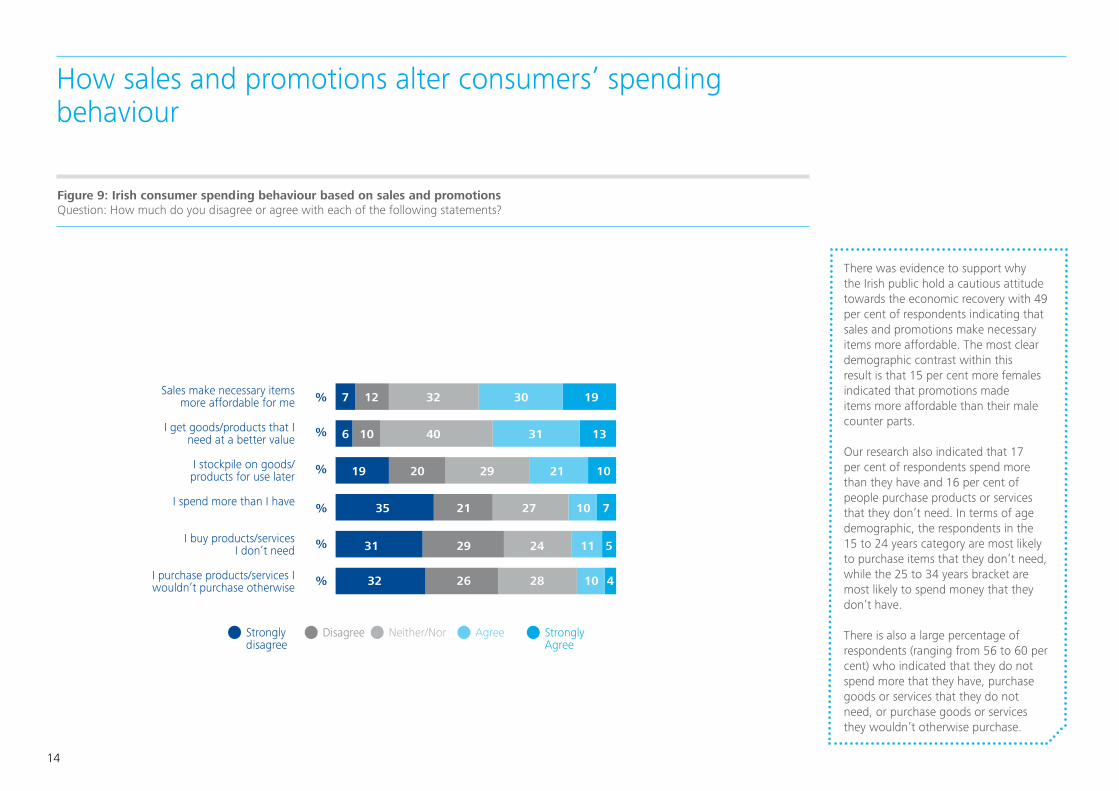
Figure 9: Irish consumer spending behaviour based on sales and promotions Question: How much do you disagree or agree with each of the following statements?
There was evidence to support why the Irish public hold a cautious attitude towards the economic recovery with 49 per cent of respondents indicating that sales and promotions make necessary items more affordable. The most clear demographic contrast within this result is that 15 per cent more females indicated that promotions made items more affordable than their male counter parts.
Our research also indicated that 17 per cent of respondents spend more than they have and 16 per cent of people purchase products or services that they don’t need. In terms of age demographic, the respondents in the 15 to 24 years category are most likely to purchase items that they don’t need, while the 25 to 34 years bracket are most likely to spend money that they don’t have.
There is also a large percentage of respondents (ranging from 56 to 60 per cent) who indicated that they do not spend more that they have, purchase goods or services that they do not need, or purchase goods or services they wouldn’t otherwise purchase.
How sales and promotions alter consumers’ spending behaviour
Sales make necessary items more affordable for me
I get goods/products that I need at a better value
I stockpile on goods/products for use later
I spend more than I have
I buy products/services I don’t need
I purchase products/services I wouldn’t purchase otherwise
Spending Behaviours Based on Sales/Promotions
%
%
%
%
%
%
Strongly disagree
Disagree Neither/Nor Agree Strongly Agree
7
6
19
35
31
32 26 28 10 4
29 24 11 5
21 27 10 7
20 29 21 10
10 40 31 13
12 32 30 19
15
Deloitte perspective
For each product/service category excluding groceries, the most popular option amongst consumers is to “only purchase on sale/wait for sale”, highlighting the effectiveness of sales and promotions in encouraging the purchase of discretionary products and services.
On average, across all categories, approximately one-half of respondents advised that they buy whatever brands are on offer, while 29 per cent indicated they are not influenced by brands, highlighting a lack of brand loyalty amongst many Irish consumers. It also indicates that sales and promotions achieve the desired goal of brand switching.
A significant majority of those who switch service providers due to a promotion do not return to their original provider, which suggests promotions are an effective method of acquiring new customers for key service providers.
Just over two-thirds of Irish adults retain and actively use coupons, which indicate this is an effective means of promotion for Irish businesses.

16
The Deloitte Ireland Consumer Tracker
Introducing the Deloitte Ireland Consumer Tracker
The Deloitte Consumer Tracker provides a regular update on changes in consumer spending, attitudes and behaviours.
%
Welcome to the second edition of the bi-annual Deloitte Ireland Consumer Tracker
The Deloitte Consumer Tracker is a forward-looking economic update focused on consumer spending attitudes and behaviours. Through our proprietary consumer survey, we gain detailed insight not only into the patterns of consumer expenditure on a category by category basis, but also the underlying drivers of spending behaviour, notably household disposable income and consumer confidence.
The Deloitte Consumer Tracker aims to reflect consumer confidence levels in the market through monitoring and comparison of key consumer indicators such as overall consumer confidence, confidence in level of disposable income, spending essentials and spending on discretionary goods and services.
In this issue of the Deloitte Ireland Consumer Tracker, we surveyed a number of consumers on these key indicators in September 2014 with respect to the prior 6 months as well as surveying consumers’ outlook for the following 6 months.
17
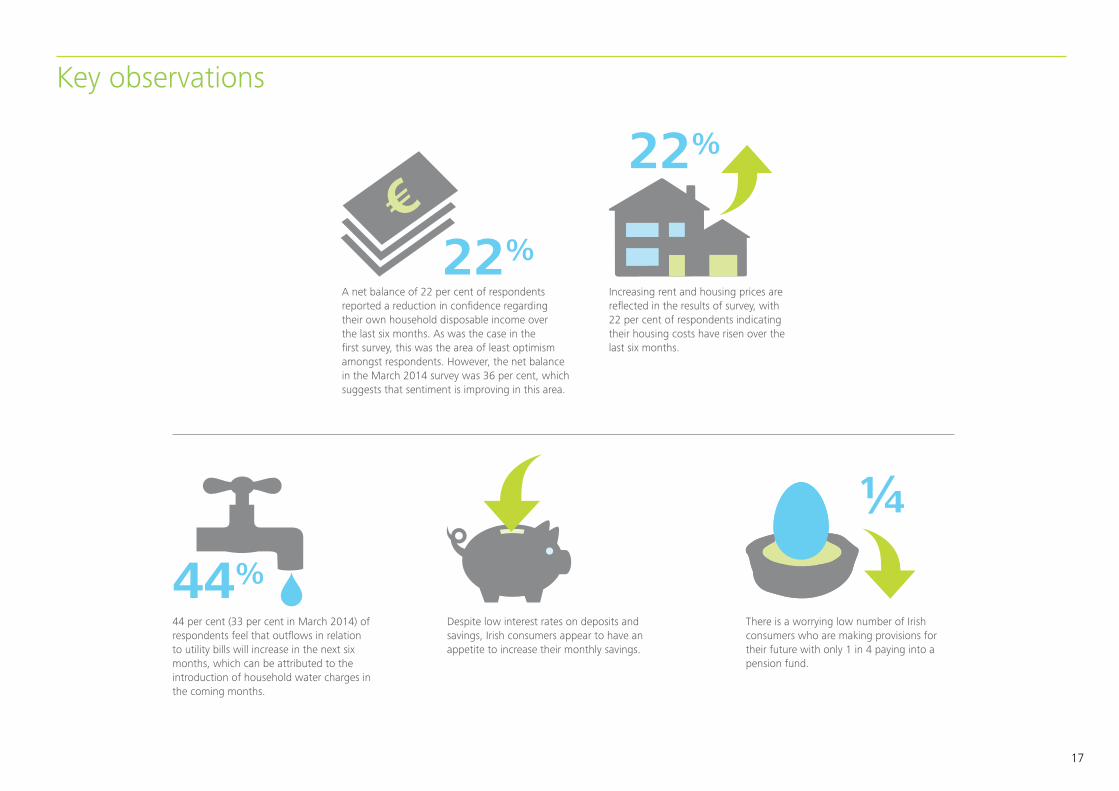
Key observations
A net balance of 22 per cent of respondents reported a reduction in confidence regarding their own household disposable income over the last six months. As was the case in the first survey, this was the area of least optimism amongst respondents. However, the net balance in the March 2014 survey was 36 per cent, which suggests that sentiment is improving in this area.
Increasing rent and housing prices are reflected in the results of survey, with 22 per cent of respondents indicating their housing costs have risen over the last six months.
44 per cent (33 per cent in March 2014) of respondents feel that outflows in relation to utility bills will increase in the next six months, which can be attributed to the introduction of household water charges in the coming months.
There is a worrying low number of Irish consumers who are making provisions for their future with only 1 in 4 paying into a pension fund.
Despite low interest rates on deposits and savings, Irish consumers appear to have an appetite to increase their monthly savings.
22
1/4
22
44
%
%
%
18
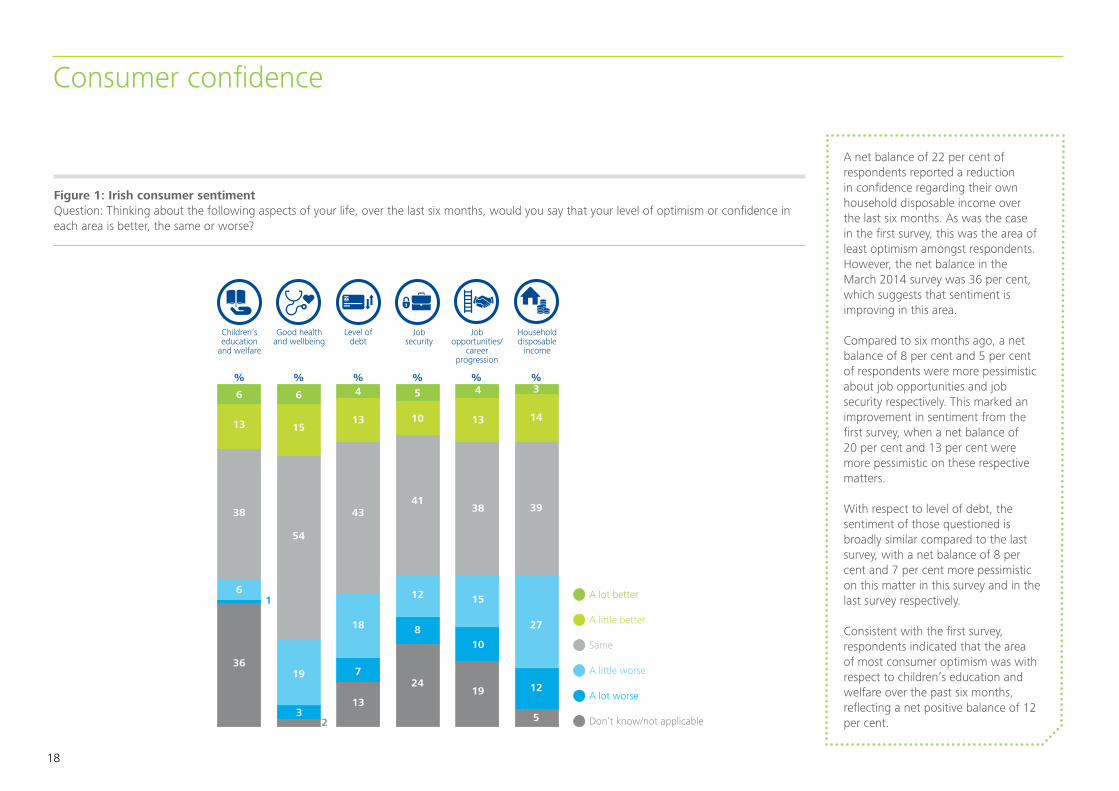
A net balance of 22 per cent of respondents reported a reduction in confidence regarding their own household disposable income over the last six months. As was the case in the first survey, this was the area of least optimism amongst respondents. However, the net balance in the March 2014 survey was 36 per cent, which suggests that sentiment is improving in this area.
Compared to six months ago, a net balance of 8 per cent and 5 per cent of respondents were more pessimistic about job opportunities and job security respectively. This marked an improvement in sentiment from the first survey, when a net balance of 20 per cent and 13 per cent were more pessimistic on these respective matters.
With respect to level of debt, the sentiment of those questioned is broadly similar compared to the last survey, with a net balance of 8 per cent and 7 per cent more pessimistic on this matter in this survey and in the last survey respectively.
Consistent with the first survey, respondents indicated that the area of most consumer optimism was with respect to children’s education and welfare over the past six months, reflecting a net positive balance of 12 per cent.
Figure 1: Irish consumer sentimentQuestion: Thinking about the following aspects of your life, over the last six months, would you say that your level of optimism or confidence in each area is better, the same or worse?
0
20
40
60
80
100
Children’s education
and welfare
Good health and wellbeing
Level of debt
Job security
Job opportunities/
career progression
Household disposable
income
6
13
38
61
2
36
6 4 5
10
41
12
8
24
4
13
38
15
10
19
3
14
39
27
5
12
13
43
18
7
13
15
54
19
3
Levels of optimism over last 6 months
% % % % % %
A lot worse
A little worse
Same
Don’t know/not applicable
A little better
A lot better
Consumer confidence
19
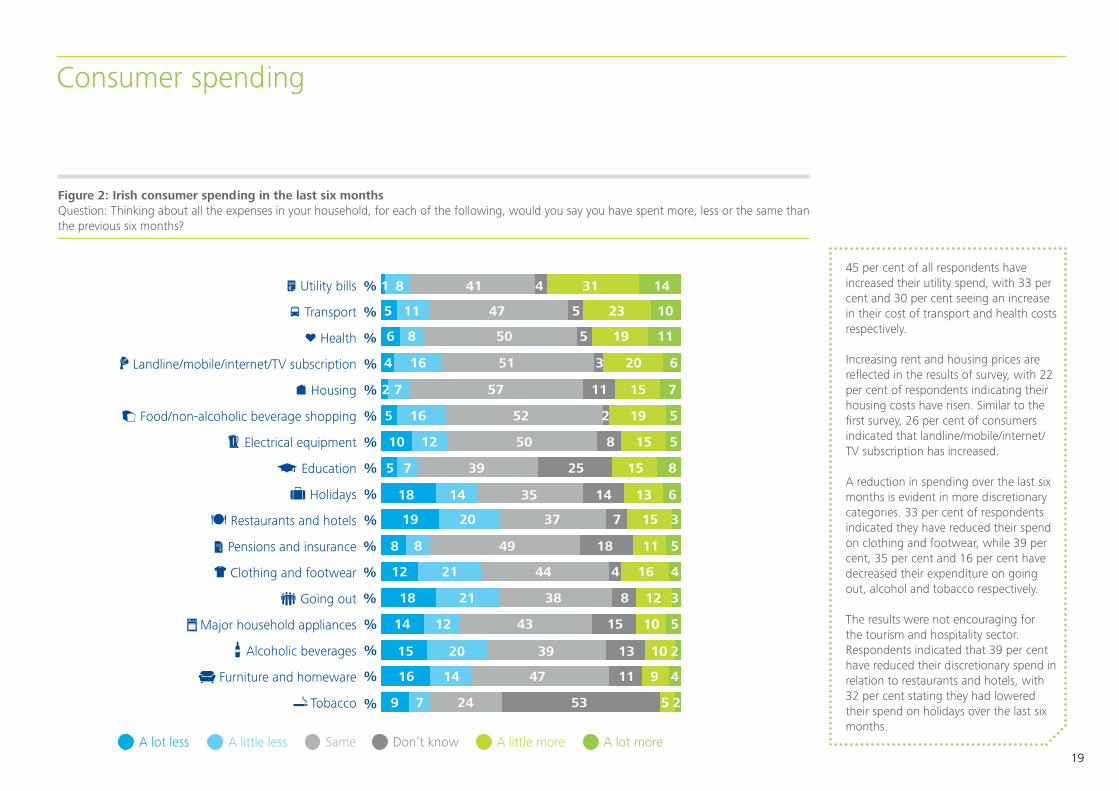
45 per cent of all respondents have increased their utility spend, with 33 per cent and 30 per cent seeing an increase in their cost of transport and health costs respectively.
Increasing rent and housing prices are reflected in the results of survey, with 22 per cent of respondents indicating their housing costs have risen. Similar to the first survey, 26 per cent of consumers indicated that landline/mobile/internet/TV subscription has increased. A reduction in spending over the last six months is evident in more discretionary categories. 33 per cent of respondents indicated they have reduced their spend on clothing and footwear, while 39 per cent, 35 per cent and 16 per cent have decreased their expenditure on going out, alcohol and tobacco respectively.
The results were not encouraging for the tourism and hospitality sector. Respondents indicated that 39 per cent have reduced their discretionary spend in relation to restaurants and hotels, with 32 per cent stating they had lowered their spend on holidays over the last six months.
Figure 2: Irish consumer spending in the last six months Question: Thinking about all the expenses in your household, for each of the following, would you say you have spent more, less or the same than the previous six months?
Comparisons in household expenses – Last 6 months
Utility bills
Transport
Health
Landline/mobile/internet/TV subscription
Housing
Food/non-alcoholic beverage shopping
Electrical equipment
Education
Holidays
Restaurants and hotels
Pensions and insurance
Clothing and footwear
Going out
Major household appliances
Alcoholic beverages
Furniture and homeware
Tobacco
1 4 31 148 41
5 5 23 1011 47
6 5 19 118 50
4 3 20 616 51
2 11 15 77 57
5 2 19 516 52
10 8 15 512 50
5 25 15 87 39
18 14 13 614 35
19 7 15 320 37
8 18 11 58 49
12 4 16 4
3
5
2
4
21 44
18 8 1221 38
14 15 1012 43
15 13 1020 39
9 7 24 53 5 2
9111416 47
%
%
%
%
%
%
%
%
%
%
%
%
%
%
%
%
%
A lot less A little less Same Don’t know A little more A lot more
Consumer spending
20
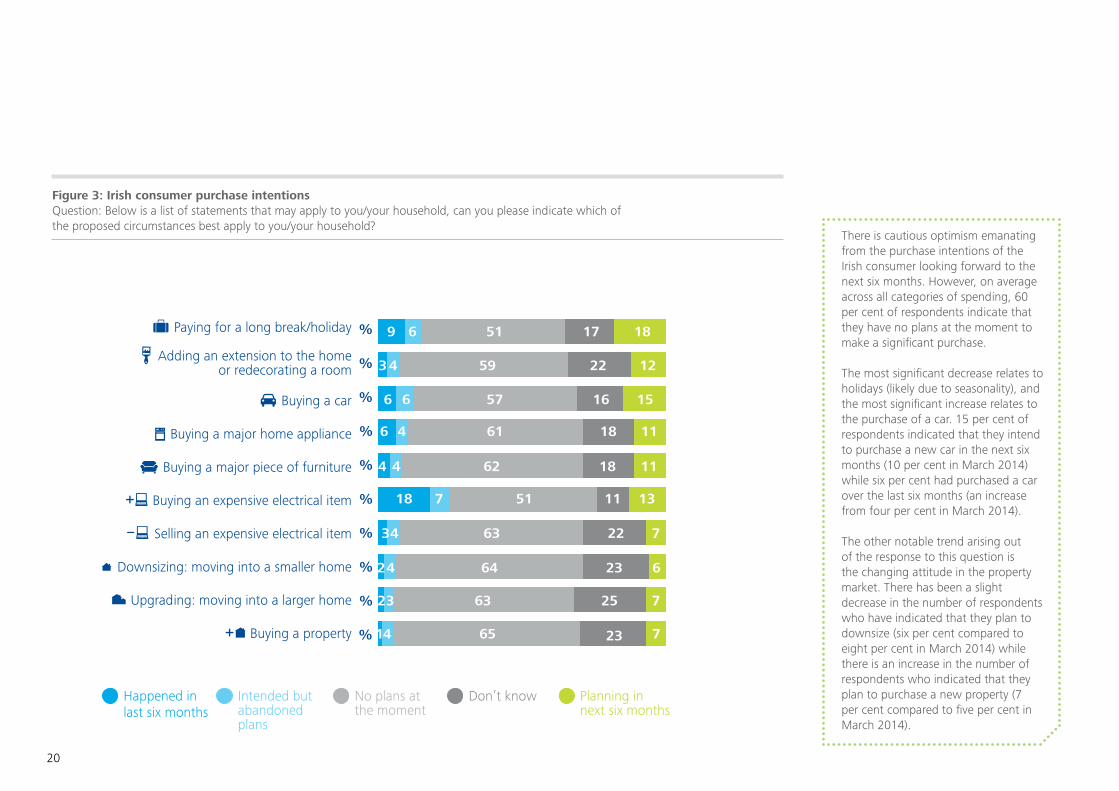
There is cautious optimism emanating from the purchase intentions of the Irish consumer looking forward to the next six months. However, on average across all categories of spending, 60 per cent of respondents indicate that they have no plans at the moment to make a significant purchase.
The most significant decrease relates to holidays (likely due to seasonality), and the most significant increase relates to the purchase of a car. 15 per cent of respondents indicated that they intend to purchase a new car in the next six months (10 per cent in March 2014) while six per cent had purchased a car over the last six months (an increase from four per cent in March 2014).
The other notable trend arising out of the response to this question is the changing attitude in the property market. There has been a slight decrease in the number of respondents who have indicated that they plan to downsize (six per cent compared to eight per cent in March 2014) while there is an increase in the number of respondents who indicated that they plan to purchase a new property (7 per cent compared to five per cent in March 2014).
Figure 3: Irish consumer purchase intentionsQuestion: Below is a list of statements that may apply to you/your household, can you please indicate which of the proposed circumstances best apply to you/your household?
Events in the household
Paying for a long break/holiday
Adding an extension to the home or redecorating a room
Buying a car
Buying a major home appliance
Buying a major piece of furniture
Buying an expensive electrical item
Selling an expensive electrical item
Downsizing: moving into a smaller home
Upgrading: moving into a larger home
Buying a property
%
%
%
%
%
%
%
%
%
%
Happened in last six months
Intended but abandoned plans
No plans at the moment
Don’t know Planning in next six months
9 17 186 51
3 22 124 59
6 16 156 57
6 18 114 61
4 18 114 62
18 11 137 51
3 22 74 63
2 23 64 64
2 25 73 63
1 23 74 65
21
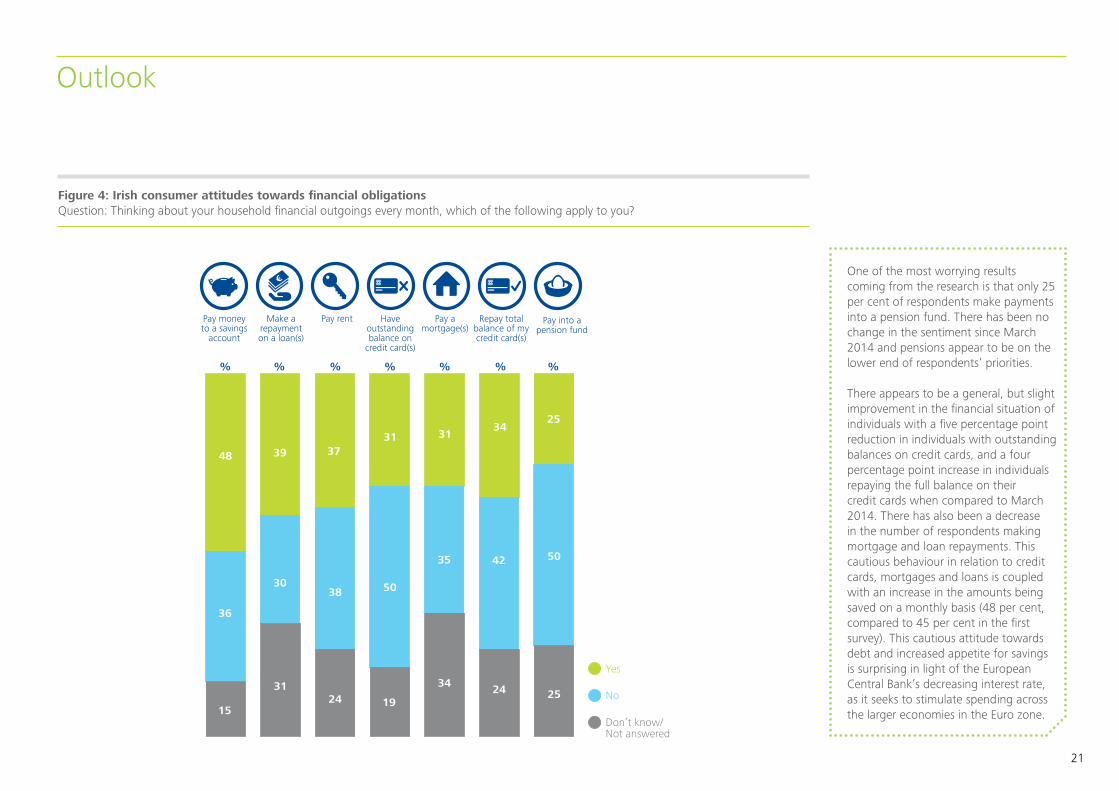
One of the most worrying results coming from the research is that only 25 per cent of respondents make payments into a pension fund. There has been no change in the sentiment since March 2014 and pensions appear to be on the lower end of respondents’ priorities.
There appears to be a general, but slight improvement in the financial situation of individuals with a five percentage point reduction in individuals with outstanding balances on credit cards, and a four percentage point increase in individuals repaying the full balance on their credit cards when compared to March 2014. There has also been a decrease in the number of respondents making mortgage and loan repayments. This cautious behaviour in relation to credit cards, mortgages and loans is coupled with an increase in the amounts being saved on a monthly basis (48 per cent, compared to 45 per cent in the first survey). This cautious attitude towards debt and increased appetite for savings is surprising in light of the European Central Bank’s decreasing interest rate, as it seeks to stimulate spending across the larger economies in the Euro zone.
Figure 4: Irish consumer attitudes towards financial obligations Question: Thinking about your household financial outgoings every month, which of the following apply to you?
Outlook
0
20
40
60
80
100
Pay money to a savings
account
Make a repayment on a loan(s)
Pay rent Have outstanding balance on
credit card(s)
Pay a mortgage(s)
Repay total balance of my credit card(s)
Pay into a pension fund
48
36
15
39
30
31
37
38
24
31
50
19
31
35
34
34
42
24
25
50
25
Household financial outgoings every month
% % % % % % %
No
Yes
Don’t know/ Not answered
22
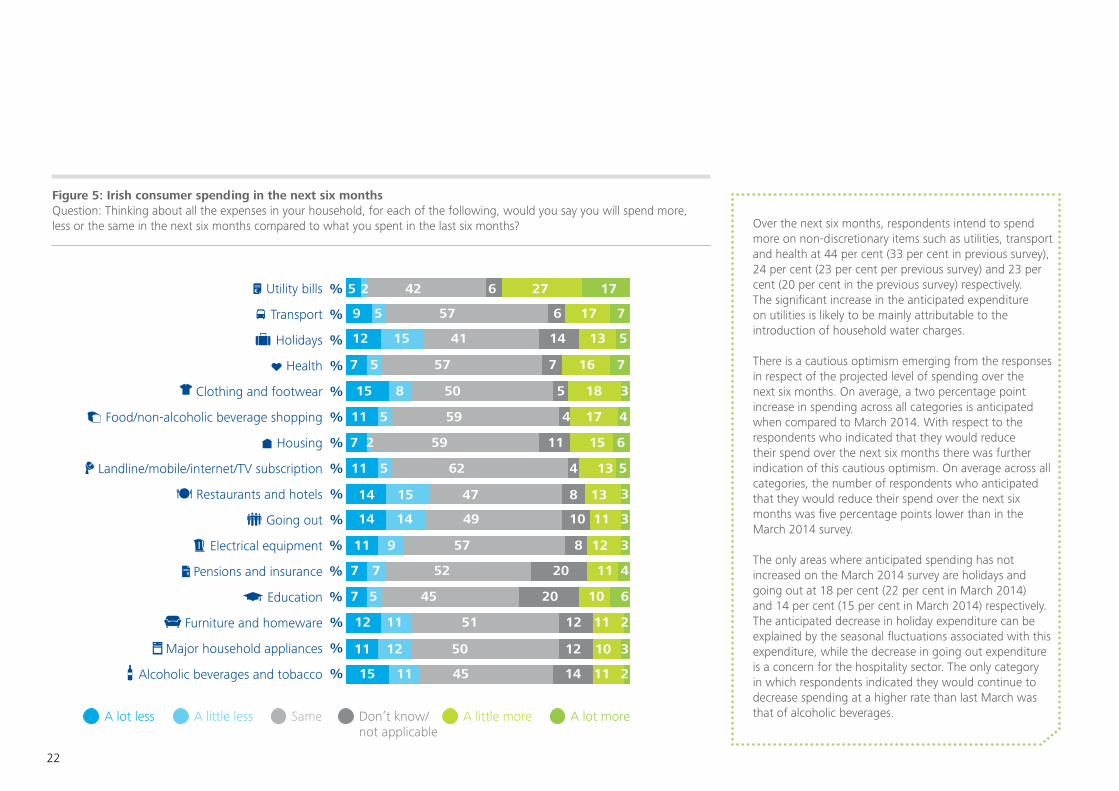
Over the next six months, respondents intend to spend more on non-discretionary items such as utilities, transport and health at 44 per cent (33 per cent in previous survey), 24 per cent (23 per cent per previous survey) and 23 per cent (20 per cent in the previous survey) respectively. The significant increase in the anticipated expenditure on utilities is likely to be mainly attributable to the introduction of household water charges.
There is a cautious optimism emerging from the responses in respect of the projected level of spending over the next six months. On average, a two percentage point increase in spending across all categories is anticipated when compared to March 2014. With respect to the respondents who indicated that they would reduce their spend over the next six months there was further indication of this cautious optimism. On average across all categories, the number of respondents who anticipated that they would reduce their spend over the next six months was five percentage points lower than in the March 2014 survey.
The only areas where anticipated spending has not increased on the March 2014 survey are holidays and going out at 18 per cent (22 per cent in March 2014) and 14 per cent (15 per cent in March 2014) respectively. The anticipated decrease in holiday expenditure can be explained by the seasonal fluctuations associated with this expenditure, while the decrease in going out expenditure is a concern for the hospitality sector. The only category in which respondents indicated they would continue to decrease spending at a higher rate than last March was that of alcoholic beverages.
Figure 5: Irish consumer spending in the next six months Question: Thinking about all the expenses in your household, for each of the following, would you say you will spend more, less or the same in the next six months compared to what you spent in the last six months?
Comparisons in household expenses – Next 3 months
Utility bills
Transport
Holidays
Health
Clothing and footwear
Food/non-alcoholic beverage shopping
Housing
Landline/mobile/internet/TV subscription
Restaurants and hotels
Going out
Electrical equipment
Pensions and insurance
Education
Furniture and homeware
Major household appliances
Alcoholic beverages and tobacco
5 6 27 172 42
9 6 17 75 57
12 14 13 515 41
7 7 16 75 57
15 5 18 38 50
11 4 17 45 59
7 11 15 62 59
11 5
3
3
3
4
2
4 135 62
14 8 1315 47
14 10 1114 49
11 8 129 57
7 20 11
6
3
2
7 52
7 20 105 45
12 12 1111 51
11 12 1012 50
15 14 1111 45
%
%
%
%
%
%
%
%
%
%
%
%
%
%
%
%
A lot less A little less Same Don’t know/not applicable
A little more A lot more
23
Deloitte perspective
On balance, the Irish consumer still feels cautious about their financial situation, but sentiment has improved since our last survey. There is a continuation of the trend that individuals are looking to save rather than spend when looking forward to the next six months.
This is a concern for traders who, on the basis of this research, will have to continue to work hard to grow revenues in the coming months. Given consumers’ cautious attitudes towards spending, traders may need to look at innovative ways of enticing consumers to part with their monies. There are additional insights into consumers’ opinions in relation to this in the sales and promotions section of this publication.
ContactsFor more details please contact:
DublinDeloitte & ToucheDeloitte & Touche HouseEarlsfort TerraceDublin 2T: +353 1 417 2200F: +353 1 417 2300
CorkDeloitte & ToucheNo.6 Lapp’s QuayCorkT: +353 21 490 7000F: +353 21 490 7001
LimerickDeloitte & ToucheDeloitte & Touche HouseCharlotte QuayLimerickT: +353 61 435500F: +353 61 418310
www.deloitte.com/ie
Deloitte refers to one or more of Deloitte Touche Tohmatsu Limited, a private company limited by guarantee, and its network of member firms, each of which is a legally separate and independent entity. Please see www.deloitte.com/ie/about for a detailed description of the legal structure of Deloitte Touche Tohmatsu Limited and its member firms. Deloitte provides audit, tax, consulting, and financial advisory services to public and private clients spanning multiple industries. With a globally connected network of member firms in more than 150 countries, Deloitte brings world-class capabilities and high-quality service to clients, delivering the insights they need to address their most complex business challenges. Deloitte has in the region of 200,000 professionals, all committed to becoming the standard of excellence. This publication contains general information only, and none of Deloitte Touche Tohmatsu Limited, Deloitte Global Services Limited, Deloitte Global Services Holdings Limited, the Deloitte Touche Tohmatsu Verein, any of their member firms, or any of the foregoing’s affiliates (collectively the “Deloitte Network”) are, by means of this publication, rendering accounting, business, financial, investment, legal, tax, or other professional advice or services. This publication is not a substitute for such professional advice or services, nor should it be used as a basis for any decision or action that may affect your finances or your business. Before making any decision or taking any action that may affect your finances or your business, you should consult a qualified professional adviser. No entity in the Deloitte Network shall be responsible for any loss whatsoever sustained by any person who relies on this publication. © 2014 Deloitte & Touche. All rights reserved
For more information on the Deloitte Consumer Review please contact:
Kevin Sheehan Head of Consumer Business T: +353 1 417 2218 E: [email protected]
Honor Moore Partner, Audit T: +353 21 490 7082 E: [email protected]
Ger Lyons Partner, Audit T: +353 61 43 5501 E: [email protected]