del servizio studi - connecting repositories · del servizio studi the sectoral distribution of...
TRANSCRIPT

Temi di discussionedel Servizio Studi
The sectoral distribution of money supply in the euro area
Number 627 - April 2007
by Giuseppe Ferrero, Andrea Nobili and Patrizia Passiglia
The purpose of the Temi di discussione series is to promote the circulation of working papers prepared within the Bank of Italy or presented in Bank seminars by outside economists with the aim of stimulating comments and suggestions.
The views expressed in the articles are those of the authors and do not involve the responsibility of the Bank.
Editorial Board: DOMENICO J. MARCHETTI, MARCELLO BOFONDI, MICHELE CAIVANO, STEFANO IEZZI, ANDREA LAMORGESE, FRANCESCA LOTTI, MARCELLO PERICOLI, MASSIMO SBRACIA, ALESSANDRO SECCHI, PIETRO TOMMASINO.Editorial Assistants: ROBERTO MARANO, ALESSANDRA PICCININI.

THE SECTORAL DISTRIBUTION OF MONEY SUPPLY IN THE EURO AREA
by Giuseppe Ferrero*, Andrea Nobili* and Patrizia Passiglia*
Abstract
The strong and prolonged deviation of money growth from its reference value since 2001 has caused concern among policy-makers about the upside risks to price stability from monetary developments. In this paper we provide evidence that excess liquidity might be smaller than previously assumed. We provide a sectoral breakdown of money holdings and show that current excess liquidity conditions are in some measure related to the acceleration of non-bank financial intermediaries’ money demand, as well as to the accumulation of marketable instruments. Such increases are likely to be related more to portfolio choices than to transaction motives. We also find evidence from balance sheet data on investment funds that points to a general increase of this sector in the economy, rather than to a higher degree of liquidity of their asset positions. This is likely to imply that recent dynamics reflect, to a large extent, a permanent change in the financial structure of the economy. Finally, our sectoral analysis suggests that excess liquidity did not appear before the end of 2005, which is also when the ECB started to raise the official interest rates.
JEL Classification: E41, E51. Keywords: money holding sector, excess liquidity, money supply.
Contents
1. Introduction.......................................................................................................................... 3 2. The sectoral distribution of M3 growth ............................................................................... 6 3. The sectoral distribution of “excess liquidity” .................................................................. 12 4. Sectoral money demand and the transmission mechanism: a survey of the literature ...... 18 5. Why do OFIs hold more money?....................................................................................... 21 6. Monetary developments in Italy: a special case ................................................................ 23 7. Conclusions........................................................................................................................ 26 Appendix A ............................................................................................................................ 28 Appendix B. Methodology ..................................................................................................... 30 References .............................................................................................................................. 31
*Bank of Italy, Economic Research Department.
1. Introduction1
A well-known stylized fact in macroeconomics is the high correlation between money
growth and inflation in the long run. A positive and almost one-to-one relationship between
monetary growth and inflation at low frequencies has been highlighted for a wide range of
countries, using different analytical and empirical tools and employing various definitions of
money and data sets (McCandless and Weber, 1995; Lucas, 1995).
For the euro area, many empirical works have found a stable long-run relationship
between the broad monetary aggregate M3 and the price level (Coenen and Vega, 2001;
Brand and Cassola, 2000; Calza et al., 2001; Bruggeman et al, 2003) and have shown
important leading properties of several monetary indicators for future inflation at medium-
term horizons (Nicoletti Altimari, 2001).
This evidence provided justification for the prominent role of money in the ECB’s
strategy, signalled in December 1998 by the announcement of a reference value for the
annual growth rate of M3 of 4.5 per cent. The computation of the reference value was
derived using the “equation of exchange” in the context of the quantity theory of money, by
using the former ECB’s definition of price stability for the inflation rate (annual increase in
the HICP for the euro area below 2 per cent), a trend growth rate for real GDP in the range
2.0-2.5 per cent and a trend decline in M3 income velocity in the range 0.5-1.0 per cent.2
Since 2001 the annual growth rate of M3 has been persistently higher than the
reference value, raising concerns on the implications for future price stability (Figure 1).
These risks were also confirmed by the evolution of alternative excess liquidity measures
1 We are in debt to Eugenio Gaiotti and Alessandro Secchi for their suggestions and discussions. We are particularly grateful to Dieter Gerdesmeier and Antonio Matas Mir for providing us with the new ECB data on sectoral money holdings. We also benefited from comments by Riccardo De Bonis, Matteo Piazza, two anonymous referees and all participants at the European Central Bank Expert Meeting (Frankfurt, 23 March 2006) on “The Role of OFIs for Monetary and Credit Developments”. All remaining errors are our own. The views expressed in this paper are our own and do not necessarily reflect those of the Bank of Italy. E-mail: [email protected]; [email protected]; [email protected].
2 The Governing Council arrived at the reference value of 4.5 per cent by noting that summing the three upper bounds for the components of the reference value would lead to an implicit rate for M3 growth of 5.5 per cent. In view of the definition of price stability, which indicated that inflation should be below 2 per cent and noting that the actual trend decline in velocity was likely to lie somewhat below the extreme of the range, the reference value was then set at 4.5 per cent.

4
derived under the assumption of stable money demand equations, such as the “real money
gap” and the “monetary overhang”, which represent money stock deviations from measures
of equilibrium money balances and have been shown to have higher predictive power for
future inflation than money growth at horizons between one and three years (Trecroci and
Vega, 2002; Nicoletti Altimari, 2001; Gerlach and Svensson, 2003).
Figure 1
M3 ANNUAL GROWTH RATE IN THE EURO AREA (percentage changes; data adjusted for seasonal and calendar effects)
0
2
4
6
8
10
12
1991 1992 1993 1994 1995 1996 1997 1998 1999 2000 2001 2002 2003 2004 2005 2006
M3 growth rate ECB's reference value
Source: ECB.
The excess liquidity measures are nowadays a standard tool in the monetary analysis
conducted by the ECB and are frequently discussed in its regular publications (Masuch et al.,
2001; ECB, 2001, 2004). Nevertheless, their usefulness for monetary analysis has recently
been questioned, as money demand equations appear to have become unstable over time
(Carstensen, 2004; Alves et al., 2006) and their predictive power for future inflation seems to
have consistently decreased (e.g. Hofmann, 2006). These findings suggest a certain degree of
caution in interpreting their implications for monetary policy.
As argued by Laidler (1997) the main economic explanation of the relation between
monetary and future price developments, in the context of the quantity theory of money, is
that the accumulation of excess liquidity is likely to be spent by private agents in order to re-
establish monetary equilibrium, thereby increasing private demand, especially households’
5
consumption, independently from the interest rate channel (Pigou effect).3 This framework,
even if not as rigorous as that offered by Dynamic Stochastic General Equilibrium models
(DSGE), has a strong intellectual tradition and appears to have empirical relevance in the
context of so-called P-star models (Hallman et al., 1991).
In this paper we argue that the usefulness of monetary aggregates as leading indicators
of inflation at different horizons crucially depends on the ability to distinguish movements in
money reflecting underlying inflationary developments from those arising from structural
changes (Orphanides and Porter, 2001). We do that by analyzing monetary developments in
the euro area at a sectoral level in the period 1991-2006. If the excess liquidity is mainly
concentrated among households and non-financial firms it is more likely to foreshadow an
increase in future private demand and, therefore, to signal upside risks to price stability in
the medium term. On the contrary, fewer risks should be inferred if the build-up of liquidity
mainly reflects developments in financial firms’ portfolio choices or permanent changes in
the financial structure of the economy.4
Our sectoral breakdown shows that since 2001 the large accumulation of excess
liquidity in the euro area partly reflected money demand by non-bank financial
intermediaries, as well as the dynamism of some marketable instruments (especially money
market fund shares), which are likely to be held by private agents for portfolio motives rather
than for transaction purposes. In addition, we find that the accumulation over time of
monetary instruments held by non-bank financial intermediaries was due to an increase in
their size in the economy, rather than to a higher degree of liquidity of their asset positions.
This evidence suggests that part of the current excess liquidity is likely to reflect permanent
changes in the financial structure of the economy, as opposed to temporary portfolio shifts
from risky assets to more safe and liquid assets included in M3. Overall, we may conclude
3 In the context of structural VARs, Coenen and Vega (2001) showed that a positive money demand shock, defined as innovations in the growth rate of M3, leads to a temporary increase in real output within a year and a permanent rise in the price level. These results have been also confirmed by Cassola and Morana (2002) by identifying a preference liquidity shock.
4 On the other hand we could not rule out that actual monetary developments could signal risks to financial stability, as well as to real economic growth. Past evidence for OECD countries suggest that boom-bust cycles in both asset prices and house prices are also more likely to harm the entire economy, whenever the build-up of the financial bubble is associated with excess credit and liquidity conditions (e.g. Borio and Lowe, 2002, 2004; Detken and Smets, 2004; Adalid and Detken, 2006).

6
that monetary developments observed in recent years should imply lower threat to price
stability than generally considered. We note that, by excluding non-bank financial
intermediaries’ money holdings and other marketable instruments, excess liquidity
conditions (e.g. a positive value for the monetary overhang) would emerge only from the end
of 2005, which was also the timing of the ECB’s first increase of official interest rates.
The paper is organized as follows. In Section 2 we provide the sectoral breakdown of
the overall M3 growth; in Section 3 we show the corresponding breakdown for our measure
of excess liquidity, based on the estimate of the velocity of money. Section 4 presents a
selective survey of the literature regarding the role of non-bank financial intermediaries’
money demand in the transmission mechanism. In Section 5 we focus on investment funds,
giving an assessment on their degree of liquidity. In Section 6 we analyze the case of Italy.
Section 7 concludes.
2. The sectoral distribution of M3 growth
In this section we assess the contributions of different money holding sectors to the
overall increase in M3. In order to provide a sectoral breakdown of M3, we use the new ECB
time series for euro-area holdings of short-term deposits and repurchase agreements – the
broadest aggregation of M3 components for which information by holding sector is reported,
accounting for over 80 per cent of the stock of M3 – available since the first quarter of 1991.
This new dataset allows us to derive a more accurate breakdown of M3, as it is based on
financial liabilities of both MFIs and central government (post office and Treasury) while, by
contrast, the previously available dataset (which is regularly used by the ECB staff to
construct the Table 2.5 in the euro-area statistics section of the Monthly Bulletin) was built
on the basis of total deposits and repurchase agreements held only with MFIs (excluding the
Eurosystem). In addition, it allows longer-term deposits not included in M3 (deposits with
agreed maturity over two years and those redeemable at notice over three months) to be
dropped from the overall sectoral aggregates over the entire sample period.5 The sectoral
breakdown is computed on a yearly basis using indexes of notional stocks, which have the
5 For further information see the box entitled “New euro area historical series on holdings of M3 deposits by sector” in the ECB Monthly Bulletin of August 2006.
7
advantage of being adjusted for reclassifications, revaluations, exchange rate variations and
any other changes that do not arise from transactions.6
The resulting sectoral breakdown is showed in Table 1, where the non-sectorized
components include currency in circulation and an aggregate labelled “other items”, which
comprises other marketable instruments (money market fund shares and debt securities up to
two years) and the residual discrepancies between the overall M3 and the sum of the
corresponding sectoral aggregates. Some stylized facts can be highlighted.
During the period 1992-2006, the annual growth rate of M3 was, on average, about 6.0
per cent. Households’ money holdings, which represented about 60 per cent of the overall
M3 stock in the euro area at the beginning of period, provided the largest contribution to the
overall increase (about 46 per cent), reflecting an average annual growth rate of 4.8 per cent.
The money stock held by non-financial corporations contributed by around 18 per cent to the
overall accumulation of liquidity. Interestingly, non-bank financial intermediaries, which
instead held only 7.0 per cent of the overall stock, more than doubled their share of total
M3, thus providing an important contribution to the overall increase in liquidity (13 per
cent). In particular, OFIs more than tripled their share (the annual growth rate of their money
holdings was, on average, 13.0 per cent). Finally, there has been a strong acceleration of
other marketable instruments, whose average contribution was around 10 per cent.
It is interesting to compare the sectoral distribution of money holdings in two different
sub-samples. The first is the period 1992-2000, which was characterized by a relatively
stable M3 annual growth rate, 0.5 percentage points higher than the reference value; the
second is the period 2001-2006, when the money M3 experienced a phase of strong and
persistent acceleration and its annual growth rate always stood above the reference value,
performing an average annual growth rate of 7.6 per cent. In this period, the concern among
policy-makers about the upside risks to price stability from monetary developments became
considerable.
6 We thank the ECB staff for pointing out this issue. In a previous draft of the paper we used outstanding amounts for the M3 growth rates. See the technical notes in the ECB Monthly Bulletin for details regarding the calculation of growth rates for monetary developments. The use of index of notional stocks also allows to take into account the impact of Greece’s euro adoption from 2001 on the overall M3 annual growth rates. A sectoral breakdown based on outstanding amounts does not lead to significant changes with respect to results outlined in this section.

8
Source: authors’ calculations based on ECB data.
Notes: The sectoral breakdown is based on MFIs and central government financial liabilities using indexes of notional stocks. M3 and currency in circulation data are adjusted for seasonal and calendar effects. Average shares are computed on outstanding amounts. - The column labelled “Other items” comprises money market fund shares, debt securities up to two years and the discrepancies between the overall M3 and the sum of the corresponding sectoral aggregates.
Table 1
SECTORAL BREAKDOWN OF M3 IN THE EURO AREA (percentage changes; percentage points)
Sectorized deposits and repurchase agreements Non-sectorized components
Non-bank financial intermediaries
Annual growth
rate of M3 Households Non-
financial firms
Insurance corporations and pension
funds
OFIs Total General
government
Currency in
circulation
Other items
1992 7.5 4.1 -0.1 0.1 0.2 0.3 0.0 0.6 2.8 1993 6.6 4.4 0.7 0.1 0.4 0.5 0.3 0.4 0.4 1994 2.4 1.3 0.7 0.0 0.3 0.3 0.0 0.4 -0.3 1995 5.7 3.7 1.0 0.0 0.6 0.6 0.0 0.3 0.1 1996 4.2 2.3 1.2 0.1 0.6 0.7 0.0 0.3 -0.4 1997 4.2 1.3 1.1 0.1 0.9 1.0 0.2 0.2 0.3 1998 5.0 1.9 0.7 0.1 1.2 1.3 0.3 0.0 0.6 1999 5.7 1.8 0.5 0.2 0.7 0.9 0.4 0.6 1.5 2000 4.1 1.0 2.0 0.3 0.6 0.9 0.3 0.0 0.0 2001 8.0 5.8 1.9 0.2 0.3 0.5 0.2 -2.3 1.6 2002 7.0 2.3 0.5 0.3 0.7 1.0 0.1 1.9 1.3 2003 7.1 2.9 1.1 0.1 0.8 0.9 0.0 1.5 0.8 2004 6.6 2.7 1.2 0.2 0.5 0.7 0.3 1.1 0.5 2005 7.3 3.1 1.5 0.1 1.1 1.3 0.4 1.0 0.0 2006 9.8 3.4 2.0 0.2 1.5 1.6 0.5 0.8 1.5
Average annual growth rates 92-06 6.1 4.8 7.0 7.8 13.0 11.6 6.8 7.7 8.2 92-00 5.0 4.0 6.0 7.0 13.9 12.0 5.7 4.2 6.9 01-06 7.6 6.1 8.5 9.0 11.6 11.0 8.5 12.9 10.3
Average shares 92-06 0.58 0.15 0.02 0.06 0.07 0.03 0.07 0.09 92-00 0.60 0.15 0.02 0.05 0.06 0.03 0.07 0.09 01-06 0.55 0.16 0.02 0.07 0.09 0.03 0.06 0.10
Average contributions to the M3 growth rate 92-06 2.8 1.1 0.1 0.7 0.8 0.2 0.4 0.7 92-00 2.4 0.9 0.1 0.6 0.7 0.2 0.3 0.6 01-06 3.4 1.4 0.2 0.8 1.0 0.3 0.7 1.0

9
In the period 2001-2006 the annual growth rate of M3 was higher by 2.6 percentage
points on average with respect to the period 1992-2000. All different sectors positively
contributed to the overall increase in the money growth. Among them, households’ money
holdings accounted by 45 per cent of the overall increase in money growth, mainly reflecting
the remarkable acceleration of their short-term deposits in 2001, when they temporary
lodged their currency denominated cash into deposits in order to face the euro cash
changeover. Non-financial corporations’ and non-bank financial intermediaries contributions
were respectively about 18 and 13 percent of the overall increase.
Among the non-sectorized components, we notice an increase in the contribution of the
currency in circulation. Interestingly, the growth rate of currency in circulation remained
sustained also after the cash changeover, maybe suggesting a structural break in the demand
for euro denominated banknotes due to the increase of the international role of the euro as
well as to a higher demand for euro denominated banknotes from non euro area residents,
such as those in accessing countries of East Europe. As far as the implications of a higher
growth rate of currency in circulation are regarded, it is worthwhile noticing that half of the
growth rate of the value of euro banknotes in circulation, is explained by the increase in the
number of high-denomination ones, namely the €500 banknotes, which are likely to be held
by economic agents as a store of value and not for transaction purposes.
Marketable instruments different from repurchase agreements significantly contributed
to the overall increase in the M3 growth (12 per cent), due, to a large extent, to the strong
dynamism of money market fund shares, which are likely to be held by economic agents for
portfolio motives, rather than for transactional purposes.
So far we have only analyzed the evolution of M3 (and its sectoral breakdown), but no
conclusion can be derived in terms of risks for price stability.
The equation of exchange,
(1) tttt YPVM ⋅=⋅
(where M denotes the stock of money in circulation, V its velocity, Y real output, and P its
price), is commonly used in the quantity theory of money to examine the relationship
between money and inflation. According to this identity, the change in the money stock in

10
Source: authors’ calculations based on ECB data.
Notes: The sectoral breakdown is based on MFIs and central government financial liabilities using indexes of notional stocks. M3 and currency in circulation data are adjusted for seasonal and calendar effects. Average shares are computed on outstanding amounts. - The column labelled “Other items” comprises money market fund shares, debt securities up to two years and the discrepancies between the overall M3 and the sum of the corresponding sectoral aggregates.
the economy equals the change in nominal transactions (approximated by the change in
nominal GDP) minus changes in the velocity. Based on this relation, the ECB’s reference
value for the growth of the broad monetary aggregate M3 embodies the definition of price
stability as an increase in the HICP of the euro area “below but close to 2 per cent per
annum”, a growth of real GDP of 2-2.5 per cent, and a decrease of M3 velocity in the range
of 0.5-1 per cent per annum.
Therefore, assuming that the change in the velocity of money and of the real GDP
growth rate are constant over time at the levels assumed by the ECB for the computation of
the reference value, in the medium term any increase in the amount of money above the
reference value should lead to a proportional rise in the risk for price stability.
In Table 2 we report the average gap between money growth and the ECB’s reference
value, and the corresponding sectoral contributions, which are computed under the
assumption that the reference value is the same for all sectors.
Table 2
SECTORAL BREAKDOWN OF THE AVERAGE DEVIATION OF M3 ANNUAL GROWTH RATE FROM THE ECB’S REFERENCE VALUE
(percentage points)
Sectorized deposits and repurchase agreements Non-sectorized components
Non-bank financial intermediaries
Deviation of M3 annual growth Households
Non-financial
firms
Insurance corporations and pension
funds
OFIs Total General
government
Currency in
circulation
Other items
92-06 1.6 0.2 0.4 0.1 0.5 0.5 0.1 0.1 0.3 92-00 0.5 -0.3 0.2 0.0 0.4 0.5 0.0 0.0 0.2 01-06 3.1 0.9 0.6 0.1 0.5 0.6 0.1 0.4 0.5
During the period 1992-2006, the annual growth rate of M3 was, on average, about 1.6
percentage points higher than the ECB’s reference value. Interestingly, households’ money
11
Source: authors’ calculations based on ECB data.
Notes: growth rates are computed using indexes of notional stocks.
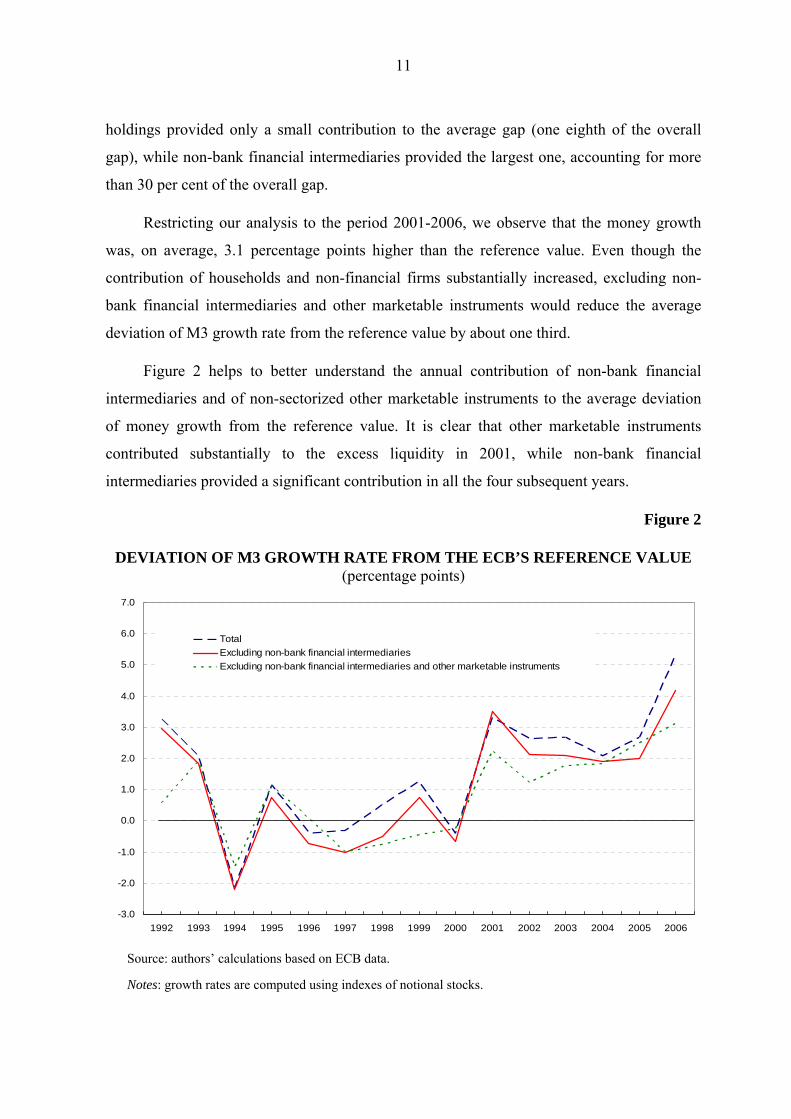
holdings provided only a small contribution to the average gap (one eighth of the overall
gap), while non-bank financial intermediaries provided the largest one, accounting for more
than 30 per cent of the overall gap.
Restricting our analysis to the period 2001-2006, we observe that the money growth
was, on average, 3.1 percentage points higher than the reference value. Even though the
contribution of households and non-financial firms substantially increased, excluding non-
bank financial intermediaries and other marketable instruments would reduce the average
deviation of M3 growth rate from the reference value by about one third.
Figure 2 helps to better understand the annual contribution of non-bank financial
intermediaries and of non-sectorized other marketable instruments to the average deviation
of money growth from the reference value. It is clear that other marketable instruments
contributed substantially to the excess liquidity in 2001, while non-bank financial
intermediaries provided a significant contribution in all the four subsequent years.
Figure 2
DEVIATION OF M3 GROWTH RATE FROM THE ECB’S REFERENCE VALUE (percentage points)
-3.0
-2.0
-1.0
0.0
1.0
2.0
3.0
4.0
5.0
6.0
7.0
1992 1993 1994 1995 1996 1997 1998 1999 2000 2001 2002 2003 2004 2005 2006
TotalExcluding non-bank financial intermediariesExcluding non-bank financial intermediaries and other marketable instruments

12
3. The sectoral distribution of “excess liquidity”
In this section we analyze a measure of excess liquidity that is based on the comparison
between the period-by-period velocity of money and its trend estimate.
Equation (1) can be easily rearranged as
(2) ⎟⎟⎠
⎞⎜⎜⎝
⎛⋅
=tt
t
t YPM
V1 .
If the velocity of money is nearly constant over time and the amount of production set
at a fixed level, such as its long-run or full-employment equilibrium level, then any increase
in the amount of money would lead to a proportional rise in prices. Therefore, inflation in the
long run would only be caused by increases in the quantity of money in circulation. In
practice, the money velocity may vary considerably over time, and as a result understanding
its movements becomes essential for assessing the inflationary implications of particular
patterns of money growth.
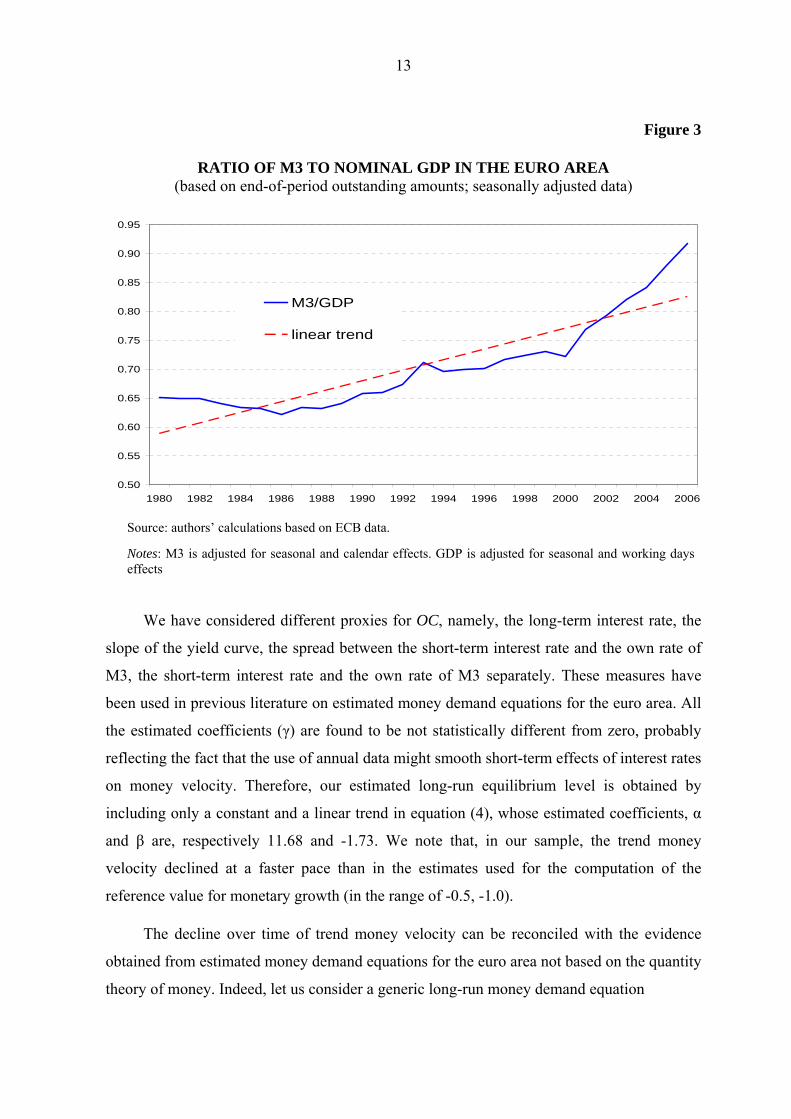
In particular, the velocity of money may vary considerably over time for two reasons
(Orphanides and Porter, 2001): on one side, improvements in financial services and deeper
financial innovation represent structural changes that affect the long-run equilibrium of
money velocity; on the other side, fluctuations in the opportunity cost of holding money
involve cyclical changes associated with short-run deviations of velocity from its underlying
long-run trend and represent the effective “excess liquidity” in the economy (see Figure 3).
Therefore, the “excess liquidity” crucially depends on how we measure the long-run
velocity. Let us define *tv the equilibrium level of the logarithm of money velocity, namely
(3) ttttttttt mypMYPvv −+=−+=+= logloglog* ε .
Following Orphanides and Porter (2001) we estimate *tv by running a linear regression
on annual data covering the period 1991-2006 of the following form
(4) tt OCtv γβα ˆˆˆ* ++= ,
where t is a linear trend and OC is a measure of the opportunity cost of holding money.
13
Source: authors’ calculations based on ECB data.
Notes: M3 is adjusted for seasonal and calendar effects. GDP is adjusted for seasonal and working days effects
Figure 3
RATIO OF M3 TO NOMINAL GDP IN THE EURO AREA (based on end-of-period outstanding amounts; seasonally adjusted data)
0.50
0.55
0.60
0.65
0.70
0.75
0.80
0.85
0.90
0.95
1980 1982 1984 1986 1988 1990 1992 1994 1996 1998 2000 2002 2004 2006
M3/GDP
linear trend
We have considered different proxies for OC, namely, the long-term interest rate, the
slope of the yield curve, the spread between the short-term interest rate and the own rate of
M3, the short-term interest rate and the own rate of M3 separately. These measures have
been used in previous literature on estimated money demand equations for the euro area. All
the estimated coefficients (γ) are found to be not statistically different from zero, probably
reflecting the fact that the use of annual data might smooth short-term effects of interest rates
on money velocity. Therefore, our estimated long-run equilibrium level is obtained by
including only a constant and a linear trend in equation (4), whose estimated coefficients, α
and β are, respectively 11.68 and -1.73. We note that, in our sample, the trend money
velocity declined at a faster pace than in the estimates used for the computation of the
reference value for monetary growth (in the range of -0.5, -1.0).
The decline over time of trend money velocity can be reconciled with the evidence
obtained from estimated money demand equations for the euro area not based on the quantity
theory of money. Indeed, let us consider a generic long-run money demand equation
14
(5) 0 ,0 t <>+++=− ϑϕηϑϕ tttt OCykpm
then, the implied long-run money velocity is given by
(6) ( ) ttt OCykv ϑϕ ˆˆ1ˆ* −−+−=
As y is the logarithm of GDP, the money velocity is declining over time if and only if
1ˆ >ϕ , which is consistent with the empirical estimates (Coenen and Vega, 2001, Calza et al.,
2001, Brand and Cassola, 2000, and Bruggeman et al., 2003).
Rearranging equation (3) we obtain an excess liquidity measure, defined as the
deviation of the inverse of money velocity from its equilibrium level, which can be labelled
the “monetary overhang”, MO,
(7) *ttttt vypmMO +−−= .
The monetary overhang captures the part of the ratio of real money stock to nominal
GDP that is not explained by the long-run determinants of money demand and is interpreted
as the purely monetary impulse to price developments.7
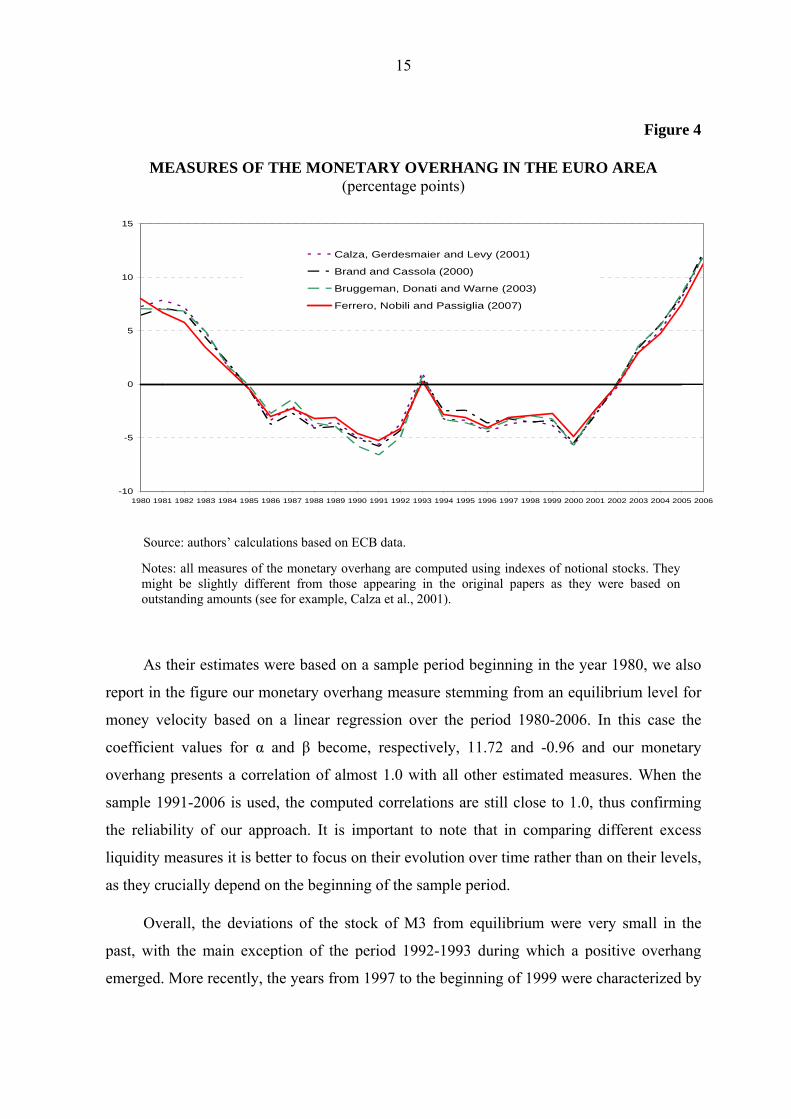
In order to check the reliability of our approach, we present in Figure 4 a visual
comparison between the evolution over time of our monetary overhang measure and that
derived from previously estimated long-run money demand equations for the euro area.8
The specifications differ from each other as to the choice of the opportunity cost,
namely, the long-term interest rate (Brand and Cassola, 2000), the spread between the short-
term interest rate and the own rate of M3 (Calza et al., 2001), the short-term interest rate and
the own rate of M3 separately (Bruggeman et al., 2003). These alternative monetary
overhang estimates are computed using long-run coefficient values taken from the original
authors’ papers.
7 In the literature there are also other measures of excess liquidity. For example, the ECB also monitors the “real money gap” defined as the deviation of the observed stock of real money from that which would be implied by a money demand model in which income and opportunity cost of holding money are evaluated at the levels consistent with price stability. See Masuch et al. (2001) and ECB (2001, 2004).
8 All values are re-scaled to average zero over the entire sample period as in Calza et al. (2001).
15
Figure 4
MEASURES OF THE MONETARY OVERHANG IN THE EURO AREA (percentage points)
-10
-5
0
5
10
15
1980 1981 1982 1983 1984 1985 1986 1987 1988 1989 1990 1991 1992 1993 1994 1995 1996 1997 1998 1999 2000 2001 2002 2003 2004 2005 2006
Calza, Gerdesmaier and Levy (2001)
Brand and Cassola (2000)
Bruggeman, Donati and Warne (2003)
Ferrero, Nobili and Passiglia (2007)
Source: authors’ calculations based on ECB data.
Notes: all measures of the monetary overhang are computed using indexes of notional stocks. They might be slightly different from those appearing in the original papers as they were based on outstanding amounts (see for example, Calza et al., 2001).
As their estimates were based on a sample period beginning in the year 1980, we also
report in the figure our monetary overhang measure stemming from an equilibrium level for
money velocity based on a linear regression over the period 1980-2006. In this case the
coefficient values for α and β become, respectively, 11.72 and -0.96 and our monetary
overhang presents a correlation of almost 1.0 with all other estimated measures. When the
sample 1991-2006 is used, the computed correlations are still close to 1.0, thus confirming
the reliability of our approach. It is important to note that in comparing different excess
liquidity measures it is better to focus on their evolution over time rather than on their levels,
as they crucially depend on the beginning of the sample period.
Overall, the deviations of the stock of M3 from equilibrium were very small in the
past, with the main exception of the period 1992-1993 during which a positive overhang
emerged. More recently, the years from 1997 to the beginning of 1999 were characterized by

16
a shortfall in M3. Starting from 2001, the amount of liquidity has increased significantly,
leading to a prolonged accumulation of excess liquidity which reached its peak in 2006.
In order to study the implications of the increase in the monetary overhang in terms
of risks for price stability, we derive a sectoral breakdown of the monetary overhang, under
the assumption that the trend velocity of money during the sample period 1991-2006 is the
same among all sectors, as sectoral nominal GDPs are not available (see Figure 5).
Figure 5
MONETARY OVERHANG IN THE EURO AREA (percentage points)
Source: authors’ calculations based on ECB data.
We can observe that both non-bank financial intermediaries and non-sectorized other
marketable instruments contributed significantly to the overall evolution of the monetary
overhang in the sample period. Sectoral contribution to changes in the monetary overhang
are presented in Table 3.9
9 Details of the methodology used for the computation of sectoral contributions are in Appendix B.
-8.0
-6.0
-4.0
-2.0
0.0
2.0
4.0
6.0
8.0
1991 1992 1993 1994 1995 1996 1997 1998 1999 2000 2001 2002 2003 2004 2005 2006
Monetary overhang
Monetary overhang (excluding non-bank financial intermediaries)
Monetary overhang (excluding non-bank financial intermediaries and other marketable instruments)

17
Table 3
Sectoral contributions Non-sectorized components
Non-bank financial intermediaries
Change in the
Monetary Overhang Households
Non-financial
firms
Insurance corporations and pension
funds
OFIs Total General
government
Currency in
circulation
Other items
1992 0.4 -0.2 -1.1 0.0 0.0 0.0 -0.3 0.1 2.1 1993 3.7 2.7 0.3 0.0 0.3 0.3 0.2 0.1 0.1 1994 -3.8 -2.5 -0.2 -0.1 0.1 0.0 -0.2 -0.1 -0.9 1995 -1.1 -0.5 0.0 -0.1 0.3 0.3 -0.2 -0.2 -0.5 1996 -1.7 -1.3 0.3 0.0 0.4 0.3 -0.1 -0.1 -0.9 1997 0.1 -1.2 0.5 0.0 0.7 0.8 0.1 -0.1 0.0 1998 -0.6 -1.4 -0.1 0.0 0.9 0.9 0.2 -0.4 0.2 1999 -0.6 -1.8 -0.4 0.1 0.3 0.4 0.2 0.1 1.0 2000 -2.9 -3.0 0.9 0.2 0.1 0.3 0.1 -0.5 -0.6 2001 1.8 2.3 0.8 0.1 -0.1 0.0 0.0 -2.6 1.1 2002 1.7 -0.7 -0.3 0.2 0.3 0.5 0.0 1.6 0.8 2003 2.3 0.2 0.3 0.0 0.5 0.5 -0.1 1.2 0.3 2004 1.0 -0.3 0.3 0.1 0.1 0.2 0.1 0.7 0.0 2005 1.9 0.2 0.6 0.0 0.7 0.8 0.2 0.6 -0.6 2006 3.2 -0.1 0.9 0.0 0.9 1.0 0.3 0.3 0.8
Cumulative contributions to the change in the monetary overhang 92-06 5.6 -7.6 2.9 0.6 5.6 6.2 0.4 0.7 2.8 92-00 -6.3 -9.2 0.3 0.2 3.1 3.3 -0.1 -1.0 0.4 01-06 11.9 1.6 2.7 0.4 2.5 2.9 0.5 1.8 2.4
The monetary overhang decreased by more than 6 percentage points during the
period 1992-2000 in the euro area. Excluding non-bank financial intermediaries and non
sectorized other marketable instruments, the total reduction in the monetary overhang would
have been even larger (10.0 percentage points), essentially due to the negative contribution
of households’ money holdings.
SECTORAL BREAKDOWN OF THE CHANGE IN THE MONETARY OVERHANG FOR THE EURO AREA
(percentage changes)
Source: authors’ calculations based on ECB data.
Notes: The sectoral breakdown is based on MFIs and central government financial liabilities using indexes of notional stocks. M3 and currency in circulation data are adjusted for seasonal and calendar effects. - The column labelled “Other items” comprises money market fund shares, debt securities up to two years and the discrepancies between the overall M3 to GDP ratio and the sum of the corresponding sectoral aggregates. - The monetary overhang is computed as the difference between the logarithm of the M3 to nominal GDP ratio and its equilibrium level, estimated by a linear regression on annual data covering the period 1991-2006.

18
In the period 2001-2006, when it is generally assumed that risks for price stability have
increased considerably, the monetary overhang increased substantially, by about 12.0
percentage points. In this period, holdings of non-sectorized money market fund shares and
monetary instruments held by non-bank financial intermediaries contributed for about 40 per
cent of the overall increase in the monetary overhang. As suggested by the analysis in
Section 2, a large contribution also derived from the exceptional growth of the currency in
circulation and monetary deposits held by households due to the cash changeover in 2001.
Overall, the contribution derived from households and non-financial firms was by 36 per
cent.10
We note that excluding non-bank financial intermediaries’ money holdings, in the euro
area there would be excess liquidity conditions (i.e. a positive value for the monetary
overhang) only from 2005, which is also the time when the ECB started to raise official
interest rates.
4. Sectoral money demand and the transmission mechanism: a survey of the literature
The results outlined in the previous section provide evidence that non-bank financial
intermediaries’ money holdings were one of the main driving forces of the increase in excess
liquidity observed in recent years. Nevertheless, in order to better assess what implications
the sectoral breakdown of the excess liquidity has in terms of risks to price stability, it is
now important to consider the role of different sectors in the transmission mechanism.
Indeed, there is broad agreement that money demand equations differ from one sector to
another (Fisher and Vega, 1993; Fujiki and Mulligan, 1996; Thomas, 1997a, 1997b) and it is
10 Results based on outstanding amounts of the overall M3 and indexes of notional stocks for the sectoral deposits are substantially unchanged. The contribution of households and non-financial firms to the overall increase in the monetary overhang during the period 2001-2006 was around 40 per cent and that of other marketable instruments and non bank financial intermediaries about 45 per cent. Neither a sectoral breakdown were both overall M3 and sectoral deposits growth rates are based on outstanding amounts leads to significant changes with respect to results outlined in this section (see Appendix A). Finally, in order to check the robustness of our conclusions to the choice of the sample period used for the computation of the long-run money velocity, we also assessed the corresponding sectoral breakdown obtained from an estimated money velocity using the linear trend over the period 1980-2006. In this case, the contribution from households and non-financial firms is about 45 per cent, while that of non-bank financial intermediaries and other marketable instruments is about 35 per cent.
19
widely recognized that different sectors are likely to hold money for different motives and
not necessarily for transaction purposes.
Empirical evidence on the role of financial firms in the transmission mechanism of
monetary policy in the euro area is not yet available neither at aggregate nor at single-
country level, mainly because of the lack of more comprehensive and harmonized statistics
regarding sectoral balance sheet data. Some lessons can be learnt from past evidence in the
United Kingdom, with the important caveat that differences in the financial structure of the
economy might imply significant differences in the transmission mechanism.
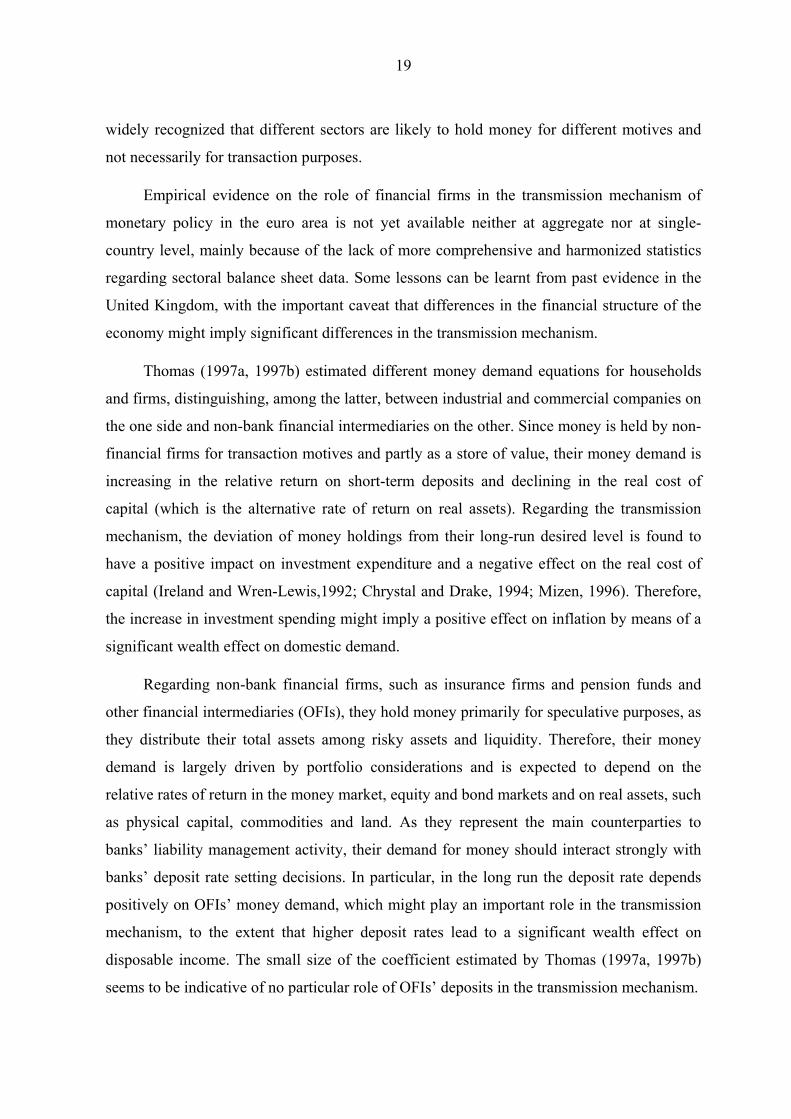
Thomas (1997a, 1997b) estimated different money demand equations for households
and firms, distinguishing, among the latter, between industrial and commercial companies on
the one side and non-bank financial intermediaries on the other. Since money is held by non-
financial firms for transaction motives and partly as a store of value, their money demand is
increasing in the relative return on short-term deposits and declining in the real cost of
capital (which is the alternative rate of return on real assets). Regarding the transmission
mechanism, the deviation of money holdings from their long-run desired level is found to
have a positive impact on investment expenditure and a negative effect on the real cost of
capital (Ireland and Wren-Lewis,1992; Chrystal and Drake, 1994; Mizen, 1996). Therefore,
the increase in investment spending might imply a positive effect on inflation by means of a
significant wealth effect on domestic demand.
Regarding non-bank financial firms, such as insurance firms and pension funds and
other financial intermediaries (OFIs), they hold money primarily for speculative purposes, as
they distribute their total assets among risky assets and liquidity. Therefore, their money
demand is largely driven by portfolio considerations and is expected to depend on the
relative rates of return in the money market, equity and bond markets and on real assets, such
as physical capital, commodities and land. As they represent the main counterparties to
banks’ liability management activity, their demand for money should interact strongly with
banks’ deposit rate setting decisions. In particular, in the long run the deposit rate depends
positively on OFIs’ money demand, which might play an important role in the transmission
mechanism, to the extent that higher deposit rates lead to a significant wealth effect on
disposable income. The small size of the coefficient estimated by Thomas (1997a, 1997b)
seems to be indicative of no particular role of OFIs’ deposits in the transmission mechanism.

20
Chrystal and Mizen (2005) suggest that financial firms might have effects on real
spending and investment decisions of the private sector (households and non-financial
firms), and finally on inflation, through both direct and indirect channels. For example,
pension funds, insurance corporations and investment funds mainly manage long-term
private saving, securities dealers typically take short-term financial positions, leasing
companies buy capital equipment directly to lease to non-financial firms, and many financial
firms also invest in real estate. Therefore, they might directly generate income and other
components of value added in the economy (positive wealth effects). In addition, they affect
real economic activity through indirect financial linkages with other sectors that enable firms
or households to change their spending patterns, such as by lowering the cost of external
finance.
Using an encompassing VAR approach, Chrystal and Mizen (2005) estimate a
simultaneous system for the UK comprising an aggregate money demand for non-financial
firms, a borrowing equation and a domestic demand equation, based on the assumption that
both sides of financial firms’ balance sheets may affect real economic activity. Both real
lending and money balances are explained by a common set of variables. The estimated
relationships suggest that financial firms’ borrowing influences aggregate investment in the
long run, and through this effect they alter the short-term dynamics of investment spending.
In interpreting this link it is difficult to assess whether the effect stems solely from the
investment behaviour of leasing companies or whether there are other indirect effects on
non-financial firms’ investment from the financial services received from financial firms. By
contrast, financial firms have little impact on the long-run behaviour of the household sector,
and therefore on the short-term pattern of consumption. 11
Congdon (2000a, 2000b, 2005) argues that insurance corporations and pension funds
played a role in the UK “boom-bust cycles” of the 1970s and 1980s. Recently, Benati et al.
(2006) have pointed out that the build up in financial firms’ money holdings might not be
11 The level of real lending is positively affected by real GDP, with an elasticity close to unity. Real gross financial wealth has a more muted effect on money and borrowing, even if positive. The coefficient of the real short-term interest rate in the lending equation is negative, as expected, but not statistically different from zero. The equation for real money balances is also positively affected by the variable measuring the return on financial intermediation services and by the spread of long gilts over equity returns, suggesting that money balances are regarded as a safe asset in the portfolio when dividend yields on equities are falling relative to the yield on gilts.
21
driven by changes in underlying fundamental determinants, as money might be held as a
buffer to allow for unpredictable shifts in the flow of funds. The resulting excess liquidity is
likely to be spent on purchasing assets, putting upward pressure on asset prices and then on
inflation. Nevertheless, using a time-varying parameter VAR they find that broad money
holdings by total financial firms have no information content for inflation, while money held
by insurance corporations and pension funds is positively but not significantly related to
asset prices.
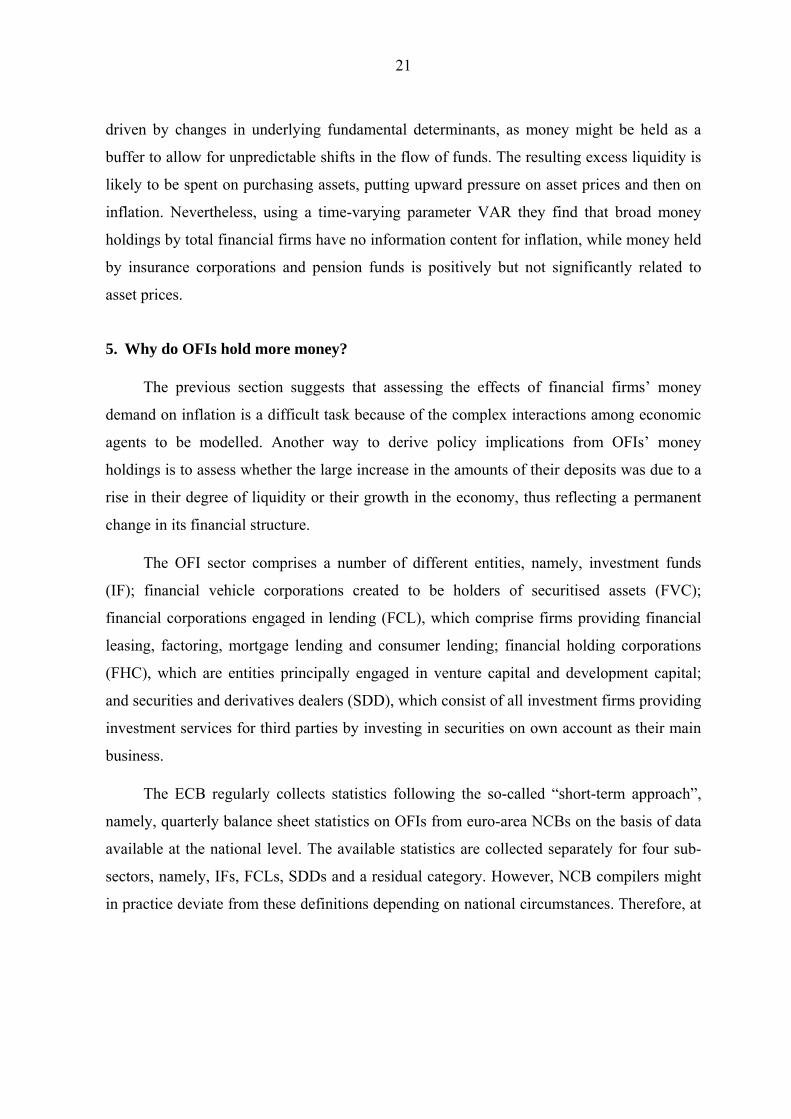
5. Why do OFIs hold more money?
The previous section suggests that assessing the effects of financial firms’ money
demand on inflation is a difficult task because of the complex interactions among economic
agents to be modelled. Another way to derive policy implications from OFIs’ money
holdings is to assess whether the large increase in the amounts of their deposits was due to a
rise in their degree of liquidity or their growth in the economy, thus reflecting a permanent
change in its financial structure.
The OFI sector comprises a number of different entities, namely, investment funds
(IF); financial vehicle corporations created to be holders of securitised assets (FVC);
financial corporations engaged in lending (FCL), which comprise firms providing financial
leasing, factoring, mortgage lending and consumer lending; financial holding corporations
(FHC), which are entities principally engaged in venture capital and development capital;
and securities and derivatives dealers (SDD), which consist of all investment firms providing
investment services for third parties by investing in securities on own account as their main
business.
The ECB regularly collects statistics following the so-called “short-term approach”,
namely, quarterly balance sheet statistics on OFIs from euro-area NCBs on the basis of data
available at the national level. The available statistics are collected separately for four sub-
sectors, namely, IFs, FCLs, SDDs and a residual category. However, NCB compilers might
in practice deviate from these definitions depending on national circumstances. Therefore, at

22
euro-area level, the lack of harmonized statistics regarding all entities does not allow us to
conduce an exhaustive analysis.12
Notwithstanding the limited data availability and quality, some conclusions can be
inferred looking at the balance sheet data regarding IFs, currently published by the ECB;
their deposit amounts represent by far the largest part of overall ones of OFIs (80 per cent in
the euro area). In Figure 6 we report the pattern of total deposits (which also include longer-
term ones) and total financial assets held by investment funds in the period 1999-2006Q3 for
the main European countries, as well as for the euro area as a whole.
Figure 6
RATIO OF DEPOSITS TO TOTAL FINANCIAL ASSETS (INVESTMENT FUNDS IN MAIN EUROPEAN COUNTRIES)
(percentage points; 1999-2006Q3)
0,0
1,0
2,0
3,0
4,0
5,0
6,0
7,0
8,0
9,0
10,0
1999 2000 2001 2002 2003 2004 2005 2006 Q30,0
5,0
10,0
15,0
20,0
25,0
Italy FranceGermany NetherlandsLuxembourg Euro areaSpain (right hand side)
Source: authors’ calculations based on ECB data.
We argue that in the euro area the substantial increase in the volume of deposits held
by investment funds mainly reflected the growth in their total assets, and only to a lesser
extent an increase in their degree of liquidity. The evolution of deposits held by investment
funds in the euro area as a whole reflected a similar behaviour at country level, with the
12 The ESCB statistical function is currently working towards some improvements, in order to provide more accurate data regarding both IFs and FCVs. See Moutot et al. (2007) for more details.
23
2001 37479 1309 67 19810 586652002 38504 2835 132 29998 714692003 34552 1614 131 20941 572382004 31466 3410 222 18160 532582005 35557 5202 153 18769 596812006 40871 6141 119 21895 69026
2001-2006 9.1% 369.1% 77.6% 10.5% 17.7%2001 156544 40212 5155 85340 2825032002 152654 130186 6481 97144 3864652003 180895 130832 6088 104389 4222042004 180281 138988 10050 119798 4491172005 233943 184960 10497 121064 5504642006 276583 251607 10633 117053 655876
2001-2006 76.7% 525.7% 106.3% 37.2% 132.2%
Euro
Are
a
Deposits with agreed maturity up to 2 years
Repurchase agreements
Total short-term deposits
Deposits redeemable at notice up to 3
months
Overnight deposits
Italy
Years
exception of Italy. Deposits held by investment funds increased significantly in Germany,
France and Spain, but the degree of liquidity in these countries did not change substantially.
At the same time, in Italy the decrease in total deposits was due to the decrease in total
financial assets. The pattern of the ratio of deposits to total financial assets basically
remained unchanged throughout the period.
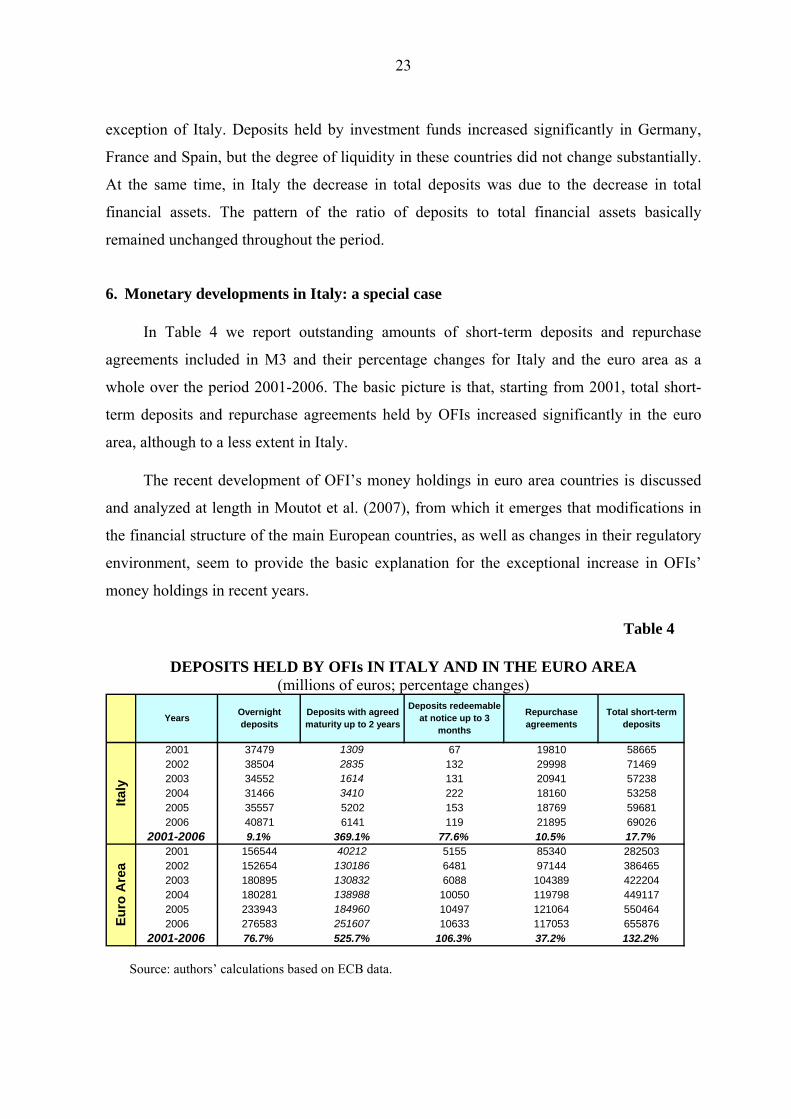
6. Monetary developments in Italy: a special case
In Table 4 we report outstanding amounts of short-term deposits and repurchase
agreements included in M3 and their percentage changes for Italy and the euro area as a
whole over the period 2001-2006. The basic picture is that, starting from 2001, total short-
term deposits and repurchase agreements held by OFIs increased significantly in the euro
area, although to a less extent in Italy.
The recent development of OFI’s money holdings in euro area countries is discussed
and analyzed at length in Moutot et al. (2007), from which it emerges that modifications in
the financial structure of the main European countries, as well as changes in their regulatory
environment, seem to provide the basic explanation for the exceptional increase in OFIs’
money holdings in recent years.
Table 4
DEPOSITS HELD BY OFIs IN ITALY AND IN THE EURO AREA (millions of euros; percentage changes)
Source: authors’ calculations based on ECB data.

24
In the remaining part of this section we focus on the sectoral breakdown of excess
liquidity in Italy. Our analysis is based on notional stocks for the period 1997-2006 and
outstanding amounts for the period 1991-1996 taken from disaggregated balance sheet data
on both MFIs and post office. Table 5 shows that, in the period 1991-2006, the annual
growth rate of the Italian contribution to M3 has been on average by 5.6 per cent. Among the
sectors, households provided the largest contribution to the overall increase in the monetary
aggregate (about 50 per cent). The contributions of non-financial firms’ and non-bank
financial intermediaries’ money holdings were, respectively, 20 and 15 per cent.
When we assess the corresponding breakdown of the change in the monetary overhang
(see Table A2 in Appendix A), we argue that the overall accumulation of excess liquidity has
been higher than in the euro area (11.0 percentage points in 1991-2006), mainly because the
trend growth velocity of money has a smaller slope.13 If we focus the analysis on the period
2001-2006 we note that the picture is very different from that for the euro area as a whole.
The overall increase in the monetary overhang is more than 25 percentage points.
Households and non-financial firms accounted, respectively, by 42 and 17 per cent. Non-
sectorized other marketable instruments’ contribution was 25 per cent, while that from non-
bank financial intermediaries was only by 8 per cent of the overall increase in the monetary
overhang.
For Italy available statistics on investment funds are based only on balance sheet data
for open-end investment funds, while SSD data mainly represent data on SIMs (Società
d’intermediazione mobiliare). Nevertheless, in first quarter 2006 outstanding amounts of IFs
represented 69 per cent of overall OFIs’ financial assets but 96 per cent of their overall
deposits (80 per cent in 1999).
In the case of Italy the reduction in deposits held by Italian open-end investment funds
was due in large part to banks’ supply strategies, designed to sell customers investment
funds operated by management companies that they themselves had set up in foreign
financial centres where the taxation of business income is lower (Ireland and Luxembourg).
Figure 7 shows the pattern over time of the end-of-period outstanding amounts of Italian
13 For Italy the estimated coefficients of the trend in money velocity are, respectively, -0.54 for the slope and 0.38 for the constant term.

25
open-end investment funds, allowing a comparison with those held by foreign funds
controlled by Italian intermediaries.
Table 5
SECTORAL BREAKDOWN OF THE ITALIAN COMPONENT OF M3 (percentage changes; percentage points)
Sectorized deposits and repurchase agreements Non-sectorized
components Non-bank financial intermediaries
Growth rate of Italian
component of M3
Households Non-
financial firms
Insurance corporations and pension
funds
OFIs Total General
government Currency in circulation
Other items
1992 9.4 7.0 0.1 0.1 -0.1 0.0 0.3 0.9 1.3 1993 6.3 3.1 1.0 -0.1 0.8 0.7 0.4 0.4 0.8 1994 1.8 0.6 1.1 -0.1 0.3 0.2 0.0 0.5 -0.6 1995 4.8 1.2 0.3 0.2 0.5 0.7 0.4 0.2 2.0 1996 2.4 1.3 0.0 0.0 0.6 0.6 0.2 0.1 0.1 1997 -0.4 1.2 0.6 0.0 1.3 1.2 0.0 0.5 -3.9 1998 2.1 2.4 2.7 -0.2 2.1 1.9 -0.2 0.6 -5.2 1999 3.6 -0.8 0.8 0.1 1.4 1.6 0.4 1.1 0.6 2000 4.8 2.1 1.9 0.3 0.2 0.5 0.3 0.5 -0.5 2001 8.3 6.0 1.3 0.1 0.1 0.3 0.4 -1.6 2.0 2002 10.5 3.9 0.8 0.5 1.6 2.1 0.2 0.5 2.9 2003 10.1 3.2 0.7 -0.1 -0.6 -0.6 0.0 1.3 5.5 2004 5.9 4.0 1.9 0.2 -0.1 0.1 0.2 1.2 -1.4 2005 6.9 3.9 1.2 0.6 0.6 1.2 0.3 1.1 -0.8 2006 8.0 4.4 1.5 0.0 0.8 0.8 0.2 0.9 0.2
Average annual growth rates 92-06 5.6 4.5 10.4 10.3 16.8 14.0 9.4 7.4 9.2 92-00 3.9 2.9 10.8 5.3 23.6 17.9 10.1 6.8 -6.5 01-06 8.3 6.9 9.8 17.7 6.5 14.3 8.4 8.2 32.7
Average shares 92-06 0.65 0.11 0.01 0.05 0.06 0.02 0.08 0.08 92-00 0.67 0.09 0.01 0.04 0.05 0.02 0.08 0.09 01-06 0.61 0.13 0.01 0.07 0.08 0.03 0.08 0.08
Average contributions to the Italian contribution to M3 growth rate 92-06 2.9 1.1 0.1 0.6 0.7 0.2 0.5 0.2 92-00 2.0 0.9 0.0 0.8 0.8 0.2 0.5 -0.6 01-06 4.2 1.2 0.2 0.4 0.6 0.2 0.6 1.4
Source: calculations based on Bank of Italy data.
Notes: The sectoral breakdown is based on MFIs and central government financial liabilities using outstanding amounts until 1996 and notional stocks afterwards. - The column labelled “Other items” comprises money market fund shares, debt securities up to two years and the discrepancies between the overall Italian contribution to M3 and the sum of the corresponding sectoral aggregates.

26
Figure 7
TOTAL FINANCIAL ASSETS HELD BY ITALIAN INVESTMENT FUNDS (end-of-period outstanding amounts)
0
100
200
300
400
500
600
700
800
1999 2000 2001 2002 2003 2004 2005 2006
Open-end investment funds in Luxembourg and Irelandcontrolled by Italian intermediariesItalian open-end investment funds
Source: authors’ calculations based on Assogestioni data.
7. Conclusions
In this paper we provide evidence that current excess liquidity in the euro area may
imply smaller upside risks to price stability over the medium term than usually argued. Our
claim is based on a sectoral breakdown of the monetary overhang, which shows that the
largest contribution to the increase in excess liquidity in the period 2001-2006 stemmed from
non-bank financial intermediaries’ money holdings, as well as from a large accumulation of
marketable instruments. Such increases are likely to be related more to portfolio choices than
to transaction motives.
The lack of comprehensive statistics for the euro area did not allow us to gain a deeper
understanding of the role of financial firms in the transmission mechanism of monetary
policy. Nonetheless, we derived some policy implications using available balance sheet data
on investment funds. In particular, we found that the substantial increase in deposits held by

27
these intermediaries in the euro area reflected an increase in their total financial assets and
not in their degree of liquidity. Our overall picture is that current excess liquidity mainly
reflects permanent changes in the financial structure of the economy. Interestingly, our
sectoral analysis suggests that excess liquidity did not appear before the end of 2005, which
is also the time when the ECB started to raise the official interest rates.
For monetary analysis purposes we think that additional investigations on these topics
are necessary, especially using the new and longer ECB dataset on sectoral money holdings.
First, the estimation of sectoral money demands is strongly advocated in order to understand
better the role of each money holding sector in the transmission of monetary policy. Second,
our sectoral distribution of the monetary overhang may offer a natural explanation of the
breakdown of estimated money demand equations for the euro area in recent years. Indeed,
permanent changes in the financial system produced by the increasing role of non-bank
financial intermediaries in the economy can lead to changes in the long-run equilibrium level
of real money holdings and offset the leading indicator properties of excess liquidity
measures for future inflation.
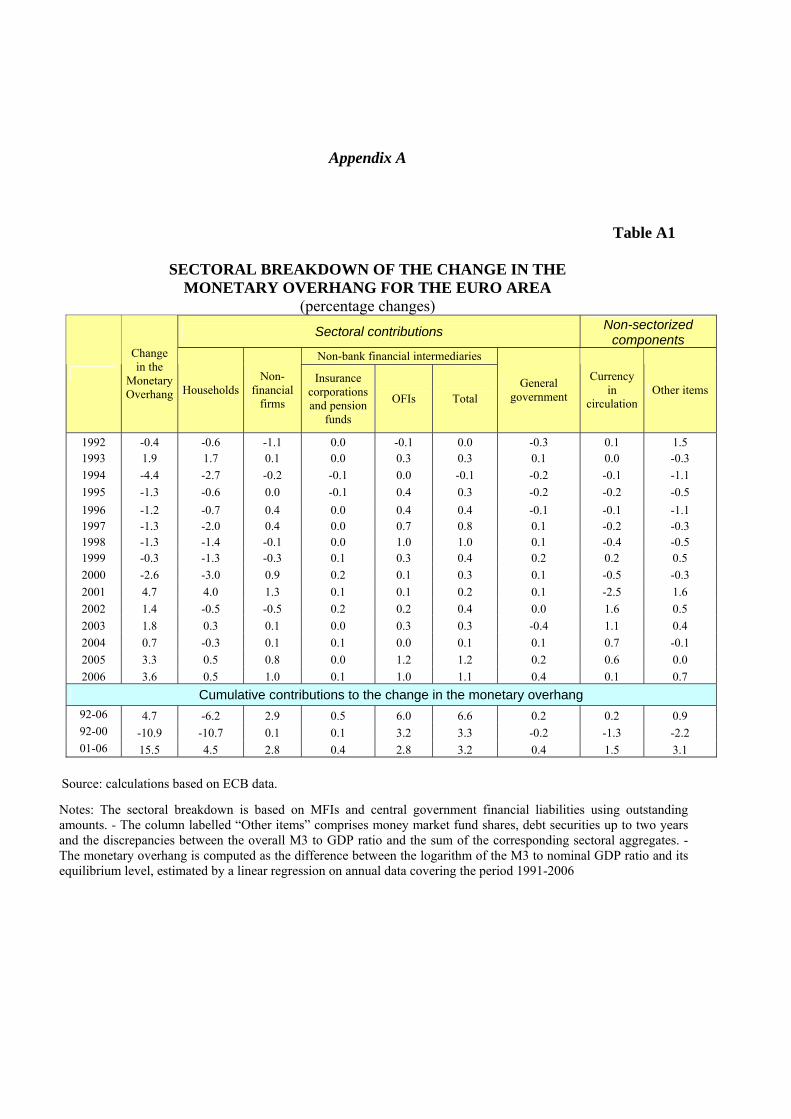
Appendix A
Table A1
SECTORAL BREAKDOWN OF THE CHANGE IN THE MONETARY OVERHANG FOR THE EURO AREA
(percentage changes) Sectoral contributions Non-sectorized
components Non-bank financial intermediaries
Change in the
Monetary Overhang Households
Non-financial
firms
Insurance corporations and pension
funds
OFIs Total General
government
Currency in
circulation Other items
1992 -0.4 -0.6 -1.1 0.0 -0.1 0.0 -0.3 0.1 1.5 1993 1.9 1.7 0.1 0.0 0.3 0.3 0.1 0.0 -0.3 1994 -4.4 -2.7 -0.2 -0.1 0.0 -0.1 -0.2 -0.1 -1.1 1995 -1.3 -0.6 0.0 -0.1 0.4 0.3 -0.2 -0.2 -0.5 1996 -1.2 -0.7 0.4 0.0 0.4 0.4 -0.1 -0.1 -1.1 1997 -1.3 -2.0 0.4 0.0 0.7 0.8 0.1 -0.2 -0.3 1998 -1.3 -1.4 -0.1 0.0 1.0 1.0 0.1 -0.4 -0.5 1999 -0.3 -1.3 -0.3 0.1 0.3 0.4 0.2 0.2 0.5 2000 -2.6 -3.0 0.9 0.2 0.1 0.3 0.1 -0.5 -0.3 2001 4.7 4.0 1.3 0.1 0.1 0.2 0.1 -2.5 1.6 2002 1.4 -0.5 -0.5 0.2 0.2 0.4 0.0 1.6 0.5 2003 1.8 0.3 0.1 0.0 0.3 0.3 -0.4 1.1 0.4 2004 0.7 -0.3 0.1 0.1 0.0 0.1 0.1 0.7 -0.1 2005 3.3 0.5 0.8 0.0 1.2 1.2 0.2 0.6 0.0 2006 3.6 0.5 1.0 0.1 1.0 1.1 0.4 0.1 0.7
Cumulative contributions to the change in the monetary overhang 92-06 4.7 -6.2 2.9 0.5 6.0 6.6 0.2 0.2 0.9 92-00 -10.9 -10.7 0.1 0.1 3.2 3.3 -0.2 -1.3 -2.2 01-06 15.5 4.5 2.8 0.4 2.8 3.2 0.4 1.5 3.1
Source: calculations based on ECB data.
Notes: The sectoral breakdown is based on MFIs and central government financial liabilities using outstanding amounts. - The column labelled “Other items” comprises money market fund shares, debt securities up to two years and the discrepancies between the overall M3 to GDP ratio and the sum of the corresponding sectoral aggregates. - The monetary overhang is computed as the difference between the logarithm of the M3 to nominal GDP ratio and its equilibrium level, estimated by a linear regression on annual data covering the period 1991-2006

29
Table A2
SECTORAL BREAKDOWN OF THE CHANGE IN THE MONETARY OVERHANG FOR ITALY
(percentage changes) Sectoral contributions Non-sectorized
components Non-bank financial intermediaries
Change in the
Monetary Overhang Households
Non-financial
firms
Insurance corporations and pension
funds
OFIs Total General
government
Currency in
circulation
Other items
1992 3.5 2.9 -0.4 0.1 -0.2 -0.2 0.2 0.4 0.6 1993 2.7 0.6 0.7 -0.2 0.8 0.6 0.3 0.1 0.4 1994 -4.3 -3.6 0.6 -0.1 0.1 0.0 -0.1 0.1 -1.3 1995 -3.5 -4.2 -0.3 0.1 0.3 0.4 0.2 -0.4 0.9 1996 -3.9 -2.8 -0.5 0.0 0.4 0.4 0.1 -0.3 -0.7 1997 -5.2 -2.1 0.2 -0.1 1.0 1.0 -0.1 0.2 -4.3 1998 -2.5 -0.7 2.2 -0.2 1.8 1.6 -0.3 0.2 -5.4 1999 -0.2 -3.3 0.4 0.1 1.1 1.2 0.3 0.7 0.4 2000 -1.4 -1.8 1.1 0.3 -0.3 -0.1 0.1 -0.1 -0.7 2001 2.8 2.5 0.6 0.1 -0.3 -0.2 0.2 -2.0 1.7 2002 5.9 1.1 0.3 0.4 1.3 1.7 0.1 0.2 2.6 2003 6.3 0.9 0.3 -0.1 -0.8 -1.0 -0.1 1.0 5.1 2004 1.3 1.2 1.3 0.1 -0.4 -0.2 0.1 0.8 -1.9 2005 4.3 2.3 0.9 0.5 0.4 1.0 0.2 0.9 -1.1 2006 5.1 2.7 1.1 -0.1 0.7 0.6 0.2 0.6 0.0
Cumulative contributions to the change in the monetary overhang 92-06 10.9 -4.4 8.3 0.8 5.9 6.7 1.3 2.4 -3.4 92-00 -14.8 -15.2 4.0 -0.1 5.0 4.9 0.7 0.8 -10.0 01-06 25.7 10.7 4.3 1.0 0.9 1.8 0.7 1.6 6.5
Source: calculations based on Bank of Italy data.
Notes: The sectoral breakdown is based on MFIs and central government financial liabilities using outstanding amounts until 1996 and adjusted notional flows afterwards. - The column labelled “Other items” comprises money market fund shares, debt securities up to two years and the discrepancies between the overall Italian contribution to M3 to GDP ratio and the sum of the corresponding sectoral aggregates. - The monetary overhang is computed as the difference between the M3 to nominal GDP ratio and its equilibrium level, estimated by a linear regression on annual data covering the period 1991-2006

30
Appendix B. Methodology
The monetary overhang for the whole economy in the year t is defined as
( )*ttttt ypmMO ν−−−= (B1)
The trend growth velocity of money is estimated with a linear interpolation on annual data
tt ⋅+= βαν ˆˆ* (B2)
The overall change in the monetary overhang between time t and T>t is
( ) ( ) ( )tTypmypmMOMO tttTTTtT −−−−−−−=− β̂ (B3)
The change in the monetary overhang in the sector i is
( ) ( )[ ] ( )tTypmypmMOMO itt
itTT
iT
it
iT −−−−−−−= β̂ - (B4)
The contribution of the sector i to the overall change in the monetary overhang is14
( ) ( )( )
( )t
iti
it
it
iTi
T MM
tTPYM
PYMPYMZ ⋅
⎥⎥⎦
⎤
⎢⎢⎣
⎡−−
⎪⎭
⎪⎬⎫
⎪⎩
⎪⎨⎧ −
≅ β̂)( (B5)
If the trend growth velocity of money is assumed to be the same among all sectors, namely
ii ∀= ββ (B6)
we obtain
( ) ( )( )
( )t
it
it
it
iTi
T MM
tTPYM
PYMPYMZ ⋅
⎥⎥⎦
⎤
⎢⎢⎣
⎡−−
⎪⎭
⎪⎬⎫
⎪⎩
⎪⎨⎧ −
≅ β̂)( (B7)
We note that, by definition ∑=
=n
it
it MM
1
, therefore,
( ) ( )( )
( ) tT
n
i
n
i t
it
t
it
it
it
iT
n
i
iT MOMO
MM
tTMM
PYMPYMPYM
Z −=⋅−−⋅⎥⎥⎦
⎤
⎢⎢⎣
⎡
⎪⎭
⎪⎬⎫
⎪⎩
⎪⎨⎧ −
=∑ ∑∑= == 1 11
)( β̂ (B8)
14 In deriving the sectoral breakdown of the monetary overhang in table 3, the sectoral weights t
it MM / are computed
using outstanding amounts, while the changes in ( )itPYM are computed using indexes of notional stocks.

31
References
Adalid, R. and Detken C. (2006), “Arsonist, Killjoy or White Night? The role of monetary policy during asset price booms”, ECB, mimeo.
Alves, N., Robalo Marques C. and Sousa J. (2006), “Some issues concerning the use of M3 for monetary policy analysis in the euro area”, Banco de Portugal, Economic Bulletin, 2006.
Benati, L., Surico P., Thomas J. and Weldon D. (2006), “OFCs’ money, asset prices and inflation: some evidence for the UK”, Bank of England, mimeo.
Borio, C. and Lowe P. (2002), “Asset prices, financial and monetary stability: exploring the nexus”, BIS Working Paper, 114.
Borio, C. and Lowe P. (2004), “Securing sustainable price stability: should credit come back from the wilderness?”, BIS Working Paper, 157.
Brand, C. and Cassola N. (2000), “A money demand system for euro area M3”, ECB Working Paper, 39.
Bruggeman, A., Donati P. and Warne A. (2003), “Is the demand for euro area M3 stable?”, ECB Working Paper, 255.
Calza, A., Gerdesmeier, D. and Levy J. (2001), “Euro area money demand: measuring the opportunity costs appropriately”, IMF Working Paper, 179.
Carstensen, K. (2004), “Stock Market Downswing and the Stability of EMU Money”, Kiel Institute of World Economics, mimeo.
Cassola, N. and Morana C. (2002), “Monetary policy and the stock market in the euro area”, ECB Working Paper, 119.
Chrystal, A. and Drake L. (1994), “Company-sector money demand: new evidence on the existence of a stable long-run relationship for the United Kingdom”, Journal of Money, Credit and Banking, 26, 3, 479-94.
Chrystal, A. and Mizen P. (2005), “Other financial corporations: Cinderella or ugly sister of empirical monetary economics?”, International Journal of Finance and Economics, 10, 63-80.
Coenen, G. and Vega J. (2001), “The Demand for M3 in the euro area”, Journal of Applied Econometrics, 16, 727-748.
Congdon, T. (2000a), “Money and asset prices in the UK’s boom-bust cycles: some contemporary history”, Lombard Street Research Monthly Economic Review, 132, 3-20.
Congdon, T. (2000b), “Money and asset prices in the UK’s boom-bust cycles: some theory”, Lombard Street Research Monthly Economic Review, 131, 3-16.
Congdon, T. (2005), “Money and asset prices in boom and bust”, Institute of Economic Affairs, manuscript.
Detken, C. and Smets F. (2004), “Asset price booms and monetary policy”, ECB Working Paper, 364.
ECB (2001), “Framework and tools of monetary analysis”, ECB Monthly Bulletin, May 2001.
ECB (2004), “Monetary analysis in real time”, ECB Monthly Bulletin, October 2004.
32
ECB (2006), “New euro area historical series on holdings of M3 deposits by sector”, ECB Monthly Bulletin, August 2006.
Fisher, P. G. and Vega J. (1993), “An empirical analysis of M4 in the United Kingdom”, Bank of England Working Paper, 21.
Fujiki, H. and Mulligan C. (1996), “Production, financial sophistication, and the demand for money by households and firms,” Bank of Japan Monetary and Economic Studies, 14 (1), 65–103.
Gerlach, S. and Svensson L. (2003), “Money and inflation in the euro area: a case for monetary indicators?”, Journal of Monetary Economics, 50, 1649-72.
Hallman, J. J., Porter R. D. and Small D. H. (1991), “Is the price level tied to the M2 monetary aggregate in the long run?”, American Economic Review, 81, 4, 841-858.
Hofmann, B. (2006), “Do monetary indicators (still) predict euro area inflation?”, Deutsche Bundesbank, Discussion Paper, 18.
Ireland, J. and Wren-Lewis S. (1992), “Buffer-stock money and the company sector”, Oxford Economic Papers, 44, 209-31.
Laidler, D. E. W. (1997), “Notes on the microfoundations of monetary economics”, Economic Journal, 106, 445, 231-243.
Lucas, R. E. (1995), “Nobel lecture: monetary neutrality”, Journal of Political Economy, 104, 4, 661-82.
Masuch, K., H. Pill and C. Willeke (2001), “Framework and tools of monetary analysis”, in H.-J. Klöckers and Willeke C. (eds.), “Monetary analysis: Tools and applications”, ECB, Frankfurt am Main.
McCandless, G. T. and. Weber W. E (1995), “Some monetary facts”, Federal Reserve Bank of Minneapolis, Quarterly Review, 19, 3, 2-11.
Mizen, P. (1996), “Modelling the demand for money in the industrial and commercial companies sector in the United Kingdom”, Journal of Policy Modelling, 18, 4, 445-67.
Moutot, P. et al. (2007), “The role of Other Financial Intermediaries for money and credit developments in the euro area”, ECB Occasional Paper, forthcoming.
Nicoletti Altimari, S. (2001), “Does money lead inflation in the Euro Area?”, ECB Working Paper, 63.
Orphanides, A. and Porter R. D. (2001), “Money and inflation: the role of information regarding the determinants of M2 behaviour”, in H.-J. Klöckers and Willeke C. (eds.), Monetary Analysis: Tools and Applications, ECB, Frankfurt am Main.
Thomas, R. S. J. (1997a), “The demand for M4: a sectoral analysis - Part 1, the personal sector”, Bank of England Working Paper, 61.
Thomas, R. S. J. (1997b), “The demand for M4: a sectoral analysis - Part 2, the corporate sector”, Bank of England Working Paper, 62.
Trecroci, C. and Vega J.-L. (2002), “The information content of M3 for future inflation”, Weltwirtschaftliches Archiv, 138, 1, 22-53.
(*) Requests for copies should be sent to: Banca d’Italia – Servizio Studi – Divisione Biblioteca e pubblicazioni – Via Nazionale, 91 – 00184 Rome(fax 0039 06 47922059). They are available on the Internet www.bancaditalia.it.
RECENTLY PUBLISHED “TEMI” (*)
N. 603 – A dual-regime utility model for poverty analysis, by Claudia Biancotti (September 2006).
N. 604 – The political economy of investor protection, by Pietro Tommasino (December 2006).
N. 605 – Search in thick markets: Evidence from Italy, by Sabrina Di Addario (December 2006).
N. 606 – The transmission of monetary policy shocks from the US to the euro area, by S. Neri and A. Nobili (December 2006).
N. 607 – What does a technology shock do? A VAR analysis with model-based sign restrictions, by L. Dedola and S. Neri (December 2006).
N. 608 – Merge and compete: Strategic incentives for vertical integration, by Filippo Vergara Caffarelli (December 2006).
N. 609 – Real-time determinants of fiscal policies in the euro area: Fiscal rules, cyclical conditions and elections, by Roberto Golinelli and Sandro Momigliano (December 2006).
N. 610 – L’under-reporting della ricchezza finanziaria nell’indagine sui bilanci delle famiglie, by Leandro D’Aurizio, Ivan Faiella, Stefano Iezzi, Andrea Neri (December 2006).
N. 611 – La polarizzazione territoriale del prodotto pro capite: un’analisi del caso italiano sulla base di dati provinciali by Stefano Iezzi (December 2006).
N. 612 – A neural network architecture for data editing in the Bank of Italy’s business surveys by Claudia Biancotti, Leandro D’Aurizio and Raffaele Tartaglia-Polcini (February 2007).
N. 613 – Outward FDI and Local Employment Growth in Italy, by Stefano Federico and Gaetano Alfredo Minerva (February 2007).
N. 614 – Testing for trend, by Fabio Busetti and Andrew Harvey (February 2007).N. 615 – Macroeconomic uncertainty and banks’ lending decisions: The case of Italy, by
Mario Quagliariello (February 2007).N. 616 – Entry barriers in italian retail trade, by Fabiano Schivardi and Eliana Viviano
(February 2007).N. 617 – A politicy-sensible core-inflation measure for the euro area, by Stefano Siviero and
Giovanni Veronese (February 2007).N. 618 – Le opinioni degli italiani sull’evasione fiscale, by Luigi Cannari and Giovanni
D'Alessio (February 2007)N. 619 – Memory for prices and the euro cash changeover: An alalysis for cinema prices in
Italy, by Vincenzo Cestari, Paolo Del Giovane and Clelia Rossi-Arnaud (February 2007).
N. 620 – Intertemporal consumption choises, transaction costs and limited participation in financial markets: Reconciling data and theory, by Orazio P. Attanasio and Monica Paiella (April 2007).
N. 621 – Why demand uncertainty curbs investment: Evidence from a panel of Italian manufacturing firms, by Maria Elena Bontempi, Roberto Golinelli and Giuseppe Parigi (April 2007).
N. 622 – Employment, innovation and productivity: Evidence from italian microdata, by Bronwyn H. Hall, Francesca Lotti and Jacques Mairesse (April 2007).
N. 623 – Measurement of Income Distribution in Supranational Entities: The Case of the European Union, by Andrea Brandolini (April 2007).
N. 624 – Un nuovo metodo per misurare la dotazione territoriale di infrastrutture di trasporto, by Giovanna Messina (April 2007).
N. 625 – The forgone gains of incomplete portfolios, by Monica Paiella (April 2007).N. 626 – University drop-out: The case of Italy, by Federico Cingano and Piero Cipollone
(April 2007).
"TEMI" LATER PUBLISHED ELSEWHERE
2001
M. CARUSO, Stock prices and money velocity: A multi-country analysis, Empirical Economics, Vol. 26 (4), pp. 651-672, TD No. 264 (February 1996).
P. CIPOLLONE and D. J. MARCHETTI, Bottlenecks and limits to growth: A multisectoral analysis of Italian industry, Journal of Policy Modeling, Vol. 23 (6), pp. 601-620, TD No. 314 (August 1997).
P. CASELLI, Fiscal consolidations under fixed exchange rates, European Economic Review, Vol. 45 (3), pp. 425-450, TD No. 336 (October 1998).
F. ALTISSIMO and G. L. VIOLANTE, The non-linear dynamics of output and unemployment in the US, Journal of Applied Econometrics, Vol. 16 (4), pp. 461-486, TD No. 338 (October 1998).
F. NUCCI and A. F. POZZOLO, Investment and the exchange rate: An analysis with firm-level panel data, European Economic Review, Vol. 45 (2), pp. 259-283, TD No. 344 (December 1998).
A. ZAGHINI, Fiscal adjustments and economic performing: A comparative study, Applied Economics, Vol. 33 (5), pp. 613-624, TD No. 355 (June 1999).
L. GAMBACORTA, On the institutional design of the European monetary union: Conservatism, stability pact and economic shocks, Economic Notes, Vol. 30 (1), pp. 109-143, TD No. 356 (June 1999).
P. FINALDI RUSSO and P. ROSSI, Credit costraints in italian industrial districts, Applied Economics, Vol. 33 (11), pp. 1469-1477, TD No. 360 (December 1999).
A. CUKIERMAN and F. LIPPI, Labor markets and monetary union: A strategic analysis, Economic Journal, Vol. 111 (473), pp. 541-565, TD No. 365 (February 2000).
G. PARIGI and S. SIVIERO, An investment-function-based measure of capacity utilisation, potential output and utilised capacity in the Bank of Italy’s quarterly model, Economic Modelling, Vol. 18 (4), pp. 525-550, TD No. 367 (February 2000).
P. CASELLI, P. PAGANO and F. SCHIVARDI, Investment and growth in Europe and in the United States in the nineties, Rivista di politica economica, v. 91, 10, pp. 3-35, TD No. 372 (March 2000).
F. BALASSONE and D. MONACELLI, Emu fiscal rules: Is there a gap?, in: M. Bordignon and D. Da Empoli (eds.), Politica fiscale, flessibilità dei mercati e crescita, Milano, Franco Angeli, TD No. 375 (July 2000).
A. B. ATKINSON and A. BRANDOLINI, Promise and pitfalls in the use of “secondary" data-sets: Income inequality in OECD countries as a case study, Journal of Economic Literature, Vol. 39 (3), pp. 771-799, TD No. 379 (October 2000).
D. FOCARELLI and A. F. POZZOLO, The patterns of cross-border bank mergers and shareholdings in OECD countries, Journal of Banking and Finance, Vol. 25 (12), pp. 2305-2337, TD No. 381 (October 2000).
M. SBRACIA and A. ZAGHINI, Expectations and information in second generation currency crises models, Economic Modelling, Vol. 18 (2), pp. 203-222, TD No. 391 (December 2000).
F. FORNARI and A. MELE, Recovering the probability density function of asset prices using GARCH as diffusion approximations, Journal of Empirical Finance, Vol. 8 (1), pp. 83-110, TD No. 396 (February 2001).
P. CIPOLLONE, La convergenza dei salari dell'industria manifatturiera in Europa, Politica economica, Vol. 17 (1), pp. 97-125, TD No. 398 (February 2001).
E. BONACCORSI DI PATTI and G. GOBBI, The changing structure of local credit markets: Are small businesses special?, Journal of Banking and Finance, Vol. 25 (12), pp. 2209-2237, TD No. 404 (June 2001).
L. DEDOLA and S. LEDUC, Why is the business-cycle behaviour of fundamentals alike across exchange-rate regimes?, International Journal of Finance and Economics, v. 6, 4, pp. 401-419, TD No. 411 (August 2001).
M. PAIELLA, Limited Financial Market Participation: a Transaction Cost-Based Explanation, IFS Working Paper, 01/06, TD No. 415 (August 2001).
G. MESSINA, Per un federalismo equo e solidale: obiettivi e vincoli per la perequazione regionale in Italia,, Studi economici, Vol. 56 (73), pp. 131-148, TD No. 416 (August 2001).
L GAMBACORTA Bank-specific characteristics and monetary policy transmission: the case of Italy, ECB Working Paper, 103, TD No. 430 (December 2001).

F. ALTISSIMO, A. BASSANETTI, R. CRISTADORO, M. FORNI, M. LIPPI, L. REICHLIN and G. VERONESE A real time coincident indicator of the euro area business cycle, CEPR Discussion Paper, 3108, TD No. 436 (December 2001).
A. GERALI and F. LIPPI, On the "conquest" of inflation, CEPR Discussion Paper, 3101, TD No. 444 (July 2002).
L. GUISO and M. PAIELLA, Risk aversion, wealth and background risk, CEPR Discussion Paper, 2728, TD No. 483 (September 2003).
2002
R. CESARI and F. PANETTA, The performance of italian equity fund, Journal of Banking and Finance, Vol. 26 (1), pp. 99-126, TD No. 325 (January 1998).
F. ALTISSIMO, S. SIVIERO and D. TERLIZZESE, How deep are the deep parameters?, Annales d’Economie et de Statistique, (67/68), pp. 207-226, TD No. 354 (June 1999).
F. FORNARI, C. MONTICELLI, M. PERICOLI and M. TIVEGNA, The impact of news on the exchange rate of the lira and long-term interest rates, Economic Modelling, Vol. 19 (4), pp. 611-639, TD No. 358 (October 1999).
D. FOCARELLI, F. PANETTA and C. SALLEO, Why do banks merge?, Journal of Money, Credit and Banking, Vol. 34 (4), pp. 1047-1066, TD No. 361 (December 1999).
D. J. MARCHETTI, Markup and the business cycle: Evidence from Italian manufacturing branches, Open Economies Review, Vol. 13 (1), pp. 87-103, TD No. 362 (December 1999).
F. BUSETTI, Testing for (common) stochastic trends in the presence of structural break, Journal of Forecasting, Vol. 21 (2), pp. 81-105, TD No. 385 (October 2000).
F. LIPPI, Revisiting the Case for a Populist Central Banker, European Economic Review, Vol. 46 (3), pp. 601-612, TD No. 386 (October 2000).
F. PANETTA, The stability of the relation between the stock market and macroeconomic forces, Economic Notes, Vol. 31 (3), pp. 417-450, TD No. 393 (February 2001).
G. GRANDE and L. VENTURA, Labor income and risky assets under market incompleteness: Evidence from Italian data, Journal of Banking and Finance, Vol. 26 (2-3), pp. 597-620, TD No. 399 (March 2001).
A. BRANDOLINI, P. CIPOLLONE and P. SESTITO, Earnings dispersion, low pay and household poverty in Italy, 1977-1998, in D. Cohen, T. Piketty and G. Saint-Paul (eds.), The Economics of Rising Inequalities, Oxford, Oxford University Press, TD No. 427 (November 2001).
E. GAIOTTI and A. GENERALE, Does monetary policy have asymmetric effects? A look at the investment decisions of Italian firms, Giornale degli economisti e annali di economia, v. 61, 1, pp. 29-60, TD No. 429 (December 2001).
G. M. TOMAT, Durable goods, price indexes and quality change: An application to automobile prices in Italy, 1988-1998, ECB Working Paper, 118, TD No. 439 (March 2002).
A. PRATI and M. SBRACIA, Currency crises and uncertainty about fundamentals, IMF Working Paper, 3, TD No. 446 (July 2002).
L. CANNARI and G. D’ALESSIO, La distribuzione del reddito e della ricchezza nelle regioni italiane, Rivista Economica del Mezzogiorno, Vol. 16 (4), pp. 809-847, Il Mulino, TD No. 482 (June 2003).
2003
L. GAMBACORTA, Asymmetric bank lending channels and ECB monetary policy, Economic Modelling, Vol. 20, 1, pp. 25-46, TD No. 340 (October 1998).
F. SCHIVARDI, Reallocation and learning over the business cycle, European Economic Review, Vol. 47 (1), pp. 95-111, TD No. 345 (December 1998).
P. CASELLI, P. PAGANO and F. SCHIVARDI, Uncertainty and slowdown of capital accumulation in Europe, Applied Economics, Vol. 35 (1), pp. 79-89, TD No. 372 (March 2000).
F. LIPPI, Strategic monetary policy with non-atomistic wage setters, Review of Economic Studies, v. 70, 4, pp. 909-919, TD No. 374 (June 2000).

P. ANGELINI and N. CETORELLI, The effect of regulatory reform on competition in the banking industry, Journal of Money, Credit and Banking, Vol. 35, 5, pp. 663-684, TD No. 380 (October 2000).
P. PAGANO and G. FERRAGUTO, Endogenous growth with intertemporally dependent preferences, Contribution to Macroeconomics, Vol. 3 (1), pp. 1-38, TD No. 382 (October 2000).
P. PAGANO and F. SCHIVARDI, Firm size distribution and growth, Scandinavian Journal of Economics, Vol. 105 (2), pp. 255-274, TD No. 394 (February 2001).
M. PERICOLI and M. SBRACIA, A Primer on Financial Contagion, Journal of Economic Surveys, Vol. 17 (4), pp. 571-608, TD No. 407 (June 2001).
M. SBRACIA and A. ZAGHINI, The role of the banking system in the international transmission of shocks, World Economy, Vol. 26 (5), pp. 727-754, TD No. 409 (June 2001).
L. GAMBACORTA, The Italian banking system and monetary policy transmission: evidence from bank level data, in: I. Angeloni, A. Kashyap and B. Mojon (eds.), Monetary Policy Transmission in the Euro Area, Cambridge University Press, TD No. 430 (December 2001).
M. EHRMANN, L. GAMBACORTA, J. MARTÍNEZ PAGÉS, P. SEVESTRE and A. WORMS, Financial systems and the role of banks in monetary policy transmission in the euro area, in: I. Angeloni, A. Kashyap and B. Mojon (eds.), Monetary Policy Transmission in the Euro Area, Cambridge, Cambridge University Press, TD No. 432 (December 2001).
F. SPADAFORA, Official bailouts, moral hazard and the "Specialtiy" of the international interbank market, Emerging Markets Review, Vol. 4 ( 2), pp. 165-196, TD No. 438 (March 2002).
D. FOCARELLI and F. PANETTA, Are mergers beneficial to consumers? Evidence from the market for bank deposits, American Economic Review, Vol. 93 (4), pp. 1152-1172, TD No. 448 (July 2002).
E.VIVIANO, Un'analisi critica delle definizioni di disoccupazione e partecipazione in Italia, Politica Economica, Vol. 19 (1), pp. 161-190, TD No. 450 (July 2002).
M. PAGNINI, Misura e determinanti dell’agglomerazione spaziale nei comparti industriali in Italia, Rivista di Politica Economica, Vol. 93 (3-4), pp. 149-196, TD No. 452 (October 2002).
F. PANETTA, Evoluzione del sistema bancario e finanziamento dell'economia nel Mezzogiorno, Moneta e credito, v. 56, 222, pp. 127-160, TD No. 467 (March 2003).
F. BUSETTI and A. M. ROBERT TAYLOR, Testing against stochastic trend and seasonality in the presence of unattended breaks and unit roots, Journal of Econometrics, Vol. 117 (1), pp. 21-53, TD No. 470 (March 2003).
P. ZAFFARONI, Testing against stochastic trend and seasonality in the presence of unattended breaks and unit roots, Journal of Econometrics, v. 115, 2, pp. 199-258, TD No. 472 (June 2003).
E. BONACCORSI DI PATTI, G. GOBBI and P. E. MISTRULLI, Sportelli e reti telematiche nella distribuzione dei servizi bancari, Banca impresa società, v. 2, 2, pp. 189-209, TD No. 508 (July 2004).
2004
P. ANGELINI and N. CETORELLI, Gli effetti delle modifiche normative sulla concorrenza nel mercato creditizio, in F. Panetta (eds.), Il sistema bancario negli anni novanta: gli effetti di una trasformazione, Bologna, il Mulino, TD No. 380 (October 2000).
P. CHIADES and L. GAMBACORTA, The Bernanke and Blinder model in an open economy: The Italian case, German Economic Review, Vol. 5 (1), pp. 1-34, TD No. 388 (December 2000).
M. BUGAMELLI and P. PAGANO, Barriers to Investment in ICT, Applied Economics, Vol. 36 (20), pp. 2275-2286, TD No. 420 (October 2001).
F. BUSETTI, Preliminary data and econometric forecasting: An application with the Bank of Italy quarterly model, CEPR Discussion Paper, 4382, TD No. 437 (December 2001).
A. BAFFIGI, R. GOLINELLI and G. PARIGI, Bridge models to forecast the euro area GDP, International Journal of Forecasting, Vol. 20 (3), pp. 447-460,TD No. 456 (December 2002).
D. AMEL, C. BARNES, F. PANETTA and C. SALLEO, Consolidation and Efficiency in the Financial Sector: A Review of the International Evidence, Journal of Banking and Finance, Vol. 28 (10), pp. 2493-2519, TD No. 464 (December 2002).
M. PAIELLA, Heterogeneity in financial market participation: Appraising its implications for the C-CAPM, Review of Finance, Vol. 8, 3, pp. 445-480, TD No. 473 (June 2003).
F. CINGANO and F. SCHIVARDI, Identifying the sources of local productivity growth, Journal of the European Economic Association, Vol. 2 (4), pp. 720-742, TD No. 474 (June 2003).

E. BARUCCI, C. IMPENNA and R. RENÒ, Monetary integration, markets and regulation, Research in Banking and Finance, (4), pp. 319-360, TD No. 475 (June 2003).
G. ARDIZZI, Cost efficiency in the retail payment networks: first evidence from the Italian credit card system, Rivista di Politica Economica, Vol. 94, (3), pp. 51-82, TD No. 480 (June 2003).
E. BONACCORSI DI PATTI and G. DELL’ARICCIA, Bank competition and firm creation, Journal of Money Credit and Banking, Vol. 36 (2), pp. 225-251, TD No. 481 (June 2003).
R. GOLINELLI and G. PARIGI, Consumer sentiment and economic activity: a cross country comparison, Journal of Business Cycle Measurement and Analysis, Vol. 1 (2), pp. 147-170, TD No. 484 (September 2003).
L. GAMBACORTA and P. E. MISTRULLI, Does bank capital affect lending behavior?, Journal of Financial Intermediation, Vol. 13 (4), pp. 436-457, TD No. 486 (September 2003).
F. SPADAFORA, Il pilastro privato del sistema previdenziale: il caso del Regno Unito, Economia Pubblica, 34, (5), pp. 75-114, TD No. 503 (June 2004).
C. BENTIVOGLI and F. QUINTILIANI, Tecnologia e dinamica dei vantaggi comparati: un confronto fra quattro regioni italiane, in C. Conigliani (eds.), Tra sviluppo e stagnazione: l’economia dell’Emilia-Romagna, Bologna, Il Mulino, TD No. 522 (October 2004).
G. GOBBI and F. LOTTI, Entry decisions and adverse selection: an empirical analysis of local credit markets, Journal of Financial services Research, Vol. 26 (3), pp. 225-244, TD No. 535 (December 2004).
E. GAIOTTI and F. LIPPI, Pricing behavior and the introduction of the euro:evidence from a panel of restaurants, Giornale degli Economisti e Annali di Economia, 2004, Vol. 63, (3/4), pp. 491-526, TD No. 541 (February 2005).
A. CICCONE, F. CINGANO and P. CIPOLLONE, The Private and Social Return to Schooling in Italy, Giornale degli economisti e annali di economia, v. 63, 3-4, pp. 413-444, TD No. 569 (January 2006).
2005
L. DEDOLA and F. LIPPI, The monetary transmission mechanism: Evidence from the industries of 5 OECD countries, European Economic Review, 2005, Vol. 49, (6), pp. 1543-1569, TD No. 389 (December 2000).
D. J. MARCHETTI and F. NUCCI, Price stickiness and the contractionary effects of technology shocks. European Economic Review, v. 49, pp. 1137-1164, TD No. 392 (February 2001).
G. CORSETTI, M. PERICOLI and M. SBRACIA, Some contagion, some interdependence: More pitfalls in tests of financial contagion, Journal of International Money and Finance, v. 24, 8, pp. 1177-1199, TD No. 408 (June 2001).
GUISO L., L. PISTAFERRI and F. SCHIVARDI, Insurance within the firm. Journal of Political Economy, 113, pp. 1054-1087, TD No. 414 (August 2001)
R. CRISTADORO, M. FORNI, L. REICHLIN and G. VERONESE, A core inflation indicator for the euro area, Journal of Money, Credit, and Banking, v. 37, 3, pp. 539-560, TD No. 435 (December 2001).
F. ALTISSIMO, E. GAIOTTI and A. LOCARNO, Is money informative? Evidence from a large model used for policy analysis, Economic & Financial Modelling, v. 22, 2, pp. 285-304, TD No. 445 (July 2002).
G. DE BLASIO and S. DI ADDARIO, Do workers benefit from industrial agglomeration? Journal of regional Science, Vol. 45, (4), pp. 797-827, TD No. 453 (October 2002).
R. TORRINI, Cross-country differences in self-employment rates: The role of institutions, Labour Economics, V. 12, 5, pp. 661-683, TD No. 459 (December 2002).
A. CUKIERMAN and F. LIPPI, Endogenous monetary policy with unobserved potential output, Journal of Economic Dynamics and Control, v. 29, 11, pp. 1951-1983, TD No. 493 (June 2004).
M. OMICCIOLI, Il credito commerciale: problemi e teorie, in L. Cannari, S. Chiri e M. Omiccioli (eds.), Imprese o intermediari? Aspetti finanziari e commerciali del credito tra imprese in Italia, Bologna, Il Mulino, TD No. 494 (June 2004).
L. CANNARI, S. CHIRI and M. OMICCIOLI, Condizioni di pagamento e differenziazione della clientela, in L. Cannari, S. Chiri e M. Omiccioli (eds.), Imprese o intermediari? Aspetti finanziari e commerciali del credito tra imprese in Italia, Bologna, Il Mulino, TD No. 495 (June 2004).
P. FINALDI RUSSO and L. LEVA, Il debito commerciale in Italia: quanto contano le motivazioni finanziarie?, in L. Cannari, S. Chiri e M. Omiccioli (eds.), Imprese o intermediari? Aspetti finanziari e commerciali del credito tra imprese in Italia, Bologna, Il Mulino, TD No. 496 (June 2004).
A. CARMIGNANI, Funzionamento della giustizia civile e struttura finanziaria delle imprese: il ruolo del credito commerciale, in L. Cannari, S. Chiri e M. Omiccioli (eds.), Imprese o intermediari? Aspetti finanziari e commerciali del credito tra imprese in Italia, Bologna, Il Mulino, TD No. 497 (June 2004).
G. DE BLASIO, Credito commerciale e politica monetaria: una verifica basata sull’investimento in scorte, in L. Cannari, S. Chiri e M. Omiccioli (eds.), Imprese o intermediari? Aspetti finanziari e commerciali del credito tra imprese in Italia, Bologna, Il Mulino, TD No. 498 (June 2004).
G. DE BLASIO, Does trade credit substitute bank credit? Evidence from firm-level data. Economic notes, Vol. 34 (1), pp. 85-112, TD No. 498 (June 2004).
A. DI CESARE, Estimating Expectations of Shocks Using Option Prices, The ICFAI Journal of Derivatives Markets, Vol. 2, (1), pp. 42-53, TD No. 506 (July 2004).
M. BENVENUTI and M. GALLO, Il ricorso al "factoring" da parte delle imprese italiane, in L. Cannari, S. Chiri e M. Omiccioli (eds.), Imprese o intermediari? Aspetti finanziari e commerciali del credito tra imprese in Italia, Bologna, Il Mulino, TD No. 518 (October 2004).
L. CASOLARO and L. GAMBACORTA, Redditività bancaria e ciclo economico, Bancaria, v. 61, 3, pp. 19-27, TD No. 519 (October 2004).
F. PANETTA, F. SCHIVARDI and M. SHUM, Do mergers improve information? Evidence from the loan market, CEPR Discussion Paper, 4961, TD No. 521 (October 2004).
P. DEL GIOVANE and R. SABBATINI, La divergenza tra inflazione rilevata e percepita in Italia, Bologna, Il Mulino, TD No. 532 (December 2004).
R. TORRINI, Quota dei profitti e redditività del capitale in Italia: un tentativo di interpretazione, Politica economica, v. 21, pp. 7-42, TD No. 551 (June 2005).
M. OMICCIOLI, Il credito commerciale come “collateral”, in L. Cannari, S. Chiri, M. Omiccioli (eds.), Imprese o intermediari? Aspetti finanziari e commerciali del credito tra imprese in Italia, Bologna, il Mulino, TD No. 553 (June 2005).
L. CASOLARO, L. GAMBACORTA and L. GUISO, Regulation, formal and informal enforcement and the development of the household loan market. Lessons from Italy, in Bertola G., Grant C. and Disney R. (eds.) The Economics of Consumer Credit: European Experience and Lessons from the US, Boston, MIT Press, TD No. 560 (September 2005).
S. DI ADDARIO and E. PATACCHINI, Wages and the city: The italian case, University of Oxford, Department of Economics. Discussion Paper, 243, TD No. 570 (January 2006).
P. ANGELINI and F. LIPPI, Did inflation really soar after the euro changeover? Indirect evidence from ATM withdrawals, CEPR Discussion Paper, 4950, TD No. 581 (March 2006).
2006
C. BIANCOTTI, A polarization of inequality? The distribution of national Gini coefficients 1970-1996, Journal of Economic Inequality, v. 4, 1, pp. 1-32, TD No. 487 (March 2004).
M. BOFONDI and G. GOBBI, Information barriers to entry into credit markets, Review of Finance, Vol. 10 (1), pp. 39-67, TD No. 509 (July 2004).
LIPPI F. and W. FUCHS, Monetary union with voluntary participation, Review of Economic Studies, 73, pp. 437-457 TD No. 512 (July 2004).
GAIOTTI E. and A. SECCHI, Is there a cost channel of monetary transmission? An investigation into the pricing behaviour of 2000 firms, Journal of Money, Credit, and Banking, v. 38, 8, pp. 2013-2038 TD No. 525 (December 2004).
A. BRANDOLINI, P. CIPOLLONE and E. VIVIANO, Does the ILO definition capture all unemployment?, Journal of the European Economic Association, v. 4, 1, pp. 153-179, TD No. 529 (December 2004).
A. BRANDOLINI, L. CANNARI, G. D’ALESSIO and I. FAIELLA, Household Wealth Distribution in Italy in the 1990s, In E. N. Wolff (ed.) International Perspectives on Household Wealth, Cheltenham, Edward Elgar, TD No. 530 (December 2004).
A. NOBILI, Assessing the predictive power of financial spreads in the euro area: does parameters instability matter?, Empirical Economics, v. 31, 4, pp. , TD No. 544 (February 2005).
L. GUISO and M. PAIELLA, The Role of Risk Aversion in Predicting Individual Behavior, In P. A. Chiappori e C. Gollier (eds.) Competitive Failures in Insurance Markets: Theory and Policy Implications, Monaco, CESifo, TD No. 546 (February 2005).

G. M. TOMAT, Prices product differentiation and quality measurement: A comparison between hedonic and matched model methods, Research in Economics, No. 60, pp. 54-68, TD No. 547 (February 2005).
M. CARUSO, Stock market fluctuations and money demand in Italy, 1913 - 2003, Economic Notes, v. 35, 1, pp. 1-47, TD No. 576 (February 2006).
R. BRONZINI and G. DE BLASIO, Evaluating the impact of investment incentives: The case of Italy’s Law 488/92. Journal of Urban Economics, vol. 60, n. 2, pag. 327-349, TD No. 582 (March 2006).
A. DI CESARE, Do market-based indicators anticipate rating agencies? Evidence for international banks, Economic Notes, v. 35, pp. 121-150, TD No. 593 (May 2006).
L. DEDOLA and S. NERI, What does a Technology Shock Do? A VAR Analysis with Model-Based Sign Restrictions, Journal of Monetary Economics, v. 54, 2, pp. 512 - 549, TD No. 607 (December 2006).
2007
F. LOTTI and J. MARCUCCI, Revisiting the Empirical Evidence on Firms' Money Demand, Journal of Economics and Business, v. 59, 1, pp. 51-73, TD No. 595 (May 2006).
FORTHCOMING
S. MAGRI, Italian Households' Debt: The Participation to the Debt market and the Size of the Loan, Empirical Economics, TD No. 454 (October 2002).
F. LIPPI and S. NERI, Information variables for monetary policy in a small structural model of the euro area, Journal of Monetary Economics TD No. 511 (July 2004).
A. ANZUINI and A. LEVY, Monetary Policy Shocks in the new EU members: A VAR approach, Journal of Monetary Economics TD No. 514 (July 2004).
A. DALMAZZO and G. DE BLASIO, Production and Consumption Externalities of Human Capital: An Empirical Study for Italy, Journal of Population Economics, TD No. 554 (June 2005).
R. BRONZINI and G. DE BLASIO, Una valutazione degli incentivi pubblici agli investimenti, Rivista Italiana degli Economisti , TD No. 582 (March 2006).
L. DEDOLA and S. NERI, What does a technology shock do? A VAR analysis with model-based sign restrictions, Journal of Monetary Economics TD No. 607 (December 2006).