del servizio studi how do banks set interest rates? - … · del servizio studi how do banks set...
TRANSCRIPT

Temi di discussionedel Servizio Studi
How do banks set interest rates?
Number 542 - February 2005
by Leonardo Gambacorta

The purpose of the Temi di discussione series is to promote the circulation of working papers prepared within the Bank of Italy or presented in Bank seminars by outside economists with the aim of stimulating comments and suggestions.
The views expressed in the articles are those of the authors and do not involve the responsibility of the Bank.
Editorial Board:GIORGIO GOBBI, MARCELLO BOFONDI, MICHELE CAIVANO, ANDREA LAMORGESE, FRANCESCO PATERNÒ, MARCELLO PERICOLI, ALESSANDRO SECCHI, FABRIZIO VENDITTI, STEFANIA ZOTTERI, RAFFAELA BISCEGLIA (Editorial Assistant).

HOW DO BANKS SET INTEREST RATES?
by Leonardo Gambacorta*
Abstract
The aim of this paper is to study cross-sectional differences in banks interest rates. It adds to the existing literature in two ways. First, it analyzes systematically the micro and macroeconomic factors that influence the price-setting behaviour of banks. Second, by using banks’ prices (rather than quantities) it provides an alternative way of disentangling loan supply from loan demand shift in the “bank lending channel” literature. The results, derived from a sample of Italian banks, suggest that heterogeneity in the banking rates pass-through exists only in the short run. Consistently with the literature, interest rates on short-term lending of liquid and well-capitalized banks react less to changes in money market rates. Also banks with a high proportion of long-term lending tend to modify their prices less. Heterogeneity in the pass-through on the interest rate on current accounts depends mainly on banks’ liability structure. Bank size is never relevant.
JEL classification: E44, E51, E52.
Keywords: monetary policy transmission, interest rates, bank lending channel.
Contents
1. Introduction.......................................................................................................................... 7 2. Some facts regarding bank interest rates in Italy................................................................. 9 3. What does influence banks’ interest rate setting?.............................................................. 11 4. Empirical specification and data........................................................................................ 15
4.1 Characteristics of the dataset ...................................................................................... 18 5. Results................................................................................................................................ 20 6. Robustness checks ............................................................................................................. 25 7. Conclusions........................................................................................................................ 26 Appendix– Technical details regarding the data .................................................................... 28 Tables and figures................................................................................................................... 31 References .............................................................................................................................. 41
* Bank of Italy, Economic Research Department.

1. Introduction1
This paper studies cross-sectional differences in the price-setting behaviour of Italian
banks in the last decade. The study was motivated by two major considerations. First,
heterogeneity in the response of bank interest rates to market rates helps to explain how
monetary policy decisions are transmitted through the economy independently of the
consequences for bank lending. The analysis of heterogeneous behaviour in banks’ interest
setting has been largely neglected by the existing literature. The majority of studies of the
“bank lending channel” analyze the response of credit aggregates to a monetary policy
impulse, but pay no attention to the effects on prices. This seems odd because, in practice,
when bank interest rates change, real effects on consumption and investment could be
produced even if there were no changes in total lending. The scant evidence on the effects of
monetary shocks on bank prices is mainly due to the lack of long series of micro data on
interest rates and contrasts with some recent works highlighting a different adjustment of
retail rates in the euro area (see, amongst others, de Bondt et al., 2003).
Second, this paper aims to add to the “bank lending channel” literature by identifying
loan supply shocks via banks’ prices (rather than quantities). To date the “identification
problem” has been solved by claiming that certain bank-specific characteristics (i.e. size,
liquidity, capitalization) influence only loan supply movements, while banks’ loan demand is
independent of them. After a monetary tightening, the drop in the supply of credit should be
larger for small banks, which are financed almost exclusively from deposits and equity
(Kashyap and Stein, 1995), less liquid banks, which cannot protect their loan portfolio
against monetary tightening simply by drawing down cash and securities (Stein, 1998;
Kashyap and Stein, 2000), and poorly capitalized banks, which have less access to markets
for uninsured funding (Peek and Rosengren, 1995; Kishan and Opiela, 2000; Van den
Heuvel, 2001a; 2001b).2 The intuition of an identification via prices of a loan supply shift is
very simple: if loan demand is not perfectly elastic, the effect of a monetary tightening on
1 This study was developed while the author was a visiting scholar at the NBER. I wish to thank two anonymous referees for very helpful comments. The opinions expressed in this paper are those of the author only and in no way involve the responsibility of the Bank of Italy and the NBER. Email: [email protected]. 2 All these studies on cross-sectional differences in the effectiveness of the “bank lending channel” refer to the US. The literature on European countries is far from conclusive (see Altunbas et al., 2002; Ehrmann et al., 2003). For Italy see Gambacorta (2004) and Gambacorta and Mistrulli (2004).

8
bank interest rates should be more pronounced for small, low-liquid and low-capitalized
banks.
Apart from these standard indicators other bank-specific characteristics could influence
banks’ price-setting behaviour (Weth, 2002). Berlin and Mester (1999) claim that banks
which depend heavily on non-insured funding (i.e. bonds) will adjust their deposit rates more
(and more quickly) than banks whose liabilities are less affected by market movements.
Berger and Udell (1992) maintain that banks with close ties with their customers will change
their lending rates comparatively less and slowly.
In this paper heterogeneity in banks’ behaviour is sought by using a balanced panel of
73 Italian banks that represent more than 70 per cent of the banking system. Heterogeneity is
investigated with respect to the interest rate on short-term lending and that on current
accounts. The use of microeconomic data is particularly appropriate in this context because
aggregation may significantly bias the estimation of dynamic economic relations (Harvey,
1981). Moreover, information at the level of individual banks provides a more precise
understanding of their behavioural patterns and should be less prone to structural changes,
such as the creation of EMU.
The paper reaches two main conclusions. First, heterogeneity in banking rates pass-
through exists, but it is detected only in the short run: no differences exist in the long-run
elasticities of banking rates to money market rates. Second, consistently with the literature,
interest rates on short-term lending by liquid and well-capitalized banks react less strongly to
changes in money market rates. Moreover, banks with a high proportion of long-term
lending tend to modify their prices less. Heterogeneity in the pass-through on the interest
rate on current accounts depends mainly the liability structure of the banks. Bank size is
never relevant.
The paper is organized as follows. Section 2 describes some institutional
characteristics that help to explain the behaviour of banking rates in Italy in the last two
decades. Section 3 reviews the main channels that influence banks’ interest rate settings by
trying to disentangle macro from microeconomic factors. After a description of the
econometric model and the data in Section 4, Section 5 shows the empirical results.
Robustness checks are presented in Section 6. The last section summarizes the main
conclusions.

9
2. Some facts regarding bank interest rates in Italy
Before discussing the main channels that influence banks’ price setting, it is important
to analyze the institutional characteristics that have influenced bank interest rates in Italy in
the last two decades. The purpose of this section is therefore to highlight some facts that
could help to explain the differences, if any, with respect to the results obtained by the
existing literature for the 1980s and mid-1990s.
For example, there is evidence that in the eighties Italian banks were comparatively
slow to adjust their rates (Verga, 1984; Banca d’Italia, 1986, 1988; Cottarelli and Kourelis,
1994), but important measures to liberalize the markets and introduce deregulation in the last
twenty years should have influenced the speed at which changes in money market conditions
are transmitted to lending and deposit rates (Cottarelli et al. 1995; Passacantando, 1996;
Ciocca, 2000; Angelini and Cetorelli, 2002).
In fact, between the mid-1980s and the early 1990s all the restrictions that
characterized the Italian banking system were gradually removed. In particular: 1) the ceiling
on lending was definitively abolished in 1985; 2) foreign exchange controls were lifted
between 1987 and 1990; 3) branching was liberalized in 1990; 4) the 1993 Consolidated Law
on Banking allowed banks and special credit institutions to perform all banking activities.
In particular, the 1993 Consolidated Law on Banking completed the institutional,
operational and maturity despecialization of the Italian banking system, ensuring consistent
supervisory controls and a uniform range of operations of intermediaries within a single
market framework. The restriction imposed by the 1936 Banking Law, which distinguished
between banks that could raise short-term funds (aziende di credito) and those that could not
(Istituti di credito speciale), was eliminated.3 To avoid criticism of structural breaks, the
econometric analysis is based on the period 1993:03-2001:03, when all the main reforms of
the Italian banking system had already taken place.
3 For more details see Banca d’Italia, Annual Report for 1993.

10
The behaviour of bank interest rates in Italy reveals some stylized facts (Figures 1 and
2). First, there has been a substantial fall in average rates since the end of 1992, and second
there has been a strong and persistent dispersion of rates among banks. These stylized facts
suggest that both the time series and the cross sections dimensions are important for
understanding the banks’ interest setting. This justifies the use of panel data techniques.
The main reason for the fall in bank interest rates was probably the successful
monetary policy enacted to reduce inflation in the country in order to fulfill the Maastricht
criteria and reach the third stage of EMU. As a result, the interbank rate decreased by more
than 10 percentage points in the period 1993-99. Excluding the episode of turbulence on the
foreign exchange markets in 1995, it moved upwards from the third quarter of 1999 to the
end of 2000, then continued its declining trend. From a statistical point of view, this
behaviour calls for the investigation of a possible structural break in the nineties.4
The second stylized fact is cross-sectional dispersion among interest rates. Figure 2
shows the coefficient of variation for loan and deposit rates both over time and across banks
in the period 1987-2001.5 The temporal variation (dotted line) of the two rates shows a
different behaviour from the mid-1990s when the deposit rate is more variable, probably for
a catching-up process of the rate toward a new equilibrium caused by the convergence
process. Moreover, the cross-sectional dispersion of the deposit rate is greater than that of
the loan rate, especially after the introduction of the euro.6
4 In the period 1995-98, which coincides with the convergence process towards stage three of EMU, it will be necessary to allow for a change in the statistical properties of interest rates (see the Appendix). 5 The coefficient of variation is given by the ratio of the standard errors to the mean. The series that refers to the variability “over time” shows the coefficient of variation in each year of monthly figures. By contrast, the series that capture the variability “across banks” shows the coefficient of variation of annual averages of bank-specific interest rates. 6 In the period before the 1993 Consolidated Law on Banking deposit interest rates were quite sticky to monetary policy changes. Deposit interest rate rigidity in this period has been extensively analyzed for the US as well. Among the market factors that have been found to affect the responsiveness of bank deposit rates are the direction of the change in market rates (Ausubel, 1992; Hannan and Berger, 1991), whether the bank interest rate is above or below a target rate (Hutchison, 1995; Moore, Porter and Small, 1990; Neumark and Sharpe, 1992), and market concentration in the bank’s deposit market (Hannan and Berger, 1991). Rosen (2001) develops a model of price settings in the presence of heterogeneous customers to explain why bank deposit interest rates respond sluggishly to some extended movements in money market rates but not to others. Hutchinson (1995) presents a model of bank deposit rates that includes a demand function for customers and predicts a linear (but less than one-for-one) relationship between market interest rate changes and bank interest rate changes. Green (1998) claims that the rigidity is due to the fact that bank interest rate management is based on a two-tier pricing system; banks offer accounts at market related interest rates and at posted rates that are changed at discrete intervals.

11
3. What does influence banks’ interest rate setting?
The literature that studies banks’ interest rate setting behaviour generally assumes that
banks operate under oligopolistic market conditions.7 This means that a bank does not act as
a price-taker but sets its loan rates taking into account the demand for loans and deposits.
This section reviews the main channels that influence banks’ interest rates (Figure 3).
Loan and deposit demand
The interest rate on loans depends positively on real GDP and inflation (y and p).
Better economic conditions increase the number of projects becoming profitable in terms of
expected net present value and hence increase the demand for credit (Kashyap, Stein and
Wilcox, 1993). As stressed by Melitz and Pardue (1973) only boosts in permanent income
(yP) have a positive influence on loan demand, while the effect due to the transitory part (yT)
could also be associated with a self-financing effect that reduces the proportion of bank debt
(Friedman and Kuttner, 1993).8 An increase in the money market rate (iM) raises the
opportunity cost of other forms of financing (i.e. bonds), making lending more attractive.
This mechanism also boosts loan demand and increases the interest rate on loans.
The interest rate on deposits is negatively influenced by real GDP and inflation. A
higher level of income increases the demand for deposits9 and therefore reduces the
incentive for banks to set higher deposit rates. In this case the shift of deposit demand will be
higher if the transitory component of GDP is affected (unexpected income is generally first
deposited in current accounts). On the contrary, an increase in the money market rate, ceteris
paribus, makes it more attractive to invest in risk-free securities that represent an alternative
to detaining deposits; the subsequent reduction in deposit demand determines an upward
pressure on the interest rate on deposits.
7 For a survey on modeling the banking firm, see Santomero (1984). Among more recent works, see Green (1998) and Lim (2000). 8 Taking this into account, in Section 4 I tried to disentangle the two effects using a Beveridge and Nelson (1981) decomposition. More details are provided in the Appendix. 9 The aim of this paper is not to answer the question whether deposits are input or output for the bank (see Freixas and Rochet, 1997, on this debate). For simplicity, here deposits are considered a service supplied by the bank to depositors and are therefore regarded as an output (Hancock, 1991).

12
Operating cost, credit risk and interest rate volatility
The costs of intermediation (screening, monitoring, branching costs, etc.) have a
positive effect on the interest rate on loans and a negative effect on that on deposits
(efficiency is represented by e). The interest rate on lending also depends on the riskiness of
the credit portfolio; banks that invest in riskier projects will have a higher rate of return in
order to compensate the higher percentage of bad loans that have to be written off (j).
Bank interest rates are also influenced by interest rate volatility. High volatility of the
money market rate (σ) should increase lending and deposit rates. Following the dealership
model by Ho and Saunders (1981) and its extension by Angbazo (1997), the interest rate on
loans should be more affected by interbank interest rate than that on deposits
(diL/dσ > diD/dσ). This should indicate a positive correlation between interest rate volatility
and the spread.
Interest rate channel
Bank interest rates are also directly influenced by monetary policy changes. A
monetary tightening (easing) determines a reduction (increase) in reservable deposits and an
increase (reduction) in market interest rates. This has a positive effect on bank interest rates
through the traditional “interest rate channel”. Nevertheless, the increase in the cost of
financing could have a different impact on banks depending on their specific characteristics.
There are two channels through which heterogeneity among banks may produce a different
impact on lending and deposit rates: the “bank lending channel” and the “bank capital
channel”. Both mechanisms are based on adverse selection problems that affect banks fund-
raising, but from different perspectives.
Bank lending channel
According to the “bank lending channel” thesis, a monetary tightening has an effect on
bank loans because the drop in reservable deposits cannot be completely offset by issuing
other forms of funding (i.e. uninsured CDs or bonds; for an opposite view see Romer and
Romer, 1990) or liquidating some assets. Kashyap and Stein (1995, 2000), Stein (1998) and
Kishan and Opiela (2000) claim that the market for bank debt is imperfect. Since non-
reservable liabilities are not insured and there is an asymmetric information problem about

13
the value of banks’ assets, a “lemon’s premium” is paid to investors. According to these
authors, small, low-liquid and low-capitalized banks pay a higher premium because the
market perceives them to be more risky. Since these banks are more exposed to asymmetric
information problems they have less capacity to shield their credit relationships in the case of
a monetary tightening, and they should cut their supplied loans and raise their interest rates
by a larger amount. Moreover, these banks have less capacity to issue bonds and CDs and
therefore they could try to contain the drain of deposits by raising their rates more. In Figure
3 three effects are highlighted: the “average” effect due to the increase in the money market
rate (which is difficult to disentangle from the “interest rate channel”), the “direct”
heterogeneous effect due to bank-specific characteristics (Xt-1) and the “interaction effect”
between monetary policy and the bank-specific characteristic (iM Xt-1). These last two effects
can be genuinely attributed to the “bank lending channel” because bank-specific
characteristics influence only loan supply movements. Two aspects should be stressed. First,
to avoid endogeneity problems bank-specific characteristics should refer to the period before
banks set their interest rates. Second, heterogeneous effects, if any, should be detected only
in the short run, while there is no a priori reason why these effects should influence the long-
run relationship between interest rates.
Apart from the standard indicators of size (logarithm of total assets), liquidity (cash
and securities over total assets) and capitalization (excess capital over total assets),10 two
other bank-specific characteristics are worth investigating: a) the ratio between deposits and
bonds plus deposits; b) the ratio between long-term loans and total loans.
The first indicator is in line with Berlin and Mester (1999): banks that depend heavily
on non-deposit funding (i.e. bonds) will adjust their deposit rates by more (and more
quickly) than banks whose liabilities are less affected by market movements. The intuition of
this result is that, other things being equal, it is more likely that a bank will adjust its terms
10 It is important to note that the effect of bank capital on the “bank lending channel” cannot be easily captured by the capital-to-asset ratio. This measure, generally used by the existing literature to analyze the distributional effects of bank capitalization on lending, does not take into account the riskiness of a bank portfolio. A relevant measure is instead the excess capital that is the amount of capital banks hold in excess of the minimum required to meet prudential regulation standards. Since minimum capital requirements are determined by the quality of bank’s balance-sheet activities, the excess capital represents a risk-adjusted measure of bank capitalization that gives more indications regarding the probability of a bank default. Moreover, the excess capital is a relevant measure of the availability of the bank to expand credit because it directly controls for prudential regulation constraints. For more details see Gambacorta and Mistrulli (2004).

14
for passive deposits if the conditions of its own alternative form of refinancing change.
Therefore an important indicator in analyzing the pass-through between market and banking
rates is the ratio between deposits and bonds plus deposits. Banks which use relatively more
bonds than deposits for financing purposes fall under greater pressure because their costs
increase contemporaneously and to similar extent to market rates.
The Berger and Udell (1992) indicator represents a proxy for long-term business; those
credit institutions that maintain close ties with their non-bank customers will adjust their
lending rates comparatively less and slowly. Banks may offer implicit interest rate insurance
to risk-averse borrowers in the form of below-market rates during periods of high market
rates, for which the banks are later compensated when market rates are low. Having this in
mind, banks that have a higher proportion of long-term loans should be more inclined to split
the risk of monetary policy change with their customers and preserve credit relationships.
For example, Weth (2002) finds that in Germany those banks with large volumes of long-
term business with households and firms change their prices less frequently than the others.
Bank capital channel
The “bank capital channel” is based on three hypotheses. First, there is an imperfect
market for bank equity: banks cannot easily issue new equity owing to the presence of
agency costs and tax disadvantages (Myers and Majluf, 1984; Cornett and Tehranian, 1994;
Calomiris and Hubbard, 1995; Stein, 1998). Second, banks are subject to interest rate risk
because their assets typically have a longer maturity than liabilities (maturity
transformation). Third, regulatory capital requirements limit the supply of credit (Thakor,
1996; Bolton and Freixas, 2001; Van den Heuvel, 2001a; 2001b).
The mechanism is the following. After an increase in market interest rates, a smaller
fraction of loans can be renegotiated with respect to deposits (loans are mainly long-term,
while deposits are typically short-term): banks therefore incur a cost due to the maturity
mismatch that reduces profits and then capital accumulation.11 If equity is sufficiently low
and it is too costly to issue new shares, banks reduce lending (otherwise they fail to meet
11 In Figure 3, the cost per unit of asset due to maturity transformation at time t-1 ( 1itρ − ) is multiplied by the actual change in the money market rate (∆iMt). For more details see the Appendix.

15
regulatory capital requirements) and widen their interest rate spread. This leads to an
increase in the interest rates on loans and a decrease in those on deposits:12 in the
oligopolistic version of the Monti-Klein model, the maturity transformation cost has the
same effect as an increase in operating costs.
Industry structure
The literature underlines two possible impacts of concentration on the pricing
behaviour of banks (Berger and Hannan, 1989). A first class of model claims that more
concentrated banking industry will behave oligopolistically (structure-performance
hypothesis), while another class of model stresses that concentration is due to more efficient
banks taking over less efficient counterparts (efficient-structure hypothesis). This means that
in the first case lower competition should result in higher spreads, while in the second case a
decrease in managerial costs due to increased efficiency should have a negative impact on
the spread. In the empirical part great care will be paid therefore to the treatment of bank
mergers (see the Appendix). Nevertheless, the scope of this paper is not to extract policy
implications for this issue, for which a different analysis is needed. The introduction of bank-
specific dummy variables (µi) tries to control for this and other missing aspects.13
4. Empirical specification and data
The empirical specification used in this paper adapts the standard approach for the
estimation of bank rates to the case of heterogeneous banks. Following Cottarelli et al.
(1995), Lim (2000) and Weth (2002) we start from two simple error correction models that
establish a long-run relationship between each bank rate and the money market rate.
Economic theory on oligopolistic (and perfect) competition suggests that, in the long run,
both bank rates (on lending and deposits) should be related to the level of the monetary rate
12 The “bank capital channel” can also be at work even if the capital requirement is not currently binding. Van den Heuvel (2001a) shows that low-capitalized banks may optimally forgo lending opportunities now in order to lower the risk of capital inadequacy in the future. This is interesting because in reality most banks are not constrained at any given time. 13 In Section 6 this hypothesis will be tested introducing a specific measure of the degree of competition that each banks faces. For a more detailed explanation of the effect of concentration on the pricing behaviour of Italian banks see Focarelli and Panetta (2003).
16
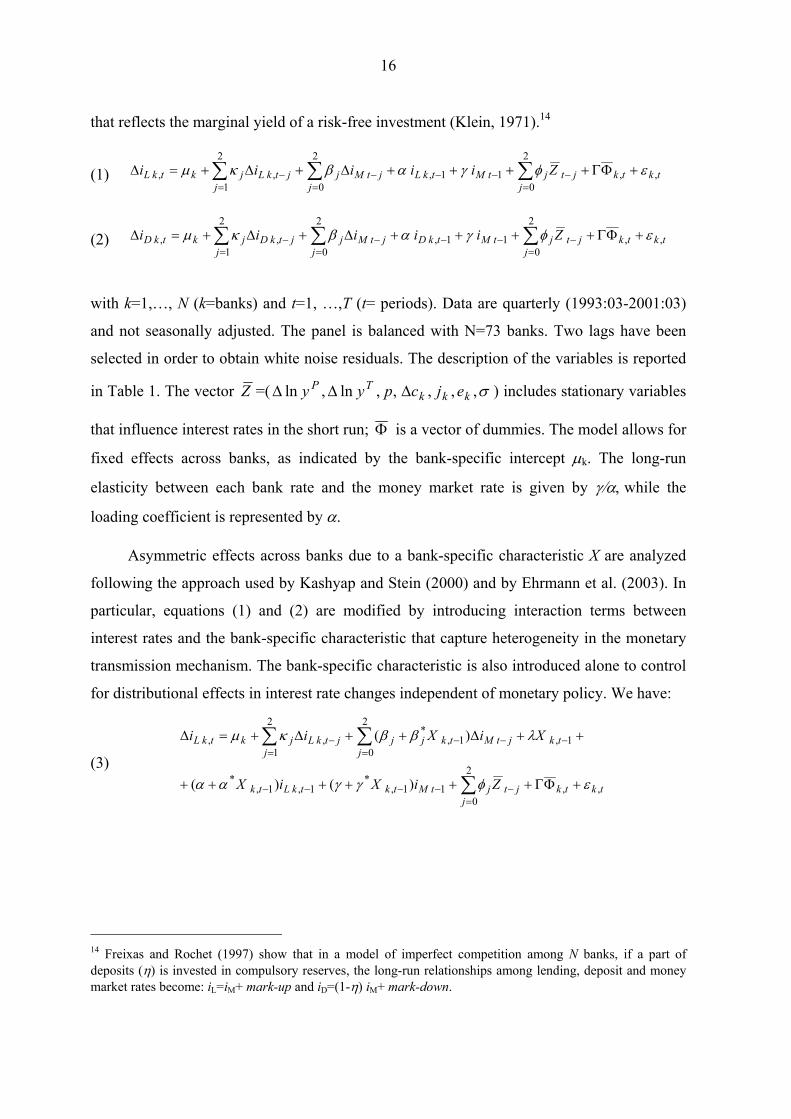
that reflects the marginal yield of a risk-free investment (Klein, 1971).14
(1) tktkjtj
jtMtkLjtMj
jj
jtkLjktkL Ziiiii ,,
2
01 1,
2
0
2
1, , εφγαβκµ +ΦΓ++++∆+∆+=∆ −
=−−−
==− ∑∑∑
(2) tktkjtj
jtMtkDjtMj
jj
jtkDjktkD Ziiiii ,,
2
01 1,
2
0
2
1, , εφγαβκµ +ΦΓ++++∆+∆+=∆ −
=−−−
==− ∑∑∑
with k=1,…, N (k=banks) and t=1, …,T (t= periods). Data are quarterly (1993:03-2001:03)
and not seasonally adjusted. The panel is balanced with N=73 banks. Two lags have been
selected in order to obtain white noise residuals. The description of the variables is reported
in Table 1. The vector Z =( ,,ln,ln pyy TP ∆∆ σ,,, kkk ejc∆ ) includes stationary variables
that influence interest rates in the short run; Φ is a vector of dummies. The model allows for
fixed effects across banks, as indicated by the bank-specific intercept µk. The long-run
elasticity between each bank rate and the money market rate is given by γ/α, while the
loading coefficient is represented by α.
Asymmetric effects across banks due to a bank-specific characteristic X are analyzed
following the approach used by Kashyap and Stein (2000) and by Ehrmann et al. (2003). In
particular, equations (1) and (2) are modified by introducing interaction terms between
interest rates and the bank-specific characteristic that capture heterogeneity in the monetary
transmission mechanism. The bank-specific characteristic is also introduced alone to control
for distributional effects in interest rate changes independent of monetary policy. We have:
(3) tktkjt
jjtMtktkLtk
tkjtMj
tkjjj
jtkLjktkL
ZiXiX
XiXii
,,
2
01 1,
*1, 1,
*
1,
2
01,
*2
1, ,
)()(
)(
εφγγαα
λββκµ
+ΦΓ++++++
++∆++∆+=∆
−=
−−−−
−−=
−=
−
∑
∑∑
14 Freixas and Rochet (1997) show that in a model of imperfect competition among N banks, if a part of deposits (η) is invested in compulsory reserves, the long-run relationships among lending, deposit and money market rates become: iL=iM+ mark-up and iD=(1-η) iM+ mark-down.

17
(4)
tktkjtj
jtMtktkDtk
tkjtMj
tkjjj
jtkDjktkD
ZiXiX
XiXii
,,
2
01 1,
*1, 1,
*
1,
2
01,
*2
1, ,
)()(
)(
εφγγαα
λββκµ
+ΦΓ++++++
++∆++∆+=∆
−=
−−−−
−−=
−=
−
∑
∑∑
where the bank-specific characteristic X refers to t-1 to avoid an endogeneity bias.15
The long-run elasticity between each bank rate and the money market rate is given by:
)/()( 1,*
1,*
−− ++ tktk XX ααγγ . Therefore to test if the pass-through between the money
market rate and the bank rate is complete it is necessary to verify that this elasticity is equal
to one. If this is the case there is a one-to-one long-run relationship between the lending
(deposit) rate and the money market rate, while the individual effect µk influences the bank-
specific mark-up (mark-down). The loading coefficient )( 1,*
−+ tkXαα must be significantly
negative if the assumption of an equilibrium relationship is correct. In fact, it represents what
percentage of an exogenous variation from the steady state between the rates is brought back
towards equilibrium in the next period.16
The degree of bank interest rate stickiness in the short run can be analyzed by the
impact multiplier and the total effect after three months.
The variable Xk,t-1 represents a bank-specific characteristic that economic theory
suggests influences only loan and deposit supply movements, without affecting loan and
deposit demand. In particular, all bank-specific indicators ( ,k tχ ) have been re-parameterized
in the following way:
15 Given the complexity of the model, we have followed a “general to specific” strategy in order to drop some statistically insignificant variables in the Z vector. Nevertheless, this approach has not be interpreted as a mechanical reduction process that implies dropping all insignificant parameters (Pagan, 1990): the restrictions have been tested comparing the initial model with the reduced one. In the final models, only contemporaneous exogenous variables are included with the exception, as expected, of the risk measure for loans kj in the
equation for interest rate deposits. Moreover, the coefficients 2β and *2
β were never significant. The estimated equations are reported on top of Tables 3-5. 16 Testing for heterogeneity in the loading coefficient means verifying if *α is significant or not. At the same time heterogeneity in the long-run elasticity can be proved if * *α γ αγ− is statistically different from zero.
18
,1
, ,1
/
N
k tTk
k t k tt
X TN
χχ =
=
= −
∑∑
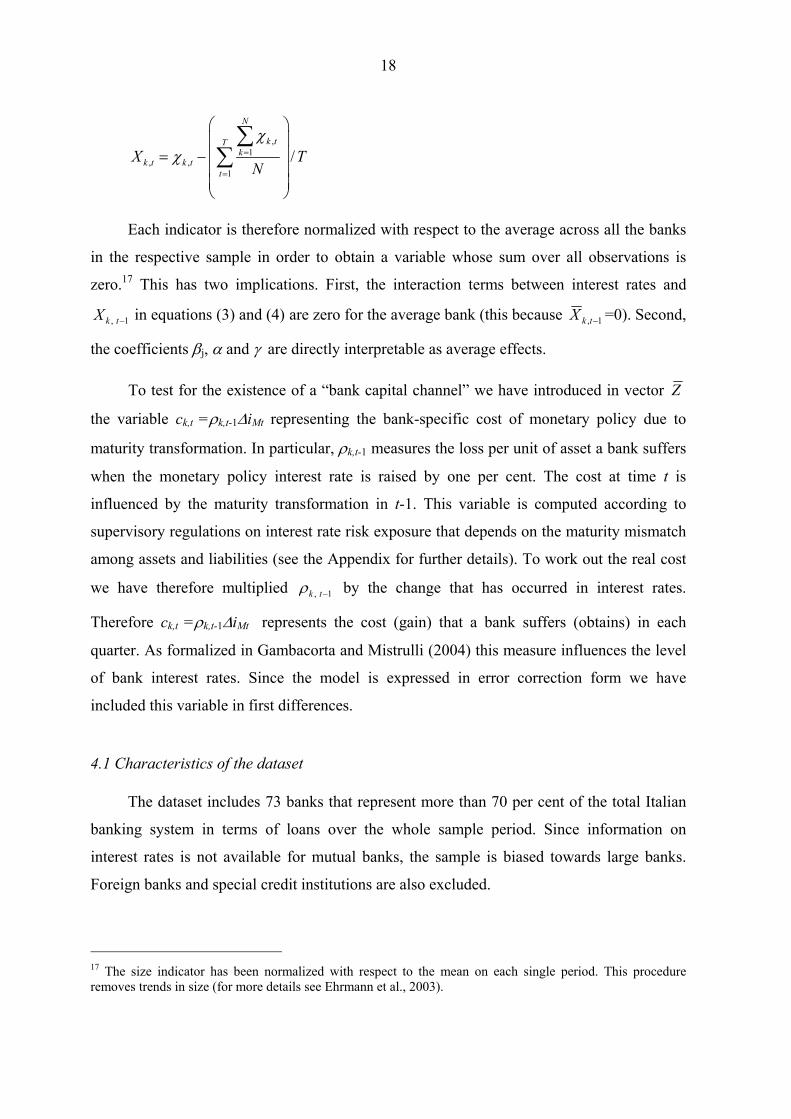
Each indicator is therefore normalized with respect to the average across all the banks
in the respective sample in order to obtain a variable whose sum over all observations is
zero.17 This has two implications. First, the interaction terms between interest rates and
, 1k tX − in equations (3) and (4) are zero for the average bank (this because 1, −tkX =0). Second,
the coefficients βj, α and γ are directly interpretable as average effects.
To test for the existence of a “bank capital channel” we have introduced in vector Z
the variable ck,t =ρk,t-1∆iMt representing the bank-specific cost of monetary policy due to
maturity transformation. In particular, ρk,t-1 measures the loss per unit of asset a bank suffers
when the monetary policy interest rate is raised by one per cent. The cost at time t is
influenced by the maturity transformation in t-1. This variable is computed according to
supervisory regulations on interest rate risk exposure that depends on the maturity mismatch
among assets and liabilities (see the Appendix for further details). To work out the real cost
we have therefore multiplied , 1k tρ − by the change that has occurred in interest rates.
Therefore ck,t =ρk,t-1∆iMt represents the cost (gain) that a bank suffers (obtains) in each
quarter. As formalized in Gambacorta and Mistrulli (2004) this measure influences the level
of bank interest rates. Since the model is expressed in error correction form we have
included this variable in first differences.
4.1 Characteristics of the dataset
The dataset includes 73 banks that represent more than 70 per cent of the total Italian
banking system in terms of loans over the whole sample period. Since information on
interest rates is not available for mutual banks, the sample is biased towards large banks.
Foreign banks and special credit institutions are also excluded.
17 The size indicator has been normalized with respect to the mean on each single period. This procedure removes trends in size (for more details see Ehrmann et al., 2003).

19
This bias toward large banks has two consequences. First, the distributional effects of
the size variable must be treated with extreme caution because a “small” bank inside this
sample should not be considered to have the same characteristics as where the full
population of Italian banks is used.18 The size grouping in this study mainly controls for
variations in scale, technology and scope efficiencies across banks but it is not able to shed
light on differences between mutual and other banks. Second, results for the average bank
will provide more “macroeconomic insights” than studies based on the whole population
(where the average bank size is very small).
Table 2 gives some basic information on the dataset. Rows are organized dividing the
sample with respect to the bank-specific characteristics that are potential causes of
heterogeneous shifts in loan supply in the event of changes in monetary policy. In the
columns, the table reports summary statistics for the two interest rates and for each indicator.
Several clear patterns emerge. Considering size, small banks charge higher interest
rates on lending but show a lower time variation. This fits the standard idea of a close
customer relationship between small firms and small banks that provides them with an
incentive to smooth the effect of a monetary tightening (Angelini, Di Salvo and Ferri, 1998).
Moreover, small banks are more liquid and capitalized than average, and this should help
them to reduce the effect of cyclical variations on supplied credit. On the liability side, the
percentage of deposits (overnight deposits, CDs and savings accounts) is greater among
small banks, while their bond issues are more limited than those of large banks.
Nevertheless, no significant differences emerge in the level and volatility of the interest rate
on current accounts.
High-liquid banks are smaller than average and are more capitalized. These
characteristics should reduce the speed of the “bank lending channel” transmission through
interest rates. In particular, since deposits represent a large share of their funding they should
have a smoother transmission on passive rates.
18 In particular, banks that are considered “small” in this study are labeled “medium” in other studies of the Italian banking system that analyze quantities (see Gambacorta, 2004; Gambacorta and Mistrulli, 2004). This is clear if one considers that the average assets of a “small” bank in my data (1.6 billion euros) over the sample period are very similar to those of a “medium” bank in the whole system (1.7 billion euros).

20
Well-capitalized banks make relatively more short-term loans. In general they are not
listed and issue less subordinated debt to meet capital requirements. This evidence is
consistent with the view that, ceteris paribus, capitalization is higher for those banks that
bear more adjustment costs from issuing new (regulatory) capital. Well-capitalized banks
charge a higher interest rate on lending; this probably depends on their higher ratios of bad
loans, which increase their credit risk. In other words, their higher capitalization is necessary
to cope with a riskier portfolio. Moreover, the interest rate on deposits is lower for low-
capitalized banks, indicating that agents do not perceive these deposits as riskier than those
at other banks. This has two main explanations. First, the impact of bank failures has been
very small in Italy, especially with respect to deposits.19 Second, the presence of deposit
insurance insulates the deposits of less-capitalized banks from the risk of default.
The Berlin-Mester and the Berger-Udell indicators seem to have a high ability to
explain heterogeneity in banks’ price setting behaviour. Differences in the standard
deviations of the two groups are particularly sensitive, calling for lower interest rate
variability of banks with a high percentage of deposits and long-term loans.
5. Results
The main channels that influence the interest rate on short-term lending and that on
current accounts are summarized, respectively, in Tables 3 and 4. The first part of each table
shows the influence of the permanent and transitory components of real GDP and inflation.
These macro variables capture cyclical movements and serve to isolate shifts in loan and
deposit demand from monetary policy changes. The second part of the tables presents the
effects of bank efficiency, credit risk and interest rate volatility. The third part highlights the
effects of monetary policy. These are divided into four components: i) the immediate pass-
through; ii) the one-quarter pass-through; iii) the long-run elasticity between each bank rate
and the monetary policy indicator; iv) the loading coefficient of the cointegrating
19 During our sample period, the share of deposits of failed banks to total deposits approached 1 per cent only twice, namely in 1987 and 1996 (Boccuzzi, 1998).

21
relationship.20 The last part of the tables shows the significance of the “bank capital
channel”. Each table is divided into five columns that highlight, one at a time, the
heterogeneous behaviour of banks with different characteristics in response to a monetary
shock. The existence of distributional effects is tested for all four components of the
monetary policy pass-through. The models have been estimated using the GMM estimator
suggested by Arellano and Bond (1991), which ensures efficiency and consistency provided
the models are not subject to serial correlation of order two and the instruments used are
valid (which is tested for with the Sargan test).21
Loan and deposit demand
As predicted by theory, only changes in permanent income have a positive and
significant effect on the interest rate on short-term lending, while the transitory component is
never significant. In fact, as discussed in Section 3, the effect of transitory changes may also
be due to a self-financing effect that reduces the proportion of bank debt. On the contrary,
the interest rate on deposits is negatively influenced by real GDP. In this case the effect is
higher when a change in the transitory component occurs because it is directly channeled
through current accounts. The effect of inflation is positive on both interest rates but is
significantly higher for short-term lending.
20 The immediate pass-through is given by the expression *
0 0 , 1k tXβ β −+ and heterogeneity among banks is
simply tested through the significance of *0β . The effect for a bank with a low value of the characteristic under
evaluation is worked out through the expression * 0.250 0 , 1k tXβ β −+ , where 0.25
, 1k tX − is the average for the banks below the first quartile. Vice versa the effect for a bank with a high value of the characteristic is calculated using
0.75, 1k tX − . The total effect after three months for the average bank is given by 0 1 1 1(1 ) 'β α κ β γ+ + + + , while
heterogeneity among banks can be accepted if and only if the expression * * * * * * 2
0 0 1 1 , 1 0 , 1(1 ) k t k tX Xβ α β α κ β γ α β− − + + + + + + is equal to zero. The long-run elasticity is given by:
)/()( **kk XX ααγγ ++ , while the loading coefficient is *
1 1 , 1k tXα α −+ . Standard errors have been approximated with the “delta method” (Rao, 1973). 21 In the GMM estimation, instruments are the second lag of the dependent variable and of the bank-specific characteristics included in each equation. Inflation, GDP growth rate and the monetary policy indicator are considered exogenous variables.

22
Operating costs, credit risk and interest rate volatility
Bank efficiency reduces the interest rate on loans and increases that of deposits.
Nevertheless, the effect is not always significant at conventional levels, especially in the
equation for the interest rate on current accounts. These results call for further robustness
checks using a cost-to-asset ratio (see Section 6).
The relative amount of bad loans has a positive and significant effect on the interest
rate on loans. This is in line with the standard result that banks that invest in riskier projects
ask for a higher rate of return to compensate the credit risk.
Both bank rates are positively correlated with money market rate volatility. The
correlation is higher for the interest rate on loans than for that on deposits. This is consistent
with the prediction of the dealership model by Ho and Saunders (1981) and its extension by
Angbazo (1997), where an increase in interbank interest rate volatility is associated with a
higher spread.
Bank capital channel
As expected the “bank capital channel” (based on the maturity mismatch between bank
assets and liabilities; see Section 3) has a positive effect on the interest rate on short-term
lending and a negative effect on the interest rate on current accounts. The absolute values of
the coefficients are greater in the first case, calling for a stronger adjustment on credit
contracts than on deposits. Since this channel can be interpreted similarly to a general
increase in the costs for banks, it is worth comparing this result with that obtained for the
efficiency indicator. In both cases the effect is strongest for the interest rate on short-term
lending, and this is consistent with the view that the interest rate on deposits is more
sluggish.
Interest rate channel
A monetary tightening positively influences bank interest rates. After a one per cent
increase in the monetary policy indicator, interest rates on short-term lending is immediately
raised by around 0.5 per cent, and by around 0.9 per cent after a quarter. Moreover, the pass-
through is complete in the long run (the null hypothesis of a unitary elasticity is accepted in
all models). The reaction of the short-term lending rate is greater than in previous studies of
23
the Italian case and this calls for an increase in competition after the introduction of the 1993
Consolidated Law on Banking. Cottarelli et al. (1995), analyzing the period 1986:02-
1993:04, find that the immediate pass-through is around 0.2 per cent, while the effect after
three months is 0.6 per cent. Their long-run elasticity is equal to 0.9 per cent, but also in their
model the null hypothesis of a complete pass-through in the long run is accepted.22
The long-run elasticity of the interest rate on current accounts is around 0.7 per cent.
This result is in line with the recent findings by de Bondt et al. (2003) under a similar sample
period and only a little higher than the long-run elasticity in Angeloni et al. (1995) for the
period 1987:1-1993:04.23
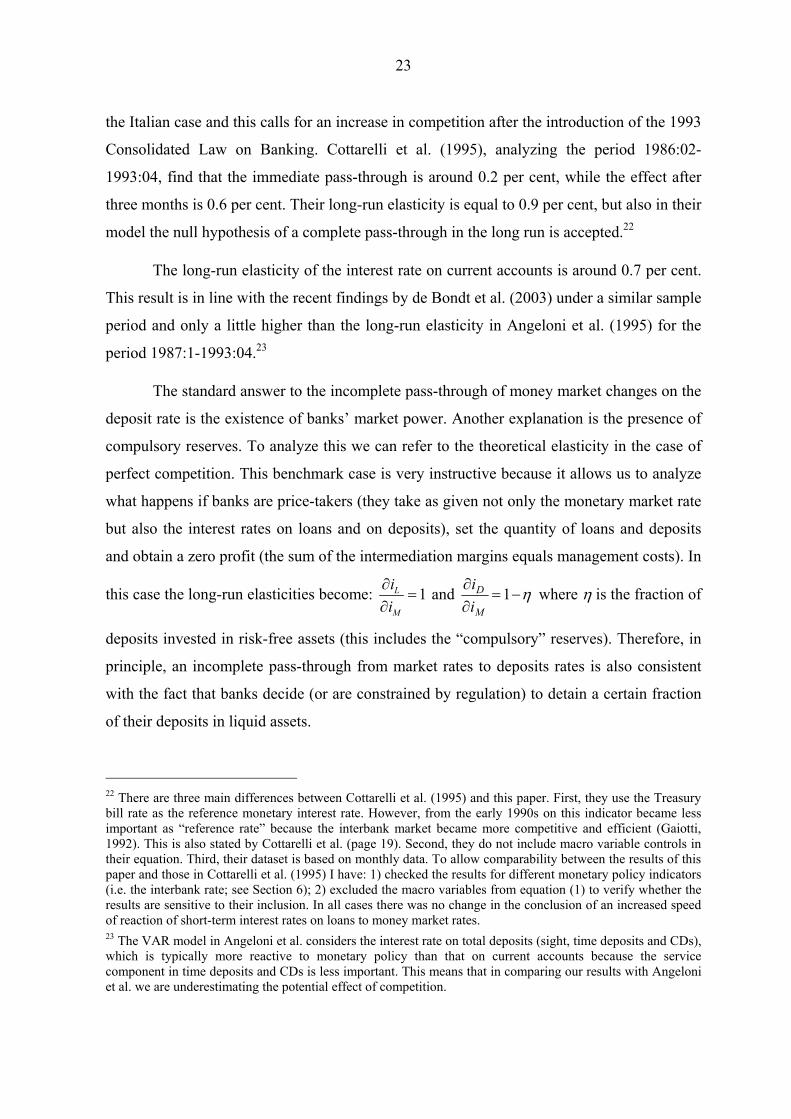
The standard answer to the incomplete pass-through of money market changes on the
deposit rate is the existence of banks’ market power. Another explanation is the presence of
compulsory reserves. To analyze this we can refer to the theoretical elasticity in the case of
perfect competition. This benchmark case is very instructive because it allows us to analyze
what happens if banks are price-takers (they take as given not only the monetary market rate
but also the interest rates on loans and on deposits), set the quantity of loans and deposits
and obtain a zero profit (the sum of the intermediation margins equals management costs). In
this case the long-run elasticities become: 1L
M
ii
∂=
∂ and η−=
∂∂ 1
M
D
ii where η is the fraction of
deposits invested in risk-free assets (this includes the “compulsory” reserves). Therefore, in
principle, an incomplete pass-through from market rates to deposits rates is also consistent
with the fact that banks decide (or are constrained by regulation) to detain a certain fraction
of their deposits in liquid assets.
22 There are three main differences between Cottarelli et al. (1995) and this paper. First, they use the Treasury bill rate as the reference monetary interest rate. However, from the early 1990s on this indicator became less important as “reference rate” because the interbank market became more competitive and efficient (Gaiotti, 1992). This is also stated by Cottarelli et al. (page 19). Second, they do not include macro variable controls in their equation. Third, their dataset is based on monthly data. To allow comparability between the results of this paper and those in Cottarelli et al. (1995) I have: 1) checked the results for different monetary policy indicators (i.e. the interbank rate; see Section 6); 2) excluded the macro variables from equation (1) to verify whether the results are sensitive to their inclusion. In all cases there was no change in the conclusion of an increased speed of reaction of short-term interest rates on loans to money market rates. 23 The VAR model in Angeloni et al. considers the interest rate on total deposits (sight, time deposits and CDs), which is typically more reactive to monetary policy than that on current accounts because the service component in time deposits and CDs is less important. This means that in comparing our results with Angeloni et al. we are underestimating the potential effect of competition.

24
The loading coefficients are significantly negative at around –0.4 in the loan equation
and –0.6 in the current account equation. This means that if an exogenous shock occurs,
respectively 40 and 60 per cent of the deviation is cancelled out within the first quarter in
each bank rate.
Bank lending channel
In the case of a monetary shock, banks with different characteristics behave differently
only in the short run. On the contrary no heterogeneity emerges in the long-run relationship
between each bank rate and the monetary policy indicator.
Considering each bank’s specific characteristics one at a time (Tables 3 and 4), the
interest rates of small, liquid and well-capitalized banks react less to changes in the money
market rate. Also the Berlin-Mester and the Berger-Udell indicators have a strong ability to
explain heterogeneity in banks’ price-setting behaviour.
Nevertheless, the robustness of these distributional effects has to be checked in a
model that takes all five indicators into account. In this model, in order to save degrees of
freedom, the long-run elasticity between the money market rate and the short-term lending
rate has been fixed at one; that between the money market rate and the interest rate on
current account at 0.7.
Results are reported in Table 5 while Figure 4 highlights asymmetric effects. Interest
rates on short-term lending by liquid and well-capitalized banks react less to a monetary
policy shock. Also banks with a high proportion of long-term lending tend to change their
prices less. Size is not significant.
This evidence matches previous results on lending. Liquid banks can protect their loan
portfolio against a monetary tightening simply by drawing down cash and securities
(Gambacorta, 2004). Well-capitalized banks that are perceived as less risky by the market
are better able to raise uninsured funds in order to compensate the drop in deposits
(Gambacorta and Mistrulli, 2004). Therefore the effects on lending detected for liquid and
well-capitalized banks are mirrored by their higher capacity to insulate clients from the
effects on interest rates as well. It is interesting to note that, in contrast with the evidence for
the US (Kashyap and Stein; 1995), the interaction terms between size and monetary policy
are insignificant. The fact that the interest rate on the short-term lending of smaller banks is

25
not more sensitive to monetary policy than that of larger banks is well documented in the
literature for Italy and reflects the close customer relationship between small banks and
small firms (Angeloni et al., 1995; Conigliani et al., 1997; Angelini, Di Salvo and Ferri,
1998; Ferri and Pittaluga, 1996). This result is also consistent with Ehrmann et al. (2003),
where size does not emerge as a useful indicator for the distributional effect of monetary
policy on lending, not only in Italy but also in France, Germany and Spain.
As regards the interest rate on current accounts, the Berlin-Mester indicator (hereafter
BM) is the only bank-specific characteristic that explains heterogeneity in banks’ price-
setting behaviour. In particular, banks that depend heavily on non-deposit funding (banks
with a low BM indicator) will adjust their interest rate on current accounts by more (and
more quickly) than banks whose liabilities are less affected by market movements. As
explained in Section 3, the intuition of this result is that, other things being equal, it is more
likely that a bank will adjust its terms on deposits if the other conditions of refinancing
change. The liability structure seems to influence not only the short-run adjustment but also
the loading coefficient. This implies that banks with a high BM ratio react less when there is
a deviation in the long-run mark-down: banks with a higher percentage of deposits have
more room for adjusting their prices towards the optimal equilibrium. As expected, no cross-
sectional differences emerge among banks due to size, liquidity and capitalization because
current accounts are typically insured. This is consistent with the findings for current
accounts in Gambacorta (2004).
6. Robustness checks
The robustness of the results has been checked in several ways. The first test was to
introduce as additional control variable a bank-specific measure of the degree of competition
that each bank faces in the market. In particular, the average value of the Herfindahl index in
the different “local markets” (corresponding to the administrative provinces of Italy) in
which the bank operates was introduced in each equation. The reason for this test is that the
fixed effect (that also captures industry structure) remains stable over the whole period,
while the degree of competition could change over time due to the effect of concentration.
Therefore this test allows us also to check whether the bank mergers are treated properly.
The Herfindahl index did not appear to be statistically significant and the results of the study
did not change.

26
The second test was to use as bank efficiency indicator the cost-to-total-asset ratio
instead of the ratio of total loans and deposits to the number of branches. In all cases the
results remained unchanged.
The third test was to consider whether different fiscal treatments over the sample
period could have changed deposit demand (from June 1996 the interest rate on current
accounts is subject to 27 per cent tax, deducted at source; 12.5 per cent before). However,
when the net interest rate on current accounts was used in place of gross rate, nothing
changed.
The fourth robustness check was the introduction of a dummy variable to take account
of the spike in the change of the repo interest rate caused by the turbulence in the foreign
exchange market in the first quarter of 1995. The results are the same in this case too.
The fifth test was to introduce additional interaction terms combining the bank-specific
characteristic with inflation, and permanent and transitory changes in real income. The
reason for this test is the possible presence of endogeneity between bank characteristics and
cyclical factors. Performing the test, however, nothing changed, and the double interactions
were almost always not significant (they turned out to be statistically not different from zero
in the case of the interaction of capitalization and permanent income).
The final robustness check was to introduce a dummy variable that indicates whether
the bank belongs to a group (1) or not (0). Banks belonging to a group may be less
influenced by monetary changes if they can benefit from internal liquidity management; in
other words, bank holding companies establish internal capital markets in an attempt to
allocate capital among their various subsidiaries (Houston and James, 1998; Upper and
Worms, 2004). The introduction of this dummy did not change the results of the study.
7. Conclusions
This paper investigates the factors that influence the price-setting behaviour of Italian
banks. It adds to the existing literature in two ways. First, it analyzes systematically a wide
range of micro and macroeconomic variables that have an effect on bank interest rates:
permanent and transitory changes in income, interest and credit risk, interest rate volatility,
bank efficiency. Second, the analysis of bank prices (rather than quantities) provides an

27
alternative way of disentangling loan supply from loan demand shift in the “bank lending
channel” literature.
The search for heterogeneity in banks’ behaviour uses a balanced panel of 73 Italian
banks that represent more than 70 per cent of the banking system. The use of microeconomic
data helps to reduce the problems of aggregation that may significantly bias the estimation of
dynamic economic relations and is less prone to structural changes such as the creation of
EMU.
The main results of the study are the following. First, heterogeneity in the bank rate
pass-through exists, but it is detected only in the short run: no differences exist in the long-
run elasticities of bank rates to the money market rate. Second, consistently with the existing
literature, interest rates on short-term lending of liquid and well-capitalized banks react less
to changes in official rates. Also banks with a high proportion of long-term lending tend to
modify their prices less. Heterogeneity in the pass-through on the interest rate on current
accounts depends on banks’ liability structure. Bank size is never relevant.
The policy implication of these results is that monitoring bank-specific characteristics
is relevant for evaluating not only the total effects on lending and deposits but also the
consequences on bank rates. This is particularly important in relation to the short-run
distributional effects on consumption and investment, which are mainly driven by interest
rates, while in the long run monetary policy determines a diverse response across banks only
on the supply of loans and deposits.

Appendix– Technical details regarding the data
The dataset has been constructed using three sources. Interest rates are taken from the
10-day survey conducted by the Bank of Italy. Information on bank balance sheets comes
from the Banking Supervision Register at the Bank of Italy. Data on macroeconomic
variables are taken from International Financial Statistics.
Data on interest rates refer to transactions in euros (Italian lira before 1999). The
deposit interest rate is the weighted average rate paid by the single banks on current
accounts, which are highly homogenous deposit products.24 The rate on domestic short-term
lending for the single bank is the weighted average of all lending positions. Overdraft fees
are excluded from this computation. The choice of the short-term rate as a measure of the
bank interest lending pass-through is based on a number of considerations. First, short-term
lending excludes subsidized credit. Second, short-term loans typically are not collateralized
and this allows the “bank lending” channel to be insulated from the “balance sheet” channel.
Broadly speaking, the pass-through from market interest rates to the interest rate on loans
does not depend on market price variations that influence the value of collateral. Nearly half
of banks’ business is done at this rate.
Both interest rates are posted rates that are changed at discrete intervals (often less
frequently than weekly; see Green, 1998). In our case, the quarterly frequency of the data is
sufficient to capture all relevant changes due to a monetary policy shock. Both rates are
gross of fiscal deductions.
The interest rate taken as monetary policy indicator is that on repurchase agreements
between the Bank of Italy and credit institutions in the period 1993-98, and the interest rates
on main refinancing operations of the ECB for the period 1999-2001.25 The series does not
24 Current accounts are the most common type of deposit (at the end of 2001 they represented around 70 per cent of total bank deposits and passive repos). Current accounts allow unlimited checking for depositor that can close the account without notice. The bank, in turn, can change the remuneration on the account at any point in time. Therefore differences in deposit rates are not influenced by heterogeneity in maturity (see Focarelli and Panetta, 2003). 25 As pointed out by Buttiglione, Del Giovane and Gaiotti (1997), in the period under investigation the repo rate mostly affected the short-term end of the yield curve and, as it represented the cost of banks’ refinancing, it represented the value to which market rates and bank rates eventually tended to converge. The interest rate on main refinancing operations of the ECB does not present any particular break with the repo rate.

29
present any break.
The cost (gain) a bank incurs (obtains) from her maturity transformation function is
due to the different sensitivity of assets and liabilities to interest rates. Using a maturity
ladder, we have:
( )*100
j j j jj
ij
j
A P
A
χ ζρ
⋅ −=
∑∑
where Aj (Pj) is the amount of assets (liabilities) of j months-to-maturity and χj (ζj) measures
the increase in interest on assets (liabilities) of class j due to a 1 per cent increase in the
monetary policy interest rate (∆iM=0.01). In other words, if ( )j j j jj
A Pχ ζ⋅ −∑ >0, iρ
represents the cost per unit of asset bank k incurs if the monetary policy interest rate is raised
by 1 percentage point. We obtain χj and ζj directly from supervisory regulation on interest
rate risk exposure. In particular, the regulation assumes, for any given class j of months to
maturity: 1) the same sensitivity parameter (χj =ζj) and 2) a non-parallel shift of the yield
curve (∆iM=0.01 for the first maturity class and then decreasing for longer maturity classes).
Then, for each bank, after having classifying assets and liabilities according to their months-
to-maturity class, we have computed the bank-specific variable iρ . This variable has then
been multiplied by the change in the monetary policy indicator (∆iM) to obtain the realized
loss (or gain) per unit of asset in each quarter.
In assembling our sample, the so-called special credit institutions (long-term credit
banks) have been excluded as they were subject to different supervisory regulations
regarding the maturity range of their assets and liabilities. Nevertheless, special long-term
credit sections of commercial banks have been considered part of the banks to which they
belonged.
Particular attention has been paid to the treatment of mergers. In practice, it has been
assumed that these took place at the beginning of the sample period, summing the balance-
sheet items of the merging parties. For example, if bank A was incorporated by bank B at
time t, bank B has been reconstructed backwards as the sum of the merging banks before the
30
merger. Bank interest rates have been reconstructed backwards using as weights the short-
term loans and current accounts of the merging parties.26
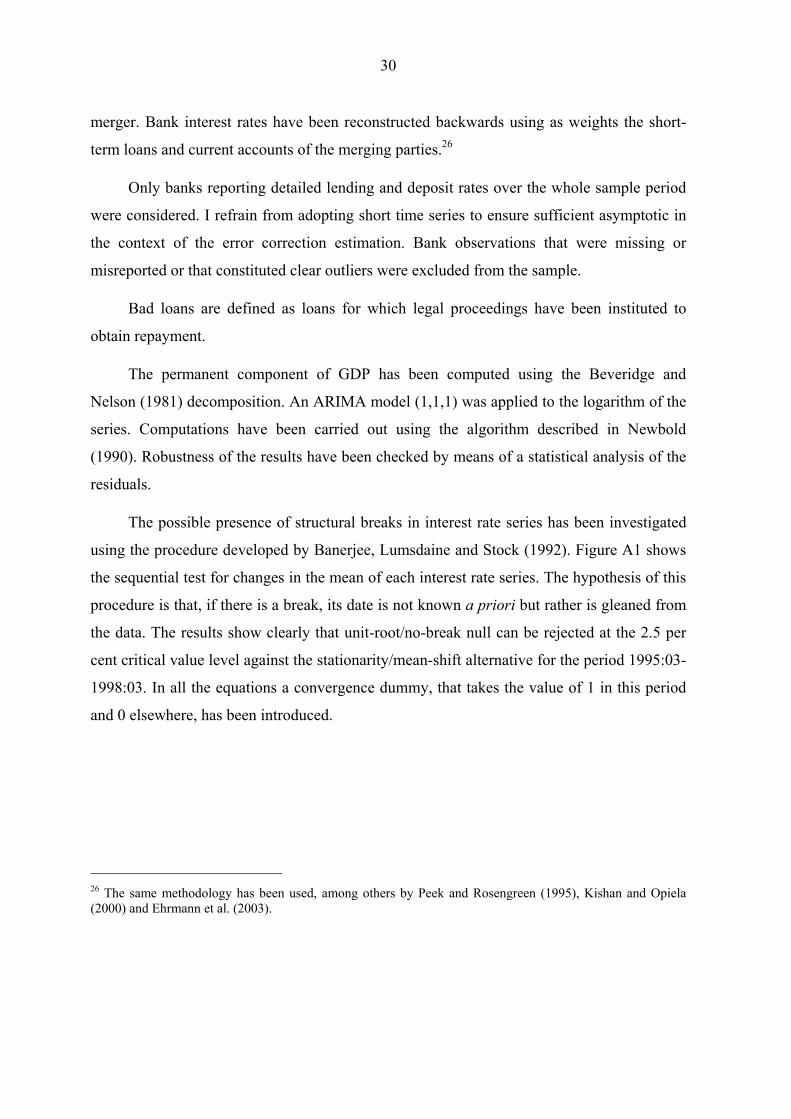
Only banks reporting detailed lending and deposit rates over the whole sample period
were considered. I refrain from adopting short time series to ensure sufficient asymptotic in
the context of the error correction estimation. Bank observations that were missing or
misreported or that constituted clear outliers were excluded from the sample.
Bad loans are defined as loans for which legal proceedings have been instituted to
obtain repayment.
The permanent component of GDP has been computed using the Beveridge and
Nelson (1981) decomposition. An ARIMA model (1,1,1) was applied to the logarithm of the
series. Computations have been carried out using the algorithm described in Newbold
(1990). Robustness of the results have been checked by means of a statistical analysis of the
residuals.
The possible presence of structural breaks in interest rate series has been investigated
using the procedure developed by Banerjee, Lumsdaine and Stock (1992). Figure A1 shows
the sequential test for changes in the mean of each interest rate series. The hypothesis of this
procedure is that, if there is a break, its date is not known a priori but rather is gleaned from
the data. The results show clearly that unit-root/no-break null can be rejected at the 2.5 per
cent critical value level against the stationarity/mean-shift alternative for the period 1995:03-
1998:03. In all the equations a convergence dummy, that takes the value of 1 in this period
and 0 elsewhere, has been introduced.
26 The same methodology has been used, among others by Peek and Rosengreen (1995), Kishan and Opiela (2000) and Ehrmann et al. (2003).

Tables and figures

Table 1
VARIABLES DESCRIPTION Variables
Symbols
Description
iL Interest rate on domestic short-term loans Dependent variables iD Interest rate on current account deposits
Fixed effects µ k Bank-specific dummy variable
iM Monetary policy indicator yP , yT Permanent and transitory components of real GDP computed using the
Beveridge and Nelson (1981) decomposition Macro variables
p Inflation rate Size: log of total assets (Kashyap and Stein, 1995; Ehrmann et al., 2003) Liquidity: cash and securities over total assets (Stein, 1998; Kashyap and Stein, 2000) Excess capital: difference between regulatory capital and capital requirements (Peek and Rosengren, 1995; Kishan and Opiela, 2000; Gambacorta and Mistrulli, 2004) Deposit strength: ratio between deposits and bonds plus deposits (Berlin and Mester,1999; Weth, 2002)
Bank-specific characteristics that influence the “bank lending channel”
Xk
Credit relationship: ratio between long term loans and total loans (Berger and Udell, 1992)
Measure for the “bank capital channel” ck Bank-specific cost of monetary policy due to maturity transformation
Risk measure jk Ratio between bad loans and total loans. This variable captures the riskiness of lending operations and should be offset by a higher expected yield on loans.
Efficiency ratio ek Management efficiency: ratio of total loans and deposits to the number of branches.
Interest rate volatility σ Interest rate volatility: coefficient of variation of Mi . Convergence dummy: step dummy that takes the value of 1 in the period 1995:03-1998:03 and 0 elsewhere. Dummies Φ Seasonal dummies.
Note: For more information on the definition of the variables see the Appendix.

Table 2
SUMMARY STATISTICS (1993:03-2001:03)
Total sample 73 9.51 2.72 3.69 16.12 3.58 1.79 0.52 8.21 16.20 24.00 3.91 82.40 37.66
Big banks 18 9.28 2.81 3.69 15.06 3.57 1.74 0.73 7.35 51.15 19.01 2.56 77.60 38.98Small banks 18 10.02 2.73 5.03 16.12 3.55 1.79 0.52 8.21 1.55 25.11 4.81 84.40 41.72
Liquid banks 18 9.51 2.72 3.69 15.94 3.57 1.80 0.65 8.21 4.67 33.07 4.27 86.27 36.15Low-liquid banks 18 9.33 2.73 4.42 14.86 3.61 1.71 0.73 7.35 43.75 14.91 3.13 72.43 43.66
Well-capitalized banks 18 9.71 2.73 3.69 16.12 3.68 1.80 0.52 7.18 9.66 26.15 6.86 85.49 37.22Low-capitalized banks 18 9.42 2.81 4.75 15.93 3.53 1.79 0.74 8.21 24.28 20.82 1.49 78.40 38.46Banks with high BM ratio 18 11.78 1.49 4.88 16.12 5.15 0.96 0.74 8.21 6.58 29.69 4.46 98.53 28.72Banks with low BM ratio 18 7.77 2.24 3.69 15.06 2.41 1.45 0.52 7.35 27.00 18.56 3.42 66.10 45.30
Banks with high BU ratio 18 8.51 2.59 3.69 15.06 2.80 1.67 0.65 7.36 21.92 19.98 3.80 71.84 53.29Banks with low BU ratio 18 10.97 2.12 4.00 16.12 4.68 1.44 0.53 7.43 8.51 28.26 3.95 93.13 22.46(5)
Size (1)
(1)
(2)
(3)
Min Max
Former special credit institutions, foreign banks and "banche di credito cooperativo" are excluded. The sample represents more than 70 per cent of the total system in terms of
lending. All interest rates are annualized and given in percentages. (1) The size indicator is given by total asset (billions of euros). (2) The liquidity indicator is represented by the
sum of cash and government securities over total assets. (3) The capital ratio is given by excess capital divided by total assets. Excess capital is the difference between regulatory
capital and total capital requirements. (4) The Berlin and Mester indicator (BM) is the ratio between deposits and deposits plus bonds. (5) The Berger and Udell indicator (BU) is the
ratio between long-term loans and total loans. A bank with a "high" characteristic has an average ratio above the first quartile of the distribution. (*) A bank with a
"low"characteristic has an average ratio below the third quartile. Since the characteristics of each bank could change with time, percentiles have been worked out on mean values.
For more details regarding the definition of the variables see Appendix 2. The sources of the dataset are Bank of Italy supervisory returns and 10-day reports.
Interest rate on current accounts
(4)
BM (4)
BU (5)
Liq. (2)
Mean
Cap. (3)
St. dev.
Interest rate on short-term lendingNumber of banks
Mean St. dev. Min MaxBank-characteristics (*)

Table 3
RESULTS FOR THE EQUATION ON THE INTEREST RATE ON SHORT-TERM LENDING
Coeff. S.Error Coeff. S.Error Coeff. S.Error Coeff. S.Error Coeff. S.Error
Loan demandInflation: 0.159 *** 0.019 0.145 *** 0.017 0.145 *** 0.015 0.149 *** 0.018 0.187 *** 0.015Permanent Income: 0.033 ** 0.015 0.030 *** 0.012 0.032 ** 0.013 0.025 ** 0.012 0.043 *** 0.010Transitory Income: 0.012 0.031 0.013 0.025 0.012 0.026 0.012 0.024 0.026 0.020
Costs, credit risk and int.rate volatilityBank efficiency: -0.004 ** 0.002 -0.001 0.002 -0.006 ** 0.002 -0.001 0.001 -0.001 0.001Bad loans: 0.020 *** 0.002 0.016 *** 0.002 0.017 *** 0.001 0.020 *** 0.002 0.019 *** 0.002Interest rate volatility: 0.011 *** 0.001 0.012 *** 0.001 0.010 *** 0.001 0.014 *** 0.001 0.012 *** 0.001
Immediate pass-throughAverage bank: 0.569 *** 0.027 0.403 *** 0.031 0.533 *** 0.023 0.465 *** 0.030 0.497 *** 0.034Ho: no heterogeneity (p-value) 0.003 0.018 0.418 0.023 0.000Low characteristic 0.556 *** 0.028 0.414 *** 0.027 0.536 *** 0.022 0.474 *** 0.028 0.529 *** 0.033High characteristic 0.586 *** 0.026 0.383 *** 0.036 0.529 *** 0.026 0.456 *** 0.032 0.463 *** 0.035
Pass-through after a quarterAverage bank: 0.938 *** 0.013 0.941 *** 0.018 0.954 *** 0.012 0.869 *** 0.016 0.878 *** 0.013Ho: no heterogeneity (p-value) 0.000 0.000 0.037 0.159 0.000Low characteristic 0.913 *** 0.015 0.962 *** 0.018 0.958 *** 0.011 0.862 *** 0.017 0.889 *** 0.014High characteristic 0.971 *** 0.014 0.920 *** 0.018 0.949 *** 0.015 0.878 *** 0.016 0.863 *** 0.012
Long run elasticityAverage bank: 1.017 *** 0.014 0.996 *** 0.014 1.023 *** 0.012 0.982 *** 0.015 1.012 *** 0.018Ho: unitary long run elasticity (p-val.) 0.056 0.816 0.047 0.235 0.489Ho: no heterogeneity (p-value) 0.509 0.822 0.883 0.924 0.644Low characteristic 0.996 *** 0.014 0.987 *** 0.015 1.031 *** 0.013 0.990 *** 0.026 0.992 *** 0.016High characteristic 1.049 *** 0.016 1.005 *** 0.015 1.015 *** 0.012 0.978 *** 0.012 1.040 *** 0.023
Loading of the long-run relationshipAverage bank: -0.477 *** 0.023 -0.422 *** 0.019 -0.507 *** 0.023 -0.381 *** 0.043 -0.382 *** 0.017Ho: no heterogeneity (p-value) 0.000 0.000 0.035 0.000 0.000Low characteristic -0.505 *** 0.026 -0.391 *** 0.023 -0.482 *** 0.028 -0.234 *** 0.021 -0.434 *** 0.017High characteristic -0.441 *** 0.023 -0.451 *** 0.019 -0.539 *** 0.026 -0.519 *** 0.020 -0.330 *** 0.020
Bank capital channel 0.104 * 0.055 0.409 *** 0.070 0.178 *** 0.051 0.197 *** 0.066 0.109 * 0.066
Miss-specification testsMA(1), MA(2) (p-value) 0.000 0.949 0.000 0.367 0.000 0.702 0.000 0.185 0.000 0.116Sargan test (p-value) 0.087 0.099 0.088 0.101 0.057No of banks, no of observations 73 2336 73 2336 73 2336 73 2336 73 2336
(4) Dep./(Bonds+Dep.)
(5) Long term loans/
Total loans
with k=1,…, N (k=number of banks) and t=1, …,T (t= periods). Data are quarterly (1993:03-2001:03) and not seasonally adjusted. The panel isbalanced with N=73 banks. Lags have been selected in order to obtain white noise residuals. The description of the variables is reported in Table 1.The models have been estimated using the GMM estimator suggested by Arellano and Bond (1991), which ensures efficiency and consistencyprovided that the models are not subject to serial correlation of order two and that the instruments used are valid (which is tested for with the Sargantest). A bank with “low characteristic” has an average ratio below the first quartile, a bank with "high characterisic” has an average ratio above thethird quartile. For more details regarding the data see the Appendix. *=significance at the 10 per cent level; **=significance at the 5 per cent level;***=significance at the 1 per cent level.
This table shows the results of the equation for the interest rate on short-term lending. The model is given by the following equation, which includesinteraction terms that are the product of the monetary policy indicator and a bank-specific characteristic:
Dependent variable: quarterly change of the interest rate on short-term lending
(1) Size
(2) Liquidity
(3) Capitalization
tktkttktktktTt
Pt
tMtktkLtktkjtMj
tkjjj
jtkLjktkL
ejcpyy
iXiXXiXii
,,,,,21
1 1, *
1, 1, *
1,
1
01,
*2
1, ,
lnln
)()()(
εψσξθηϕδδ
γγααλββκµ
+ΦΓ++++∆++∆+∆+
++++++∆++∆+=∆ −−−−−−=
−=
− ∑∑

Table 4
RESULTS FOR THE EQUATION ON INTEREST RATE ON CURRENT ACCOUNTS
Coeff. S.Error Coeff. S.Error Coeff. S.Error Coeff. S.Error Coeff. S.Error
Deposit demandInflation: 0.049 *** 0.015 0.091 *** 0.012 0.058 *** 0.015 0.099 *** 0.008 0.039 *** 0.009Permanent Income: -0.058 *** 0.006 -0.048 *** 0.006 -0.058 *** 0.005 -0.024 * 0.013 -0.052 *** 0.004Transitory Income: -0.222 *** 0.012 -0.204 *** 0.012 -0.223 *** 0.011 -0.102 *** 0.012 -0.202 *** 0.010
Costs, credit risk and int.rate volatilityBank efficiency: 0.001 0.001 0.001 0.001 0.001 0.002 0.012 *** 0.001 0.002 * 0.001Interest rate volatility: 0.001 ** 0.001 0.002 *** 0.001 0.001 *** 0.001 0.005 *** 0.000 0.002 *** 0.001
Immediate pass-throughAverage bank: 0.413 *** 0.013 0.411 *** 0.010 0.410 *** 0.008 0.418 *** 0.009 0.388 *** 0.008Ho: no heterogeneity (p-value) 0.000 0.000 0.742 0.000 0.000Low characteristic 0.400 *** 0.015 0.431 *** 0.010 0.411 *** 0.009 0.451 *** 0.009 0.408 *** 0.007High characteristic 0.429 *** 0.012 0.394 *** 0.010 0.409 *** 0.009 0.387 *** 0.010 0.366 *** 0.010
Pass-through after a quarterAverage bank: 0.546 *** 0.009 0.541 *** 0.008 0.544 *** 0.007 0.507 *** 0.006 0.540 *** 0.006Ho: no heterogeneity (p-value) 0.000 0.000 0.049 0.000 0.776Low characteristic 0.512 *** 0.010 0.551 *** 0.008 0.551 *** 0.007 0.526 *** 0.006 0.536 *** 0.006High characteristic 0.588 *** 0.008 0.530 *** 0.008 0.535 *** 0.009 0.493 *** 0.008 0.542 *** 0.008
Long-run elasticityAverage bank: 0.685 *** 0.013 0.685 *** 0.009 0.676 *** 0.009 0.643 *** 0.007 0.669 *** 0.010Ho: unitary long run elasticity (p-val.) 0.000 0.000 0.000 0.000 0.000Ho: no heterogeneity (p-value) 0.905 0.205 0.463 0.444 0.717Low characteristic 0.688 *** 0.014 0.670 *** 0.010 0.663 *** 0.009 0.631 *** 0.006 0.675 *** 0.010High characteristic 0.682 *** 0.013 0.699 *** 0.009 0.694 *** 0.011 0.654 *** 0.009 0.661 *** 0.011
Loading of the long-run relationshipAverage bank: -0.572 *** 0.018 -0.646 *** 0.018 -0.609 *** 0.020 -0.760 *** 0.016 -0.572 *** 0.016Ho: no heterogeneity (p-value) 0.000 0.016 0.000 0.000 0.000Low characteristic -0.537 *** 0.018 -0.657 *** 0.020 -0.645 *** 0.019 -0.725 *** 0.019 -0.610 *** 0.017High characteristic -0.610 *** 0.023 -0.634 *** 0.017 -0.564 *** 0.025 -0.795 *** 0.017 -0.533 *** 0.017
Bank capital channel -0.055 *** 0.015 -0.036 *** 0.012 -0.049 *** 0.009 -0.039 *** 0.013 -0.034 *** 0.009
Miss-specification testsMA(1), MA(2) (p-value) 0.000 0.953 0.000 0.976 0.000 0.785 0.000 0.340 0.000 0.508Sargan test (p-value) 0.091 0.960 0.094 0.092 0.095No of banks, no of observations 73 2336 73 2336 73 2336 73 2336 73 2336
with k=1,…, N (k=number of banks) and t=1, …,T (t= periods). Data are quarterly (1993:03-2001:03) and not seasonally adjusted. The panel isbalanced with N=73 banks. Lags have been selected in order to obtain white noise residuals. The description of the variables is reported in Table 1. Themodels have been estimated using the GMM estimator suggested by Arellano and Bond (1991), which ensures efficiency and consistency provided thatthe models are not subject to serial correlation of order two and that the instruments used are valid (which is tested for with the Sargan test). A bankwith “low characteristic” has an average ratio below the first quartile, a bank with "high characterisic” has an average ratio above the third quartile. Formore details regarding the data see the Appendix. *=significance at the 10 per cent level; **=significance at the 5 per cent level; ***=significance atthe 1 per cent level.
This table shows the results of the equation for the interest rate on current accounts. The model is given by the following equation, which includesinteraction terms that are the product of the monetary policy indicator and a bank-specific characteristic:
Dependent variable: quarterly change of the interest rate on current accounts
(1) Size
(2) Liquidity
(3) Capitalization
(4) Dep./(Bonds+Dep.)
(5) Long term loans/
Total loans
tktkttktktTt
Pt
tMtktkDtktkjtMj
tkjjj
jtkDjktkD
ecpyy
iXiXXiXii
,,,,21
1 1, *
1, 1, *
1,
1
01,
*2
1, ,
lnln
)()()(
εψσξηϕδδ
γγααλββκµ
+ΦΓ+++∆++∆+∆+
++++++∆++∆+=∆ −−−−−−=
−=
− ∑∑

Table 5
BANK LENDING CHANNEL
Coeff. S.Error Coeff. S.Error Coeff. S.Error Coeff. S.Error Coeff. S.Error
Immediate pass-throughAverage bank: 0.452 *** 0.062 0.452 *** 0.062 0.452 *** 0.062 0.452 *** 0.062 0.452 *** 0.062Ho: no heterogeneity (p-value) 0.159 0.027 0.043 0.702 0.016Low characteristic 0.492 *** 0.064 0.476 *** 0.058 0.558 *** 0.065 0.460 *** 0.059 0.519 *** 0.050High characteristic 0.393 *** 0.080 0.421 *** 0.069 0.308 *** 0.110 0.437 *** 0.077 0.375 *** 0.084
Pass-through after a quarterAverage bank: 0.879 *** 0.039 0.879 *** 0.039 0.879 *** 0.039 0.879 *** 0.039 0.879 *** 0.039Ho: no heterogeneity (p-value) 0.639 0.317 0.744 0.913 0.912Low characteristic 0.895 *** 0.058 0.891 *** 0.036 0.914 *** 0.082 0.883 *** 0.050 0.888 *** 0.039High characteristic 0.857 *** 0.040 0.868 *** 0.033 0.847 *** 0.075 0.876 *** 0.047 0.873 *** 0.053
Long-run elasticityAll banks: 1.000 - - 1.000 - - 1.000 - - 1.000 - - 1.000 - -
Loading of the long-run relationshipAverage bank: -0.354 *** 0.050 -0.354 *** 0.050 -0.354 *** 0.050 -0.354 *** 0.050 -0.354 *** 0.050Ho: no heterogeneity (p-value) 0.681 0.990 0.536 0.761 0.773Low characteristic -0.377 *** 0.072 -0.354 *** 0.063 -0.318 *** 0.070 -0.332 *** 0.089 -0.332 *** 0.086High characteristic -0.324 *** 0.092 -0.354 *** 0.046 -0.399 *** 0.095 -0.375 *** 0.085 -0.376 *** 0.095
Miss-specification testsMA(1), MA(2) (p-value) 0.000 0.073Sargan test (p-value) 0.985No of banks, no of observations 73 2336
Immediate pass-throughAverage bank: 0.452 *** 0.042 0.452 *** 0.042 0.452 *** 0.042 0.452 *** 0.042 0.452 *** 0.042Ho: no heterogeneity (p-value) 0.972 0.129 0.529 0.032 0.112Low characteristic 0.453 *** 0.043 0.470 *** 0.050 0.479 *** 0.054 0.509 *** 0.044 0.497 *** 0.062High characteristic 0.452 *** 0.050 0.434 *** 0.037 0.419 *** 0.074 0.400 *** 0.054 0.406 *** 0.062
Pass-through after a quarterAverage bank: 0.545 *** 0.033 0.545 *** 0.033 0.545 *** 0.033 0.545 *** 0.033 0.545 *** 0.033Ho: no heterogeneity (p-value) 0.160 0.978 0.481 0.203 0.224Low characteristic 0.572 *** 0.032 0.546 *** 0.038 0.566 *** 0.055 0.590 *** 0.045 0.563 *** 0.041High characteristic 0.524 *** 0.043 0.545 *** 0.033 0.517 *** 0.045 0.516 *** 0.039 0.525 *** 0.034Long-run elasticityAverage bank: 0.700 - - 0.700 - - 0.700 - - 0.700 - - 0.700 - -Loading of the long-run relationshipAverage bank: -0.570 *** 0.043 -0.570 *** 0.043 -0.570 *** 0.043 -0.570 *** 0.043 -0.570 *** 0.043Ho: no heterogeneity (p-value) 0.388 0.820 0.481 0.004 0.575Low characteristic -0.537 *** 0.048 -0.565 *** 0.050 -0.607 *** 0.019 -0.452 *** 0.062 -0.589 *** 0.059High characteristic -0.612 *** 0.074 -0.575 *** 0.047 -0.523 *** 0.025 -0.680 *** 0.054 -0.550 *** 0.051
Miss-specification testsMA(1), MA(2) (p-value) 0.000 0.915Sargan test (p-value) 0.180No of banks, no of observations 73 2336
(B) Dependent variable is the quarterly change of the interest rate on current accounts
(4) Dep./(Bonds+Dep.)
(5) Long term loans/
Total loans
(A) Dependent variable is the quarterly change of the interest rate on short-term lending
(1) Size
(2) Liquidity
(3) Capitalization
This table shows the results of the equation for the interest rate on short-term lending (panel A) and current accounts (panel B) when all bank-specificcharacteristics are taken simultaneously into account. The model is given by the following equation, which includes interaction terms that are theproduct of the monetary policy indicator and each bank-specific characteristic:
with iw= quarterly change of the interest rate on short-term lending or current accounts k=1,…, N (k=number of banks) and t=1, …,T (t= periods).Bank-specific characteristics are size,liquidity, capitalization, Berlin-Mester and Berger-Udell indicators (m =5). Data are quarterly (1992:03-2001:03) and not seasonally adjusted. The panel is balanced with N=73 banks. Lags have been selected in order to obtain white noise residuals. Thedescription of the variables is reported in Table 1. The models have been estimated using the GMM estimator suggested by Arellano and Bond(1991) which ensures efficiency and consistency provided that the models are not subject to serial correlation of order two and that the instrumentsused are valid (which is tested for with the Sargan test). A bank with “low characteristic” has an average ratio below the first quartile, a bank with"high characterisic” has an average ratio above third quartile. For more details regading the data see the Appendix. *=significance at the 10 per centlevel; **=significance at the 5 per cent level; ***=significance at the 1 per cent level.
tktkttktktTt
Pt
tMtkm
tmkm
tmkmm
jtMj
tmkjjj
jtkWjktkW
ecpyy
iiXXiXii
,,,,21
1 1,
5
11,,
*5
11,,
5
1
1
01,,
*2
1, ,
lnln
) )(()(
εψσξηϕδδ
γααλββκµ ψ
+ΦΓ+++∆++∆+∆+
+−+++∆++∆+=∆ −−=
−=
−=
−=
−=
− ∑∑∑∑∑

Fig. 1
Banking interest rates (quarterly data, percentage points)
Fig. 2
Cross-sectional and time series dispersion of interest rates
0
5
10
15
20
1987 1988 1989 1990 1991 1992 1993 1994 1995 1996 1997 1998 1999 2000 2001
Short term lending rate Repo rate 3-month interbank rate Interest rate on current accounts
Estimation period 1993:03-2001:03
Euro
Period before C.L.B. 1987:01-1993:02
(b) Interest rate on current accounts
0.000
0.050
0.100
0.150
0.200
0.250
0.300
0.350
1987 1988 1989 1990 1991 1992 1993 1994 1995 1996 1997 1998 1999 2000 2001
ACROSS BANKS OVER TIME
(a) Interest rate on short-term loans
0.000
0.050
0.100
0.150
0.200
0.250
0.300
0.350
1987 1988 1989 1990 1991 1992 1993 1994 1995 1996 1997 1998 1999 2000 2001

Fig. 3
Determinants of bank interest rates
Note: the meaning of all the symbols is reported in Table 1.
) , ,costs , , , , , ,,( 1?
1?
1 kMttMtMTP
D iXiXipyyfi µσρ+−−
−−−+−−−
∆=
), ,costs , , , , , , ,,( 1?
1?
1?
kMttMtMTP
L jiXiXipyyfi µσρ++++
−−−+++
∆=
Deposit demand
Bank lending channel
Interest rate
channel
Bank capital channel
Cost of inter-mediation, credit risk
and interest rate volatility
Industry structure
Loan demand
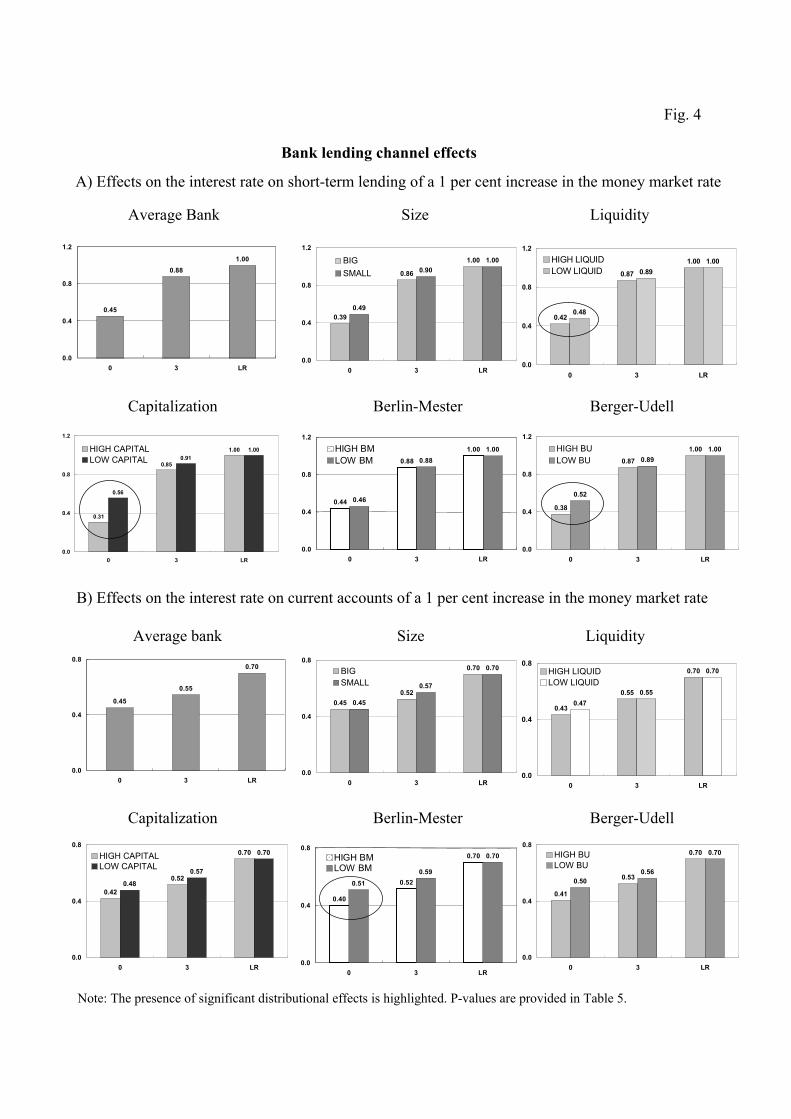
Fig. 4
Bank lending channel effects
A) Effects on the interest rate on short-term lending of a 1 per cent increase in the money market rate
0.39
0.86
1.00
0.49
0.901.00
0.0
0.4
0.8
1.2
0 3 LR
BIGSMALL
0.42
0.87
1.00
0.48
0.891.00
0.0
0.4
0.8
1.2
0 3 LR
HIGH LIQUIDLOW LIQUID
0.31
0.85
1.00
0.56
0.911.00
0.0
0.4
0.8
1.2
0 3 LR
HIGH CAPITALLOW CAPITAL
0.38
0.87
1.00
0.52
0.891.00
0.0
0.4
0.8
1.2
0 3 LR
HIGH BULOW BU
0.450.52
0.70
0.45
0.57
0.70
0.0
0.4
0.8
0 3 LR
BIGSMALL
0.43
0.55
0.70
0.470.55
0.70
0.0
0.4
0.8
0 3 LR
HIGH LIQUIDLOW LIQUID
0.42
0.52
0.70
0.48
0.57
0.70
0.0
0.4
0.8
0 3 LR
HIGH CAPITALLOW CAPITAL
0.41
0.53
0.70
0.500.56
0.70
0.0
0.4
0.8
0 3 LR
HIGH BULOW BU
0.40
0.52
0.70
0.510.59
0.70
0.0
0.4
0.8
0 3 LR
HIGH BMLOW BM
0.44
0.88
1.00
0.46
0.881.00
0.0
0.4
0.8
1.2
0 3 LR
HIGH BMLOW BM
0.45
0.55
0.70
0.0
0.4
0.8
0 3 LR
0.45
0.881.00
0.0
0.4
0.8
1.2
0 3 LR
Average Bank Size Liquidity
Capitalization Berlin-Mester Berger-Udell
B) Effects on the interest rate on current accounts of a 1 per cent increase in the money market rate
Average bank Size Liquidity
Capitalization Berlin-Mester Berger-Udell
Note: The presence of significant distributional effects is highlighted. P-values are provided in Table 5.

Fig. A1
Search for mean shift breaks (monthly data, sequential minimum unit root tests)
Note: The estimated model tests for a shift in the constant. No trend is included. Sequential statistics are computed using the sample 1984:7-2002:12, sequentially incrementing the date of the hypothetical shift. A fraction equal to 15 per cent of the total sample at the beginning and at the end of the sample is not considered for the test. For more details see Banerjee, Lumsdaine and Stock (1992).
-10
-9
-8
-7
-6
-5
-4
-3
-2
-1
0Dec-87 Dec-88 Dec-89 Dec-90 Dec-91 Dec-92 Dec-93 Dec-94 Dec-95 Dec-96 Dec-97 Dec-98 Dec-99
Interest rate on current accountsInterest rate on short-term loans3-month interbank market rate10% critical value2.5% critical value

References
Altunbas Y., Fazylow O. and Molyneux P. (2002), “Evidence on the Bank Lending Channel in Europe”, Journal of Banking and Finance, Vol. 26, No. 11, pp. 2093-2110.
Angbazo L. (1997), “Commercial Bank Net Interest Margins, Default Risk, Interest-rate risk, and Off-balance Sheet Banking”, Journal of Banking and Finance, Vol. 21, No. 1, pp. 55-87.
Angelini P. and Cetorelli N. (2002), “The Effects of Regulatory Reform on Competition in the Banking Industry”, Journal of Money, Credit and Banking, Vol. 35, No. 5, pp. 663-684.
Angelini P., Di Salvo P. and Ferri G. (1998), “Availability and Cost of Credit for Small Businesses: Customer Relationships and Credit Cooperatives”, Journal of Banking and Finance, Vol. 22, No. 6-8, pp. 925-954.
Angeloni I., Buttiglione L., Ferri G. and Gaiotti E. (1995), “The Credit Channel of Monetary Policy across Heterogeneous Banks: The Case of Italy”, Banca d’Italia, Temi di discussione, No. 256.
Ausubel L. M. (1992), Rigidity and Asymmetric Adjustment of Bank Interest Rates, mimeo.
Banca d’Italia (1986), “Modello trimestrale dell’economia italiana”, Banca d’Italia, Temi di discussione, No. 80.
Banca d’Italia (1988), “Modello mensile del mercato monetario”, Banca d’Italia, Temi di discussione, No. 108.
Banerjee A., Lumsdaine R.L. and Stock J.H. (1992), “Recursive and Sequential Tests of the Unit-Root and Trend Break Hypotheses: Theory and International Evidence”, Journal of Business and Economic Statistics, Vol. 10, No. 3, pp. 271-287.
Berger A.N. and Udell G.F. (1992), “Some Evidence on the Empirical Significance of Credit Rationing”, Journal of Political Economy, Vol. 100, No. 5, pp. 1047-1077.
Berlin M. and Mester L.J. (1999), “Deposits and Relationship Lending”, Review of Financial Studies, Vol. 12, No. 3, pp. 579-607.
Bernanke B. and Blinder A.S. (1988), “Is it Money or Credit, or Both or Neither? Credit, Money and Aggregate Demand”, American Economic Review, Vol. 78, No. 2, pp. 435-439. Paper and Proceedings of the One-Hundredth Annual Meeting of the American Economic Association.
Beveridge S. and Nelson C. (1981), “A New Approach to the Decomposition of Economics Time Series into Permanent and Transitory Components with Particular Attention to Measurement of the Business Cycle”, Journal of Monetary Economics, Vol. 21, No. 2, pp. 151-174.
Boccuzzi G. (1998), La crisi dell'impresa bancaria. Profili economici e giuridici, Giuffrè, Milano.
Bolton P. and Freixas X. (2001), “Corporate Finance and the Monetary Transmission Mechanism”, CEPR, Discussion Paper Series, No. 2982.

42
Calomiris C.W. and Hubbard G.R. (1995), “Internal Finance and Investment: Evidence from the Undistributed Profit Tax of 1936-37”, Journal of Business, Vol. 68, No. 4, pp. 443-482.
Ciocca P. (2000), La nuova finanza in Italia. Una difficile metamorfosi (1980-2000), Bollati Boringhieri, Torino.
Cornett M. and Tehranian H. (1994), “An Examination of Voluntary Versus Involuntary Security Issuances by Commercial Banks: The Impact of Capital Regulations on Common Stock Returns”, Journal of Financial Economics, Vol. 35, No. 1, pp. 99-122.
Cottarelli C. and Kourelis A. (1994), “Financial Structure, Bank Lending Rates and the Transmission Mechanism of Monetary Policy”, IMF Staff Papers, Vol. 41, No. 4, pp.587-623.
Cottarelli C., Ferri G. and Generale A. (1995), “Bank Lending Rates and Financial Structure in Italy: A Case Study”, IMF Working Papers, No. 38.
de Bondt G., Mojon B. and Valla N. (2003), “Term Structure and the Sluggishness of Retail Bank Rates in the Euro Area”, ECB, mimeo.
Dermine J. (1991), Discussion to Vives X., “Banking Competition and European Integration”, in Giovannini A. and Mayer C. (eds.), European Financial Integration, Cambridge, Cambridge University Press.
Dewatripont M. and Tirole J. (1994), The Prudential Regulation of Banks, Cambridge, Massachusetts, MIT Press.
Ehrmann M., Gambacorta L., Martinez Pagés J., Sevestre P. and Worms A. (2003), “Financial Systems and the Role of Banks in Monetary Policy Transmission in the Euro Area”, in Angeloni I., Kashyap A. and Mojon B. (eds.), Monetary Policy Transmission in the Euro Area, Cambridge, Cambridge University Press.
Focarelli D. and Panetta F. (2003), “Are Merger Beneficial to Consumers? Evidence from the Market for Bank Deposits”, American Economic Review, Vol. 93, No. 4, pp. 1152-1172.
Friedman B. and Kuttner K. (1993), “Economic Activity and the Short-Term Credit Markets: an Analysis of Prices and Quantities”, Brooking Papers on Economic Activity, Vol. 2, pp. 193-283.
Freixas X. and Rochet J. (1997), Microeconomics of Banking, Cambridge, MIT Press.
Gaiotti E. (1992), “L’evoluzione delle tecniche di controllo monetario nel modello mensile della Banca d’Italia”, mimeo, Banca d’Italia.
Gambacorta L. (2004), “Inside the Bank Lending Channel”, European Economic Review, forthcoming.
Gambacorta L. and Mistrulli P. (2004), “Does Bank Capital Affect Lending Behavior?”, Journal of Financial Intermediation, Vol. 13, No. 4, pp. 436-457.
Green C.J. (1998), “Banks as Interest Rate Managers”, Journal of Financial Services Research, Vol. 14, No. 3, pp. 189-208.
43
Hancock D. (1991), A Theory of Production for the Financial Firm, Norwell, Massachusetts, Kluwer Academic Publishers.
Hannan T.H. and Berger A.N. (1991), “The Rigidity of Prices: Evidence From Banking Industry”, American Economic Review, Vol. 81, No. 4, pp. 938-945.
Harvey (1981), Time Series Models, Oxford, Allan.
Ho T.S.Y. and Saunders A. (1981), The Determinants of Bank Interest Margins: Theory and Empirical Evidence”, Journal of Financial and Quantitative Analysis, Vol. 16, No. 2, pp. 581-600.
Houston J.F. and James C. (1998), “Do Bank Internal Capital Market Promote Lending?”, Journal of Banking and Finance, Vol. 22, No. 6-8, pp. 899-918.
Hutchison D.E. (1995), “Retail Bank Deposit Pricing: An Intertemporal Asset Pricing Approach”, Journal of Money Credit and Banking, Vol. 27, No. 1, pp. 217-231.
Kashyap A. and Stein J.C. (1995), “The Impact of Monetary Policy on Bank Balance Sheets”, Carnegie Rochester Conference Series on Public Policy, Vol. 42, pp.151-195.
Kashyap A. and Stein J.C. (2000), “What Do a Million Observations on Banks Say About the Transmission of Monetary Policy”, American Economic Review, Vol. 90, No. 3, pp. 407-428.
Kashyap A., Stein J.C. and Wilcox D. (1993), “Monetary Policy and Credit Conditions: Evidence from the Composition of External Finance”, American Economic Review, Vol. 83, No. 1, pp. 78-98.
Kishan R.P. and Opiela T.P. (2000), “Bank Size, Bank Capital and the Bank Lending Channel”, Journal of Money, Credit and Banking, Vol. 32, No. 1, pp. 121-141.
Klein M. (1971), “A Theory of the Banking Firm”, Journal of Money, Credit and Banking, Vol. 3, No. 2, pp. 205-218.
Lim G.C. (2000), “Bank Interest Rate Adjustments: Are They Asymmetric?”, The Economic Record, Vol. 77, No. 237, pp. 135-147.
Melitz J. and Pardue M. (1973), “The Demand and Supply of Commercial Bank Loans”, Journal of Money, Credit and Banking, Vol. 5, No. 2, pp. 669-692.
Moore G.R., Porter R.D. and Small D.H. (1990), “Modelling the Disaggregated Demands for M2 and M1: the U.S. Experience in the 1980s”, Proceedings of a Federal Reserve Board Conference on Monetary Aggregates and Financial System Behavior.
Myers S.C. and Majluf N.S. (1984), “Corporate Finance and Investment Decisions when Firms Have Information that Investors Do Not Have”, Journal of Financial Economics, Vol. 13, No. 2, pp. 187-221.
Neumark D. and Sharpe S.A. (1992), “Market Structure and the Nature of Price Rigidity: Evidence From the Market for Consumer Deposits”, Quarterly Journal of Economics, Vol. 107, No. 2, pp. 657-680.

44
Newbold P. (1990), “Precise and Efficient Computation of the Beveridge-Nelson Decomposition of Economic Time Series”, Journal of Monetary Economics, Vol. 26, No. 3, pp. 453-457.
Pagan A.R. (1990), “Three Econometric Methodologies: a Critical Appraisal”, in Granger C.W.J. (eds.), Modelling Economic Series: Readings in Econometric, Oxford, Oxford University Press, pp. 97-120.
Passacantando F. (1996), “Building an Institutional Framework for Monetary Stability”, BNL Quarterly Review, Vol. 49, No. 196, pp. 83-132.
Peek J. and Rosengren E.S. (1995), “Bank Lending and the Transmission of Monetary Policy”; in Peek J. and E.S. Rosengren (eds.), Is Bank Lending Important for the Transmission of Monetary Policy?, Federal Reserve Bank of Boston Conference Series No. 39, pp. 47-68.
Petersen M. and Rajan R. (1994), “The Benefits of Lending Relationships: Evidence from Small Business Data”, The Journal of Finance, Vol. 49, No. 1, pp.3-37.
Rosen R.J. (2001), What Goes Up Must Come Down? Asymmetries and Persistence in Bank Deposit Rates, Indiana University, mimeo.
Santomero A.M. (1984), “Modeling the Banking Firm: A Survey”, Journal of Money Credit and Banking, Vo. 16, No. 4, pp. 576-602.
Stein J.C. (1998), “An Adverse-Selection Model of Bank Asset and Liability Management with Implications for the Transmission of Monetary Policy”, RAND Journal of Economics, Vol. 29, No. 3, pp. 466-486.
Thakor A.V. (1996), “Capital Requirements, Monetary Policy, and Aggregate Bank Lending: Theory and Empirical Evidence”, The Journal of Finance, Vol. 51, No. 1, pp. 279-324.
Upper C. and Worms A. (2004), “Estimating Bilateral Exposures in the German Interbank Market: Is There a Danger of Contagion?”, European Economic Review, Vol. 48, No. 4, pp. 827-849.
Van den Heuvel S.J. (2001a), “The Bank Capital Channel of Monetary Policy”, University of Pennsylvania, mimeo.
Van den Heuvel S.J. (2001b), “Banking Conditions and the Effects of Monetary Policy: Evidence from U.S. States”, University of Pennsylvania, mimeo.
Van den Heuvel S.J. (2003), “Does Bank Capital Matter for Monetary Transmission?”, Federal Reserve Bank of New York Economic Policy Review, May, pp. 258-265.
Verga G. (1984), “La determinazione dei tassi bancari in Italia: un’analisi per gli anni più recenti”, Banca, Impresa, Società, Vol. 3, No. 1, pp.65-84.
Weth M.A. (2002), “The Pass-Through from Market Interest Rates to Bank Lending Rates in Germany”, Discussion Paper No. 11, Economic Research Center of the Deutsche Bundesbank.

RECENTLY PUBLISHED “TEMI” (*)
N. 517 – The modelling of operational risk: experience with the analysis of the data collected by the Basel Committee, by M. MOSCADELLI (July 2004).
N. 518 – Perché le imprese ricorrono al factoring? Il caso dell’Italia, by M. BENVENUTI and M. GALLO (September 2004).
N. 519 – Un modello dei conti economici per il sistema bancario italiano, by L. CASOLARO and L. GAMBACORTA (September 2004).
N. 520 – Errori di misura nell’indagine sui bilanci delle famiglie italiane, by C. BIANCOTTI, G. D’ALESSIO and A. NERI (September 2004).
N. 521 – Do mergers improve information? Evidence from the loan market, by F. PANETTA, F. SCHIVARDI and M. SHUM (September 2004).
N. 522 – Tecnologia e dinamica dei vantaggi comparati: un confronto fra quattro regioni italiane, by C. BENTIVOGLI and F. QUINTILIANI (September 2004).
N. 523 – The short-term impact of government budgets on prices: evidence from macroeconometric models, by J. HENRY, P. HERNÀNDEZ DE COS and S. MOMIGLIANO, (October 2004).
N. 524 – Pricing behavior and the comovement of productivity and labor: evidence from firm-level data, by D.J. MARCHETTI and F. NUCCI (December 2004).
N. 525 – Is there a cost channel of monetary policy transmission? An investigation into the pricing behaviour of 2,000 firms, by E. GAIOTTI and A. SECCHI (December 2004).
N. 526 – Foreign direct investment and agglomeration: Evidence from Italy, by R. BRONZINI (December 2004).
N. 527 – Endogenous growth in open economies: A survey, by A. F. POZZOLO (December 2004).
N. 528 – The role of guarantees in bank lending, by A. F. POZZOLO (December 2004).
N. 529 – Does the ILO definition capture all unemployment, by A. BRANDOLINI, P. CIPOLLONE and E. VIVIANO (December 2004).
N. 530 – Household wealth distribution in Italy in the 1990s, by A. BRANDOLINI, L. CANNARI, G. D’ALESSIO and I. FAIELLA (December 2004).
N. 531 – Cyclical asymmetry in fiscal policy, debt accumulation and the Treaty of Maastricht, by F. BALASSONE and M. FRANCESE (December 2004).
N. 532 – L’introduzione dell’euro e la divergenza tra inflazione rilevata e percepita, by P. DEL GIOVANE and R. SABBATINI (December 2004).
N. 533 – A micro simulation model of demographic development and households’ economic behavior in Italy, by A. ANDO and S. NICOLETTI ALTIMARI (December 2004).
N. 534 – Aggregation bias in macro models: does it matter for the euro area?, by L. MONTEFORTE (December 2004).
N. 535 – Entry decisions and adverse selection: an empirical analysis of local credit markets, by G. GOBBI and F. LOTTI (December 2004).
N. 536 – An empirical investigation of the relationship between inequality and growth, by P. PAGANO (December 2004).
N. 537 – Monetary policy impulses, local output and the transmission mechanism, by M. CARUSO (December 2004).
N. 538 – An empirical micro matching model with an application to Italy and Spain, by F. PERACCHI and E.VIVIANO (December 2004).
N. 539 – La crescita dell’economia italiana negli anni novanta tra ritardo tecnologico e rallentamento della produttività, by A. BASSANETTI, M. IOMMI, C. JONA-LASINIO and F. ZOLLINO (December 2004).
N. 540 – Cyclical sensitivity of fiscal policies based on real-time data, by L. FORNI and S. MOMIGLIANO (December 2004).
N. 541 – L’introduzione dell’euro e le politiche di prezzo: analisi di un campione di dati individuali, by E. GAIOTTI and F. LIPPI (February 2005).
(*) Requests for copies should be sent to: Banca d’Italia – Servizio Studi – Divisione Biblioteca e pubblicazioni – Via Nazionale, 91 – 00184 Rome(fax 0039 06 47922059). They are available on the Internet www.bancaditalia.it.

"TEMI" LATER PUBLISHED ELSEWHERE
1999
L. GUISO and G. PARIGI, Investment and demand uncertainty, Quarterly Journal of Economics, Vol. 114(1), pp. 185-228, TD No. 289 (November 1996).
A. F. POZZOLO, Gli effetti della liberalizzazione valutaria sulle transazioni finanziarie dell’Italia conl’estero, Rivista di Politica Economica, Vol. 89 (3), pp. 45-76, TD No. 296 (February 1997).
A. CUKIERMAN and F. LIPPI, Central bank independence, centralization of wage bargaining, inflation andunemployment: theory and evidence, European Economic Review, Vol. 43 (7), pp. 1395-1434,TD No. 332 (April 1998).
P. CASELLI and R. RINALDI, La politica fiscale nei paesi dell’Unione europea negli anni novanta, Studi enote di economia, (1), pp. 71-109, TD No. 334 (July 1998).
A. BRANDOLINI, The distribution of personal income in post-war Italy: Source description, data quality,and the time pattern of income inequality, Giornale degli economisti e Annali di economia, Vol.58 (2), pp. 183-239, TD No. 350 (April 1999).
L. GUISO, A. K. KASHYAP, F. PANETTA and D. TERLIZZESE, Will a common European monetary policyhave asymmetric effects?, Economic Perspectives, Federal Reserve Bank of Chicago, Vol. 23 (4),pp. 56-75, TD No. 384 (October 2000).
2000
P. ANGELINI, Are banks risk-averse? Timing of the operations in the interbank market, Journal ofMoney, Credit and Banking, Vol. 32 (1), pp. 54-73, TD No. 266 (April 1996).
F. DRUDI and R: GIORDANO, Default Risk and optimal debt management, Journal of Banking andFinance, Vol. 24 (6), pp. 861-892, TD No. 278 (September 1996).
F. DRUDI and R. GIORDANO, Wage indexation, employment and inflation, Scandinavian Journal ofEconomics, Vol. 102 (4), pp. 645-668, TD No. 292 (December 1996).
F. DRUDI and A. PRATI, Signaling fiscal regime sustainability, European Economic Review, Vol. 44 (10),pp. 1897-1930, TD No. 335 (September 1998).
F. FORNARI and R. VIOLI, The probability density function of interest rates implied in the price ofoptions, in: R. Violi, (ed.) , Mercati dei derivati, controllo monetario e stabilità finanziaria, IlMulino, Bologna, TD No. 339 (October 1998).
D. J. MARCHETTI and G. PARIGI, Energy consumption, survey data and the prediction of industrialproduction in Italy, Journal of Forecasting, Vol. 19 (5), pp. 419-440, TD No. 342 (December1998).
A. BAFFIGI, M. PAGNINI and F. QUINTILIANI, Localismo bancario e distretti industriali: assetto deimercati del credito e finanziamento degli investimenti, in: L.F. Signorini (ed.), Lo sviluppolocale: un'indagine della Banca d'Italia sui distretti industriali, Donzelli, TD No. 347 (March1999).
A. SCALIA and V. VACCA, Does market transparency matter? A case study, in: Market Liquidity:Research Findings and Selected Policy Implications, Basel, Bank for International Settlements,TD No. 359 (October 1999).
F. SCHIVARDI, Rigidità nel mercato del lavoro, disoccupazione e crescita, Giornale degli economisti eAnnali di economia, Vol. 59 (1), pp. 117-143, TD No. 364 (December 1999).
G. BODO, R. GOLINELLI and G. PARIGI, Forecasting industrial production in the euro area, EmpiricalEconomics, Vol. 25 (4), pp. 541-561, TD No. 370 (March 2000).
F. ALTISSIMO, D. J. MARCHETTI and G. P. ONETO, The Italian business cycle: Coincident and leadingindicators and some stylized facts, Giornale degli economisti e Annali di economia, Vol. 60 (2),pp. 147-220, TD No. 377 (October 2000).
C. MICHELACCI and P. ZAFFARONI, (Fractional) Beta convergence, Journal of Monetary Economics, Vol.45, pp. 129-153, TD No. 383 (October 2000).
R. DE BONIS and A. FERRANDO, The Italian banking structure in the nineties: testing the multimarketcontact hypothesis, Economic Notes, Vol. 29 (2), pp. 215-241, TD No. 387 (October 2000).
2001
M. CARUSO, Stock prices and money velocity: A multi-country analysis, Empirical Economics, Vol. 26(4), pp. 651-72, TD No. 264 (February 1996).
P. CIPOLLONE and D. J. MARCHETTI, Bottlenecks and limits to growth: A multisectoral analysis of Italianindustry, Journal of Policy Modeling, Vol. 23 (6), pp. 601-620, TD No. 314 (August 1997).
P. CASELLI, Fiscal consolidations under fixed exchange rates, European Economic Review, Vol. 45 (3),pp. 425-450, TD No. 336 (October 1998).
F. ALTISSIMO and G. L. VIOLANTE, Nonlinear VAR: Some theory and an application to US GNP andunemployment, Journal of Applied Econometrics, Vol. 16 (4), pp. 461-486, TD No. 338 (October1998).
F. NUCCI and A. F. POZZOLO, Investment and the exchange rate, European Economic Review, Vol. 45(2), pp. 259-283, TD No. 344 (December 1998).
L. GAMBACORTA, On the institutional design of the European monetary union: Conservatism, stabilitypact and economic shocks, Economic Notes, Vol. 30 (1), pp. 109-143, TD No. 356 (June 1999).
P. FINALDI RUSSO and P. ROSSI, Credit costraints in italian industrial districts, Applied Economics, Vol.33 (11), pp. 1469-1477, TD No. 360 (December 1999).
A. CUKIERMAN and F. LIPPI, Labor markets and monetary union: A strategic analysis, Economic Journal,Vol. 111 (473), pp. 541-565, TD No. 365 (February 2000).
G. PARIGI and S. SIVIERO, An investment-function-based measure of capacity utilisation, potential outputand utilised capacity in the Bank of Italy’s quarterly model, Economic Modelling, Vol. 18 (4),pp. 525-550, TD No. 367 (February 2000).
F. BALASSONE and D. MONACELLI, Emu fiscal rules: Is there a gap?, in: M. Bordignon and D. DaEmpoli (eds.), Politica fiscale, flessibilità dei mercati e crescita, Milano, Franco Angeli, TD No.375 (July 2000).
A. B. ATKINSON and A. BRANDOLINI, Promise and pitfalls in the use of “secondary" data-sets: Incomeinequality in OECD countries, Journal of Economic Literature, Vol. 39 (3), pp. 771-799, TD No.379 (October 2000).
D. FOCARELLI and A. F. POZZOLO, The determinants of cross-border bank shareholdings: An analysiswith bank-level data from OECD countries, Journal of Banking and Finance, Vol. 25 (12), pp.2305-2337, TD No. 381 (October 2000).
M. SBRACIA and A. ZAGHINI, Expectations and information in second generation currency crises models,Economic Modelling, Vol. 18 (2), pp. 203-222, TD No. 391 (December 2000).
F. FORNARI and A. MELE, Recovering the probability density function of asset prices using GARCH asdiffusion approximations, Journal of Empirical Finance, Vol. 8 (1), pp. 83-110, TD No. 396(February 2001).
P. CIPOLLONE, La convergenza dei salari manifatturieri in Europa, Politica economica, Vol. 17 (1), pp.97-125, TD No. 398 (February 2001).
E. BONACCORSI DI PATTI and G. GOBBI, The changing structure of local credit markets: Are smallbusinesses special?, Journal of Banking and Finance, Vol. 25 (12), pp. 2209-2237, TD No. 404(June 2001).
G. MESSINA, Decentramento fiscale e perequazione regionale. Efficienza e redistribuzione nel nuovosistema di finanziamento delle regioni a statuto ordinario, Studi economici, Vol. 56 (73), pp.131-148, TD No. 416 (August 2001).

2002
R. CESARI and F. PANETTA, Style, fees and performance of Italian equity funds, Journal of Banking andFinance, Vol. 26 (1), TD No. 325 (January 1998).
L. GAMBACORTA, Asymmetric bank lending channels and ECB monetary policy, Economic Modelling,Vol. 20 (1), pp. 25-46, TD No. 340 (October 1998).
C. GIANNINI, “Enemy of none but a common friend of all”? An international perspective on the lender-of-last-resort function, Essay in International Finance, Vol. 214, Princeton, N. J., PrincetonUniversity Press, TD No. 341 (December 1998).
A. ZAGHINI, Fiscal adjustments and economic performing: A comparative study, Applied Economics,Vol. 33 (5), pp. 613-624, TD No. 355 (June 1999).
F. ALTISSIMO, S. SIVIERO and D. TERLIZZESE, How deep are the deep parameters?, Annales d’Economieet de Statistique,.(67/68), pp. 207-226, TD No. 354 (June 1999).
F. FORNARI, C. MONTICELLI, M. PERICOLI and M. TIVEGNA, The impact of news on the exchange rate ofthe lira and long-term interest rates, Economic Modelling, Vol. 19 (4), pp. 611-639, TD No. 358(October 1999).
D. FOCARELLI, F. PANETTA and C. SALLEO, Why do banks merge?, Journal of Money, Credit andBanking, Vol. 34 (4), pp. 1047-1066, TD No. 361 (December 1999).
D. J. MARCHETTI, Markup and the business cycle: Evidence from Italian manufacturing branches, OpenEconomies Review, Vol. 13 (1), pp. 87-103, TD No. 362 (December 1999).
F. BUSETTI, Testing for stochastic trends in series with structural breaks, Journal of Forecasting, Vol. 21(2), pp. 81-105, TD No. 385 (October 2000).
F. LIPPI, Revisiting the Case for a Populist Central Banker, European Economic Review, Vol. 46 (3), pp.601-612, TD No. 386 (October 2000).
F. PANETTA, The stability of the relation between the stock market and macroeconomic forces, EconomicNotes, Vol. 31 (3), TD No. 393 (February 2001).
G. GRANDE and L. VENTURA, Labor income and risky assets under market incompleteness: Evidencefrom Italian data, Journal of Banking and Finance, Vol. 26 (2-3), pp. 597-620, TD No. 399(March 2001).
A. BRANDOLINI, P. CIPOLLONE and P. SESTITO, Earnings dispersion, low pay and household poverty inItaly, 1977-1998, in D. Cohen, T. Piketty and G. Saint-Paul (eds.), The Economics of RisingInequalities, pp. 225-264, Oxford, Oxford University Press, TD No. 427 (November 2001).
L. CANNARI and G. D’ALESSIO, La distribuzione del reddito e della ricchezza nelle regioni italiane,Rivista Economica del Mezzogiorno (Trimestrale della SVIMEZ), Vol. XVI (4), pp. 809-847, IlMulino, TD No. 482 (June 2003).
2003
F. SCHIVARDI, Reallocation and learning over the business cycle, European Economic Review, , Vol. 47(1), pp. 95-111, TD No. 345 (December 1998).
P. CASELLI, P. PAGANO and F. SCHIVARDI, Uncertainty and slowdown of capital accumulation in Europe,Applied Economics, Vol. 35 (1), pp. 79-89, TD No. 372 (March 2000).
P. ANGELINI and N. CETORELLI, The effect of regulatory reform on competition in the banking industry,Federal Reserve Bank of Chicago, Journal of Money, Credit and Banking, Vol. 35, pp. 663-684,TD No. 380 (October 2000).

P. PAGANO and G. FERRAGUTO, Endogenous growth with intertemporally dependent preferences,Contribution to Macroeconomics, Vol. 3 (1), pp. 1-38, TD No. 382 (October 2000).
P. PAGANO and F. SCHIVARDI, Firm size distribution and growth, Scandinavian Journal of Economics,Vol. 105 (2), pp. 255-274, TD No. 394 (February 2001).
M. PERICOLI and M. SBRACIA, A Primer on Financial Contagion, Journal of Economic Surveys, Vol. 17(4), pp. 571-608, TD No. 407 (June 2001).
M. SBRACIA and A. ZAGHINI, The role of the banking system in the international transmission of shocks,World Economy, Vol. 26 (5), pp. 727-754, TD No. 409 (June 2001).
E. GAIOTTI and A. GENERALE, Does monetary policy have asymmetric effects? A look at the investmentdecisions of Italian firms, Giornale degli Economisti e Annali di Economia, Vol. 61 (1), pp. 29-59, TD No. 429 (December 2001).
L. GAMBACORTA, The Italian banking system and monetary policy transmission: evidence from banklevel data, in: I. Angeloni, A. Kashyap and B. Mojon (eds.), Monetary Policy Transmission in theEuro Area, Cambridge, Cambridge University Press, TD No. 430 (December 2001).
M. EHRMANN, L. GAMBACORTA, J. MARTÍNEZ PAGÉS, P. SEVESTRE and A. WORMS, Financial systems andthe role of banks in monetary policy transmission in the euro area, in: I. Angeloni, A. Kashyapand B. Mojon (eds.), Monetary Policy Transmission in the Euro Area, Cambridge, CambridgeUniversity Press, TD No. 432 (December 2001).
F. SPADAFORA, Financial crises, moral hazard and the speciality of the international market: furtherevidence from the pricing of syndicated bank loans to emerging markets, Emerging MarketsReview, Vol. 4 ( 2), pp. 167-198, TD No. 438 (March 2002).
D. FOCARELLI and F. PANETTA, Are mergers beneficial to consumers? Evidence from the market for bankdeposits, American Economic Review, Vol. 93 (4), pp. 1152-1172, TD No. 448 (July 2002).
E.VIVIANO, Un’analisi critica delle definizioni di disoccupazione e partecipazione in Italia, PoliticaEconomica, Vol. 19 (1), pp. 161-190, TD No. 450 (July 2002).
M. PAGNINI, Misura e Determinanti dell’Agglomerazione Spaziale nei Comparti Industriali in Italia,Rivista di Politica Economica, Vol. 3 (4), pp. 149-196, TD No. 452 (October 2002).
F. BUSETTI and A. M. ROBERT TAYLOR, Testing against stochastic trend and seasonality in the presenceof unattended breaks and unit roots, Journal of Econometrics, Vol. 117 (1), pp. 21-53, TD No.470 (February 2003).
2004
F. LIPPI, Strategic monetary policy with non-atomistic wage-setters, Review of Economic Studies, Vol. 70(4), pp. 909-919, TD No. 374 (June 2000).
P. CHIADES and L. GAMBACORTA, The Bernanke and Blinder model in an open economy: The Italiancase, German Economic Review, Vol. 5 (1), pp. 1-34, TD No. 388 (December 2000).
M. BUGAMELLI and P. PAGANO, Barriers to Investment in ICT, Applied Economics, Vol. 36 (20), pp.2275-2286, TD No. 420 (October 2001).
A. BAFFIGI, R. GOLINELLI and G. PARIGI, Bridge models to forecast the euro area GDP, InternationalJournal of Forecasting, Vol. 20 (3), pp. 447-460,TD No. 456 (December 2002).
D. AMEL, C. BARNES, F. PANETTA and C. SALLEO, Consolidation and Efficiency in the Financial Sector:A Review of the International Evidence, Journal of Banking and Finance, Vol. 28 (10), pp. 2493-2519, TD No. 464 (December 2002).
M. PAIELLA, Heterogeneity in financial market participation: appraising its implications for the C-CAPM, Review of Finance, Vol. 8, pp. 1-36, TD No. 473 (June 2003).
E. BARUCCI, C. IMPENNA and R. RENÒ, Monetary integration, markets and regulation, Research inBanking and Finance, (4), pp. 319-360, TD NO. 475 (June 2003).

E. BONACCORSI DI PATTI and G. DELL’ARICCIA, Bank competition and firm creation, Journal of MoneyCredit and Banking, Vol. 36 (2), pp. 225-251, TD No. 481 (June 2003).
R. GOLINELLI and G. PARIGI, Consumer sentiment and economic activity: a cross country comparison,Journal of Business Cycle Measurement and Analysis, Vol. 1 (2), pp. 147-172, TD No. 484(September 2003).
L. GAMBACORTA and P. E. MISTRULLI, Does bank capital affect lending behavior?� Journal of FinancialIntermediation, Vol. 13 (4), pp. 436-457, TD NO. 486 (September 2003).
F. SPADAFORA, Il pilastro privato del sistema previdenziale: il caso del Regno Unito, Rivista EconomiaPubblica, (5), pp. 75-114, TD No. 503 (June 2004).
G. GOBBI e F. LOTTI, Entry decisions and adverse selection: an empirical analysis of local creditmarkets, Journal of Financial services Research, Vol. 26 (3), pp. 225-244, TD NO. 535(December 2004).
F. CINGANO e F. SCHIVARDI, Identifying the sources of local productivity growth, Journal of the EuropeanEconomic Association, Vol. 2 (4), pp. 720-742, TD NO. 474 (June 2003).
C. BENTIVOGLI e F. QUINTILIANI, Tecnologia e dinamica dei vantaggi comparati: un confronto fraquattro regioni italiane� in C. Conigliani (a cura di), Tra sviluppo e stagnazione: l’economiadell’Emilia-Romagna, Bologna, Il Mulino, TD NO. 522 (October 2004).
2005
A. DI CESARE, Estimating Expectations of Shocks Using Option Prices, The ICFAI Journal of DerivativesMarkets, Vol. II (1), pp. 42-53, TD No. 506 (July 2004).
M. OMICCIOLI, Il credito commerciale: problemi e teorie, in L. Cannari, S. Chiri e M. Omiccioli (a curadi), Imprese o intermediari? Aspetti finanziari e commerciali del credito tra imprese in Italia,Bologna, Il Mulino, TD NO. 494 (June 2004).
L. CANNARI, S. CHIRI e M. OMICCIOLI, Condizioni del credito commerciale e differenzizione dellaclientela, in L. Cannari, S. Chiri e M. Omiccioli (a cura di), Imprese o intermediari? Aspettifinanziari e commerciali del credito tra imprese in Italia, Bologna, Il Mulino, TD NO. 495 (June2004).
P. FINALDI RUSSO e L. LEVA, Il debito commerciale in Italia: quanto contano le motivazioni finanziarie?,in L. Cannari, S. Chiri e M. Omiccioli (a cura di), Imprese o intermediari? Aspetti finanziari ecommerciali del credito tra imprese in Italia, Bologna, Il Mulino, TD NO. 496 (June 2004).
A. CARMIGNANI, Funzionamento della giustizia civile e struttura finanziaria delle imprese: il ruolo delcredito commerciale, in L. Cannari, S. Chiri e M. Omiccioli (a cura di), Imprese o intermediari?Aspetti finanziari e commerciali del credito tra imprese in Italia, Bologna, Il Mulino, TD NO.497 (June 2004).
G. DE BLASIO, Does trade credit substitute for bank credit?, in L. Cannari, S. Chiri e M. Omiccioli (a curadi), Imprese o intermediari? Aspetti finanziari e commerciali del credito tra imprese in Italia,Bologna, Il Mulino, TD NO. 498 (June 2004).
M. BENVENUTI e M. GALLO, Perché le imprese ricorrono al factoring? Il caso dell'Italia, in L. Cannari, S.Chiri e M. Omiccioli (a cura di), Imprese o intermediari? Aspetti finanziari e commerciali delcredito tra imprese in Italia, Bologna, Il Mulino, TD NO. 518 (October 2004).