december 2017 equity sector outlook - wachovia … 2017 equity sector outlook ... and an increase in...
TRANSCRIPT

1
December 2017
Equity Sector OutlookWells Fargo Advisors Equity Sector Analysts
OverviewAs we enter 2018, we believe a number of market sectors are poised to benefit from the current economic environment. In line with forecasts from the Wells Fargo Investment Institute (WFII), we anticipate stable economic growth aided by a recovery in manufacturing. Industrials should benefit if many end
markets continue to recover from depressed levels as we expect. The strong economic environment, coupled with low unemployment, will likely lead to increased interest rates which should, in turn, benefit the Financials sector. Decreased regulation, improved economic activity, and an increase in capital returns may also benefit the Financials sector. These conditions allow us to be increasingly more comfortable with the diversified banks and property and casualty insurance companies. We anticipate another year of regulatory “suspense” as the Trump administration embarks on a major tax reform effort. If tax reform is implemented, a number of sectors are poised to benefit. The Information Technology and Health Care sectors are anticipated to benefit the most from potential tax relief for companies that have cash to repatriate back into the U.S. from their overseas operations. More importantly, tax reform should in theory incrementally benefit the Financials and Industrials sectors as tax relief trickles through the economy.We expect the administration may turn its attention back to health care later in 2018. We maintain our position that the continued efforts to repeal and replace the ACA are neutral to positive for the Health Care sector but uncertainties still remain.The e-commerce theme should continue to play a strong role in 2018 and create pressures related to substitution and price transparency and the evolving effect of the new laptop: the mobile device. We believe the applications of this technology to be in the early innings. Additionally, we expect the Information Technology sector to benefit as businesses continue transitioning computing and storage needs to the cloud. Finally, we cannot ignore the pressure that a rising interest rate environment can have on the more income-oriented sectors like Utilities, Telecommunications Services, Real Estate, and Consumer Staples. We continue to favor companies that exhibit financial stability and consistently growing dividends, notwithstanding the rising interest rates.
Prepared By:Joseph Buffa Equity Sector Analyst Utilities Telecommunications Services
Thomas Christopher Equity Sector Analyst Information Technology
Michael Colón Equity Sector Analyst, Team Lead Health Care
Ian Mikkelsen Associate Analyst
Daniel Moisio, CFAEquity Sector Analyst Energy Financials
Lawrence Pfeffer, CFAEquity Sector Analyst Industrials Materials
Brian Postol Equity Sector Analyst Consumer Discretionary
Jack Russo, CFAEquity Sector Analyst Consumer Staples
John Sheehan, CFAEquity Sector Analyst Real Estate
Global Industry Classification Standard (GICS) Industry Guidance
Sector More Favorable Less FavorableOverweight Consumer Discretionary Internet Retail; Apparel Retail; Home Improvement Department Stores
Financials Diversified Banks; Insurance Regional and Sub-Regional Banks
Health Care Pharmaceuticals; Medical Devices Generic Pharma; Health Care Technology
Industrials Machinery Conglomerates; Aerospace and Defense
Evenweight Information Technology Semiconductors & Semiconductor Equipment; Internet Software & Services; Software
Hardware Storage; Computer Peripherals
Materials Chemicals Metals and Mining
Real Estate Cell Tower and Data Centers; Shorter-Lease term REITs (Manufactured Housing and Self-Storage)
REITs with Longer-Lease Terms (Triple Net Lease and Health Care REITs)
Telecom Services Integrated Alternative
Underweight Consumer Staples Beverages; Tobacco Food
Energy Integrated Oil Cos; Well Capitalized E&Ps; Well Capitalized MLPs Coal; E&Ps with High Leverage; MLPs with Low Distribution Coverage or High Leverage; Offshore Drillers
Utilities Electric, Multi Water, Gas
Source: Wells Fargo Advisors. Sector weights as recommended by Wells Fargo Investment Institute. As of 12/04/2017.
2018 Equity Sector Weighting Guidance
Investment and Insurance Products: NOT FDIC Insured NO Bank Guarantee MAY Lose Value

2
EQUITY SECTOR OUTLOOK
WHERE TO INVEST IN 2018The proliferation of online shopping has been a disruptive force to brick and mortar retailers and decreased mall traffic — due largely to millennial purchasing habits, which are expected to continue to pressure sector margins. Because mobile devices are becoming the new laptops, consumers are increasingly able to comparison shop from virtually any location, and purchase goods based purely on the lowest prices or added benefits, such as free shipping and rewards incentives. Traditional retailers and weaker brands should continue to face challenges of decreased store traffic and deflationary e-commerce pressures. We witnessed accelerated store closures in 2017 as retailers attempted to navigate the shift to online. In 2017 alone, more than a dozen retailers announced bankruptcies while more than 20 announced individual store closure plans of at least 100 locations according to the National Retail Federation. While the pace of store closures has been well documented, the U.S. remains saturated well above other major economies in terms of retail square foot per capita. Given tepid same-store sales trends across department stores and apparel retailers, the data would suggest that further closings and footprint reductions remain likely, particularly for retailers/brands over-exposed to traditional shopping malls. We believe strong brand allegiance can protect many companies against substitution. Further, companies that control the distribution (i.e., vertically integrated) and pricing of goods are better equipped to maintain strong sales margins, in our opinion. It is our view that these companies offer the potential for the best sales and earnings growth potential in 2018 and beyond. We view Internet Retail as a preferred sub-industry, while recommending avoidance of sub-standard Department Store competitors. Other sub-industries we see having wide moats to combat e-commerce penetration are Home Improvement, Automotive Aftermarket Retail, Off-Price Retail, and leading brand Apparel Manufacturers.
SECTOR DRIVERS AND THEMES FOR 2018 We view the growth of e-commerce as the most disruptive occurrence related to consumer lifestyle and consumption habits today. Internet-based retail gives consumers the ability to identify and purchase goods based on obtaining the lowest price. Additional incentives, such as free shipping and corporate rewards incentives help retail companies create strong customer brand allegiances. This leads us to
believe that companies that can effectively manage the distribution and pricing of their products are increasingly attractive. The pressures of substitution and price transparency aren’t limited to the retail industry. In the media category for example, traditional subscription cable providers are being pressured by a trend known as “cord cutting.” The option to avoid or drop cable service has grown in popularity and has been driven largely by millennials.
CONSUMER DISCRETIONARY
2017 PERFORMANCEThe Consumer Discretionary sector outperformed the broader market year-to-date led by strong performance from the Internet Retail sub-industry. Anything related to apparel — Textiles, Multiline Retail, and Specialty Retail — have all posted weak year-to-date returns as investors brace for further retail store closings. We believe this dichotomy between e-commerce and physical retail will continue to widen — albeit not at the rate experienced during 2017.
POTENTIAL TAILWINDS AND HEADWINDSLow gas prices and an improving job market should provide consumers with increased disposable income. On the flip side, higher wages are a catch-22 for the Consumer Discretionary sector. On one hand, higher wages are positive overall for the U.S. economy and for consumer spending. However, sectors and industries with a high labor component (e.g., Restaurants, Hotels/Resorts/Cruises, Retail, and Advertising) will generally receive less incremental benefit given the increased operating expense impact on profits due to higher wages.
Same Store Sales, year-over-year change: Off-Price Retailers vs. Department Stores
Q217
Q416
Q216
Q415
Q215
Q414
Q214
Q413
Q213
Q412
Q212
Q411
Q211
Q410
Q210
Q409
Q209
Q408
Q208
Q407
Q207
-10.00%
-5.00%
0.00%
5.00%
10.00%
15.00%
– Off-Price Retailers – Department Stores
Over the past ten years, the Off-Price retailers have consistently taken market share from the Department Store segment in every period — except for a short-time frame in 2010 – 2011 — with peak spreads reaching double-digits. Source: FactSet. Composite figures are weighted by total sales. Off-Price Retailers composite consists of T.J. Maxx, Ross Stores, and Burlington Stores. Department Stores composite consists of Macy’s, Dillard’s, JCPenney, and Kohl’s.
Data Set: 2nd Quarter 2007 through 2nd Quarter 2017.
Past performance is no guarantee of future results.
3
EQUITY SECTOR OUTLOOK
WHERE TO INVEST IN 2018Broadly speaking, we remain selective in our views across the Consumer Staples sector. This is due to above average valuations, the likelihood of rising interest rates which could hurt higher price to earnings (P/E) stocks and potential market share disruption from private label competition and the e-commerce threat. The ongoing domestic economic recovery, rising wages, and low unemployment all bode well for continued growth in consumer spending although some of the spending may go towards more cyclically-based products.Subsectors that could fare well in 2018 are those with stronger sales growth aided by pricing power, meaningful emerging market presence, and products that could benefit from the ongoing interest in overall health and wellness. We believe the beverage sector could benefit given its refocus in growing noncarbonated beverages (water, teas, sports drinks, and juices) that represent more healthy choices. Household product companies, while maintaining higher valuations, are seeing relatively stronger sales growth too versus consumer staples peers, particularly those in the beauty and personal care categories.We remain cautious on packaged food stocks given their recent weak sales and earnings growth. P/E multiples in food have compressed considerably and combined with relatively low interest rates and higher cash stockpiles on corporate balance sheets, merger and acquisition (M&A) potential and consolidation could accelerate. In addition, corporate tax reform could benefit these companies more than other consumer staples names given their domestic geographic focus.
SECTOR DRIVERS AND THEMES FOR 2018 In our opinion, there are at least three factors likely to drive performance in the Consumer Staples sector in 2018: stable (albeit low) growth, attractive returns, and solid countercyclical share-price performance. The sector offers stable earnings growth opportunities across economic cycles and the high-return nature of these businesses
usually delivers excess free cash flow after funding operations. Consumers are staples purchasers regardless of the state of the economy, making Consumer Staples minimally cyclical. Therefore, the stocks afford countercyclical relative price performance, providing rationale to own the sector for both absolute return and diversification. In our opinion, the benefits felt from lower gas prices, higher minimum wage rates, and improving employment all bode well for sustainable and growing consumer spending trends.
CONSUMER STAPLES
2017 PERFORMANCEGiven strength in the global economy, investors should not be surprised the Consumer Staples sector has underperformed the S&P 500. The market has favored growth over the defensive qualities Consumer Staples companies provide. Strength occurred in household products, beverages, and international tobacco, while packaged food (due to online retail’s new presence in grocery) and domestic tobacco (due to potential FDA regulation on nicotine levels) lagged.
POTENTIAL TAILWINDS AND HEADWINDSThe ongoing economic recovery should help keep consumer spending patterns relatively stable. Additional tailwinds include steady cash flow generation supported by consumer staples product and geographic diversification, potential merger and acquisitions, and the perceived flight to safety trade if market volatility picks up. The biggest potential headwind could be rising interest rates causing additional U.S. dollar strength, which in turn would potentially make higher dividend yields look relatively less attractive. Other headwinds could include rising commodity costs and pricing compression from increasing private label competition.
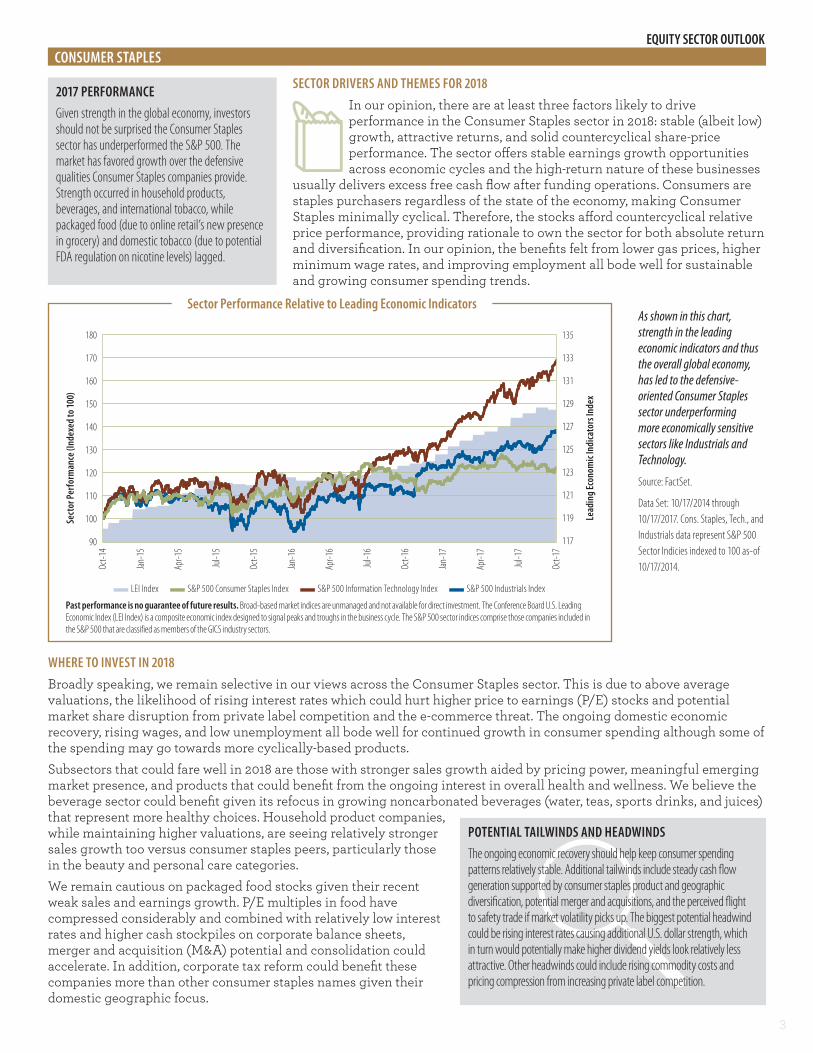
Sector Performance Relative to Leading Economic Indicators
117
119
121
123
125
127
129
131
133
135
90
100
110
120
130
140
150
160
170
180
Oct-1
4
Jan-1
5
Apr-1
5
Jul-1
5
Oct-1
5
Jan-1
6
Apr-1
6
Jul-1
6
Oct-1
6
Jan-1
7
Apr-1
7
Jul-1
7
Oct-1
7
– LEI Index – S&P 500 Consumer Staples Index – S&P 500 Information Technology Index – S&P 500 Industrials Index
Sect
or Pe
rform
ance
(Ind
exed
to 10
0)
Lead
ing E
cono
mic
Indi
cato
rs In
dex
As shown in this chart, strength in the leading economic indicators and thus the overall global economy, has led to the defensive-oriented Consumer Staples sector underperforming more economically sensitive sectors like Industrials and Technology.
Source: FactSet.
Data Set: 10/17/2014 through 10/17/2017. Cons. Staples, Tech., and Industrials data represent S&P 500 Sector Indicies indexed to 100 as-of 10/17/2014.
Past performance is no guarantee of future results. Broad-based market indices are unmanaged and not available for direct investment. The Conference Board U.S. Leading Economic Index (LEI Index) is a composite economic index designed to signal peaks and troughs in the business cycle. The S&P 500 sector indices comprise those companies included in the S&P 500 that are classified as members of the GICS industry sectors.
4
EQUITY SECTOR OUTLOOK
WHERE TO INVEST IN 2018We favor integrated oil companies, given their current stable cash flows, reasonable yields, and balance sheet strength. We believe these companies are destined to underperform the broader energy sector in periods of rapidly rising commodity prices. For more direct commodity price exposure, we maintain our positive outlook on well capitalized, upstream exploration and production names operating in low cost U.S. shale basins. Producers in the U.S. in particular have benefited from dramatic declines in the cost of production, which has increased the net asset value (NAV) estimates of resource bases, and is increasingly driving increased drilling activity. In the MLP space, our experience in 2017 was worse than expected as a number of firms we considered to be of reasonable or even high quality have produced lower than expected returns. In many cases, MLP equities are trading at levels that pressure the historic business model of issuing equity to fund growth, prompting many to engage in distribution cuts, in some cases for a second time since the energy downturn began. We are more selective than before in recommending MLPs with our biases for moving up in quality.As has been the case for the past two years, we remain less favorable to exploration and production names with high cost production, limited financial flexibility, and the need for ongoing gains in commodity prices to survive, particularly upstream MLPs. We also remain less favorable to the offshore drilling and oil tanker and marine MLP sub-groups. Both continue to suffer from oversupply and even in the event of an end-market recovery, we see low visibility to sustained strong returns on capital among these industries.
SECTOR DRIVERS AND THEMES FOR 2018The price performance of energy equities largely tracked the price changes in crude oil through the first three quarters of 2017. Looking out to 2018, we continue to believe that the prices of energy equities will be led by energy commodity prices. With the outlook for both crude oil and natural gas prices being lower for the foreseeable future,
including the WFII’s crude oil price target which is below current trading levels, we expect another difficult year for energy equities in 2018.
ENERGY
2017 PERFORMANCEThe Energy sector has been the second worst performer in the S&P 500 year-to-date. Losses were led by more volatile sub-industries, with drillers the worst performers, followed by equipment and services, and exploration and production names. Our favored sub-industry of integrated oil companies (IOCs) mitigated losses despite the poor environment in energy. The large-cap mid-stream master limited partnerships (MLPs) did not prove as defensive as we had hoped in 2017.
POTENTIAL TAILWINDS AND HEADWINDSOil and natural gas prices pose the biggest potential headwind for the Energy Sector. Ironically, lower for longer prices would likely support our industry preference on a relative basis, hence our preference for Integrated Oil Companies (IOCs). While the biggest potential tailwind is that the sector as whole is likely to perform ahead of the market in an environment where the energy commodity prices strengthen significantly.
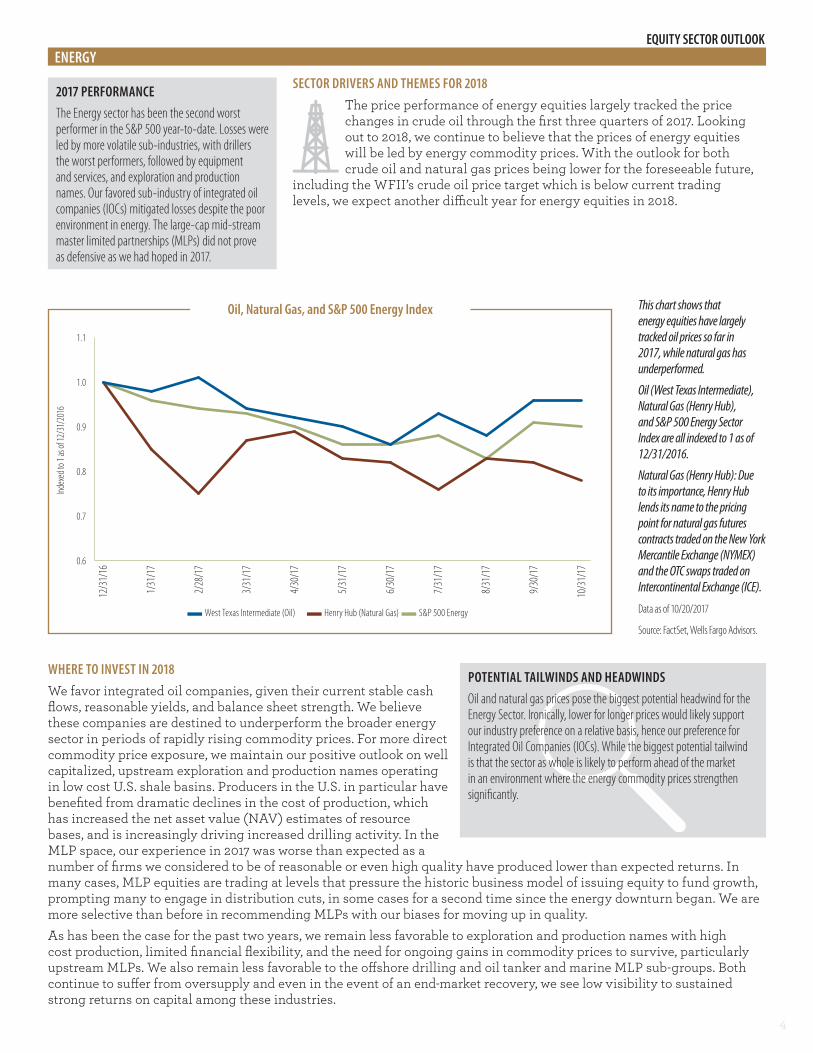
Oil, Natural Gas, and S&P 500 Energy Index
0.6
0.7
0.8
0.9
1.0
1.1
10/3
1/17
9/30
/17
8/31
/17
7/31
/17
6/30
/17
5/31
/17
4/30
/17
3/31
/17
2/28
/17
1/31
/17
12/3
1/16
– West Texas Intermediate (Oil) – Henry Hub (Natural Gas) – S&P 500 Energy
This chart shows that energy equities have largely tracked oil prices so far in 2017, while natural gas has underperformed.
Oil (West Texas Intermediate), Natural Gas (Henry Hub), and S&P 500 Energy Sector Index are all indexed to 1 as of 12/31/2016.
Natural Gas (Henry Hub): Due to its importance, Henry Hub lends its name to the pricing point for natural gas futures contracts traded on the New York Mercantile Exchange (NYMEX) and the OTC swaps traded on Intercontinental Exchange (ICE).
Data as of 10/20/2017
Source: FactSet, Wells Fargo Advisors.
Index
ed to
1 as
of 12
/31/
2016

5
EQUITY SECTOR OUTLOOK
WHERE TO INVEST IN 2018Recent stronger economic activity in the United States, and globally, has modestly increased our outlook for key drivers of Financial sector performance, including loan growth, asset prices, and interest rate increases. Competition in the banking sector continues to be fierce, and results from the third quarter of 2017 indicate that many institutions are being forced to trade between loan growth and net interest margins. Looking out through 2018, we are modestly shifting our view to focus less on the direction of interest rates, and more on which businesses we believe will be well positioned to grow earnings regardless of the interest rate and market environment. Given that, we are emphasizing insurance companies, particularly property/casualty insurers, as well as large, diversified banks as the best opportunities to invest in 2018.Previously, our investment thesis on the Financial sector revolved around positioning relative to interest rates, with a focus on a barbell approach of low interest rate sensitive names such as property/casualty insurers, and high interest rate sensitive names such as life insurers. Our updated thinking on positioning does not change our sector focus meaningfully. In particular, our updated focus on diversified banks reiterates individual stock ideas we have supported, but our increasing comfort with the names is based on the fact that a combination of lessened regulation, better economic activity, and significant recent increases in capital returns following the Federal Reserve’s Comprehensive Capital Analysis and Review (CCAR) process — all of which we believe play to the benefit of the largest U.S. banks. Moreover, the operational diversity of these institutions can help to defray the potential earnings impact in the event of a market correction, downward interest rate reversion, and/or economic slowdown.
SECTOR DRIVERS AND THEMES FOR 2018Interest rates are critical to Financial sector performance and are a key driver of return-on-equity, particularly for banks and life insurers. We expect stronger economic growth and lower unemployment to translate into higher interest rates to the benefit
of the Financial sector. Stronger economic activity could also increase loan demand and potentially benefit banks. Other key themes emerged in 2017 including deregulation and tax policy reform. We believe the relative performance of Financials compared to the broader markets will be stronger if tax reform passes. On the regulatory front, the Trump administration’s looser policies are a potential positive for the Financial sector.
FINANCIALS
2017 PERFORMANCEThrough the end of September 2017, Financial sector performance was in line with the S&P 500. Following strength early in 2017, starting in mid-March a slide in interest rates and flattening of the yield curve hurt the performance of most financial equities. However, September was a strong month for financials, with the sector returning 5% which was helped by improvements in the economic outlook and rising interest rates.
POTENTIAL TAILWINDS AND HEADWINDSNew regulations, including the Department of Labor fiduciary standards rule could have a meaningful impact on many of the asset managers and brokerage firms creating potential headwinds for the sector. A highly competitive lending environment is pressuring return on equity for banks. Potential tailwinds may be a more favorable regulatory environment for financial institutions, which have spent much of the last decade reacting to a more restrictive and costly regulatory burden.
S&P 500 Financials Indices by GICS Industry Relative Performance vs. S&P 500 and 10-Year Treasury Yield
0.80
0.85
0.90
0.95
1.00
1.05
2.0%
2.1%
2.2%
2.3%
2.4%
2.6%
Oct-1
7
Sep-
17
Aug-
17
Jul-1
7
Jun-
17
May-
17
Apr-1
7
Mar-1
7
Feb-
17
Jan-1
7
Dec-1
6
– U.S. Ten Year Treasury Yield – S&P 500 Capital Markets Index – S&P 500 Insurance Index
– S&P 500 Banks Index – S&P 500 Consumer Finance Index
U.S.
10-Y
ear T
reas
ury (
%)
GICS
Indu
stry
Rel
ativ
e Per
form
ance
vs. S
&P 50
0
As shown in this chart, financial industry indices have largely followed 10-year Treasury yields in terms of relative performance.
An index is unmanaged and not available for direct investment.
Indexed to 1 as of 12/31/2016
Source: FactSet, Wells Fargo Advisors.
As of: 10/20/2017
For illustrative purposes only. Past performance is no guarantee of future results. An index is unmanaged and not available for direct investment.

6
EQUITY SECTOR OUTLOOK
WHERE TO INVEST IN 2018We anticipate that any successful efforts at tax and/or health care reform will occur in 2018. We continue to see an appetite for M&A in the sector, and believe a tax repatriation relief of cash (bringing cash back into the U.S. from foreign subsidiaries at a lower tax rate) could provide additional capital to invest to some companies; even though in the last repatriation holiday (2004) it is estimated most repatriated money went to share buybacks. Either way, the additional lower-taxed cash is anticipated to add to the companies’ ability to reinvest in their businesses. The Health Care sector is poised to be one of the top beneficiaries from the tax repatriation relief (second to the Technology sector), as they were in 2004. Even though uncertainty surrounding the “if, how, and when” of tax and health care reform are giving companies pause, we believe that companies within many of the sub-industries in the Health Care sector have a continued appetite to make acquisitions. We favor the pharmaceutical sub-industry notwithstanding rhetoric of pharmaceutical pricing may continue to emerge on occasion. We believe continued focus on streamlining pipelines and expanding research and development will continue to drive the sub-industry. Additionally, we remain positive on the medical equipment sub-industry and anticipate any health care reform may be positive for the industry. Finally, although on the higher valuation side of the sector’s spectrum, we continue to favor large diversified managed care companies that can manage the exposure to changes within the health care legislative reform efforts. We believe the potential elimination of industry fees as part of ACA reform will also benefit both the medical equipment and managed care sub-industries.
SECTOR DRIVERS AND THEMES FOR 2018In our opinion, efforts to reform the health care system will continue to be an underlying theme driving the sector for the foreseeable future. Although taking a bit of a respite after yet another failed attempt, we anticipate that repeal and replace of the Affordable Care
Act (ACA) will remain a focus in 2018 — after the Trump administration tackles tax reform. The general direction that the current administration seems to be heading may result in having a neutral to positive impact on the sector on a net basis. The potential of tax reform could potentially aid companies in their efforts as they continue to focus on growing their franchises, filing pipelines, and returning value to shareholders.
HEALTH CARE
2017 PERFORMANCEIn a trend reversal from 2016, the Health Care sector has been one of the best performing sectors of the S&P 500 in 2017. Concern surrounding the impact of health care reform continues to shift from one sub-industry to another. We anticipate that major themes for the sector during 2018 will continue to be centered on health care reform efforts and on the sector’s focus on growth through investments and their businesses.
POTENTIAL TAILWINDS AND HEADWINDSCatalysts for the sector will likely take the form of new product approvals and data flow resulting from pharmaceutical, biotechnology, and medical device product research. We believe M&A will become more company specific and focused as we head into 2018.On the flip side, we could see some significant headwinds in particular as it relates to clarity behind further repeal and replace of ACA efforts, postponed tax reform legislation, and any increased rhetoric pertaining to pharmaceutical product pricing.
Percent of Qualifying Funds Repatriated in 2004 by Industry by Top 15 Repatriators
Pharmaceuticals28%
Technology11%
ConsumerStaples
8%
OtherRepatriatingCorporations
51%
Chemicals2%
A repatriation tax relief of cash held overseas is anticipated to be dominated by companies within the health care and technology sectors once again mirroring the 2004 repatriation outcome. Healthcare dollars held overseas are currently estimated to surpass 16% of total cash held overseas.
The top 15 repatriators in 2004 were Altria, Bristol-Myers, Coca-Cola, DuPont, Eli Lilly, Hewlett Packard, IBM, Intel, Johnson & Johnson, Merck, Oracle, PepsiCo, Pfizer, Procter & Gamble, and Schering-Plough.
Source: U.S. Senate Permanent Subcommittee on Investigations data, October 11, 2011.

7
EQUITY SECTOR OUTLOOK
WHERE TO INVEST IN 2018We continue to view machinery as more favorable in this context with order activity in many end markets not yet back to replacement levels and with most companies continuing to reap savings from cost saving actions and continuous improvement programs. Global capital expenditures still remain relatively subdued, especially in large process industries (i.e., oil and gas, mining) as well as infrastructure, leaving the potential for upside from additional end markets in the coming quarters and years. We are particularly favorable on the construction/agricultural/heavy truck machinery sub-industries due to rebounding production rates in these areas. We will be monitoring the machinery group closely over the course of the year as the cycle continues to mature, but we remain most comfortable with this sector in terms of relative performance at current valuations. We remain neutral on transports largely due to valuations, although the outlook is more favorable for the sector than it has been for some time given the alleviation of excess supply in various modes during 2017. We continue to view the aerospace and defense sub-industry less favorably due to historically elevated absolute and relative valuation multiples against the backdrop of what we expect to be peaking commercial order activity. We also see conglomerates as relatively less attractive entering 2018 due to valuation expansion in recent quarters, as well as less exposure for this group to improving momentum in more cyclical areas of the industrial economy.
SECTOR DRIVERS AND THEMES FOR 2018We expect 2018 to be a more “normal” year for the broader industrial sector with demand having now bounced off of cyclical lows in most markets and restocking activity largely complete. We anticipate more modest revenue growth and lower incremental margins as the early cycle recovery in oil and gas, mining, and
China, more generally, will largely have played out by the end of 2017. We still see a solid 2018 as most end markets remain well below replacement rates, the U.S. dollar has receded from cycle highs and commodity prices have firmed. We would generally expect slightly above market earnings growth from the Industrial sector in 2018 driven by improving order activity and continued benefits from restructuring activity.
INDUSTRIALS
2017 PERFORMANCEIn our 2017 Outlook report, we were more favorable on conglomerates and less favorable on the machinery and transportation sectors. In our 2017 Midyear Outlook, we adjusted our positioning, moving to more favorable on machinery and less favorable on aerospace and defense. As of October 2017, conglomerates have been the worst performing industrial sub-sector while aerospace and defense has been the best performing. Since our midyear repositioning, machinery has outperformed both the sector and the market.
POTENTIAL TAILWINDS AND HEADWINDSWe view the greatest risks to the sector as a stronger U.S. dollar, a greater degree of softening in China than is expected, rising protectionism, and unexpected weakness in demand for consumer durable goods in developed economies. Potential tailwinds would include a weaker U.S. dollar, higher commodity prices, increased investment in China, above trend growth in Europe, tax reform in the U.S., and stronger consumer spending.
Global Industrial Activity
-20.0%
-15.0%
-10.0%
-5.0%
0.0%
5.0%
10.0%
30
35
40
45
50
55
60
Apr-0
7
Feb-
08
Dec-0
8
Oct-0
9
Aug-
10
Jun-
11
Apr-1
2
Feb-
13
Dec-1
3
Oct-1
4
Aug-
15
Jun-
16
Apr-1
7
– Global Manufacturing PMI advanced three months (left side) – Global Industrial Production three month moving average (right side)
Global purchasing manager surveys point toward accelerating growth in industrial production into 2018, which should result in rising build rates for many types of machinery and support above market earnings growth.
Source: J.P. Morgan, Markit, Netherlands Bureau for Economic Policy Analysis.
PMI Surveys track sentiment among purchasing managers at manufacturing, construction, and/or services firms. An overall sentiment index is generally calculated from the results of queries on production, orders, inventories, employment, prices, etc.

8
EQUITY SECTOR OUTLOOK
WHERE TO INVEST IN 2018The transition to the cloud, in our opinion, represents a generational shift within the industry, as businesses of all shapes and sizes continue to transition their data information to the cloud. We are likely in the early years of a multi-decade migration to the cloud. The largest cloud vendors should maintain their dominance within the space, as they invest capital to build massive data centers with cutting-edge technologies to expand their growing customer base. Given the complexity and costs surrounding the shift to the cloud, we expect the end result to be a hybrid solution where companies move non-sensitive information to the public cloud while maintaining control of customer-sensitive information. Semiconductor revenue growth will likely slow in 2018, but the upward trajectory should remain. We anticipate semiconductor firms with exposure to specialized cutting-edge applications (i.e., artificial intelligence, deep learning, and augmented/virtual reality) will likely be well positioned going forward. The industry is transitioning to new leading edge technologies and firms will likely need to invest capital into new equipment. Yet, semiconductor capital equipment companies have been conservative with capital spending, retooling, and adjusting existing machinery to stretch out useful lives as much as possible. Additionally, China plans to spend $30 billion over the coming years to develop semiconductor manufacturing facilities, which should help extend the equipment purchasing cycle.Fundamentals within the security software industry appear to be normalizing, highlighted by a stabilization of bookings and revenue shifting toward higher margin subscription and services revenue. These attributes should help reduce volatility while producing earnings with higher visibility and more predictability. If some tax reform or repatriation efforts are pushed through Congress, firms may use this as an opportunity to bolster their security offerings through M&A.
SECTOR DRIVERS AND THEMES FOR 2018 The world is connected more than ever, and the number of semiconductors used in everyday household items is growing at a fast pace. For example, the amount of digital content inside a
vehicle is rapidly increasing as high-end features often found in luxury models are trickling down into entry-level and standard models. Semiconductor firms will probably have their content positioned alongside competitors on the circuit board and it should not be a “winner-take-all” environment. The budding secular shift to cloud computing should remain one of the most powerful themes in software today, especially to protect personal data from being stolen from cloud databases. Global Information Technology (IT) spending is forecast to move markedly higher in 2018, driven by spending on enterprise software and IT services. An uptick in security breaches during the second half of 2017 should move cybersecurity concerns to the forefront of top management teams.
INFORMATION TECHNOLOGY
2017 PERFORMANCETechnology has been the top performing group, handily outperforming the benchmark S&P 500 Index through the end of the third quarter 2017. In our view, some of the best opportunities within Technology have been semiconductor companies that had exposure to automotive and industrial applications. Fortunately, semiconductor demand has remained positive, despite difficult year-over-year comparisons, and the long-term sales momentum should continue into at least the first half of 2018.
POTENTIAL TAILWINDS AND HEADWINDSImmigration and trade reform could have resounding impacts on the sector. Technology firms hold the lion’s share of cash overseas and would likely benefit from a tax holiday. Any repatriation effort could stimulate M&A activity, as firms could look for bolt-on acquisitions to enhance existing product offerings. Significant changes to existing visa programs would likely increase Research and Development costs and slow the pace of innovation. Technology companies have historically been reliant on specialized foreign talent to develop new and cutting-edge technologies.
Worldwide Semiconductor RevenuesSolid demand in memory chips, notably a shortage in Dynamic random-access memory (DRAM), has driven semiconductor revenue. Worldwide semiconductor sales should top $400 billion in 2017, representing year-over-year growth of nearly 20%. That would mark the strongest period of growth since rebounding from the 2008 – 09 financial crisis.
Source: World Semiconductor Trade Statistics, Wells Fargo Advisors.
40
30
35
25
20
15
10
5
0
80%
60%
40%
20%
0%
-20%
-40%
-60%
Jan-9
7
Jan-9
8
Jan-9
9
Jan-0
0
Jan-0
1
Jan-0
2
Jan-0
3
Jan-0
4
Jan-0
5
Jan-0
6
Jan-0
7
Jan-0
8
Jan-0
9
Jan-1
0
Jan-1
1
Jan-1
2
Jan-1
3
Jan-1
4
Jan-1
5
Jan-1
6
Jan-1
7
Billi
ons U
SD$
– Monthly Sales – Year/Year Percentage ChangeYe
ar/Y
ear %
Chan
ge

9
EQUITY SECTOR OUTLOOK
WHERE TO INVEST IN 2018We continue to favor the chemicals sub-industry within materials into 2018 as we see heightened M&A activity in recent years driving increased industry consolidation, company-specific synergies, as well as upgraded (i.e., higher margin) portfolios of assets. We also see chemicals benefiting from a solid global industrial production backdrop which should drive relatively stable low single underlying digit volume growth. Within chemicals, we favor specialty chemicals as this group should benefit the most from 2017’s merger activity and also has significant exposure to the U.S. housing market, which we believe still has multiple years of runway left. Although increased input costs from recent natural disasters are likely to impact margins negatively in the near term, we believe the earnings outlook for this group is positive. We are also positive on construction materials as we expect the group to benefit from reconstruction activity during the first half of 2018 while also experiencing solid organic demand growth from the U.S. housing market. We continue to view metals and mining less favorably given our outlook for commodity prices to remain volatile in 2018. Additionally, we remain concerned that the performance of the metals and mining group continues to be materially impacted by difficult to predict government policy. We are neutral on containers and packaging along with paper and forest products as we believe both groups are largely fairly valued with few visible catalysts in the near term.
SECTOR DRIVERS AND THEMES FOR 20182017 was the year of the merger in the materials space, with multiple significant transactions in each of the diversified, specialty, and agricultural sub-industries within chemicals coming to fruition. Investors have generally responded favorably to the
heightened deal activity over the last two years and there are well-defined pipelines of synergies that should support earnings growth for many in the sector into 2018. Commodity prices have also bounced off their 2016 lows, although production results and market sentiment continue to fluctuate based on government policies (i.e., resource taxes in emerging markets, Chinese capacity rationalization, potential U.S. steel tariffs). Global industrial production trends are increasingly favorable exiting 2017 and we expect broad-based demand for materials to be solid in the near term. However, we see pricing continuing to remain volatile for most commodities given limited visibility in China and an uncertain global monetary policy outlook.
MATERIALS
2017 PERFORMANCEWe maintained a consistent preference for non-commodity oriented material sub-industries throughout 2017. Our favored sub-industry within this space, specialty chemicals, outperformed both the sector and the market, while other non-commodity centric sub-industries, including industrial gases and agricultural chemicals, also outperformed the market. Metals and mining, a less favored space, underperformed, weighed on by the performance of steel companies.
POTENTIAL TAILWINDS AND HEADWINDSWe view the greatest risks to the sector as a stronger U.S. dollar, a greater degree of softening in China than is currently expected, rising protectionism, and unexpected weakness in demand for consumer durable goods in developed economies. Potential tailwinds would include a weaker U.S. dollar, higher commodity prices, increased investment in China, tax reform in the U.S., and stronger consumer spending.
The value of announced merger activity in the chemicals sector hit all-time highs in 2016 with several material deals closing in 2017. We believe this should drive strong organic and inorganic growth and support structurally higher valuations for the sector in 2018.
Source: Deloitte.$0
$50
$100
$150
$200
$250
0
100
200
300
400
500
600
700
2016201520142013201220112010
– Volume (left side) – Value $B (right side)
Global Chemical Industry Announced Merger and Acquisition Activity

10
EQUITY SECTOR OUTLOOK
WHERE TO INVEST IN 2018REITs that may outperform during a period of rising interest rates and modestly higher inflation would include REITs with shorter lease terms or stronger earnings growth prospects. Real estate sectors with shorter lease terms would include hotels, residential REITs such as apartments and manufactured housing, and self-storage. These REITs reprice their properties more frequently and thus can benefit from higher inflation. With respect to hotels, expectations of continued stable employment prospects and corporate revenue growth (two important hotel demand drivers) have resulted in a relatively healthier outlook for near-term hotel REIT earnings growth. However, new hotel construction remains elevated and material declines in corporate profits, employment, or overall economic growth could generate a quick downturn in hotel REIT earnings and total returns. On the earnings growth front, we expect specialty REITs (particularly technology-related REITs such as cell tower and data center REITs) and industrial REITs to produce strong growth due to robust underlying demand from their tenants. Conversely, sectors with longer lease terms such as health care, freestanding retail/net lease, and certain retail categories may lag the broader Real Estate sector returns if the Federal Reserve implements a higher number of interest rates than investors expect and inflation expectations increase in the coming quarters. REITs with longer lease terms are generally viewed as more-bond like and as a result these REIT sectors can be more vulnerable in inflationary environments.
SECTOR DRIVERS AND THEMES FOR 2018We believe a significant influence on 2018 REIT total returns will be the interest rate environment, given the performance of REITs during in 2017 as the Federal Reserve was increasing interest rates. Another major factor will likely be the ability of REITs to access attractively priced capital. Finally, as shown in the chart below,
privately owned commercial real estate total returns (including both income and price appreciation, as measured by the National Council of Real Estate Investment Fiduciaries (NCREIF) National Property Index Return) have been moderating since the first quarter of 2015 which may suggest near-term growth in commercial real estate values is slowing. We believe the potential moderation of commercial real estate values could translate into smaller increases or even declines in REIT property values and share prices.
REAL ESTATE SECTOR
2017 PERFORMANCEThe total return of the S&P 500 Real Estate sector trailed the S&P 500 total return by roughly 680 basis points through the first three quarters of 2017. We attribute the year-to-date 2017 Real Estate sector performance in part to investor concerns regarding interest rate increases by the Federal Reserve, which occurred in March and June 2017, and expectations of another Federal Reserve interest rate hike by the end of 2017.
POTENTIAL TAILWINDS AND HEADWINDSWe feel REITs could struggle relative to other industry sectors during 2018 should the Federal Reserve ultimately implement two or three modest interest rate increases in 2018. The pace of U.S. economic growth in 2018 will also likely influence REIT total returns. A continuation of positive but somewhat sluggish U.S. economic growth trajectory will likely result in generally moderate REIT earnings growth but could also result in interest rates remaining low which should be beneficial for REITs.
National Council of Real Estate Investment Fiduciaries (NCREIF) National Property Index Return
-10.0
-8.0
-6.0
-4.0
-2.0
0.0
2.0
4.0
6.0
8.0
2017
1992
1993
1994
1995
1996
1997
1998
1999
2000
2001
2002
2003
2004
2005
2006
2007
2008
2009
2010
2011
2012
2013
2014
2015
2016
1990
1991
1989
1988
1987
Following a steep decline in property total returns in 2008 and 2009, the NCREIF National Property Index Return has turned positive; however, returns have moderated since early 2015.
Source: Factset. The numbers on the vertical axis represent the total returns (both the income generated and percentage change in values) of a group of real estate properties tracked by NCREIF.
Tota
l Pro
pert
y Ret
urns
(Qua
rter
ly Ch
ange
, %)
Past performance is no guarantee of future results. The NCREIF Property Index (NPI) tracks the performance of U.S. commercial real estate as measured by the performance of commercial real estate assets managed by contributing members of NCREIF. An index is unmanaged and not available for direct investment.

11
EQUITY SECTOR OUTLOOK
WHERE TO INVEST IN 2018We believe the integrated carriers are an appropriate investment as the cornerstone of an investor’s Telecom exposure and view the tower companies as attractive alternatives for higher-growth accounts. We are less favorable on wireline-specific carriers as this segment continues to anticipate revenue inflection and have potentially unsustainable dividend yields. Integrated carriers have offered attractive dividend income (yields of about 5%), diverse revenue sources, and relatively stable total return profiles. The “integrateds” have evolved over time and continue to do so as they leverage their massive scale and network superiority with owned content and advertising capabilities. We believe the ability to deliver high-quality video and data services across various screen types while selling targeted ads will prove to be advantageous in a world where delivery itself simply isn’t enough. We also appreciate the diversity benefits of wireline and wireless operations serving both individuals and enterprises in competitive markets. We suggest investing in tower companies for additional telecom exposure due to their higher expected growth and carrier-agnostic leverage to the wireless segment. The three publicly traded tower companies are organized as REITs so technically they fall under the Real Estate sector. Further, the tower companies’ business mixes vary by geography, technology, and carrier exposures, while dividend yields and risk profiles are similarly diverse. We believe the tower companies offer an attractive way to participate in the robust growth of data consumption both domestically and abroad without the need to pick the “winner” among the carriers.
SECTOR DRIVERS AND THEMES FOR 2018Competition, regulation, and interest rates remain influential drivers of the Telecom sector; however, we believe 2018 may prove to be a year of change. As of mid-October, there are two pending M&A transactions in the sector (an integrated/media tie-up and a wireline/wireline deal) and another persistently rumored one that we believe
could be realized in the near term (merger of wireless competitors). The S&P 500 Telecom sector has been reduced to three constituents, but at the same time, the distinctions between traditional cable and telecom operators are being blurred as the product offerings are increasingly similar. We believe this could portend further M&A or perhaps shuffling within the S&P 500 index, hypothetically a situation such as cable joining Telecom.
TELECOM
2017 PERFORMANCEComing into 2017, we suggested Telecom investors focus primarily on the large national carriers with diverse revenue streams — essentially narrowing the field to the top two companies in the sector. Additional exposure was suggested in the tower companies for higher-growth accounts. Through mid-October 2017, this approach has been mixed — the two sector leaders are in negative territory while tower companies outperformed the sector and market nicely.
POTENTIAL TAILWINDS AND HEADWINDSThe attractive dividends paid by most telecom stocks make them sensitive to interest rate movements and rate expectations will affect sector performance. Telecom markets are competitive. If our assumption of wireless consolidation comes to fruition, competition could increase. As well, the newly combined entity could push pricing as a means to gain further share. Additionally, the tower companies could experience elevated churn as network costs are rationalized. Our assumption of unsustainable dividend rates in wireline could prove overly pessimistic.
Estimated U.S. Monthly Mobile Data Traffic
0.0
1.0
2.0
3.0
4.0
5.0
6.0
7.0
202120202019201820172016
- Video - Audio, Filesharing, Web, and Other Data
Exab
ytes
*
Mobile data traffic, driven by video, is expected to continue to grow significantly into 2021 as estimated by Cisco. This is potentially positive for carriers and tower companies.
*Exabyte: a unit of measure of digital information. One exabyte is equal to one quintillion bytes.
Source: Cisco 2020 VNI Forecast, Wells Fargo Advisors.

12
EQUITY SECTOR OUTLOOK
WHERE TO INVEST IN 2018We continue to recommend investors focus Utilities sector exposure on primarily regulated names with the potential for above average dividend growth. The rationale behind the “primarily” qualifier is that often times, outsized dividend growth potential stems at least partially from unregulated operations. From our perspective, the relatively reliable nature of regulated operations should provide the core of a Utilities sector recommendation while the riskier unregulated piece should provide enhanced growth — with the balance between the two segments important. We note valuations in the sector remain high, relative to historical levels, with dividend yields and earnings multiple premiums across the traditional electric, gas, water, and multi-utility industries. We believe utilities with the ability to increase dividends at above average rates will likely perform well relative to peers against the backdrop of a rising interest rate environment. In a rising rate environment we expect utility stock prices to come under pressure, potentially bringing elevated valuation multiples down and pushing dividend yields up. We believe a rising dividend stream could lessen the pressure on the stock price as the dividend growth further increases the yield beyond the price decline. Within this framework, we see opportunities in select electric and multi-utilities with a preference for those at the lower end of the sector’s valuation spectrum, but caution against simply choosing the “cheapest” stocks in the sector without first understanding of the issues surrounding each company. We are less favorable on water and gas utilities given current multiples and yields relative to historical levels. The gas industry in particular, while attractive from a relative growth perspective, appears to factor in sizable M&A premiums which could fade.
SECTOR DRIVERS AND THEMES FOR 2018We believe interest rate expectations will be one of the top drivers of Utilities sector sentiment as we move through 2018 and the market anticipates timing of Federal Reserve rate increases. In our view, the risk is skewed to the downside for utilities given valuation levels that are roughly two points — or 13% — higher
than the average over the past five years. M&A activity will potentially remain a factor in 2018 as we expect gas roll-ups to continue given their attractive growth profiles and long capital expenditure backlogs. The final item on our radar is tax reform, particularly interest deductibility as this could impact utilities with relatively high levels of parent-level debt.
UTILITIES
2017 PERFORMANCEThe Utilities sector performed well through the first nine-plus months of 2017, just slightly underperforming the overall market. Our initial guidance coming into the year suggested a focus on primarily regulated names with above average dividend growth potential. Regulated names performed largely in line with the sector while the relatively small independent power and renewables producers far outpaced the sector and market.
POTENTIAL TAILWINDS AND HEADWINDSThe attractive and reliable dividends paid by many utility stocks make them sensitive to interest rate movements. Interest rate increases could negatively affect the sector on a short term basis as the dividend yields could become less attractive relative to other income producing securities (i.e., bonds) and lead to a rotation out of utility stocks. A prolonged environment of benign interest rates and expectations could provide support or potentially increase demand for the stocks.
Utilities Sector and Industry Next-twelve-months Price-to-earnings Multiples
5
10
15
20
25
30
2013 2014 2015 2016 2017
– S&P Composite 1500/Utilites – S&P Composite 1500/ Electric Utilities – S&P Composite 1500/ Gas Utilities
– S&P Composite 1500/ Ind Power Prod & Energy Traders – S&P Composite 1500/ Multi-Utilities – S&P Composite 1500/ Water Utilites
As shown in the chart, the Utilities sector and industry next-twelve-month price-to-earnings multiples are high relative to average over the past five years.
Source: FactSet.
The S&P Composite 1500 Index combines three leading indices, the S&P 500, MidCap 400, and SmallCap 600, that are classified as members of the GICS sectors which together cover approximately 90% of the U.S. equity market. The S&P Composite 1500 sector indices comprise those companies included in the S&P Composite 1500 that are classified as members of individual GICS industry sectors. An index is unmanaged and not available for direct investment.
Past performance is no guarantee of future results.

13
Valuation and Risks CONSUMER DISCRETIONARY• The Consumer Discretionary sector currently trades at 20.42x the NTM consensus estimate of $36.89. The current P/E ratio is above the five-year historical valuation of 17.86x. Relative to the
S&P 500, the Consumer Discretionary sector is trading at 1.13x, which is in line with historical levels of 1.14x. The consensus estimates reflect EPS to increase 8.4% in 2018 compared to the EPS increase of 4.1% in 2017.
• Risk considerations for the Consumer Discretionary sector include (1) apparel price deflation due to low-cost entries, high inventory levels and pressure from e-commerce players, (2) reduction in traditional advertising dollars as social media ad spending increases, (3) increasing household debt levels that could limit consumer appetite for discretionary purchases, (4) declining consumer acceptance of new product introductions, and (5) geopolitical uncertainty that could impact consumer sentiment.
CONSUMER STAPLES• The Consumer Staples sector currently trades at 19.28x the NTM consensus estimate of $29.29. The current P/E ratio is slightly above the five-year historical valuation of 18.62x. Relative to the
S&P 500, the Consumer Staples sector is trading at 1.07x, which slightly below historical levels of 1.19x. We believe the absolute premium is due to investors utilizing this sector as a perceived alternative equity safe-haven for yield relative to traditional fixed-income instruments. The consensus estimates reflect EPS to increase 7.7% in 2018 compared to the EPS increase of 6.6% in 2017.
• Risk considerations for the Consumer Staples sector include a softer macro environment, intense competition, downward pricing pressure from retailers and off-brands, customer concentration, availability and cost of raw materials, consumer perceptions towards processed foods, and complexities associated with acquisitions. In addition, a perceived increase in real interest rates could impact investor sentiment towards the Consumer Staples segment, as investors, over recent years, have used this sector as a perceived safe-haven yield alternative to traditional fixed-income vehicles during the low interest rate environment.
ENERGY• The energy sector is currently trading at price-to-book value (P/B) of 1.86x. The current P/B ratio is above the five-year average for the group of 1.79x. Relative to the S&P 500, the energy
sector has been trading at 0.60x, below the five-year historical average of 0.70x. The weaker ratio is due to the contraction in both sector equity prices and average book values. • Risks include weakness in the economy world-wide, commodity price exposure, slow macro-economic recovery, reserve replacement, exploration risk, and a slow approval process for liquid
natural gas (LNG) projects by regulatory and government agencies. Additionally, Master Limited Partnerships (MLPs) can be exposed to volumetric risk, commodity price exposure, potential customer concentration risks, asset depletion, and even seasonality in the case of propane.
FINANCIALS• The Financial sector currently trades at 14.25x the NTM consensus earnings per share (EPS) estimate of $30.51. The P/E ratio reflects a premium compared with the 5 year historical valuation
of 12.81x. Relative to the S&P 500, the Financial sector is trading at 0.79x which is in line with historical levels of 0.82x. The consensus estimates reflect EPS to increase 15.2% in 2018 compared to the EPS increase of 8.3% in 2017.
• Key risks to the Financials sector include maturation of the credit cycle resulting in higher credit losses and tighter lending standards, lower interest rates leading to a reduction in profitability, and capital market weakness reducing assets under management as well as constraints around accessing the markets for growth capital.
HEALTH CARE• The health care sector is currently trading at 16.50x the NTM consensus earnings per share (EPS) estimate of $57.28. The current P/E ratio is above the five-year average for the group of
15.74x. Relative to the S&P 500, the health care sector has been trading at 0.92x, below the 1.01x five-year historical average level. The consensus estimates reflect EPS to increase 6.5% in 2018 compared to the EPS increase of 5.9% in 2017.
• Risks to companies within the health care sector include competition on branded products, sales erosion due to cheaper alternatives (such as generic pharmaceuticals and/or biosimilar products), research & development risk, and dependence on regulators such as the Food and Drug Administration (FDA) to approve products anticipated to enter the market. Additionally, companies can be exposed to cuts in Medicare reimbursements (either based on yearly review or due to sequestration) as well as uncertainty surrounding healthcare reform efforts in the U.S.
INDUSTRIALS• The Industrials sector currently trades at 18.70x the NTM consensus estimate of $32.25. The current P/E ratio is above the five-year historical valuation of 15.94x. Relative to the S&P 500, the
Industrial sector is trading at 1.04x, which is mostly in line with historical levels of 1.01x. The consensus estimates reflect EPS to increase 8.9% in 2018 compared to the EPS increase of 2.6% in 2017.
• Key risks within the Industrial sector include the possibility of a worsening in the global economy, acquisition integration risk, operational issues, failure to introduce to market new and innovative products, further weakening in the oil market, potential price wars due to any excesses industry capacity, and a sustained rise in the dollar relative to other currencies.
INFO TECH• The Information Technology sector currently trades at 19.37x the NTM consensus EPS estimate of $58.03. The P/E ratio is above the 5-year historical valuation of 15.30x. Relative to the S&P
500, the Information Technology sector is trading at 1.08x, which is modestly above historical levels of 0.97x. The consensus estimates reflect EPS to increase 12.2% in 2018 compared to the EPS increase of 15.5% in 2017.
• Risks for the Technology sector include increased competition from domestic and international companies, unexpected changes in demand, regulatory actions, technical problems with key products and the departure of key members of management.
MATERIALS• The Materials sector currently trades at 18.04x the next-twelve-month (NTM) consensus EPS estimate of $20.32. This P/E ratio is above the average 5-year historical valuation of 15.45x.
Relative to the S&P 500, the sector is trading at 1.00x which is in line with historical levels of 0.98x. The consensus estimates reflect EPS to increase 18.6% in 2018 compared to EPS growth of 9.9% in 2017.
• The sector is sensitive to fluctuations in and relationships among commodity prices, particularly crude oil, natural gas and NGLs, metals, and agricultural products. China has been a major factor in driving demand and therefore pricing for many commodities. A global economic slowdown would weigh on the Materials sector’s performance. Many materials companies have significant operational exposure to foreign currencies. Additionally, many commodities are priced in U.S. dollars. Strength in the U.S. dollar could negatively impact reported results within the sector.

14
Wells Fargo Investment Institute, Inc. is a registered investment adviser and wholly-owned subsidiary of Wells Fargo Bank, N.A., a bank affiliate of Wells Fargo & Company.Wells Fargo Advisors is registered with the U.S. Securities Exchange Commission and the Financial Industry Regulatory Authority, but is not licensed or registered with any financial services regulatory authority outside of the U.S. Non-U.S. residents who maintain U.S.-based financial services account(s) with Wells Fargo Advisors may not be afforded certain protections conferred by legislation and regulations in their country of residence in respect of any investments, investment transactions, or communications made with Wells Fargo Advisors.Wells Fargo Advisors is a trade name used by Wells Fargo Clearing Services, LLC and Wells Fargo Advisors Financial Network, LLC, Members SIPC, separate registered broker-dealers and non-bank affiliates of Wells Fargo & Company.© 2017 Wells Fargo Clearing Services, LLC. All rights reserved. 1117-03692 IHA-5092901
REAL ESTATE• The Real Estate sector currently trades at 18.23x the NTM consensus estimate of $11.34. Relative to the S&P 500, the sector is trading at 1.04x. The consensus estimates reflect EPS to
increase 6.8% in 2018 compared to EPS growth of 0.7% in 2017. The sector yields 3.2% relative to the S&P’s yield of 1.9%.• Risks to the Real Estate sector include general weakness in U.S. economic growth that could negatively impact demand for residential and commercial real estate, saturation in key markets, a
lack of access to attractively priced capital for external growth, and significant increases in interest rates which would make the yields on real estate securities relatively less attractive.
TELECOMMUNICATIONS• The Telecommunications Services sector currently trades at 11.95x the NTM consensus earnings per share estimate of $12.42; a discount to the sector’s average 5-year historical valuation
of 13.81x. Relative to the S&P 500, the Telecom sector is trading at 0.66x times which is also at a discount to the historical level of 0.89x. The sector’s current yield is 5.6%, well above the other ten S&P 500 sectors which makes it sensitive to interest rate increases. The Telecom sector is highly capital intensive as building and maintaining state-of-the-art networks requires significant capital expenditure. The consensus estimates reflect EPS to increase 0.5% in 2018 compared to EPS growth of 2.3% in 2017.
• Network performance, coverage, and reach are often the deciding factors when choosing a carrier and perceived weakness can affect customer metrics. Competition in all lines of the sector is formidable and varies based on region. Telecom companies are subject to thorough regulation at multiple levels. An adverse regulatory environment can stifle innovation and returns and add an element of uncertainty.
UTILITIES• The Utilities sector trades at approximately 18.50x the NTM consensus EPS estimate of $15.32, which is higher than its 5-year historical average of about 16.51x. Relative to the S&P 500, the
Utilities sector is trading at 1.03x, in line with historical levels of 1.02x. Analysts are expecting EPS to increase 4.7% in 2018 compared to EPS increase of 1.0% in 2017. The Utilities sector pays an annual dividend of about 3.3%, compared to the yield of 1.9% within the S&P 500 Index.
• Regulatory risk remains the key uncertainty for the Utilities sector, both at the federal and state levels. Additionally, Utilities typically carry high debt levels, and rising rates could impact their overall borrowing costs. High debt levels could also put a strain on credit ratings, which would also limit the ability to finance capital expenditures. As M&A activity increases, companies may face challenges when integrating those acquired businesses.
Other Risk Considerations:Commodities: Investments in commodities may be affected by changes in overall market movements, commodity index volatility, changes in interest rates, or factors affecting a particularindustry or commodity. The commodities markets are considered speculative, carry substantial risks, and have experienced periods of extreme volatility. In addition to the risks of investing incommodities generally, investing in base metals carries additional risks. The metals are highly levered to the relative strength of the U.S. dollar, economic growth, and inflation. They cannot beheld physically and are not easily converted to cash.Equity Securities: Equity securities are subject to market risk which means their value may fluctuate in response to general economic and market conditions, the prospects of individualcompanies, and industry sectors. Investments in equity securities are generally more volatile than other types of securities. Technology and Internet-related stocks, especially of smaller,less-seasoned companies, tend to be more volatile than the overall market. There is no guarantee that dividend-paying stocks will return more than the overall stock market. Dividends are notguaranteed and are subject to change or elimination.Master Limited Partnerships: Investment in securities of Master Limited Partnerships (MLPs) involves certain risks which differ from an investment in the securities of a corporation. MLPsmay be sensitive to price changes in oil, natural gas, etc., regulatory risk, and rising interest rates. A change in the current tax law regarding MLPs could result in the MLP being treated as acorporation for federal income tax purposes which would reduce the amount of cash flows distributed by the MLP. In addition, there are certain tax risks associated with an investment in MLPunits and conflicts of interest may exist between common unitholders and the general partner, including those arising from incentive distribution payments. In addition, a change in the current tax law regarding MLPs could result in the MLP being treated as a corporation for federal income tax purposes which would reduce the amount of cash flows distributed by the MLP. Other risks include the volatility associated with the use of leverage; volatility of the commodities markets; market risks; supply and demand; natural and man-made catastrophes; competition; liquidity; market price discount from Net Asset Value, and other material risks. An MLP is not required to make distributions and distributions may represent a return of capital as detailed in the K-1 delivered to the unitholder. Unlike regular dividends, a “return of capital” is typically tax-deferred for the unitholder of an MLP and each distribution may reduce the unitholder’s cost-basis.Real Estate: Investment in real estate securities have certain risks, including possible illiquidity of the underlying properties, credit risk, interest rate fluctuations, and the impact of variedeconomic conditions.